Article

Identification and Experimental Study of Sand Gravel Formations Driven by an Earth Pressure Balance Shield Machine Based on GTNet

School of Mechanical Engineering, Shenyang Jianzhu University, Shenyang 110168, China
*
Authors to whom correspondence should be addressed.
Appl. Sci. 2025, 15(14), 7983; https://doi.org/10.3390/app15147983
Submission received: 26 May 2025 / Revised: 5 July 2025 / Accepted: 9 July 2025 / Published: 17 July 2025

Abstract

The earth pressure balance shield machine (EPB) is an important piece of engineering equipment used in tunnel excavation and plays an important role in large underground tunnel projects. This article takes the sand and gravel formation as the research object, while discrete element simulation is utilized to study the correlation between cutterhead torque and thrust and other parameters. The EPB tunneling experiment was carried out by setting up formations with different sand and gravel contents. The reliability of the simulation model was verified by the experimental data, which provided the data samples for the training of the excavation formation identification network. Finally, a GTNet (gated Transformer network) based on the formation identification method was proposed. The reliability of the network model was verified by contrasting the model used with other network models and by analyzing the results of experiment and visualization. The effects of different parameters were weighted using the ablation study for tunneling parameters. The proposed method has a high accuracy of 0.99, and the cutterhead torque and thrust have a great recognition feature, the weight of which is over 0.95. This paper can provide significant guidance for the torque and thrust analysis of cutterheads in tunnel construction.

1. Introduction

The working environment of the earth pressure balance shield machine is harsh, and faults, such as the cutterhead becoming stuck and cracking, often occur. This is mostly due to geological changes in a formation, and the real-time adjustment of operating parameters being lacking [1,2,3]. The most popular methods to achieve intelligent operation use numerical simulation and a test bench and integrate modern technologies [4,5]. The electro-hydraulic faults of the propulsion system are mainly studied using a tunneling simulation test bench [6], the assembly of shield segments [7], and the soil settlement problem [8]. The collection method of the operation data of the shield machine simulation test bench needs to be improved. It would be of great significance to be able to identify and classify the tunneling formations by using deep learning methods to enable the normal operation of shield machines and cost reduction.
In TBM tunneling research, various aspects of tunnel construction have been analyzed using the discrete element method: Wang et al. [9] analyzed the construction of tunnels in cobble-rich formations by using the three-dimensional discrete element method (DEM) and studied the relationship between the face supporting pressure and the rotational speed of the cutterhead. Vergara et al. [10] proposed a modified approach, which can be used as a guide to reduce the risk of cost and time overruns. Hu et al. [11] studied the ground damage caused by earth pressure balance shield machines in granular soil, while the indoor experiments and the three-dimensional discrete element method were utilized, and the dynamic excavation process was simulated. These scholars also studied the stability of the working face of the shield tunnel with dry particles through earth pressure balance using the discrete element method. The failure modes of the working face under different rotational speeds and opening rates were determined [12]. Xia et al. [13] enhanced tunneling efficiency by modifying the scouring flux and measured the tunneling performance parameters. Due to the limitations caused by conditions during the construction process of the shield machine, it is impossible to directly observe the interaction between the formation and the equipment. Therefore, many scholars use a shield machine simulation test bench to conduct research on formation identification and the parameter control of the shield machine. Jin et al. [14] used a shield machine test bench to study the opening ratio and rotation speed of the cutterhead and observed an increase in the limit support pressure. Di et al. [15] conducted passive instability rock and soil model tests for tunnels of different burial depths and studied the surface stability of the tunnels. Kong et al. [16] established a shield offset load model test device to study the shield attitude changes in soil and rock formations. Li et al. [17] designed a composite shield machine test bench and analyzed the variation laws of tunnel displacement, stress, and permeation pressure. There are few studies that concentrate on the cutterhead system of earth pressure balance shield machines, and there is a lack of research that combines the structure of the shield cutterhead, working parameters, and formation characteristics.
In the field of shield machine tunnel engineering, machine learning is utilized. Regarding formation identification and classification, Yang et al. [18] established an automatic geological condition prediction model based on geological data, and the operation parameters were calculated using the K-means algorithm. Yan et al. [19] used the SCA-GS algorithm for geological feature prediction and compared the recorded geological features with the predicted features. Kilic [20] proposed an unsupervised and oversampling-guided light gradient enhancement classifier for the geological identification of soft soil tunnels. Qin et al. [21] proposed an enhanced multi-head self-attention convolutional neural network for the geological prediction of shield machines. The accuracy rate was verified and was over 96%. Aiming to explore formation geology and the operation parameters of shield machines, Liu et al. [22] proposed an autonomous intelligent control method. Yu et al. [23] proposed a new A-CNN neural network based on geological conditions, achieving a high accuracy rate, and compared it with the existing methods. Soroush et al. [24] employed an elastic net polynomial regression to model the advance rate using data collected during the excavation. The EPBM data were partitioned based on the geological profile in order to examine the influence of the soil type through which the EPBM was tunneling. Glab et al. [25] used the main drive torque for the calculations and trained and tested data collected from different projects to test the transferability of the model. The machine learning approach resulted in a smaller and more accurate torque estimation. Bel et al. [26] identified the extension of the TBM impact zone based on the measured stress and strain variations in the ground using the earth pressure balanced shield method. Koki et al. [27] utilized a combination of a small-scale model experiment and a computer-aided engineering (CAE) analysis via the moving particle simulation (MPS) method to investigate the plasticity of muddy soil—specifically whether earth pressure is a reliable indicator of soil plasticity. Based on the measured data of the earth pressure balance shield tunnel, Tao et al. [28] compared the forecast outcomes of the enhanced superposition method with the geological features observed at the location. Machine learning techniques are used in the majority of scholarly research on formation identification and tunneling parameters of shield machines. However, machine learning has a high demand for feature engineering, poor model generalization ability, and model performance is highly dependent on the quality and quantity of training data. Machine learning models often struggle with recognition accuracy in nonlinear and complex scenarios.
This paper aims to address issues of excavation reliability driven by earth pressure balance shield machines in sandy and pebble formations. Taking the cutterhead system of earth pressure balance shield machines as the research object, the influence of discontinuous formation distribution on the excavation parameters of the cutterhead system is explored. The second part applies the DEM to establish a discrete element simulation model for the studied formation and cutterhead system. The stacking angle experiment and the geological exploration report are used to calculate the particle contact parameters. In the third part, based on the similarity principle, a simulation experimental platform is built for the excavation. In the fourth part, the operating principle of the Transformer network is analyzed. The earth pressure balance shield machine’s tunneling formation identification model based on GTNet is established. By preprocessing the experimental data and adjusting the parameters of the GTNet network, the optimal hyperparameters and the highest accuracy rate were obtained.

2. Methodology of the Tunneling Simulation

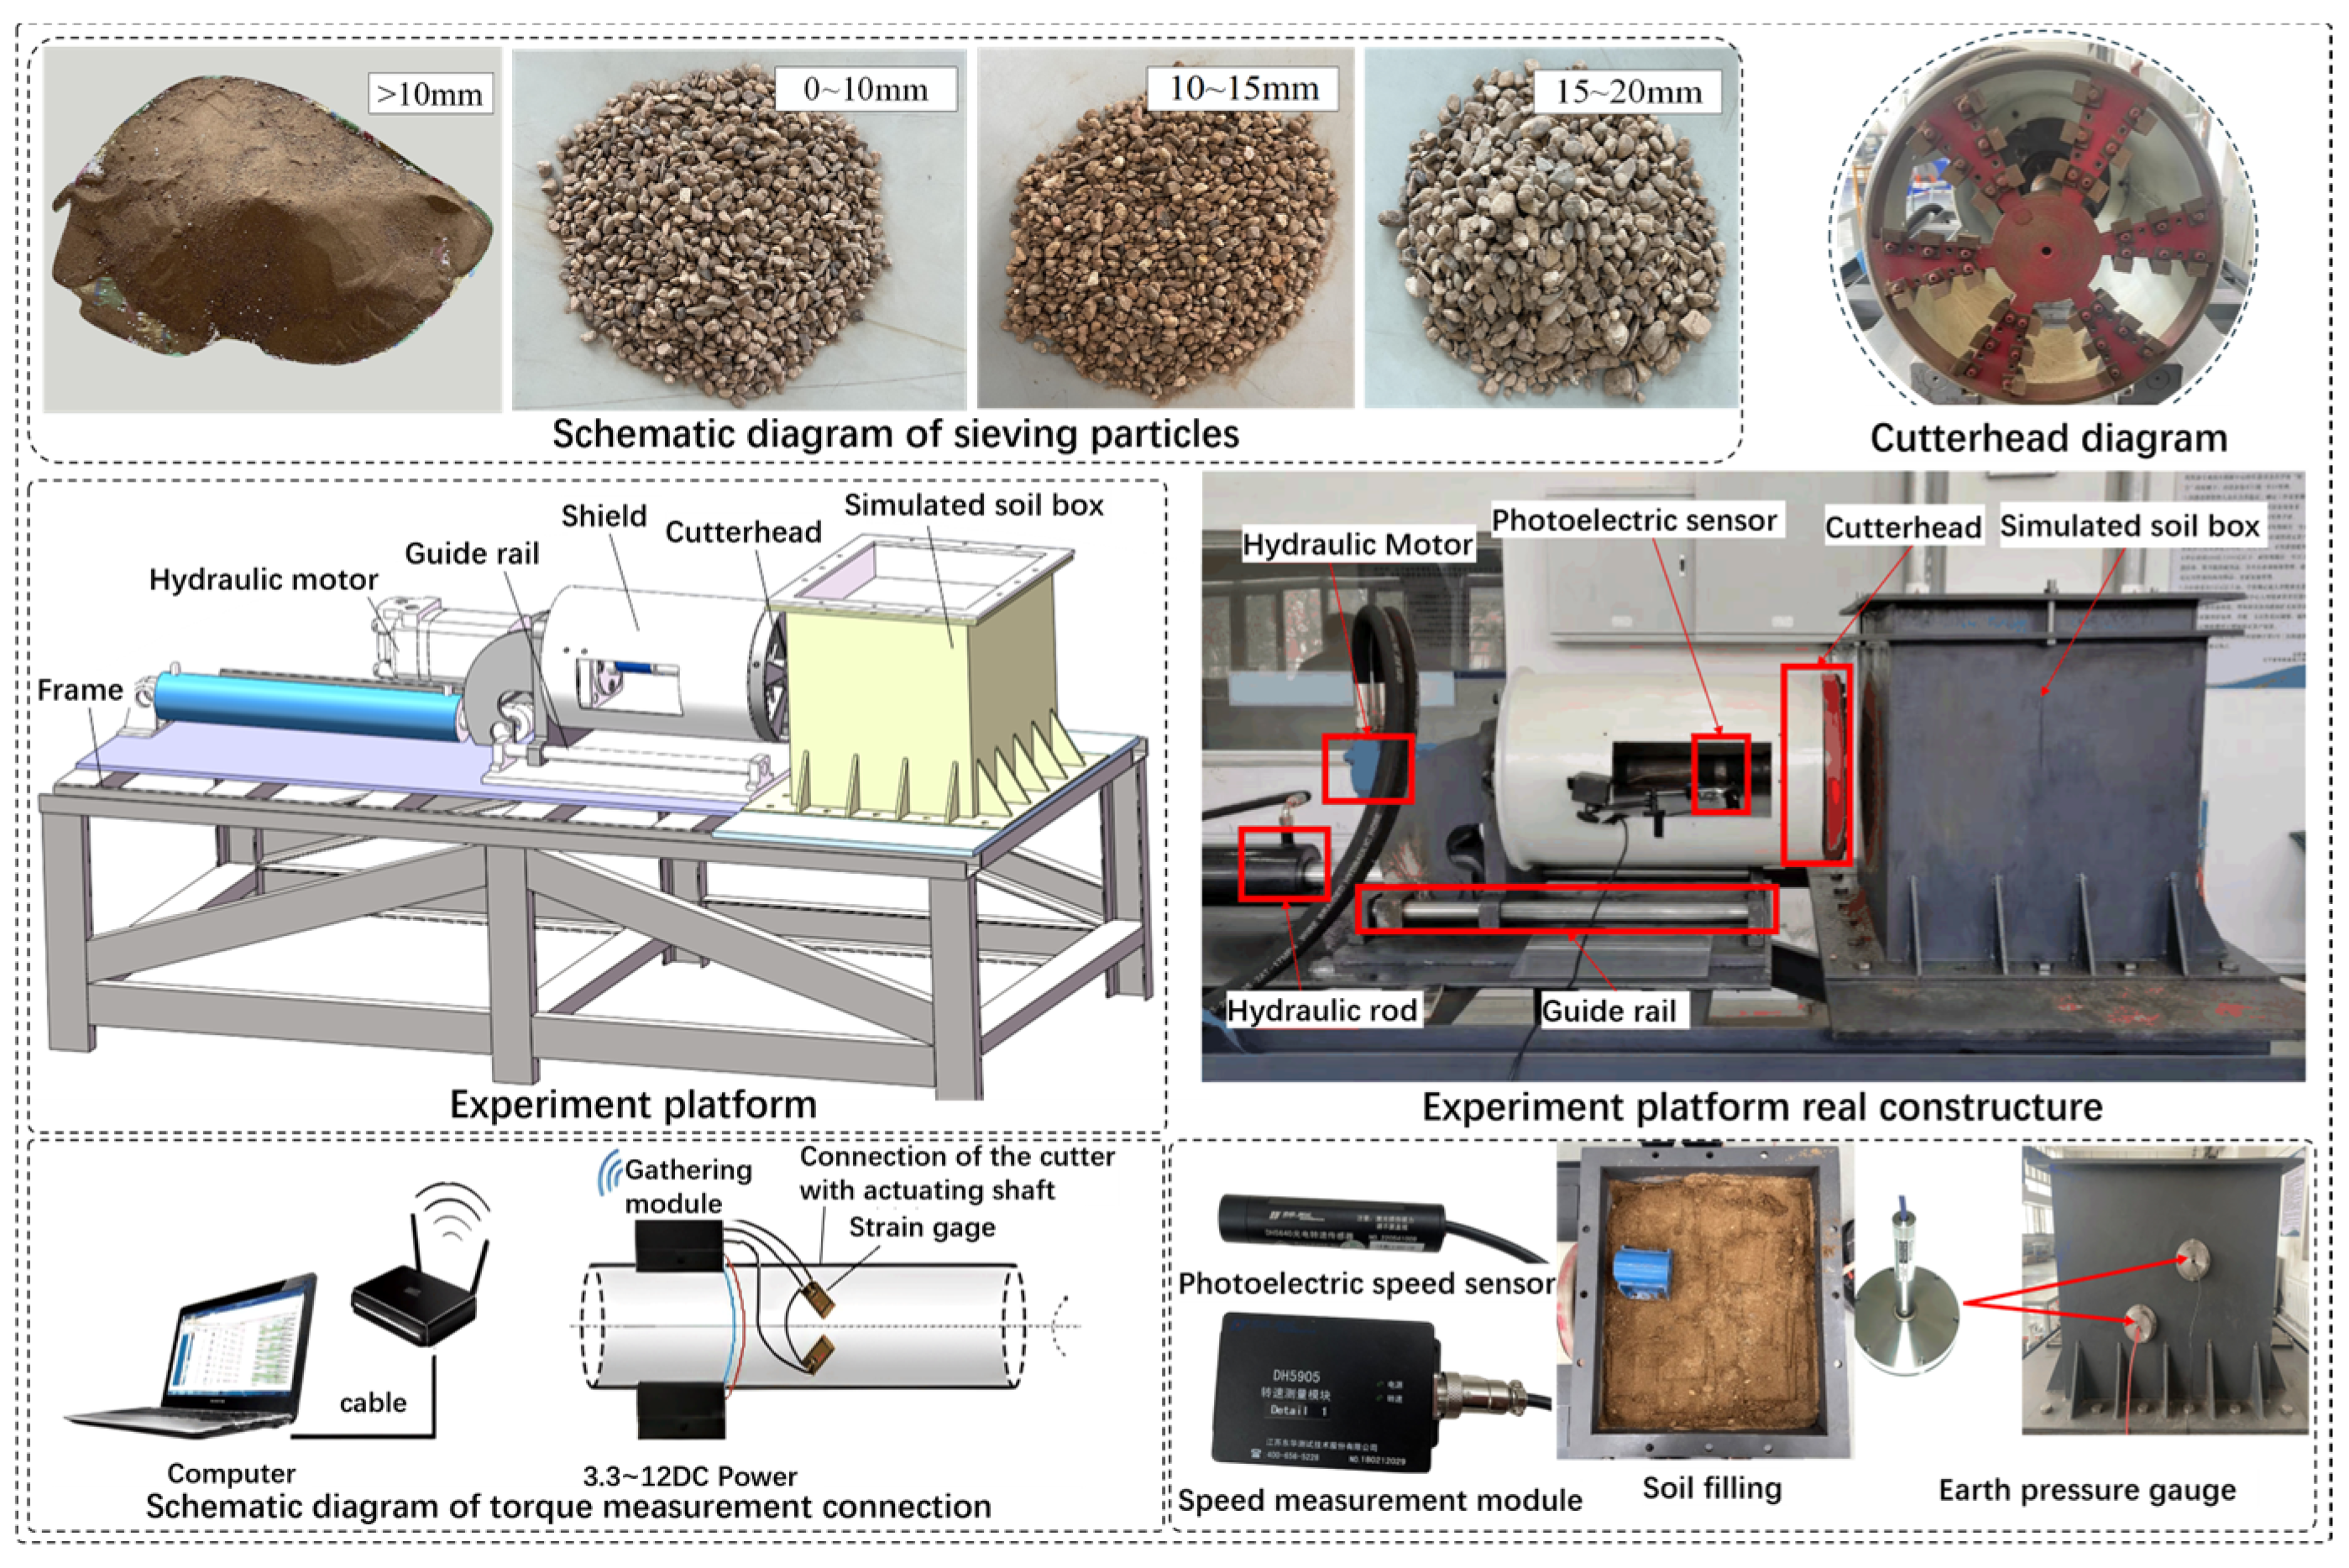
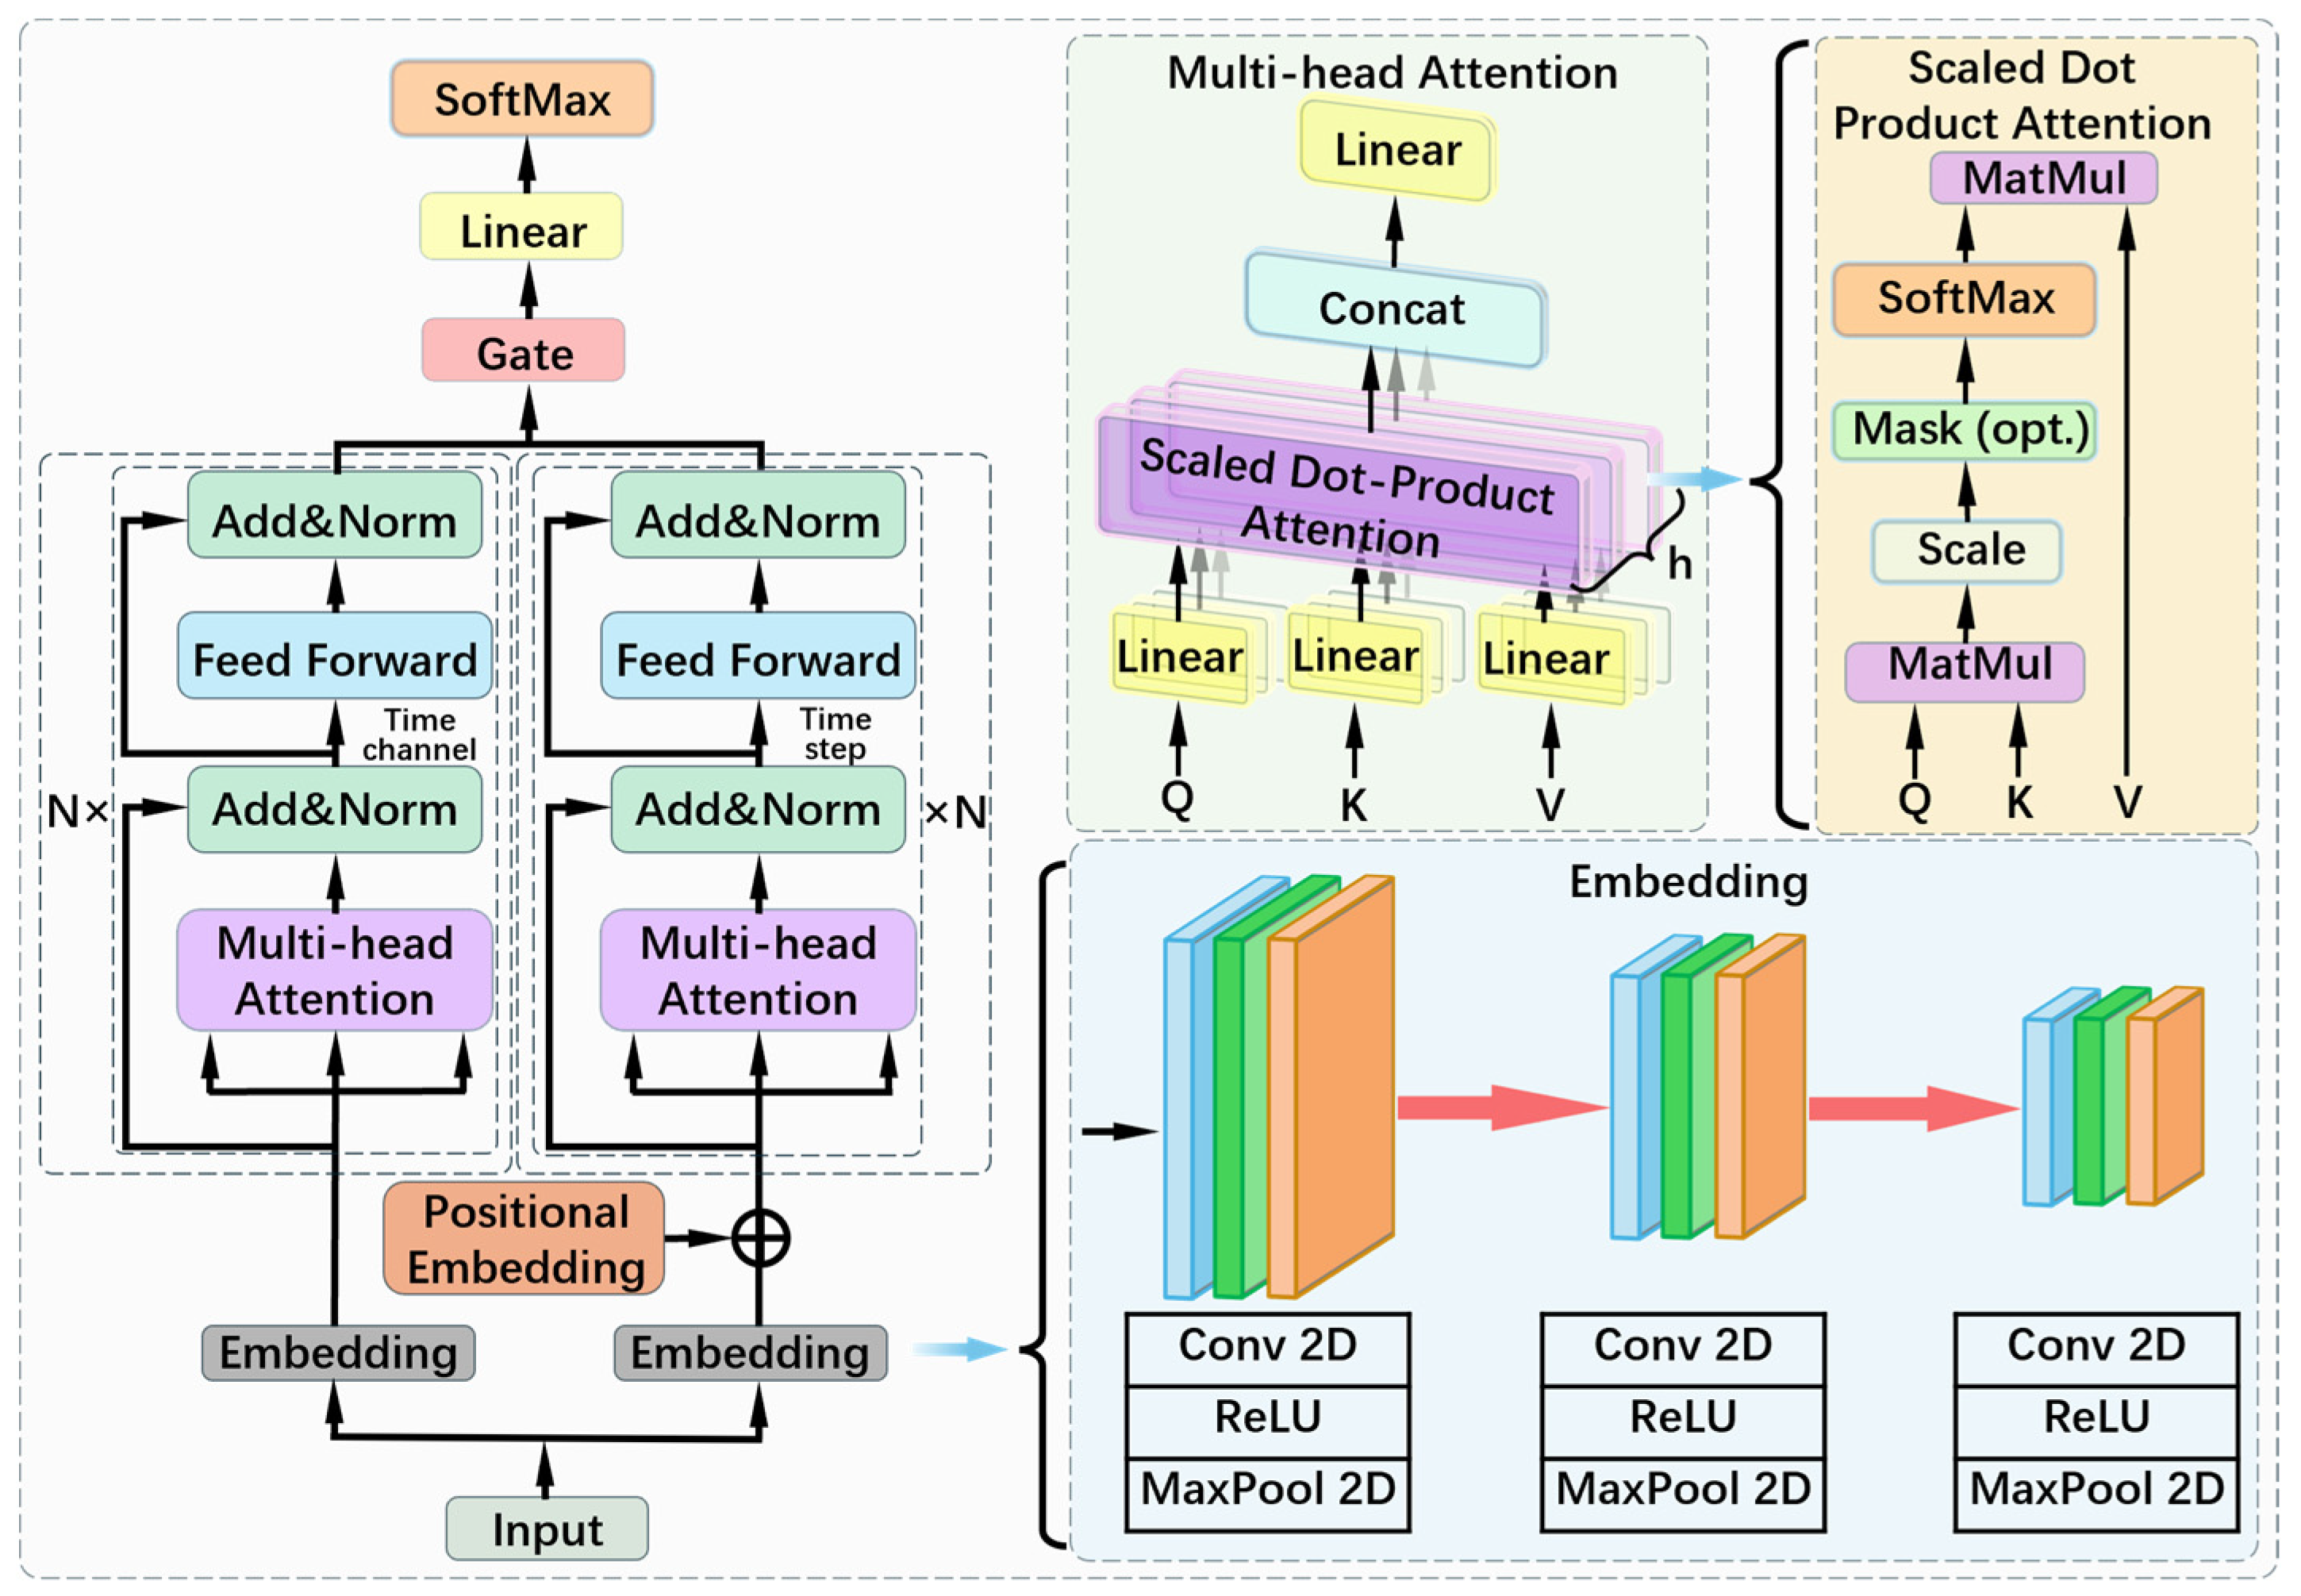
The working formation of the earth pressure balance shield machine studied in this paper is the sandy pebble formation, whose main components are sandy soil, gravel sand, and pebbles. The pebbles exhibit uneven particle sizes, strong abrasiveness, and poor fluidity. Due to the discontinuity of the formation, the torque and thrust of the cutterhead of the earth pressure balance shield machine fluctuate greatly during excavation, and wear of the cutterhead and cutting tools often occurs. In this section, the discrete element method is utilized to simulate the movement of the cutterhead system of the earth pressure balance shield machine in the sandy pebble formation and the influence of formation changes on the operating parameters of the cutterhead system is studied.

Discrete Element Simulation

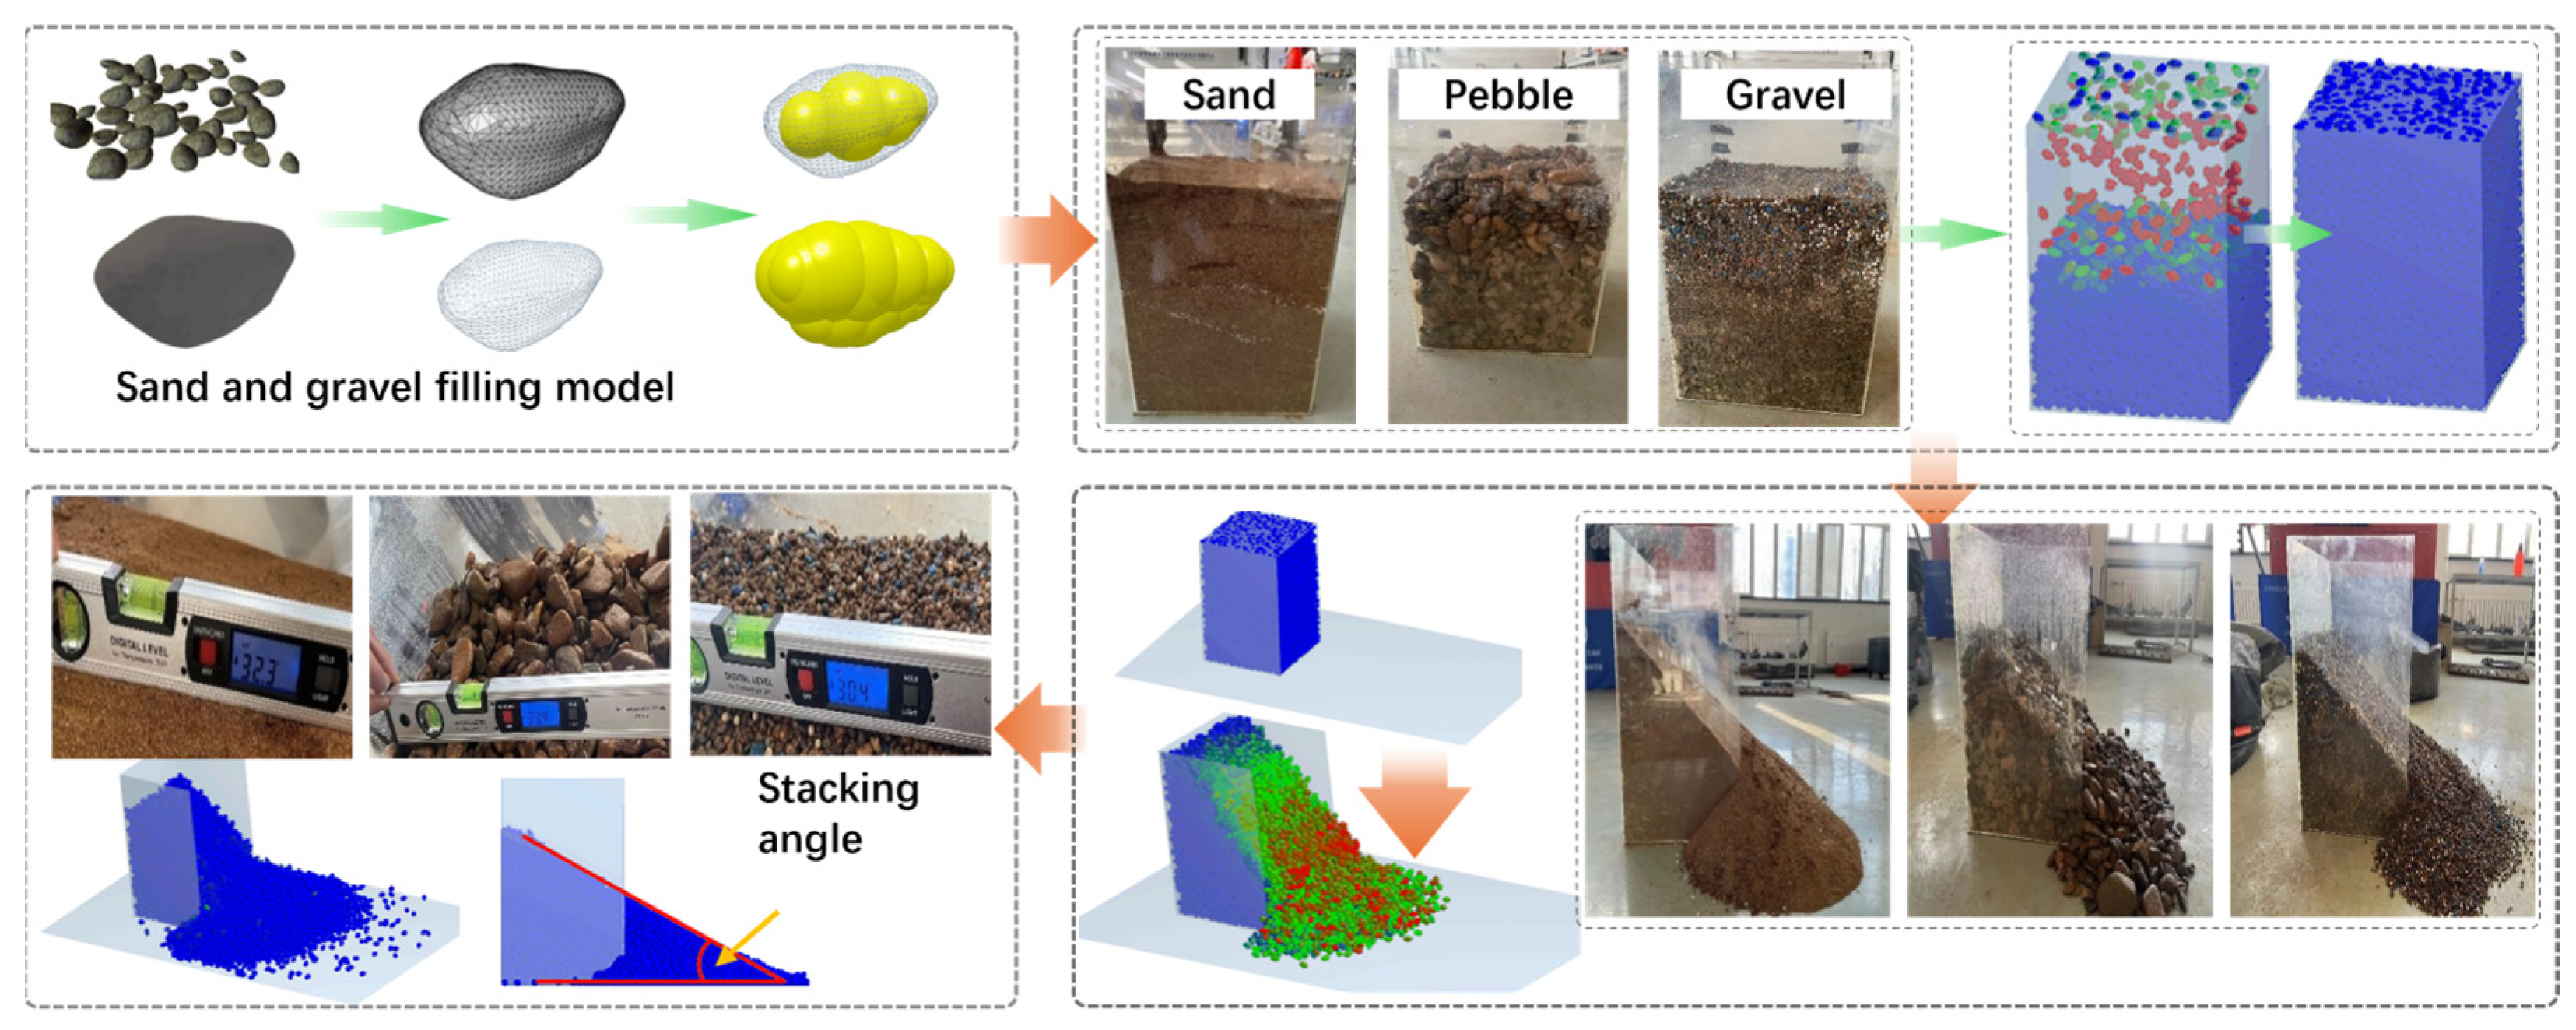
The DEM is utilized to calibrate the stacking angle. The stacking angle is known as the repose angle, which is maintained by the conical material pile when granular materials are freely stacked on a plane. The maximum angle between the slope surface of the material and the plane is called the maximum stacking angle. For loose granular materials, the natural repose angle is approximately equal to the peak friction angle of the soil. Therefore, the internal friction angle of the particles can be estimated through the accumulation angle experiment. The process of staking angle measurement is shown in Figure 1.
In order to reduce the errors caused by manual operation, when conducting the stacking angle experiments of the three types of particles above, the stacking angle experiments of each type of particle were repeated in three groups, and the average value of the measured stacking angles was taken as the stacking angles of each type of particle, as shown in Table 1. By consulting the geological exploration report and relevant materials, intrinsic parameters such as density, Poisson’s ratio, and shear modulus of the three types of particles can be obtained, as shown in Table 2.
The simulated experiments on the stacking angles of three types of particles involved sand, pebbles, and gravel. To eliminate the randomness of the simulation, after comparison and multiple simulation exercises, the stacking angles, recovery coefficients, static friction coefficients, and rolling friction coefficients of the three particle materials were finally determined, as shown in Table 3.
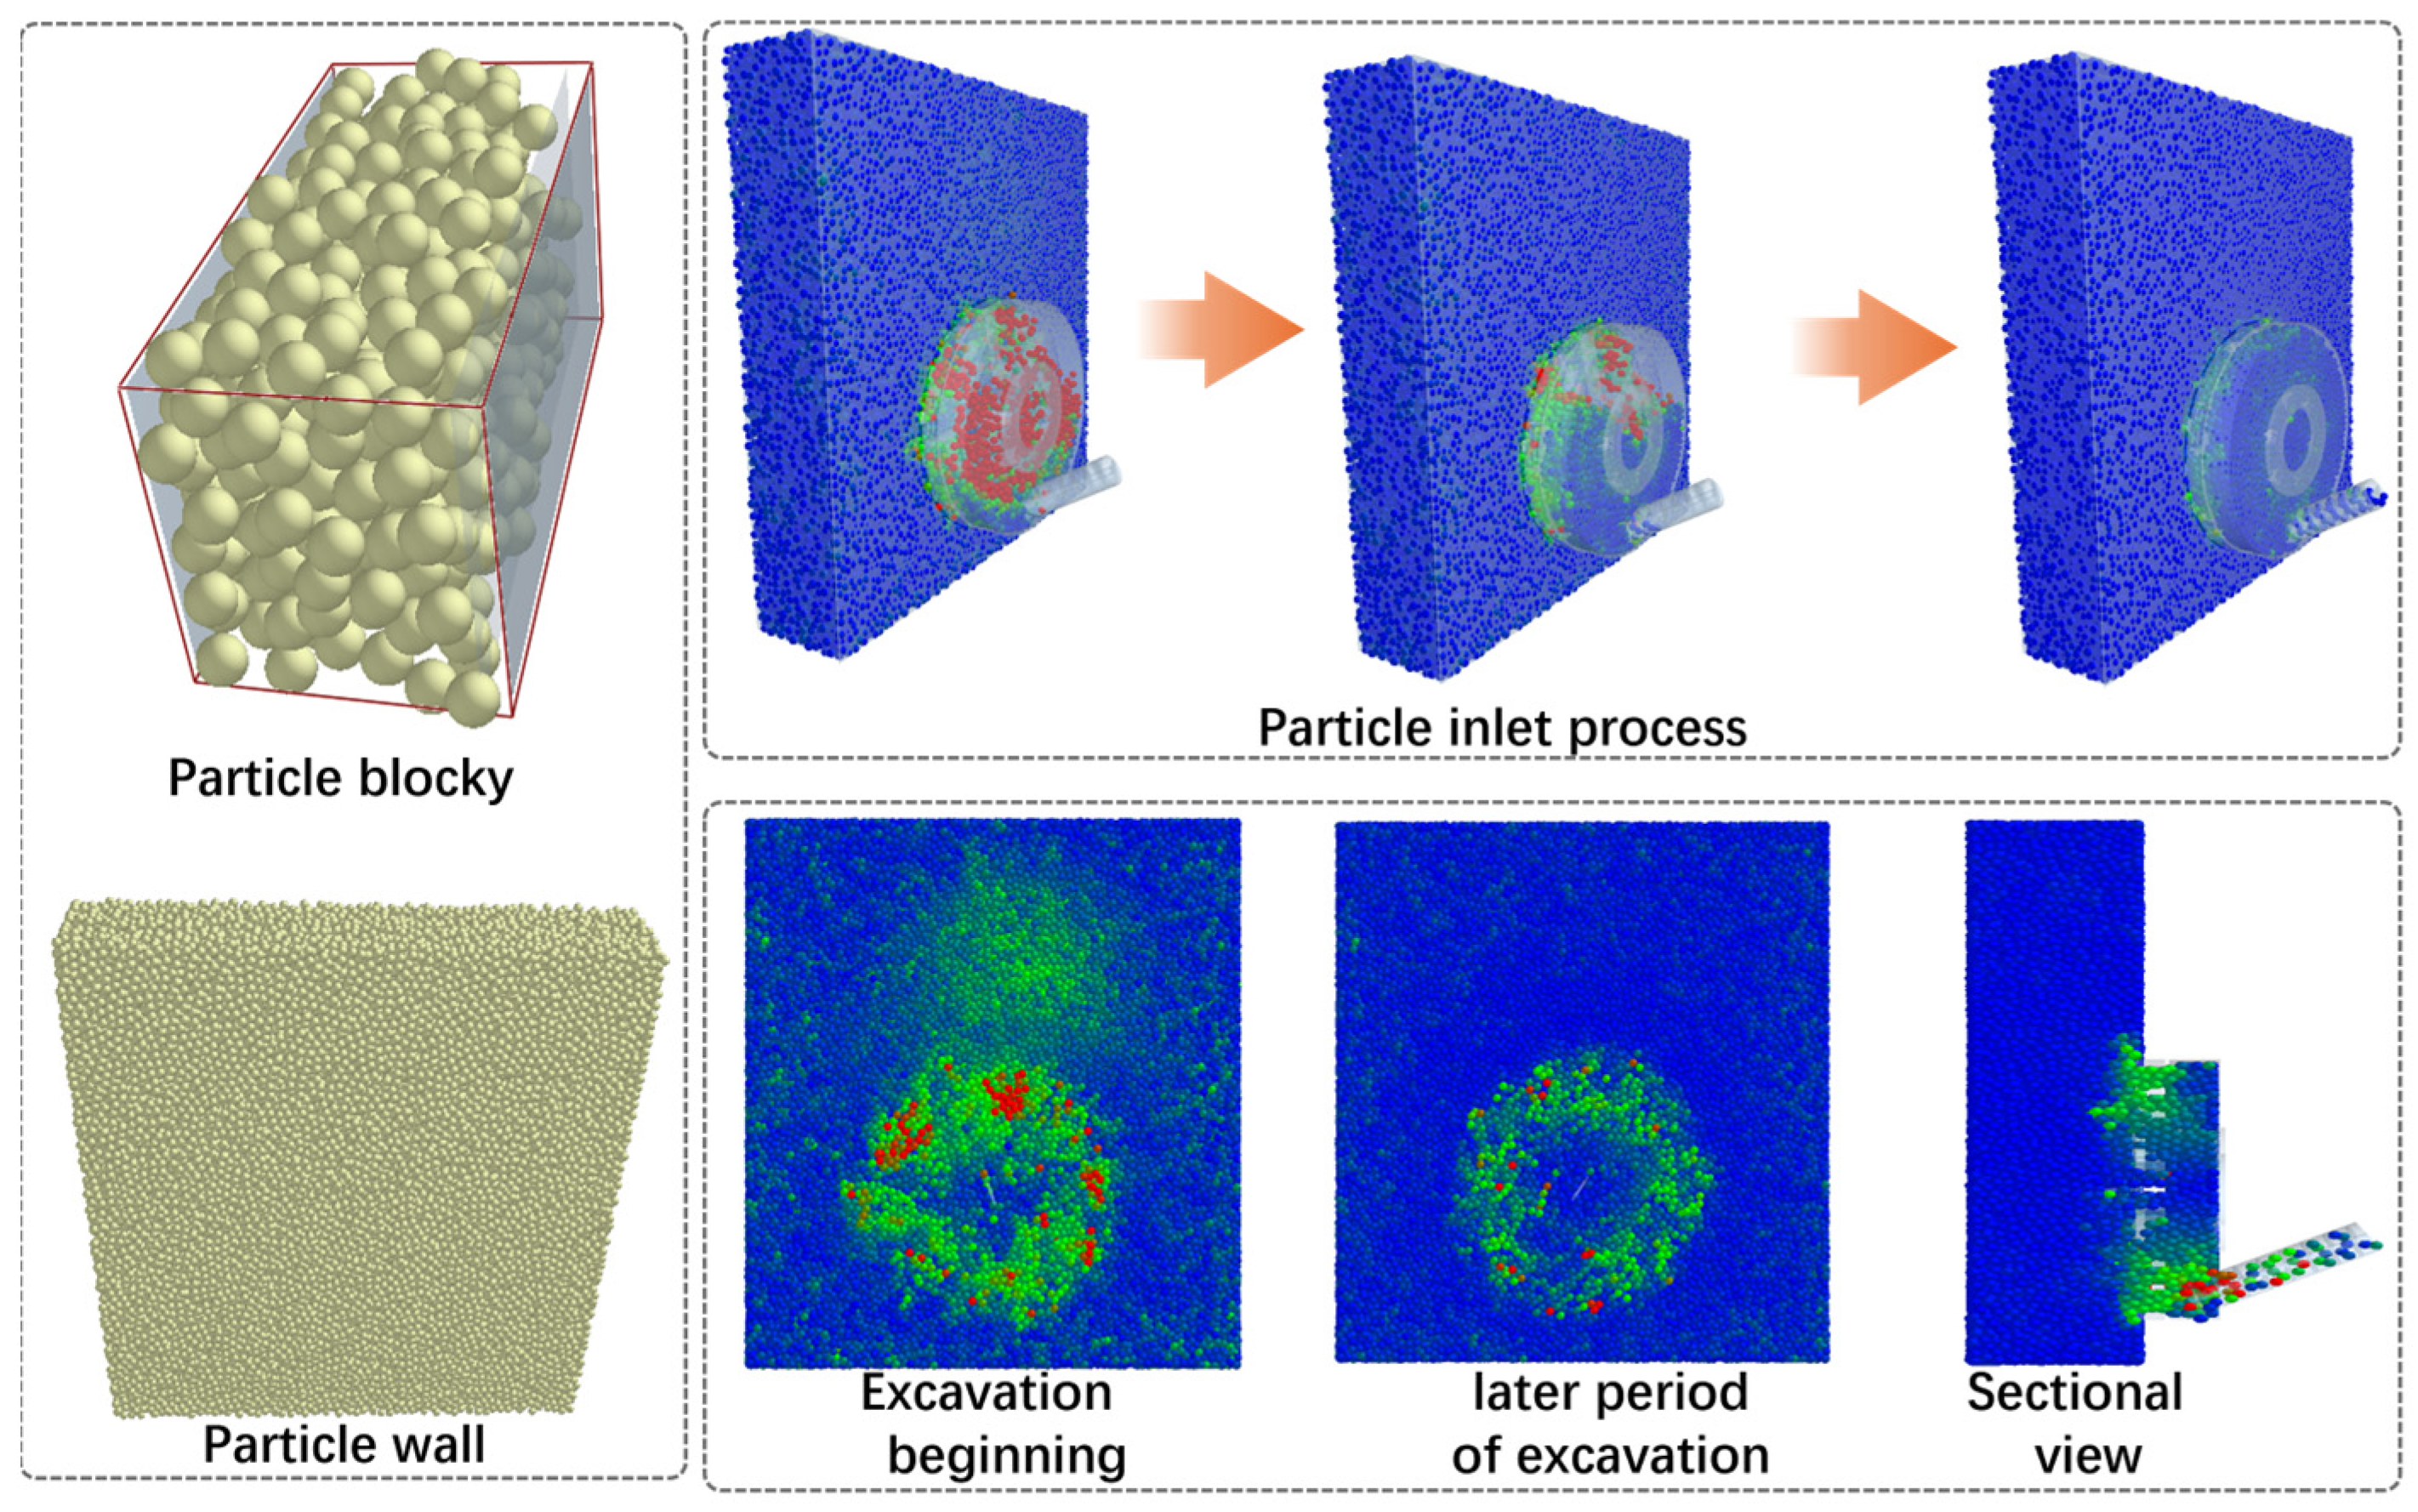
Figure 2 is a schematic diagram of the speed of particles entering the soil chamber and the tunneling face of the cutterhead. The color changes in the figure reflect the speed changes in particles entering the soil chamber.
When the cutter head system is being excavated, the particle movement at the face is relatively intense. In the later stage of the simulation, the particle movement is stable. It can be observed that the particle velocity is large in the part where the screw conveyor extends into the soil bunker.
Combining the simulation effect and calculation time, after adjustment, the selected particle diameter was 60 mm. The particle shape was circular particles. After the filling of each particle was completed, the particle wall was left to stand for 20 s. The tunneling speed of the cutter head system was set to 60 mm/min, the rotational speed of the cutter head to 1.6 r/min, and the rotational speed of the screw conveyor to 9 r/min; the step size was set to 20%. The simulation time for each group was set to 400 s, the data storage interval was set to 1 s, and the mesh particle size was set to 3R. Tunneling simulations were conducted in single-particle formation for three types of particles (sandy soil, gravel, and pebbles). Due to the discontinuous distribution of pebble layers in the formation, it was also necessary to conduct tunneling simulation of composite particle formation. The formations of sand—gravel, sand—pebbles, gravel—pebbles, and sand—gravel—pebbles were set up. The proportion of particles in the two types of formations was 50% each, and the proportion of particles in the three types of formations was 33.3% each.
The above simulation was conducted in a formation with a soil cover ratio of 1. The excavation simulation of the cutterhead system was then carried out in a formation with a soil cover ratio of 2. The formation setting scheme is shown in Table 4. The rotational speed of the cutter head, the tunneling speed, and the rotational speed of the screw conveyor were preset parameters, while the torque and thrust of the cutter head were feedback parameters. Formation type five was selected, and the influence relationship of each parameter was analyzed. The simulation schemes for setting different rotational speeds and different tunneling speeds are shown in Table 5.
The torque of the cutterhead was analyzed through simulation of earth pressure balance shield machine tunneling. 
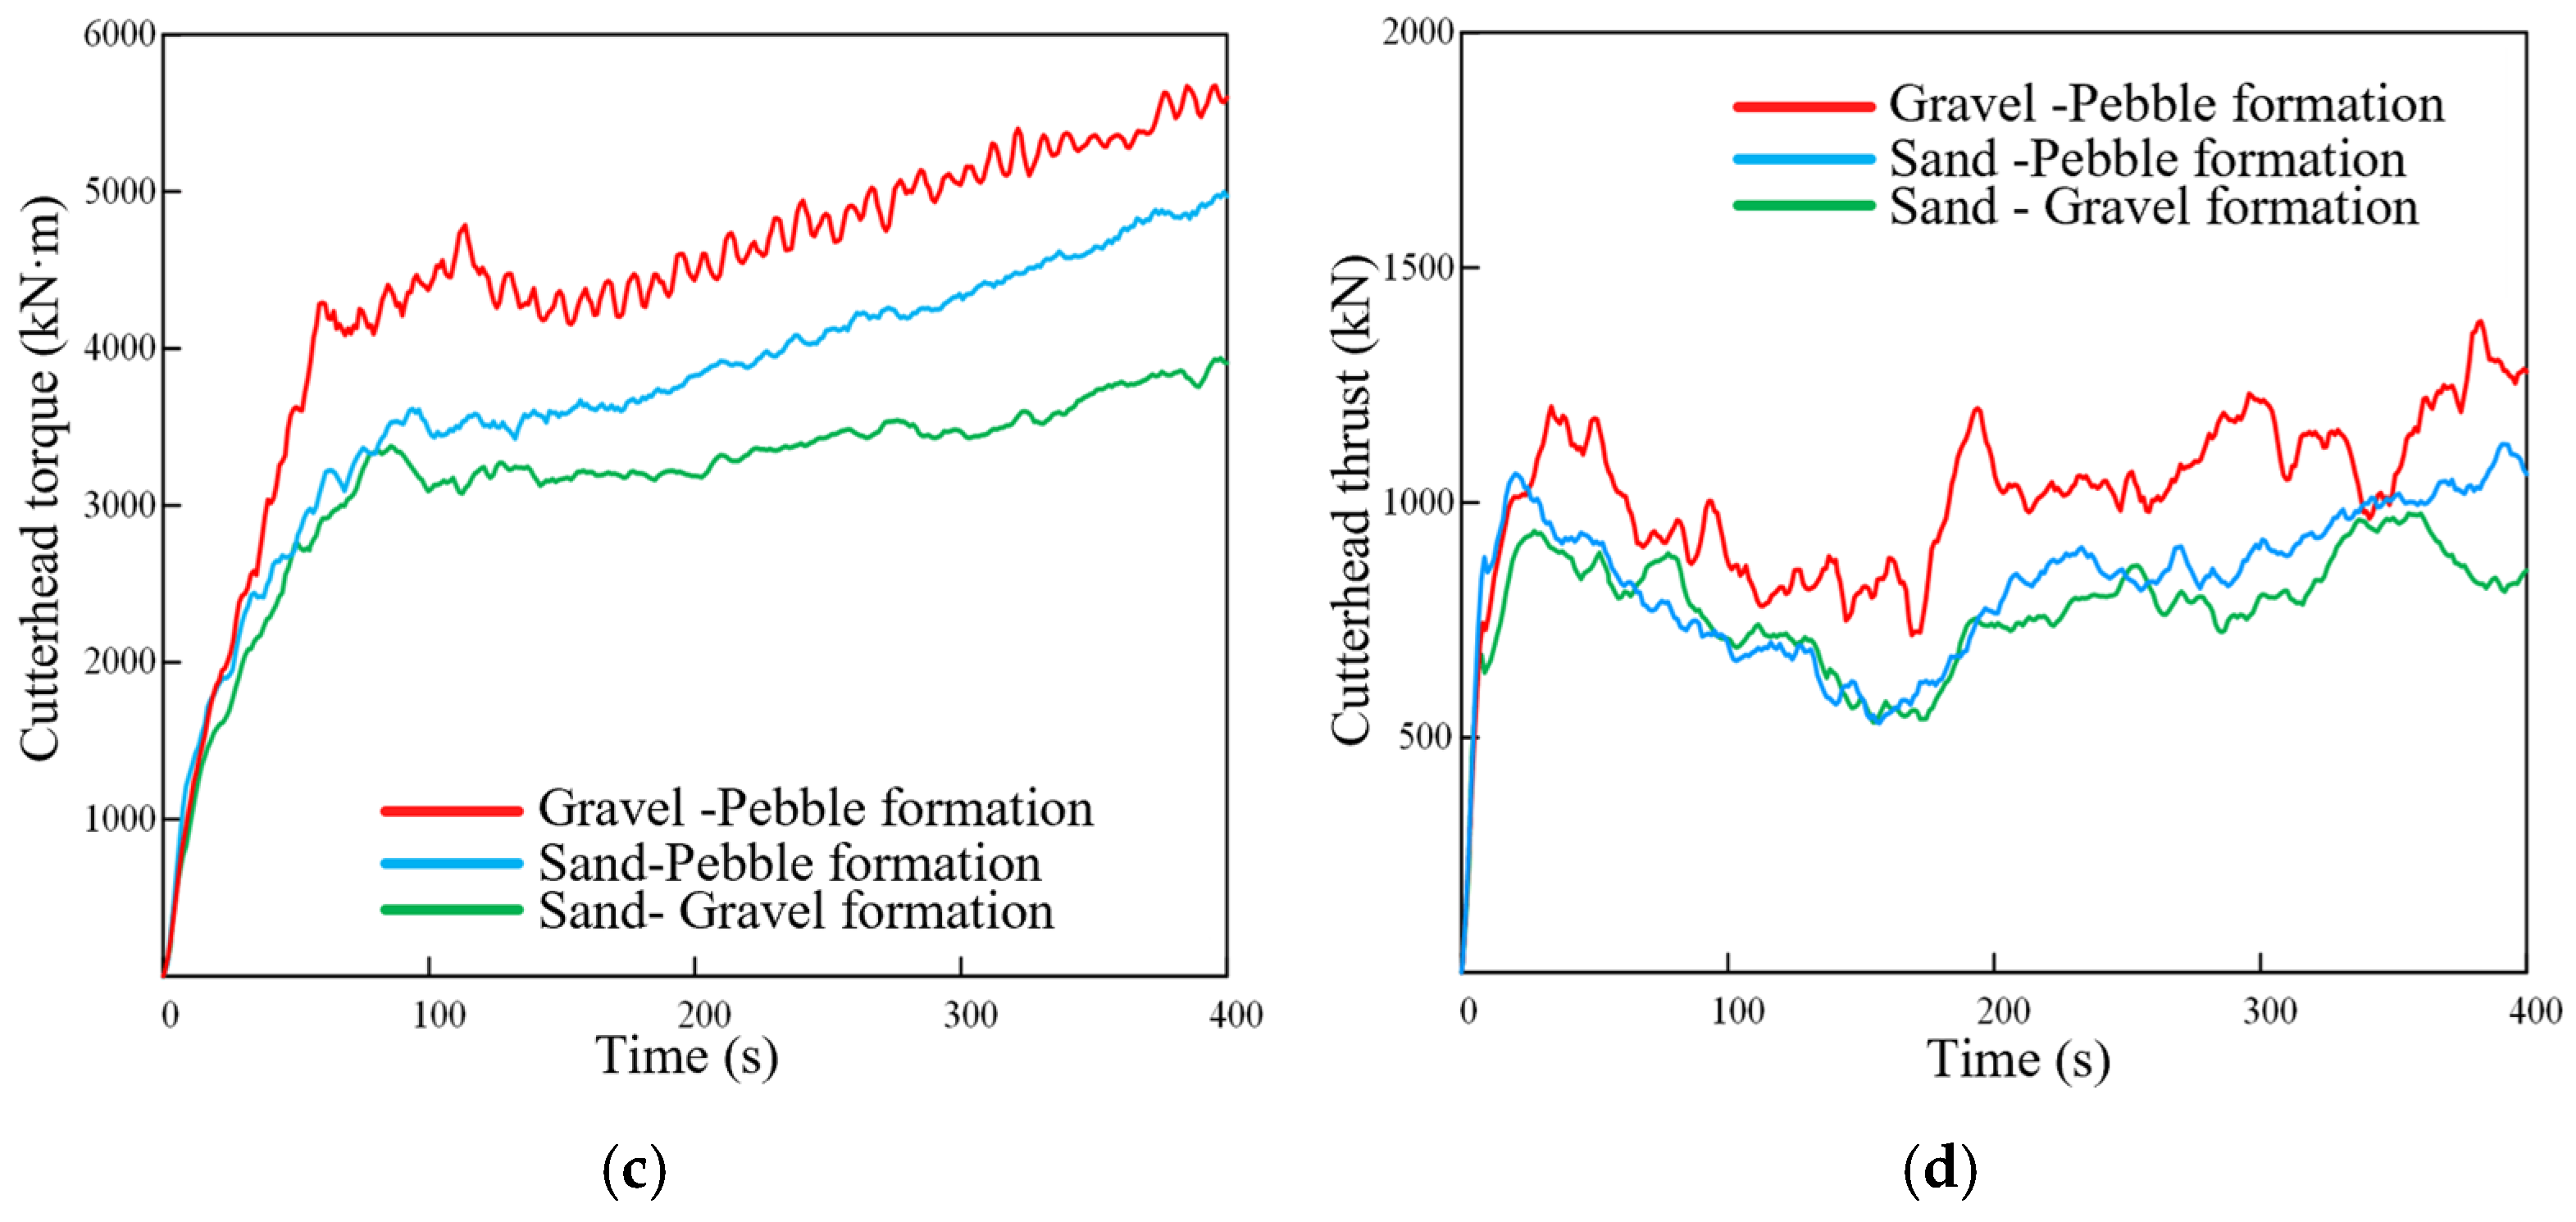
Figure 3a,b show the torque and thrust of the cutterhead system when tunneling in a single granular formation. It can be seen from Figure 3a that at the beginning of the tunneling, the torque of the cutterhead increases rapidly. In the middle stage of the simulation, as the tunneling enters the stable period, the increase in the torque of the cutterhead decreases and tends to be stable. The maximum torque of the cutter head in the sandy soil formation, the gravel and sand formation, and the pebble formation is 2430 kN·m, 4915 kN·m, and 5115 kN·m, respectively.
The formation depth and particle contact parameters were set the same as single formation tunneling. The simulation results of the composite formation were analyzed. Figure 3c,d show the cutterhead torque and thrust of the cutterhead system for tunneling in the double-particle formation. Figure 3c shows the torque of the cutter head in the double-particle formation. It can be seen that the torque of the cutter head increases with the increase in the content of gravel and pebble particles. The maximum torque of the cutter head in the sand–gravel formation is 4452 kN·m, the sand–pebble formation is 5615 kN·m, and the gravel–pebble formation is 5874 kN·m. Figure 3d shows the thrust of the cutter head in the double-particle formation. In the sandy soil–gravel formation, the maximum thrust of the cutter head is 1256 kN. The maximum thrust of the cutter head in the sandy soil–pebble formation is 1204 kN, and in the gravel–pebble formation it is 1462 kN. When the content of gravel and pebbles increases, the excavation thrust of the cutter head system in the formation will increase accordingly.
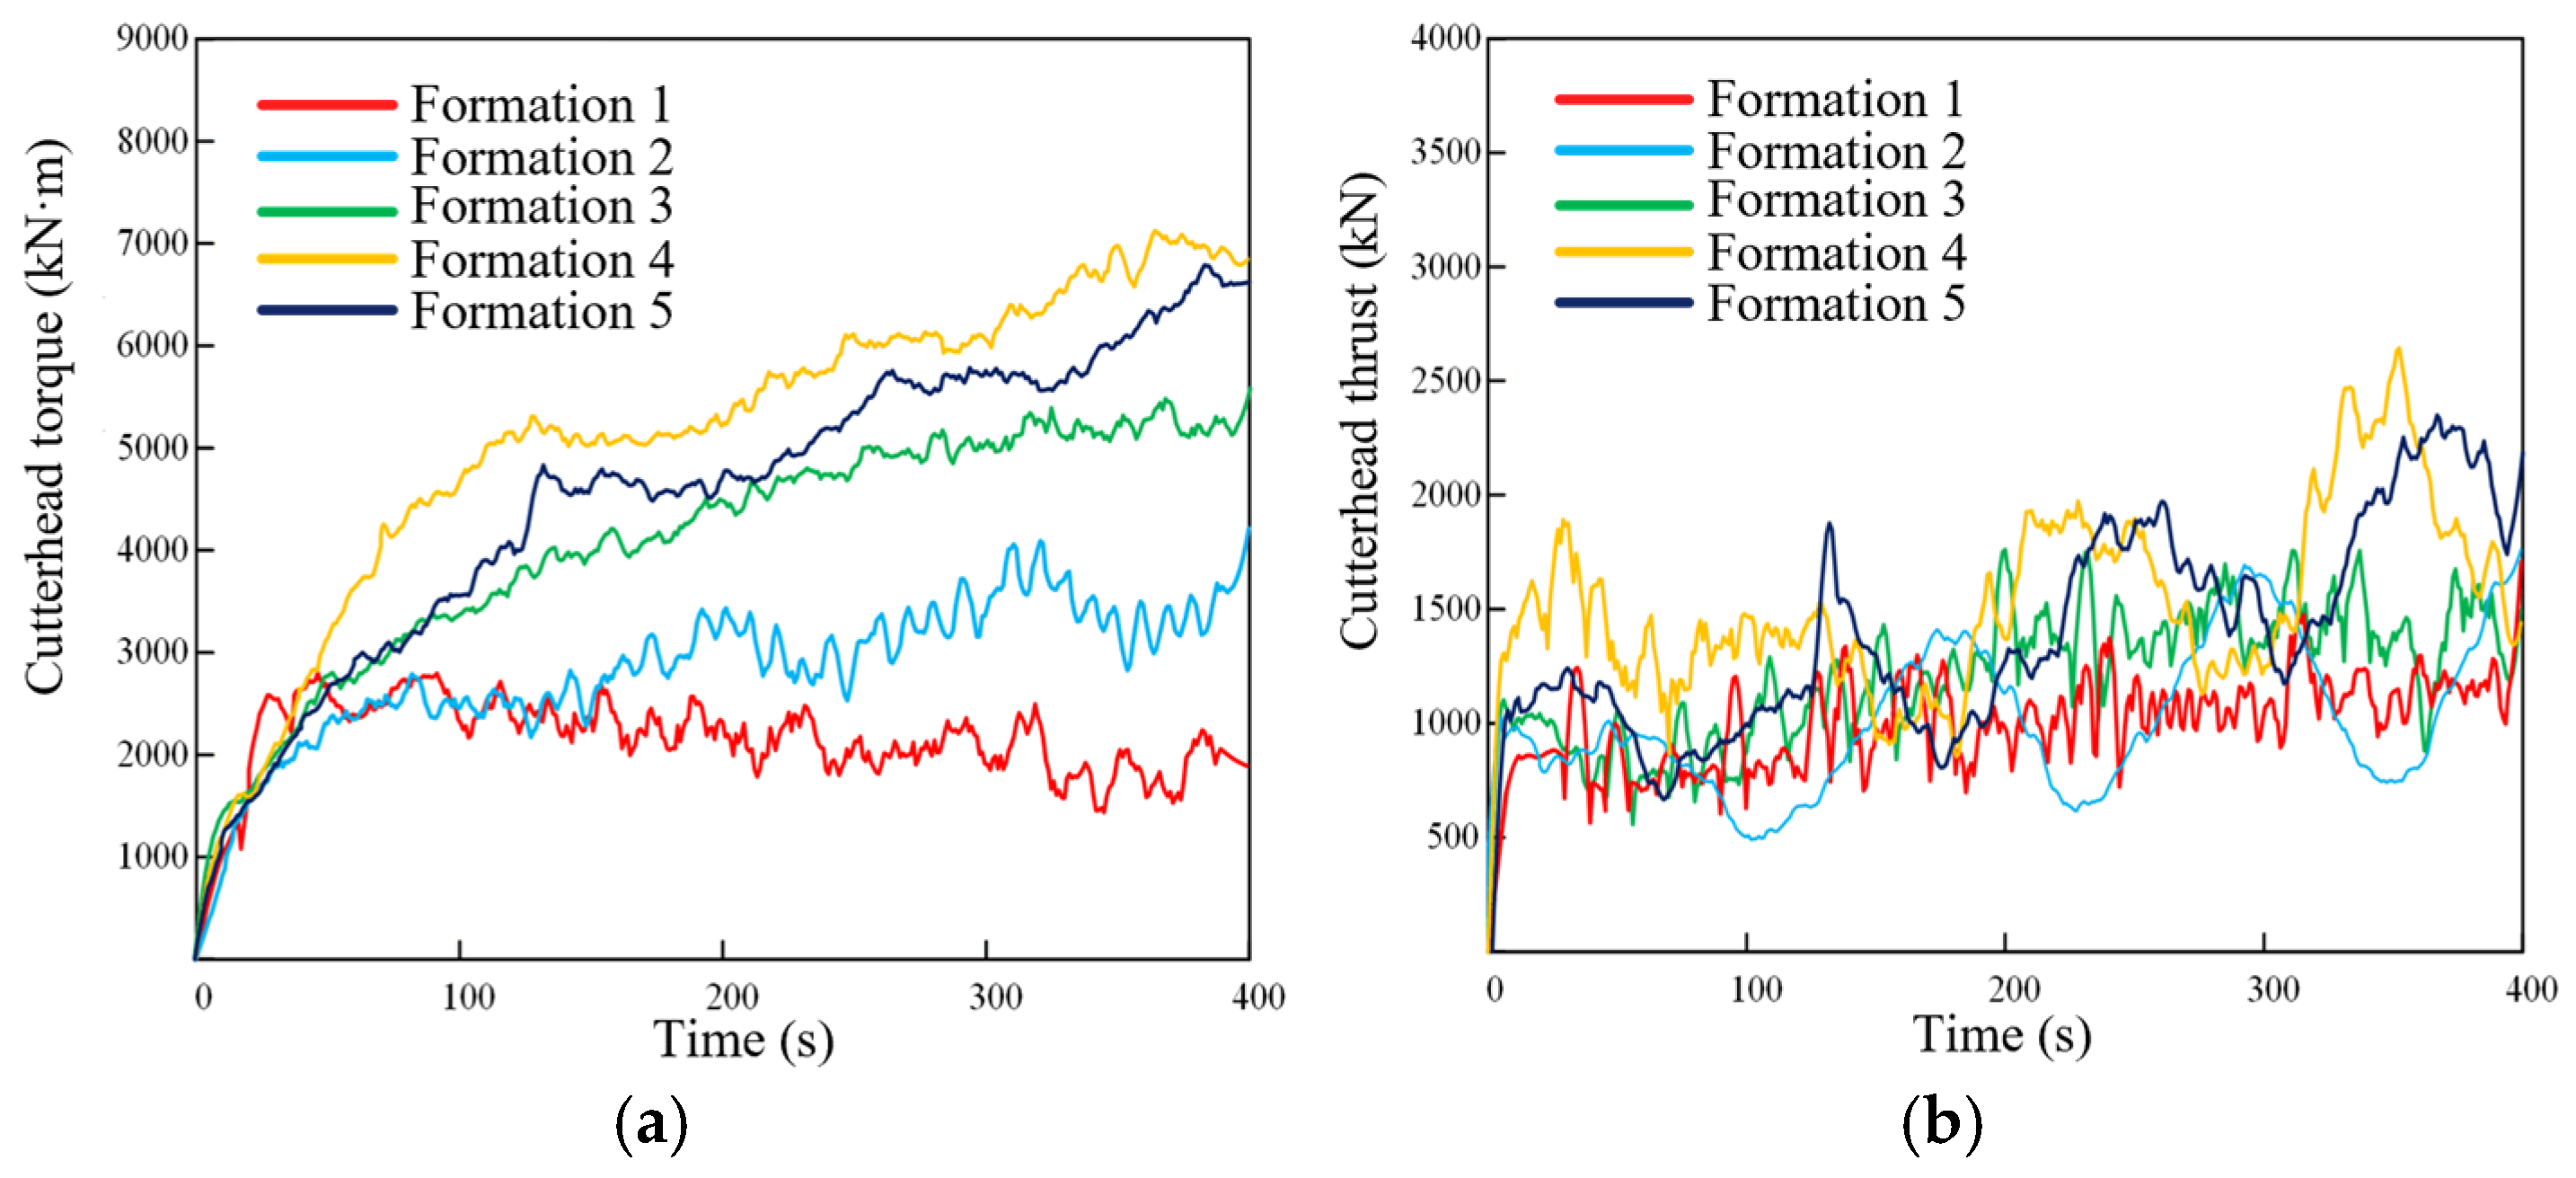
The torque and thrust of the cutter head with a soil cover ratio of 2 are shown in Figure 4. The torque of the cutter head gradually increases and then tends to be stable. It can be observed from Figure 4a that the torque of the cutter head increases with the increase in the contents of gravel-sand and pebble particle formation. The maximum torques of the cutter heads of formations 1, 2, 3, 4, and 5 are 2956 kN·m, 3756 kN·m, 5712 kN·m, and 6523 kN·m, respectively. In formation 1, there are sand particles. In the later stage of the simulation, the torque of the cutter head shows a downward trend. Among the four formations, the torque of the cutter head is the greatest, and the proportion of gravel, sand, and pebbles in the formation is the largest. It can be seen from Figure 4b that the thrust of the cutter head fluctuates in the formation, with smaller amplitudes in formation 1 and formation 3 and larger amplitudes emerging in formation 2, formation 4, and formation 5.
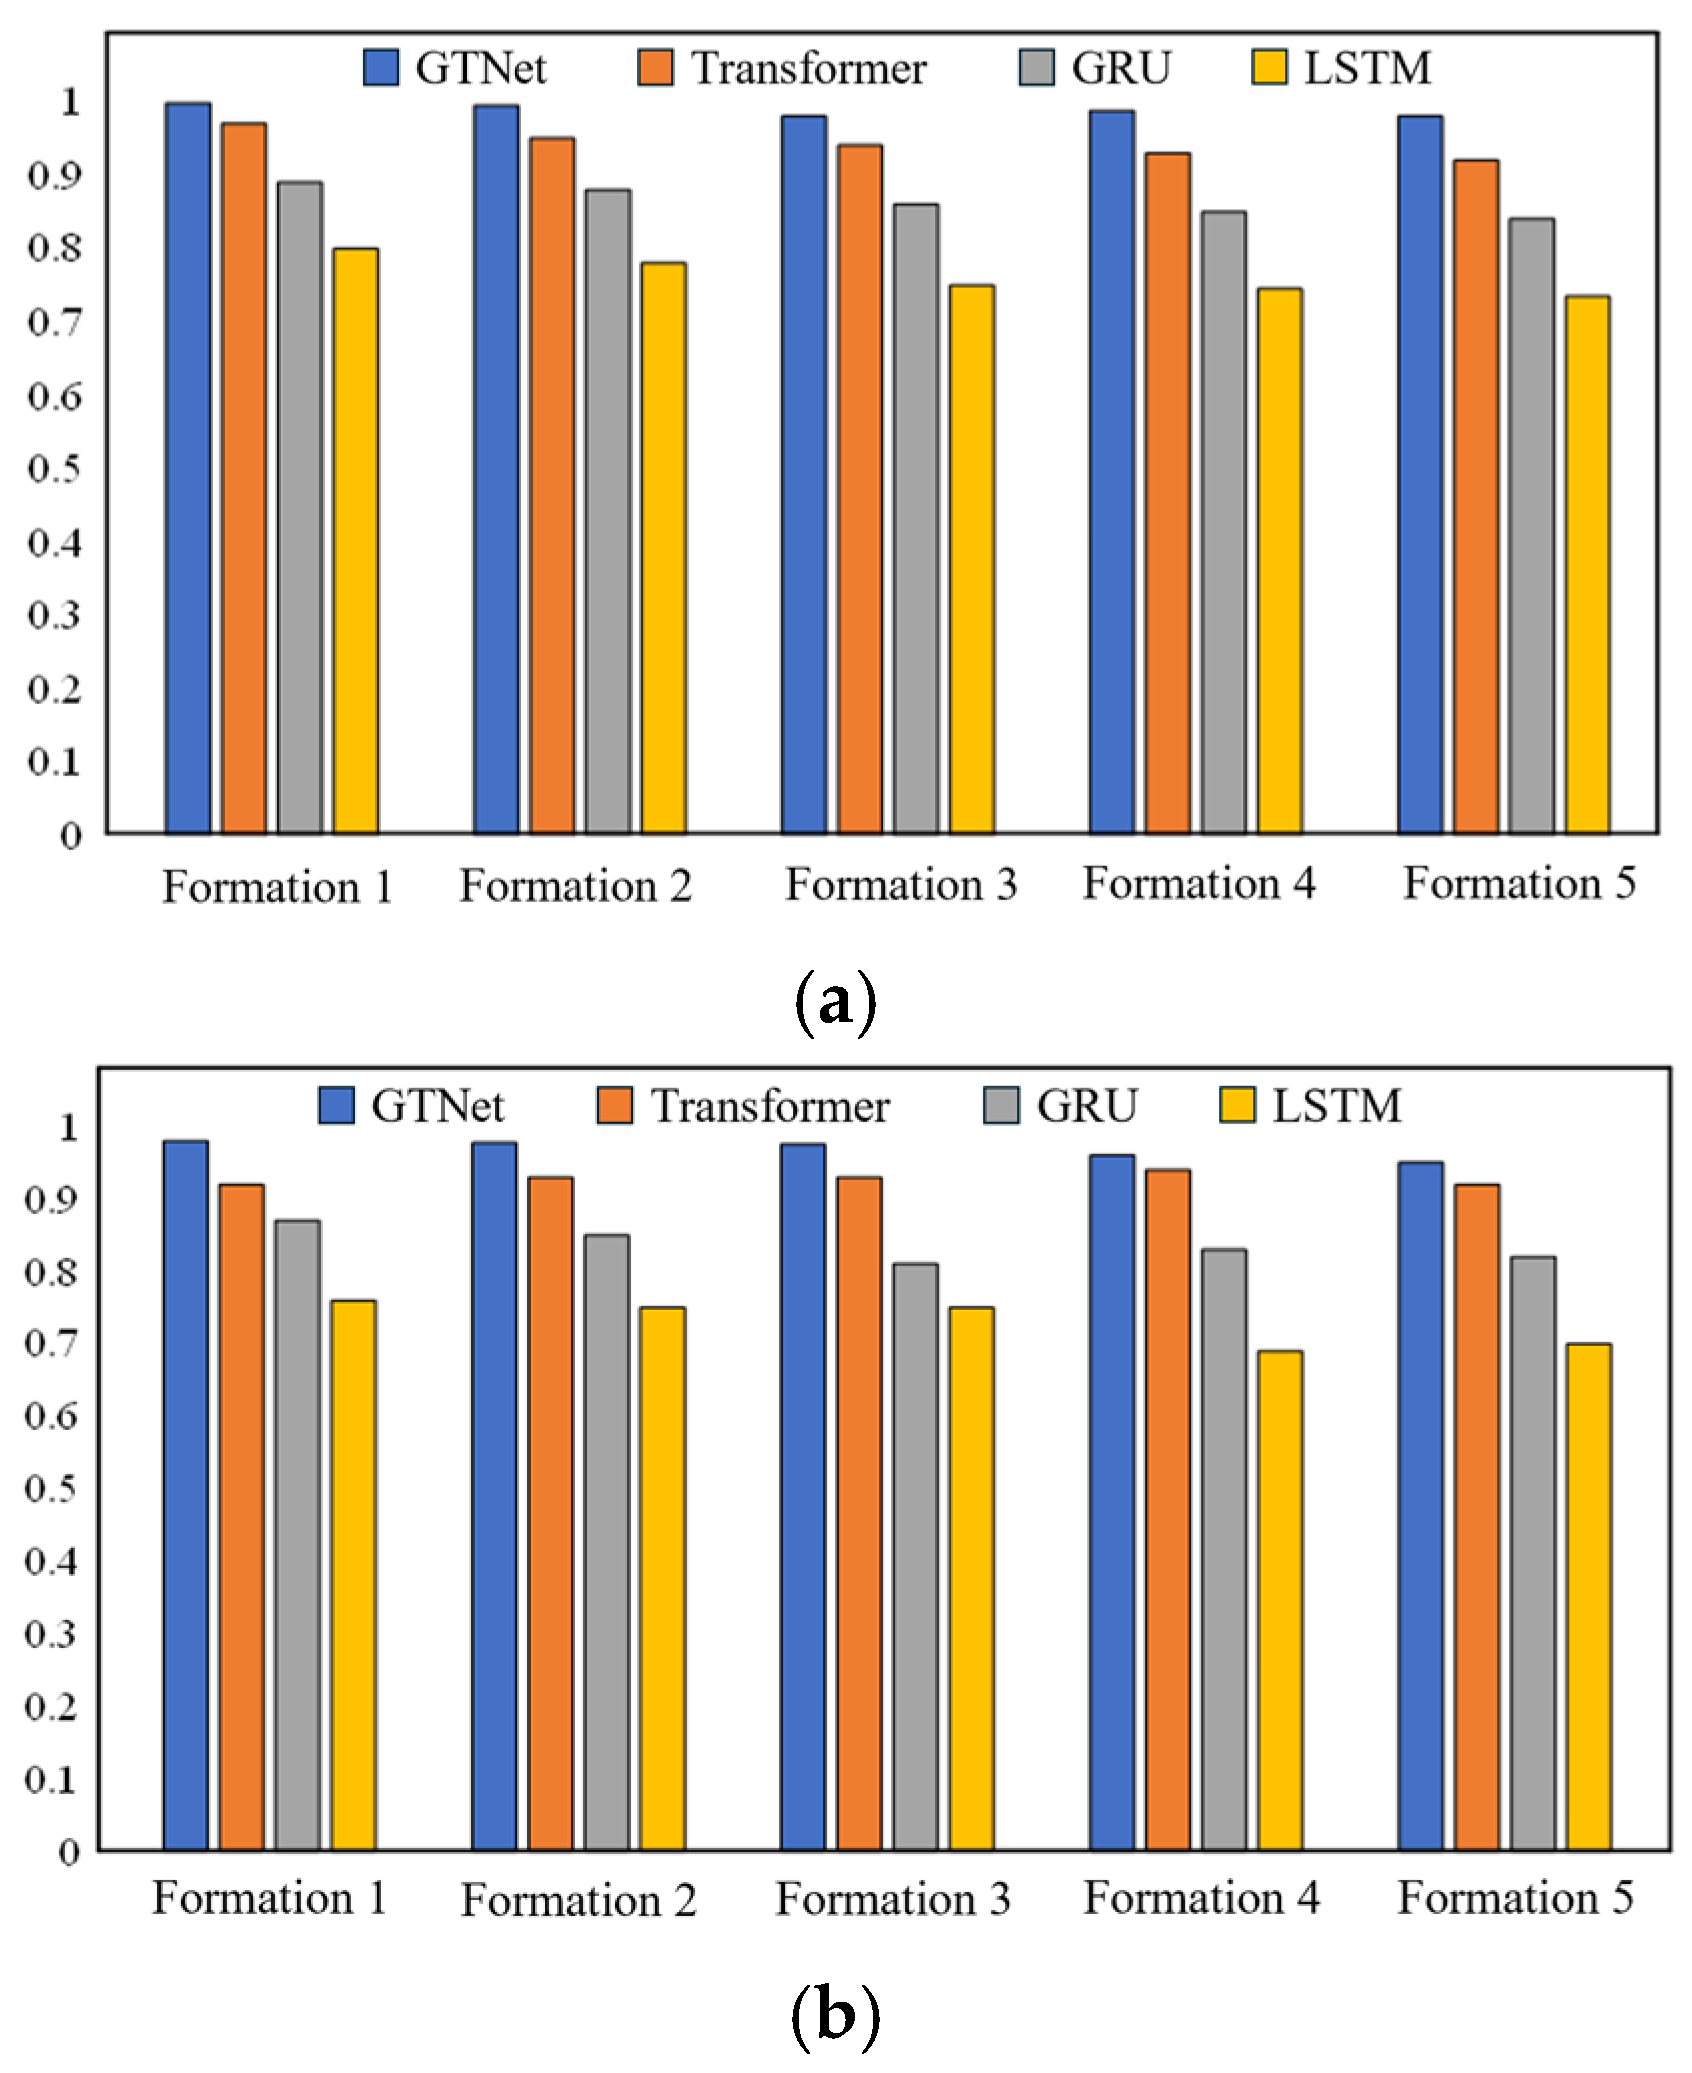
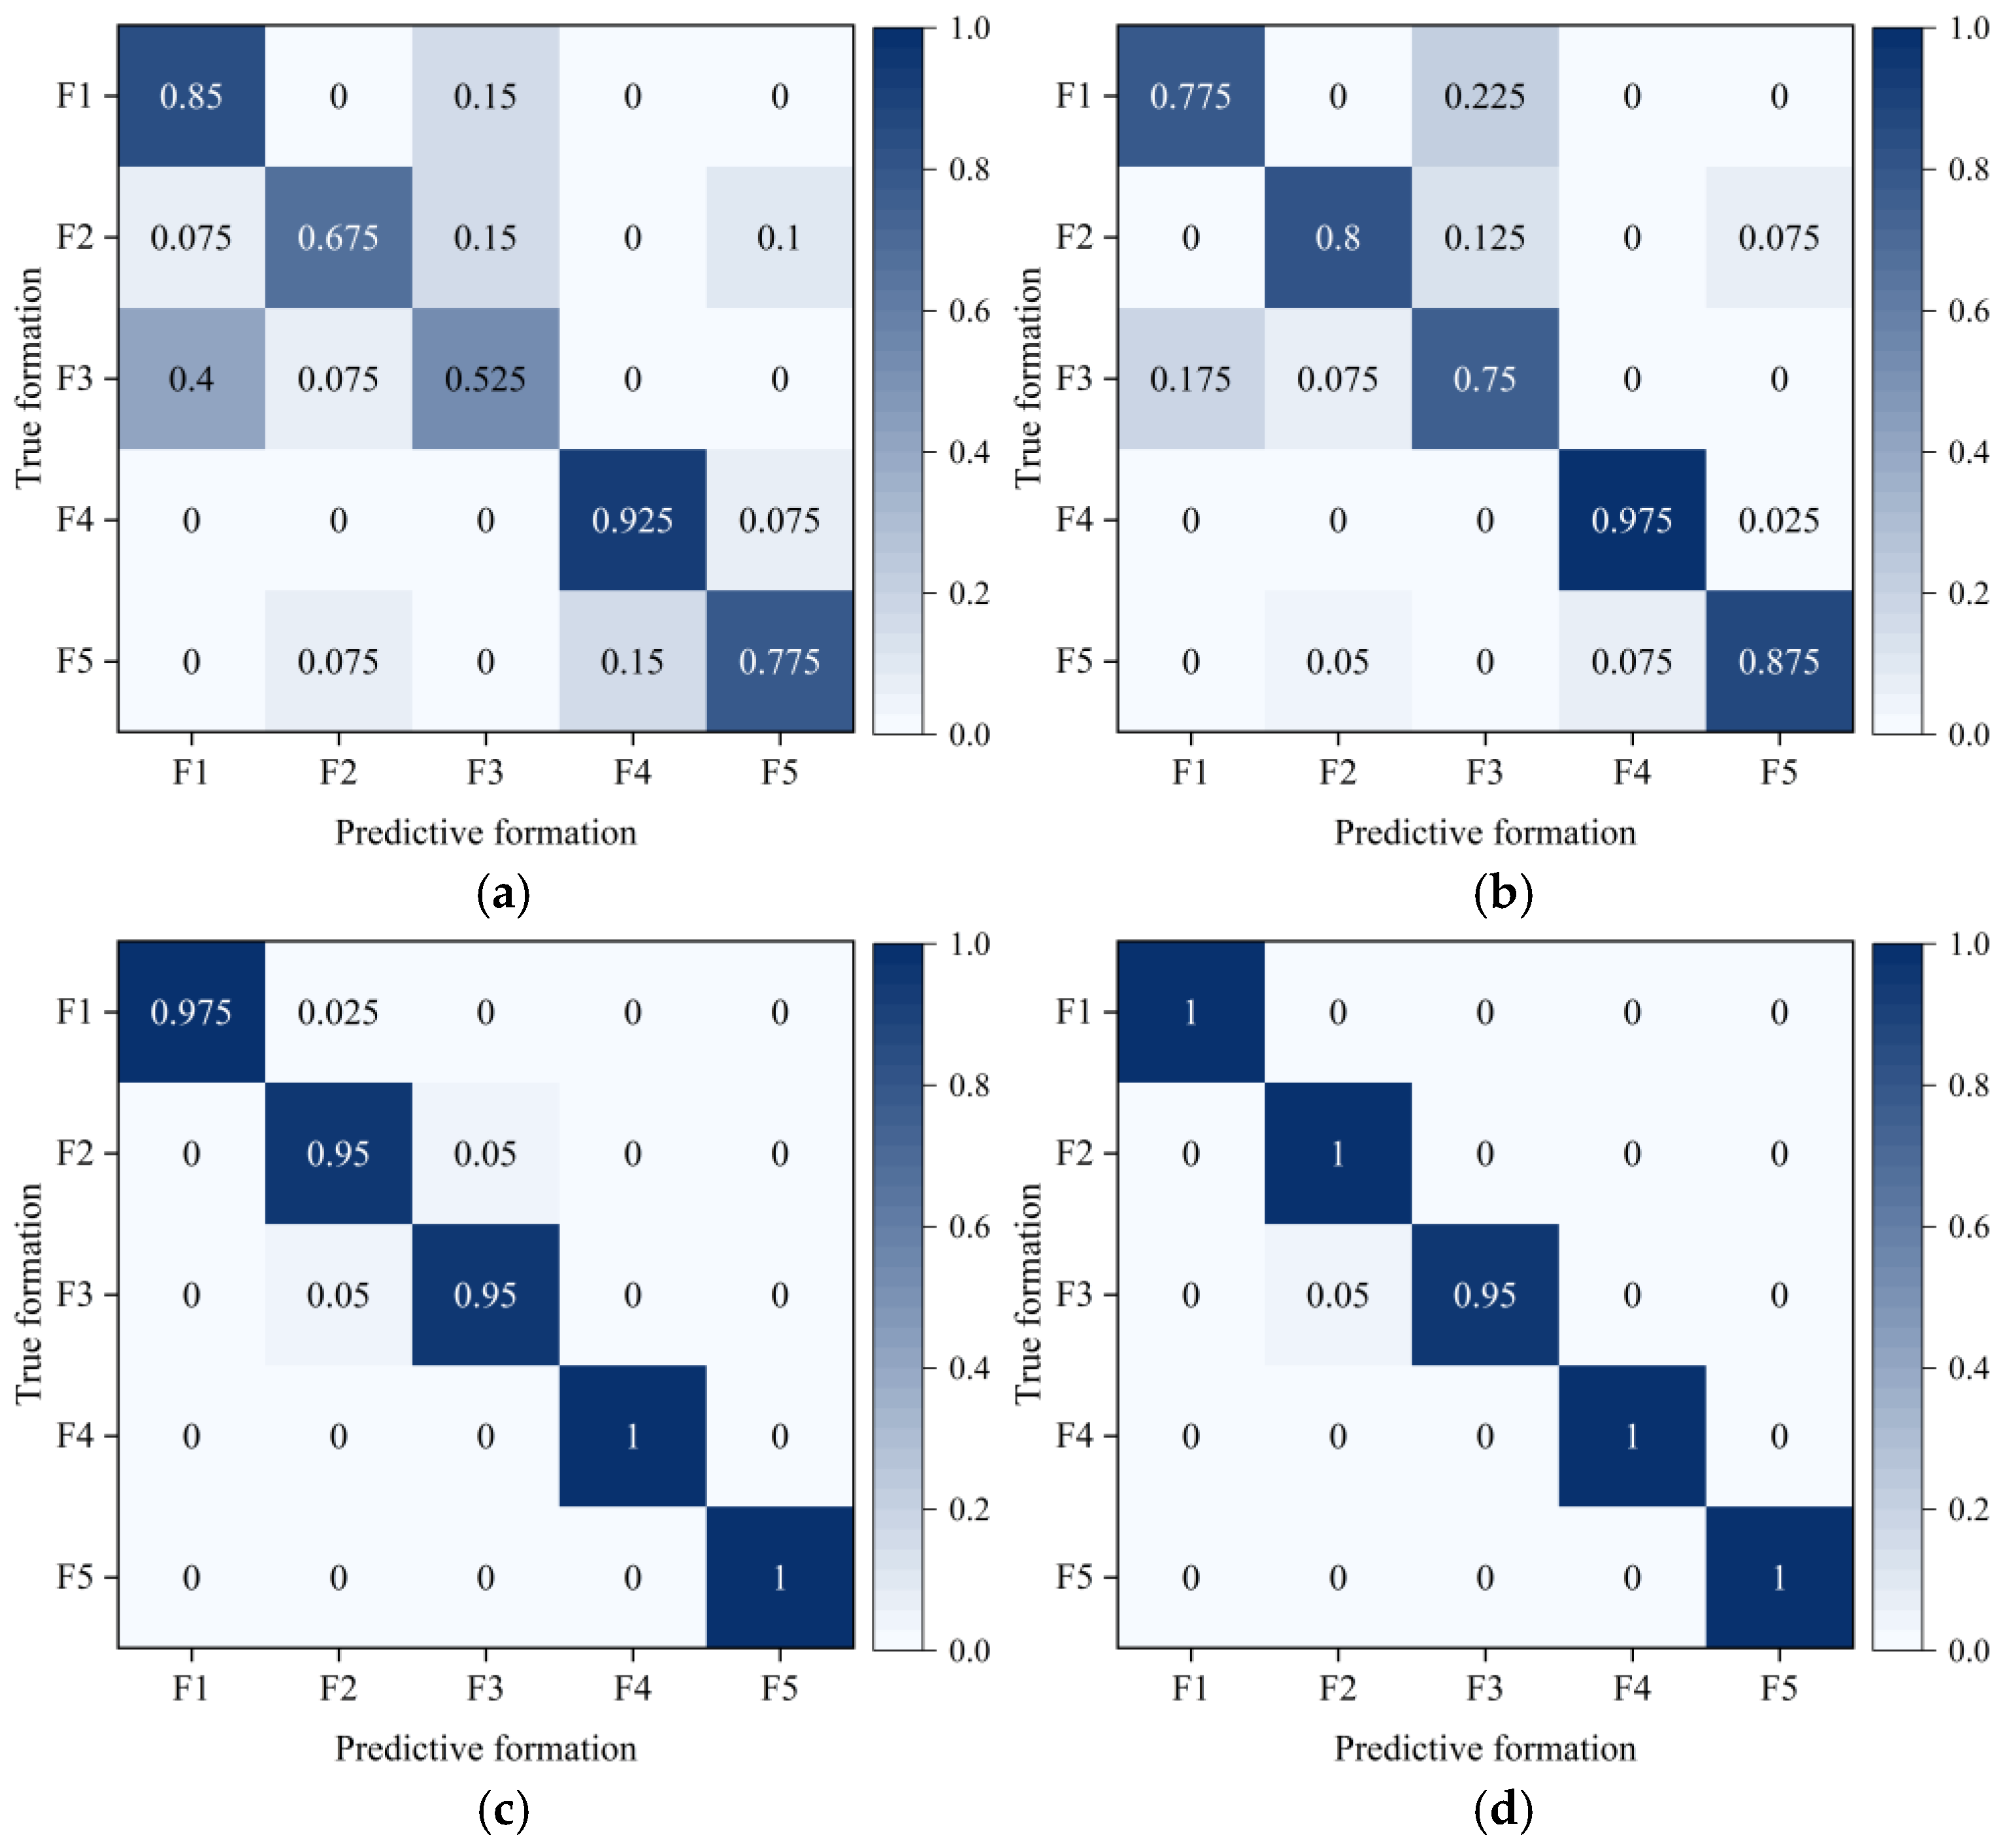
In the research that follows, formation 5 is selected as the research object, and the simulation results in Table 5 are analyzed to study the influence of tunneling parameters. 
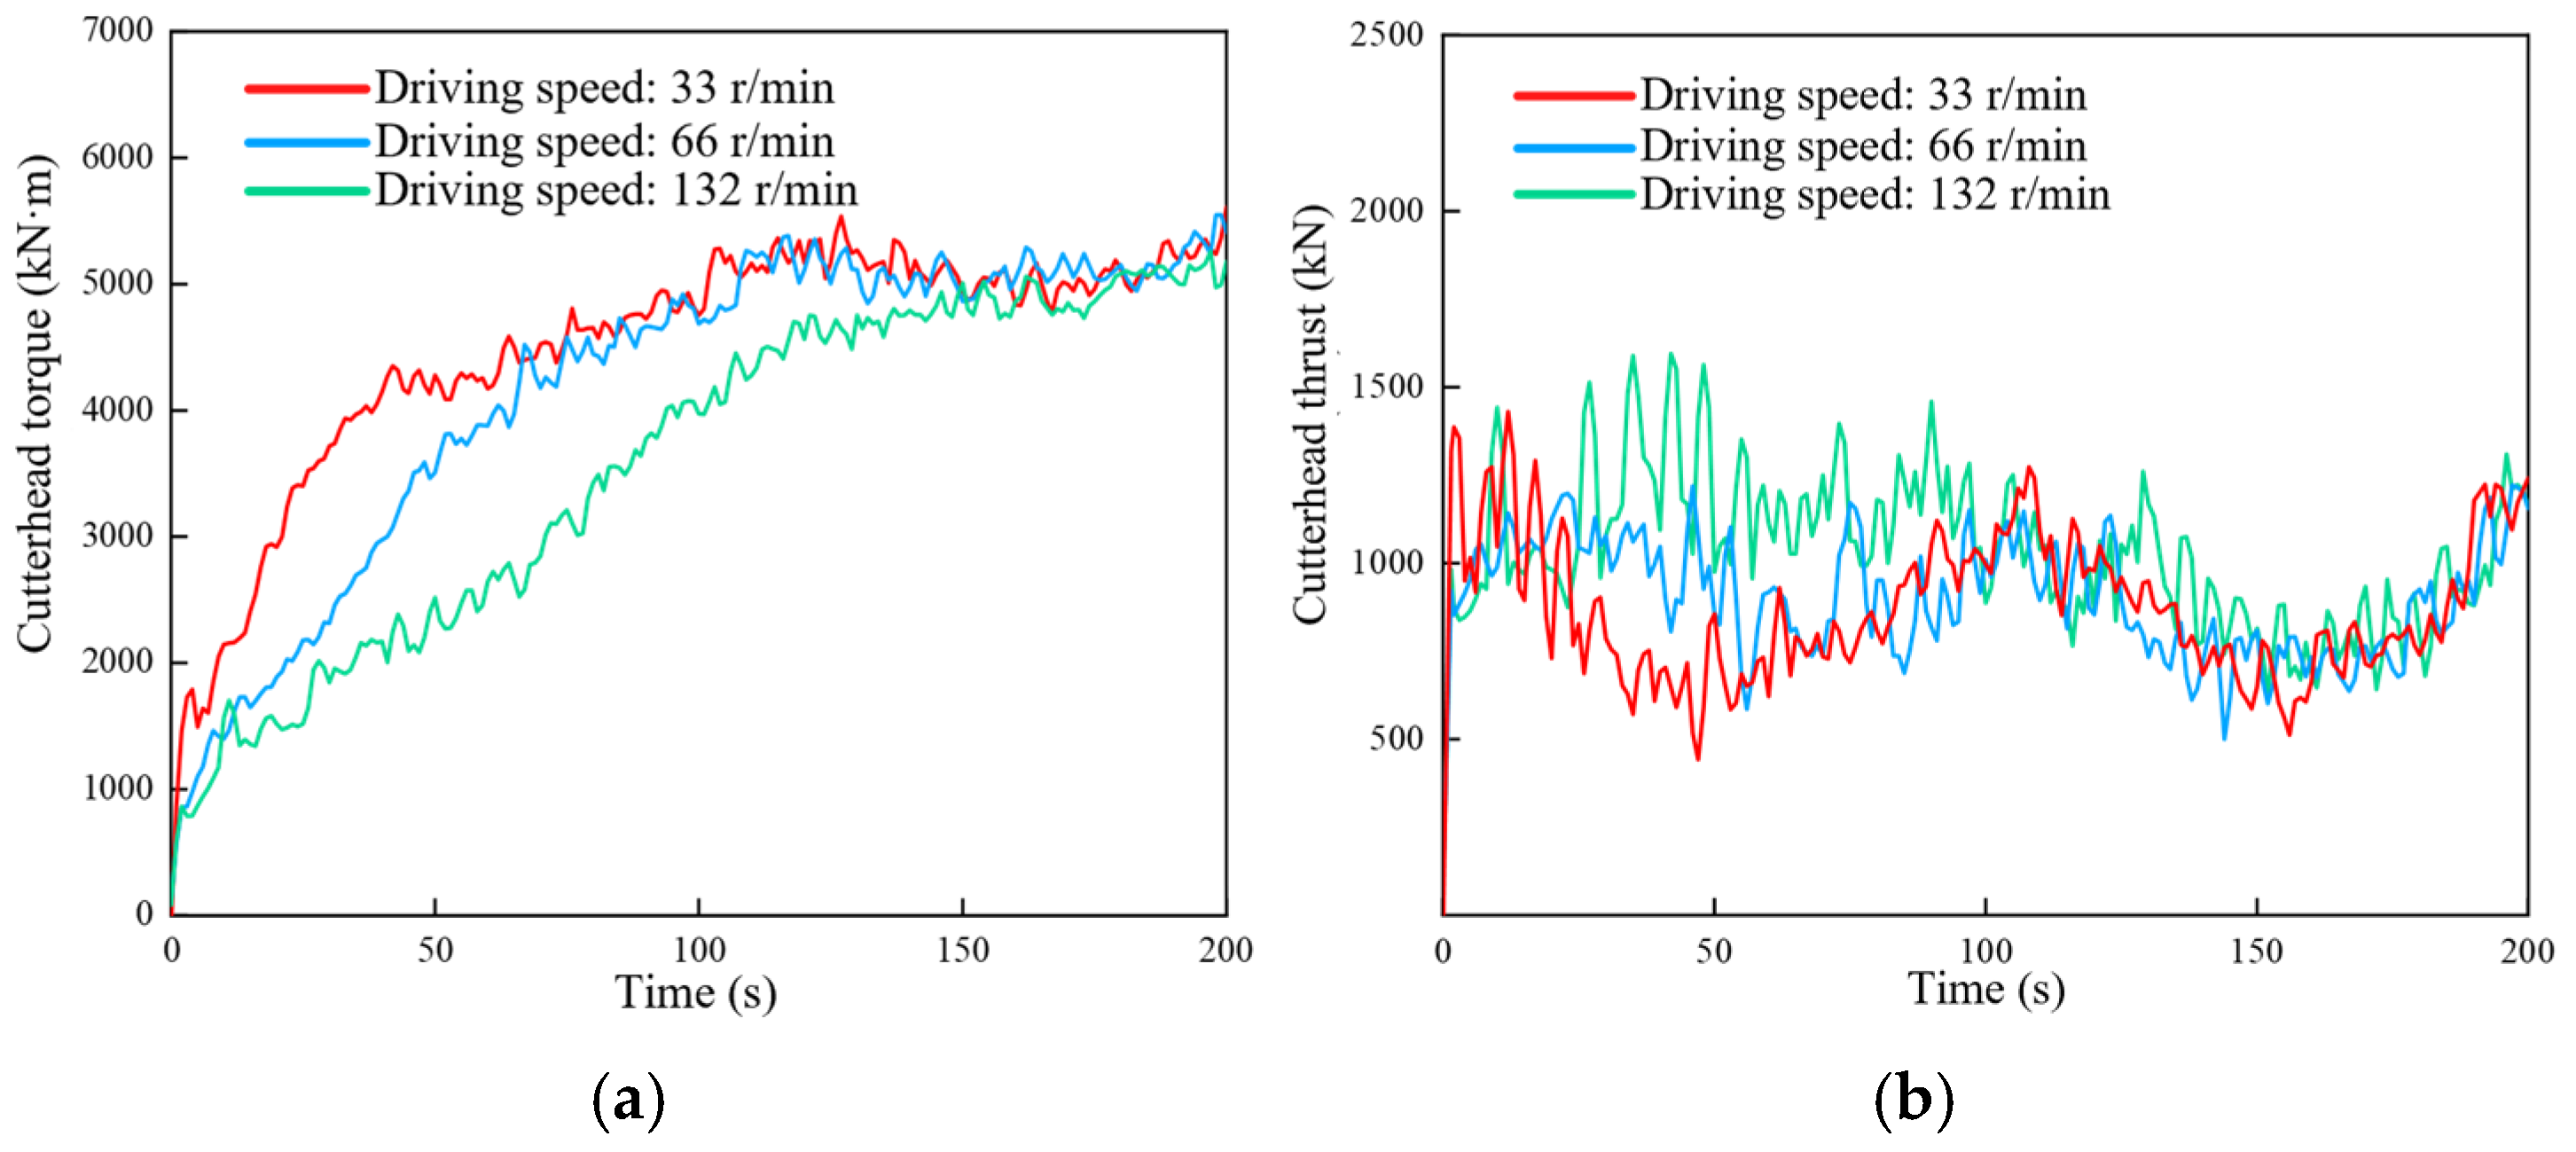
Figure 5 shows the torque and thrust of the screw conveyor at different cutter head speeds when the tunneling speed is 66 mm/min and the rotational speed is 10 r/min. Figure 5a shows that the cutterhead torque increases with the rotational speed, whereas Figure 5b shows that the cutterhead thrust decreases with the rotational speed of the cutterhead.
Figure 6 shows the torque and thrust of the cutter head at different tunneling speeds; the cutter head speed is 2 r/min and the screw conveyor speed is 10 r/min. It can be seen from Figure 6a that the faster the tunneling speed, the slower the increase in the torque of the cutter head. When the cutter head enters a stable tunneling process, the torque value stabilizes at about 5000 kN·m. The thrust and torque of the cutterhead fluctuate at the beginning of tunneling. During stable tunneling, the thrust at each tunneling speed is within the same range.
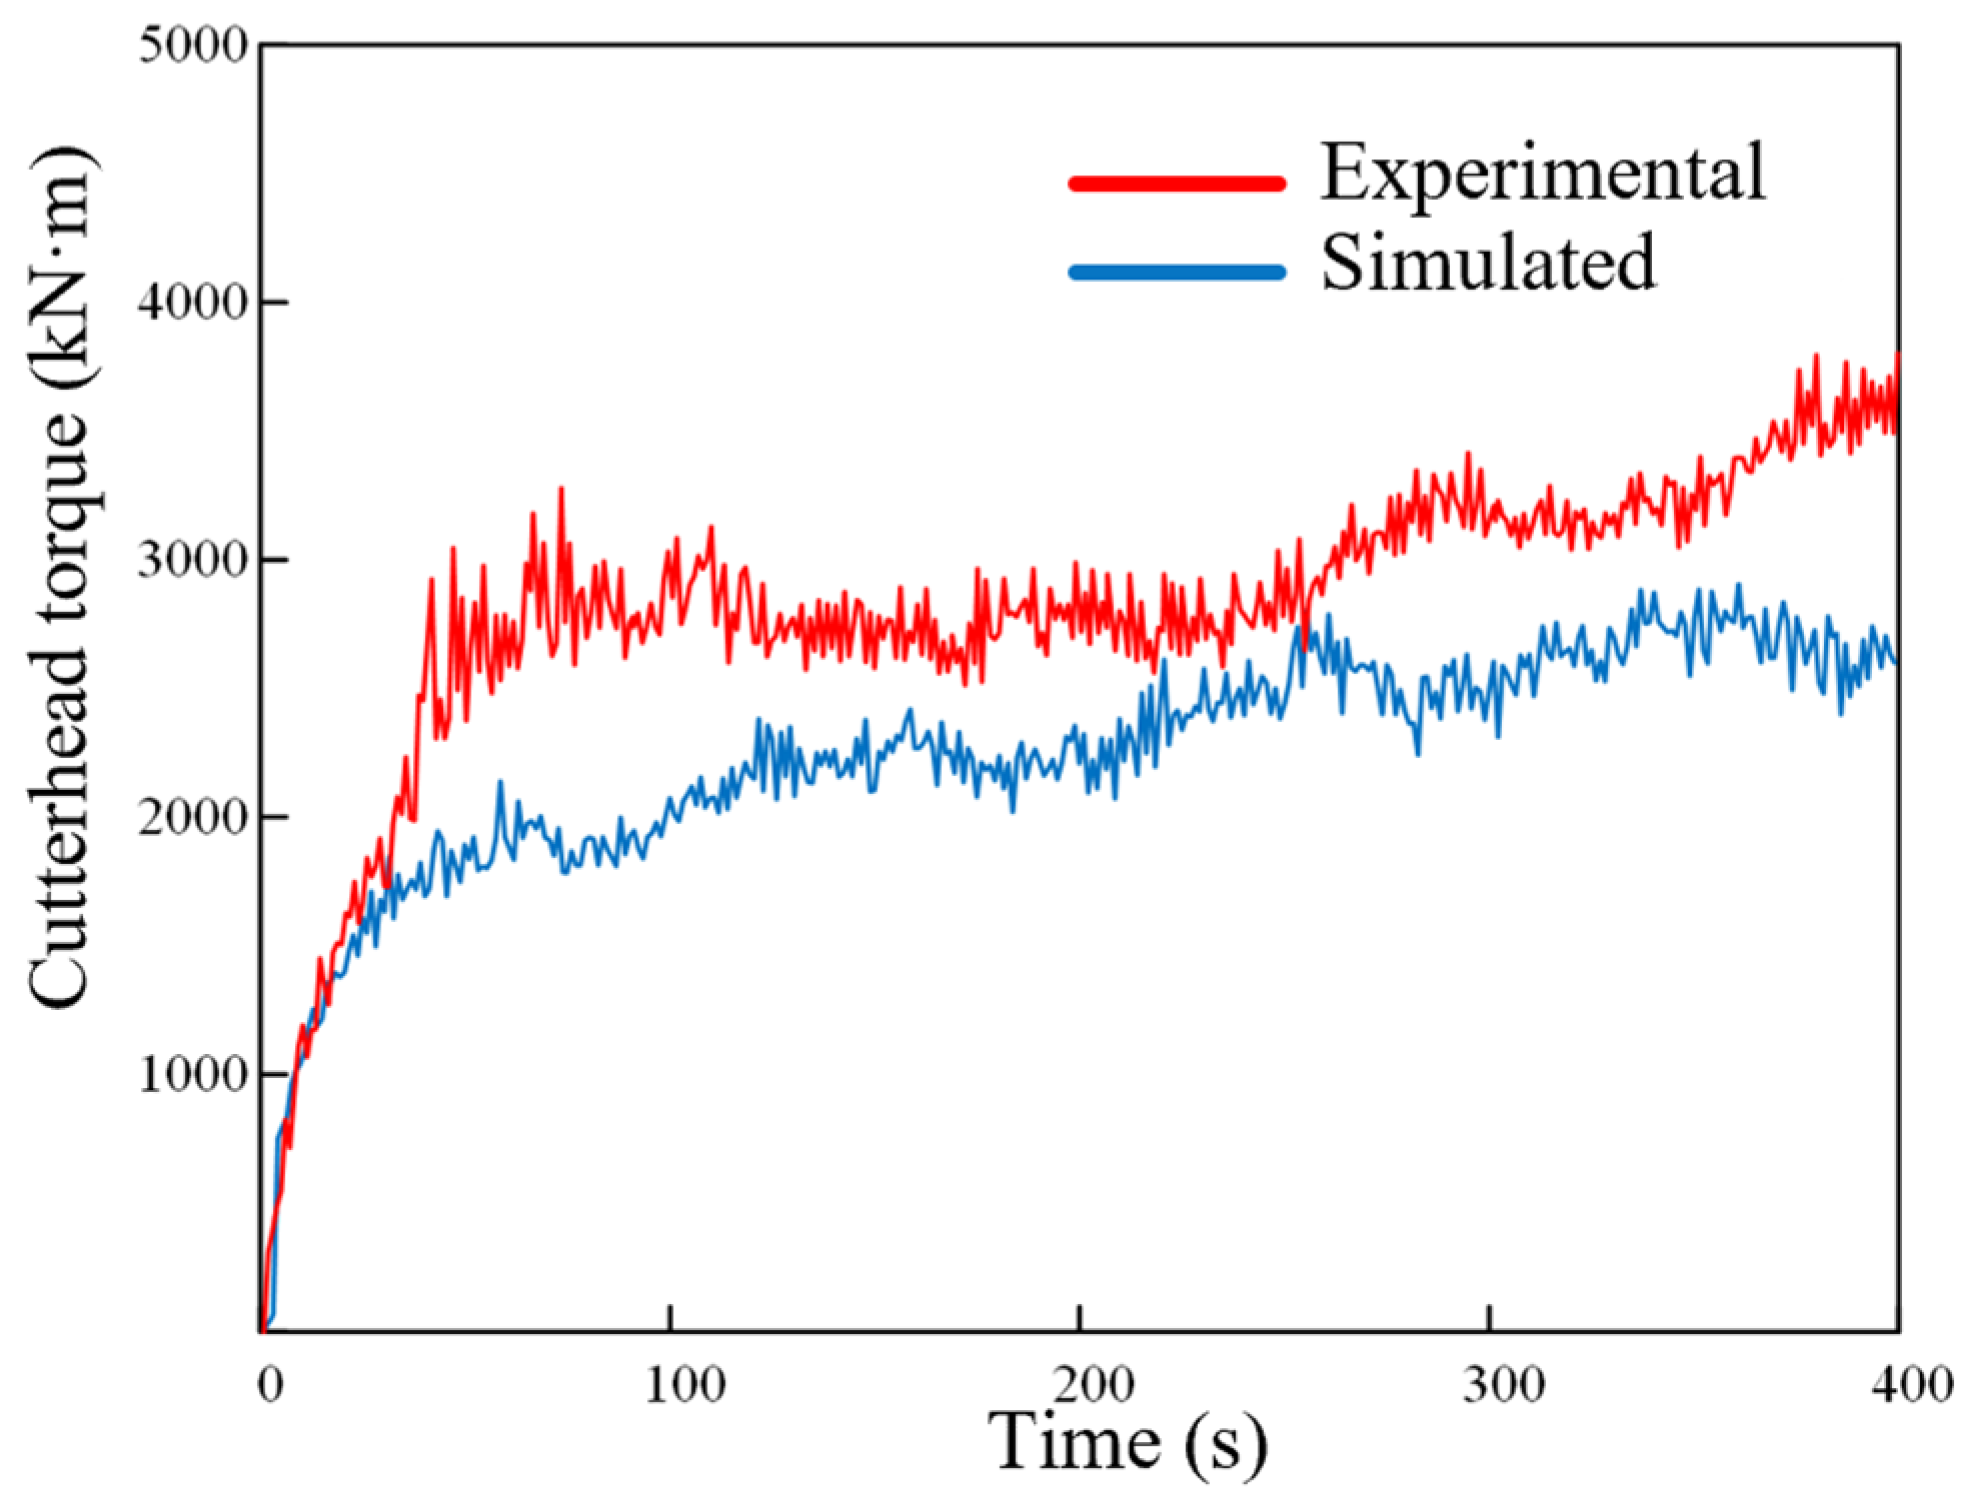
The actual cutterhead torque and the simulated cutterhead torque in one loop selected from this range are compared as shown in Figure 7. It was found that the actual torque and the simulated torque increase instantaneously when the cutterhead starts tunneling, but the cutterhead torque gradually approaches stability at around 200 s.

3. Experimental Process of the Cutterhead System

This experimental bench is composed of a proportional cutter head, a driving device, a loading device, a simulated soil box, a signal monitoring device, etc. The working steps of the tunneling experiment are as follows: First, the drive motor is started. The hydraulic pump transmits the hydraulic oil with power from the hydraulic oil tank to the hydraulic cylinder and motor. While the hydraulic cylinder pushes the motor base, the hydraulic motor also drives the rotating shaft of the cutter head to rotate. A formation simulation soil box is installed on the right side of the experimental bench to simulate sandy and pebble formation.
In order to monitor the signals and directly observe the operating status of the test bench, the dimensions of the test bench frame are set to be 2800 mm in length, 800 mm in height, and 1250 mm in width. The simulation test bench is shown in Figure 8.
The experimental bench is designed to simulate the function of the cutter head system of the earth pressure balance shield machine; both the diameter of the cutter head and the opening size have been reduced. During the experiment, particles with overly large diameters need to be processed to prevent damage to the cutter head in the same proportion. The equivalent substitution method, one of the methods for treating large-sized particles, is applied. The equal substitution method is used to replace the excess particle size part in the soil within the allowable range with 15 to 20 mm particles. The research results show that the coarse-grained part after substitution has some changes in the curvature coefficient and non-uniformity coefficient but still maintains the original particle content. For particles larger than the opening of the simulated cutter head, particles of the same volume are filled into the simulated soil box to ensure the integrity of the formation particle gradation. Figure 8 shows the partial screening particle diagram. In the screened soil used in the experiment, particles smaller than 10 mm were classified as sand soil particles, those ranging from 0 to 10 mm and 10 to 15 mm were classified as gravel sand particles, and those ranging from 15 to 20 mm were classified as pebble particles. After the soil filling is completed, the soil in the box is compacted and left to stand for 10 h before the start of each group of experiments.
Two earth pressure gauges are set inside the soil box to monitor the pressure changes inside the box in real time. The model of the earth pressure gauge used is TMT-Y2000. The soil pressure in the simulated earthen box is set at 10 kPa and the simulated formation depth is 15 m. The wireless torque sensor measures the strain at the end of the cutter head drive shaft by connecting strain gauges. The strain value is measured by vertically arranging 120-3AA strain gauges. Through the torque signal processing module in the dynamic signal acquisition system, parameters such as the diameter at the end of the shaft, elastic modulus, and Poisson’s ratio are set. This module can convert the strain measured by the sensor into a torque value. The rotational speed of the cutter head is measured by using the DH5640 photoelectric rotational speed sensor in conjunction with the DH5905 rotational speed module, and the rotational speed of the cutter head is monitored through the dynamic signal acquisition system. Reflective patches are pasted on the drive shaft of the cutter head, and the sensor is fixed on the simulated shield body for collection.
Sensors were used in tunneling experiments on five different types of formations to measure the torque, thrust, and rotational speed of the cutterhead. Two tunneling simulation experiments were conducted for each formation. A relatively stable set of data was selected and analyzed for 60 s. Figure 9a–e shows the torque and thrust of the cutter heads in formations 1, 2, 3, 4, and 5. It can be seen from Figure 9f that the torque of the cutterhead increases gradually with the tunneling time. As the cutting depth increases, the contact of the front surface of the cutterhead with the soil layer becomes more thorough, the resistance in front of the cutterhead becomes greater, and the thrust of the cutterhead also increases accordingly. The torque of the cutterhead and the thrust of the cutterhead have the same trend. It is clear that there is a strong correlation between the torque and the thrust of the cutterhead.
The torque of the cutterhead measured in the experiment was compared with that obtained from the discrete element simulation. Formation 1 and formation 2 in the formation category were selected, and the simulation data were proportionally reduced through a similar ratio. The comparison results are shown in Figure 10. Due to the stability of the operation on the experimental bench, there are slight differences in the values. It can be found that the torque variation trend of the cutter head is the same, which proves the validity of the discrete element simulation model.
It can be seen from the simulation experiment results of the cutterhead excavation that the variation trends of the cutterhead torque and thrust have a certain correlation. To understand the relationship among the operating parameters of the cutter head, the correlation analysis method was used to explore the correlation among the data collected in the tunneling simulation experiment. Among the tunneling parameters, such as the torque of the cutterhead, the thrust of the cutterhead, and the rotational speed of the cutterhead, do not meet the conditions of a normal distribution. Therefore, the Spearman correlation coefficient is adopted.
The Spearman correlation coefficient is applicable to measure the relationship between two sequential variables and is suitable for nonlinear or non-normal data types. Since this method is not sensitive to outliers, the magnitude of the difference between the actual values has little impact on the calculation results. It is expressed as follows:
ρ = 1 6 d i 2 n ( n 2 1 )
where ρ is the Spearman correlation coefficient, di is the rank difference between variables x and y after sorting, and n is the sample size.
A total of 1200 samples from the collected experimental data were selected, and correlation analysis was conducted. The results obtained are shown in Table 6. A correlation coefficient greater than 0.5 indicates a significant correlation. It can be seen from the table that there is a strong correlation between the torque of the cutterhead and the thrust of the cutterhead, the rotational speed of the cutterhead, and the propulsion speed.

4. GTNet Earth Pressure Balance Formation Identification Method

Due to impact factors of the construction environment, it is difficult for operators to adjust the operating parameters in a timely manner in response to changes in the formation while excavating. It is prone to causing faults in the cutterhead system. To address such issues, in this section, an automatic classification method based on the Transformer network [29], GTNet (gated Transformer network), is proposed and applied to identify and classify the formations excavated by the cutterhead of earth pressure balanced shield machines.

4.1. Data Encoder

In this section, when the sand and gravel formation is excavated with discontinuous distribution, the tunneling signals, such as the cutterhead torque and cutterhead thrust, will fluctuate in response to the changes in the formation. Combined with the measured cutterhead tunneling data, the type of formation for cutterhead tunneling is identified based on the changes in the tunneling data, and a network model for formation identification in earth pressure balance shield tunneling based on GTNet is established.
The data sequence is first passed through the input embedding layer to convert each data point mark into the corresponding vector representation, which is expressed as xemb = Embedding (x). Since there is no positional information when the sequence enters the Transformer model, positional encoding is required to add positional information to each position in the input sequence. The formula is as follows:
PE ( p o s , 2 i ) = sin p o s 10000 2 i / d model
PE ( p o s , 2 i + 1 ) = cos p o s 10000 2 i / d model
In the formula, pos is the position of the data point in the sequence, and i is the dimension of the position encoding. dmodel is the dimension of the model.
Equation (4) represents the position encoding at the given position pos and dimension 2i, and Equation (5) represents the position encoding at the given position pos and dimension 2i+1. Sine encoding is used in even positions and cosine encoding is used in odd positions.
On the left side of the Transformer structure diagram is the encoder module. N being 6 indicates the superposition of six encoders. The encoder module includes multi-head self-attention, residual connection and layer normalization, and fully connected feedforward neural networks. The basis of multi-head self-attention is the self-attention mechanism. The Transformer model processes the input sequence based on the self-attention mechanism. The correlations among different positions are established. Thereby, the dependencies among various parts of the sequence are captured. Compared with traditional machine learning methods, Transformer has more advantages in parallel processing and handles long-distance dependencies more effectively.
The self-attention mechanism is the core of the model. When the data is processed sequentially, the information at different positions is weighted to capture the dependencies. The query vectors, key vectors, and value vectors are introduced. The formula for calculating the attention scores of positions i and j is given as follows:
x m = Attention ( Q i , K j , V i ) = SoftMax Q i K j T d k V i , m c , s
where Qi is the position query vector i, Kj is the position key vector j, and dk is the key vector dimension, and the query, key, and value vectors are expressed as follows:
Q i = x i W Q ,   K j = x i W K ,   V i = x i W V
The role of SoftMax is to highlight the relationship between the two data, calculate the attention weights, and perform weighted summation on the value vectors at each position to obtain the attention score.
For the model’s attention layer and allowing the model to learn different information in different representation subspaces. The calculation formula of multi-head self-attention is as follows:
h e a d i = Attention ( Q i , K j , V i )
MultiHead ( Q , K , V ) = Concat ( h e a d 1 , h e a d 2 ,   , h e a d h ) W 0
where h is the number of heads, headi represents the output of the i-th head, Concat represents the concatenation of multi-heads, and W0 is the weight matrix.
From the correlation analysis of the parameter channels of the cutterhead excavation, it can be seen that parameters such as the cutterhead torque and the cutterhead thrust have a strong correlation. The data collected in the excavation simulation experiment belong to the multivariate time series. The model established in this paper refers to the multivariate time series classification method based on the Transformer proposed by Pinasthika [30]. Two encoder structures are established to process time series signals in parallel. The left side is the channel encoder, and the right side is the time step encoder. The attention mechanism of the encoder and the mask are utilized to capture the time steps and channel correlations. The original Transformer embedding layer is replaced with a fully connected layer, and the tanh function is introduced. The position encoding is combined with the time series of the tunneling signal of the nonlinearly transformed cutter head system to encode the data. The GTNet network structure diagram is shown in Figure 11.
To merge the features of the two encoders, a gating mechanism is set up to learn the output weights, the output information of the two encoders is transformed into C and S through a nonlinear fully connected layer, and C and S are concatenated and packaged into vectors. After passing through a linear projection layer, h is obtained, and then it is denoted as g1 and g2 using SoftMax weights. Each weight is combined with the encoder output, and the expression is as follows:
h = W Concat ( C , S ) + b
g 1 , g 2 = SoftMax ( h )
y = Concat ( C g 1 , S g 2 )

4.2. Model Training

At the beginning of the model training, channel embedding and position embedding (position encoding enabled) are first performed on the input data. Then, the data are, respectively, encoded for channel and time step positions through two encoders. During the encoding process, the attention distribution matrix at the time step or channel level is obtained by the network model. After the feature extraction and information interaction are carried out in the multi-head attention layer and the feedforward neural network layer, the data is flattened into a two-dimensional vector. The outputs of the two encoders are weighted and fused through the gating mechanism after the flattening operation. The data eventually enters the output layer to complete the recognition and classification. During the entire recognition process, the model parameters are updated through the gradient of the loss function to optimize the predictive performance of the model.
In order to verify the generalization performance of the model and study the influence of hyperparameters on model training, hyperparameter selection experiments need to be conducted before the model training begins. The hyperparameter settings include the training period epoch; batch size is the key factor determining the generalization ability of the model; the learning rate affects the learning speed of the model; model input and output dimensions d-model; model depth d-hidden; N represents the number of encoder modules created; h represents the number of attention heads; random inactivation rate dropout; and optimizer.
The hyperparameters of the applied GTNet model are first set with the epoch value initially set to 100. Different learning rates and batch sizes are set. The proportion of the training set and the test set in the total data set is set to 4:1. The accuracy is shown in Table 7. Excessive network layers and training cycles can lead to longer training time and overfitting problems. When the d-model and d-hidden are set to 512 and 1024, respectively, the accuracy of the model during training first increases and then decreases, and the training time is twice that when the d-model and d-hidden are set to 256 and 512, respectively. The batch size of 64 is chosen for the accuracy, which keeps higher under different learning rates than that of others. Finally, the optimal hyperparameter setting method in Table 8 was obtained by combining the model training time and accuracy rate.
In deep learning, precision, recall, and f1 value are common performance evaluation criteria used to measure the performance of classification models. Calculate the precision rate, recall rate, and f1 score of the above four network models. The precision calculation formula is Equation (10), the recall formula is Equation (11), and the f1 score formula is Equation (12).
The result is shown in Figure 12. The f1 scores are relatively close to their respective accuracy and recall rates, indicating that the performance of the model can strike a balance between accuracy and recall rates, and there is a good trade-off between correctly classifying positive instances and minimizing false positives and false negatives.
P r e c i s i o n = T P T P + F P
R e c a l l = T P T P + F N
F 1 = 2 T P 2 T P + F P + F N
where TP represents the number of samples that predict the positive class but are actually positive, FP represents the number of samples that predict the positive class but are actually negative, and FN represents the number of samples that predict the negative class but are actually positive.
Figure 13 shows the confusion matrix diagrams of the identification accuracy of excavation formation for four network models: LSTM, GRU, Transformer, and GTNet. In the confusion matrix, the true categories are columns, the model-predicted categories are rows, and the diagonal elements represent the correct classification accuracy of the network model on each formation category, while the non-diagonal elements represent the confusion of the network model among different formation categories. It can be seen from the confusion matrix diagrams of GRU and LSTM that the accuracy of formation identification is low, and identification errors occur in all five formation classifications. The confusion matrix of the Transformer shows that classification and recognition errors occur in the first three formations, and the overall accuracy rate is higher than that of the first two network models. GTNet made an error in identifying the cutterhead tunneling signal of formation 3, wrongly identifying F3 as F4. This is because the sand and gravel composition of formation 2 and formation 3 is similar. Through comparison, it can be seen that GTNet has the best effect in formation identification and classification.
Figure 14 shows the visualization scatter plots of four network models. Figure 14a is the t-SNE scatter plot of LSTM; the scatter clusters of each layer are mixed with each other, and the formation classification is not obvious. Figure 14b is the t-SNE scatter plot of GRU; the sample scatter distances of each layer are very close, the distances between clusters are very small, and there is doping among the scatter points. Figure 14c is the t-SNE scatter plot of the Transformer; it can be observed that the recognition and classification effect of the Transformer is better than that of the previous two network models. The scatter points are more concentrated, and the classification effect is obvious. However, there are still recognition errors in Layer two and Layer three, and the running time of the Transformer is twice that of GTNet. In Figure 14d, the GTNet scatter plot, it can be observed from the figure that the identification and classification effects of F1, F4, and F5 are excellent. There is a small amount of doping in the scatter distribution of F2 and F3, which is consistent with the results of the confusion matrix. The reason is that the similarity of formation composition is relatively high, and the sand content is 70% in both. By observing these four pictures, it can be seen that GTNet has the best recognition and classification effect, verifying the superiority of the GTNet network model.
To identify the effect of tunneling parameters on the formation identifying accuracy of GTNet, the ablation study is included in the research for analysis and the tunneling parameters are shown in Table 9. The recognition accuracy demonstrates that the cutterhead torque and thrust affect its accuracy significantly. The confusion matrix diagram in Figure 15 shows how the ablation parameter of cutterhead torque and thrust has a significant impact on the identification accuracy. The visualization scatter plots of the ablation study for the parameters in Table 9 provide evidence of recognition accuracy. It can be observed from Figure 16 that the ablation of rotational speed and tunneling speed has a small effect on formation recognition. The influence of tunneling parameters on recognition accuracy from largest to smallest is cutterhead thrust, cutterhead torque, rotational speed, and tunneling speed, respectively.

5. Conclusions

This paper aimed to identify the sandy and pebble formations excavated by the earth pressure balance shield machine. First, the numerical variation laws of cutterhead torque and thrust in single and a composite formations were analyzed and obtained using discrete element simulation of the cutterhead system’s excavation. Then, the construction of the tunneling simulation test bench and the tunneling experiment in sandy and pebble formations were carried out. The discrete element simulation model was validated using experimental data. Finally, an excavation formation identification model was developed, and a method for identifying excavation formations using the GTNet network model was proposed. The conclusions are as follows:
(1)
A discrete element earth pressure balance shield machine cutterhead system excavation model was established. Excavation simulations were conducted in single and composite formations. The thrust and torque of the cutterhead are directly proportional to the content of gravel and pebbles in sandy and pebble formations, and the content of pebbles has the greatest impact on the excavation parameters. The torque of the cutter head increases with an increase in the cutterhead rotational speed, and the thrust of the cutter head decreases with an increase in the cutterhead rotational speed but is not greatly affected by them. At the beginning of tunneling, the torque of the cutterhead decreases as the tunneling speed increases and remains in a certain range during stable tunneling. The thrust of the cutterhead increases as the tunneling speed accelerates.
(2)
Five types of sand and pebble formations were set up to conduct excavation simulation experiments, respectively. The data analysis of the torque and thrust of the cutterhead shows that the values of both increase with an increase in the content of gravel and pebbles in the formation. It can be seen that the torque and thrust of the cutterhead have a strong correlation. The discrete element model was verified by using experimental data, which is consistent with the experiment.
(3)
A recognition and classification model for excavated sand and gravel formations was established based on the GTNet network. After preprocessing the data, network training was conducted to find the optimal hyperparameters, and the accuracy rate was found to reach 99.3%. GTNet was compared with the classic Transformer, GRU, and LSTM network models, and GTNet had the highest accuracy rate. The precision rate, recall rate, and f1 value show that the GTNet network model has the best performance. The ablation study shows that cutterhead torque and thrust give the most formation features for recognition. The proposed GTNet network model meets the recognition requirements of the earth pressure balance shield machine in the excavation of sandy and pebble formations.

Author Contributions

P.Z. oversaw the project as the team leader, provided strategic guidance on research direction, and supervised the progress of the study. Q.W. built the whole structure and wrote the manuscript. Z.W. (Ziwen Wang) conducted in-depth analysis with data investigation and optimized the methodology. J.X. contributed to data processing, indicator calculations, and visualization. Z.W. (Zi Wang) proposed the research framework and technical roadmap. All authors have read and agreed to the published version of the manuscript.

Funding

This research was funded by National Natural Science foundation of China, grant number 62173238; Education Department Program of Liaoning Provincial, Grant number LJ222410153061, and LJ212410153041; Science and Technology Plan Project of Liaoning Province, grant number 2024-BSLH-248; Shenyang bureau of science and technology, Grant number No. 24-213-3-03.

Institutional Review Board Statement

Not applicable.

Informed Consent Statement

Not applicable.

Data Availability Statement

The data are available from the corresponding authors on reasonable request.

Conflicts of Interest

The authors declare no conflicts of interest.

References

  1. Fu, K.; Qiu, D.H.; Xue, Y.G.; Tao, Y.F.; Kong, F.M. Research on optimization strategy of TBM tunneling parameters based on stratum perception and simulation tunneling experiment. Tunn. Undergr. Space Technol. 2024, 147, 105743. [Google Scholar] [CrossRef]
  2. Sissins, S.; Paraskevopoulou, C. Assessing TBM performance in heterogeneous rock masses. Bull. Eng. Geol. Environ. 2021, 80, 6177–6203. [Google Scholar] [CrossRef]
  3. Wu, W.; Guo, J.; Li, J.; Sun, J.; Qi, H.R.; Chen, X.M. Research on Stratum Identification Method Based on TBM Tunneling Characteristic Parameters. Complexity 2022, 2022, 8540985. [Google Scholar] [CrossRef]
  4. Li, X.J.; Zhao, S.C.; Shen, Y.; Xue, Y.D.; Li, T.; Zhu, H.H. Big data-driven TBM tunnel intelligent construction system with automated-compliance-checking (ACC) optimization. Expert Syst. Appl. 2024, 244, 122972. [Google Scholar] [CrossRef]
  5. Wang, X.; Zhu, H.H.; Zhu, M.Q.; Zhang, L.Y.; Ju, J.W. An integrated parameter prediction framework for intelligent TBM excavation in hard rock. Tunn. Undergr. Space Technol. 2021, 118, 104196. [Google Scholar] [CrossRef]
  6. Wu, W.Q.; Gong, G.F.; Chen, Y.X.; Zhou, X.H. Performance Analysis of Electro-Hydraulic Thrust System of TBM Based on Fuzzy PID Controller. Energies 2022, 15, 959. [Google Scholar] [CrossRef]
  7. Liu, Y.B.; Liao, S.M.; Liu, M.B. Investigation on the structural behaviors of segmental tunnel with a new generalized-beam-theory-based model incorporating cross-sectional distortions. Comput. Geotech. 2024, 167, 106062. [Google Scholar] [CrossRef]
  8. Liu, C.; Cui, J.; Zhang, Z.X.; Liu, H.; Huang, X.; Zhang, C.Q. The role of TBM asymmetric tail-grouting on surface settlement in coarse-grained soils of urban area: Field tests and FEA modelling. Tunn. Undergr. Space Technol. 2021, 111, 103857. [Google Scholar] [CrossRef]
  9. Wang, J.; Lin, G.J.; Tang, R.; Zhang, Y.; Yao, Z.G.; Feng, K.; Tian, N.; Chen, Z.Q.; He, C. A particle-scale insight into the face stability of shallow EPB shield tunnels in dry cobble-rich soil. Tunn. Undergr. Space Technol. 2024, 144, 105516. [Google Scholar] [CrossRef]
  10. Vergara, I.M.; Saroglou, C. Prediction of TBM performance in mixed-face ground conditions. Tunn. Undergr. Space Technol. 2017, 69, 116–124. [Google Scholar] [CrossRef]
  11. Hu, X.Y.; He, C.; Fang, Y.; Wu, S.Z.; Li, K.J. Laboratory experiments and discrete element modeling on the surface failure induced by EPB tunneling: The effects of cutterhead open ratio and relative tunneling depth. Eng. Fail. Anal. 2022, 142, 106731. [Google Scholar] [CrossRef]
  12. Hu, X.Y.; Cheng, J.G.; Ju, J.W. Influence of the cutterhead configuration and operation parameters on the face stability of EPB shield tunnels in dry granular soils. Int. J. Geomech. 2021, 21, 04021050. [Google Scholar] [CrossRef]
  13. Xia, Y.M.; Xiao, H.W.; Chen, P.; Yang, M.Q.; Xiao, X.M.; Zhou, Z.X. Analysis of flow field characteristics and factors influencing the excavation chamber in large-diameter slurry shield. Tunn. Undergr. Space Technol. 2024, 152, 105966. [Google Scholar] [CrossRef]
  14. Jin, D.A.; Gong, Z.B.; Cheng, P.P.; Xiang, L.J.; Yuan, D.J. Experimental investigation of shield tunnel face stability under dynamic cutterhead in sandy soil. Tunn. Undergr. Space Technol. 2025, 161, 106549. [Google Scholar] [CrossRef]
  15. Di, Q.G.; Li, P.F.; Zhang, M.J.; Cui, X.P. Experimental study on stress distribution characteristics of a shield tunnel under passive failure. Eng. Fail. Anal. 2023, 154, 107725. [Google Scholar] [CrossRef]
  16. Kong, X.X.; Tang, L.; Ling, X.Z.; Li, H. Development of shield model test system for studying the bias load of shield in soil-rock compound strata. Tunn. Undergr. Space Technol. 2024, 143, 105464. [Google Scholar] [CrossRef]
  17. Li, L.P.; Sun, S.Q.; Wang, J.; Song, S.G.; Fang, Z.D.; Zhang, M.G. Development of compound EPB shield model test system for studying the water inrushes in karst regions. Tunn. Undergr. Space Technol. 2020, 101, 103404. [Google Scholar] [CrossRef]
  18. Yang, H.Q.; Song, K.L.; Zhou, J.Y. Automated recognition model of geomechanical information based on operational data of tunneling boring Machines. Rock Mech. Rock Eng. 2022, 55, 1499–1516. [Google Scholar] [CrossRef]
  19. Yan, T. Method for geological characteristics prediction during shield tunnelling: SCA-GS. MethodsX 2022, 9, 101883. [Google Scholar] [CrossRef] [PubMed]
  20. Kilic, K.; Ikeda, H.; Adachi, T.; Kawamura, Y. Soft ground tunnel lithology classification using clustering-guided light gradient boosting machine. J. Rock Mech. Geotech. Eng. 2023, 15, 2857–2867. [Google Scholar] [CrossRef]
  21. Qin, C.J.; Huang, G.Q.; Yu, H.G.; Wu, R.H.; Tao, J.F.; Liu, C.L. Geological information prediction for shield machine using an enhanced multi-head self-attention convolution neural network with two-stage feature extraction. Geosci. Front. 2023, 14, 101519. [Google Scholar] [CrossRef]
  22. Liu, X.Y.; Zhang, W.S.; Shao, C.; Wang, Y.D.; Cong, Q.M. Autonomous intelligent control of earth pressure balance shield machine based on deep reinforcement learning. Eng. Appl. Artif. Intell. 2023, 125, 106702. [Google Scholar] [CrossRef]
  23. Yu, H.G.; Tao, J.F.; Qin, C.J.; Sun, H.; Liu, C.L. A Novel A-CNN Method for TBM Utilization Factor Estimation. J. Phys. Conf. Ser. 2021, 2002, 012049. [Google Scholar] [CrossRef]
  24. Soroush, M.; William, N.; Michael, M. White-box regression (elastic net) modeling of earth pressure balance shield machine advance rate. Autom. Constr. 2020, 115, 103208. [Google Scholar] [CrossRef]
  25. Glab, K.; Wehrmeyer, G.; Thewes, M.; Broere, W. Predictive machine learning in earth pressure balanced tunnelling for main drive torque estimation of tunnel boring machines. Tunn. Undergr. Space Technol. 2024, 146, 105642. [Google Scholar] [CrossRef]
  26. Bel, J.; Branque, D.; Camus, T. Physical modelling of EPB TBM in dry sand and greenfield conditions. Eur. J. Environ. Civ. Eng. 2022, 27, 3236–3259. [Google Scholar] [CrossRef]
  27. Koki, N.; Motoki, S.; Shinya, I. Assessment of plasticity of muddy soil for earth pressure balance shield tunneling. Tunn. Undergr. Space Technol. 2024, 153, 106044. [Google Scholar] [CrossRef]
  28. Tao, Y. Data on prediction of geological characteristics during shield tunnelling in mixed soil and rock ground. Data Brief 2022, 45, 108726. [Google Scholar] [CrossRef] [PubMed]
  29. Bilgin, M.; Mert, A. Gated transformer network based EEG emotion recognition. Signal Image Video Process. 2024, 18, 6903–6910. [Google Scholar] [CrossRef]
  30. Pinasthika, K.; Laksono, B.S.P.; Irsal, R.B.P.; Shabiyya, S.H.; Yudistira, N. SparseSwin: Swin transformer with sparse transformer block. Neurocomputing 2024, 580, 127433. [Google Scholar] [CrossRef]
Figure 1. Simulated and experimental determination of the stacking angle.
Applsci 15 07983 g001
Figure 2. The particles enter the soil bunker and the tunneling face of the cutterhead.
Applsci 15 07983 g002
Figure 3. The torque and thrust of cutterhead: (a) cutterhead torque under a single formation; (b) cutterhead thrust under a single formation; (c) cutterhead torque under a compound formation; (d) cutterhead thrust under a compound formation.
Applsci 15 07983 g003aApplsci 15 07983 g003b
Figure 4. Torque and thrust of the cutterhead with a soil cover ratio of 2. (a) Cutterhead torque; (b) cutterhead thrust.
Applsci 15 07983 g004
Figure 5. Tunneling speed of 66 mm/min, screw conveyor speed of 10 r/min, and torque and thrust at different cutterhead rotational speeds. (a) Cutterhead torque; (b) cutterhead thrust.
Applsci 15 07983 g005
Figure 6. Cutterhead rotational speed of 2 r/min, screw conveyor rotational speed of 10 r/min, and torque and thrust of the cutterhead at different tunneling speeds. (a) Cutterhead torque; (b) cutterhead thrust.
Applsci 15 07983 g006
Figure 7. Comparison of the actual tool head torque and the simulated tool head torque in a certain ring.
Applsci 15 07983 g007
Figure 8. The experimental platform for the tunneling process.
Applsci 15 07983 g008
Figure 9. Torque and thrust of the cutterhead in five tunneling formations. (a) Formation 1; (b) formation 2; (c) formation 3; (d) formation 4; and (e) formation 5. (f) The average value of five formations.
Applsci 15 07983 g009
Figure 10. Torque and thrust differences between the experiment and simulation. (a) Cutterhead torque; (b) cutterhead thrust.
Applsci 15 07983 g010
Figure 11. GTNet structure diagram.
Applsci 15 07983 g011
Figure 12. Comparison of the results of precision, recall, and f1 scores of four network models in different formations: (a) precision rate, (b) recall rate, (c) f1 score.
Applsci 15 07983 g012aApplsci 15 07983 g012b
Figure 13. Confusion matrix diagrams of the identification accuracy of excavation formation for four network models: (a) LSTM, (b) GRU, (c) Transformer, and (d) GTNet.
Applsci 15 07983 g013
Figure 14. Visualization scatter plots of four network models: (a) LSTM, (b) GRU, (c) Transformer, and (d) GTNet.
Applsci 15 07983 g014
Figure 15. Confusion matrix diagrams of the identification accuracy of GTNet for the ablation study. (a) Without cutterhead torque; (b) without cutterhead thrust; (c) without rotational speed; (d) without tunneling speed.
Applsci 15 07983 g015
Figure 16. Visualization scatter plots of GTNet with the ablation study. (a) Without cutterhead torque; (b) without cutterhead thrust; (c) without rotational speed; (d) without tunneling speed.
Applsci 15 07983 g016aApplsci 15 07983 g016b
Table 1. Particle stacking angle.
Particle TypeAverage Value of Stacking Angle
Sand32.6°
Pebble 35.2°
Gravel 34.5°
Table 2. Intrinsic parameters of three types of particles.
Particle TypeDensity (kg/m3)Poisson’s RatioShear Elasticity (Pa)
Sand18600.334.8 × 106
Pebble 24000.254 × 107
Gravel 22000.264.2 × 107
Table 3. Basic contact parameters of particle materials.
Particle TypeStacking AngleRecover CoefficientStatic Friction CoefficientRolling Friction Coefficient
Sand32.6°0.330.20.1
Pebbles 35.2°0.315.030.02
Gravel 34.5°0.330.240.15
Table 4. Scheme settings of simulated formations.
Simulated Formation TypeProportion of Sand/%Proportion of Gravel/%Proportion of Pebble/%
Formation 1 (F1)100
Formation 2 (F2)7030
Formation 3 (F3)7030
Formation 4 (F4)602020
Formation 5 (F5)503010
Table 5. Tunneling parameter settings.
OrderCutterhead Speed (r/min)Tunneling Speed (mm/min)Simulation Time (s)
1166200
2266200
3466200
4666200
5866200
61066200
71132100
82132100
94132100
106132100
118132100
1210132100
13133400
14233400
15433400
16633400
17833400
181033400
Table 6. Correlation analysis.
CoefficientCutterhead ThrustCutterhead TorqueTunneling SpeedCutterhead Speed
Cutterhead thrust10.5940.4570.521
Cutterhead torque0.59410.5500.507
Tunneling speed0.4570.55010.166
Cutterhead speed0.5210.5070.1661
Table 7. Accuracy of GTNet under different parameters.
Learning RateBatch Size of 8Batch Size of 16Batch Size of 32Batch Size of 64
0.00030.9860.9780.9620.981
0.000020.9790.9740.9540.984
0.00020.9820.9810.9710.987
0.000010.9820.9890.9640.983
0.00010.9820.9860.9620.993
Table 8. Optimal hyperparameters of the GTNet model.
HyperparametersValue
epoch100
batch size64
learning rate0.0001
d-model256
d-hidden512
N4
h4
dropout0.01
OptimizerAdam
Table 9. The parameter setting scheme of the ablation study.
Ablation ParameterRecognition Accuracy for the Formations (F1–F5)
Cutterhead torque0.796
Cutterhead thrust0.85
Rotational speed0.95
Tunneling speed0.954
Disclaimer/Publisher’s Note: The statements, opinions and data contained in all publications are solely those of the individual author(s) and contributor(s) and not of MDPI and/or the editor(s). MDPI and/or the editor(s) disclaim responsibility for any injury to people or property resulting from any ideas, methods, instructions or products referred to in the content.

