Abstract
This study employs Particle Image Velocimetry (PIV) technology to investigate the statistical properties and flow structures of the turbulent boundary layer over smooth walls and riblet walls with yaw angles of 0, ±30° in both clear water and liquid–solid two-phase flow fields. The results indicate that, compared to the smooth wall, streamwise riblet walls and 30° divergent riblet walls can reduce the boundary layer thickness, wall friction force, comprehensive turbulence intensity, and Reynolds stress, with the divergent riblet wall being more effective. In contrast, convergent riblet walls have the opposite effect. The addition of particles leads to an increase in boundary layer thickness and a reduction in wall friction resistance, primarily by reducing turbulence fluctuations and Reynolds stress in the logarithmic region of the turbulent boundary layer. Moreover, the two types of drag-reduction riblet walls can decrease the energy content ratio of near-wall streak structures and suppress their motion in the spanwise direction. Their impact on burst events is mainly characterized by a reduction in the number of ejection events and their contribution to Reynolds shear stress. In comparison, convergent riblet walls have the complete opposite effect and also enhance the intensity of burst events. The addition of particles can fragment streak structures and suppress the intensity and number of burst events, acting similarly on drag-reduction riblet walls and further strengthening their drag reduction characteristics.
1. Introduction
Since the inception of research on drag reduction in turbulent boundary layers, it has been recognized that the primary source of drag arises from high Reynolds shear stress near the wall [1]. These elevated shear stresses are closely associated with the dynamics of coherent structures in turbulence. Consequently, a central objective in turbulent drag reduction research has been the control and manipulation of these structures. Beginning in the 1960s, substantial efforts were devoted to understanding the nature of wall-bounded turbulence. Robinson and others [2] synthesized early findings and classified coherent structures into several key types, including ejections, sweeps, low-speed streaks, vortex structures, strong shear layers, near-wall pocket structures, backflow structures, and large-scale motions in the outer layer. Among these, the self-sustaining cycle between streamwise vortices and low-speed streaks has been identified as a fundamental mechanism responsible for sustaining turbulence and generating drag. Therefore, strategies aimed at disrupting or weakening the formation and evolution of such structures offer promising potential for effectively reducing wall-bounded turbulence and minimizing energy loss.
Low-speed streaks in wall-bounded turbulence were first observed by Hama and Nutant [3], and later by Ferrell et al. [4], who identified them as narrow, elongated regions of low-momentum fluid extending in the streamwise direction. These coherent structures are predominantly located in the near-wall region, arranged with regular spacing in the spanwise direction, and often accompanied by shorter quasi-streamwise vortices that appear at higher wall-normal positions [5,6]. Lee et al. [7] proposed that the formation and merging of near-wall low-speed streaks are key contributors to the development of large-scale motions in the outer layer. Xu et al. [8] further demonstrated a strong spatial correlation between streamwise vortices at the base of the boundary layer and the streaks, forming a periodic, self-sustaining cycle maintained by intense shear in the near-wall region [9,10,11,12]. In this cycle, streamwise vortices induce the ejection of low-speed fluid away from the wall on one side and the sweep of high-speed fluid downward on the other, generating burst events that are the primary sources of high Reynolds shear stress near the wall [13,14]. These dynamics lead to the formation of alternating high- and low-speed streaks. During their lifting, oscillation, and eventual breakdown, the symmetric nature of the disturbances within the streaks promotes the generation of new streamwise vortices [15,16,17]. Schoppa and Hussain [6] identified this as the transient growth mechanism of streaks after systematically analyzing the processes that lead to the formation of streamwise vortices [18,19,20]. As a result, streamwise vortices consistently form in proximity to streaks, with multiple vortices often aligned along each streak. The low-speed streaks themselves are typically situated between pairs of counter-rotating vortices. This self-sustaining mechanism elegantly describes the regeneration of coherent structures in the near-wall region and underscores the tight coupling between streamwise vortices and streak dynamics.
The investigation of ejection and sweep events dates back to the 1960s, when Kline et al. [21] first detailed the dynamic evolution of near-wall low-speed streaks. They described how these structures undergo distortion and oscillation, leading to the formation of spanwise vortices and, ultimately, their breakdown—a process now recognized as a burst event. As research progressed, the upward transport of low-speed fluid away from the wall and the downward sweep of high-speed fluid toward the wall were, respectively, identified as ejections and sweeps. These phenomena are now collectively referred to as burst events. Burst events are fundamental to the self-sustaining cycle of wall turbulence, mediating the interaction between low-speed streaks and streamwise vortices. Studies have shown that nearly all of the Reynolds shear stress in the near-wall region is produced during these bursts [8,22], highlighting their central role in the generation and transport of turbulence.
Modifying surface structures to influence the development of turbulent flow has become a key passive strategy for controlling turbulent boundary layers. Common surface configurations include riblets, superhydrophobic coatings, and discrete roughness elements. Among these, riblet surfaces have received sustained attention in fluid mechanics due to their ease of fabrication, cost-effectiveness, and notable drag-reduction performance. Early research primarily focused on streamwise riblet arrangements, with subsequent studies optimizing riblet shape and size to maximize drag reduction [23]. Serrated riblets, in particular, have demonstrated favorable overall performances, achieving drag reduction rates of up to 10% by tuning geometric parameters [23,24,25,26]. With advances in biomimetic design, researchers have drawn inspiration from biological surfaces—such as shark skin sensory organs and the feathers of flying birds [27,28]—to explore novel riblet arrangements. This has led to investigations of convergent and divergent riblet configurations and their impact on turbulent boundary layers. In contrast to streamwise riblets, which primarily affect the near-wall region, convergent–divergent riblets influence the entire boundary layer [29,30]. Xu et al. [31,32,33] showed that the convergent and divergent regions exhibit distinct flow responses due to differences in local secondary flows. In the divergent region, a downward motion replenishes the high mass flux along the riblets. Simultaneously, transverse flow near the riblet tips induces spiral motion within the riblet grooves, which interacts with the crossflow boundary layer and plays a key role in suppressing transverse secondary flows. However, Wang et al. [34] reported that although such riblet structures can effectively reduce skin friction, they may increase the form drag in the divergent region—a result of spanwise modulation caused by large-scale secondary motions. Overall, most studies agree that the dominant control mechanism of convergent-–divergent riblets lies in their ability to generate secondary flows that modulate turbulence in the spanwise direction, leading to differentiated turbulent states across the boundary layer.
In recent years, the control of boundary layers using convergent and divergent riblet surfaces has attracted significant attention due to the secondary flows induced by these geometries, which play a critical role in the evolution of turbulent structures. Yuan et al. [35] investigated the control effects of convergent and divergent riblet walls on liquid–solid two-phase turbulent boundary layers using particle image velocimetry. They found that these riblets suppress the development of near-wall coherent structures such as hairpin vortices and reduce Reynolds shear stress, with particle addition further enhancing this suppression. However, their study did not address the dynamics of ejection and sweep events—critical components in the self-sustaining turbulence mechanism. To better approximate realistic flow conditions and expand upon previous findings, the present study introduces convergent and divergent riblet surfaces into liquid–solid two-phase turbulent boundary layers. In such environments, suspended particles introduce additional complexity. Prior research has demonstrated that particle-induced modulation of turbulence is closely related to a critical particle size—often associated with the Kolmogorov scale—below which particles can effectively attenuate turbulence intensity [36]. This interaction is particularly relevant in two-phase flow regimes and must be accounted for when analyzing near-wall turbulence structures. To this end, proper orthogonal decomposition (POD) and two-point correlation functions are employed to examine modifications to near-wall streaks under different wall configurations. Furthermore, an improved quadrant splitting method is utilized to investigate the topology of burst events and the distribution of Reynolds shear stress. By jointly examining these coherent structures, this study aims to elucidate the influence of convergent and divergent riblet surfaces on the self-sustaining turbulence cycle and to provide physical insights into drag modification mechanisms in turbulent liquid–solid two-phase boundary layers.
2. Experimental Setup
The experiment was carried out in a medium-sized, low-speed circulating water channel at the Fluid Mechanics Laboratory of Hebei University of Technology. The channel, constructed with polymethyl methacrylate (PMMA) side walls and bottom, consists of a straightening section, a contraction section, a test section, a power section, and a return section. Flow uniformity is ensured by a honeycomb and a damping net in the straightening section, while the contraction section minimizes flow separation. The test section measures 600 mm in height, 500 mm in width, and 2500 mm in length. A PMMA flat plate (2200 mm × 500 mm × 15 mm) with an 8:1 elliptical leading edge is mounted inside, and a 5 mm diameter trip wire positioned 100 mm downstream from the leading edge promotes a fully developed turbulent boundary layer. A 300 mm × 300 mm recess located 1400 mm from the plate’s leading edge allows for interchangeable test surfaces with different wall morphologies. Water flow is driven by an axial-flow pump powered by a three-phase AC motor, with speed controlled via a frequency converter. A schematic of the experimental setup is shown in Figure 1.
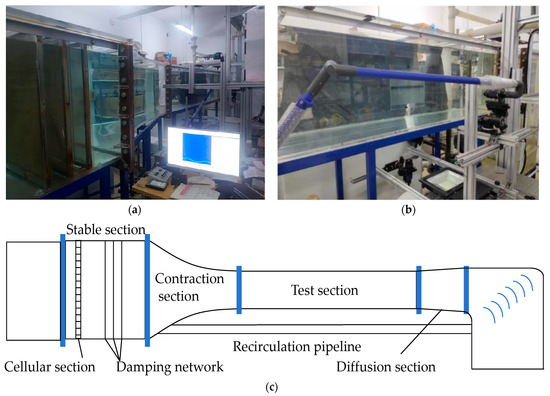
Figure 1.
Schematic diagram of experimental apparatus: (a) medium-sized low-speed circulating water tank physical diagram; (b) physical image of the experimental smooth plate; (c) medium-sized low-speed circulating water tank physical schematic diagram.
The riblet walls are arranged in a convergent and divergent pattern, with a sawtooth shape. The actual width a of the riblet walls is 240 mm, the top angle α of the ribs is 60°, the spacing s between the ridges is set to 1.2 mm, and the depth ℎ of the ribs is 1.039 mm. The riblet plates were fabricated from acrylic sheets using CNC machining to ensure precision. To investigate the effect of different yaw angles on the riblet turbulent boundary layer, the yaw angle β was set to 0°, ±30°. Figure 2 is a schematic diagram of the riblet wall plate.

Figure 2.
Schematic diagram of riblet plate: (a) the size of riblets; (b) top view of 30° divergent riblets.
To ensure the existence of a single variable and to maintain the dimensionless size of the riblets within the optimal drag reduction range [23], adjustments were made to the motor during the experiment to achieve an incoming free stream velocity of U∞ = 0.21 m/s. The experimental environment was kept at 20 °C, with the density of the experimental water being 996.7 kg/m3 and the kinematic viscosity of water equaling 1.006 mm2/s. The experimental setup and layout are shown in Figure 3. In the experiment, the flat plate was placed vertically, and by adjusting the trailing edge plate, the static pressure gradient along the flow direction on the plate surface was adjusted to be close to zero. Photographs were taken of the x-y and x-z planes under each wall surface. The working surface was 260 mm away from the side wall of the test section, and after measurement, the influence of the water channel side wall boundary layer on the flow in the measurement plane could be neglected. The x-y shooting plane is located at the center of the symmetrical plane in the model, that is, directly above the convergence and divergence junction of the convergent and divergent riblet wall surfaces. The x-z shooting plane is parallel to the smooth flat plate. The x/y/z directions in the figure represent the streamwise direction, normal direction, and spanwise direction, respectively, with the corresponding velocities represented by u, v, and w. For the x-y shooting plane, the origin of the smooth flat plate’s streamwise coordinate is located 150 mm from the front edge of the recess, and the normal coordinate is at the smooth wall surface. The streamwise coordinate position of the riblet wall surface origin remains unchanged, and the normal coordinate is the coordinate after the zero point is offset. According to the calculation [23], the protrusion height of the riblet hp = 0.17 s, which means the zero point’s coordinate is 0.204 mm below the tip of the riblet. For the x-z plane, the origin’s streamwise coordinate is also located 150 mm from the front edge of the recess, and the spanwise coordinate is located at the midpoint in the spanwise direction of the model.
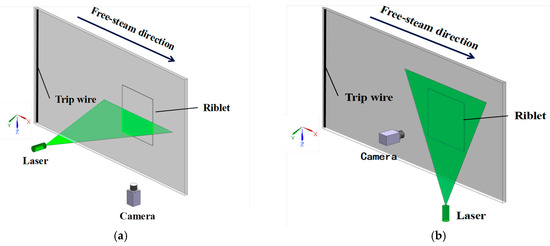
Figure 3.
Schematic diagram of the experimental facility: (a) x-y plane; (b) x-z plane.
The experiment is divided into two steps: First, under clear water conditions, the flow field information on the surfaces of the smooth and riblet walls is recorded, respectively, to determine the parameters of the clear water flow field and verify the drag reduction effect of the riblet walls. Then, keeping other conditions unchanged, solid particles are dispersed to measure the two-phase flow field over the smooth and riblet walls, studying the role of the riblets in two-phase flow. The experiment uses polystyrene particles with a diameter Dp = 15 μm as tracer particles in the liquid phase, and solid phase particles with a diameter Dp = 155 μm are selected to explore the impact of particles smaller than the Kolmogorov scale on the riblet wall turbulent boundary layer. The density of the polystyrene particles is ρp = 1050 kg/m3. Solid particles are pre-prepared into a mixture with a liquid–solid mass ratio of 1000:1 (water: solid particles), and are dispersed into the water channel from 1200 mm upstream of the flat plate, 300 mm below the water surface. The experiment is conducted after the flow stabilizes. According to calculations, the Strouhal number of all solid particles in this experiment is less than 0.4, allowing them to perfectly suspend in the flow field [37], and inter-particle interactions can be neglected [38].
The experimental data was collected using the PIV system from LaVision company in Göttingen, Germany. It mainly consists of a laser illumination system, an image acquisition system, and an image processing system. The image acquisition method is dual-frame dual-exposure, where the laser and camera are connected through a synchronizer to ensure the synchronicity of sampling. The image acquisition frequency is 90 Hz, and the time interval between two frames is set to meet the required displacement of 5–8 pixels for measurement. The observation area for a single camera is 100 mm × 100 mm, with an interrogation window of 32 × 32 pixels, and an overlap rate of 50%. For each condition, 8000 samples are collected to provide a sufficient number of samples for related calculations to ensure convergence. The captured images are processed using Gaussian filtering and median filtering to obtain images that contain only solid particles. Then, by subtracting the solid particle images from the original images, the required liquid phase flow field images are obtained. Finally, after processing with a cross-correlation algorithm, the uncertainty of the velocity vectors is ultimately detected to be less than 0.1 pixel, corresponding to an uncertainty of less than 1%.
3. Results and Discussion
3.1. Statistical Characteristics
Research indicates that the downward or upward shift in the mean velocity profile in the logarithmic region corresponds to an increase or decrease in drag [39]. For the smooth flat plate model, the friction velocity can be obtained using the Clauser method [40], and the logarithmic law expression for the mean velocity of a smooth wall is given by Equation (1):
where , is the wall friction velocity, is the Karman constant, B is the logarithmic region velocity intercept. The logarithmic law is fitted using the Newton–Raphson method and the steepest descent method to obtain the average wall friction velocity of the turbulent boundary layer [41]. However, for riblet walls, because their theoretical zero point is below the rib crest plane, it causes a shift in the intercept B of the logarithmic region of the velocity profile [42,43], rendering the traditional Clauser method ineffective. Therefore, a modified Clauser method is employed [44], and the logarithmic law region of the riblet wall boundary layer satisfies Equation (2):
where F is the intercept offset caused by the riblets. Taking F as a given discrete point varying from −10 to 10 with an interval of 0.1, the error Err generated by fitting the wall friction velocity for each F value was calculated [45], defining Equation (3):
where and represent the dimensionless normal coordinates and streamwise average velocity of the experimental values, respectively. NS and NE are the starting and ending points for the logarithmic region experimental data values, respectively. Based on the minimum experimental deviation, the corresponding F value and wall friction velocity can be obtained.
Figure 4 shows the dimensionless velocity profiles of the wall under different conditions. It can be observed from the figure that, in both flow fields, the velocity profiles of the streamwise riblet and divergent riblet walls tend to shift upwards, with a slight decrease in boundary layer thickness, while the convergent riblet wall exhibits a significant downward shift, resulting in an increased boundary layer thickness. This indicates that the first two types of walls possess certain drag reduction characteristics, with the divergent riblet wall being more effective, while the convergent riblet wall leads to an increase in wall resistance. The addition of particles causes the velocity profiles of all three types of walls to shift upwards, but the increased boundary layer thickness can result in a section of the wake region having lower velocities than in the clear water flow field. However, the overall drag reduction characteristics are still satisfied. The specific flow parameters are shown in Table 1.
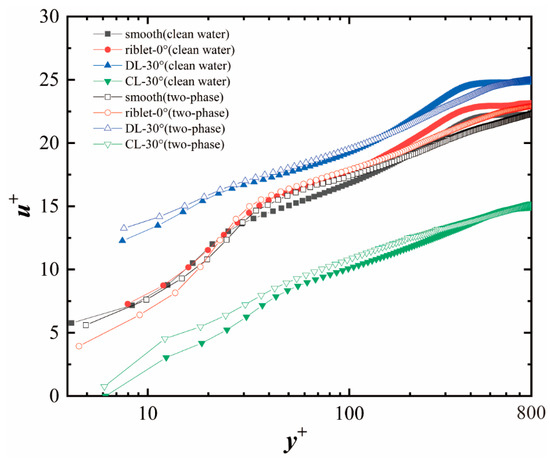
Figure 4.
Mean streamwise velocity profile.

Table 1.
Flow parameters over the smooth and riblets surfaces in clean water.
Table 1 presents the flow parameters for each wall surface in both flow fields, with the inner scale Reynolds number defined as Reτ = uτδ/ν, where δ is the nominal boundary layer thickness. Combined with the wall friction shear stress τw = and the average free stream velocity U∞, the wall friction coefficient can be obtained as Cf = 2τw/ρ, and the drag reduction rate is given by DR = (Cfs − CfR)/Cfs × 100%, where Cfs and CfR are the friction coefficients for the smooth and riblet walls, respectively. The data in the table clearly reflect the changes in the velocity profiles of each wall surface shown in Figure 4, where a positive F value indicates an upward shift in the velocity profile and a reduction in drag, and vice versa. The 30° divergent riblet wall achieved a drag reduction rate of 21.70% in the clear water flow field, a figure very close to previous research results [28,38]. In the two-phase flow field, the drag reduction rate for this wall surface reached 26.18%, indicating that the addition of particles has a certain degree of enhancement on the drag reduction effect.
Figure 5 presents the distribution curves of dimensionless comprehensive turbulence intensity and Reynolds shear stress along the wall-normal height in the turbulent boundary layer under different conditions. It can be observed that the streamwise riblet and 30° divergent riblet walls both reduce the comprehensive turbulence intensity within the turbulent boundary layer. The intensity of the streamwise riblet is very close to that of the smooth wall, primarily reducing the turbulence intensity in the logarithmic law region but enhancing it in the buffer layer region. In contrast, the 30° divergent/convergent riblet walls reduce/enhance the overall turbulence intensity of the boundary layer. According to the research by Cui et al. [46], this is because the upwelling motion of the fluid in the boundary layer of the convergent riblet wall brings the fluid with larger near-wall turbulence fluctuations away from the wall, resulting in a higher turbulence intensity within the boundary layer at the same height for the convergent riblet wall. Conversely, the downward motion on the divergent riblet surface plays exactly the opposite role. The streamwise riblet surface lacks the presence of secondary flows, leading to a weaker suppression of turbulence fluctuations, resulting in slightly different changes in turbulence intensity in the buffer layer and logarithmic law region. In Figure 5b, the distribution curve of Reynolds shear stress is similar to that of the comprehensive turbulence intensity. Among the configurations, the 30° convergent riblet surface exhibits significantly higher Reynolds shear stress compared to both the smooth wall and the 30° divergent riblet surface. All of these changes are consistent with the characteristics of drag-reduction surfaces. From both figures, it can be observed that the addition of particles leads to a decrease in the comprehensive turbulence intensity and Reynolds shear stress in the logarithmic law region, while the intensity in the buffer layer and wake region is enhanced. This is because, for the buffer layer closer to the wall, the transpiration motion caused by particle–wall collisions and the vortices generated by the particles themselves lead to an enhancement of Reynolds shear stress and turbulence intensity [47]. The increase in boundary layer thickness leads to a slower decrease in the intensity of the wake region, resulting in some regions having higher intensity than in the clear water flow field.
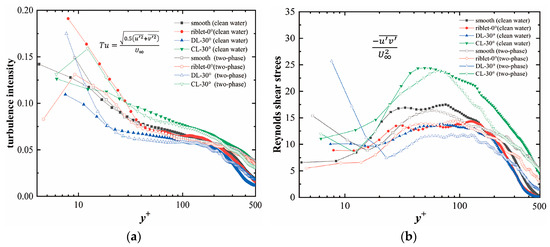
Figure 5.
(a) Distribution of the integrated turbulence intensity; (b) distribution of the Reynolds shear stress.
3.2. Extraction and Analysis of Streak Structures
In turbulent boundary layers, streak structures are generally clearly present in the region where y+ < 30, and vortex structures mainly exist in the form of quasi-streamwise vortices in the near-wall region where y+ < 60. In the region where 40 < y+ < 100, they will elevate to become hairpin vortices [8]. Therefore, self-sustaining mechanisms typically occur in the region where y+ < 60. In early visualizations of wall-parallel flow, the contribution of streamwise vortices and streak structures to the spanwise spectrum of the streamwise fluctuating velocity is equal [48]. Therefore, the study of streak structures is also one of the key points in exploring turbulent structures within the boundary layer. In order to observe the difference in streak structures in different near-wall areas, a plane with clear streak structures (y+ = 8.8) was selected for shooting.
To better observe the streak structures in the turbulent boundary layers of different wall surfaces, the Proper Orthogonal Decomposition (POD) method was utilized to extract the highest energy-containing low-order modes for each condition and compare them. The Proper Orthogonal Decomposition, introduced by Lumley [49], is a mathematical technique that can extract coherent structures from flow fields. The principle involves decomposing the original data into multiple spatial modes (called eigenmodes) and the corresponding time evolution coefficients (sequences) for each mode, which are mutually orthogonal. The order of the modes is sorted according to the energy they capture, from high to low, with the energy being given by the eigenvalues corresponding to the eigenmodes. The expansion in these eigenmodes optimally captures the energy of the data. Modal decomposition techniques provide a powerful means of identifying an effective low-dimensional coordinate system for capturing the dominant flow mechanisms, with the reduction in system order corresponding to the selection of an appropriate (reduced basis) coordinate system to represent fluid flow [50].
Consider the velocity field as a superposition of POD modes:
Here, N, j(t) and φj(x) represent the total number of snapshot modes, the time coefficient of the j-th mode, and the modal characteristic value, respectively. This section uses the POD method to perform modal decomposition on 4000 instantaneous flow fields for each wall, and analyzes the first five modes under two flow fields for the four walls.
Figure 6 shows the energy distribution of POD modes under two flow fields. The lower the order, the higher the energy content ratio. The first-order mode with the highest energy content ratio is the main flow structure. In the clean water flow field, there is a significant difference in the first-order modes between different walls. Starting from the second order, the energy content ratio gradually approaches each other, and by the fifth order, the energy content ratios of the four walls are very close. Therefore, the riblet walls mainly affect the first-order mode with the highest energy content ratio. Among them, the 30° convergent riblet wall increases the energy content ratio of the first-order mode, while the streamwise riblet and the 30° convergent riblet walls successively decrease it. This reflects that the drag-reduction riblet walls can effectively suppress the development of large-scale structures, and the decrease in the energy content ratio means that its influence on the flow field is weakened. In the two-phase flow field, the energy content ratios of the first three modes for the four walls are all significantly reduced, and the differences between them become smaller. The presence of particles intensifies the fragmentation of large-scale structures, leading to a decrease in the energy content ratio of the main structure in the entire flow field, which in turn reduces the difference in the riblet walls’ influence.
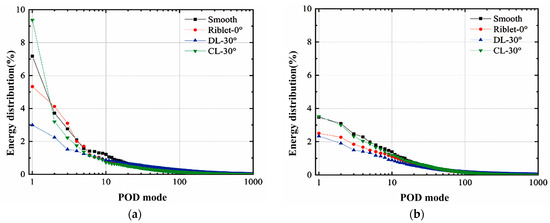
Figure 6.
Energy distribution of POD modes: (a) clean water flow field; (b) two-phase flow field.
Figure 7 shows the cloud images of low-order modes in the clean water flow field. The lower the order, the higher the energy content ratio. In the first-order mode diagrams of the four types of walls, it is clear that there are high and low speed streak structures that are alternately distributed along the spanwise direction near the wall. Their streamwise length scales basically cover the entire field of view, indicating that the high and low speed streaks are the dominant structures at this normal height. As the order increases, the scale of the streak structures gradually decreases, and more small-scale structures appear. Among them, in the fifth-order modes of the flow fields of the streamwise riblet and 30° divergent riblet walls, the structural scale is significantly reduced, and their streamwise scale no longer covers the entire field of view and is more narrow in the spanwise direction, especially for the 30° divergent riblet wall, which shows a trend of reduction from the third-order mode. In contrast, in the fifth-order modes of the smooth wall and 30° convergent riblet wall, the streamwise scale has not yet decreased significantly. Compared with the others, the streak structures in the 30° convergent riblet wall are clearer and appear more in the form of high-speed streaks. The above situation indicates that the drag-reduction riblet walls can lead to a certain degree of reduction in the spatial scale of the streak structures in the streamwise and normal directions.
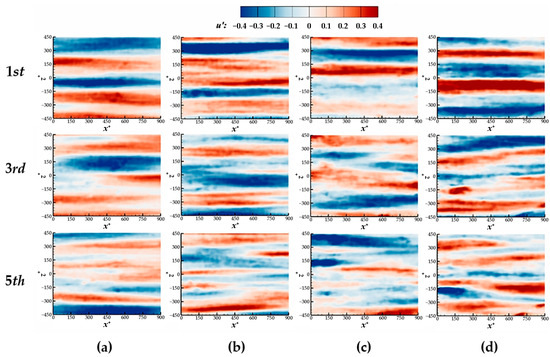
Figure 7.
POD mode cloud image of different wall streamwise fluctuation velocity at y+ = 8.8 in clear water flow field for the first five orders: (a) smooth flat wall; (b) streamwise riblet wall; (c) 30° divergent riblet wall; (d) 30° convergent riblet wall.
Figure 8 presents the low-order modal cloud images of streamwise fluctuating velocity for the four types of walls under the liquid–solid two-phase flow field. Compared to the clean water flow field, after the addition of particles, the spacing of the streak structures near the wall region for all four types of walls has increased significantly. Under the same dimensionless spanwise spacing, the number of high and low speed streaks has decreased. The turbulent structure scale of the streamwise riblets and 30° divergent riblets begins to decrease noticeably in the third-order mode, and the structure no longer exhibits a clear streak-like pattern in the fifth-order mode. The streamwise scale of the fifth-order mode structure for the smooth wall has also decreased, indicating that the energy content ratio of the streak structures has decreased, and the energy content ratio of small-scale structures has increased. From the conclusions drawn earlier, it can be seen that this is due to the particles breaking up the large-scale structures into smaller-scale structures. Due to the integrity of the self-sustaining mechanism, the streak structures are more broken by particles, which will inevitably affect their transformation into streamwise vortices. Whether the transformation process from streamwise vortices to streak structures is affected still requires further research.
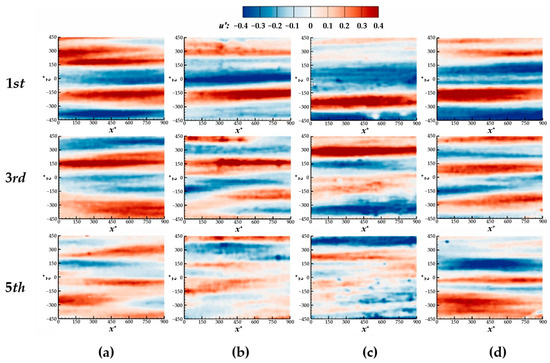
Figure 8.
The first five orders POD mode cloud image of different wall streamwise fluctuation velocity at y+ = 8.8 in two-phase flow field: (a) smooth flat wall; (b) streamwise riblet wall; (c) 30° divergent riblet wall; (d) 30° convergent riblet wall.
The motion of high- and low-speed streaks in the spanwise direction accelerates the mixing of high- and low-speed fluids, making the flow in the near-wall region more chaotic. The spanwise spacing between streaks can reflect the spanwise motion of the streaks well; the narrower the spanwise spacing, the more intense the spanwise mixing of high- and low-speed fluids, and the stronger the momentum transfer. Therefore, to better describe the performance of near-wall streak structures in the flow field, a correlation function is used to calculate their spanwise length scale. The spatial two-point correlation coefficient of streamwise fluctuating velocity has been widely proven in previous studies to indicate the existence of streak structures and to determine the size of the streak spacing [51,52,53], and its expression is:
Here, σA and σB represent the standard deviations of u′(t) at spatial points A and B, respectively, Δx is the streamwise separation between the two points, and Δz is the spanwise separation between the two points.
To reduce the interference of small-scale structures in the flow field, low-order modes containing 50% of the energy were selected to reconstruct the flow field, followed by the calculation of the correlation function of the flow field. Figure 9 shows the two-point correlation coefficient graph of the streamwise fluctuating velocity; in this graph, the characteristic spanwise scale can be defined as the gap between two negative valleys, that is, the distance between the two lines in the figure. It can be seen from the graph that the two-point correlation coefficient can fully display the structural morphology of the flow field, which is distributed in a strip-like pattern and stretched along the streamwise direction. By comparing the results longitudinally, it can be observed that the two-point correlation coefficients for different walls in the two flow fields all show the same trend of change. From the smooth flat to the 30° divergent riblet walls, the distribution of the correlation coefficient Ru′u′ continuously expands in the spanwise direction and is also elongated in the streamwise direction, representing an increase in the range of low-speed fluids. This trend is consistent with the previously mentioned trend in the streak spacing increasing with the wall-normal height y+, indicating that the motion of the streaks in the spanwise direction is suppressed. In contrast, the distribution graph of the 30° convergent riblet shows a completely opposite change, indicating that it promotes the motion of the streaks and enhances the spanwise mixing of turbulent structures in the near-wall region. By comparing the left and right sides of Figure 9, it can be seen that the addition of particles can effectively suppress the motion of the streak structures and enhance the stability of the flow field. The degree of mixing of high- and low-speed fluids is reduced, which means fewer vortex structures appear and the transfer of momentum and kinetic energy is decreased.
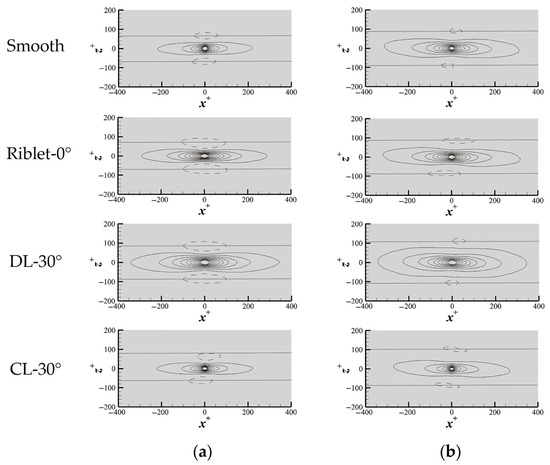
Figure 9.
Two-point correlation coefficient of streamwise fluctuation velocity in space Ru′u′ (x0, z0): (a) clean water flow field; (b) two-phase flow field.
To more intuitively compare the spanwise spacing of streaks under each type of wall, further processing of the correlation function of streamwise fluctuating velocity in space is carried out. By performing an autocorrelation operation on u′ only in the spanwise direction, the distribution of Ru′u′ along Δz+ can be obtained, and its expression is:
According to turbulence statistical theory, the position corresponding to the first peak in the correlation function when Δz+ = 0 can be regarded as the spanwise average spacing of the streak structures. Figure 10 presents the autocorrelation function curves of the streamwise fluctuating velocity along the spanwise direction for the four types of walls under two flow fields, and the spanwise spacing of the streak structures for each type of wall is obtained and marked in the figure. In the clean water flow field, the dimensionless spanwise spacings for the 30° convergent riblet, smooth flat plate, streamwise riblet, and 30° divergent riblet are 62.01, 66.31, 70.45, and 87.97, respectively. In the liquid–solid two-phase flow field, the spacings are 83.84, 86.04, 90.02, and 103.73, respectively. These data match the previous analysis made on the streak structures well, indicating that both drag-reduction riblet walls and the particulate phase effectively suppress the motion of the streak structures in the spanwise direction near the wall.
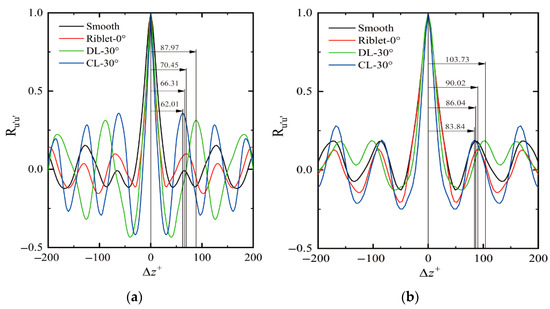
Figure 10.
Autocorrelation coefficient of streamwise fluctuation velocity in the z-direction: (a) clean water flow field; (b) two-phase flow field.
3.3. Extraction and Analysis of Burst Events
The early studies on burst events were conducted by Kline and colleagues at Stanford University in the United States [21], who used flow visualization techniques to study the streak structures in the near-wall region of turbulence. They found that low-speed streak structures underwent a process of rising, oscillating, breaking, and ejecting in some of the early investigations into burst events. With the rapid development of computational capabilities, detection methods for near-wall burst events have also been continuously improved. Wallace and Willmarth et al. [54,55,56] divided the motion of fluid particles into four quadrants to better extract these structures: Q1 events: u′ > 0, v′ > 0; Q2 events: u′ < 0, v′ > 0; Q3 events: u′ < 0, v′ < 0; Q4 events: u′ > 0, v′ < 0, where Q2 events correspond to ejection and Q4 events correspond to sweep. The introduction of this method effectively addressed the issues of burst event detection methods at the time, and subsequent methods have been based on this concept. This paper employs the new quadrant division method proposed by Jiang Nan et al. [57] to extract ejection and sweep structures. The detection function is:
Here, D(x0, l) is the detection function at x0 for the turbulence scale l, δux(x0, l)− and δux(x0, l)+ are the left and right neighborhoods located at x0. This formula represents the motion state of the fluid when ejection and sweep events occur.
After detecting ejection and sweep events with the aforementioned function, spatial phase averaging technology is utilized to process the regions where burst events occur, thereby obtaining the topological structure of ejection and sweep events. The topological structure can intuitively indicate the intensity of events occurring within the region. The calculation formula is:
Here, x0(k) and y0(k) represent the center positions where the k-th ejection or sweep event is detected, where lx and ly correspond to the streamwise and wall-normal scales of the topological structure, respectively. N and M represent the number of times ejections and sweeps are detected.
Due to the close relationship between burst events and Reynolds shear stress and the near-wall self-sustaining mechanism, to extract a clearer topological structure for comparison, this section synthesizes the Reynolds stress distribution curves under various conditions and selects the extraction plane as being near the extreme value of comprehensive Reynolds stress at y+ = 90 and the region where the self-sustaining mechanism as occurring at y+ = 30.5. First, Figure 11 shows normal fluctuating velocity cloud maps of ejection and sweep events under the four types of walls at a height of y+ = 90. The first two groups of images clearly show ejection events where low-speed fluid moves away from the wall, while the latter two groups depict sweep behavior where high-speed fluid rushes towards the wall. In Figure 11a,c, it can be observed that compared to the smooth wall, the drag-reduction riblet walls do not significantly suppress the burst events, while the 30° convergent riblet walls show a significant increase in the intensity of burst events. This implies that the drag-increasing riblet walls significantly enhance the intensity and region of burst events in the clean water flow field, thus enhancing the momentum exchange within the boundary layer. Further observation of Figure 11b,d reveals that the addition of particles plays a very significant role; the burst behavior of all four types of walls is suppressed. However, it is slightly different from the clean water flow field, under the two-phase flow field, the suppression of burst events by the drag-reduction riblet walls is significantly enhanced. Therefore, the addition of particles strengthens the inhibitory effect of the drag-reduction riblet walls. The suppression of burst events is beneficial to the reduction in momentum exchange, thereby having a favorable impact on drag reduction.
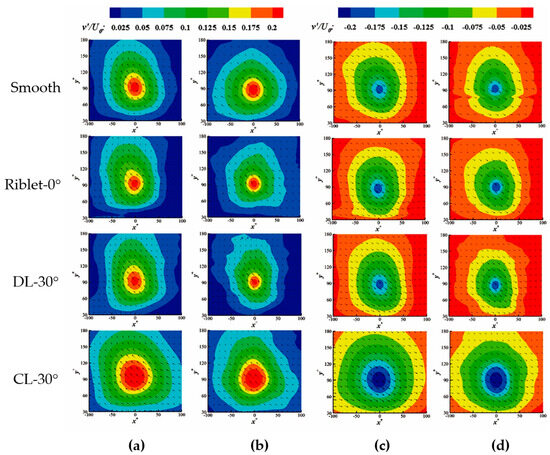
Figure 11.
Normal fluctuating velocity cloud image of ejection–sweep events under different wall surfaces at y+ = 90: (a) clear water field ejection event; (b) liquid–solid two-phase flow field ejection event; (c) clear water field sweep event; (d) liquid–solid two-phase flow field sweep event.
Figure 12 presents normal fluctuating velocity cloud maps of burst events in the self-sustaining mechanism. The burst events in this region dominate the transformation between streamwise vortices and streak structures; therefore, changes in the burst events in this region can not only reflect the level of Reynolds shear stress but also explain the reasons for the changes in the streak structures mentioned earlier. Compared to the normal height of y+ = 90, the intensity of burst events at the normal height of y+ = 30.5 is lower, and the scale is smaller. At this normal height, the pattern of changes in burst events caused by the riblet walls is consistent with that at the height of y+ = 90. However, in both flow fields, the inhibitory effect of particles on burst events is only manifested in the reduction in their scale, but the intensity of normal fluctuations velocity in the core areas of ejection and sweep slightly increases. This indicates that particles have suppressed the scale of burst events in this range, compressing more normal fluctuation into their core regions.
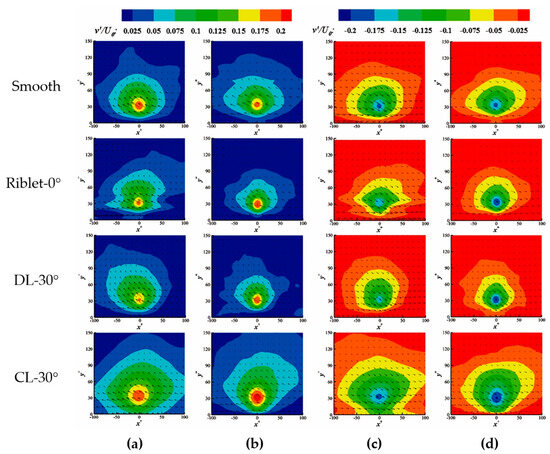
Figure 12.
Normal fluctuating velocity cloud image of ejection–sweep events under different wall surfaces at y+ = 30.5: (a) clear water field ejection event; (b) liquid–solid two-phase flow field ejection event; (c) clear water field sweep event; (d) liquid–solid two-phase flow field sweep event.
Previous studies have shown that, in the buffer zone, ejection events contribute to 70% of the Reynolds shear stress, and even in the logarithmic region, under a zero pressure gradient, the contribution of ejection events to Reynolds shear stress is higher than that of sweep events [8]. After the addition of particles, the number of sweep events does not change significantly; on the contrary, the number of ejection events varies greatly. Therefore, it can be inferred that in the buffer layer and logarithmic law region where the self-sustaining process occurs, changes in ejection events are an important factor affecting frictional resistance. Figure 13 shows the distribution pattern of ejection events at two normal heights for each wall. Unlike the distribution pattern of streamwise vortex quantities, the number of ejection events does not show a clear decrease with the increase in normal height, but is distributed with small fluctuations around the average value. All four types of walls show a clear stratification phenomenon in both flow fields, with the number of ejection events ranked from small to large as follows: 30° divergent riblets, streamwise riblets, smooth flat plate, and 30° convergent riblets. This also clearly explains that the inhibitory and promotional effects of riblet walls on burst events are not only targeted at their scales, but also significantly reduce and increase their number. Table 2 summarizes the average values of ejection events under eight conditions, confirming not only the existence of the above phenomena but also finding that the addition of particles reduces the frequency of ejection events under all wall surfaces, rather than breaking down burst events into more small-scale structures.
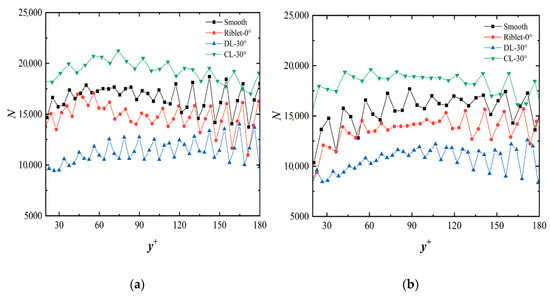
Figure 13.
Distributions of the number of eject events along normal-wall positions: (a) clean water flow field; (b) liquid–solid two-phase flow field.

Table 2.
Average number of eject events on different wall surfaces.
Since the aforementioned texts mention that burst events are an important reason for high Reynolds shear stress, analyzing only the structure and quantity of burst events is not sufficient to demonstrate their contribution to Reynolds shear stress. Figure 14 shows the distribution of Reynolds shear stress caused by burst events at two normal heights for each wall, which can intuitively show the specific impact of the change in yaw angle and the addition of particles on the Reynolds shear stress produced by burst events. It can be seen from the figure that at both normal heights, the drag-reduction riblet walls can effectively reduce the Reynolds shear stress produced by ejection events, while the drag-increasing riblet walls enhance the contribution of ejection events to Reynolds shear stress. By comparing the two normal heights, it can be seen that, unlike the intensity of the burst events themselves, the contribution of ejection events to Reynolds shear stress at a height of y+ = 30.5 does not show a significant decrease. On the contrary, the core high Reynolds shear stress area has expanded. This indicates that even at the y+ = 90 normal height, where burst events are weaker, their contribution to Reynolds shear stress is also very high. Therefore, the contribution of burst events to frictional resistance at both normal heights is very important. In the two-phase flow field, due to the addition of the particulate phase, the high Reynolds shear stress area caused by ejection events is fragmented, the area is reduced, and the intensity is decreased, indicating that the particulate phase effectively reduces the Reynolds shear stress produced by ejection events, thereby reducing the contribution to frictional resistance.
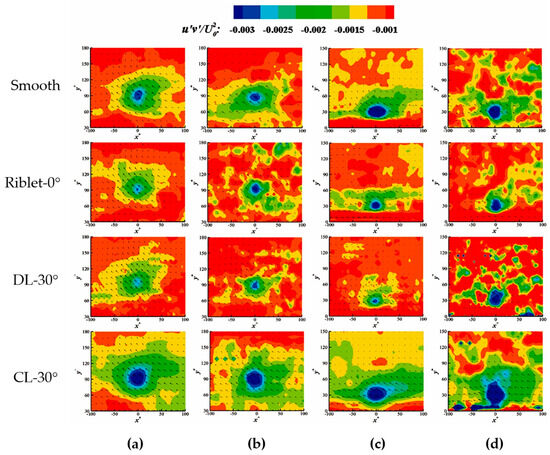
Figure 14.
Contour cloud map of Reynolds shear stress distribution during ejection events: (a) ejection event in the clear water flow field at a height of y+ = 90; (b) ejection event in the two-phase flow field at a height of y+ = 90; (c) ejection event in the clear water flow field at a height of y+ = 30.5; (d) ejection event in the two-phase flow field at a height of y+ = 30.5.
4. Conclusions
This study employs Particle Image Velocimetry (PIV) to investigate the turbulent boundary layer over smooth, streamwise riblet, and convergent–divergent riblet wall surfaces. The results demonstrate that riblet walls with different yaw angles significantly influence the statistical properties, streak structures, and burst events within the turbulent boundary layer, thereby affecting the generation of wall frictional resistance.
Compared to the statistical properties of the turbulent boundary layer on a smooth wall, the divergent riblet wall has the opposite effect on the turbulent boundary layer compared to the convergent riblet wall, while the streamwise riblet wall has a similar effect on the divergent riblet wall but with a weaker impact. The divergent and streamwise riblet walls cause the velocity profile curve in the logarithmic law region to shift upwards, resulting in a decrease in boundary layer thickness and friction velocity. The overall turbulence intensity and Reynolds shear stress within the boundary layer are reduced, indicating that these two types of riblet walls have good drag reduction characteristics. The addition of particles can lead to an increase in boundary layer thickness, a reduction in wall friction resistance, and a decrease in overall turbulence intensity and Reynolds shear stress within the logarithmic law region. However, it can also have a certain enhancing effect on the overall turbulence intensity and Reynolds shear stress in the buffer layer and part of the wake region.
By performing a proper orthogonal decomposition on the velocity field of the x-z plane, the large-scale streak structures that dominate the near-wall region were obtained. Compared to the smooth wall, drag reduction riblet walls reduce the energy content ratio of the streak structures and advance the modal order at which smaller-scale structures appear. In contrast, drag-increasing riblet wall have the opposite effect. After the addition of particles, a fragmentation effect occurs on the streak structures, reducing the energy content ratio of the first three modal orders. Subsequently, the spacing of the streak structures was quantitatively analyzed through correlation function analysis. At the same wall-normal position, drag-reduction riblet walls widen the spacing of the streak structures, while divergent riblet wall enhance the spanwise motion of the streak structures. Particles, while fragmenting the streak structures, also reduce the spanwise spacing of the streak structures. The statistical results are well in line with the morphological changes in the streak structures in the low-order modes.
The new quadrant division method was used to extract burst events near the normal heights of y+ = 90 and f y+ = 30.5. The results show that, in the clear water flow field at both heights, the drag reduction riblet walls have a minimal impact on the fluctuating velocity components of burst events but reduce the number of ejection events, decreasing their contribution to Reynolds shear stress. In contrast, drag-increasing riblet walls enhance the aforementioned effects. The addition of particles effectively suppresses the fluctuating velocity components of burst events and intensifies the role of drag-reduction riblet walls, further reducing the number of ejection events and the Reynolds shear stress they produce. Although the intensity of burst events at the normal height of y+ = 30.5 is weaker than at y+ = 90, their contribution to Reynolds shear stress is not significantly reduced.
Author Contributions
Conceptualization, Y.Z., J.S. and N.J.; methodology, Y.Z., J.N. and J.Y.; software, Y.Z., J.N. and J.Y.; validation, Y.Z., J.S., N.J. and H.L.; formal analysis, Y.Z., J.N. and J.Y.; investigation, Y.Z., J.N., J.Y. and H.L.; resources, J.S., N.J. and P.Y.; data curation, Y.Z. and H.L.; writing—original draft preparation, Y.Z. and J.N.; writing—review and editing, J.S., N.J., X.W. and P.Y.; visualization, Y.Z., H.L. and X.W.; supervision, J.S. and N.J.; project administration, J.S.; funding acquisition, J.S. All authors have read and agreed to the published version of the manuscript.
Funding
This research is supported by the National Natural Science Foundation of China [grant numbers 11602077, 11572357] and Natural Science Foundation of Hebei Province [grant number A2024202037, A2021202009].
Data Availability Statement
Data are contained within the article.
Conflicts of Interest
The authors declare no conflict of interest.
Abbreviations
The following abbreviations are used in this manuscript:
| PIV | Particle image velocimetry |
| POD | Proper orthogonal decomposition |
References
- Deck, S.; Renard, N.; Laraufie, R.; Weiss, P.É. Large-scale contribution to mean wall shear stress in high-Reynolds-number flat-plate boundary layers up to 13650. J. Fluid Mech. 2014, 743, 202–248. [Google Scholar] [CrossRef]
- Robinson, S.K. Coherent motions in the turbulent boundary layer. Annu. Rev. Fluid Mech. 1991, 23, 601–640. [Google Scholar] [CrossRef]
- Hama, F.R.; Nutant, J. Detailed flow-field observations in the transition process in a thick boundary layer. Proc. Heat Transf. Fluid Mech. Inst. 1963, 16, 77–93. [Google Scholar]
- Ferrell, J.K.; Richardson, F.M.; Beatty, K.O. Dye displacement technique for velocity distribution measurements. Ind. Eng. Chem. 1955, 47, 29–33. [Google Scholar] [CrossRef]
- Jeong, J.; Hussain, F.; Schoppa, W.; Kim, J. Coherent structures near the wall in a turbulent channel flow. J. Fluid Mech. 1997, 332, 185–214. [Google Scholar] [CrossRef]
- Schoppa, W.; Hussain, F. Coherent structure generation in near-wall turbulence. J. Fluid Mech. 2002, 453, 57–108. [Google Scholar] [CrossRef]
- Lee, J.; Lee, J.H.; Choi, J.I.; Sung, H.J. Spatial organization of large- and very-large-scale motions in a turbulent channel flow. J. Fluid Mech. 2014, 749, 818–840. [Google Scholar] [CrossRef]
- Xu, C. Coherent structures and drag-reduction mechanism in wall turbulence. Adv. Mech. 2015, 45, 111. [Google Scholar] [CrossRef]
- Jiménez, J.; Pinelli, A. The autonomous cycle of near-wall turbulence. J. Fluid Mech. 1999, 389, 335–359. [Google Scholar] [CrossRef]
- Hamilton, J.M.; Kim, J.; Waleffe, F. Regeneration mechanisms of near-wall turbulence structures. J. Fluid Mech. 1995, 287, 317–348. [Google Scholar] [CrossRef]
- Waleffe, F. On a self-sustaining process in shear flows. Phys. Fluids 1997, 9, 883–900. [Google Scholar] [CrossRef]
- Kim, J. Physics and control of wall turbulence for drag reduction. Philos. Trans. R. Soc. A Math. Phys. Eng. Sci. 2011, 369, 1396–1411. [Google Scholar] [CrossRef] [PubMed]
- Kim, H.T.; Kline, S.J.; Reynolds, W.C. The production of turbulence near a smooth wall in a turbulent boundary layer. J. Fluid Mech. 1971, 50, 133–160. [Google Scholar] [CrossRef]
- Bogardt, D.G.; Tiederman, D.W.G. Characteristics of ejections in turbulent channel flow. J. Fluid Mech. 1987, 179, 1–19. [Google Scholar] [CrossRef]
- Asai, M.; Minagawa, M.; Nishioka, M. The instability and breakdown of a near-wall low-speed streak. J. Fluid Mech. 2002, 455, 289–314. [Google Scholar] [CrossRef]
- Brandt, L.; De Lange, H.C. Streak interactions and breakdown in boundary layer flows. Phys. Fluids 2008, 20, 024107. [Google Scholar] [CrossRef]
- Wang, J.J.; Pan, C.; Zhang, P.F. On the instability and reproduction mechanism of a laminar streak. J. Turbul. 2009, 10, N26. [Google Scholar] [CrossRef]
- Brooke, J.W.; Hanratty, T.J. Origin of turbulence-producing eddies in a channel flow. Phys. Fluids A 1992, 5, 1011–1022. [Google Scholar] [CrossRef]
- Bernard, P.S.; Thomas, J.M.; Handler, R.A. Vortex dynamics and the production of Reynolds stress. J. Fluid Mech. 1993, 253, 385–419. [Google Scholar] [CrossRef]
- Smith, C.R.; Walker, J.D.A. Turbulent wall-layer vortices. In Fluid Vortices; Springer: Dordrecht, The Netherlands, 1995; pp. 235–289. [Google Scholar]
- Kline, S.J.; Reynolds, W.C.; Schraub, F.A.; Runstadler, P.W. The structure of turbulent boundary layers. J. Fluid Mech. 1967, 30, 741–773. [Google Scholar] [CrossRef]
- Corino, E.Ç.; Brodkey, R.S. A visual investigation of the wall region in turbulent flow. J. Fluid Mech. 1969, 37, 1–30. [Google Scholar] [CrossRef]
- Bechert, D.W.; Bruse, M.; Hage, W.; Van Der Hoeven, J.G.T.; Hoppe, G. Experiments on drag-reducing surfaces and their optimization with an adjustable geometry. J. Fluid Mech. 1997, 338, 59–87. [Google Scholar] [CrossRef]
- Walsh, M.J. Riblets as a viscous drag reduction technique. AIAA J. 1983, 21, 485–486. [Google Scholar] [CrossRef]
- Goldstein, D.; Handler, R.; Sirovich, L. Direct numerical simulation of turbulent flow over a modelled riblet covered surface. J. Fluid Mech. 1995, 302, 333–376. [Google Scholar] [CrossRef]
- Martin, S.; Bhushan, B. Fluid flow analysis of a shark-inspired microstructure. J. Fluid Mech. 2014, 756, 5–29. [Google Scholar] [CrossRef]
- Koeltzsch, K.; Dinkelacker, A.; Grundmann, R. Flow over convergent and divergent wall riblets. Exp. Fluids 2002, 33, 346–350. [Google Scholar] [CrossRef]
- Chen, H.; Rao, F.; Shang, X.; Zhang, D.; Hagiwara, I. Flow over bio-inspired 3D herringbone wall riblets. Exp. Fluids 2014, 55, 1698. [Google Scholar] [CrossRef]
- Nugroho, B.; Kevin; Monty, J.P.; Hutchins, N.; Gnanamanickam, E.P. Roll-modes generated in turbulent boundary layers with passive surface modifications. In Proceedings of the 52nd Aerospace Sciences Meeting, National Harbor, MD, USA, 13–17 January 2014. [Google Scholar]
- Kevin, K.; Monty, J.; Hutchins, N. Turbulent structures in a statistically three-dimensional boundary layer. J. Fluid Mech. 2019, 859, 543–565. [Google Scholar] [CrossRef]
- Xu, F.; Zhong, S.; Zhang, S. Vortical structures and development of laminar flow over convergent-divergent riblets. Phys. Fluids 2018, 30, 051901. [Google Scholar] [CrossRef]
- Xu, F.; Zhong, S.; Zhang, S. Statistical analysis of vortical structures in turbulent boundary layer over directional grooved surface pattern with spanwise heterogeneity. Phys. Fluids 2019, 31, 085110. [Google Scholar] [CrossRef]
- Xu, F.; Zhong, S.; Zhang, S. Experimental study on secondary flow in turbulent boundary layer over spanwise heterogeneous microgrooves. Phys. Fluids 2020, 32, 035109. [Google Scholar] [CrossRef]
- Wang, H.; Fan, Y.; Yan, Z.; Li, W. Direct numerical simulations of turbulent flow over the converging and diverging riblets. Phys. Fluids 2023, 35, 075121. [Google Scholar] [CrossRef]
- Yuan, P.; Sun, J.; Gao, T.; Sun, K.; Yu, L.; Chen, W.; Zhao, Y. Control effect on the divergent and convergent riblets in particle-laden turbulent boundary layer. Phys. Fluids 2024, 36, 075178. [Google Scholar] [CrossRef]
- Noguchi, K.; Nezu, I. Particle-turbulence interaction and local particle concentration in sediment-laden open-channel flows. J. Hydro-Environ. Res. 2009, 3, 54–68. [Google Scholar] [CrossRef]
- Kevin, K.; Monty, J.P.; Bai, H.L.; Pathikonda, G.; Nugroho, B.; Barros, J.M.; Christensen, K.T.; Hutchins, N. Cross-stream stereoscopic particle image velocimetry of a modified turbulent boundary layer over directional surface pattern. J. Fluid Mech. 2017, 813, 412–435. [Google Scholar] [CrossRef]
- Elghobashi, S. On predicting particle-laden turbulent flows. Appl. Sci. Res. 1994, 52, 309–329. [Google Scholar] [CrossRef]
- Qiu, H.; Chauhan, K.; Lei, C. A numerical study of drag reduction performance of simplified shell surface microstructures. Ocean Eng. 2020, 217, 107916. [Google Scholar] [CrossRef]
- Clauser, F.H. The Turbulent Boundary Layer. Adv. Appl. Mech. 1956, 4, 1–51. [Google Scholar]
- Fan, X.; Jiang, N. Skin friction measurement in turbulent boundary layer by mean velocity profile method. Chin. J. Mech. Eng. 2005, 27, 28–30. [Google Scholar]
- Choi, H.; Moin, P.; Kim, J. Direct numerical simulation of turbulent flow over riblets. J. Fluid Mech. 1993, 255, 503–539. [Google Scholar] [CrossRef]
- Lee, S.-J.; Lee, S.-H. Flow field analysis of a turbulent boundary layer over a riblet surface. Exp. Fluids 2001, 30, 153–166. [Google Scholar] [CrossRef]
- Li, S.; Wu, D.; Cui, G.; Wang, J. Experimental study on properties of turbulent/non-turbulent interface over riblets surfaces at low Reynolds numbers. Chin. J. Theor. Appl. Mech. 2020, 52, 1632–1644. [Google Scholar]
- Wang, X.; Li, S.; Tang, Z.; Jiang, N. An experimental study on riblet-induced spanwise vortices in turbulent boundary layers. J. Exp. Fluid Mech. 2018, 32, 55–63. [Google Scholar] [CrossRef]
- Cui, G.; Pan, C.; Gao, Q.; Li, L.; Wang, J. Flow structure in the turbulent boundary layer over directional riblets surfaces. Chin. J. Theor. Appl. Mech. 2017, 49, 1201–1212. [Google Scholar]
- Li, J.; Liu, Z.H.; Wang, H.F.; Chen, S.; Liu, Y.M.; Han, H.F.; Zheng, C.G. Turbulence modulations in the boundary layer of a horizontal particle-laden channel flow. Chin. Phys. Lett. 2010, 27, 064701. [Google Scholar] [CrossRef]
- Smith, C.R.; Metzler, S.P. The characteristics of low-speed streaks in the near-wall region of a turbulent boundary layer. J. Fluid Mech. 1983, 129, 21–54. [Google Scholar] [CrossRef]
- Berkooz, G.; Holmes, P.; Lumley, J.L. The proper orthogonal decomposition in the analysis of turbulent flows. Annu. Rev. Fluid Mech. 1993, 25, 539–575. [Google Scholar] [CrossRef]
- Taira, K.; Hemati, M.S.; Brunton, S.L.; Sun, Y.; Duraisamy, K.; Bagheri, S.; Dawson, S.T.M.; Yeh, C.A. Modal analysis of fluid flows: Applications and outlook. AIAA J. 2020, 58, 998–1022. [Google Scholar] [CrossRef]
- Nakagawa, H.; Nezu, I. Structure of space-time correlations of bursting phenomena in an open-channel flow. J. Fluid Mech. 1981, 104, 1–43. [Google Scholar] [CrossRef]
- Tomkins, C.D.; Adrian, R.J. Spanwise structure and scale growth in turbulent boundary layers. J. Fluid Mech. 2003, 490, 37–74. [Google Scholar] [CrossRef]
- Sillero, J.A.; Jiménez, J.; Moser, R.D. Two-point statistics for turbulent boundary layers and channels at Reynolds numbers up to δ⁺ ≈ 2000. Phys. Fluids 2014, 26, 105102. [Google Scholar] [CrossRef]
- Wallace, J.M.; Eckelmann, H.; Brodkey, R.S. The wall region in turbulent shear flow. J. Fluid Mech. 1972, 54, 39–48. [Google Scholar] [CrossRef]
- Lu, S.S.; Willmarth, W.W. Measurements of the structure of the Reynolds stress in a turbulent boundary layer. J. Fluid Mech. 1973, 60, 481–511. [Google Scholar] [CrossRef]
- Willmarth, W.W.; Lu, S.S. Structure of the Reynolds stress near the wall. J. Fluid Mech. 1972, 55, 65–92. [Google Scholar] [CrossRef]
- Yang, S.; Jiang, N. Tomographic TR-PIV measurement of coherent structure spatial topology utilizing an improved quadrant splitting method. Sci. China Phys. Mech. Astron. 2012, 55, 1863–1872. [Google Scholar] [CrossRef][Green Version]
Disclaimer/Publisher’s Note: The statements, opinions and data contained in all publications are solely those of the individual author(s) and contributor(s) and not of MDPI and/or the editor(s). MDPI and/or the editor(s) disclaim responsibility for any injury to people or property resulting from any ideas, methods, instructions or products referred to in the content. |
© 2025 by the authors. Licensee MDPI, Basel, Switzerland. This article is an open access article distributed under the terms and conditions of the Creative Commons Attribution (CC BY) license (https://creativecommons.org/licenses/by/4.0/).