Abstract
A vision-based lane detection system is difficult to implement in vehicles due to the unique characteristics of algorithms, neural network architectures, limitations, and strict hardware/software requirements. This paper proposes a new architecture, called hybrid U-Net, which represents a significant extension of the classical U-Net model, addressing its limitations in capturing global relationships, adaptability to scale variations, and sensitivity to geometric structures. An important aspect of this new architecture is the balance between performance and computational efficiency, maintaining reasonable values of performance parameters with a competitive inference time. The experimental results show that hybrid U-Net achieved superior scores in both mIoU and F1 score parameters. The most notable increase was observed in the (TuSimple+Carla) dataset, where mIoU increased from 0.56 to 0.60 (+7%), and F1 score from 0.69 to 0.74 (+7.2%). Similarly, in the Carla dataset (known for the complexity of the generated images), a substantial improvement was recorded, with an increase of +8.0% in mIoU and +5.7% in F1 score, showing better adaptability of the model to geometric structures in complex images. However, these improvements come at a considerable computational cost, as the inference time of the hybrid U-Net model is approximately 0.04 s per image (compared to 0.016 s per image for U-Net), resulting in a decrease in FPS from 60 to approximately 23. Future research should investigate model compression techniques, such as knowledge distillation, pruning, or quantization, to improve efficiency without sacrificing accuracy.
1. Introduction
1.1. Advanced Driver Assistance Systems
An advanced driver assistance system (ADAS) is a set of technologies integrated into contemporary vehicles and designed with the major role of improving vehicle safety and helping drivers better control their vehicles. It achieves this by automating certain tasks, alerting drivers to potential traffic problems, and even taking over certain driving functions (when necessary). The importance and effects of ADAS systems as important elements in the construction of modern vehicles are multifaceted, with impacts ranging from increasing road safety and improving the driving experience of drivers to positive effects on the economy [1]. Analyzing the importance and immediate effects of using ADAS systems, it can be stated that these two facets are fully equal in impact.
The importance of ADAS systems lies in the following main points (or directions) [2,3,4]:
- Reducing human errors (driver alerting and proactive intervention).
- Increasing road safety—one of the main reasons for the massive acceptance and integration of ADAS systems in the automotive market (by reducing the number of accidents and implicitly the number of injuries and deaths, increasing the safety of other road users—pedestrians, cyclists).
- Improving comfort and convenience at the wheel through ADAS systems that can automatically adjust the vehicle speed depending on traffic conditions (ACC), provide assistance in staying in the lane (LKA and LCA), facilitate or automate parking maneuvers, and support traffic jam driving by managing slow traffic with numerous stops and starts. These systems reduce driver stress and fatigue and may indirectly contribute to lowering pollutant emissions through smoother and more efficient driving behavior [5].
- Providing the basic foundation for the development of fully autonomous vehicles. As ADAS systems become more sophisticated and highly integrated, they pave the way for higher levels of vehicle automation.
Due to the proven safety benefits of ADAS systems, regulatory bodies have introduced (and continue to introduce) mandates that accelerate their adoption by consumers and drive rapid development and implementation efforts by automotive manufacturers [6].
The effects of ADAS systems are reflected in a significant reduction in accidents and fatalities. Forward collision warning (FCW) and automatic emergency braking (AEB) systems have been shown to significantly reduce rear-end collisions, and lane departure warning (LDW) and lane keeping assist (LKA) systems have reduced lane departure-related accidents [7].
In terms of economic benefits, these are mainly found in reduced repair costs (due to fewer accidents) and in reduced fuel consumption and pollutant emissions (adaptive pilotage can optimize driving patterns, leading to more consistent speeds and potentially better fuel economy).
In the transportation industry, commercial fleets of road transport vehicles have increased operational productivity by reducing/eliminating downtime due to repairs caused by accidents and savings in fuel consumption. Also, from an economic point of view, the large-scale implementation of ADAS systems will stimulate continuous innovation in sensor technology (radar, LiDAR, cameras, ultrasound), artificial intelligence, machine learning and sensor fusion. It should be noted, however, that a major disadvantage is the increasing complexity of ADAS systems, which require more sophisticated software and hardware integration in vehicles. One of the current challenges is to maintain the balance between hardware resource and computational speed [8,9]. The adoption of future IoT technologies (e.g., vehicle-to-everything—V2X) in the use of ADAS systems will create functional capabilities, allowing vehicles to communicate with each other and with the infrastructure to obtain and process real-time traffic information and the necessary hazard warnings [10,11].
Based on these points, it can be said that ADAS systems will continue to have a profound impact on the automotive industry and road safety because they represent a significant technological leap in increasing road safety through accident prevention and driver assistance, leading to safer roads, more comfortable driving experiences, and substantial economic and environmental benefits.
1.2. Traffic Lane Detection
As a fundamental part of ADAS systems, lane detection systems are a critical computer vision task that involves identifying and tracking lane boundaries in real time, providing crucial information for driving, navigation, and safety. Traffic lane detection (TLD) is a cornerstone for various intelligent transportation systems and automated driving features. Currently, there are four major categories of advanced driver assistance systems related to traffic lane detection:
- LDW—Lane departure warnings that alert the driver if the vehicle unintentionally leaves its lane, using visual, audible or haptic alerts.
- LKA—Lane keeping assist, which actively intervenes in steering to help keep the vehicle in its lane.
- LCA—Lane centering assist, acting on the steering system to keep the vehicle centered in the lane.
- ALKS—Automatic lane keeping systems that are designed to follow lane markings with minimal driver intervention.
By analyzing lane occupancy, optimizing vehicle flow, and reducing congestion based on traffic patterns, TLD systems can help monitor and manage traffic, in addition to their primary responsibilities related to road safety [12]. Due to their ability to transmit real-time images to assess the condition of road markings and potentially identify areas in need of repair, TLD systems can also be used for infrastructure condition monitoring and road maintenance.
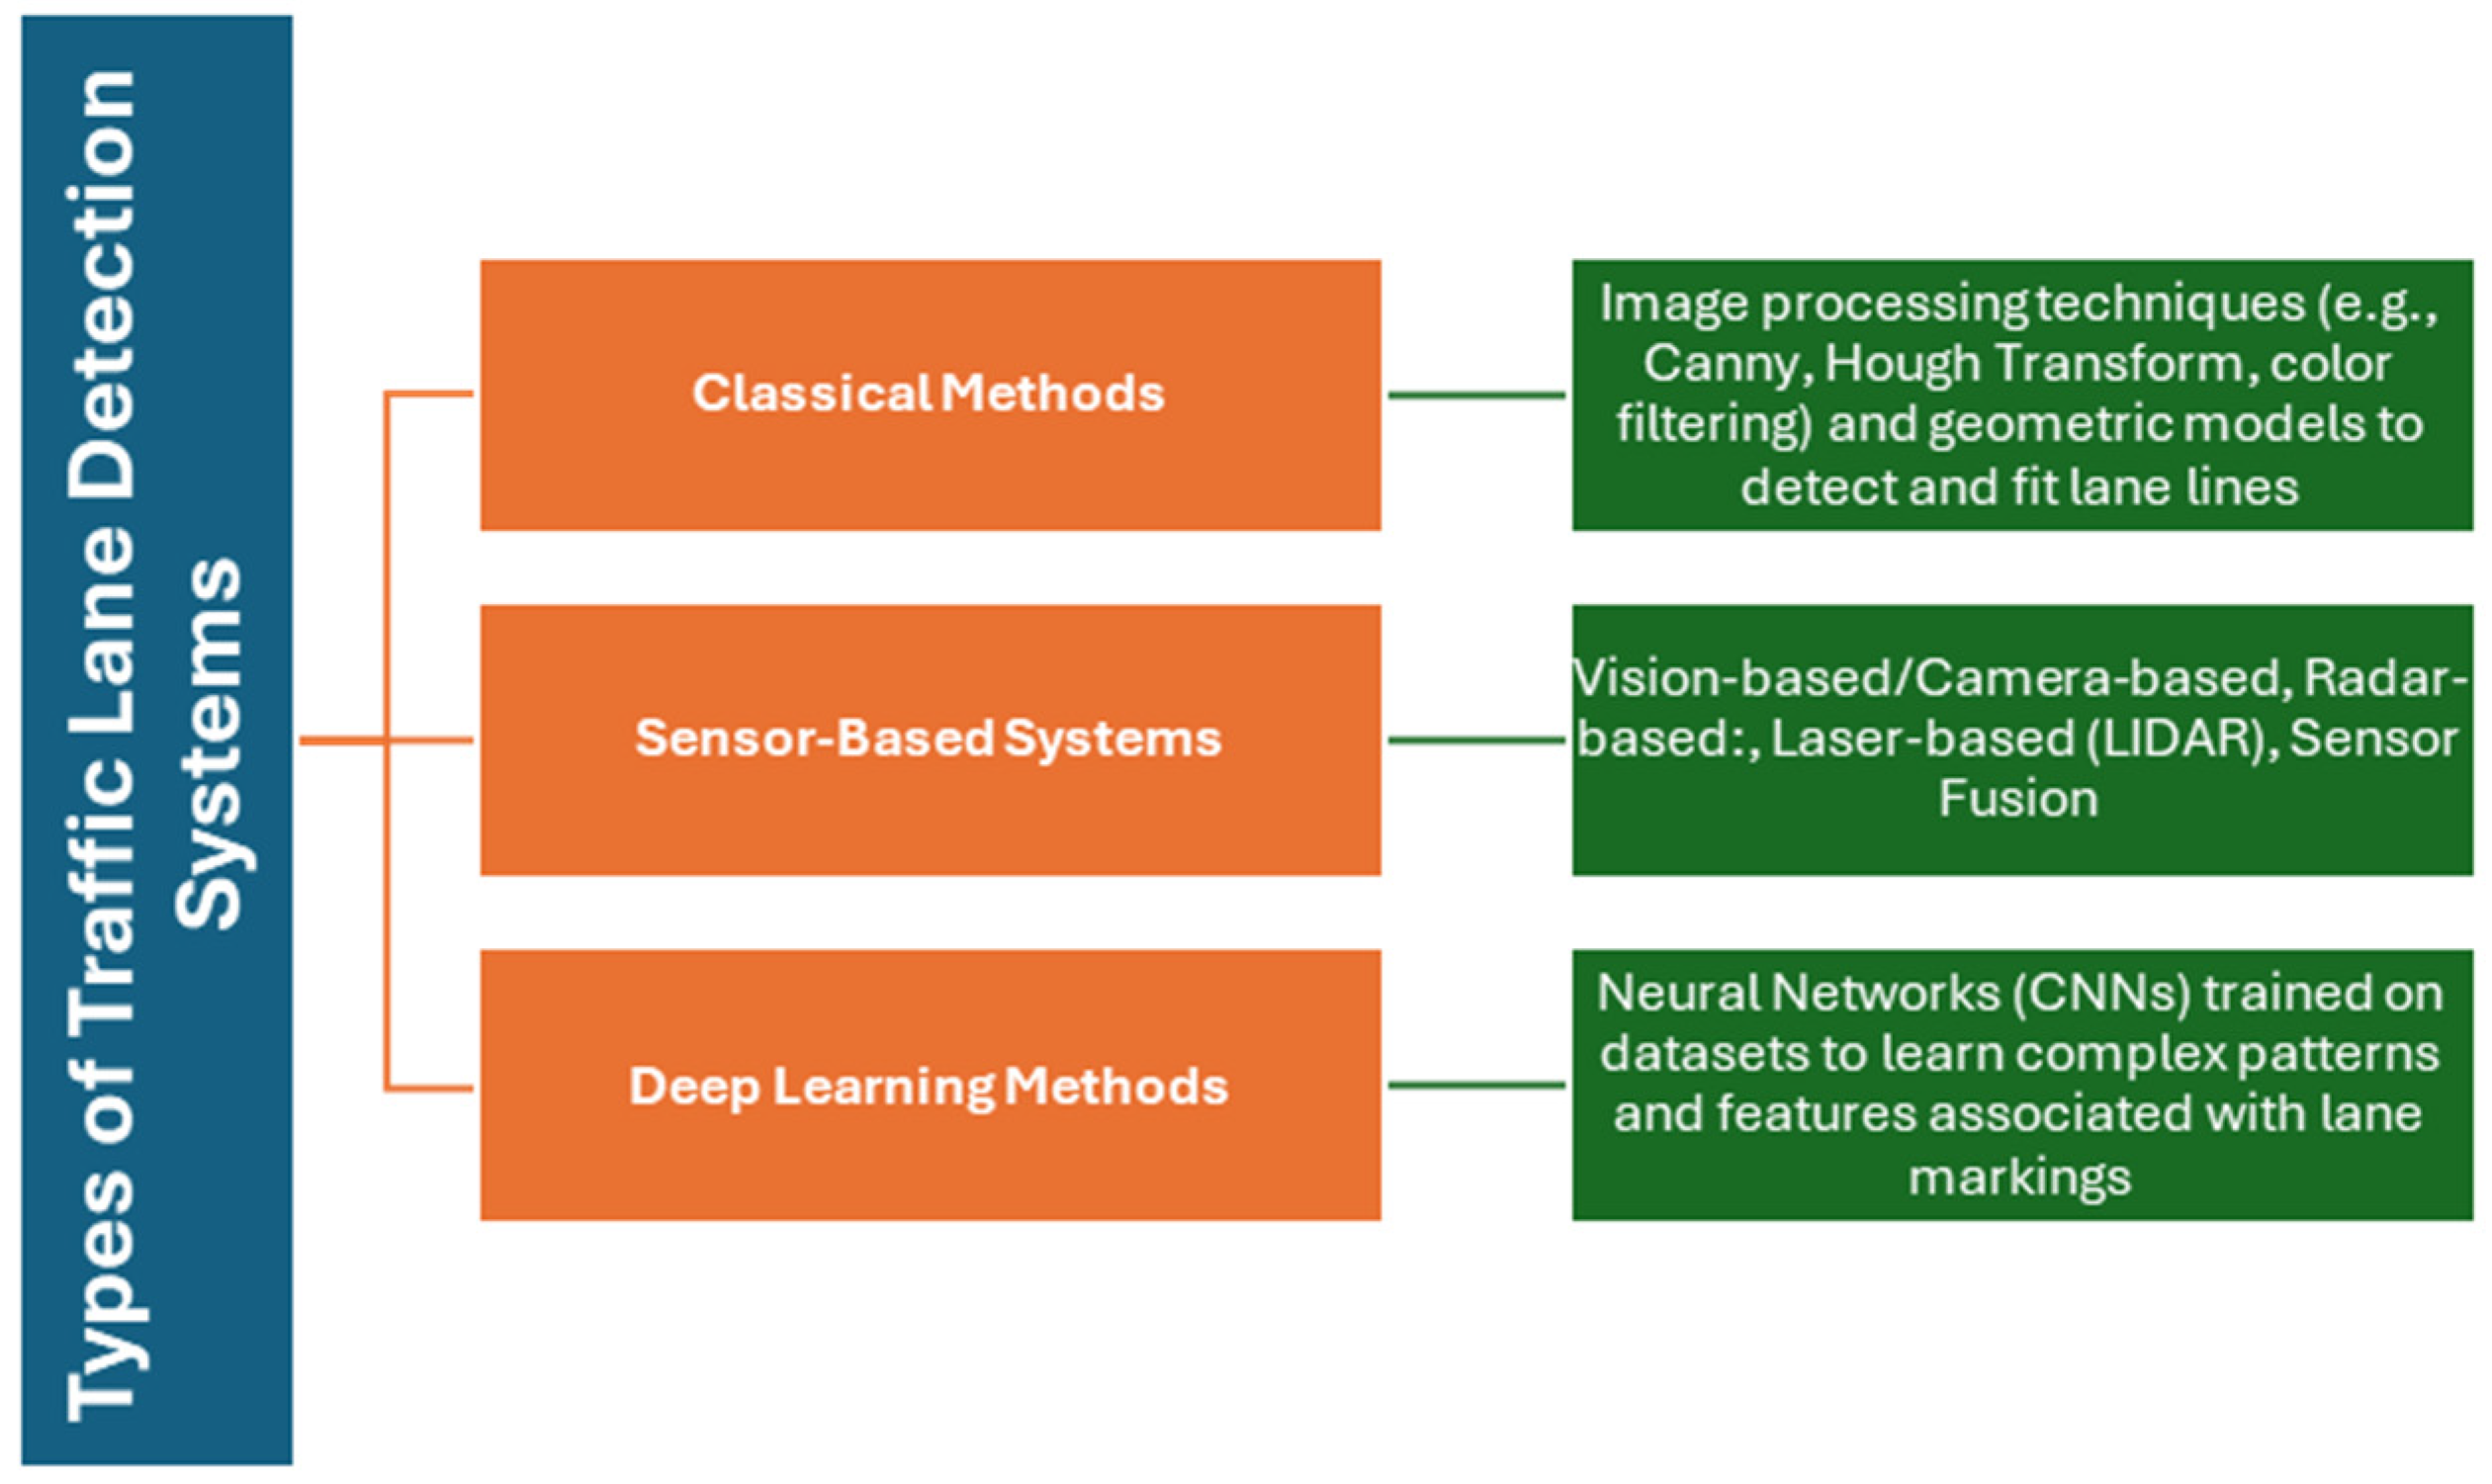
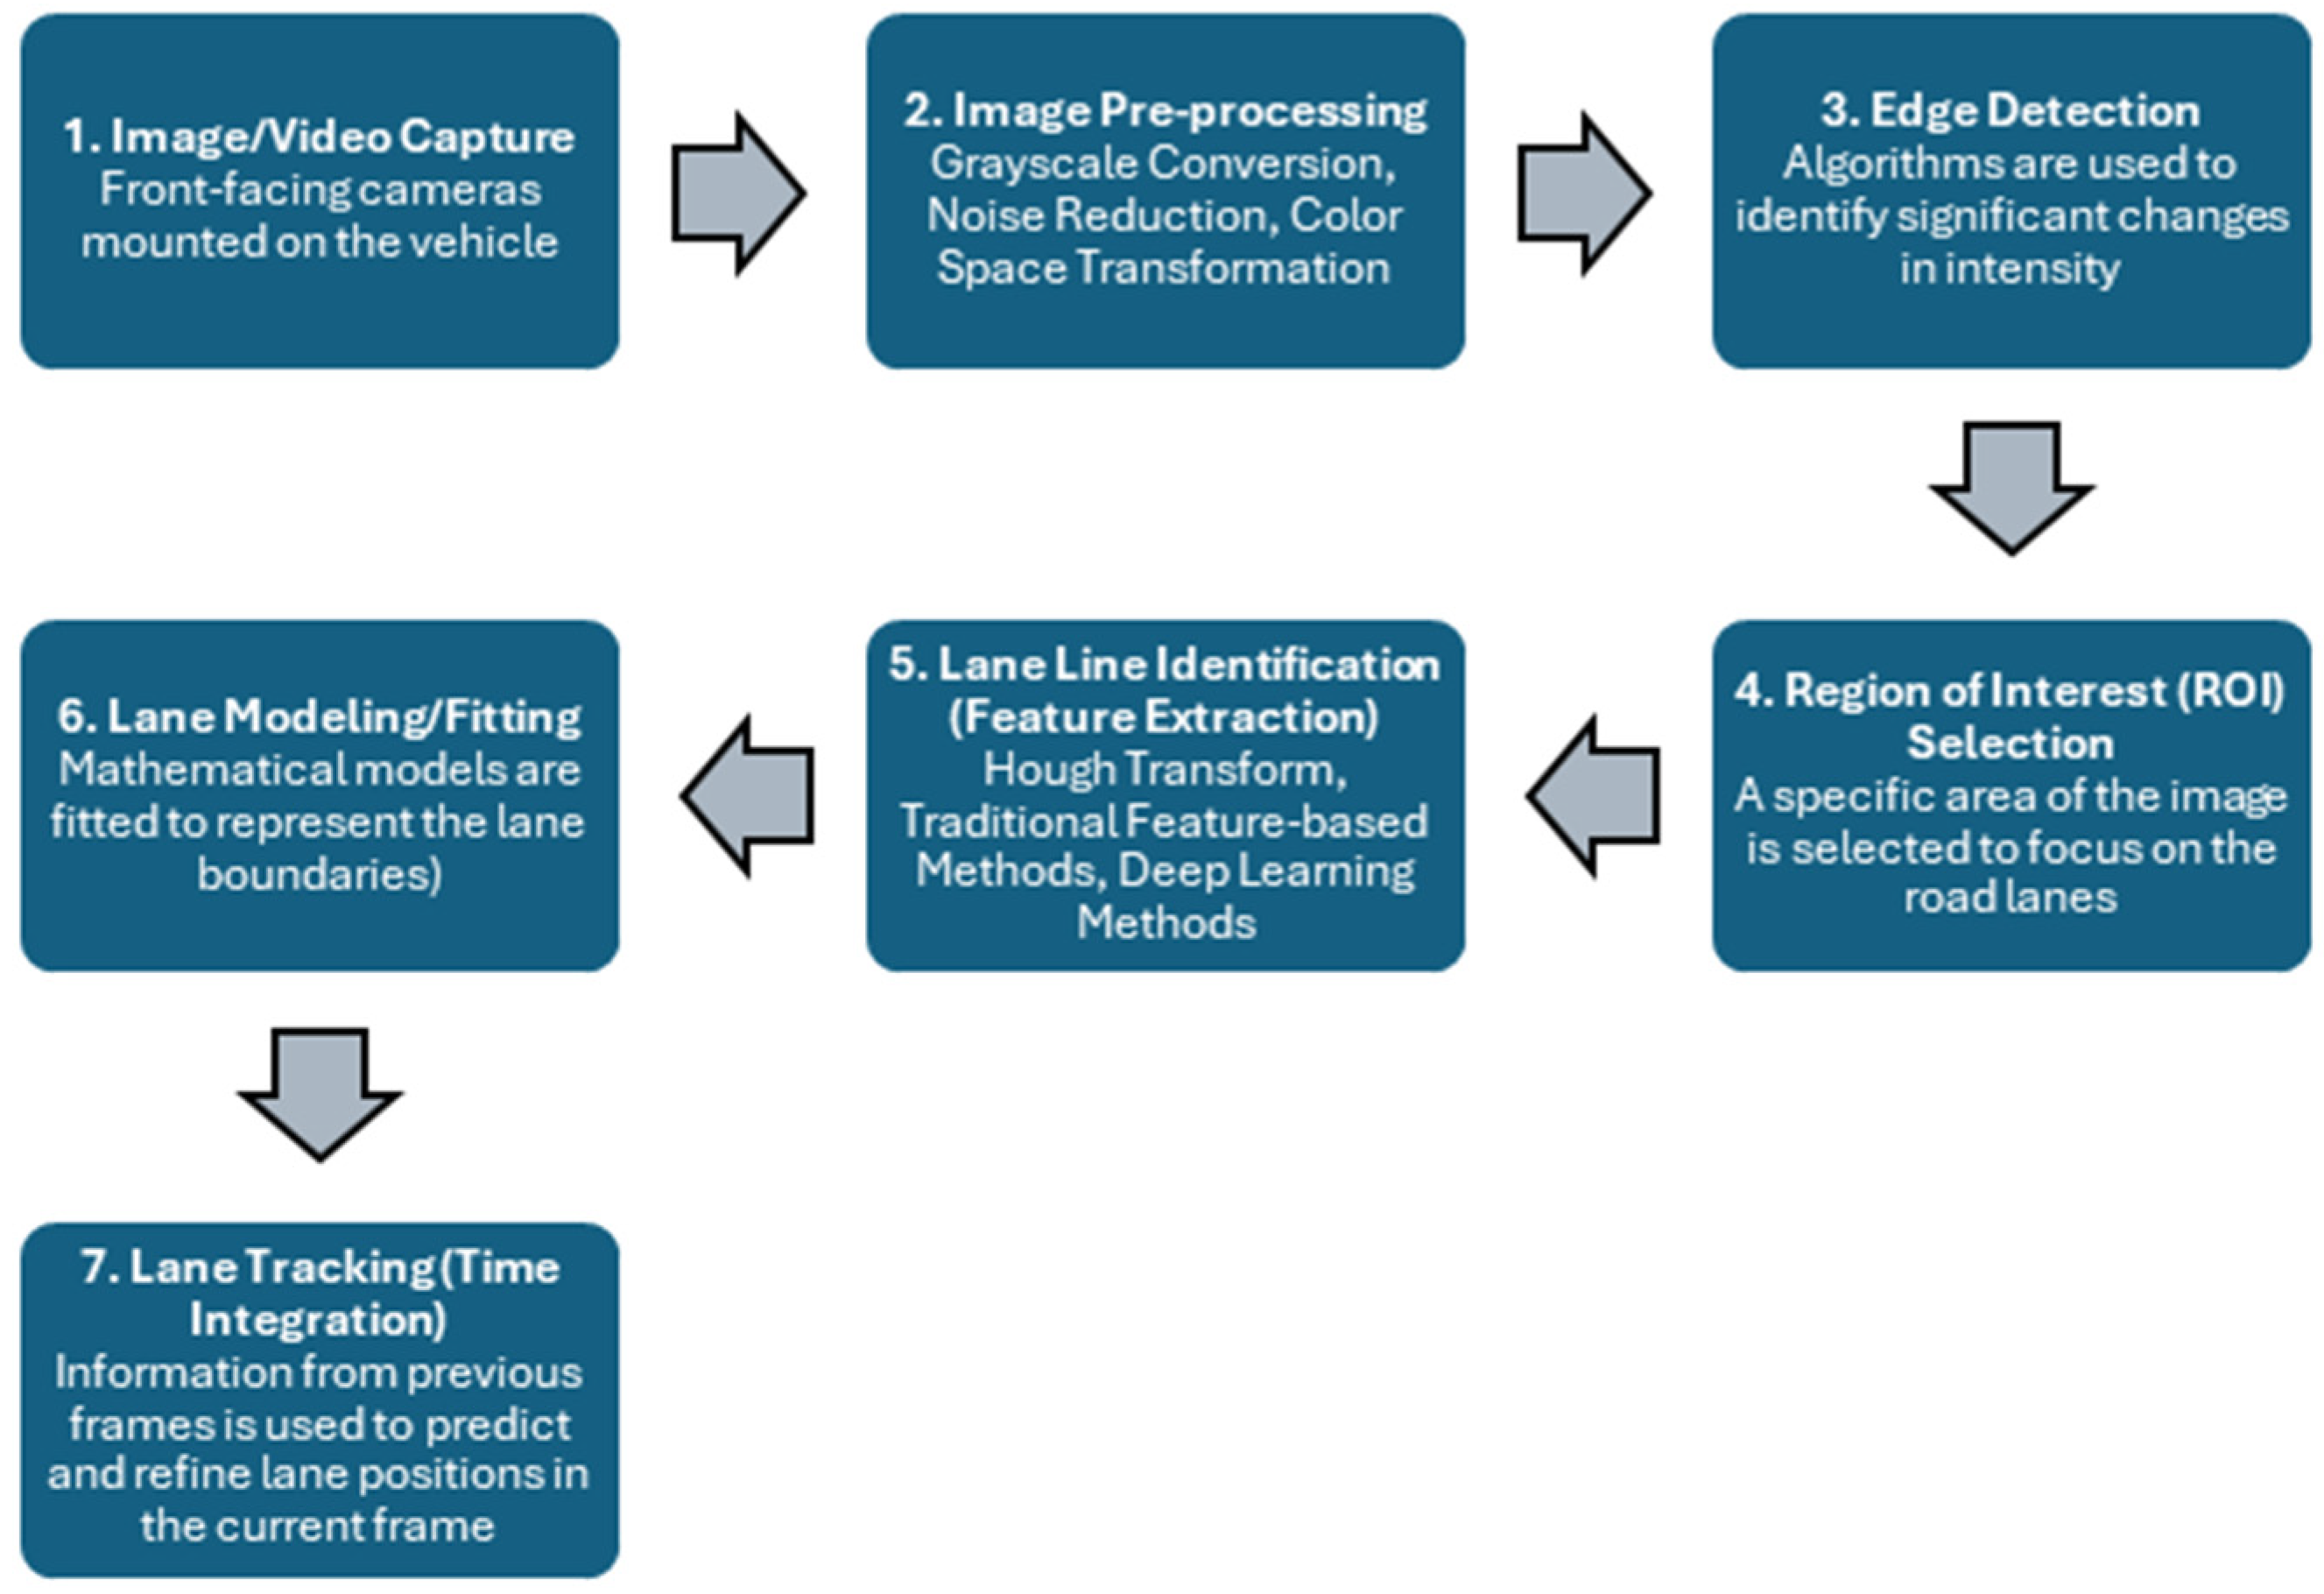
In terms of the types of existing traffic lane detection systems, lane detection systems can be broadly classified according to the underlying detection methodology and technology, and their main classification is shown in Figure 1. The process of detecting lane lines generally involves the key steps shown in Figure 2.
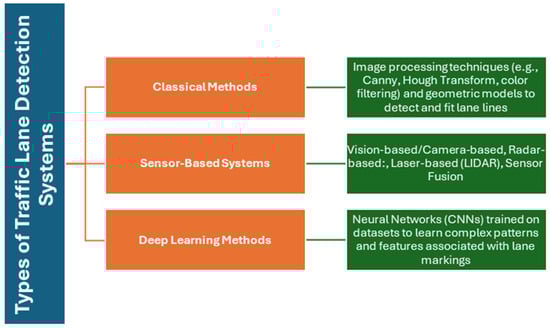
Figure 1.
Main classification of traffic lane detection systems.

Figure 2.
Key steps in the lane line detection process.
1.3. Current Challenges and Research
Despite significant progress, there are currently several challenges in the lane detection process. These challenges relate to variability/instability of environmental conditions, road infrastructure condition, different shapes and colors of road infrastructure markings, computational resources, and the need for data related to improbable scenarios.
The variation of environmental conditions can lead to situations where glare, shadows, low light, and strong sunlight can obstruct the identification of lane markings. Similarly, adverse and/or extreme weather conditions (heavy rain, dense fog, snow, and heavy dust) can significantly reduce visibility and obstruct the detection of lane lines. Faded, worn or missing road markings as well as various complex road layouts (areas with multiple or irregular markings) can confuse detection systems. Adequate computational resources are crucial for real-time lane detection, especially when using deep learning models, which can be a barrier to widespread integration in automobiles due to high processing requirements. Deep learning models need to be trained under a wide range of conditions, including edge cases and unusual situations, to ensure robustness and generalization across different traffic scenarios (including rare or extreme cases) [13]. Implementing a vision-based lane detection system in automobiles is challenging due to the peculiarities of the algorithms, neural network architecture, constraints, and strict hardware/software requirements [14].
Research to eliminate these deficiencies presented above has been conducted by various researchers, in various directions and through a multitude of field-specific approaches, the newest and most relevant being presented below.
Increasing the robustness of lane detection, especially in various weather conditions, was studied in [15]. A new adaptive preprocessing method using a fuzzy inference system (FIS) is proposed. The algorithm dynamically adjusts the parameters in geometry-based image processing functions and improves adaptability to various weather conditions. The accuracy obtained was 95.81%, even though some limitations of the proposed algorithm appeared (by adding the module to the CLRNet neural network, an inevitable increase in processing time was observed).
Research conducted in [16] focused on improving the performance of neural networks for detecting traffic lanes in foggy conditions. A data augmentation method was proposed to synthesize fog images from clear weather conditions, using 107,451 fog images synthesized based on the CULane dataset. This method was able to increase the original CULane dataset/volume with a positive effect in solving the problem of insufficient dataset for detecting traffic lanes in foggy conditions. Thus, the accuracy of the F1 score measurement of the SCNN model in different foggy weather densities was improved from 74.65, 51.41 and 11.09 to 86.65, 81.53, and 70.41, respectively.
A robust multi-stage method for detecting road markings in difficult real environments was proposed in [17]. The edge detection stage proposes a two-step lane verification technique, and the lane tracking method can predict the lane position in the next frame by defining a range of horizontal lane positions (RHLP) in the next frame relative to the horizontal lane position in the previous frame. The performance evaluation of the proposed method was carried out using the DSDLDE dataset with different resolutions at 24 and 25 frames/sec. The results showed that the average detection rate is 97.55% at an average processing time of 22.33 msec/frame, which led the authors to claim that the proposed method performs better for noisy road conditions than other algorithms.
Lane detection based on front-facing RGB cameras has poor performance in low-light conditions. To address this issue, a comprehensive dataset (NightLane) adapted for lane detection in low-light and multi-traffic conditions was introduced for the fused low-light enhancement framework (FLLENet) model [18]. Our testing on the NightLane and CULane datasets demonstrated superior performance in lane detection in low-light conditions. The results showed an F1 score of 76.90 on CULane and 78.91 on NightLane, demonstrating its effectiveness over other similar methods.
Accurate and precise detection of traffic lanes and traffic signs is paramount for the safety and efficiency of autonomous vehicles and to address these issues, models need to be trained with a wide range of data samples for autonomous vehicles to perform well. In this regard, research has been conducted on less computationally complex reduced model variants (YOLOv8 nano). The YOLOv8n transfer learning models proposed in [19] show improved performance, with an average accuracy (mAP) of 90.6% and an inference speed of 117 frames per second (FPS) for traffic lane detection.
Another study introduces an innovative ensemble learning technique (MAB-ensemble), designed for lane detection in road images for autonomous vehicles [20]. The proposed MAB-ensemble technique is based on multi-armed bandit optimization to facilitate efficient model selection for lane segmentation. The performance obtained under various conditions reached an overall accuracy of 90.28% in the dataset of 667 road images. In addition, its accuracy under day, night and abnormal road conditions reached 98.74%, 92.71%, and 79.38%, respectively, which demonstrates that the MAB-ensemble technique exhibits superior performance under all road conditions compared to individual CNN models and traditional ensemble techniques.
Research has also been conducted on the effect of integrating an adaptive ROI selection module, an adaptive threshold adjustment module, and a color channel selection mechanism [21]. The proposed approach has demonstrated good results in addressing diverse and difficult weather conditions, the process of band detection. The proposed algorithm was evaluated on DSDLDE, Caltech, and TuSimple datasets and was compared with both geometry-based and learning-based methods. Overall, the proposed algorithm achieved demonstrably high levels of accuracy (>97%) in daytime cases, while nighttime results ranged from 92% to 99%. Among all weather conditions, the nighttime snowy scene was the most difficult (the worst results).
A new lane detection method (E-CLNRet), based on the original CLRNet, was presented in [22]. The method integrates two additional components: the global feature optimizer (GFO) and the adaptive lane geometry aggregator (ALGA). The components were designed and integrated to improve the model’s ability to handle complex road scenes (curves, shadows, and glare), improving the accuracy and stability of lane detection in difficult environments. As for the performance, in the curved lane line detection scenario, the F1 score of E-CLNRet improved by almost 3% compared to the original CLRNet.
A lane detection model, based on a neural network that learns to decode the markings directly instead of relying on post-processing to define the lanes, is proposed in [23]. The method is based on a neural network designed to draw the detected lines on the recorded images, and thus the post-processing part becomes faster. The network training was performed on two datasets (images taken from the TuSimple and CULane databases), and the results obtained showed an accuracy of 95.2% on these datasets.
A road marking detection system based on recorded images was proposed [24], by creating an additional layer of data that can be used by the automatic vehicle driving system. The authors used the YOLOv3 object detection algorithm, trained to recognize 25 different road markings using more than 25,000 images. The results obtained showed that this model had an accuracy of 98.28% and a detection speed from 20 msec to 41.05 msec.
Another research direction for lane and road edge detection has addressed the specific combination of encoder, residual network, and densely connected network architectures [25]. The method itself consists of using three identical neural networks that process RGB images of road surfaces and produce binary masks for detecting road edges and markings. The method has been evaluated on a dataset of orthophotographs of Estonian highways and shows high accuracy (over 90%) for both road edge and road marking detection.
In conclusion, traffic lane detection is a vital and evolving field, driven by advances in computer vision, machine learning, and sensor technologies. While significant research and progress has been made, studies must continue to address the complexity of real-world driving conditions to enhance the robustness, safety, and efficiency of future transportation systems (vehicles).
This paper proposes a new method for lane detection based on the original U-Net architecture. The new architecture is called hybrid U-Net and incorporates several carefully designed components/modules: geometric skip connection, spatial attention module, multi-scale detection module, and transformer encoder. The integration of these components/modules was based on the benefits that each of them offers independently in increasing the robustness of the lane detection process. Through this innovative combination of modules, an improvement in detection accuracy was achieved, demonstrating the effectiveness and robustness of the proposed algorithm. The results obtained are promising, demonstrating on all three datasets used (TuSimple, Carla and TuSimple+Carla) that hybrid U-Net achieved superior scores on the mIoU and F1 score parameters.
The structure of the article is organized as follows. Section 1 presents the general notions about ADAS systems with a focus on the process of traffic lane detection. Section 2 analyzes the previous research in the field of lane detection in light of the current challenges in the field. In Section 3, an overview of the original U-Net architecture, the newly proposed hybrid U-Net architecture, and the modules integrated in the latter is provided. Section 4 includes the presentation of the experimental results and their analysis through discussions. Finally, in Section 5, the article concludes by presenting the results of this approach and discussing potential directions for future research.
2. Materials and Methods
2.1. Using Game Engines to Generate Traffic Images
With the development of game engines, their functions have been extended to areas related to data visualization, training, medical, and military use. Most recently, the game engine is becoming a popular option for researchers around the world to create prototypes of connected vehicle systems [26], ADASs [27], and autonomous vehicles [28].
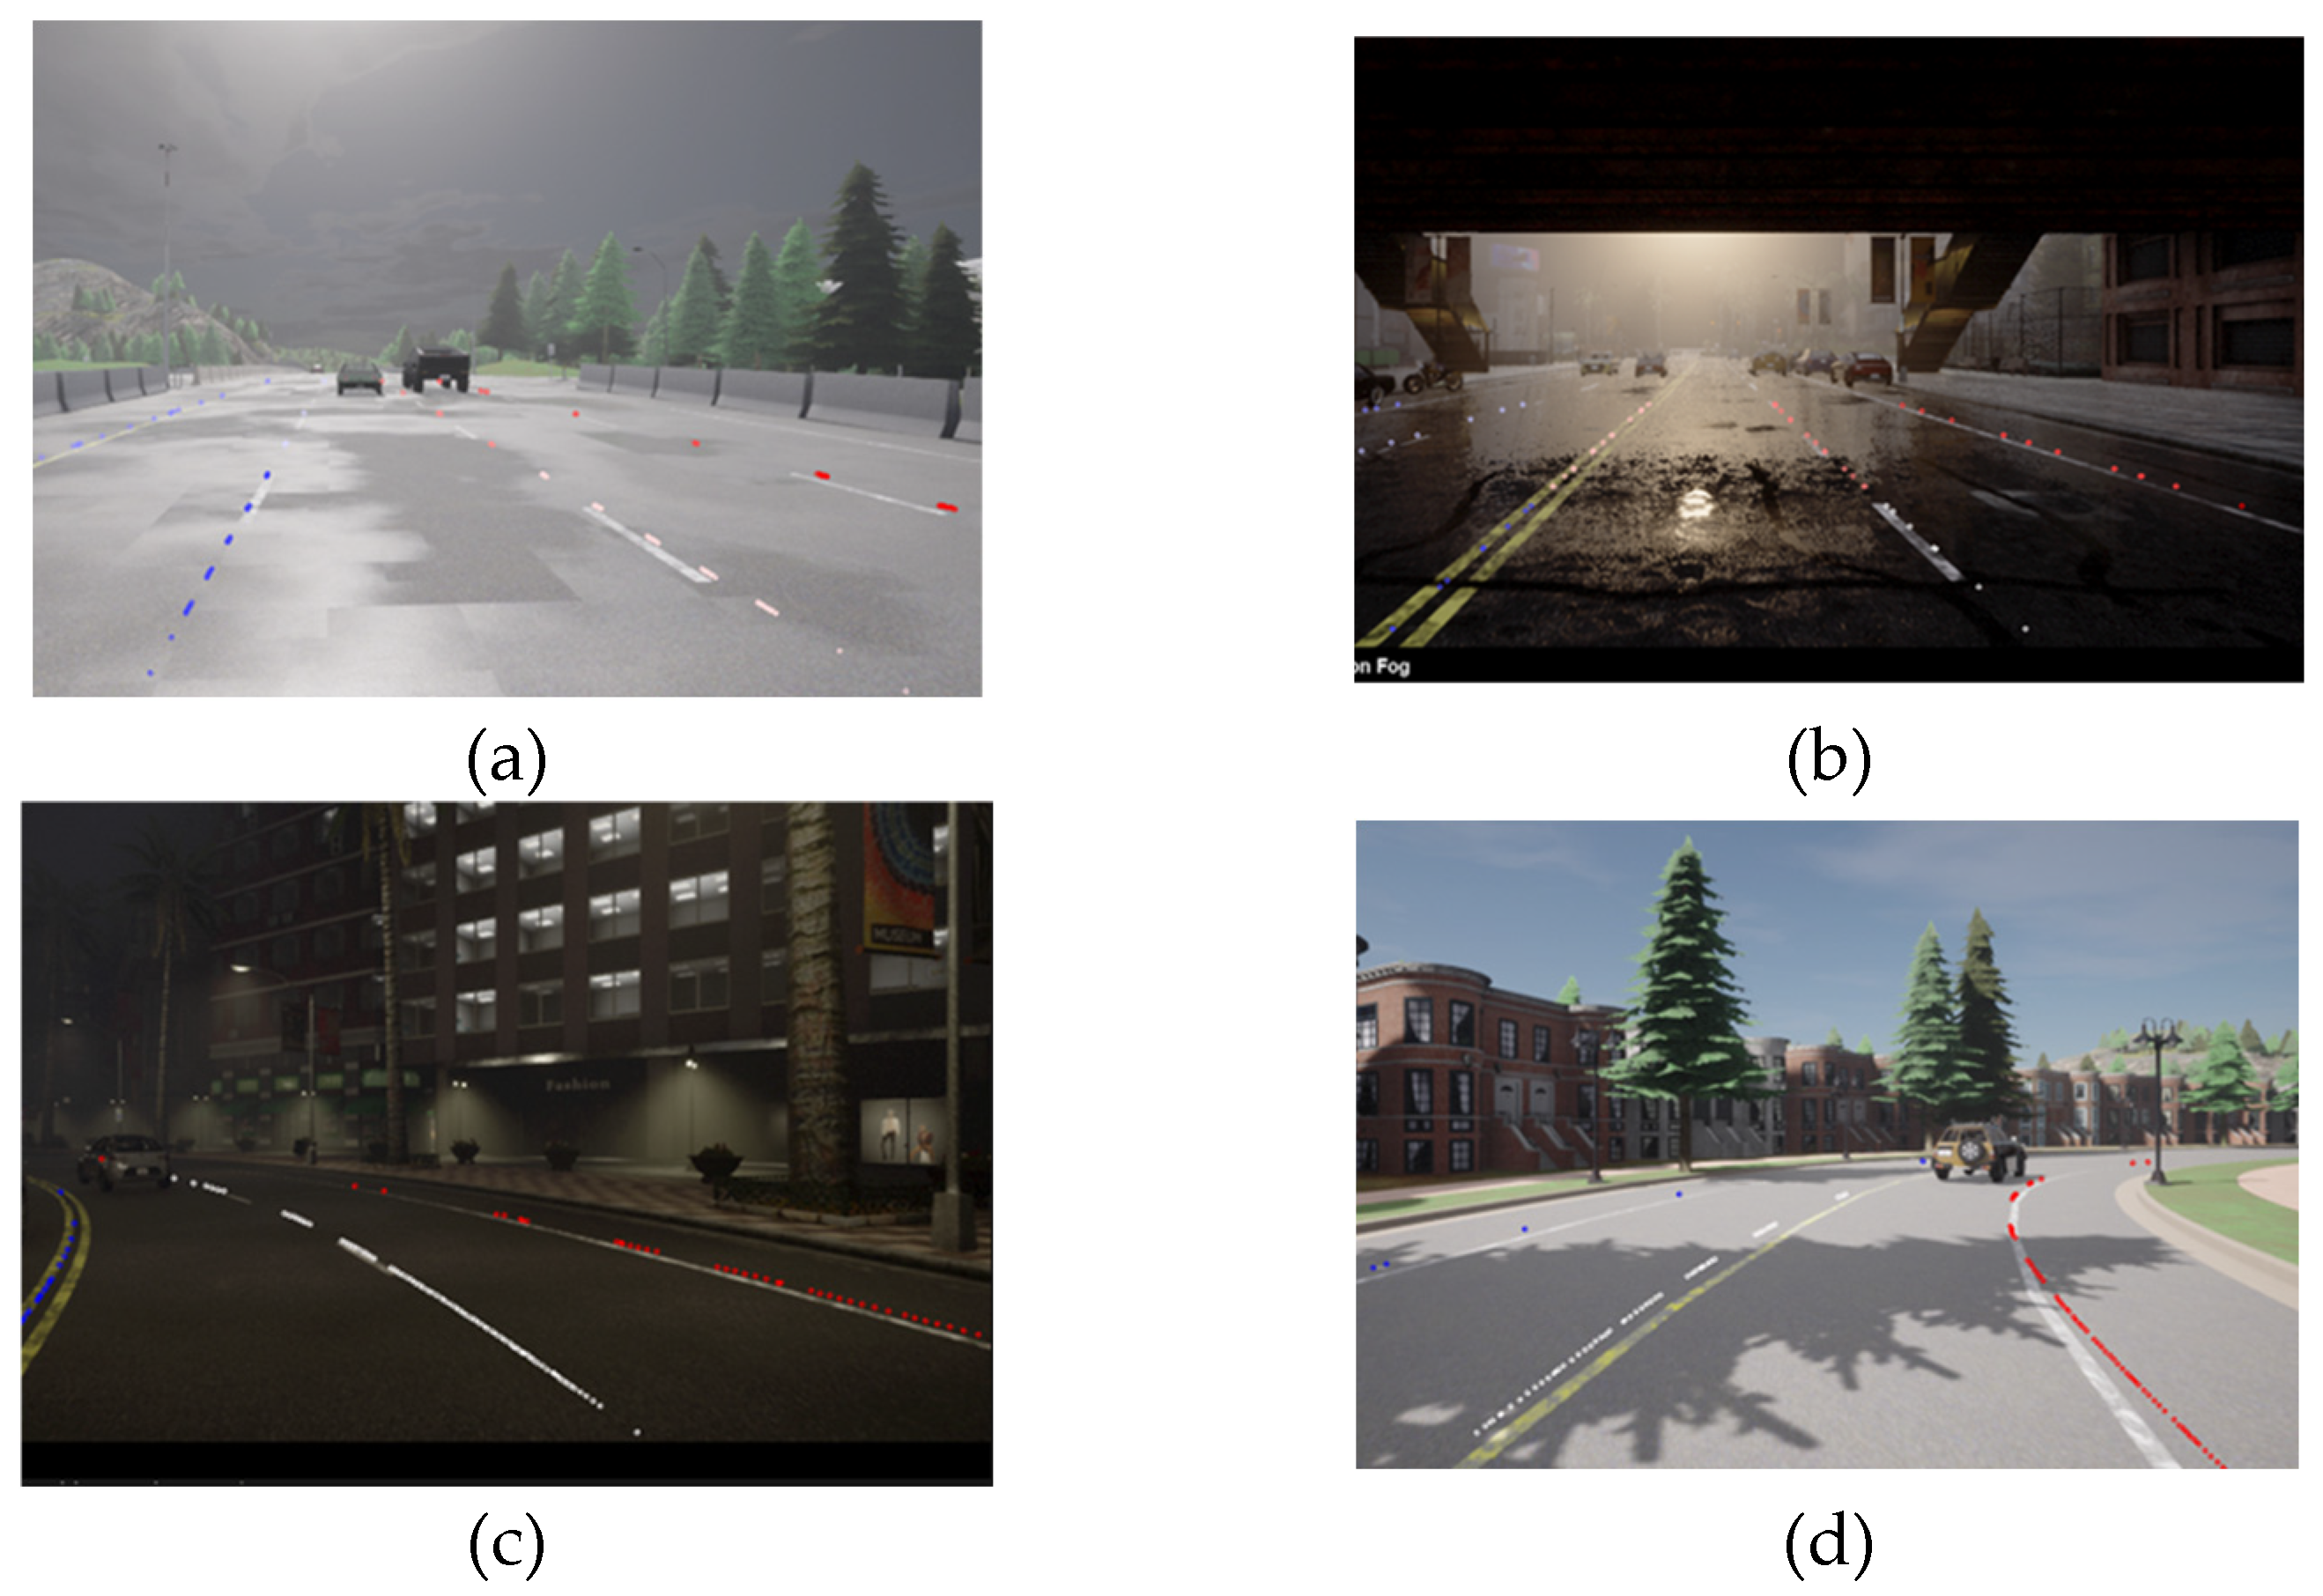
The Carla (Car Learning to Act) simulation environment is an open-source simulator for simulating the urban environment, focusing on creating a publicly available virtual environment applicable to the specific requirements of the automotive industry (training, prototyping and validation of autonomous driving models, both in terms of perception and control). Carla is based on the Unreal game engine and uses the Open Drive standard for defining road infrastructure. The simulation supports flexible sensor configuration and provides signals that can be used to train autonomous driving software, such as RGB images, point cloud, GPS coordinates, speed, acceleration, detected objects, and detailed data on collisions with objects or other road users. A wide range of environmental conditions can be specified, including weather and time of day (Figure 3).
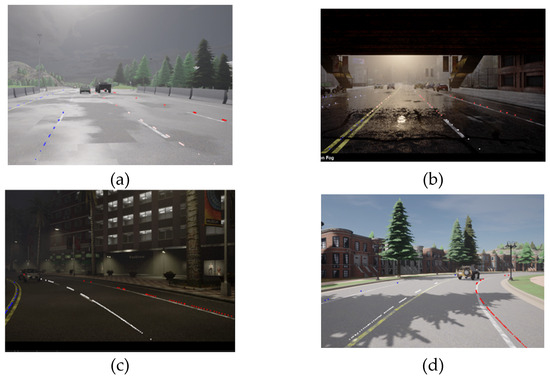
Figure 3.
Examples of environmental scenarios used and generated in Carla: (a) highway during the day and cloudy; (b) rain, urban; (c) night, urban; (d) day, clear sky, suburb.
The CARLA simulation environment offers a structured approach to autonomous vehicle development by integrating training capabilities with systematic evaluation methodologies. This dual functionality allows researchers to develop autonomous systems within a controlled virtual environment and subsequently analyze their performance through comprehensive feedback mechanisms, facilitating both ADAS system validation and the identification of enhancement opportunities for autonomous driving technologies.
2.2. U-Net Architecture
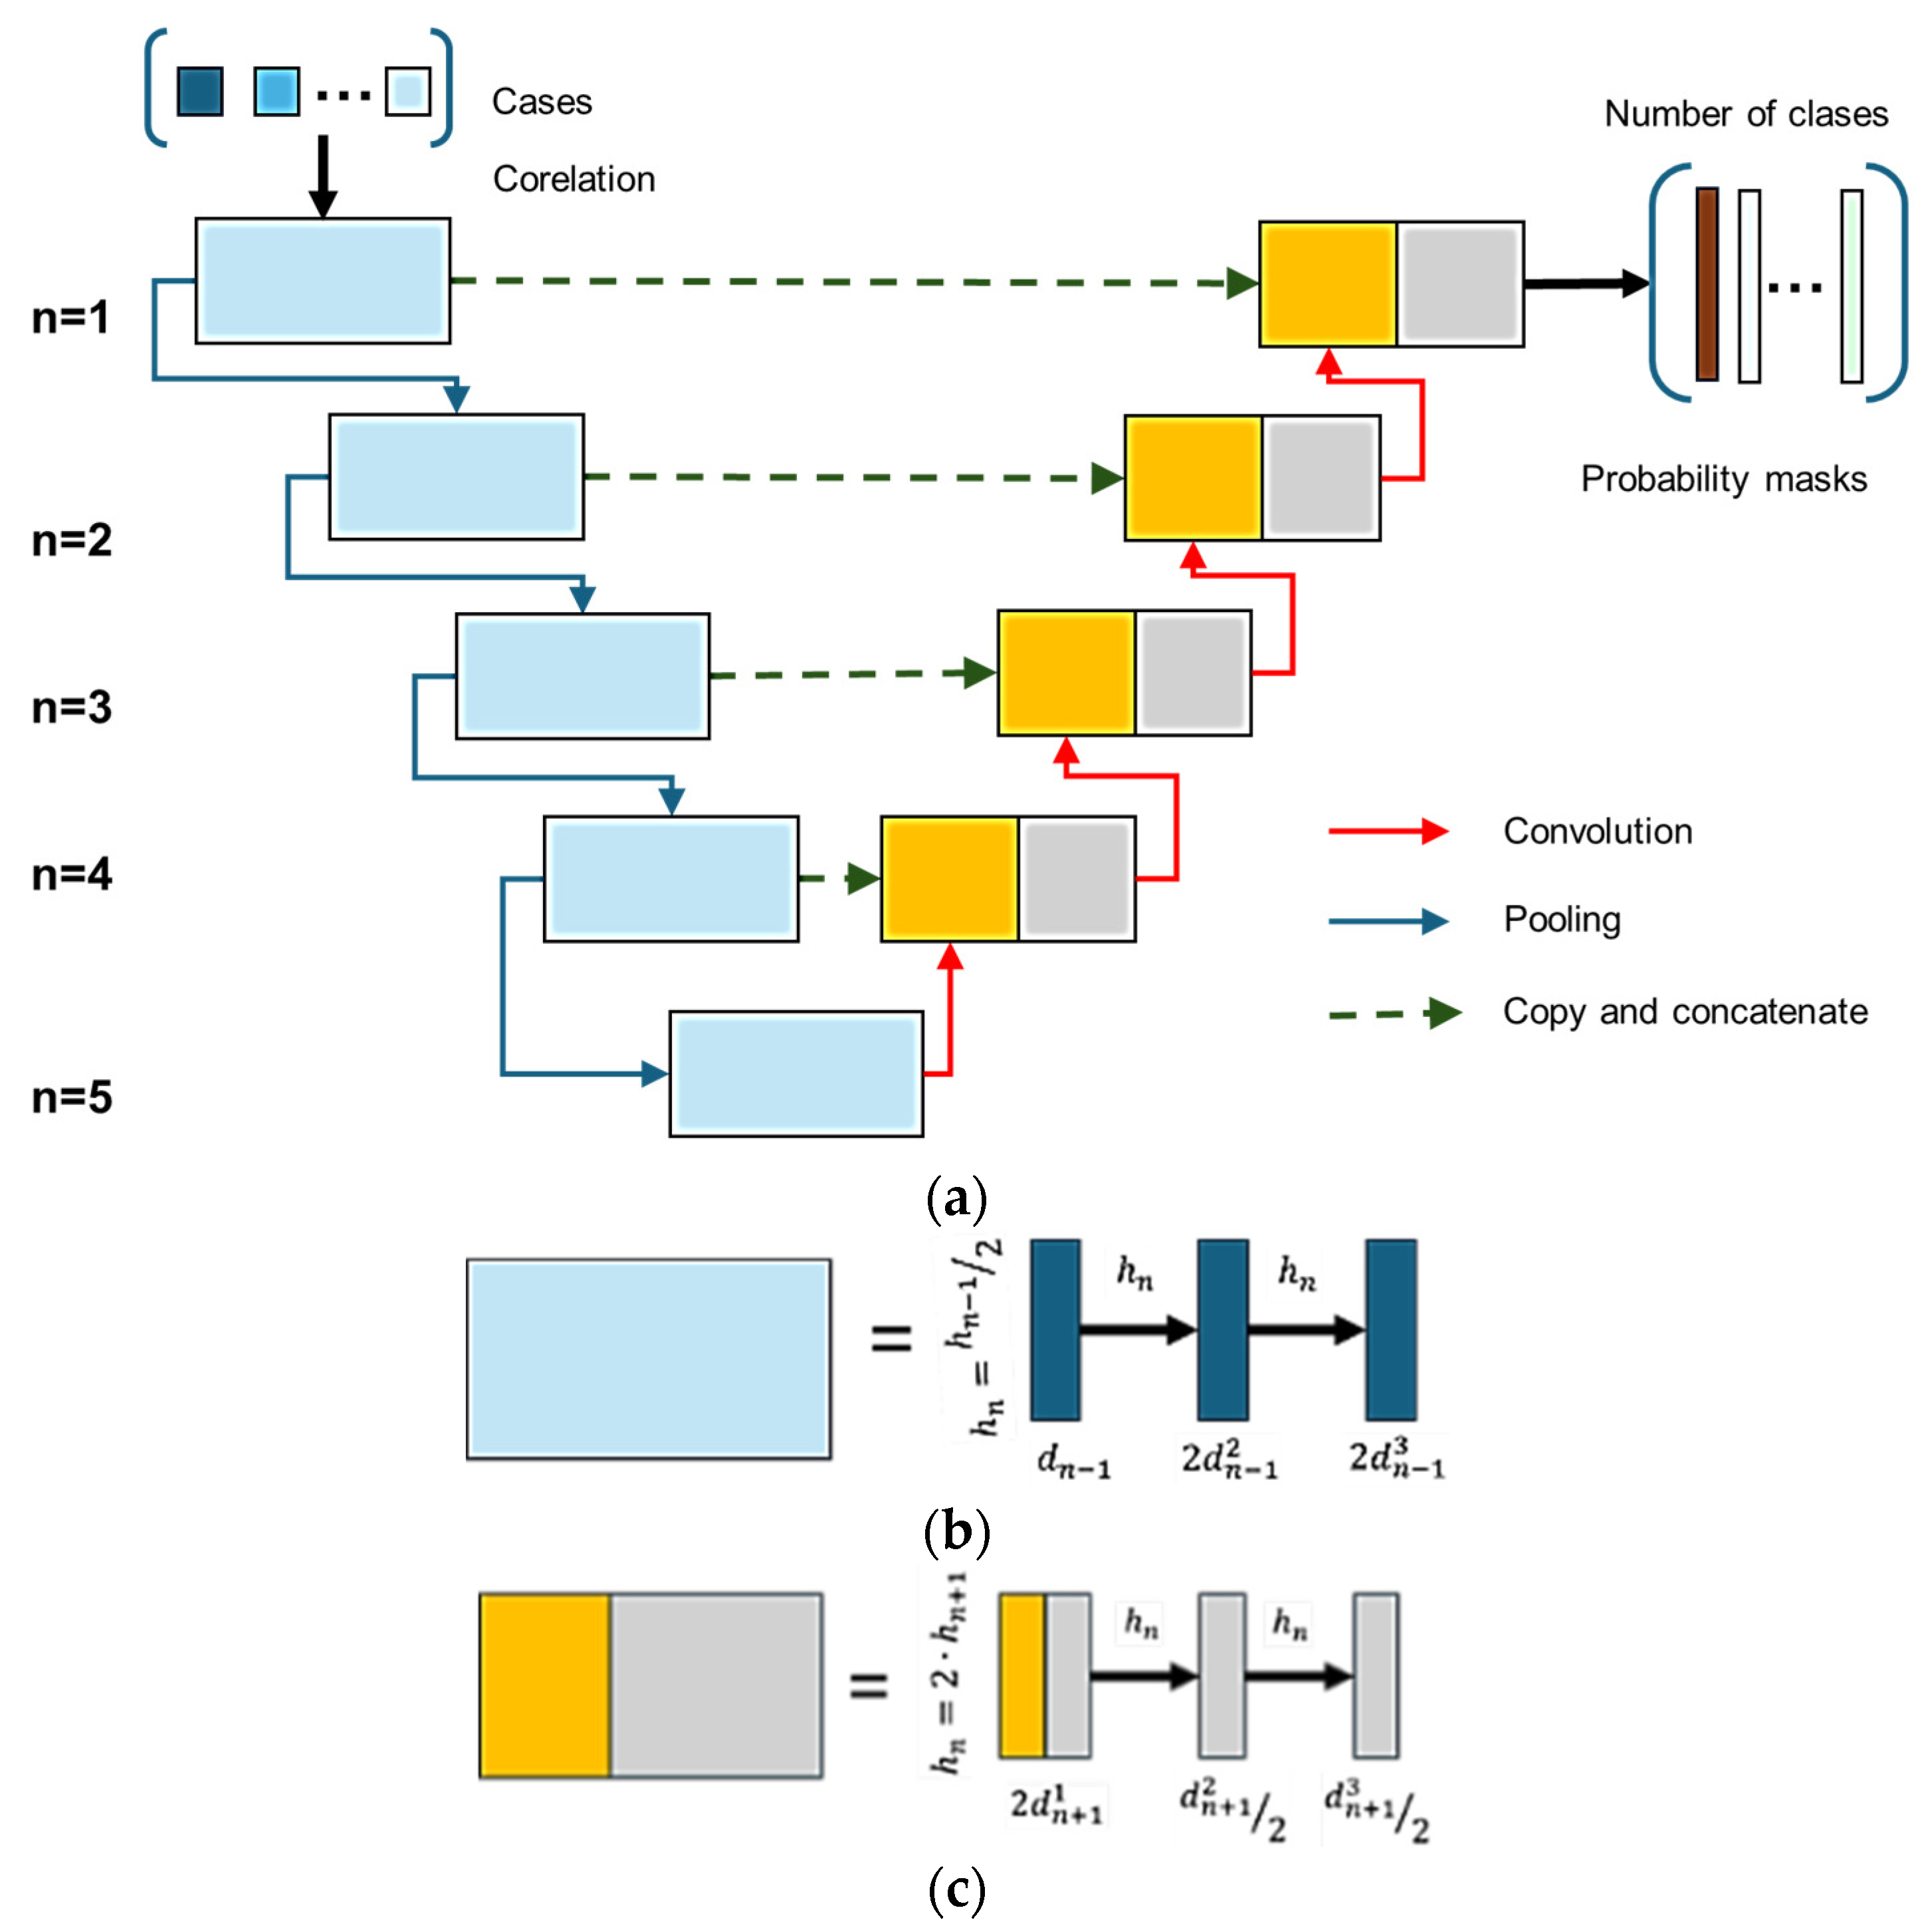
Semantic image segmentation is a fundamental problem in computer vision, with extensive applications in various fields such as medicine, autonomous driving, facial recognition, etc. One of the most popular architectures used for this task is U-Net, proposed by Ronneberger et al. for medical image segmentation [29]. U-Net is a convolutional neural network (CNN) with a symmetric encoding–decoding architecture, capable of achieving accurate segmentation of objects in an image through a combination of convolution and deconvolution layers (Figure 4). Due to its structure, U-Net can capture both local and global features, which makes it extremely efficient for segmentation tasks where fine details are essential [30], and in general the U-Net architecture consists of two main components: the encoder (contracting path) part and the decoder (expanding path) part.

Figure 4.
Structure and functionality of the U-Net architecture: (a) general architecture and information transfer paths; (b) structure of the pooling blocks; (c) structure of the convolution blocks (adapted from [29]).
The encoding part (contracting path) is responsible for mapping the features in the image. The encoding process is performed through a series of convolution and pooling operations, with the following steps. Two successive convolutions of size 3 × 3 pixels are applied, each followed by a ReLU activation function. Max-pooling with a 2 × 2 window is used to reduce the spatial dimension of the image while preserving the essential features. At each level, the number of convolutional filters is doubled to retain more complex information (e.g., 64 → 128 → 256 filters). The decoding part (expanding path) is responsible for reconstructing the segmentation at the original image size. It uses up-sampling and convolution layers to increase the spatial dimension of the image. The feature maps from the encoder and decoder are concatenated, which allows the fine details that were lost in the pooling step on the encoding side to be preserved [31]. Two successive 3 × 3 convolutions are applied, each followed by ReLU activation, and the last layer applies a 1 × 1 convolution to reduce the number of channels to the desired number of classes. With this approach, the U-Net architecture combines global information (high levels of the encoder) with local information (fine details preserved through skip connections), ensuring accurate segmentation.
It should be noted that in addition to the two main components, an innovative element of U-Net is the use of skip connections, which connect the corresponding layers between the encoding and decoding structures. These connections help to preserve fine details (which would otherwise be lost due to pooling operations) and speed up the training process, reducing the learning difficulty of image reconstruction [32] and improving the segmentation of small objects (since information from high resolutions is efficiently reused). U-Net is one of the most popular architectures for semantic segmentation due to its ability to combine information at different levels and preserve fine details of objects.
2.3. Hybrid U-Net Architecture
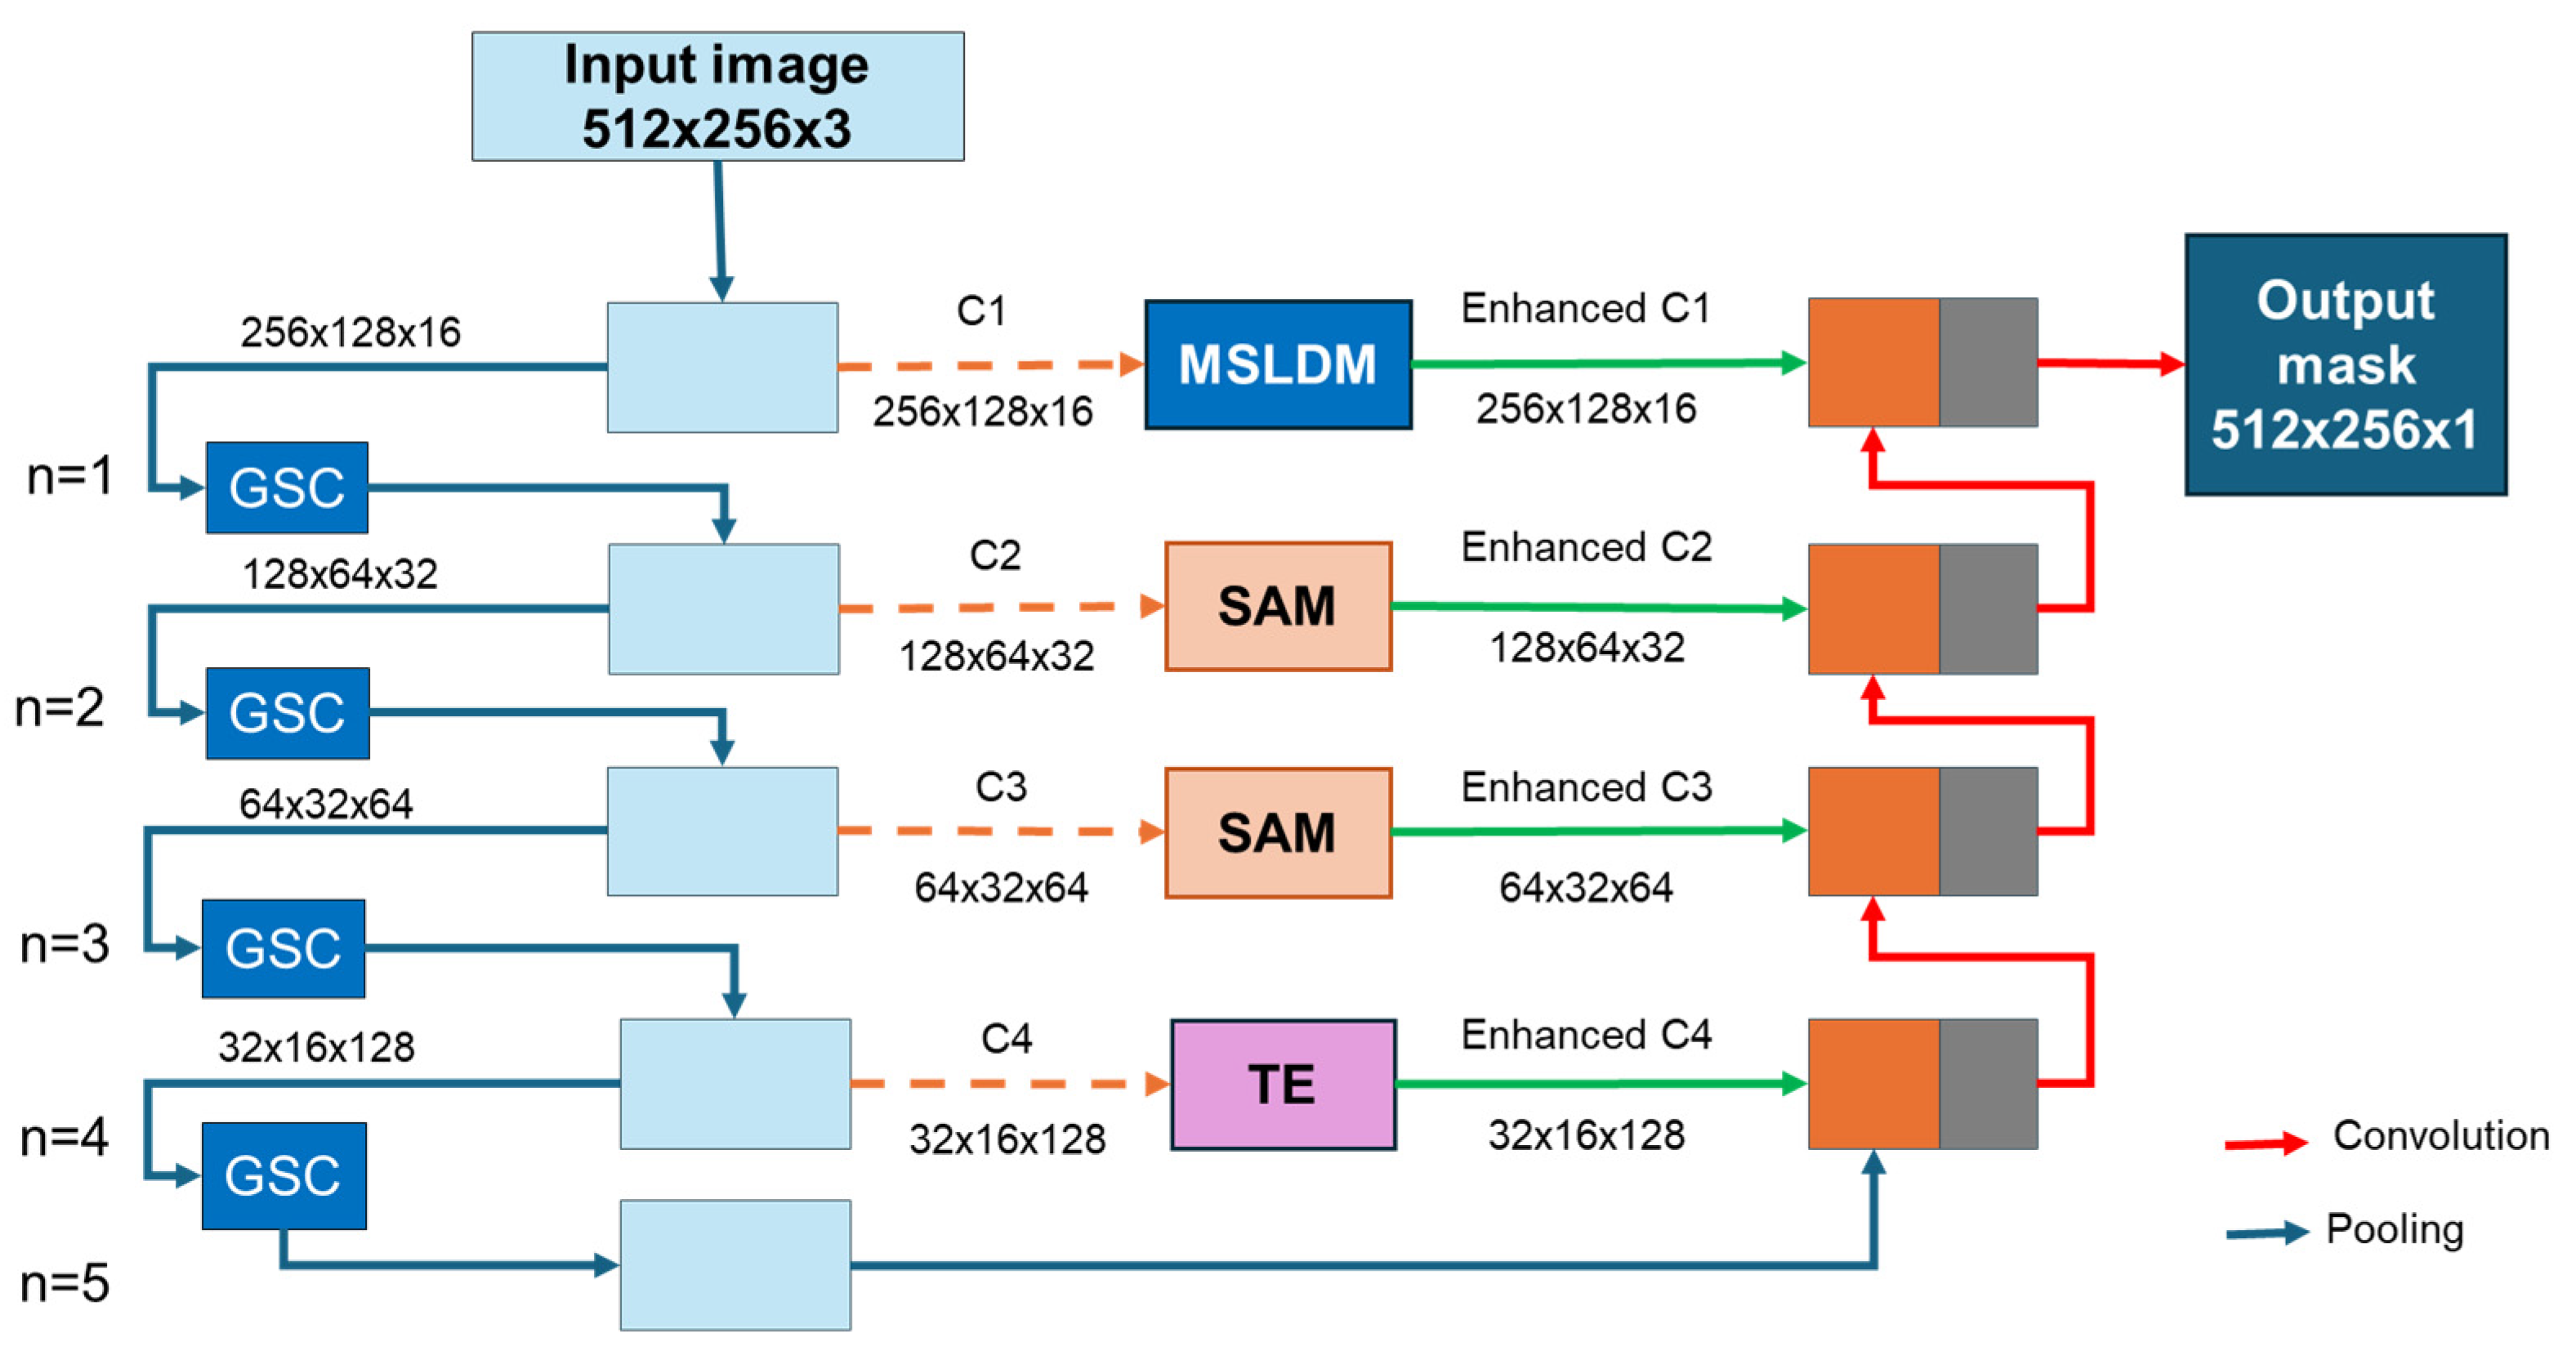
The proposed architecture, called hybrid U-Net (with the architecture shown in Figure 5), represents a significant extension of the classic U-Net model, addressing its limitations in capturing global relationships, adaptability to scale variations, and sensitivity to geometric structures. The model is built on a U-Net-specific encoder–decoder scheme but adds a series of specialized attention and geometric processing modules to its path. In the encoding branch, the model uses GSC (geometrical skip connections) modules, which include geometric positional mapping of the image, generating perspective weight in favor of lower regions. These connections introduce a dynamic distance map, which allows the model to be more robust to perspective variations, essential in the process of lane line detection.

Figure 5.
Hybrid U-Net network architecture (GSC—geometrical skip connection, SAM—spatial attention module, MSLDM—multi-scale detection module, TE—transformer encoder).
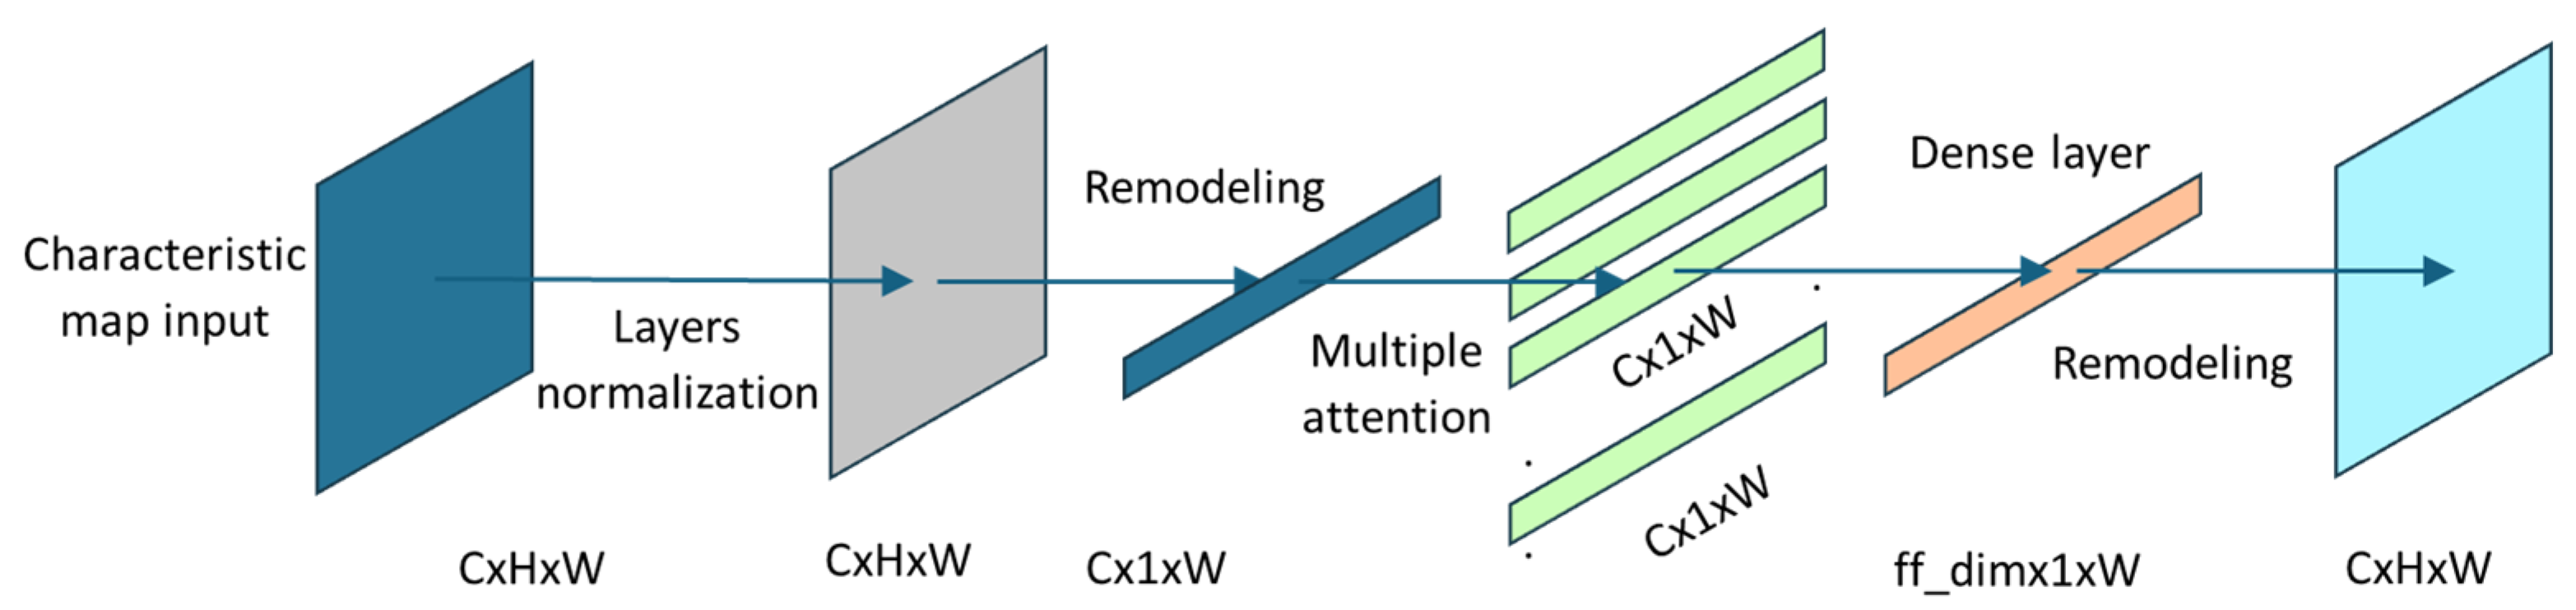
The integration of the transformer encoder (TE) in skip connection addresses the fundamental challenge of capturing long-range spatial dependencies essential for lane detection. The TE is strategically placed at the deepest skip connection (c4 level) where spatial dimensions are reduced, making the computational complexity manageable (Figure 6). The implementation uses four attention heads with 32 key dimensions, enabling simultaneous capture of different spatial relationships. The spatial dimensions are flattened (H × W → sequence length) to apply self-attention across all spatial positions, allowing the model to connect distant lane segments interrupted by occlusions. The TE block incorporates pre-normalization and residual connections, following the standard transformer architecture. A two-layer MLP with ReLU activation processes attention output, expanding to 256 dimensions before projecting back to the original channel size, enabling complex feature transformations.

Figure 6.
Transformer encoder structure and codification process.
In the decoding branch, attention modules are used in intermediate skip connections to dynamically adjust the importance of channels and spatial regions. Attention modules allow the model to focus on relevant areas in the image, thus improving segmentation.
At the highest resolution level, the hybrid U-Net model uses a dedicated multi-scale lane line detection (MSLDM) module. This module employs two categories of kernels:
- Vertical kernels (7 × 1, 6 × 2, 5 × 3) capture lane boundaries and vertical structures;
- Horizontal kernels (1 × 7, 2 × 6, 3 × 5) focus on curved lines.
All feature maps are concatenated and processed through a 3 × 3 convolution, followed by sigmoid activation to generate attention weights that modulate the input features.
An important aspect of this new proposed architecture is the balance between performance and computational efficiency, maintaining reasonable values of the performance parameters with a competitive inference time. By integrating specialized modules, the proposed architecture combines local and global learning, ensuring generalization on diverse data.
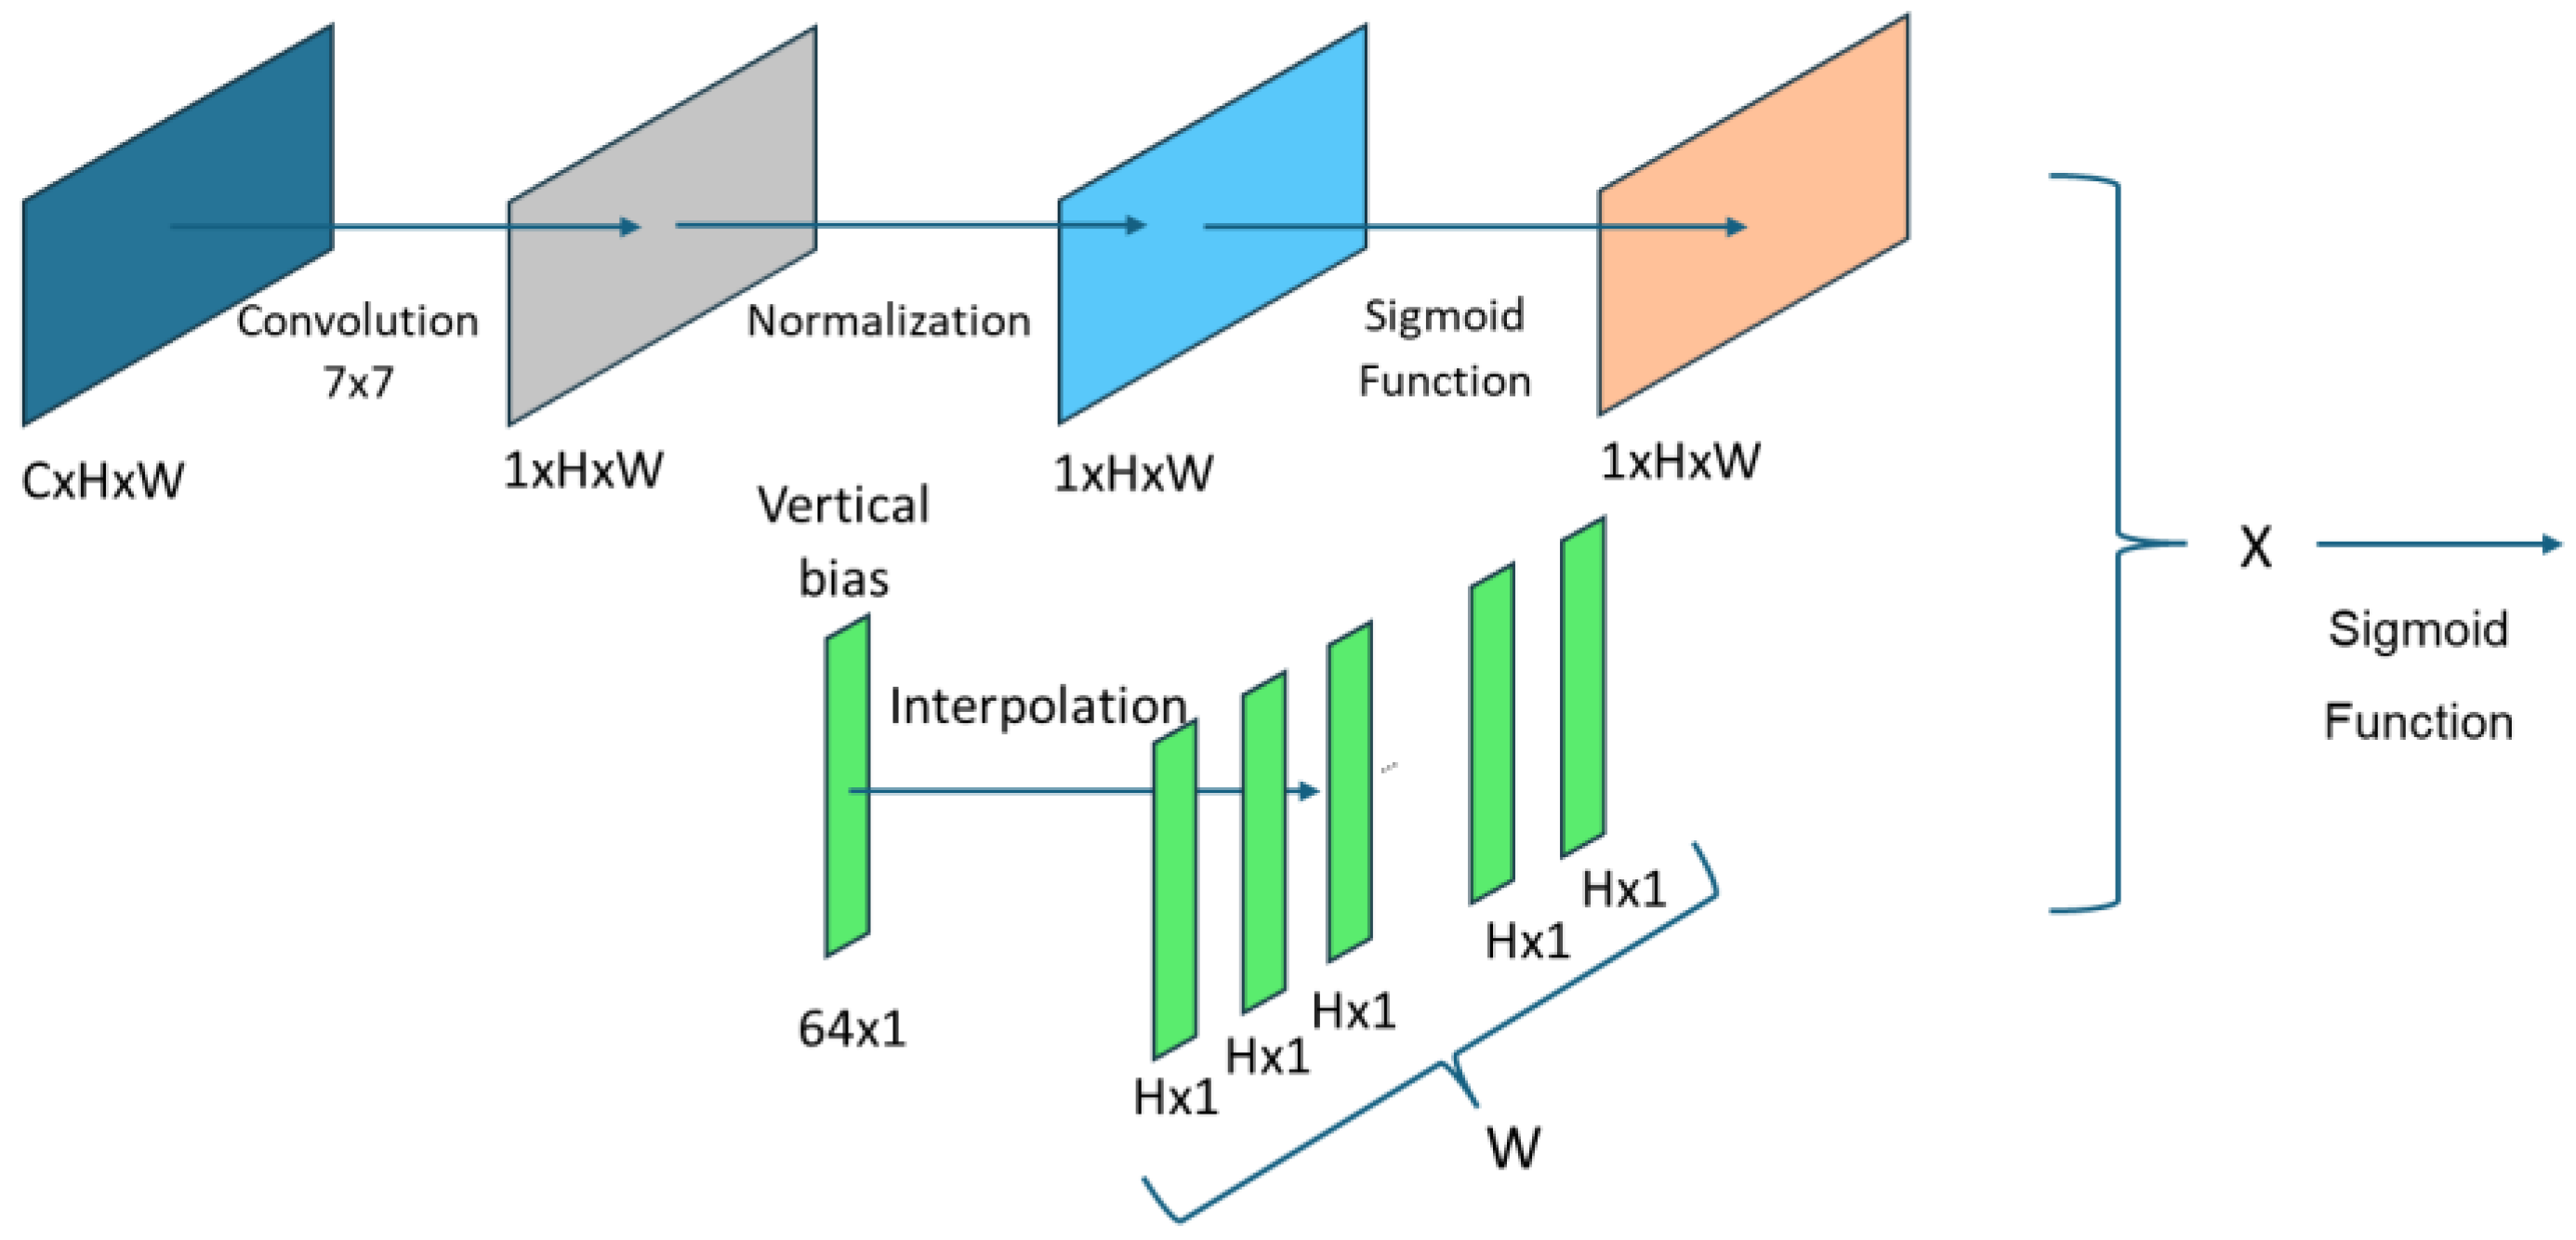
By integrating a spatial geometric attention module (Figure 7) and a multi-scale feature extraction module, the proposed hybrid U-Net model addresses certain limitations of classical CNNs in the specific context of lane detection, particularly by enhancing geometric sensitivity and capturing context at multiple spatial scales. This makes the model well-suited for advanced driver assistance systems (ADASs) that rely on precise lane interpretation.

Figure 7.
Spatial attention module structure.
In conclusion, the hybrid U-Net represents an innovative architectural approach, combining local feature robustness, global contextual understanding, and geometric adaptability within a unified neural network framework.
2.4. Simulation Conditions
The robustness and efficiency of the hybrid U-Net model was tested by using a mixture of real and virtual data. The real data used images from the TuSimple database, and the virtual data were taken from the Carla virtual simulation environment (which allowed the integration of images from complex scenarios, both in terms of traffic and environmental conditions). A training session was performed that included only images generated by the Carla simulation environment (3890 labeled images), only images taken from the TuSimple database (3626 labeled images), and an equal mix of images from Carla (1750 labeled images) and TuSimple (1750 labeled images). A notable limitation of our current study is the lack of systematic categorization and performance analysis across specific environmental and road conditions within the Carla dataset. While our 3890 Carla-generated images encompassed diverse scenarios including urban environments, highways, suburban areas, and various weather conditions (day, night, rain, cloudy), we did not perform a systematic breakdown of model performance according to specific scene types (e.g., fog density levels, intersection complexity, highway vs. urban performance). The small number of data selected, and the hardware used were assumed by the authors, one of research directions being to be able to obtain superior results with reduced computational resources.
For the comparative analysis of the hybrid U-Net model’s performance, the following cases related to changes in the basic U-Net network were considered:
- Basic U-Net;
- U-Net modified with GSC;
- U-Net modified with TE;
- U-Net modified with MDLSM;
- Hybrid U-Net.
The analysis of the results was carried out taking into account four performance indicators (or quality parameters): mean intersection over union (mIoU), F1 accuracy score, inference time, and the number of frames processed per second (FPS).
The mIoU parameter is a measure of the overlap between the predicted segmentation and the actual ground segmentation of the traffic lane (Equation (1)). It is calculated as the overlap area divided by the union area between the predicted and ground truth segments. It provides a single metric that summarizes the overall performance of the segmentation model:
Another important parameter is the F1 score, a parameter that combines two factors, precision and recall (Equation (2)). The precision factor is defined as the fraction of detected lane pixels that are correct, and the recall factor represents the fraction of ground lane pixels that are detected:
The inference time (speed) is a critical performance parameter for real-time applications, since the implementation and architecture of a neural network on mobile devices has many stringent requirements regarding latency and computational resources [33]. The FPS parameter considered in the study measures how many frames can be processed per second and is an important factor in the development of ADAS systems. This is because another major challenge of incorporating an ADAS vision algorithm is running it in real time on the embedded hardware platform, and the frame rate of the overall driver assistance system is limited by the camera frame rate and the application processing time [34].
In order to quantify and compare the efficiency of the neural networks (hybrid U-Net vs. U-Net) in real time, the following notions were introduced: confidence and coverage. The confidence metric (Equation (3)) quantifies the average confidence of the neural network in classifying each pixel as belonging to a traffic lane, being expressed as the arithmetic mean of the probability values generated by the model. In Equation (3), each element pij represents the probability that pixel (i,j) is part of a lane, and H and W are the height and width of the input image:
On the other hand, the coverage metric (Equation (4)) evaluates the proportion of the image in which the prediction exceeds a certain confidence threshold τ, thus indicating the area detected as a traffic lane in the image, where τ is the decision threshold and 1 (pij > τ) = 1 if the pixel probability is higher than the threshold, otherwise 0. Both considered metrics are essential for the robust evaluation of the performance of semantic segmentation systems in autonomous applications:
The dataset was divided into training and testing sets: 80% of the dataset was used for training and 20% for testing. The training process used Adam optimizer (adaptive moment estimation—an optimization algorithm used in training DL models) and a learning rate of 10−4 [35].
The activities related to the experimentation and validation of the proposed hybrid model, as well as the acquisition of results after training the new hybrid architecture of the proposed and developed model, were carried out by recording real traffic images using an optical camera (Logitech web cam type c 920 pro HD (Logitech, Shanghai, China) with resolution: 1920 × 1080, automatic focus, 78 degree field of view, and 1.2x digital zoom), the captured information was then processed on a laptop (Asus tuf gaming f15 with 12th generation i7 processor, 2.3 GHz frequency, 16 GB of RAM, and an Nvidia GeForce RTX 3060 video card with 6 GB of RAM) using only the computer’s CPU. The training was performed on images of size 512 × 256 pixels.
3. Results
The results of the performance parameters of all the neural networks studied and obtained following the simulation and training processes are presented in Table 1, Table 2, Table 3, Table 4 and Table 5. The comparative performances of the U-Net and hybrid U-Net (newly proposed) neural network architectures, analyzed according to each parameter considered, are presented in Figure 8, Figure 9, Figure 10 and Figure 11. The results of lane line identification are presented in Figure 12, Figure 13, Figure 14, Figure 15, Figure 16, Figure 17 and Figure 18, with the comparative results using the basic U-Net architecture vs. hybrid U-Net, trained on the same dataset, presented in Figure 12, Figure 13, Figure 14, Figure 15 and Figure 16. Figure 17 and Figure 18 show the results obtained with hybrid U-Net in different environmental conditions (sun, clouds, night, influence of headlights when meeting other vehicles at night, heavy traffic). The roads for the real experiment were deliberately chosen because they had no marking or the marking was damaged.

Table 1.
Results obtained for U-Net network architecture.
Table 2.
Results obtained by implementing the GSC module in the U-Net network architecture.
Table 3.
Results obtained by implementing the TE module in the U-Net network architecture.
Table 4.
Results obtained by implementing the MSLDM module in the U-Net network architecture.
Table 5.
Results obtained for hybrid U-Net network architecture.
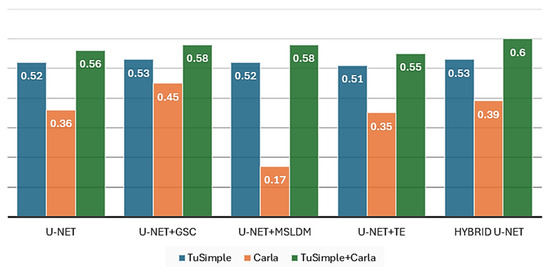
Figure 8.
Comparative analysis of the performance of U-Net architectures depending on the mIoU parameter.

Figure 9.
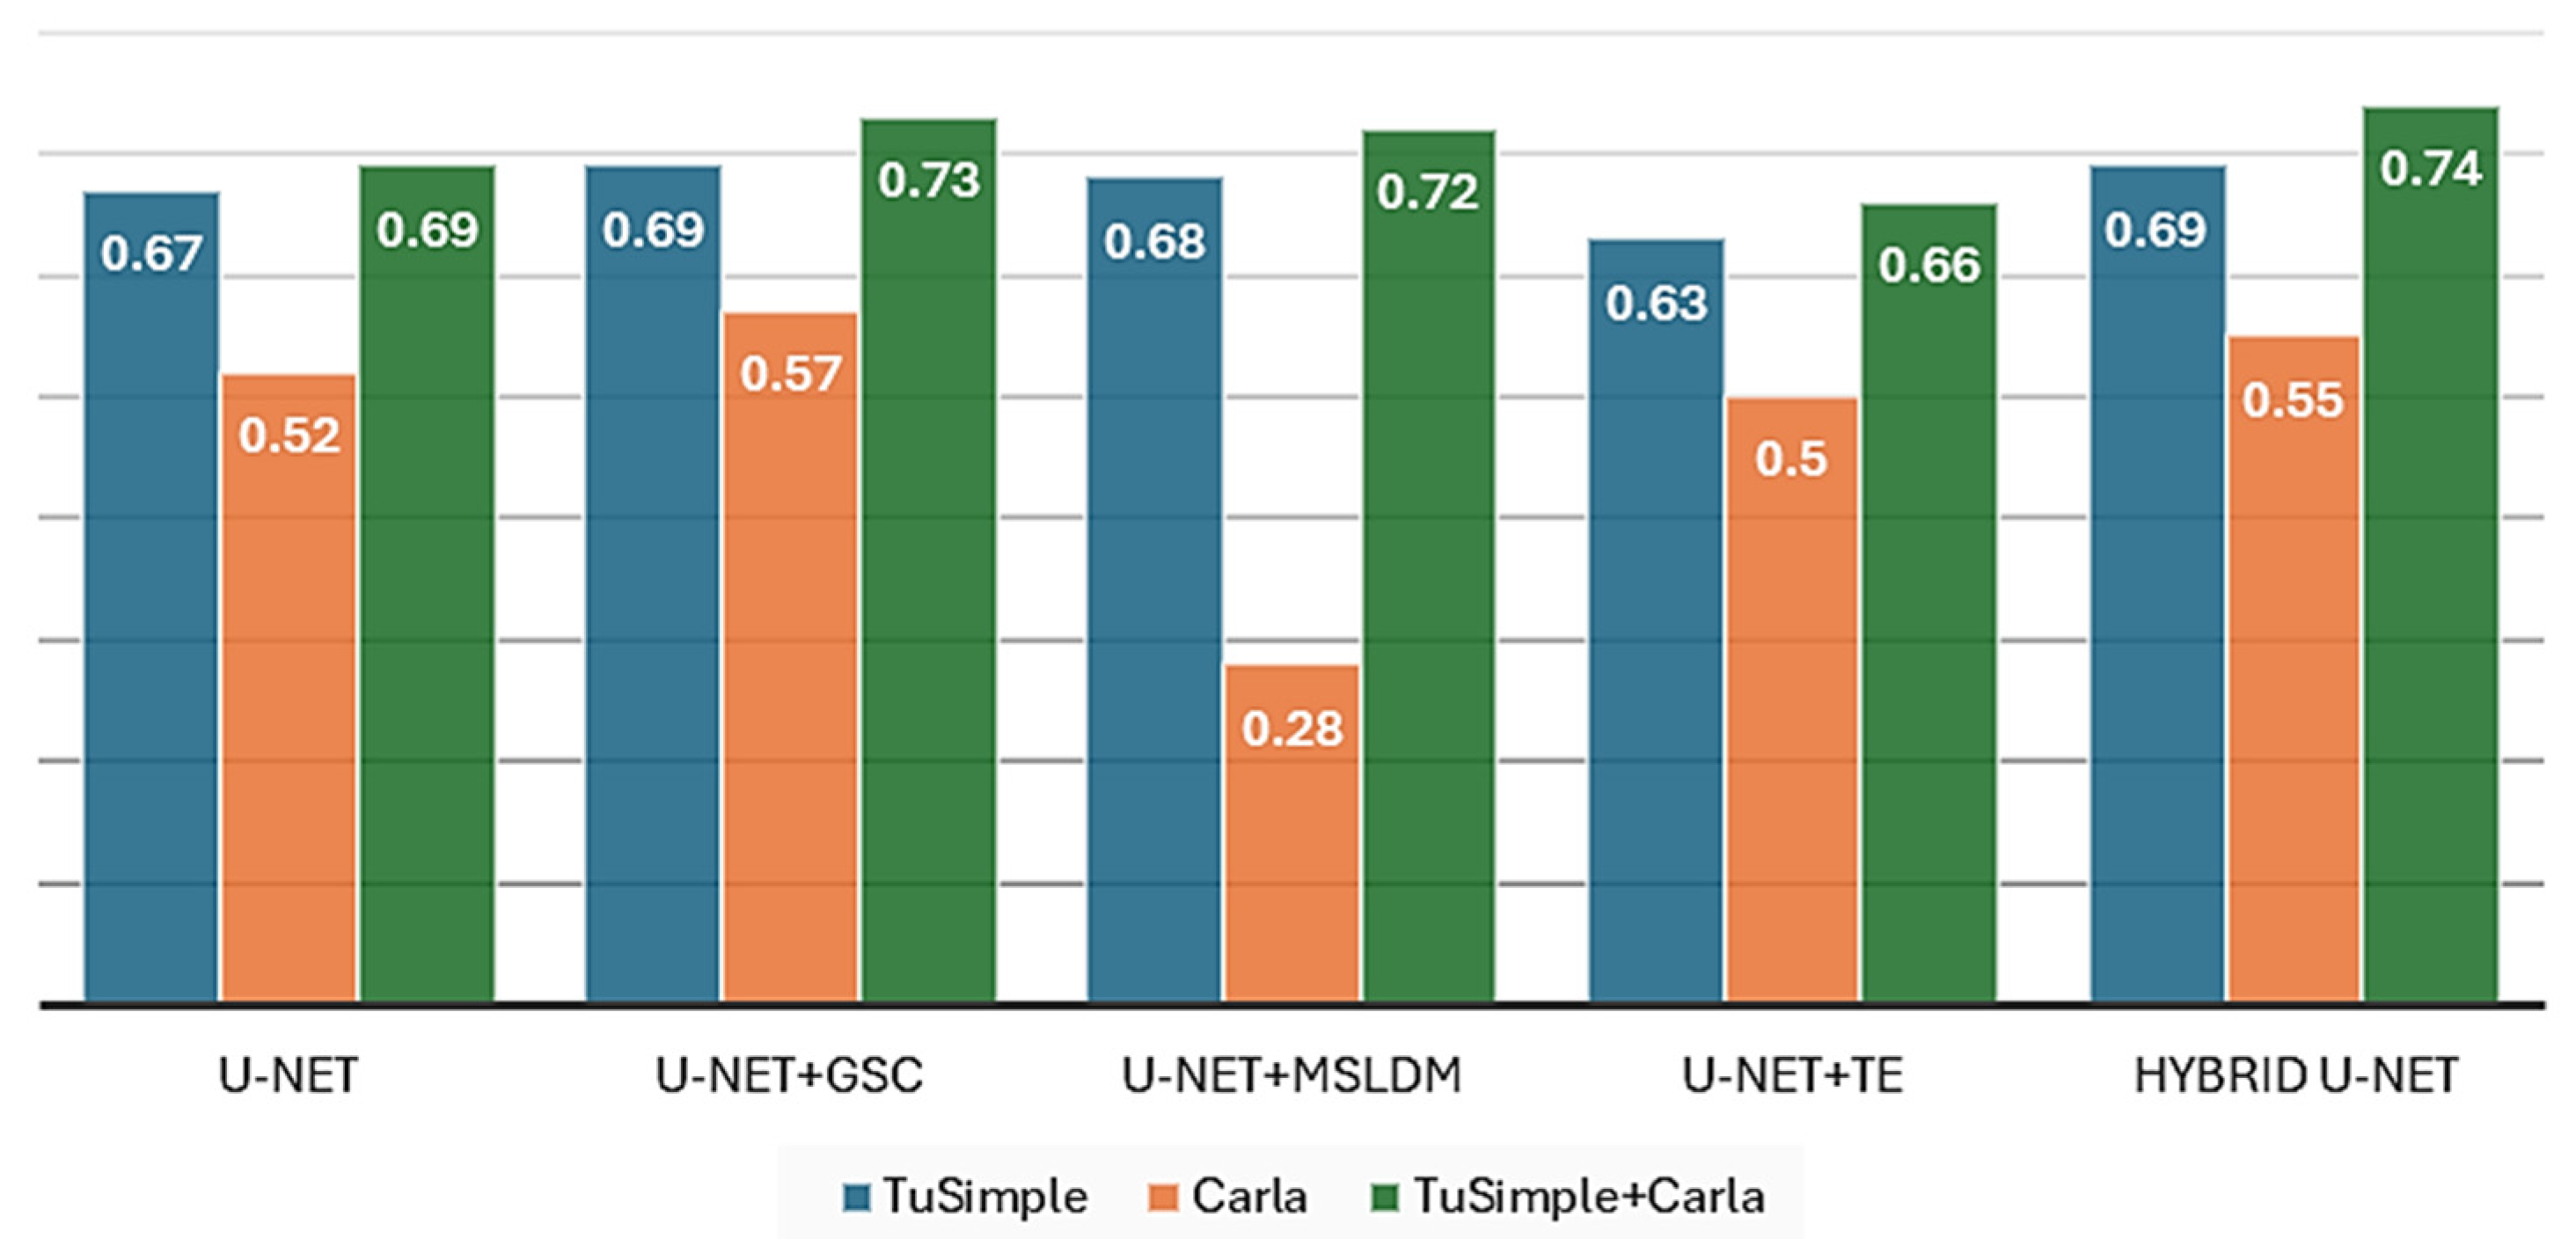
Comparative analysis of the performance of U-Net architectures depending on the F1 score parameter.

Figure 10.
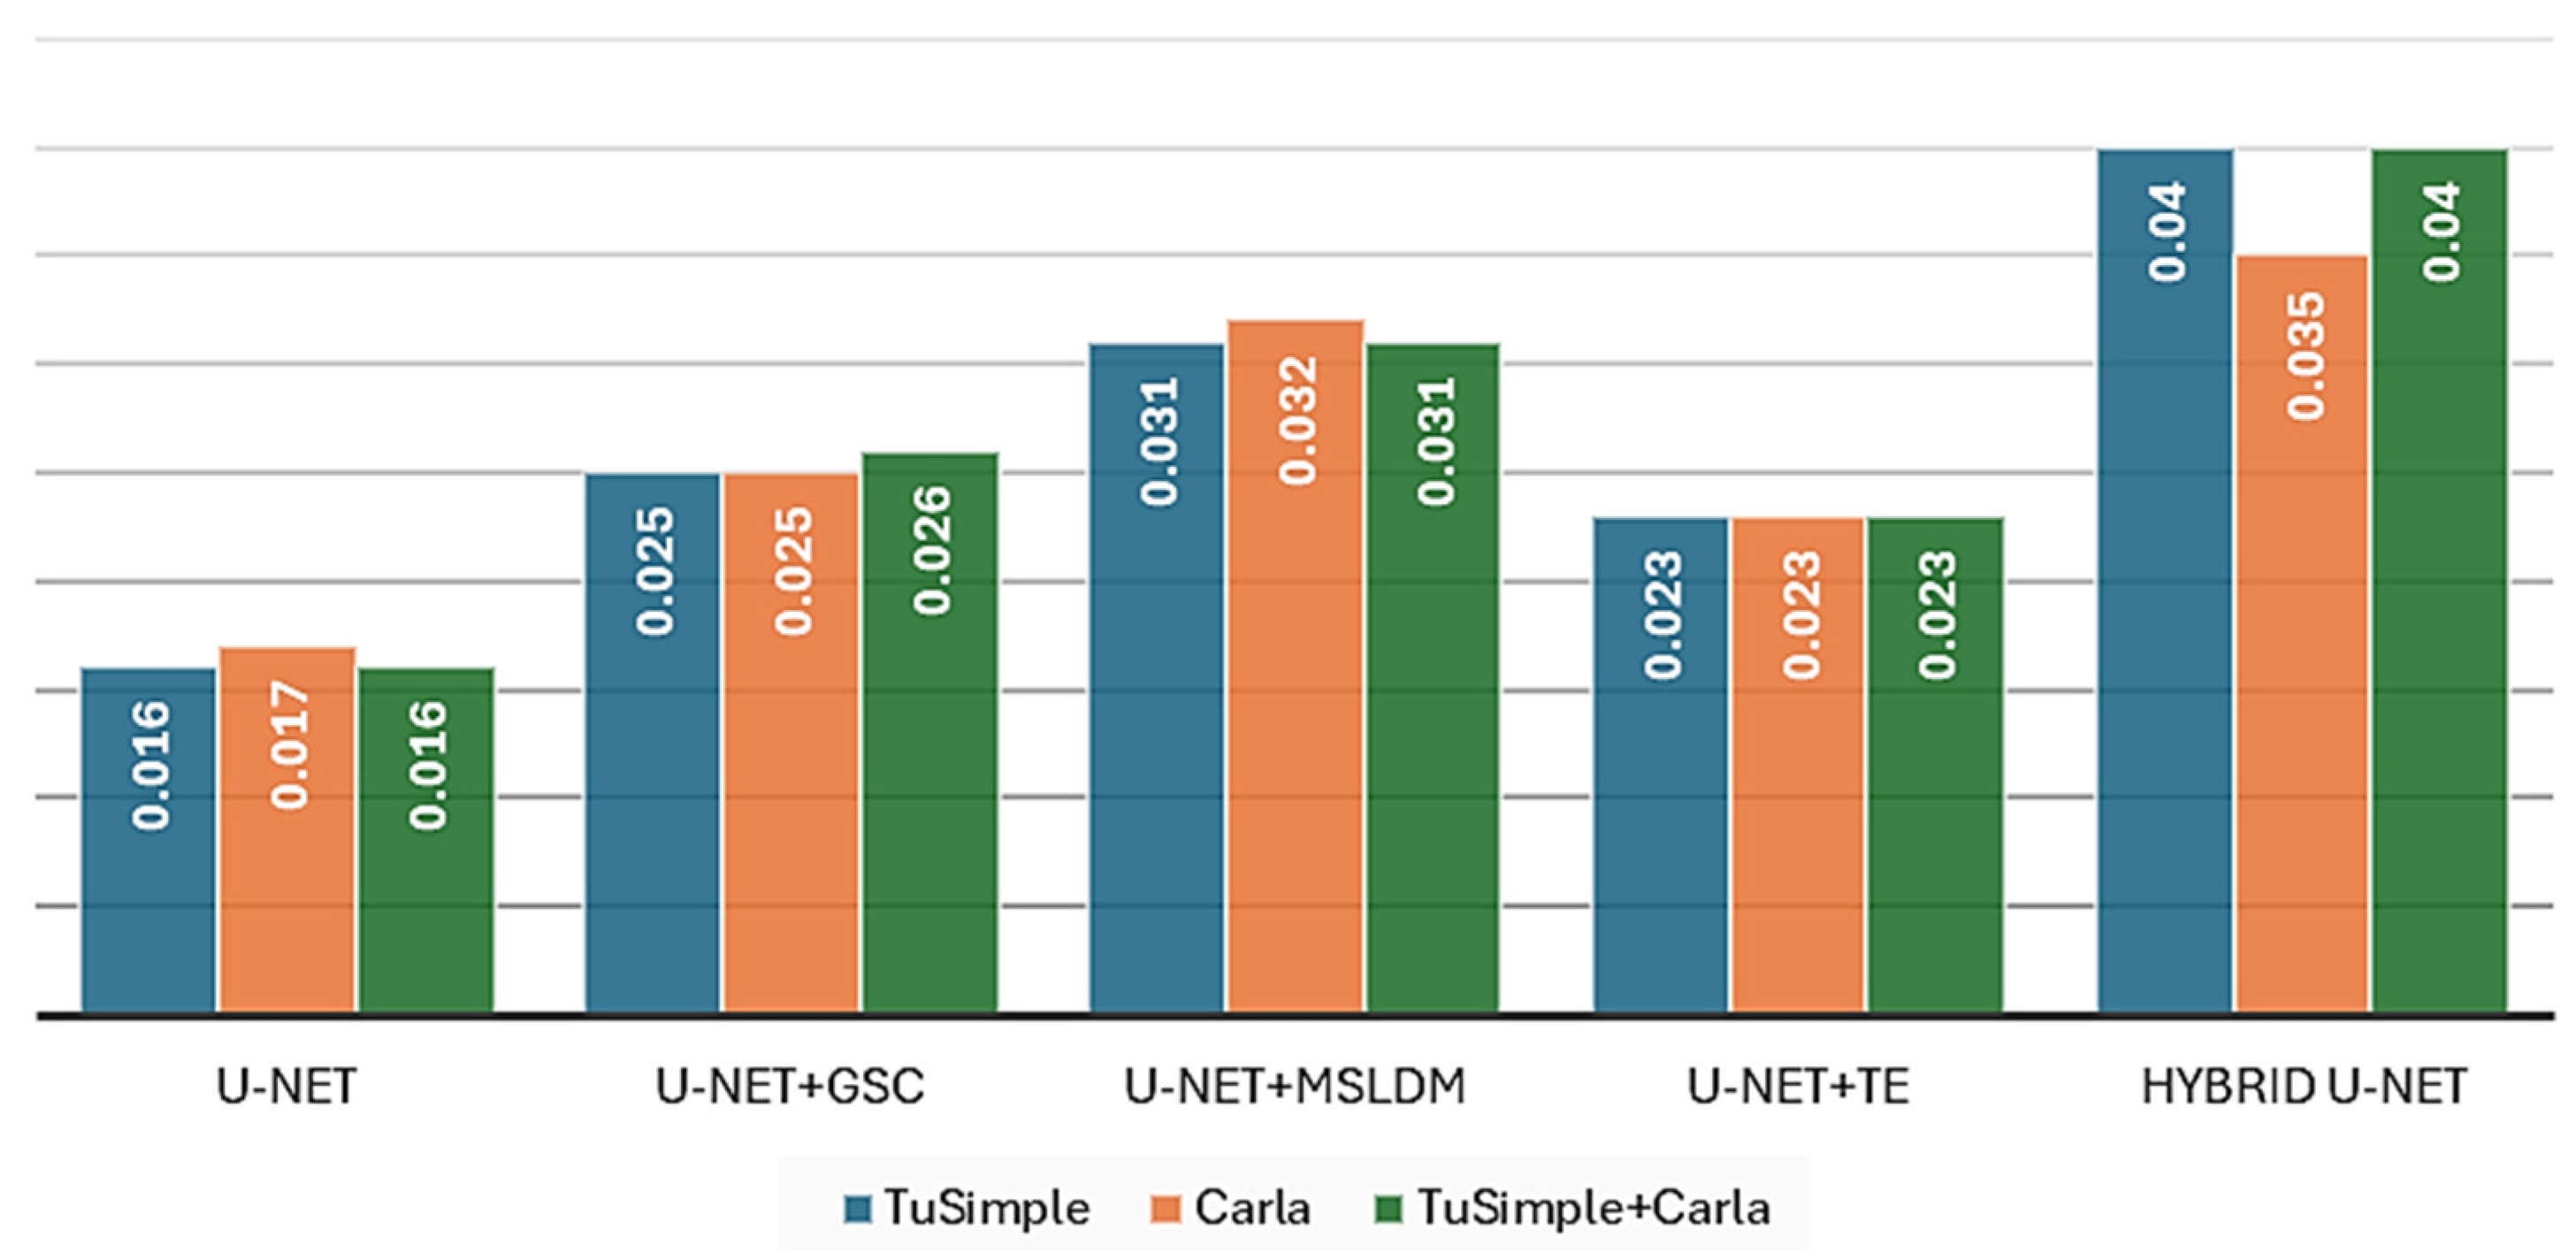
Comparative analysis of the performance of U-Net architectures depending on the inference time parameter.
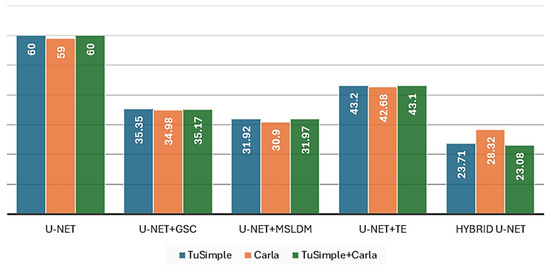
Figure 11.
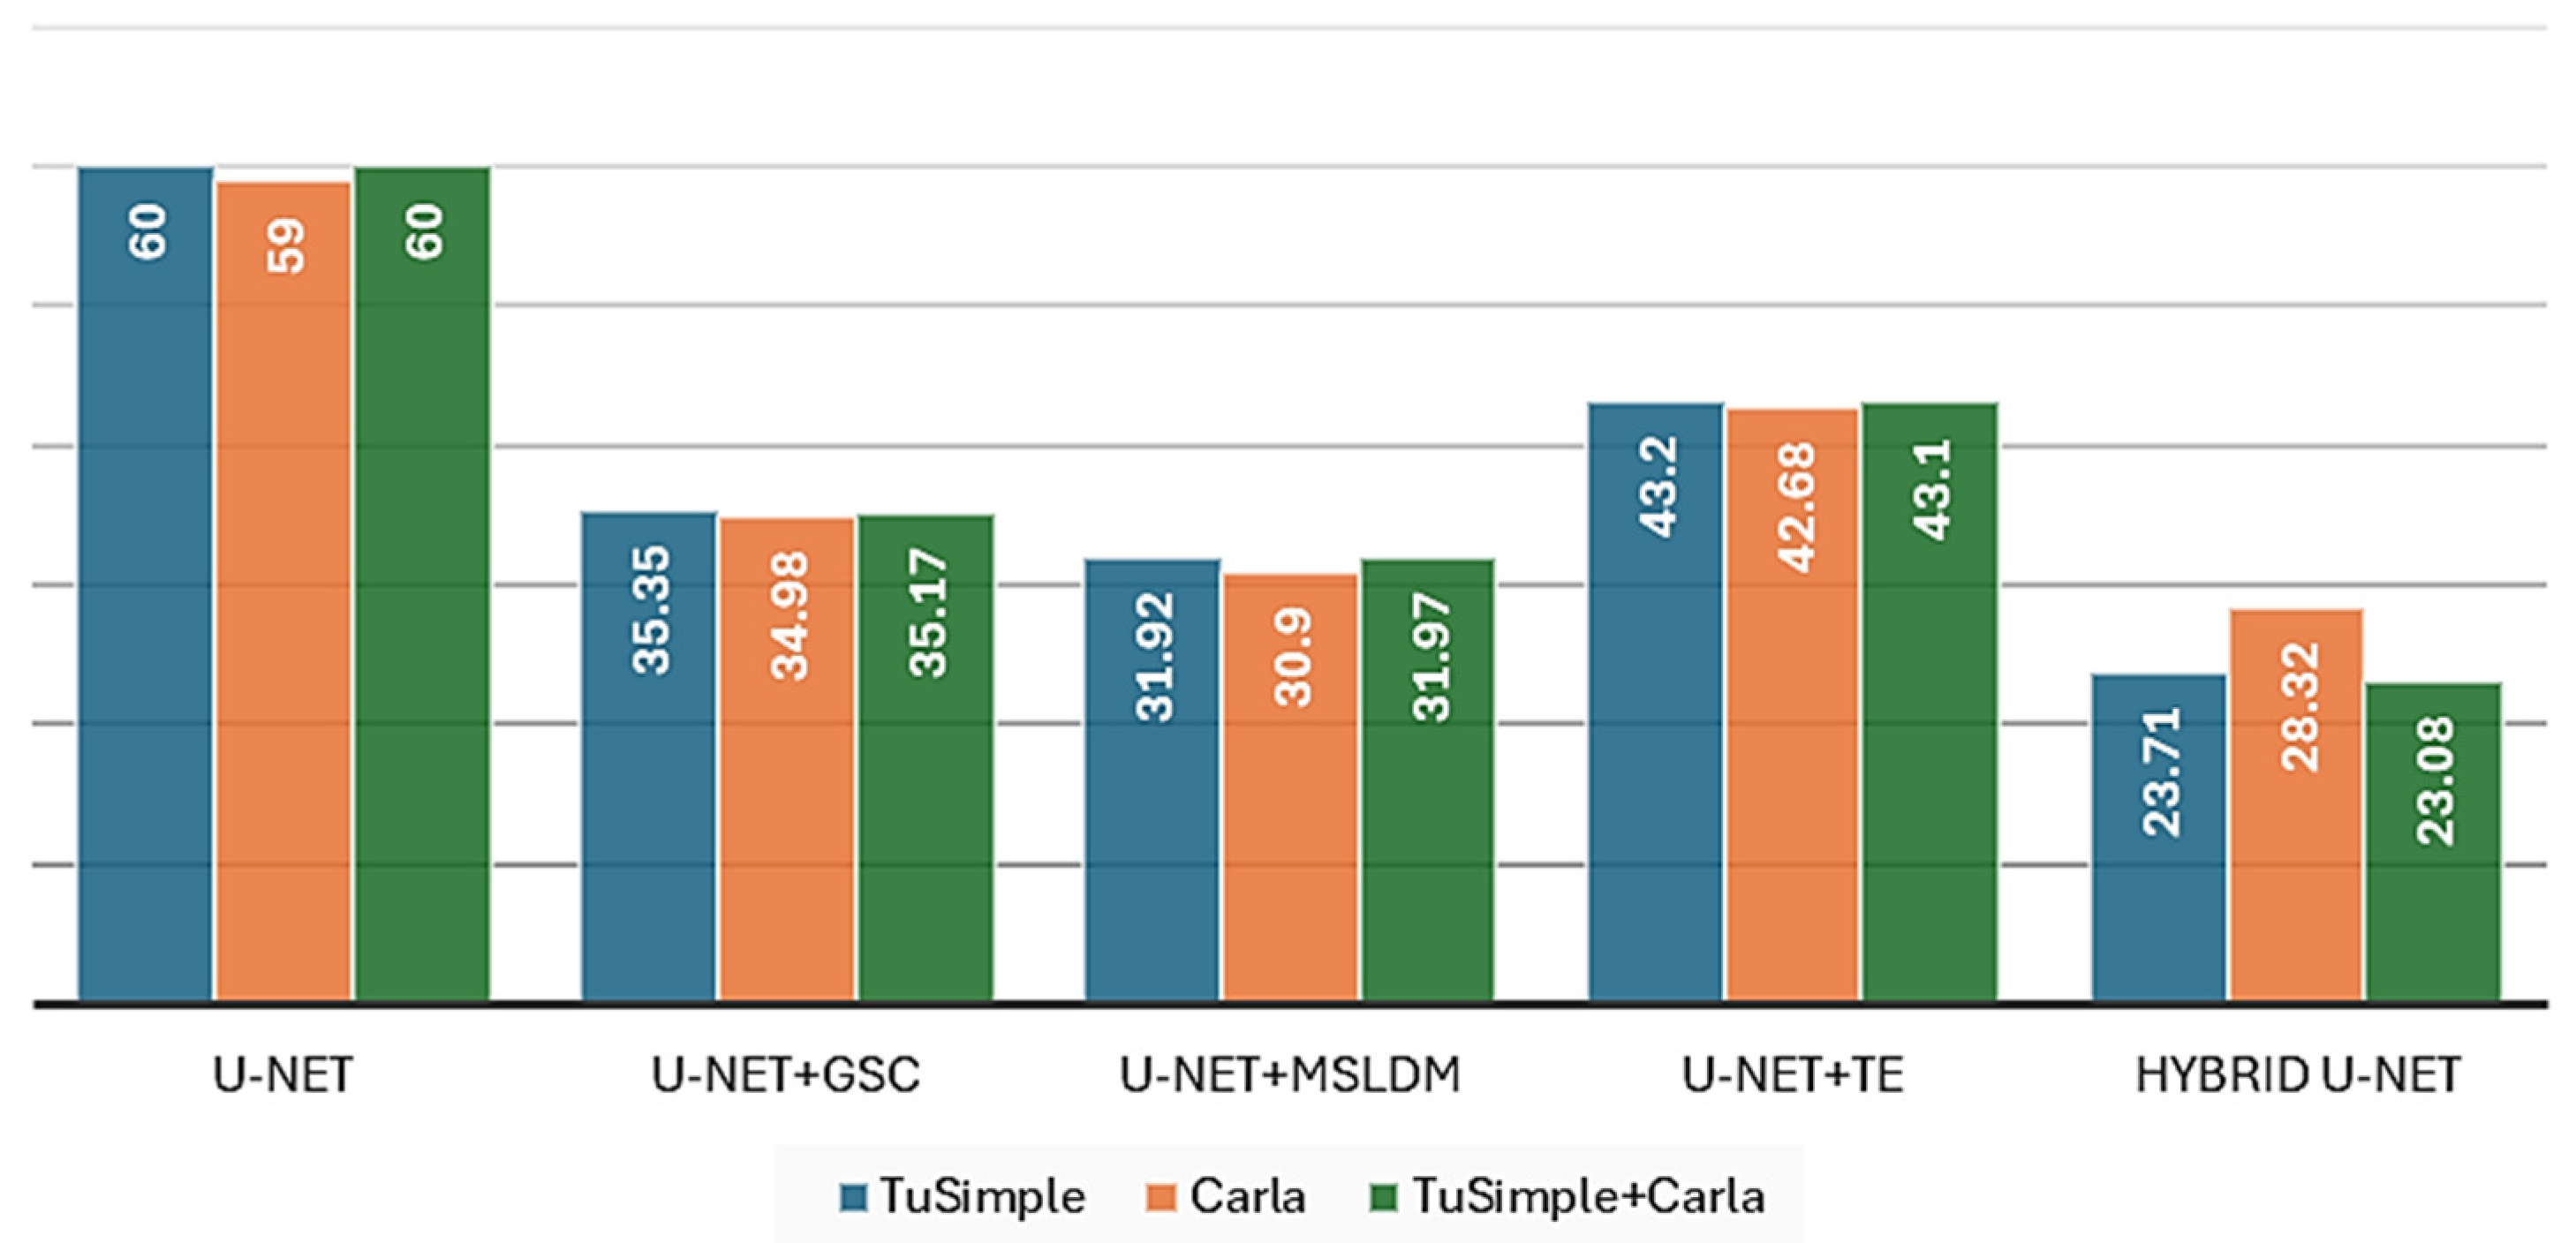
Comparative analysis of the performance of U-Net architectures depending on the FPS parameter.
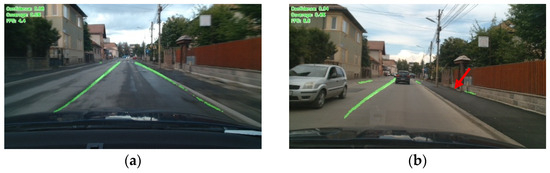
Figure 12.
Real-time results hybrid U-Net (a), U-Net (b)—urban area.
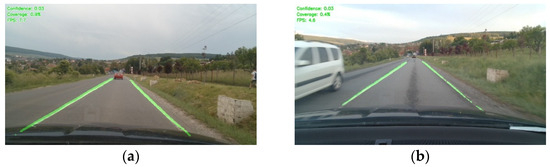
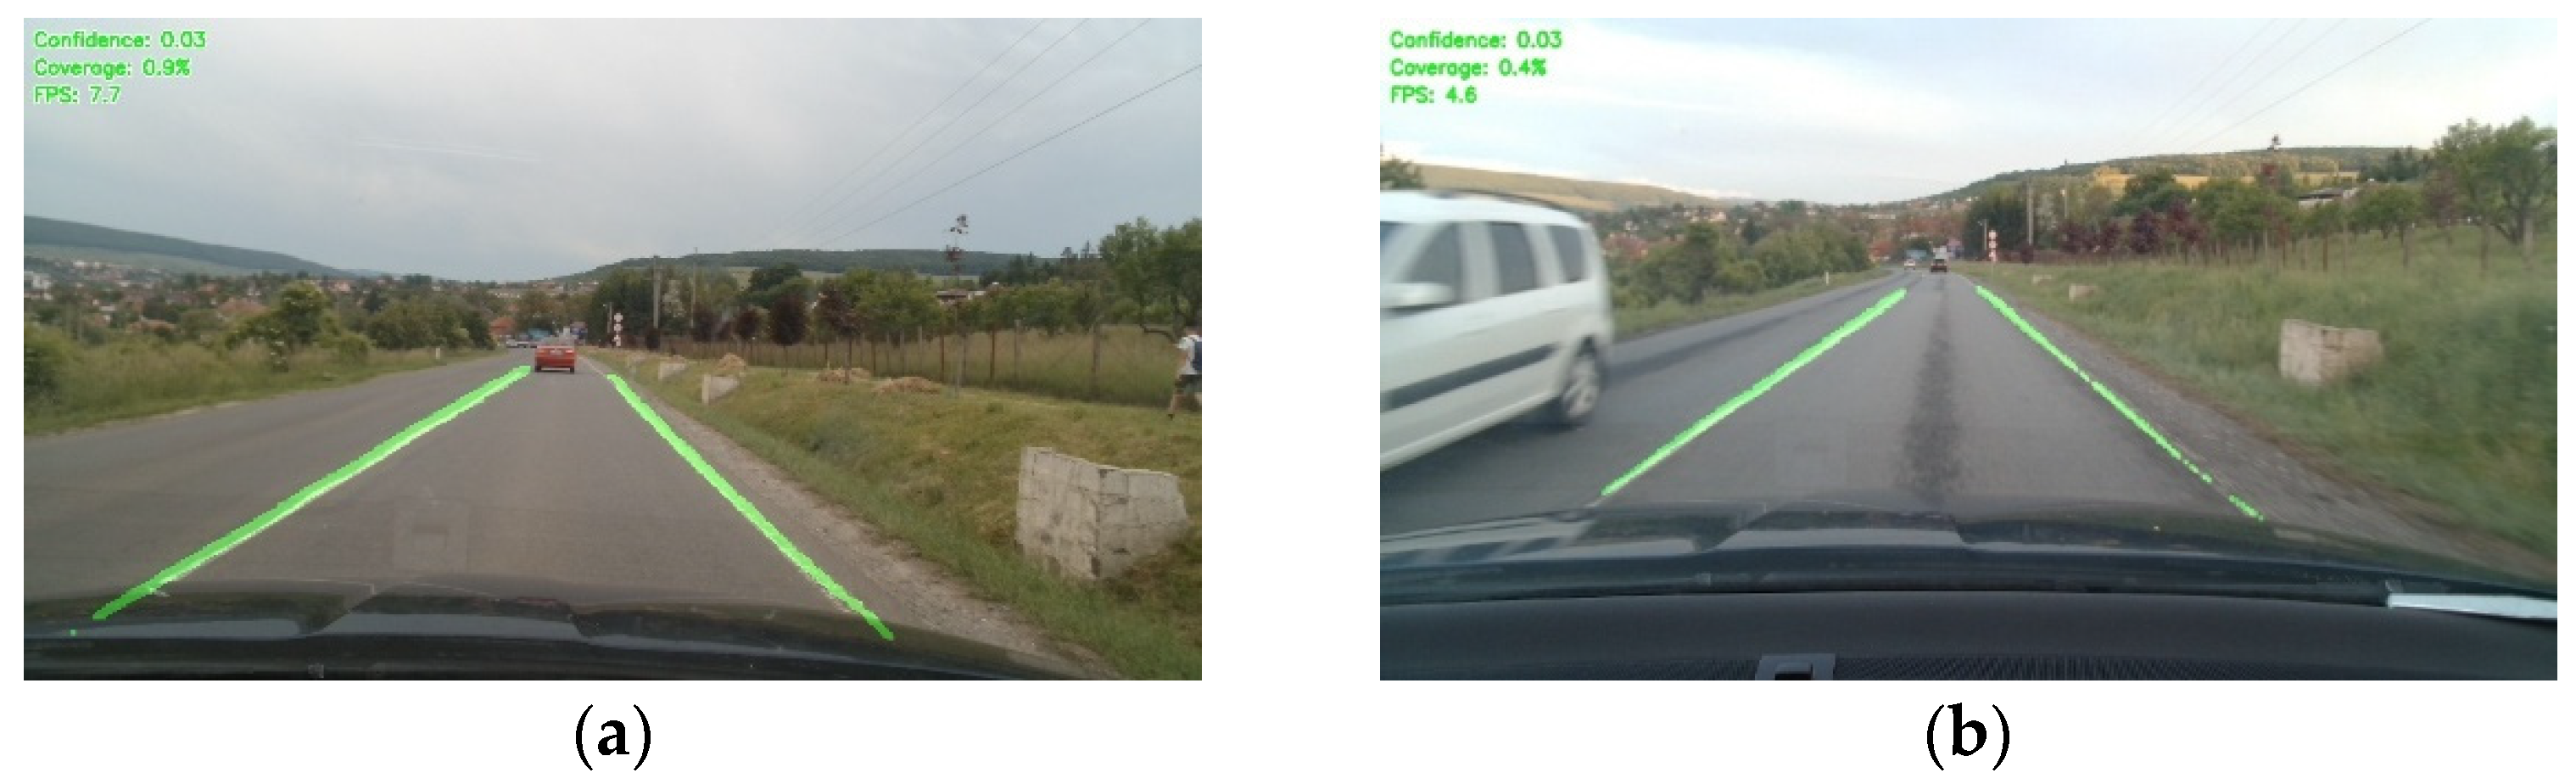
Figure 13.
Real-time results hybrid U-Net (a), U-Net (b)—extra-urban area.
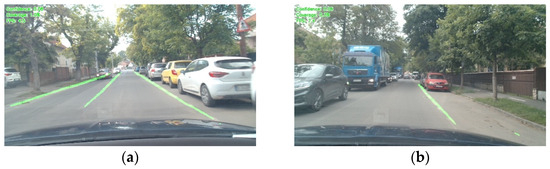
Figure 14.
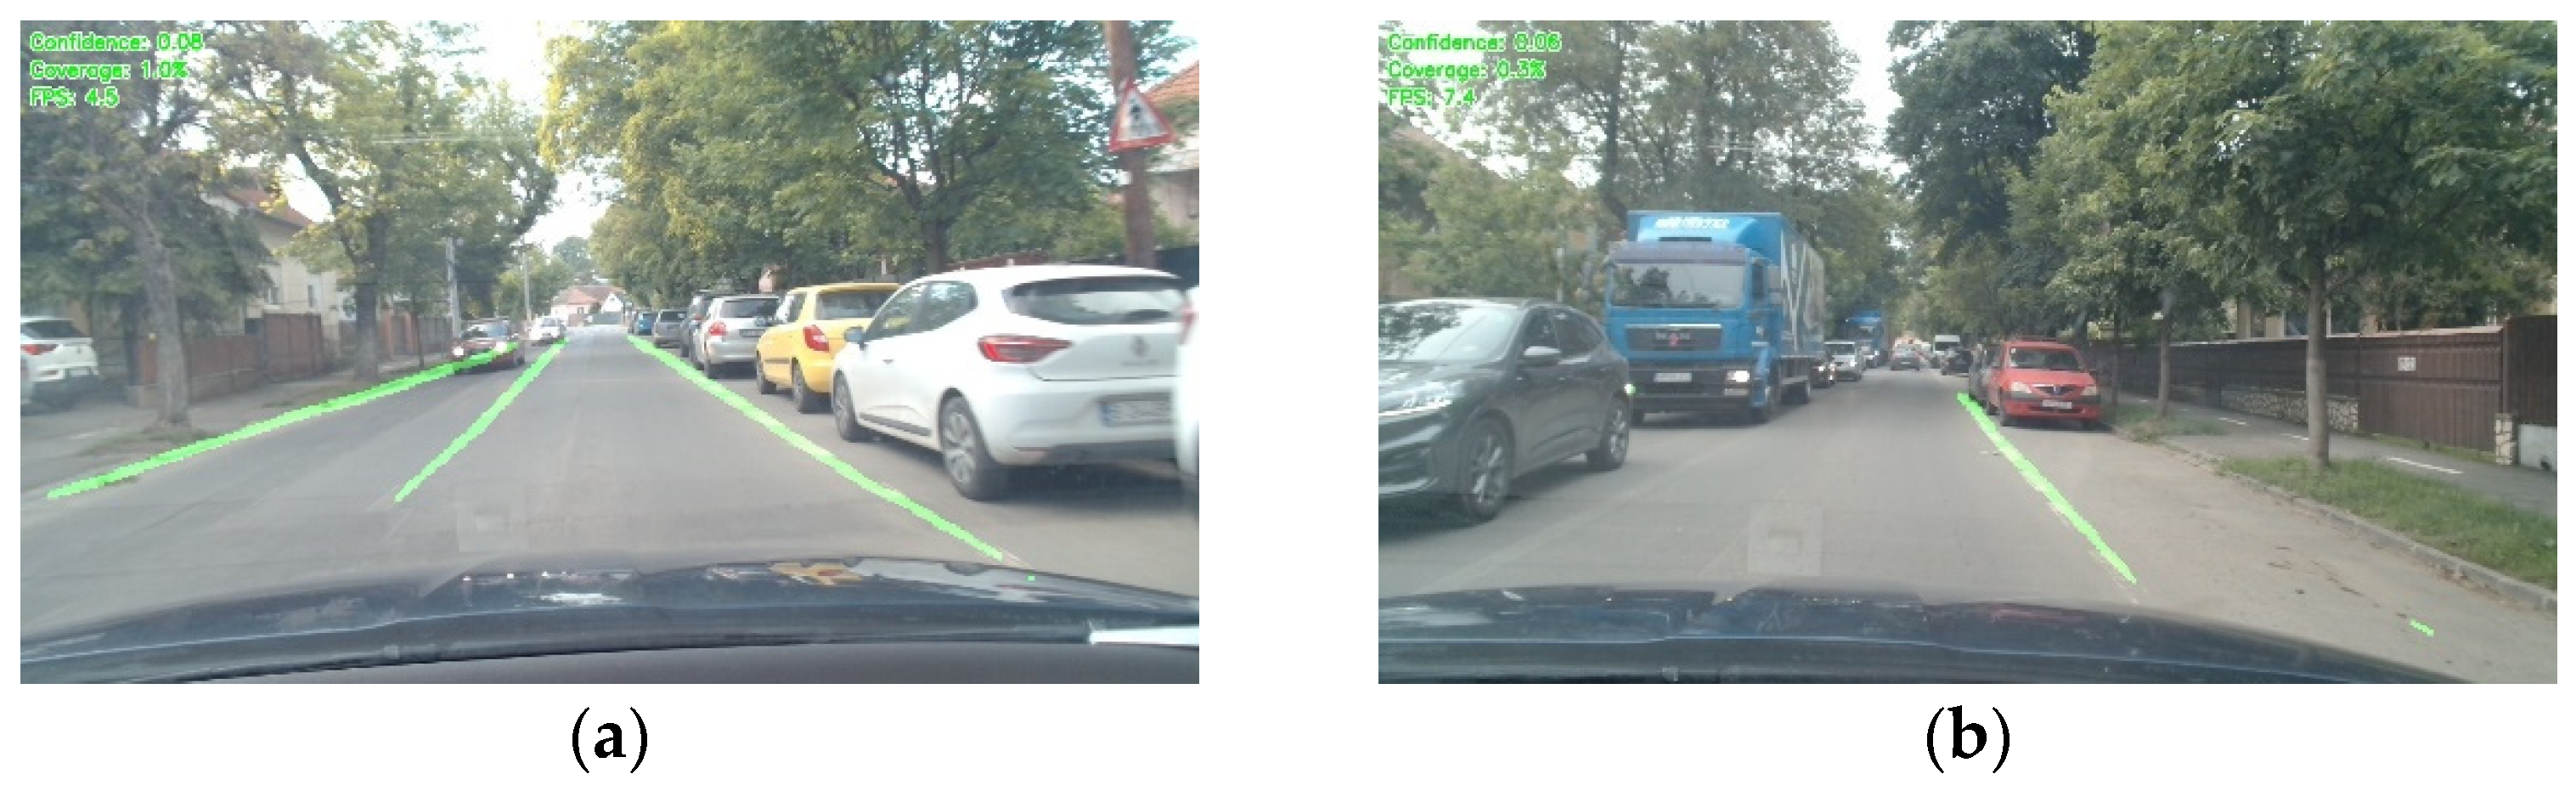
Real-time results hybrid U-Net (a), U-Net (b)—congested urban area.

Figure 15.
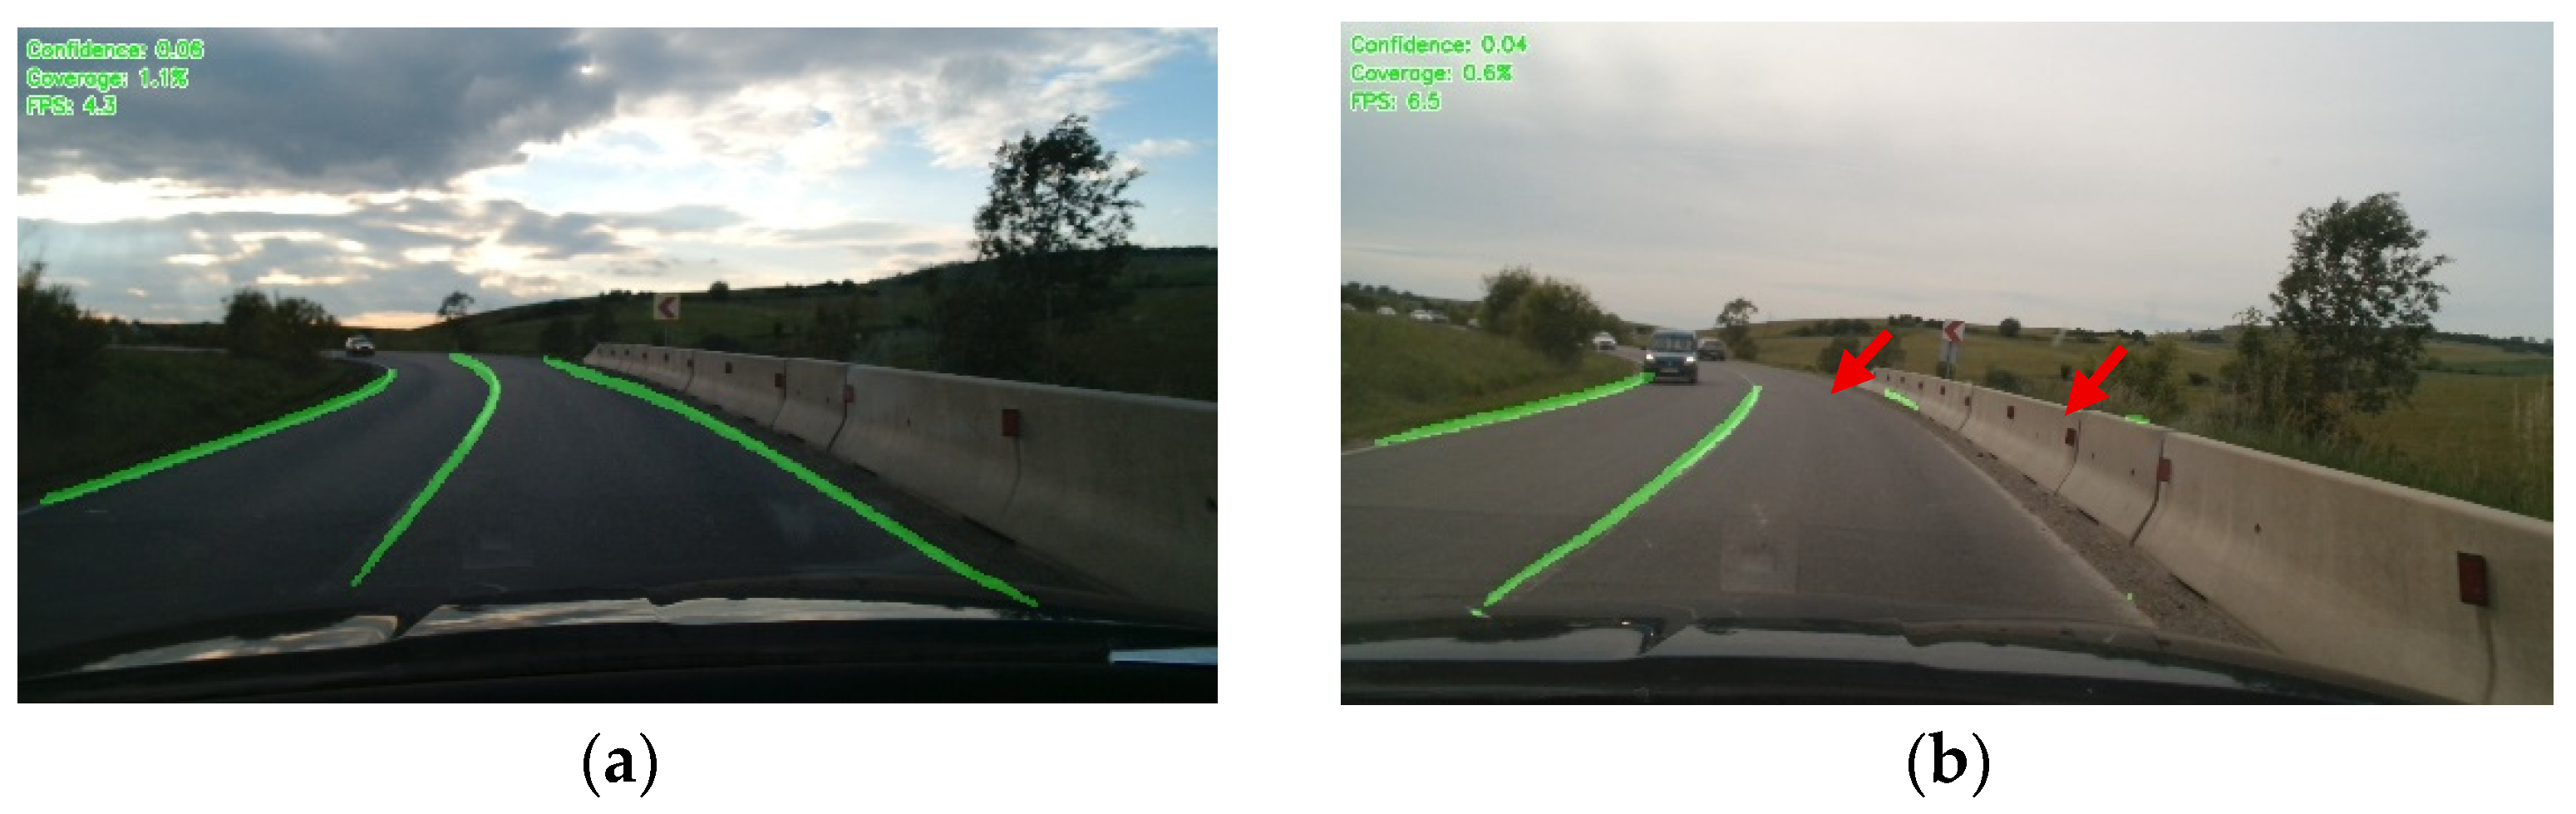
Real-time results hybrid U-Net (a), U-Net (b)—suburban area, curvy road.
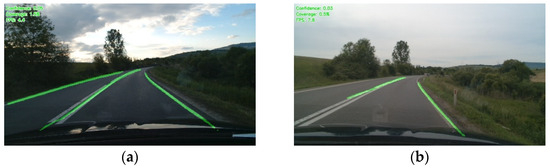
Figure 16.
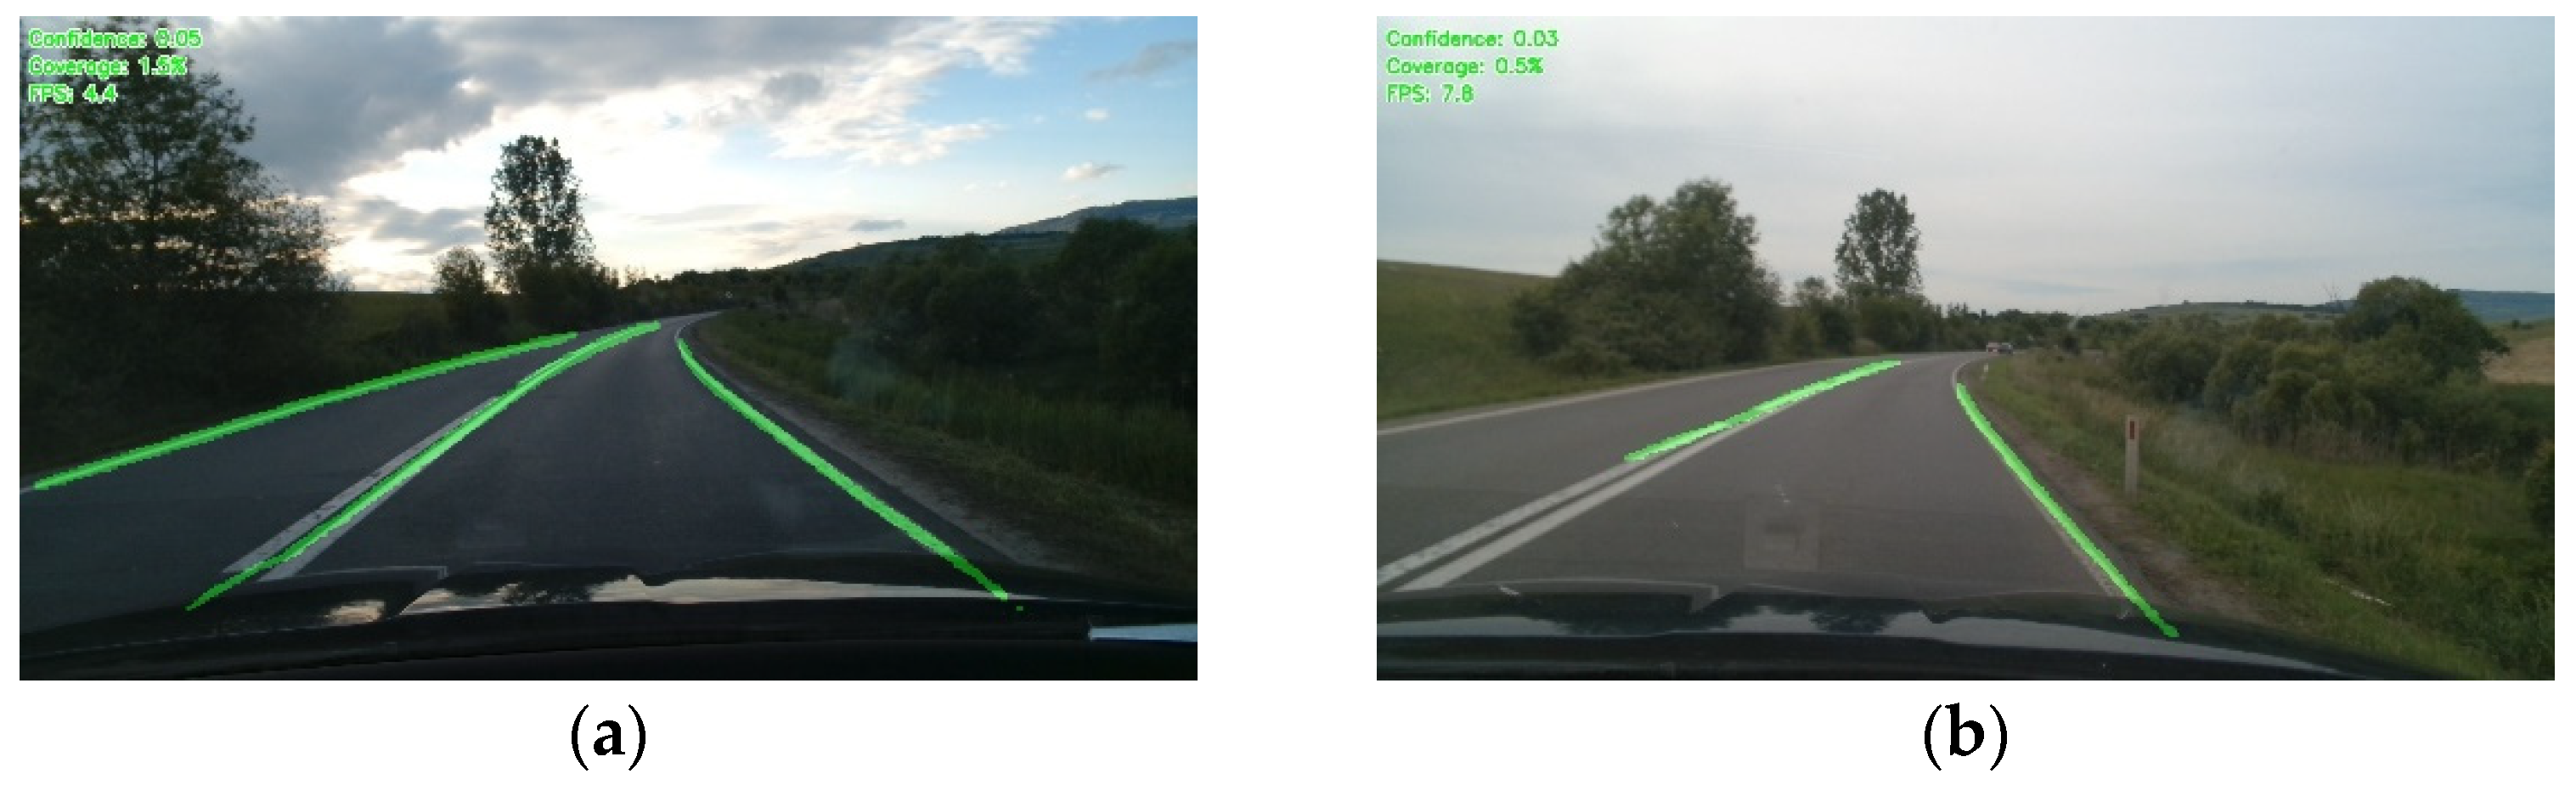
Real-time results hybrid U-Net (a), U-Net (b)—extra-urban area, curved road.

Figure 17.
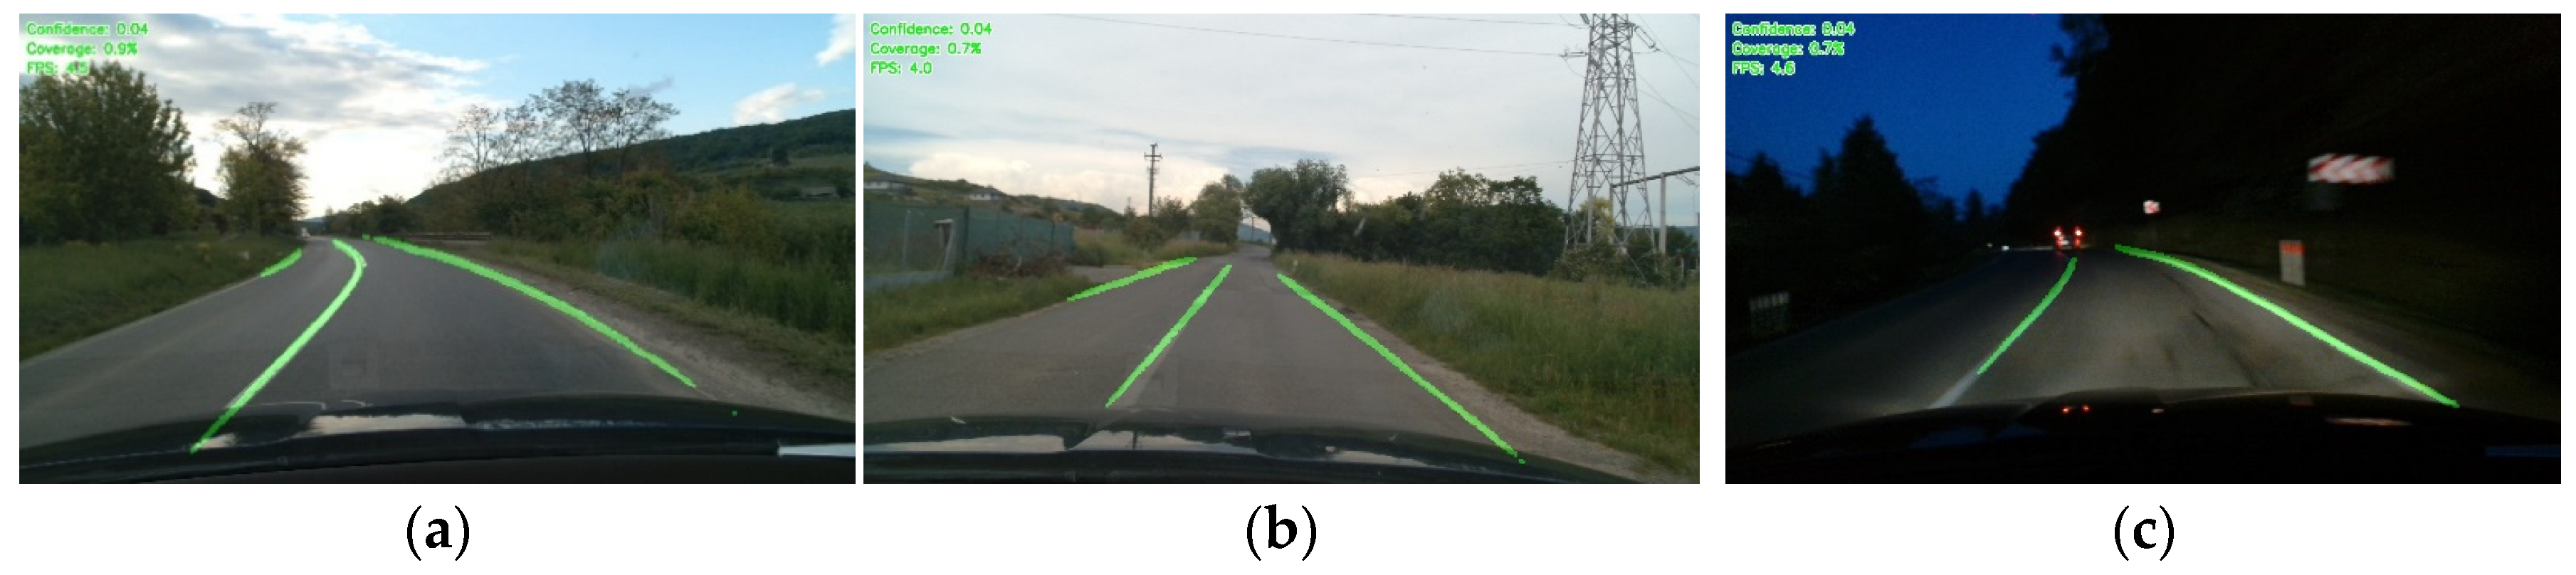
Real-time results using hybrid U-Net for traffic lane detection: (a) cloudy and sloping road, (b)—cloudy and straight road, (c)—at night and curvy road.
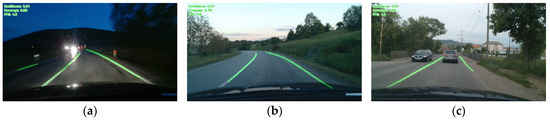
Figure 18.
Real-time results using hybrid U-Net for traffic lane detection: (a) influence of headlights meeting other vehicles at night, (b)—sunset, (c)—heavy traffic.
4. Discussion
The experimental results obtained show a clear improvement in performance with the introduction of the hybrid U-Net architecture, compared to the standard U-Net model (Table 1 and Table 5, and Figure 8, Figure 9, Figure 10 and Figure 11). On all three datasets used (TuSimple, Carla, and TuSimple+Carla), the hybrid U-Net achieved superior scores on both the mIoU and F1 score parameters. The most notable increase was observed on the mixed dataset TuSimple+Carla, where the mIoU increased from 0.56 to 0.60 (+7%) and the F1 score from 0.69 to 0.74 (+7.2%).
The Figure 12, Figure 13, Figure 14, Figure 15, Figure 16, Figure 17 and Figure 18 show how well the hybrid model performed in the variety of (mixed) data environments used. Similarly, on the Carla set—known for the complexity of images generated in simulated environments—hybrid U-Net achieved meaningful improvements, with an increase of +8.0% in mIoU and +5.7% in F1 score, indicating better adaptability to unconventional perspectives and geometric structures in complex images. However, these improvements came at a considerable computational cost.
The inference time of the hybrid U-Net model was approximately 0.04 s per image, compared to 0.016 s per image for the standard U-Net, resulting in a decrease in FPS from 60 to approximately 23. This trade-off between accuracy and speed is essential to consider for real-time applications, where low latency is critical.
While the accuracy improvements of ~7% may appear modest in absolute terms, they represent meaningful gains in challenging lane detection scenarios where standard methods often fail. The performance improvements were particularly pronounced in complex conditions such as curved lanes, poor visibility, and geometric variations where our hybrid U-Net demonstrated almost doubled coverage metrics (1.1% vs. 0.6%) compared to baseline U-Net. However, the 2.5× increase in computational cost does present challenges for real-time ADAS deployment, necessitating optimization strategies to maintain the accuracy benefits while reducing inference time to acceptable levels for automotive applications.
The performance of the hybrid U-Net and U-Net neural networks was comparable when the lane lines were clearly marked and the markings were straight (Figure 13b.) The confidence level was the same for both models (0.04) and the coverage metric was higher for U-Net (by 0.4%) because the U-Net network was less precise. In the case of curves (Figure 15 and Figure 16), the hybrid U-Net had significantly higher performance with a confidence level 0.02 higher in both cases and the coverage metric was almost double (1.1% vs. 0.6% and 1.0% vs. 0.5%, respectively).
Hybrid U-Net had the greatest advantage over U-Net where the road markings were not clearly visible (Figure 14a,b). In the case of Figure 14b, all pixels detected by the U-Net network were below the confidence threshold (value of 0.5 for pixels viewed on the image). It is observed in Figure 12b and Figure 15b that U-Net detected the marking line outside the roadway (see red arrows), and with the false detection the coverage metric was lower for U-Net by 0.2% compared to the efficiency of the proposed and developed hybrid model Hybrid U-Net.
To better observe the capacity of the proposed hybrid U-Net network for future development, a comparative analysis of the performance of the networks used in traffic line detection is presented in Table 6.
Table 6.
Comparative analysis of performance parameters for different traffic line detection networks, reported in [36,37,38,39,40,41,42].
It should be noted that the values in the table should be considered with the caveat that the performance of a network depends greatly on the various settings and hardware resources used as well as on the number of data used for training and learning.
5. Conclusions
The research topic addressed in this article is a topic of immediate interest in the field of design, development, and validation of solutions that can directly contribute to the development of ADAS systems and implicitly to the reduction of the risks of road accidents. By developing and implementing models and methods in the structure of a standard network architecture (U-Net), the hybrid U-Net model was developed, which offers high robustness and precision in the process of identifying traffic lines.
It should be noted that in the case of the U-Net + TE architecture, the weakest results were obtained because the datasets used (TuSimple—3626 images, Carla—3890 images and the mixed set TuSimple + Carla—3500 images) do not offer a large enough volume to fully exploit the capabilities of TE. These architectures, known for their ability to capture global relationships and complex spatial contexts, usually require larger and more varied datasets to achieve superior performance. In comparison, U-Net (having a simpler and more efficient architecture) is easier to train on reduced volumes of data and manages to generalize better in this context. Thus, the slightly weaker performances of the U-Net + TE model can be explained by the fact that it did not have enough data to effectively learn advanced contextual representations. This aspect suggests that a future research direction could aim at training TE models on larger or augmented datasets, in order to explore their full potential. The use of pre-training or fine-tuning methods on external datasets can also be considered to improve performance in data-limited scenarios. Future research should investigate knowledge distillation techniques to address the computational efficiency limitations observed in our hybrid U-Net model. While the proposed architecture achieved superior accuracy (+7.2% F1 score improvement), the inference time increased from 16 ms to 40 ms, limiting real-time ADAS deployment. A teacher–student framework, where the full hybrid U-Net serves as teacher and a compact variant (hybrid U-Net-Lite) as student, could potentially reduce model parameters by 40% while retaining > 95% of the accuracy benefits. This approach would preserve the synergistic effects of our integrated modules (GSC, TE, MSLDM) while achieving the target inference time of ~25 ms required for real-time lane detection at highway speeds. Additionally, complementary optimization strategies such as INT8 quantization and hardware-specific acceleration could further enhance deployment feasibility without compromising the architectural innovations that enable superior performance in complex lane detection scenarios.
Author Contributions
Conceptualization, A.C. and F.M.; methodology, A.C. and F.M.; software, A.C.; validation, A.C. and F.M.; investigation, A.C.; writing—original draft preparation, A.C. and F.M.; writing—review and editing, A.C. and F.M. All authors have read and agreed to the published version of the manuscript.
Funding
The APC was funded by Technical University of Cluj-Napoca.
Institutional Review Board Statement
Not applicable.
Informed Consent Statement
Not applicable.
Data Availability Statement
The data presented in this study are available on request from the corresponding author. The data are not publicly available due to privacy.
Conflicts of Interest
The authors declare no conflicts of interest.
Abbreviations
The following abbreviations are used in this manuscript:
| ADAS | advanced driver assistance systems |
| ALKS | automatic lane keeping systems |
| Carla | car learning to act |
| LDW | lane departure warning |
| LKA | lane keeping assist |
| LCA | lane centering assist |
| GSC | geometrical skip connection |
| MSLDM | multi-scale detection module |
| SAM | spatial attention module |
| TE | transformer encoder |
| TLD | traffic lane detection |
| U-Net | convolutional neural network |
References
- Masello, L.; Castignani, G.; Sheehan, B.; Murphy, F.; McDonnell, K. On the road safety benefits of advanced driver assistance systems in different driving contexts. Transp. Res. Interdiscip. Perspect. 2022, 15, 100670. [Google Scholar] [CrossRef]
- Sankar, S.H.; Jyothis, V.K.; Suresh, A.; Anand, P.S.; Nalinakshan, S. Comparative Analysis of Advanced Driver Assistance Systems (ADAS) in Automobiles. In Emerging Electronics and Automation. E2A 2023; Stroe, D.I., Nasimuddin, D., Laskar, S.H., Pandey, S.K., Eds.; Lecture Notes in Electrical Engineering; Springer: Singapore, 2025; Volume 1237. [Google Scholar] [CrossRef]
- Chengula, T.J.; Mwakalonge, J.; Comert, G.; Sulle, M.; Siuhi, S.; Osei, E. Enhancing advanced driver assistance systems through explainable artificial intelligence for driver anomaly detection. Mach. Learn. Appl. 2024, 17, 100580. [Google Scholar] [CrossRef]
- McDonnell, K.; Murphy, F.; Sheehan, B.; Masello, L.; Castignani, G.; Ryan, C. Regulatory and Technical Constraints: An Overview of the Technical Possibilities and Regulatory Limitations of Vehicle Telematic Data. Sensors 2021, 21, 3517. [Google Scholar] [CrossRef] [PubMed]
- Gkartzonikas, C.; Gkritza, K. What have we learned? A review of stated preference and choice studies on autonomous vehicles. Transp. Res. Part C Emerg. Technol. 2019, 98, 323–337. [Google Scholar] [CrossRef]
- European Commission. Regulation (EU) 2019/2144 on Type-Approval Requirements for Motor Vehicles with Regard to General Safety and the Protection of Vehicle Occupants and Vulnerable Road Users. Available online: https://eur-lex.europa.eu/eli/reg/2019/2144/oj/eng (accessed on 10 May 2025).
- Cicchino, J.B. Effects of lane departure warning on police-reported crash rates. Traffic Inj. Prev. 2018, 19, 615–622. [Google Scholar] [CrossRef]
- Mirzarazi, F.; Danishvar, S.; Mousavi, A. The Safety Risks of AI-Driven Solutions in Autonomous Road Vehicles. World Electr. Veh. J. 2024, 15, 438. [Google Scholar] [CrossRef]
- Kathiresh, S.; Poonkodi, M. Artificial Intelligence-Powered Advanced Driver Assistance Systems in Vehicles. In Computing Technologies for Sustainable Development IRCCTSD 2024; Sivakumar, P.D., Ramachandran, R., Pasupathi, C., Balakrishnan, P., Eds.; Communications in Computer and Information Science; Springer: Cham, Germany, 2024; Volume 2361. [Google Scholar] [CrossRef]
- Sarrab, M.; Pulparambil, S.; Awadalla, M. Development of an IoT based real-time traffic monitoring system for city governance. Glob. Transit. 2020, 2, 230–245. [Google Scholar] [CrossRef]
- Almukhalfi, H.; Noor, A.; Noor, T.H. Traffic management approaches using machine learning and deep learning techniques: A survey. Eng. Appl. Artif. Intell. 2024, 133, 108147. [Google Scholar] [CrossRef]
- Thabit, A.S.M.; Kerrache, C.A.; Calafate, C.T. A survey on monitoring and management techniques for road traffic congestion in vehicular networks. ICT Express 2024, 10, 1186–1198. [Google Scholar] [CrossRef]
- Hu, J.; Wang, Z.; Yang, L. Robust Lane Detection under Adverse Environmental Conditions Using Data Augmentation and Deep Learning. IEEE Trans. Intell. Transp. Syst. 2020, 21, 1417–1427. [Google Scholar]
- Neven, D.; De Brabandere, B.; Georgoulis, S.; Proesmans, M.; Van Gool, L. Towards End-to-End Lane Detection: An Instance Segmentation Approach–Explores Difficulties in Lane Detection Using Deep Learning. arXiv 2018, arXiv:1802.05591. Available online: https://arxiv.org/abs/1802.05591 (accessed on 8 February 2025).
- Sang, I.C.; Norris, W.R. Improved generalizability of CNN based lane detection in challenging weather using adaptive preprocessing parameter tuning. Expert Syst. Appl. 2025, 275, 127055. [Google Scholar] [CrossRef]
- Nie, X.; Xu, Z.; Zhang, W.; Dong, X.; Liu, N.; Chen, Y. Foggy Lane Dataset Synthesized from Monocular Images for Lane Detection Algorithms. Sensors 2022, 22, 5210. [Google Scholar] [CrossRef] [PubMed]
- Sultana, S.; Ahmed, B.; Paul, M.; Islam, M.R.; Ahmad, S. Vision-Based Robust Lane Detection and Tracking in Challenging Conditions. IEEE Access 2023, 11, 67938–67955. [Google Scholar] [CrossRef]
- Zhang, R.; Peng, J.; Gou, W.; Ma, Y.; Chen, J.; Hu, H.; Li, W.; Yin, G.; Li, Z. A robust and real-time lane detection method in low-light scenarios to advanced driver assistance systems. Expert Syst. Appl. 2024, 256, 124923. [Google Scholar] [CrossRef]
- Yaamini, H.S.G.; Swathi, K.J.; Manohar, N.; Ajay Kumar, G. Lane and Traffic Sign Detection for Autonomous Vehicles: Addressing Challenges on Indian Road Conditions. Methods X 2025, 14, 103178. [Google Scholar] [CrossRef]
- Pandian, J.A.; Thirunavukarasu, R.; Mariappan, L.T. Enhancing lane detection in autonomous vehicles with multi-armed bandit ensemble learning. Sci. Rep. 2025, 15, 3198. [Google Scholar] [CrossRef]
- Sang, I.C.; Norris, W.R. A Robust Lane Detection Algorithm Adaptable to Challenging Weather Conditions. IEEE Access 2024, 12, 11185–11195. [Google Scholar] [CrossRef]
- Dai, W.; Li, Z.; Xu, X.; Chen, X.; Zeng, H.; Hu, R. Enhanced Cross Layer Refinement Network for robust lane detection across diverse lighting and road conditions. Eng. Appl. Artif. Intell. 2025, 139, 109473. [Google Scholar] [CrossRef]
- Philion, J. FastDraw: Addressing the Long Tail of Lane Detection by Adapting a Sequential Prediction Network. 2019. arXiv 2019, arXiv:1905.04354. Available online: https://arxiv.org/abs/1905.04354 (accessed on 10 May 2025). [CrossRef]
- Dawam, E.S.; Feng, X. Smart City Lane Detection for Autonomous Vehicle. In Proceedings of the 2020 IEEE Intl Conf on Dependable, Autonomic and Secure Computing, Intl Conf on Pervasive Intelligence and Computing, Intl Conf on Cloud and Big Data Computing, Intl Conf on Cyber Science and Technology Congress (DASC/PiCom/CBDCom/CyberSciTech), Calgary, AB, Canada, 17–22 August 2020; pp. 334–338. [Google Scholar] [CrossRef]
- Pihlak, R.; Riid, A. Simultaneous Road Edge and Road Surface Markings Detection Using Convolutional Neural Networks. In Databases and Information Systems. DB&IS 2020; Robal, T., Haav, H.M., Penjam, J., Matulevičius, R., Eds.; Communications in Computer and Information Science; Springer: Cham, Germany, 2020; Volume 1243. [Google Scholar] [CrossRef]
- Wang, Z.; Wu, G.; Boriboonsomsin, K.; Barth, M.J.; Han, K.; Kim, B.; Tiwari, P. Cooperative Ramp Merging System: Agent-Based Modeling and Simulation Using Game Engine. SAE Int. J. Connect. Autom. Veh. 2019, 2, 115–128. [Google Scholar] [CrossRef]
- Yamaura, M.; Arechiga, N.; Shiraishi, S.; Eisele, S.; Hite, J.; Neema, S.; Scott, J.; Bapty, T. ADAS Virtual Prototyping Using Modelica and Unity Co-simulation Via OpenMETA. 2016. Available online: https://ep.liu.se/ecp/124/006/ecp16124006.pdf (accessed on 10 May 2025).
- Kim, B.; Kashiba, Y.; Dai, S.; Shiraishi, S. Testing Autonomous Vehicle Software in the Virtual Prototyping Environment. IEEE Embed. Syst. Lett. 2016, 9, 1. [Google Scholar] [CrossRef]
- Ronneberger, O.; Fischer, P.; Brox, T. U-Net: Convolutional Networks for Biomedical Image Segmentation. 2015. Available online: https://arxiv.org/abs/1505.04597 (accessed on 16 February 2025).
- Milletari, F.; Navab, N.; Ahmadi, S.A. V-Net: Fully Convolutional Neural Networks for Volumetric Medical Image Segmentation. 2016. Available online: https://arxiv.org/abs/1606.04797 (accessed on 10 May 2025).
- Zhou, Z.; Rahman Siddiquee, M.M.; Tajbakhsh, N.; Liang, J. UNet++: A Nested U-Net Architecture for Medical Image Segmentation. 2018. Available online: https://arxiv.org/abs/1807.10165 (accessed on 10 May 2025).
- Oktay, O.; Schlemper, J.; Le Folgoc, L.; Lee, M.; Heinrich, M.; Misawa, K.; Mori, K.; McDonagh, S.; Hammerla, N.Y.; Kainz, B.; et al. Attention U-Net: Learning Where to Look for the Pancreas. arXiv 2018. Available online: https://arxiv.org/abs/1804.03999 (accessed on 10 May 2025). [CrossRef]
- Liu, L.; Chen, X.; Zhu, S.; Tan, P. CondLaneNet: A Top-to-down Lane Detection Framework Based on Conditional Convolution. 2021. arXiv 2021, arXiv:2105.05003. [Google Scholar] [CrossRef]
- Baek, S.W.; Kim, M.J.; Suddamalla, U.; Wong, A.; Lee, B.H.; Kim, J.H. Real-Time Lane Detection Based on Deep Learning. J. Electr. Eng. Technol. 2021, 17, 655–664. [Google Scholar] [CrossRef]
- Kingma, D.; Ba, J. Adam: A Method for Stochastic Optimization, International Conference on Learning Representations. arXiv 2014, arXiv:1412.6980. Available online: https://arxiv.org/abs/1412.6980 (accessed on 14 May 2025).
- Feng, J.; Zhao, P.; Zheng, H.; Konpang, J.; Sirikham, A.; Kalnaowakul, P. Enhancing Autonomous Driving Perception: A Practical Approach to Event-Based Object Detection in CARLA and ROS. Vehicles 2025, 7, 53. [Google Scholar] [CrossRef]
- Nie, S.; Zhang, G.; Yun, L.; Liu, S. A Faster and Lightweight Lane Detection Method in Complex Scenarios. Electronics 2024, 13, 2486. [Google Scholar] [CrossRef]
- Tabelini, L.; Berriel, R.; Paixao, T.M.; Badue, C.; De Souza, A.F.; Olivera-Santos, T. Keep your eyes on the lane: Attention-guided lane detection. arXiv 2020, arXiv:2010.12035. [Google Scholar]
- Zubic, N.; Gehrig, D.; Gehrig, M.; Scaramuzza, D. From Chaos Comes Order: Ordering Event Representations for Object Recognition and Detection. arXiv 2023, arXiv:2304.13455. [Google Scholar]
- Tabelini, L.; Berriel, R.; Paixäo, T.M.; Badue, C.; De Souza, A.F.; Oliveira-Santos, T. PolyLaneNet: Lane Estimation via Deep Polynomial Regression. In Proceedings of the 2020 25th International Conference on Pattern Recognition (ICPR), Milan, Italy, 10–15 January 2021; pp. 6150–6156. [Google Scholar] [CrossRef]
- Gao, G.; Guo, Y.; Zhou, L.; Li, L.; Shi, G. Res2Net-based multi-scale and multi-attention model for traffic scene image classification. PLoS ONE 2024, 19, e0300017. [Google Scholar] [CrossRef]
- Li, R.; Dong, Y. Robust Lane Detection through Self Pre-training with Masked Sequential Autoencoders and Fine-tuning with Customized PolyLoss. arXiv 2023, arXiv:2305.17271. [Google Scholar] [CrossRef]


Disclaimer/Publisher’s Note: The statements, opinions and data contained in all publications are solely those of the individual author(s) and contributor(s) and not of MDPI and/or the editor(s). MDPI and/or the editor(s) disclaim responsibility for any injury to people or property resulting from any ideas, methods, instructions or products referred to in the content. |
© 2025 by the authors. Licensee MDPI, Basel, Switzerland. This article is an open access article distributed under the terms and conditions of the Creative Commons Attribution (CC BY) license (https://creativecommons.org/licenses/by/4.0/).