
Breast Cancer Image Classification Using Phase Features and Deep Ensemble Models


Abstract
1. Introduction
2. Literature Review
2.1. Machine Learning-Based Methods
2.2. Convolutional Neural Network-Based Methods
2.3. Hybrid Methods Based on CNN
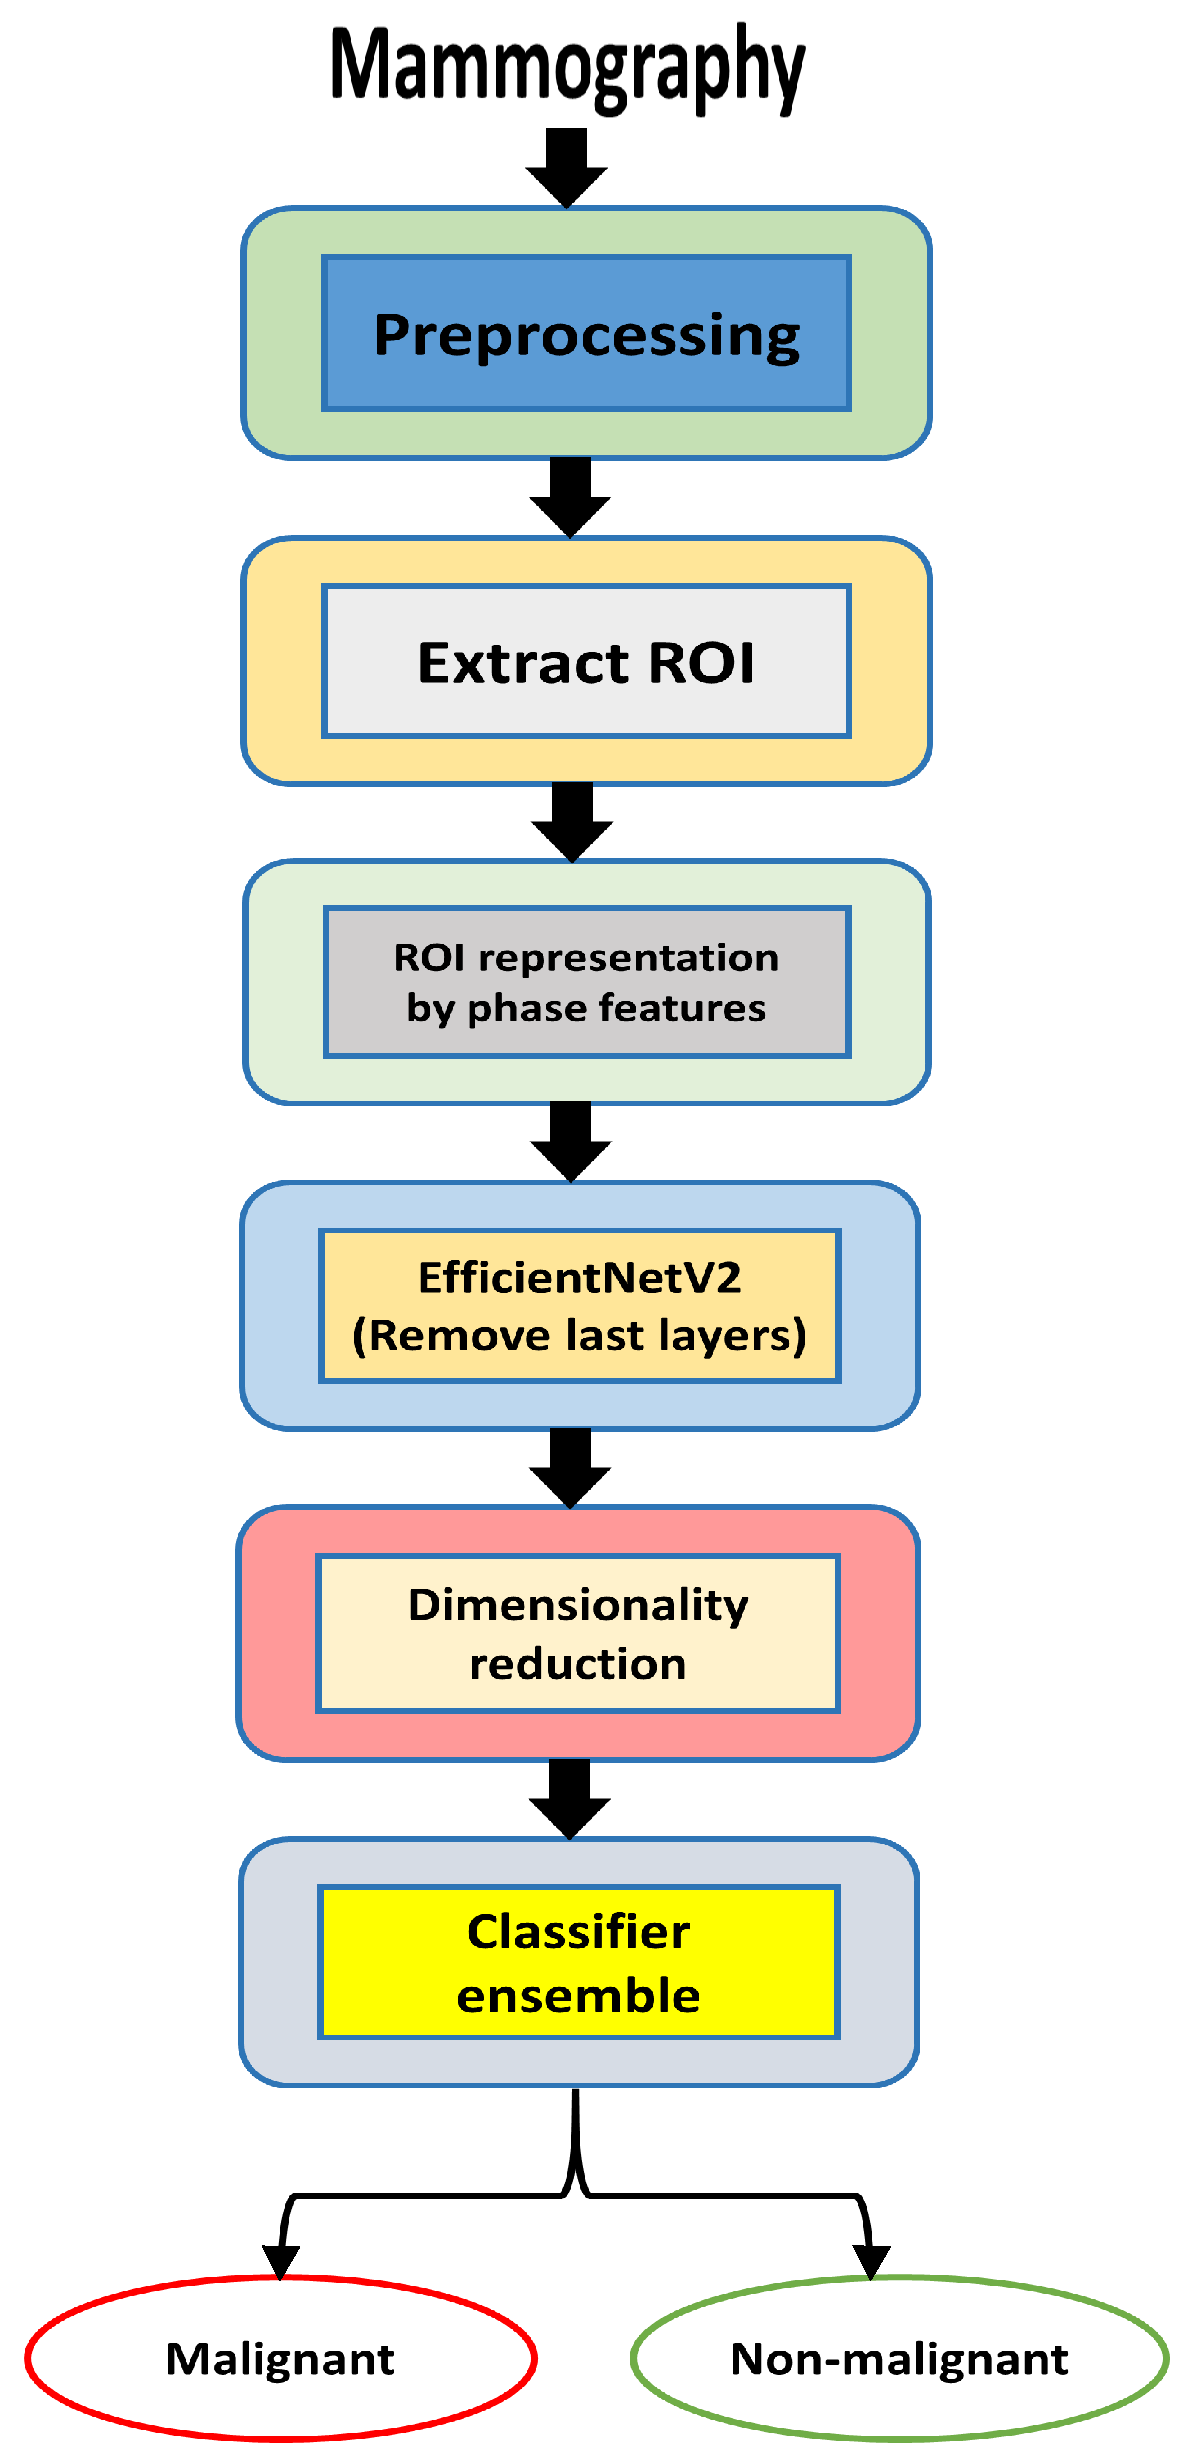
3. Proposed Methodology
3.1. Datasets
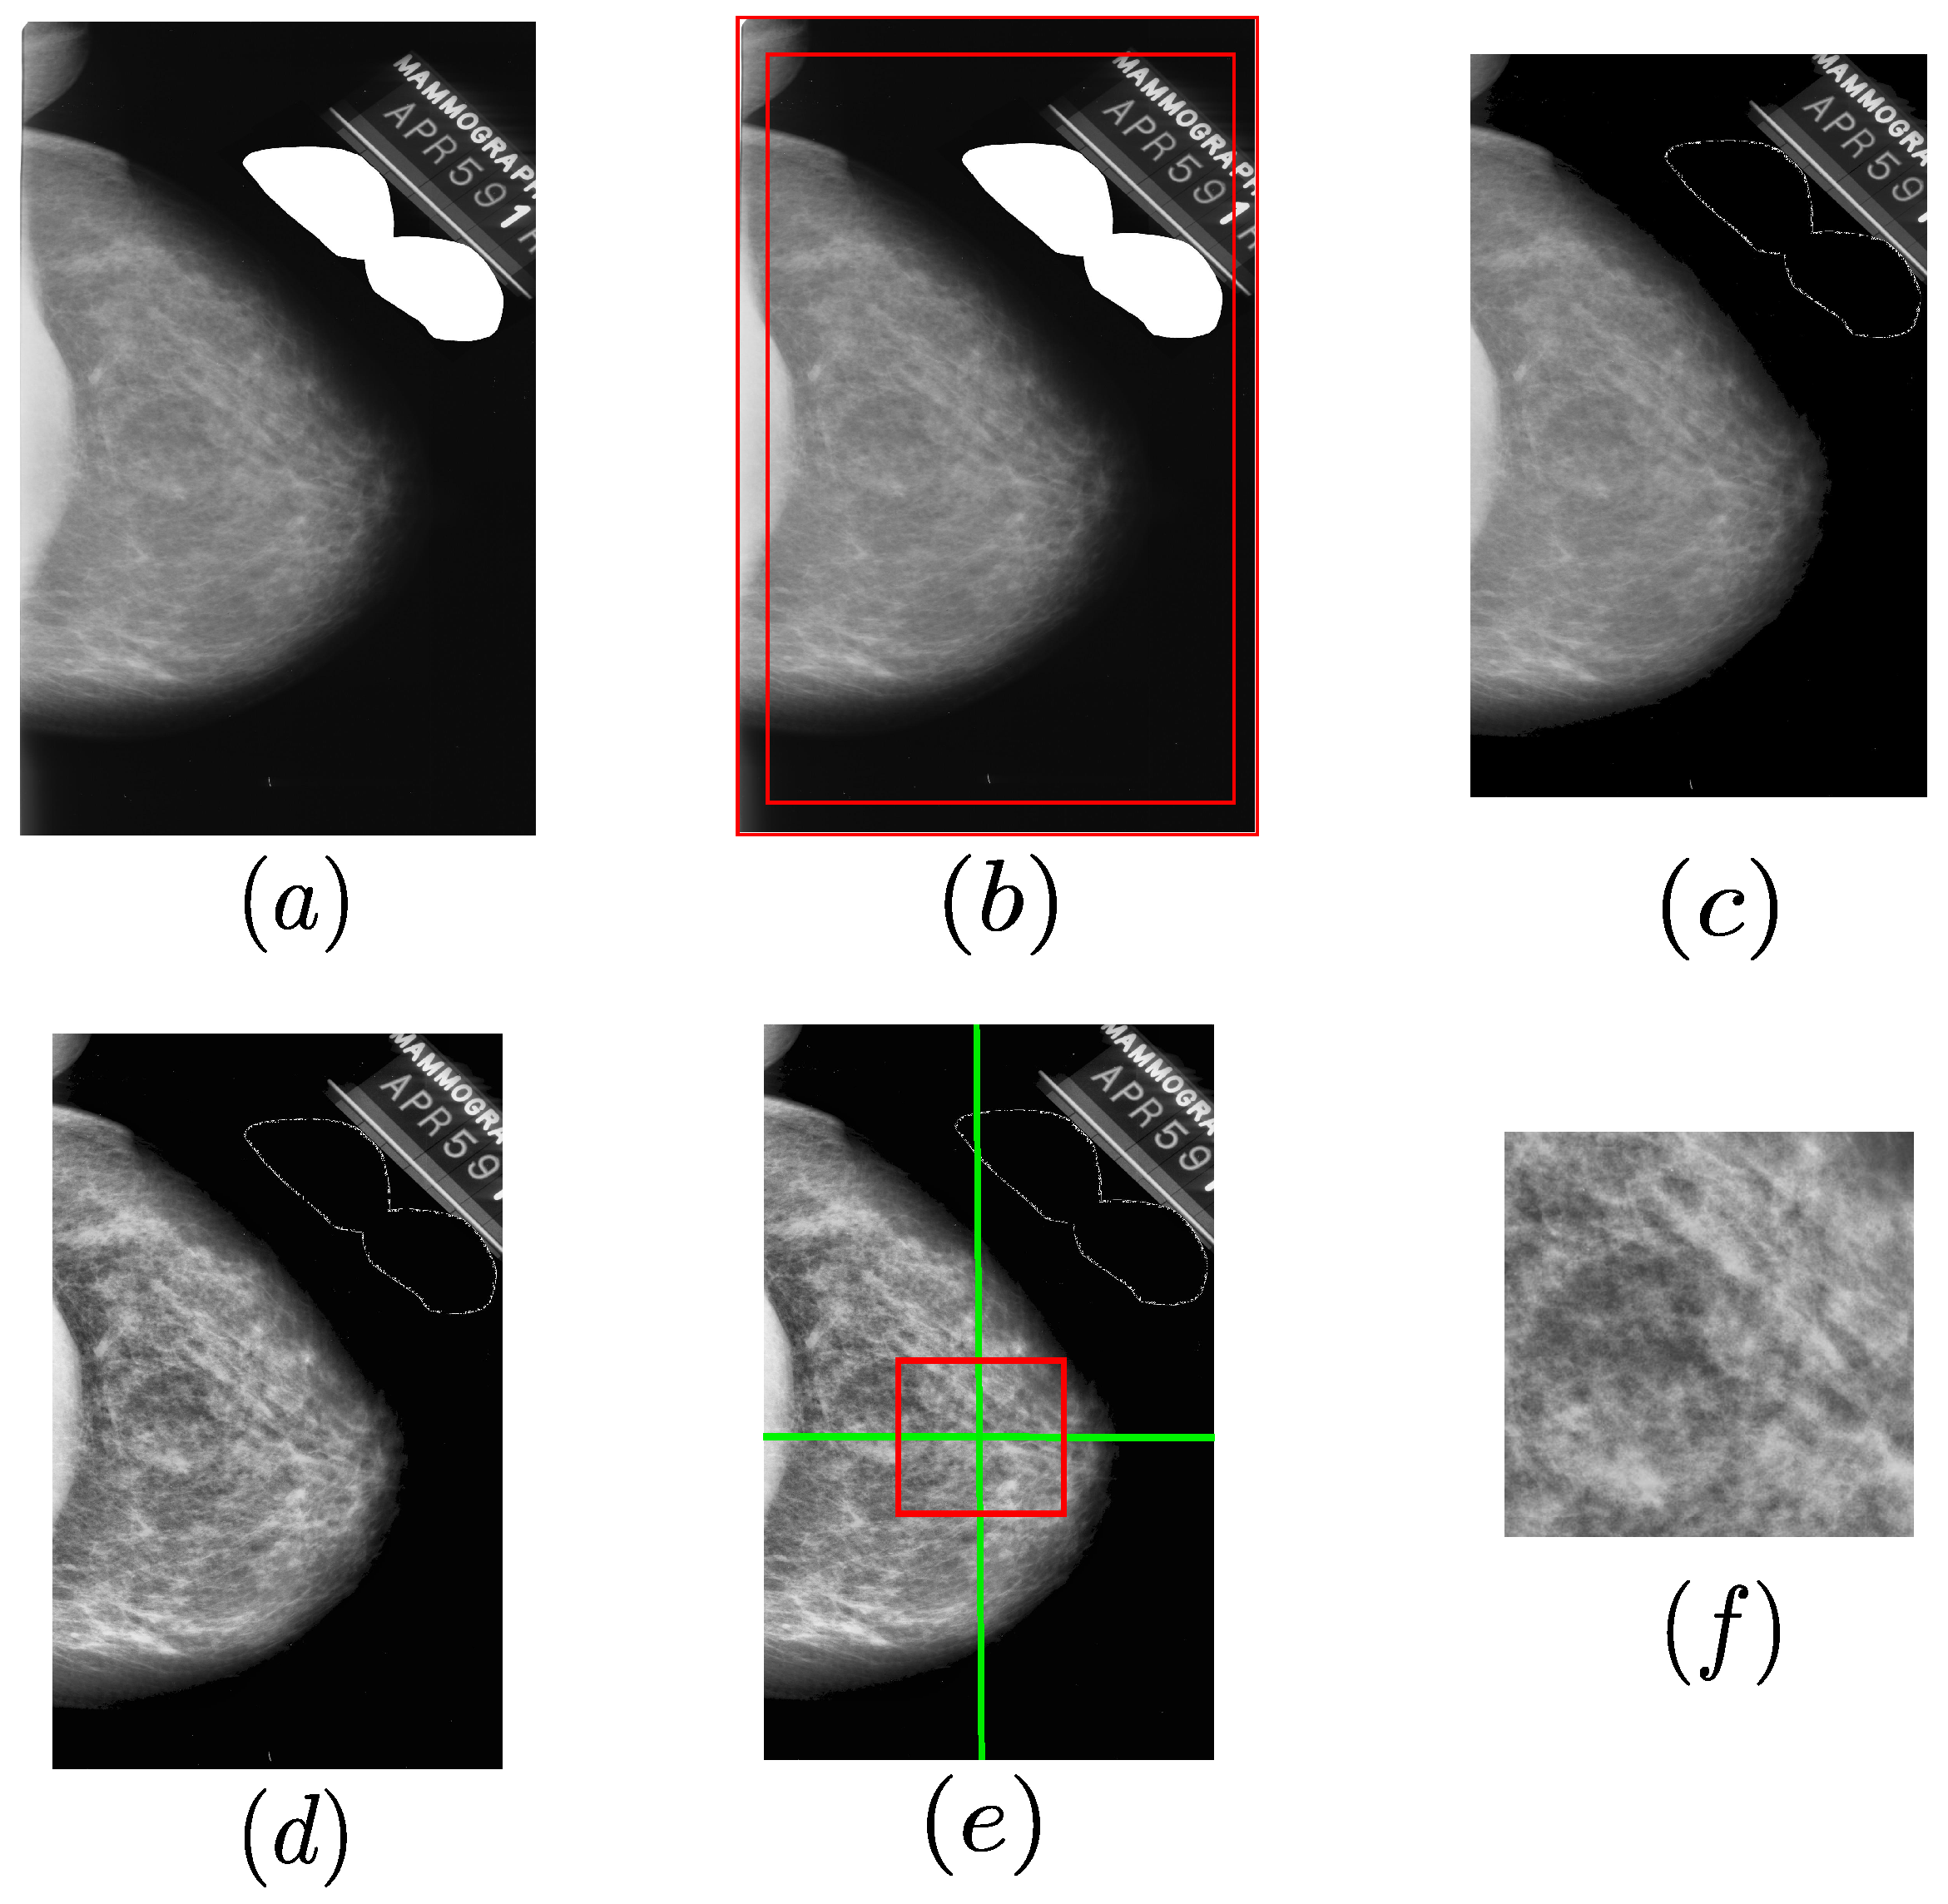
3.2. Mammography Preprocessing
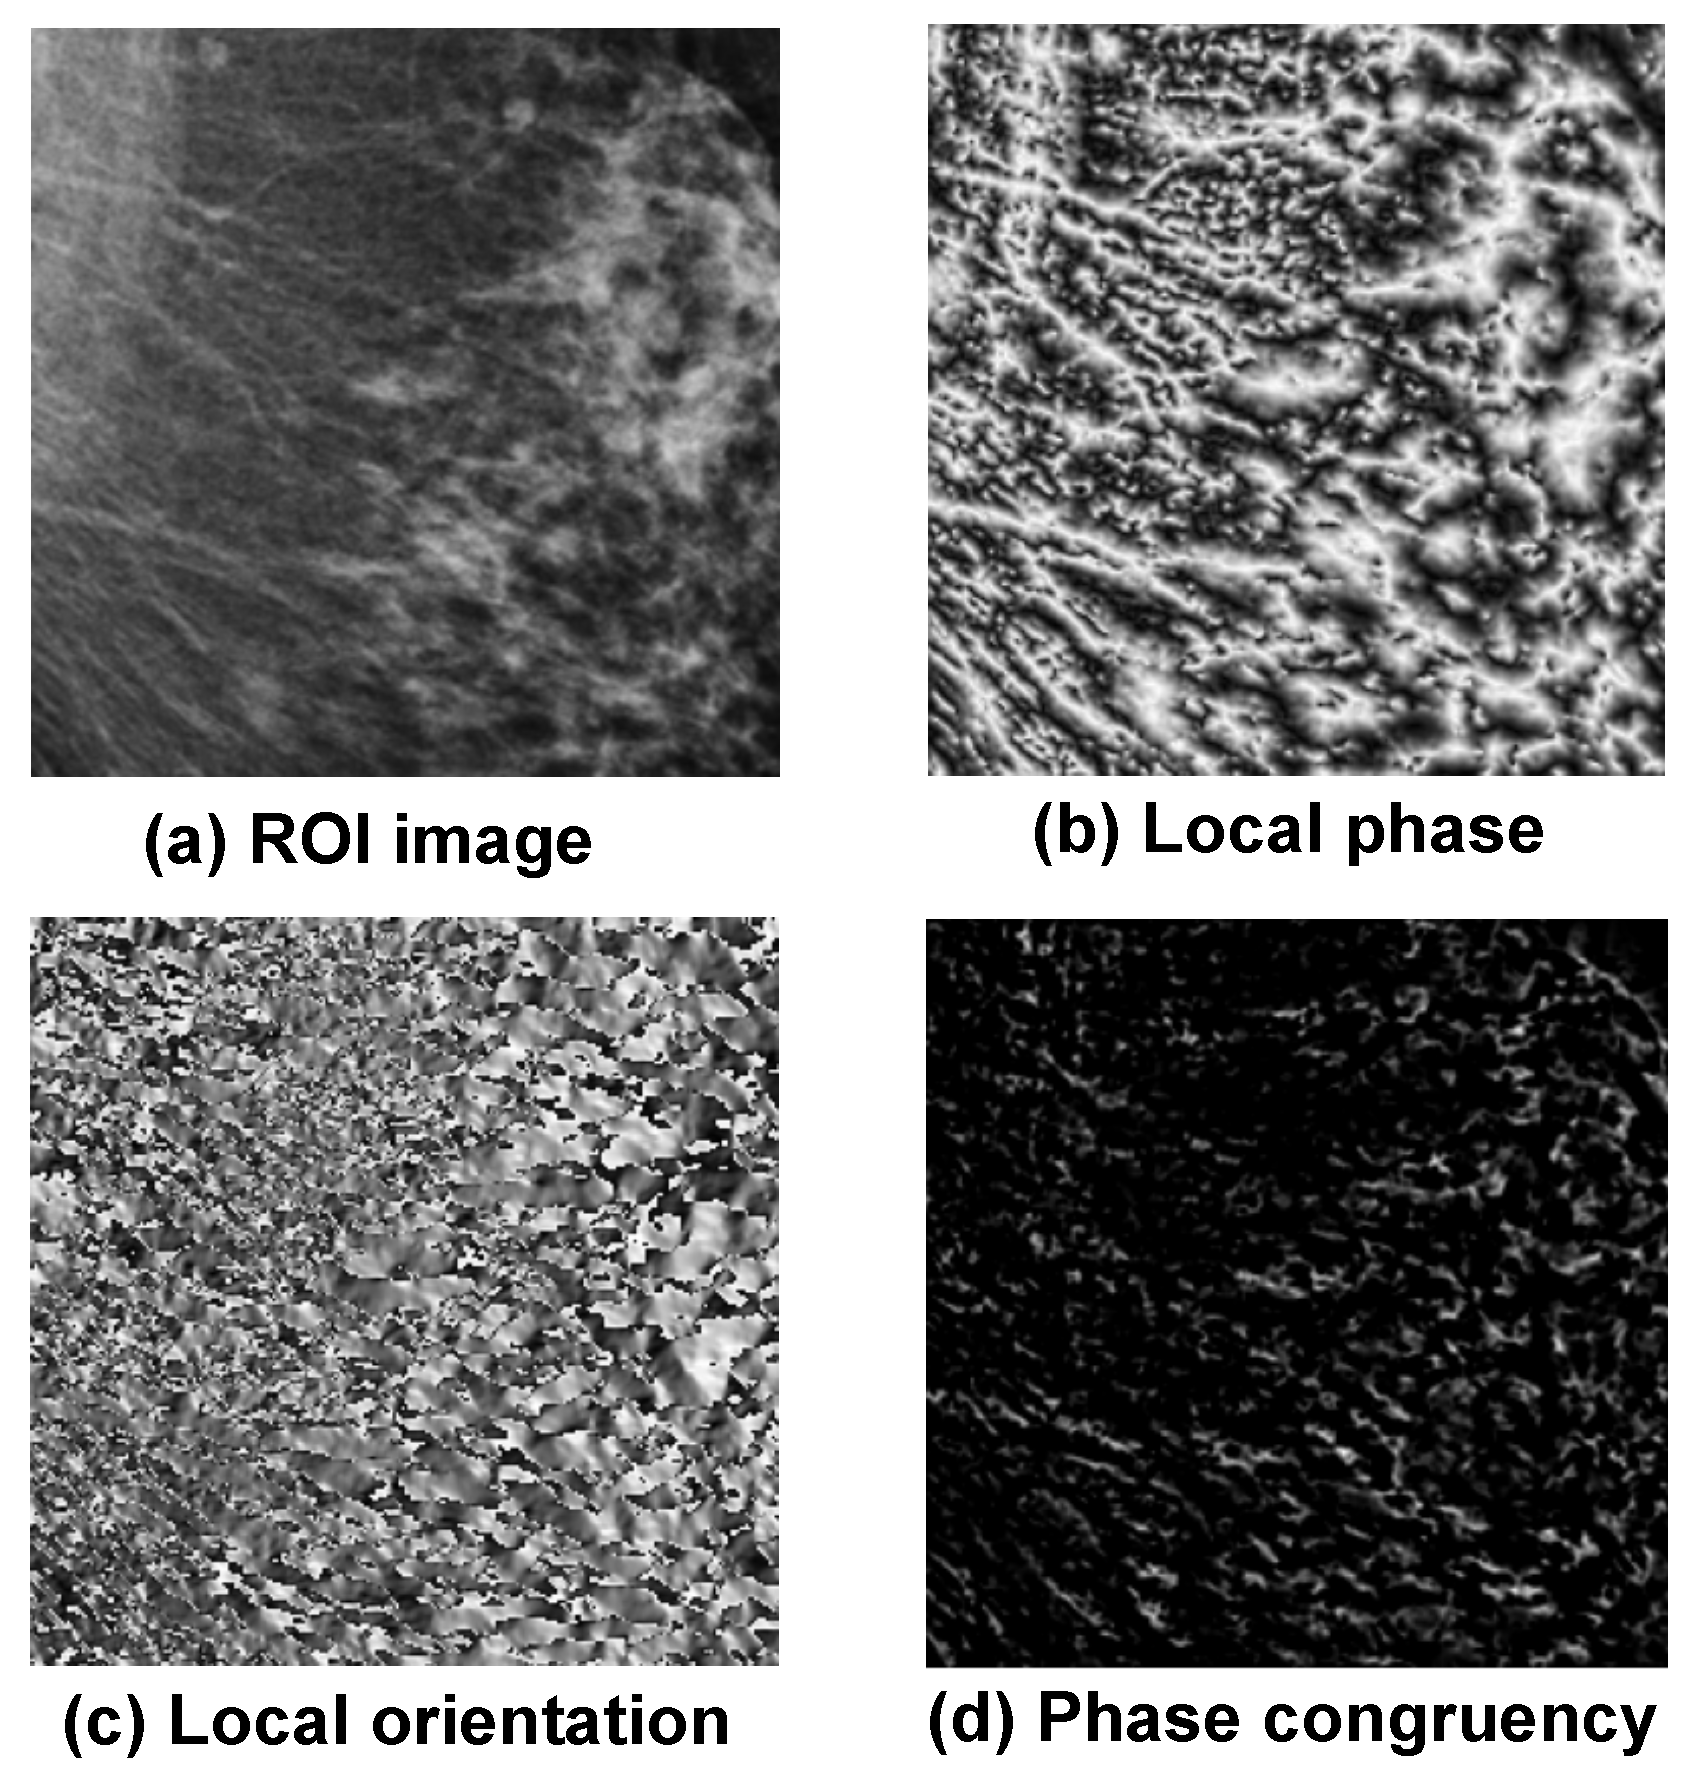
3.3. Extraction of Phase Image Features
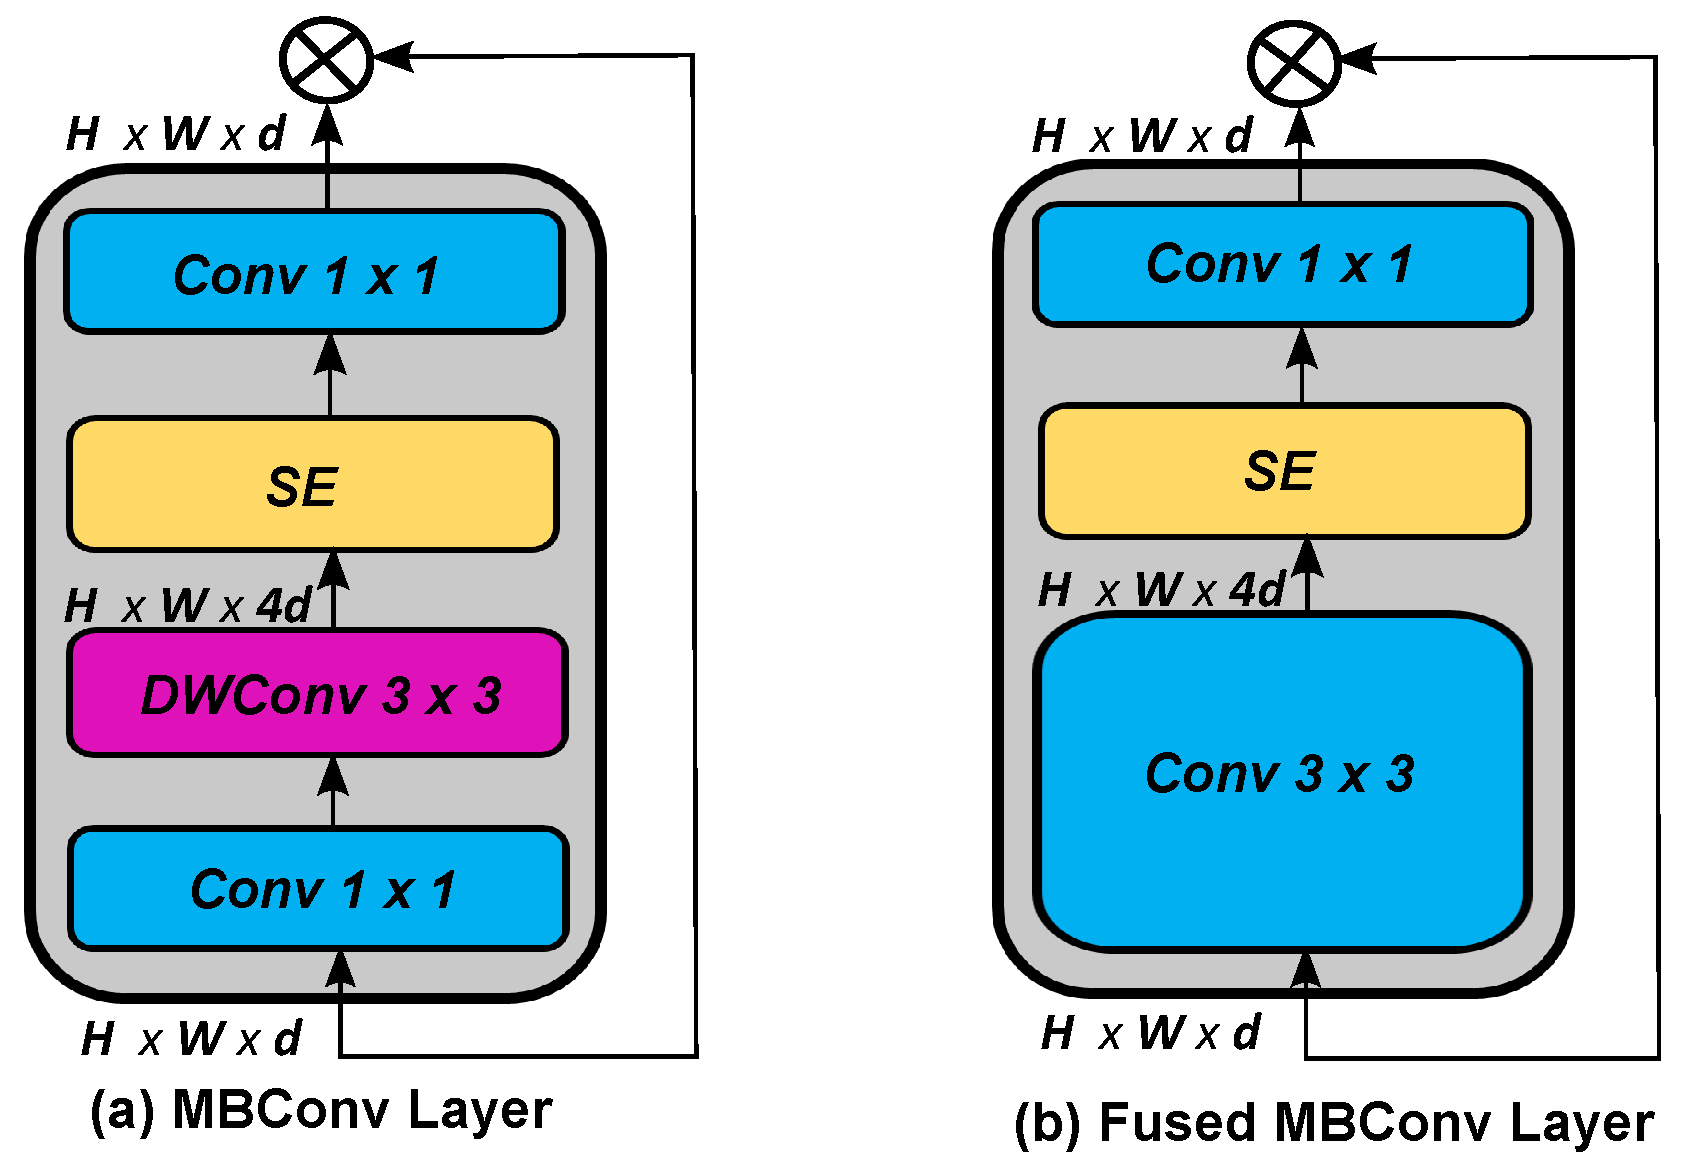
3.4. EfficientNetV2 Models
3.5. Feature Extraction CNN-Based Model
| Algorithm 1: Proposed method for breast cancer detection |
| Require:
Input mammogram image Ensure: Binary class label (1 = Malignant, 0 = Benign)
|
4. Experimental Results
4.1. Experimental Details and Evaluation
4.2. Performance Evaluation of Feature Extraction and Cancer Detection on Mammography Datasets
4.2.1. Evaluation of EfficientNetV2 Variants on the Combined Dataset (Mini-DDSM, MIAS, and CSAW-M)
4.2.2. Evaluation of the EfficientNetV2 Variants on the CSAW-M Dataset
4.3. Performance Discussion and Contribution of Phase-Based Features
4.3.1. Effectiveness of the Compact Statistical Descriptor
4.3.2. Detailed Analysis of Classification Errors and Correct Predictions
4.3.3. Impact of Phase-Based Features on Classification Performance
4.4. Performance Comparisons with Existing Methods
5. Conclusions
Author Contributions
Funding
Institutional Review Board Statement
Informed Consent Statement
Data Availability Statement
Acknowledgments
Conflicts of Interest
List of Abbreviations
| CNNs | Convolutional neural networks |
| ROI | Region of interest |
| LBPs | Local binary patterns |
| ML | Machine learning |
| RNNs | Recurrent neural networks |
| BLSTM | Bidirectional long short-term memory |
| MIAS | Mammogram Image Analysis Society |
| DDSM | Digital Database for Screening Mammography |
| CSAW-M | Classification Dataset for Benchmarking Mammographic Masking of Cancer |
| CAD | Computer-aided diagnosis |
| CDTM | Cross-diagonal texture matrix |
| KPCA | Kernel principal component analysis |
| GOA | Grasshopper optimization algorithm |
| AUC | Area under curve |
| INbreast | Imaging network in breast disease |
| FDCT-WRP | Fast discrete curvelet transform with wrapping |
| PCA | Principal component analysis |
| LDA | Linear discriminant analysis |
| PSO | Particle swarm optimization |
| DCT | Discrete Chebyshev transform |
| WDBC | Wisconsin Diagnostic Breast Cancer |
| CLAHE | Contrast limited adaptive histogram equalization |
| DE | Differential evolution |
| CSA | Crow search algorithm |
| HHO | Harris Hawks optimization |
| ANNs | Artificial neural networks |
| SVM | Support vector machine |
| KNN | k-nearest neighbors |
| CESM | Contrast-enhanced spectral mammography |
| CFS | Correlation-based feature selection |
| BEMD | Bidimensional empirical mode decomposition |
| GLCM | Gray level co-occurrence matrix |
| GLRLM | Gray level run length matrix |
| RBF | Radial basis function |
| YOLO | You Only Look Once |
| MSANet | Multi-scale attention-guided network |
| MSA | Multi-scale attention |
| MSAM | Multi-scale attention module |
| FL | Focal loss |
| MBConv | MobileNetV2 block convolution |
| CC | Craniocaudal |
| MLO | Mediolateral oblique |
| CBIS-DDSM | Curated Breast Imaging Subset of DDSM |
| MIB-Net | Multitask information bottleneck network |
| LE | Low energy |
| DES | Dual-energy subtraction |
| BUSI | Breast Ultrasound Image |
| MEWOA | Modified entropy whale optimization |
| BiLSTM | Bidirectional long short-term memory |
| DFOA | Dragonfly optimization algorithm |
| CSOA | Crow search optimization algorithm |
| SI-CSO | Self-improved cat swarm optimization |
| ELM | Extreme learning machine |
| NR | Not reported |
| MBConv | Mobile inverted bottleneck convolution |
| CC | Craniocaudal |
| MLO | Mediolateral oblique |
| MIB-Net | Multitask information bottleneck network |
| LES | Local Enhanced Set |
| DES | Denoised Enhanced Set |
| BUSI | Breast Ultrasound Image dataset |
| DFOA | Dragonfly optimization algorithm |
| CSOA | Crow search optimization algorithm |
| FC | Fully connected |
| TP | True positive |
| TN | True negative |
| FP | False positive |
| FN | False negative |
| CSHHO | Crow search with Harris Hawks optimization |
References
- Sun, Y.S.; Zhao, Z.; Yang, Z.N.; Xu, F.; Lu, H.J.; Zhu, Z.Y.; Shi, W.; Jiang, J.; Yao, P.P.; Zhu, H.P. Risk factors and preventions of breast cancer. Int. J. Biol. Sci. 2017, 13, 1387. [Google Scholar] [CrossRef]
- Xiao, Z.; Li, L. Breast cancer mortality in Chinese women and men from 1990 to 2019: Analysis of trends in risk factors. J. Obstet. Gynaecol. Res. 2024, 50, 970–981. [Google Scholar] [CrossRef] [PubMed]
- McGuire, A.; Brown, J.A.; Malone, C.; McLaughlin, R.; Kerin, M.J. Effects of age on the detection and management of breast cancer. Cancers 2015, 7, 908–929. [Google Scholar] [CrossRef] [PubMed]
- Sung, H.; Ferlay, J.; Siegel, R.L.; Laversanne, M.; Soerjomataram, I.; Jemal, A.; Bray, F. Global cancer statistics 2020: GLOBOCAN estimates of incidence and mortality worldwide for 36 cancers in 185 countries. CA A Cancer J. Clin. 2021, 71, 209–249. [Google Scholar] [CrossRef]
- Khamparia, A.; Bharati, S.; Podder, P.; Gupta, D.; Khanna, A.; Phung, T.K.; Thanh, D.N. Diagnosis of breast cancer based on modern mammography using hybrid transfer learning. Multidimens. Syst. Signal Process. 2021, 32, 747–765. [Google Scholar] [CrossRef] [PubMed]
- Florindo, J.B.; Bruno, O.M. Fractal descriptors of texture images based on the triangular prism dimension. J. Math. Imaging Vis. 2019, 61, 140–159. [Google Scholar] [CrossRef]
- Haralick, R.M.; Shanmugam, K.; Dinstein, I. Textural features for image classification. IEEE Trans. Syst. Man Cybern. 1973, SMC-3, 610–621. [Google Scholar]
- Ojala, T.; Pietikäinen, M.; Mäenpää, T. Multiresolution gray-scale and rotation invariant texture classification with local binary patterns. IEEE Trans. Pattern Anal. Mach. Intell. 2002, 24, 971–987. [Google Scholar] [CrossRef]
- Mohanty, F.; Rup, S.; Dash, B. Automated diagnosis of breast cancer using parameter optimized kernel extreme learning machine. Biomed. Signal Process. Control 2020, 62, 102108. [Google Scholar] [CrossRef]
- Muduli, D.; Dash, R.; Majhi, B. Fast discrete curvelet transform and modified PSO based improved evolutionary extreme learning machine for breast cancer detection. Biomed. Signal Process. Control 2021, 70, 102919. [Google Scholar] [CrossRef]
- Bacha, S.; Taouali, O. A novel machine learning approach for breast cancer diagnosis. Measurement 2022, 187, 110233. [Google Scholar] [CrossRef]
- Thawkar, S. Feature selection and classification in mammography using hybrid crow search algorithm with harris hawks optimization. Biocybern. Biomed. Eng. 2022, 42, 1094–1111. [Google Scholar] [CrossRef]
- Amin, M.N.; Kamal, R.; Farouk, A.; Gomaa, M.; Rushdi, M.A.; Mahmoud, A.M. An efficient hybrid computer-aided breast cancer diagnosis system with wavelet packet transform and synthetically-generated contrast-enhanced spectral mammography images. Biomed. Signal Process. Control 2023, 85, 104808. [Google Scholar] [CrossRef]
- Elmoufidi, A. Deep multiple instance learning for automatic breast cancer assessment using digital mammography. IEEE Trans. Instrum. Meas. 2022, 71, 1–13. [Google Scholar] [CrossRef]
- Hirra, I.; Ahmad, M.; Hussain, A.; Ashraf, M.U.; Saeed, I.A.; Qadri, S.F.; Alghamdi, A.M.; Alfakeeh, A.S. Breast cancer classification from histopathological images using patch-based deep learning modeling. IEEE Access 2021, 9, 24273–24287. [Google Scholar] [CrossRef]
- Al-Antari, M.A.; Han, S.M.; Kim, T.S. Evaluation of deep learning detection and classification towards computer- aided diagnosis of breast lesions in digital x-ray mammograms. Comput. Methods Programs Biomed. 2020, 196, 105584. [Google Scholar] [CrossRef]
- Lou, Q.; Li, Y.; Qian, Y.; Lu, F.; Ma, J. Mammogram classification based on a novel convolutional neural network with efficient channel attention. Comput. Biol. Med. 2022, 150, 106082. [Google Scholar] [CrossRef]
- Karthiga, R.; Narasimhan, K.; Amirtharajan, R. Diagnosis of breast cancer for modern mammography using artificial intelligence. Math. Comput. Simul. 2022, 202, 316–330. [Google Scholar] [CrossRef]
- Wang, J.; Zheng, Y.; Ma, J.; Li, X.; Wang, C.; Gee, J.; Wang, H.; Huang, W. Information bottleneck-based interpretable multitask network for breast cancer classification and segmentation. Med. Image Anal. 2023, 83, 102687. [Google Scholar] [CrossRef]
- Wei, T.; Aviles-Rivero, A.I.; Wang, S.; Huang, Y.; Gilbert, F.J.; Schönlieb, C.-B.; Chen, C.W. Beyond fine-tuning: Classifying high resolution mammograms using function- preserving transformations. Med. Image Anal. 2022, 82, 102618. [Google Scholar] [CrossRef]
- Ragab, D.A.; Attallah, O.; Sharkas, M.; Ren, J.; Marshall, S. A framework for breast cancer classification using multi-dcnns. Comput. Biol. Med. 2021, 131, 104245. [Google Scholar] [CrossRef]
- Zahoor, S.; Shoaib, U.; Lali, I.U. Breast cancer mammograms classification using deep neural network and entropy-controlled whale optimization algorithm. Diagnostics 2022, 12, 557. [Google Scholar] [CrossRef] [PubMed]
- Haq, I.U.; Ali, H.; Wang, H.Y.; Lei, C.; Ali, H. Feature fusion and ensemble learning-based cnn model for mammographic image classification. J. King Saud Univ.-Comput. Inf. Sci. 2022, 34, 3310–3318. [Google Scholar] [CrossRef]
- Chaki, J.; Woźniak, M. Deep learning for neurodegenerative disorder (2016 to 2022): A systematic review. Biomed. Signal Process. Control 2023, 80, 104223. [Google Scholar] [CrossRef]
- Xia, L.; An, J.; Ma, C.; Hou, H.; Hou, Y.; Cui, L.; Jiang, X.; Li, W.; Gao, Z. Neural network model based on global and local features for multi-view mammogram classification. Neurocomputing 2023, 536, 21–29. [Google Scholar] [CrossRef]
- Ding, W.; Zhang, H.; Zhuang, S.; Zhuang, Z.; Gao, Z. Multi-view stereoscopic attention network for 3D tumor classification in automated breast ultrasound. Expert Syst. Appl. 2023, 234, 120969. [Google Scholar] [CrossRef]
- Chakravarthy, S.S.; Bharanidharan, N.; Rajaguru, H. Deep learning-based metaheuristic weighted k-nearest neighbor algorithm for the severity classification of breast cancer. IRBM 2023, 44, 100749. [Google Scholar] [CrossRef]
- Vidivelli, S.; Devi, S. Breast cancer detection model using fuzzy entropy segmentation and ensemble classification. Biomed. Signal Process. Control 2023, 80, 104236. [Google Scholar] [CrossRef]
- Suckling, J. The mammographic images analysis society digital mammogram database. Exerpta Medica Int. Congr. Ser. 1994, 1069, 375–378. [Google Scholar]
- Heath, M.; Bowyer, K.; Kopans, D.; Kegelmeyer, P.; Moore, R.; Chang, K.; Munishkumaran, S. Current status of the digital database for screening mammography. In Digital Mammography: Nijmegen; Springer: Dordrecht, The Netherlands, 1998; pp. 457–460. [Google Scholar]
- Cortes, C.; Vapnik, V. Support-vector networks. Mach. Learn. 1995, 20, 273–297. [Google Scholar] [CrossRef]
- El Houby, E.; Yassin, N.I. Malignant and nonmalignant classification of breast lesions in mammograms using convolutional neural networks. Biomed. Signal Process. Control 2021, 70, 102954. [Google Scholar] [CrossRef]
- Huang, M.-L.; Lin, T.Y. Considering breast density for the classification of benign and malignant mammograms. Biomed. Signal Process. Control 2021, 67, 102564. [Google Scholar] [CrossRef]
- Xu, C.; Lou, M.; Qi, Y.; Wang, Y.; Pi, J.; Ma, Y. Multi-scale attention-guided network for mammograms classification. Biomed. Signal Process. Control 2021, 68, 102730. [Google Scholar] [CrossRef]
- Diaz-Escobar, J.; Kober, V.; Díaz-Ramírez, A. Breast cancer detection in digital mammography using phase features and machine learning approach. Appl. Mach. Learn. 2022, 12227, 197–202. [Google Scholar]
- Petrini, D.G.P.; Shimizu, C.; Roela, R.A.; Valente, G.V.; Folgueira, M.A.A.K.; Kim, H.Y. Breast cancer diagnosis in two-view mammography using end-to-end trained efficientnet-based convolutional network. IEEE Access 2022, 10, 77723–77731. [Google Scholar] [CrossRef]
- Aslan, M.F. A hybrid end-to-end learning approach for breast cancer diagnosis: Convolutional recurrent network. Comput. Electr. Eng. 2023, 105, 108562. [Google Scholar] [CrossRef]
- Lekamlage, C.D.; Afzal, F.; Westerberg, E.; Cheddad, A. Mini-DDSM: Mammography-based automatic age estimation. In Proceedings of the 2020 3rd International Conference on Digital Medicine and Image Processing, Kyoto, Japan, 6–9 November 2020; pp. 1–6. [Google Scholar]
- Sorkhei, M.; Liu, Y.; Azizpour, H.; Azavedo, E.; Dembrower, K.; Ntoula, D.; Zouzos, A.; Strand, F.; Smith, K. CSAW-M: An ordinal classification dataset for benchmarking mammographic masking of cancer. arXiv 2021, arXiv:2112.01330. [Google Scholar]
- Zuiderveld, K. Contrast Limited Adaptive Histogram Equalization. In Graphics Gems IV; Heckbert, P.S., Ed.; Academic Press: San Diego, CA, USA, 1994; pp. 474–485. [Google Scholar]
- Morrone, M.C.; Ross, J.; Burr, D.C.; Owens, R. Mach bands are phase dependent. Nature 1986, 324, 250–253. [Google Scholar] [CrossRef]
- Morrone, M.; Owens, R. Feature detection from local energy. Pattern Recognit. Lett. 1987, 6, 303–313. [Google Scholar] [CrossRef]
- Morrone, M.C.; Burr, D. Feature detection in human vision: A phase-dependent energy model. Proc. R. Soc. Lond. Ser. B Biol. Sci. 1988, 235, 221–245. [Google Scholar]
- Felsberg, M.; Sommer, G. The monogenic scale-space: A unifying approach to phase-based image processing in scale-space. J. Math. Imaging Vis. 2004, 21, 5–26. [Google Scholar] [CrossRef]
- Kovesi, P. Image features from phase congruency. Videre J. Comput. Vis. Res. 1999, 1, 1–26. [Google Scholar]
- Aljuaid, H.; Alturki, N.; Alsubaie, N.; Cavallaro, L.; Liotta, A. Computer-aided diagnosis for breast cancer classification using deep neural networks and transfer learning. Comput. Methods Programs Biomed. 2022, 223, 106951. [Google Scholar] [CrossRef]
- Tan, M.; Le, Q. Efficientnetv2: Smaller models and faster training. In Proceedings of the International Conference on Machine Learning, Online, 18–24 July 2021; pp. 10096–10106. [Google Scholar]
- Tan, M.; Le, Q. Efficientnet: Rethinking model scaling for convolutional neural networks. In Proceedings of the International Conference on Machine Learning, Boca Raton, FL, USA, 16–19 December 2019; pp. 6105–6114. [Google Scholar]
- Russakovsky, O.; Deng, J.; Su, H.; Krause, J.; Satheesh, S.; Ma, S.; Huang, Z.; Karpathy, A.; Khosla, A.; Bernstein, M. Imagenet large scale visual recognition challenge. Int. J. Comput. Vis. 2015, 115, 211–252. [Google Scholar] [CrossRef]
- Gupta, S.; Akin, B. Accelerator-aware Neural Network Design Using AutoML. arXiv 2020, arXiv:2003.02838. [Google Scholar] [CrossRef]
- Li, H.; Cui, J.; Zhang, X.; Han, Y.; Cao, L. Dimensionality Reduction and Classification of Hyperspectral Remote Sensing Image Feature Extraction. Remote Sens. 2022, 14, 4579. [Google Scholar] [CrossRef]
- Ahmad, N.A. Numerically stable locality-preserving partial least squares discriminant analysis for efficient dimensionality reduction and classification of high-dimensional data. Heliyon 2024, 10, e26157. [Google Scholar] [CrossRef]
- Yaniv, A.; Beck, Y. Enhancing NILM classification via robust principal component analysis dimension reduction. Heliyon 2024, 10, e30607. [Google Scholar] [CrossRef]
- Subasi, A.; Kadasa, B.; Kremic, E. Classification of the cardiotocogram data for anticipation of fetal risks using bagging ensemble classifier. Procedia Comput. Sci. 2020, 168, 34–39. [Google Scholar] [CrossRef]
- Jafarzadeh, H.; Mahdianpari, M.; Gill, E.; Mohammadimanesh, F.; Homayouni, S. Bagging and boosting ensemble classifiers for classification of multispectral, hyperspectral and polsar data: A comparative evaluation. Remote Sens. 2021, 13, 4405. [Google Scholar] [CrossRef]
- Fatima, N.; Liu, L.; Hong, S.; Ahmed, H. Prediction of breast cancer, comparative review of machine learning techniques, and their analysis. IEEE Access 2020, 8, 150360–150376. [Google Scholar] [CrossRef]
- Ibrahim, S.; Nazir, S.; Velastin, S.A. Feature selection using correlation analysis and principal component analysis for accurate breast cancer diagnosis. J. Imaging 2021, 7, 225. [Google Scholar] [CrossRef] [PubMed]
- Lehman, C.D.; Arao, R.F.; Sprague, B.L.; Lee, J.M.; Buist, D.S.; Kerlikowske, K.; Henderson, L.M.; Onega, T.; Tosteson, A.N.; Rauscher, G.H. National performance benchmarks for modern screening digital mammography: Update from the breast cancer surveillance consortium. Radiology 2017, 283, 49–58. [Google Scholar] [CrossRef] [PubMed]
- Rawashdeh, M.A.; Lee, W.B.; Bourne, R.M.; Ryan, E.A.; Pietrzyk, M.W.; Reed, W.M.; Heard, R.C.; Black, D.A.; Brennan, P.C. Markers of good performance in mammography depend on number of annual readings. Radiology 2013, 269, 61–67. [Google Scholar] [CrossRef]
- Theberge, I.; Chang, S.L.; Vandal, N.; Daigle, J.M.; Guertin, M.H.; Pelletier, E.; Brisson, J. Radiologist interpretive volume and breast cancer screening accuracy in a canadian organized screening program. J. Natl. Cancer Inst. 2014, 106, 461. [Google Scholar] [CrossRef] [PubMed]
- Giess, C.S.; Wang, A.; Ip, I.K.; Lacson, R.; Pourjabbar, S.; Khorasani, R. Patient, radiologist, and examination characteristics affecting screening mammography recall rates in a large academic practice. J. Am. Coll. Radiol. 2019, 16, 411–418. [Google Scholar] [CrossRef] [PubMed]
- Nelson, H.D.; Pappas, M.; Cantor, A.; Griffin, J.; Daeges, M.; Humphrey, L. Harms of breast cancer screening: Systematic review to update the 2009 us preventive services task force recommendation. Ann. Intern. Med. 2016, 164, 256–267. [Google Scholar] [CrossRef]
- Tosteson, A.; Fryback, D.; Hammond, C.; Hanna, L.; Grove, M.; Brown, M.; Wang, Q.; Lindfors, K.; Pisano, E. Consequences of false-positive screening mammograms. Jama Intern. Med. 2014, 174, 954–961. [Google Scholar] [CrossRef]

| Reference | Images | Data Balanced? | No. of Classes | Train–Test Split (%) | Testing Results (%) |
|---|---|---|---|---|---|
| Mohanty [9] 92.61 (Acc, DDSM) | 319, 1500 | No | 3 | NR | 97.49 (Acc, MIAS) |
| Muduli [10] | 326, 1500, 410 | No | 2 | NR | 100 (Acc, MIAS) 98.94 (Acc, DDSM) 98.76 (Acc, INbreast) |
| Bacha [11] | 322, 569 | No | 2 | NR | 100.00 (Acc, MIAS) 91.13 (Acc, WBCD) |
| Thawkar [12] | 651 | No | 2 | 70/30 | 97.85 (Acc, DDSM) |
| Amin [13] | 633 | No | 2 | 60/20/20 | 96.34 (Acc, CESM) |
| Elmoufidi [14] | 1923 | No | 2 | NR | 98.62 (Acc, DDSM) 98.04 (Acc, MIAS) 98.26 (Acc, INbreast) |
| Reference | Images | Data Balanced? | No. of Classes | Train–Test Split (%) | CNN Model | Testing Results (%) |
|---|---|---|---|---|---|---|
| Al-antari [16] | 600, 103 | Yes | 2 | 70/20/10 | ResNet-50, Inception-ResNet-V2 | 97.50 (Acc, DDSM) 95.32 (Acc, INbreast) |
| El Houby [32] | 322, 1592, 387 | No | 2 | NR | Custom | 95.30 (Acc, MIAS) 91.20 (Acc, DDSM) 96.52 (Acc, INbreast) |
| Huang [33] | 410 | No | 2 | NR | AlexNet, DenseNet, ShuffleNet | 99.72 (Acc, INbreast) |
| Xu [34] | 10,480, 410 | No | 2 | 80/20 | MSANet | 94.2 (AUC, DDSM) 92. 85 (AUC, INbreast) |
| Diaz-Escobar [35] | 322, 410, 2620, 10,020 | Yes | 2 | NR | ResNet50 | 82.20 (Acc, MIAS, INbreast, DDSM, CSAW-M) |
| Karthiga [18] | 53, 2188, 106 | No | 2 | 80/20 | Custom | 95.95 (Acc, MIAS) 99.39 (Acc, DDSM) 96.53 (Acc, INbreast) |
| Petrini [36] | 3103 | No | 2 | 79.21/20.79 | EfficientNet-B4 | 93.44 (AUC, DDSM) |
| Wei [20] | 3103 | No | 2 | 85/15 | MorphHR | 83.13 (AUC, DDSM) |
| Lou [17] | 410 | No | 2 | ECA-Net50, ResNet50 | NR | 92.29% (Acc, INbreast) |
| Wang [19] | 378, 378 | No | 2 | 80/10/10 | VGG16 | 91.28 (Acc, LES, DES) |
| Reference | Images | Class Type | Balanced? | Train–Test Split (%) | Hybrid CNN Model | Testing Results (%) |
|---|---|---|---|---|---|---|
| Ragab [21] | 891, 322 | Binary | No | NR | AlexNet, GoogleNet, ResNet-18 | 97.9 (Acc, DDSM) 95.4 (Acc, MIAS) |
| Zahoor [22] | 108, 300, 1696 | Binary/Multiclass | No | 50/50 | MobileNetV2, NasNet Mobile | 99.7 (Acc, INbreast) 99.8 (Acc, MIAS) 93.8 (Acc, DDSM) |
| Haq [23] | 322, 70 | Binary | No | 70/20/10 | Custom | 99.4 (Acc, MIAS) 98.5 (Acc, BCDR) |
| Chakravarthy [27] | 115, 113, 569 | Binary | No | 70/25 | Custom | 84.4 (Acc, MIAS) 83.2 (Acc, INbreast) 97.4 (Acc, WDBC) |
| Aslan [37] | 322, 336 | Multiclass | No | 80/20 | Custom, BiLSTM | 97.6 (Acc, MIAS) 98.6 (Acc, INbreast) |
| Xia [25] | 536 | Binary | No | 80/20 | ResNeXt | 90.6 (Acc) 94.9 (AUC) |
| Vidivelli [28] | DR | Multiclass | No | 50/20/30 | Custom | 93.5 (Acc, MIAS) 91.4 (Acc, DDSM) |
| Approach | Advantages | Disadvantages | References |
|---|---|---|---|
| Machine Learning |
|
| [9,10,11,12,13,14] |
| Deep Learning |
|
| [16,17,18,19,20,32,33,34,35,36] |
| Hybrid Methods |
|
| [21,22,23,25,27,28,37] |
| Model Variant | Input Shape | Output Vector Length |
|---|---|---|
| V2S | 1280 | |
| V2M | 1280 | |
| V2L | 1280 | |
| V2XL | 1280 |
| Model | Classifier | Acc (%) | Pre (%) | Rec (%) | F1 (%) |
|---|---|---|---|---|---|
| EfficientNetV2S | Voting KNN | 86.17 | 77.58 | 86.17 | 79.86 |
| Stacking | 86.28 | 76.24 | 86.24 | 79.87 | |
| Bagging | 86.24 | 76.54 | 85.24 | 79.80 | |
| Boosting | 86.24 | 77.23 | 86.24 | 79.85 | |
| EfficientNetV2M | Voting KNN | 86.13 | 78.75 | 86.14 | 80.09 |
| Stacking | 86.28 | 78.75 | 86.14 | 80.09 | |
| Bagging | 84.88 | 77.70 | 84.88 | 80.11 | |
| Boosting | 86.25 | 84.12 | 85.20 | 84.65 | |
| EfficientNetV2L | Voting KNN | 86.10 | 78.50 | 86.10 | 79.95 |
| Stacking | 86.24 | 86.24 | 86.24 | 79.87 | |
| Bagging | 84.87 | 76.99 | 84.87 | 79.82 | |
| Boosting | 86.25 | 84.00 | 85.05 | 84.50 | |
| EfficientNetV2XL | Voting KNN | 85.95 | 78.60 | 85.95 | 80.20 |
| Stacking | 86.21 | 85.97 | 86.21 | 79.83 | |
| Bagging | 84.88 | 78.08 | 84.88 | 80.28 | |
| Boosting | 86.18 | 78.90 | 86.18 | 79.89 |
| Model | Classifier | Acc (%) | Pre (%) | Rec (%) | F1 (%) |
|---|---|---|---|---|---|
| EfficientNetV2S | Voting KNN | 93.41 | 93.24 | 93.41 | 90.23 |
| Stacking | 93.43 | 93.43 | 93.43 | 90.26 | |
| Bagging | 93.30 | 87.76 | 93.30 | 90.21 | |
| Boosting | 93.43 | 90.51 | 93.43 | 90.29 | |
| EfficientNetV2M | Voting KNN | 93.45 | 93.27 | 93.45 | 90.29 |
| Stacking | 93.38 | 93.38 | 93.38 | 90.18 | |
| Bagging | 93.22 | 88.10 | 93.22 | 90.21 | |
| Boosting | 93.41 | 89.63 | 93.41 | 90.30 | |
| EfficientNetV2L | Voting KNN | 93.43 | 93.38 | 87.33 | 90.26 |
| Stacking | 93.40 | 87.61 | 93.19 | 90.22 | |
| Bagging | 93.28 | 87.76 | 93.28 | 90.17 | |
| Boosting | 93.34 | 89.34 | 93.34 | 90.18 | |
| EfficientNetV2XL | Voting KNN | 93.31 | 93.25 | 93.31 | 90.08 |
| Stacking | 93.47 | 87.61 | 93.19 | 90.32 | |
| Bagging | 93.29 | 87.86 | 93.29 | 90.20 | |
| Boosting | 93.34 | 89.45 | 93.33 | 90.16 |
| True Label | Cancer | No Cancer |
|---|---|---|
| (a) | ||
| Cancer | 379 (TP) | 61 (FN) |
| No Cancer | 102 (FP) | 4109 (TN) |
| (b) | ||
| Cancer | 243 (TP) | 18 (FN) |
| No Cancer | 34 (FP) | 2711 (TN) |
| Reference | Images | RepVal | Acc (%) | Pre (%) | Rec (%) | F1 (%) | AUC |
|---|---|---|---|---|---|---|---|
| Muduli [10] | 2236 | No | 98.94 | – | – | – | – |
| Bacha & Taouali [11] | 991 | No | 100.00 | – | – | – | 1.000 |
| Thawkar [12] | 651 | No | 97.85 | – | 98.22 | – | – |
| Elmoufidi [14] | 1923 | No | 98.62 | – | 98.60 | – | 0.9817 |
| Amin [13] | 633 | No | 96.87 | – | 97.23 | – | 0.980 |
| Chakravarthy [27] | 797 | No | 97.90 | 97.36 | – | – | – |
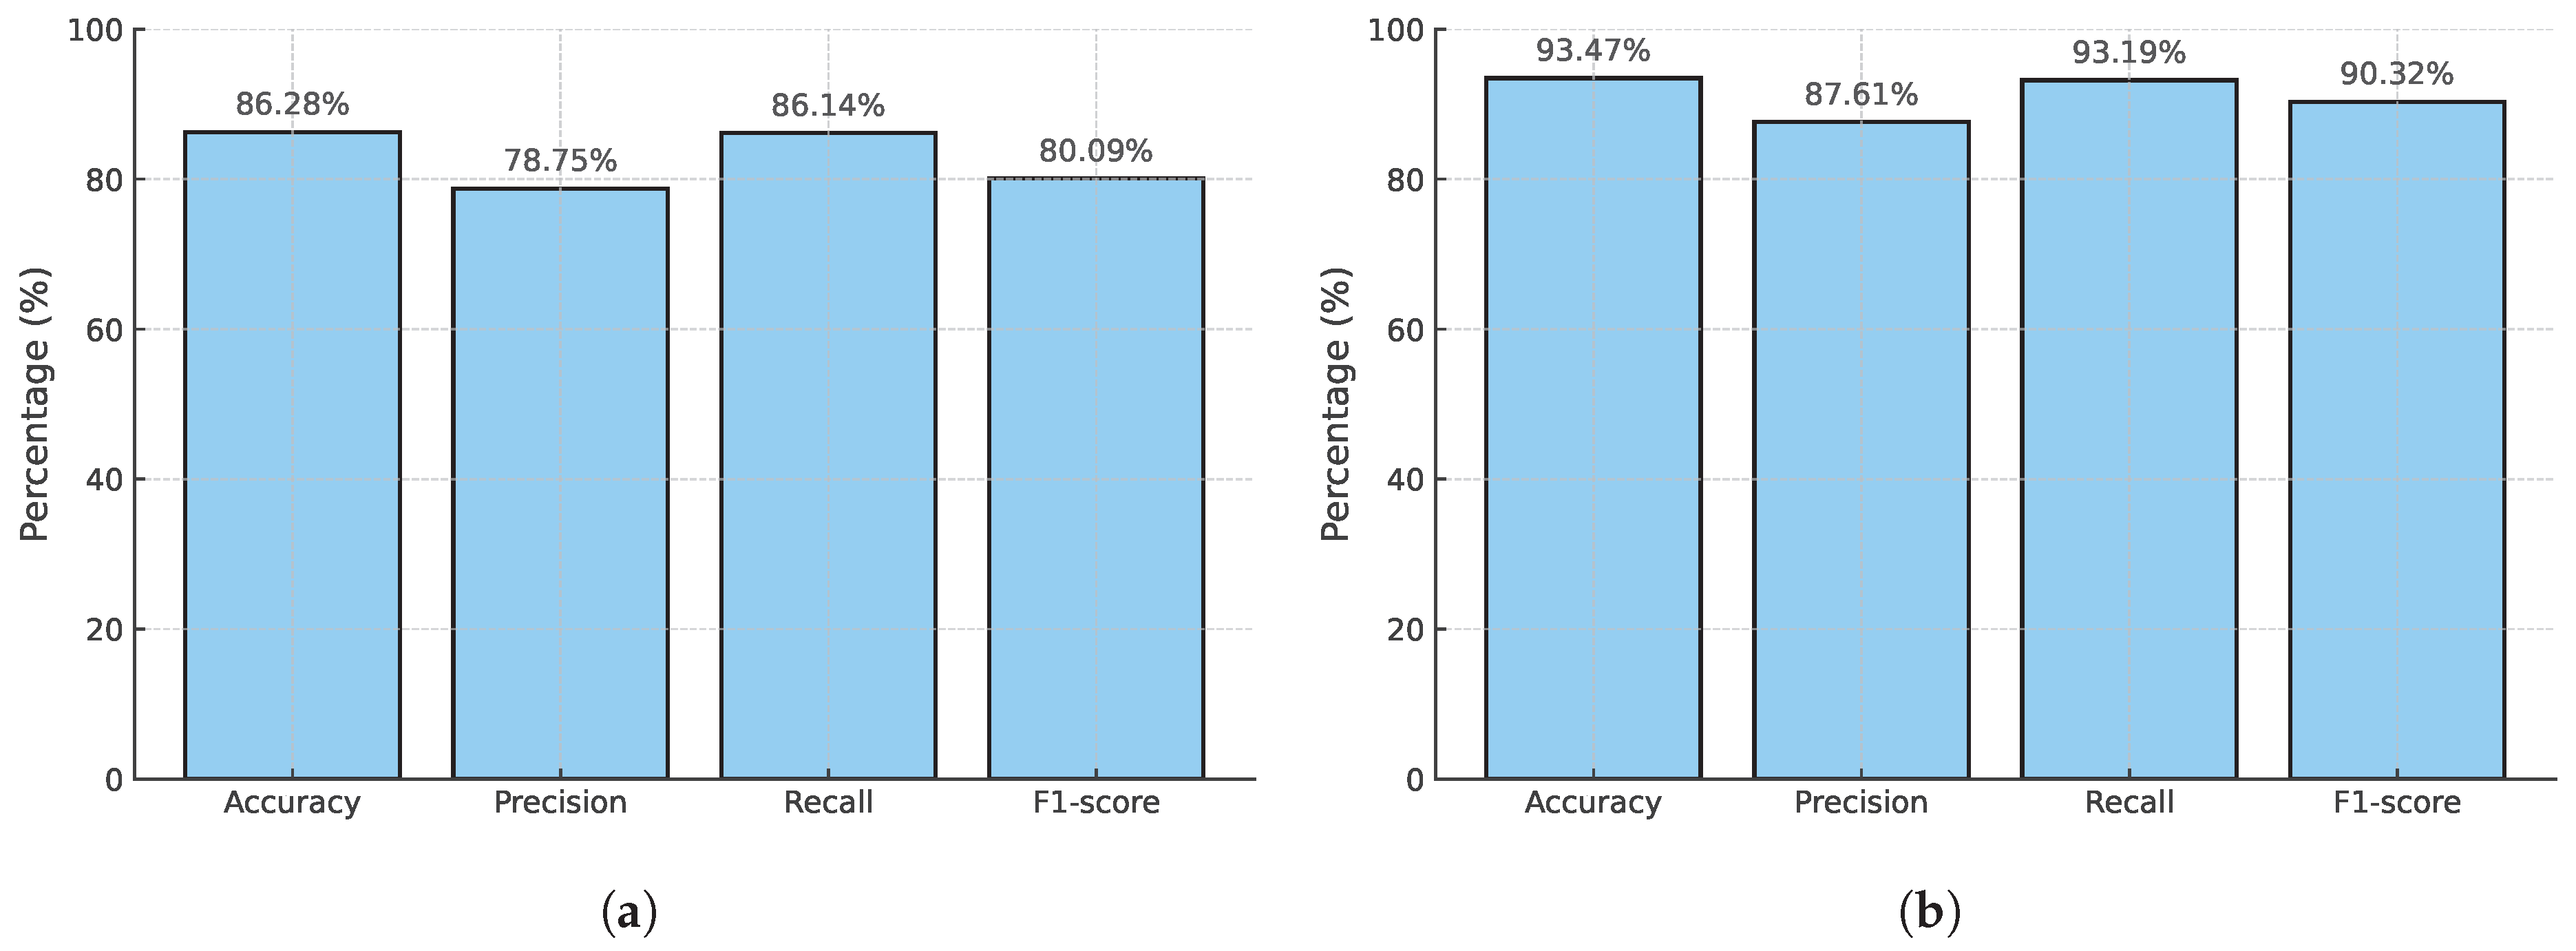
| Proposed (CSAW-M) | 10,020 | Yes | 93.47 | 87.61 | 93.19 | 90.32 | – |
| Proposed (mini-DDSM, MIAS, CSAW-M) | 15,506 | Yes | 86.28 | 78.75 | 86.14 | 80.09 | – |
Disclaimer/Publisher’s Note: The statements, opinions and data contained in all publications are solely those of the individual author(s) and contributor(s) and not of MDPI and/or the editor(s). MDPI and/or the editor(s) disclaim responsibility for any injury to people or property resulting from any ideas, methods, instructions or products referred to in the content. |
© 2025 by the authors. Licensee MDPI, Basel, Switzerland. This article is an open access article distributed under the terms and conditions of the Creative Commons Attribution (CC BY) license (https://creativecommons.org/licenses/by/4.0/).
Share and Cite
Molina Molina, E.O.; Diaz-Ramirez, V.H. Breast Cancer Image Classification Using Phase Features and Deep Ensemble Models. Appl. Sci. 2025, 15, 7879. https://doi.org/10.3390/app15147879
Molina Molina EO, Diaz-Ramirez VH. Breast Cancer Image Classification Using Phase Features and Deep Ensemble Models. Applied Sciences. 2025; 15(14):7879. https://doi.org/10.3390/app15147879
Chicago/Turabian StyleMolina Molina, Edgar Omar, and Victor H. Diaz-Ramirez. 2025. "Breast Cancer Image Classification Using Phase Features and Deep Ensemble Models" Applied Sciences 15, no. 14: 7879. https://doi.org/10.3390/app15147879
APA StyleMolina Molina, E. O., & Diaz-Ramirez, V. H. (2025). Breast Cancer Image Classification Using Phase Features and Deep Ensemble Models. Applied Sciences, 15(14), 7879. https://doi.org/10.3390/app15147879