Article

NeuroTIS+: An Improved Method for Translation Initiation Site Prediction in Full-Length mRNA Sequence via Primary Structural Information

1
School of Computer Science, Hubei University of Technology, Wuhan 430068, China
2
Hubei Provincial Key Laboratory of Green Intelligent Computing Power Network, Wuhan 430068, China
3
Hubei Provincial Engineering Research Center for Digital & Intelligent Manufacturing Technologies and Applications, Wuhan 430068, China
*
Author to whom correspondence should be addressed.
Appl. Sci. 2025, 15(14), 7866; https://doi.org/10.3390/app15147866 (registering DOI)
Submission received: 4 June 2025 / Revised: 2 July 2025 / Accepted: 10 July 2025 / Published: 14 July 2025
(This article belongs to the Section Computing and Artificial Intelligence)

Abstract

Translation initiation site (TIS) prediction in mRNA sequences constitutes an essential component of transcriptome annotation, playing a crucial role in deciphering gene expression and regulation mechanisms. Numerous computational methods have been proposed and achieved acceptable prediction accuracy. In our previous work, we developed NeuroTIS, a novel method for TIS prediction based on a hybrid dependency network combined with a deep learning framework that explicitly models label dependencies both within coding sequences (CDSs) and between CDSs and TISs. However, this method has limitations in fully exploiting the primary structural information within mRNA sequences. First, it only captures label dependency within three neighboring codon labels. Second, it neglects the heterogeneity of negative TISs originating from different reading frames, which exhibit distinct coding features in their vicinity. In this paper, under the framework of NeuroTIS, we propose its enhanced version, NeuroTIS+, which allows for more sophisticated codon label dependency modeling via temporal convolution and homogenous feature building through an adaptive grouping strategy. Tests on transcriptome-wide human and mouse datasets demonstrate that the proposed method yields excellent prediction performance, significantly surpassing the existing state-of-the-art methods.

1. Introduction

Translation initiation is a pivotal process in the regulation of gene expression, determining where protein synthesis begins on messenger RNA (mRNA). The dysregulation of this initiation process can cause various human diseases, including cancers and metabolic disorders [1,2,3]. Translation initiation site (TIS) prediction is an essential step in transcriptome annotation that aims to elucidate the biological relevance [4]. The accurate prediction of TISs is not only important for profiling the protein coding fraction of the transcriptome but also for the accurate identification of untranslated regions (UTRs), which are known as important regulators in the translation process [4]. Thus, TIS prediction holds significant importance for studying the disease mechanisms of occurrence and development.
The identification of TISs in uncharacterized mRNA sequences presents an inherently challenging task due to several key factors. These include the following: (1) Weak sequence conservation. In many organisms, translation initiation is guided by specific sequence motifs, such as the Kozak sequence [5] in eukaryotes and the Shine–Dalgarno sequence [6] in prokaryotes. However, these motifs are not universally conserved or sufficiently distinctive across all species, and TISs are surrounded by relatively poorly conserved sequences [7]. (2) Complexity in the translation initiation mechanism. In many mRNAs, there can be multiple potential translation initiation sites that may produce alternative protein isoforms or regulatory proteins. For instance, numerous mRNAs harbor several open reading frames (ORFs), among which upstream ORFs (uORFs) often inhibit the translation of the downstream CDS [8,9,10]. These alternative initiation sites necessitate sophisticated computational techniques to resolve ambiguities. In this paper, we focus on TIS prediction in the main ORF with tri-nucleotide AUG, which is biologically prevalent in eukaryotes.
Over the past few decades, numerous computational methods have been proposed for TIS prediction, primarily categorized by their classifiers. The commonly employed techniques encompass artificial neural networks (ANNs) [3,11,12,13], support vector machine (SVM) [14,15,16], linear discriminant analysis (LDA) [17], and Gaussian-based models [18]. According to the existing research, the study in [17] proposed a method called AUGpr for TIS identification using LDA, which utilizes six effective features around AUG, such as a position triplet weight matrix and ORF hexanucleotide features. The improved version of AUGpr, called AUGpr_sim, was proposed by [19], which exploits both statistical information and similarity to other known proteins to achieve higher prediction performance in cDNA sequences. Ref. [14] explored SVMs with different kernel functions for TIS prediction. The authors claimed that the careful design of kernel functions helps to improve prediction accuracy. Ref. [20] proposed a novel method for eukaryotic gene structure prediction based on a modular neural network system. The prediction task was performed by detecting different signals and contents based on different neural networks. In [21], a novel ensemble method was developed for TIS prediction, integrating two specialized neural networks: one detecting conserved motifs and the other one analyzing coding features around start codons. In [22], a modular approach for TIS prediction, called MANTIS, was proposed, which mainly consists of three models: consensus, coding region classification, and AUG positioning. Three dedicated classifiers were utilized to execute these models in MANTIS, whose outputs were subsequently fused by the ultimate decision classifier. Its enhanced variant, StackTIS, employing modified learning procedures and training strategies, was subsequently documented in [23]. All these methods demonstrate the significance of fusing multiple features (e.g., consensus motifs and coding features) for TIS prediction. In recent advancements, deep learning techniques have demonstrated remarkable efficacy in translation initiation site (TIS) prediction. A notable contribution by [13] introduced TISRover, a convolutional neural network (CNN) approach capable of autonomously extracting critical biological features directly from genomic sequences (e.g., Kozak consensus sequences [5], reading frame characteristics, and donor splice site motifs). Unlike modular systems such as MANTIS and StackTIS that explicitly engineer and combine discrete feature sets, TISRover operates through implicit feature learning. Later, we proposed a method, called NeuroTIS [24], for TIS prediction in mRNA sequences based on a hybrid dependency network and deep learning framework that explicitly models label dependencies among coding sequences (CDSs) between CDSs and TISs. NeuroTIS explicitly exploits coding features like StackTIS and implicitly learns consensus motifs like TISRover, and it achieves considerable improvements over other methods in terms of its predictive results.
Despite its effectiveness, NeuroTIS has two key limitations in mRNA primary structural information utilization. First, it incompletely models codon label consistency in a neighboring region. Meanwhile, its skip-connected bidirectional RNN (skipBRNN) aggregates the two most informative neighboring positions into their current positions; however, as shown in Figure 1, the CDS is a continuous region where codon labels are consistent with a multiple of three; hence, all the neighboring positions can provide more or less information regarding the current position. Technically speaking, it is difficult for skipBRNN to aggregate more informative neighboring positions to the current position because the network is sequentially connected. Furthermore, the network is also low-scaled and hence has too limited expressive power to model complex non-linear relationships between inputs and outputs. Second, positive TISs initiate triplet decoding in the first reading frame, while negative TISs may reside in any frame without triggering sustained translation, resulting in heterogeneous coding features around negative TISs, as shown in Figure 1. For positive TISs, the coding features around t 1 are homogeneous, but, for negative TISs, such as t 2 and t 3 , they are located in different reading frames, and hence the coding features around them are heterogeneous. During the process of TIS prediction, it is difficult for a CNN to map these heterogeneous features to the same label. This is because the weights of a CNN are global and shared by all the data, so they must reconcile to fit all the heterogeneous features when they are updated by the backpropagation algorithm [25].
In this study, we address the aforementioned limitations through the development of NeuroTIS+, an enhanced method for TIS prediction leveraging primary structural information in mRNA sequences. NeuroTIS+ models codon label consistency by using a Temporal Convolutional Network (TCN) [26], which allows for more expressive power to model coding probability outputs and more flexible codon label information aggregation than NeuroTIS. Moreover, NeuroTIS+ considers the heterogeneity of negative samples and trains three frame-specific CNNs for translation initiation site prediction. Comparative evaluations on human and mouse transcriptome-wide mRNA sequences reveal that our method substantially outperforms the existing state-of-the-art methods in terms of prediction performance. There are three key innovations that contribute to the enhanced performance of our proposed framework:
  • The proposed method, NeuroTIS+, is an improved version of NeuroTIS, which preserves the basic framework of NeuroTIS and hence inherits the merits of explicitly modeling statistic dependencies among variables and automatic feature learning. Meanwhile, it assumes a stronger dependency relationship among codon labels and integrates novel frame information for TIS inference.
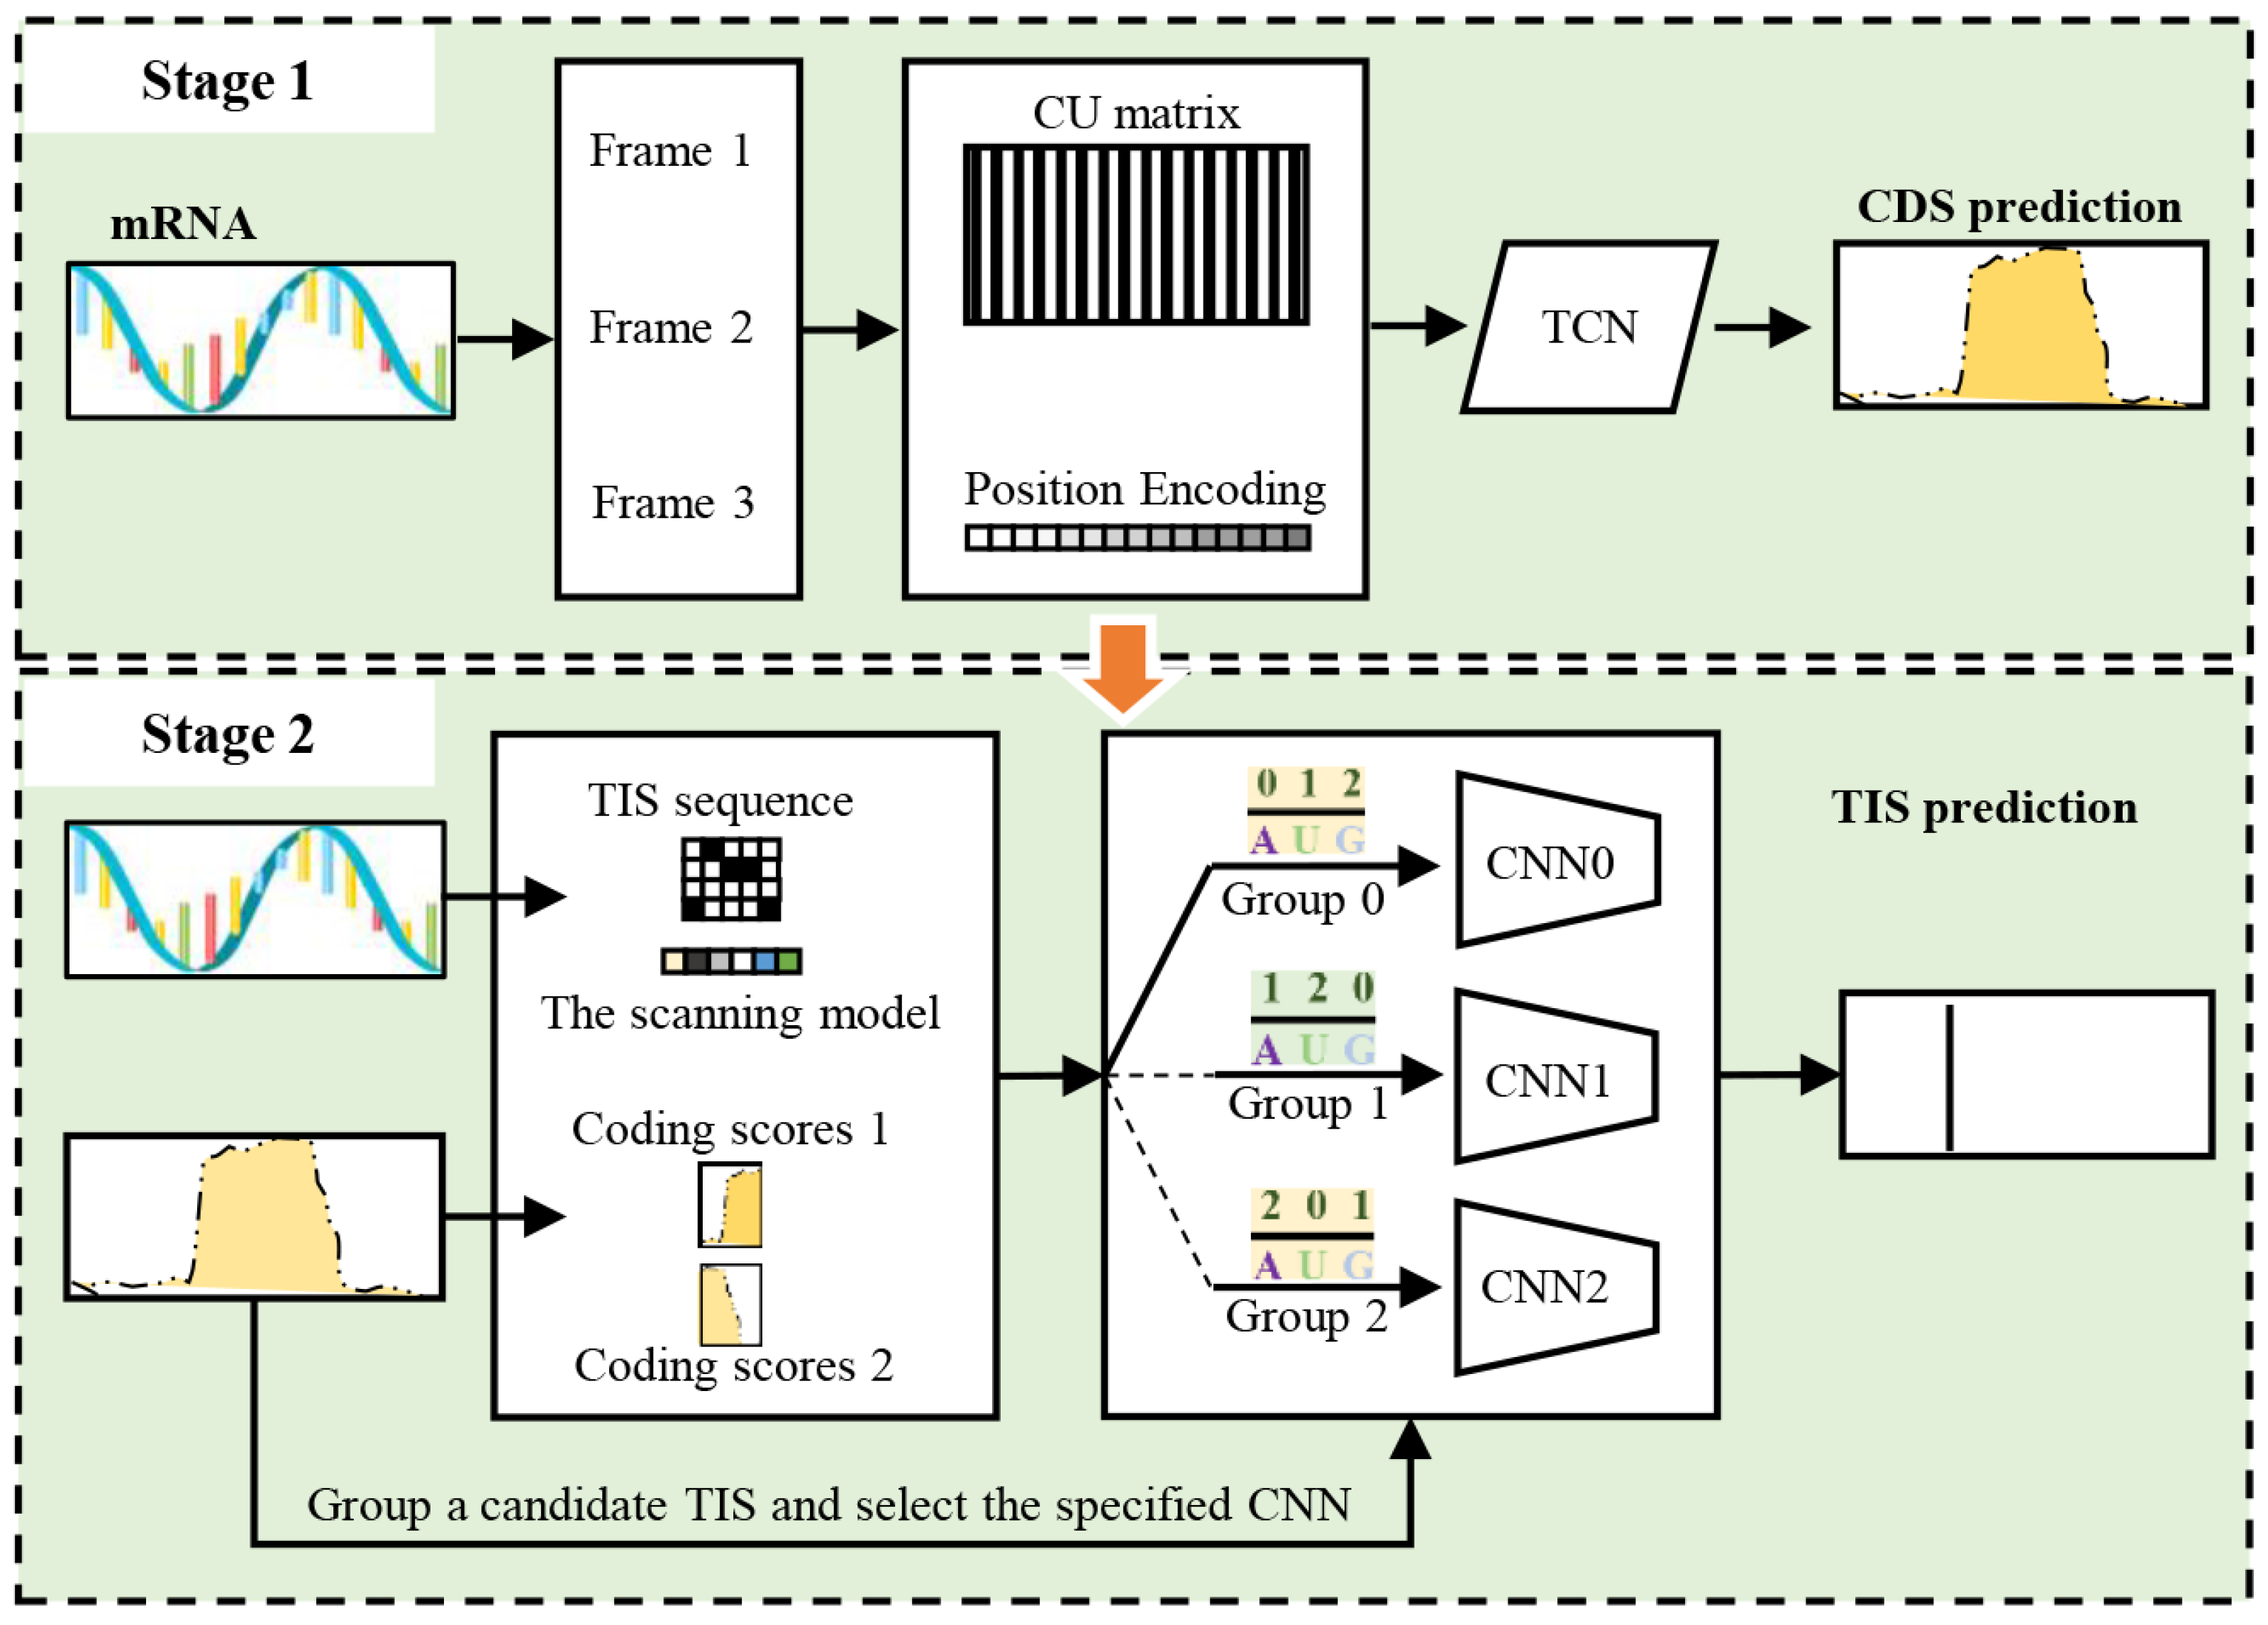
  • We consider the primary structural information that a CDS is continuous and models codon label consistency by using a TCN, which can easily and naturally aggregate information across multiple codon labels through its convolutional layers. Moreover, a position embedding and a fast codon usage generating strategy for a sequence are also proposed to improve the prediction of coding sequences in mRNA sequences.
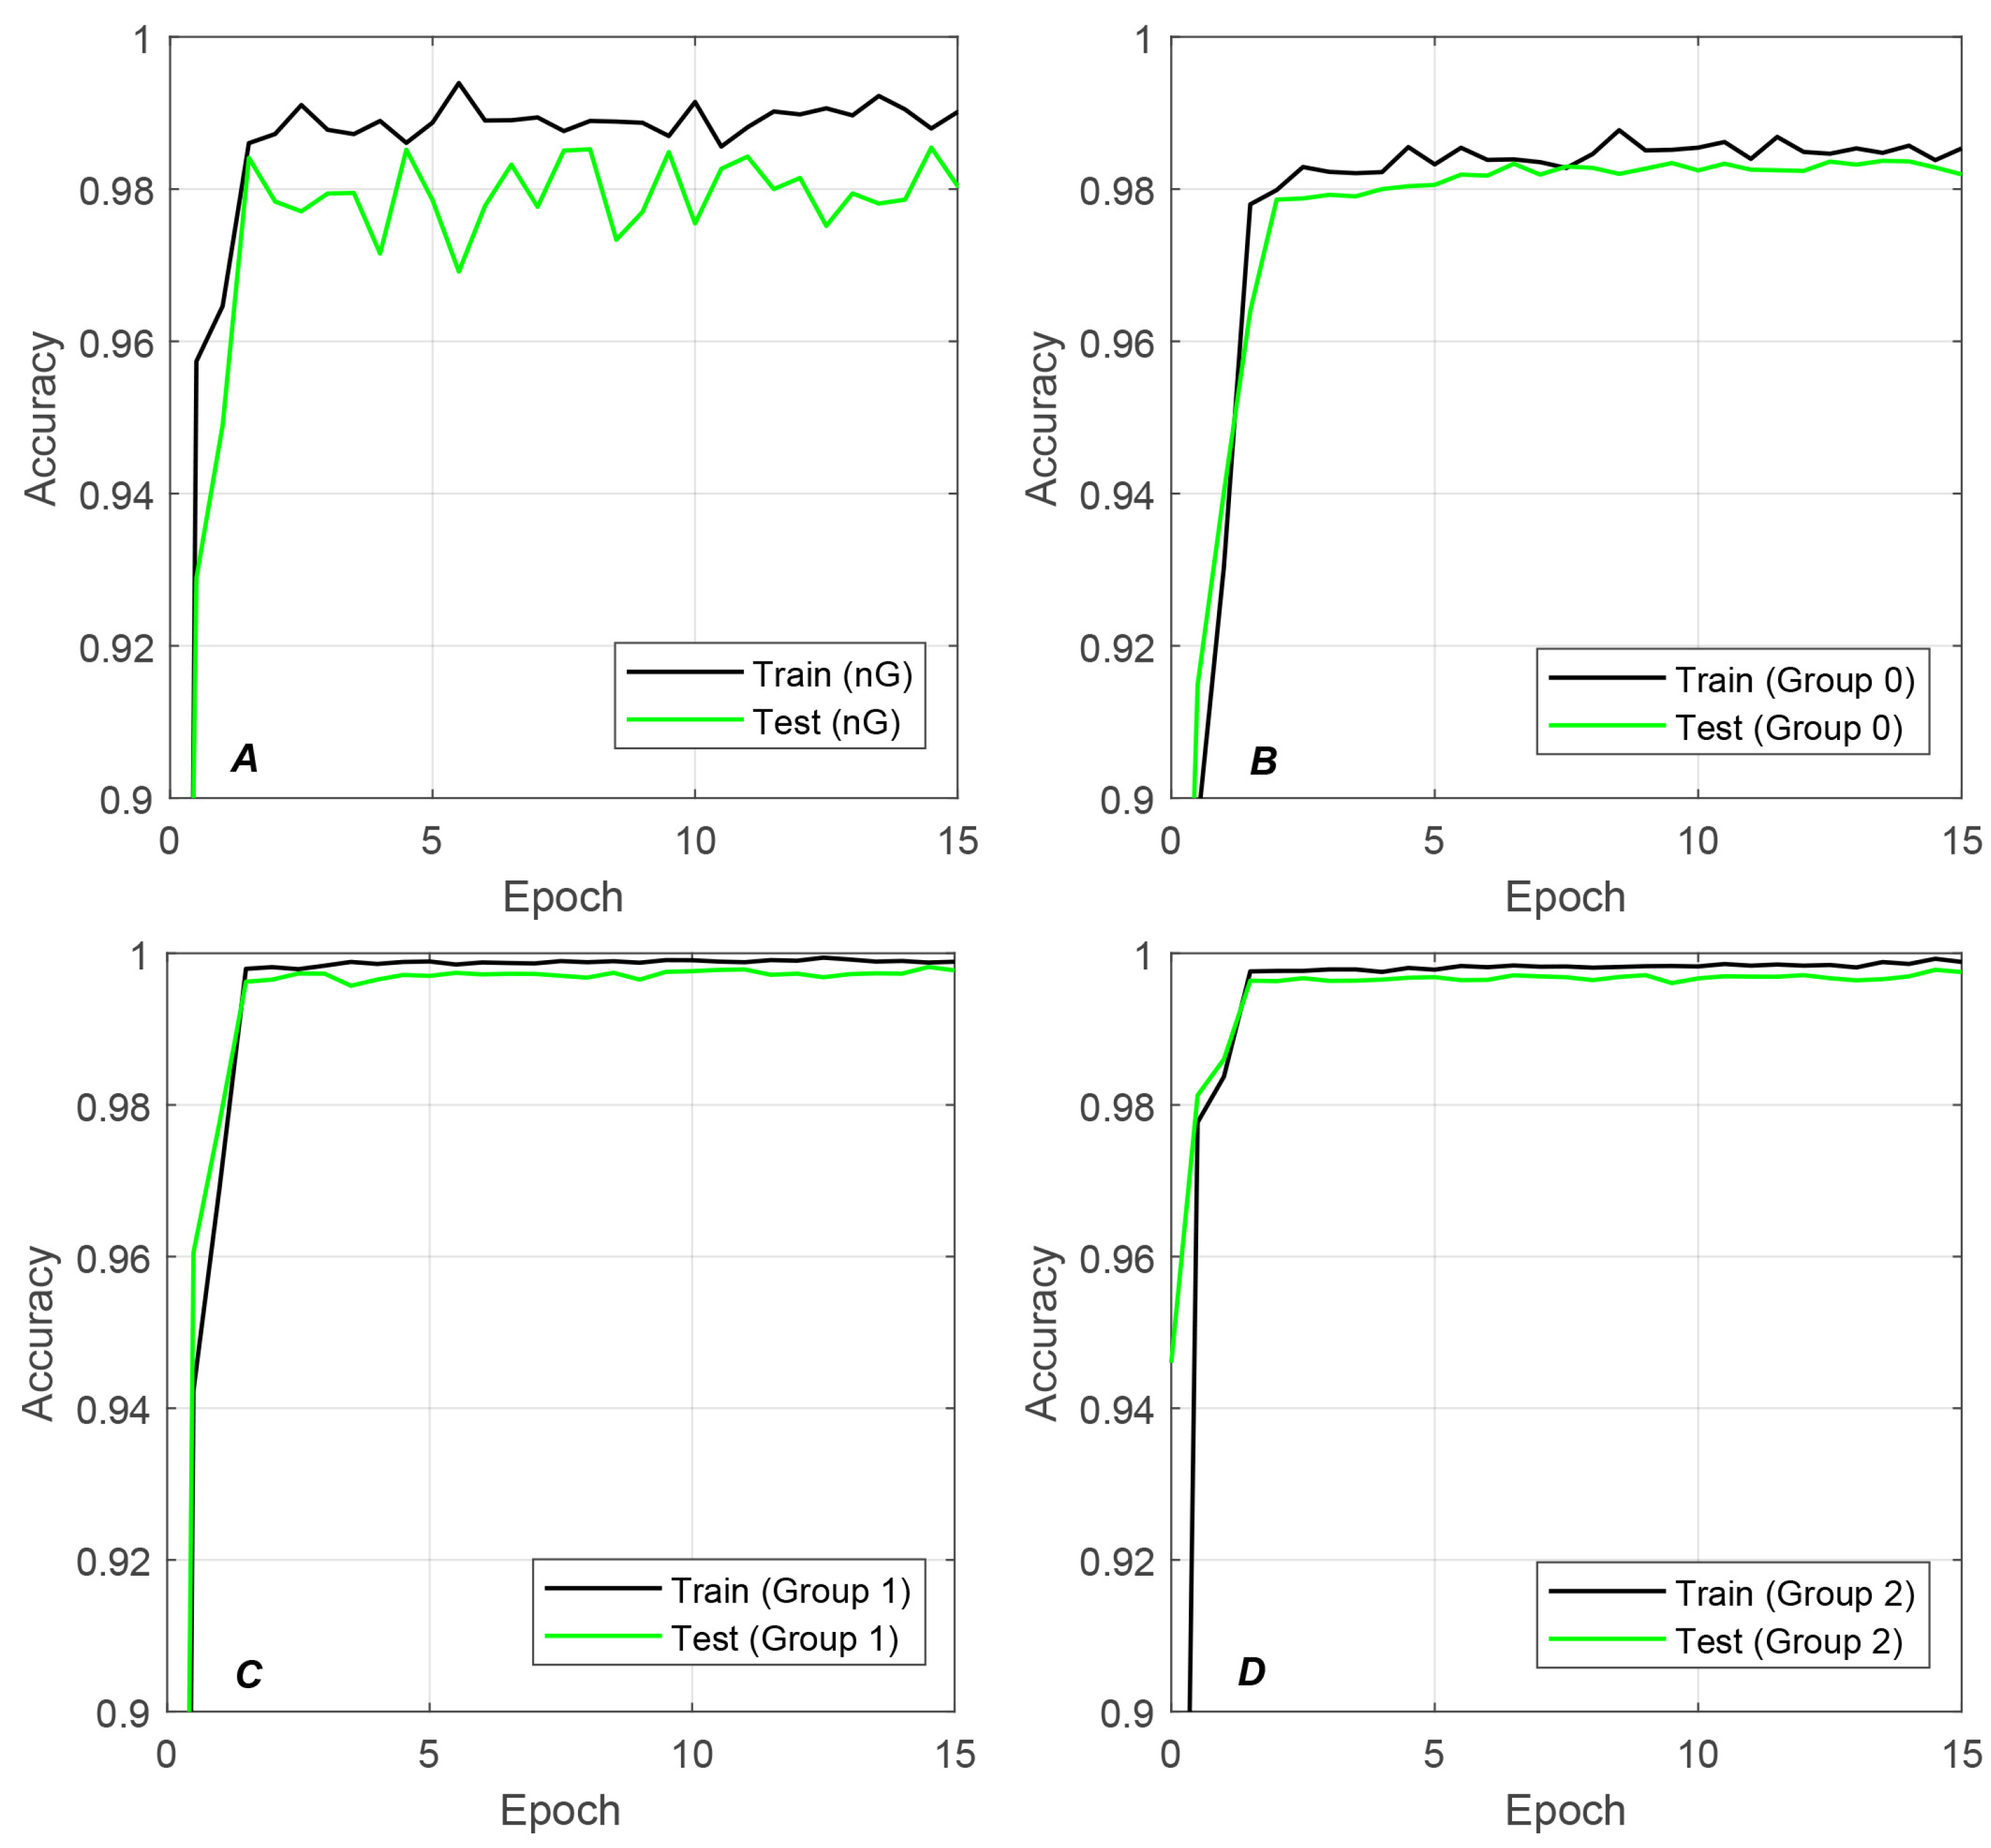
  • We consider the heterogeneity of negative TISs and develop an adaptive grouping strategy for homogenous feature building, which effectively improves the prediction accuracy of TISs. Moreover, the adaptive grouping strategy stabilizes the learning process of CNNs.
The source code and the dataset used in the paper are publicly available at https://github.com/hgcwei/NeuroTIS2.0 (accessed on 19 January 2025).

2. Related Works

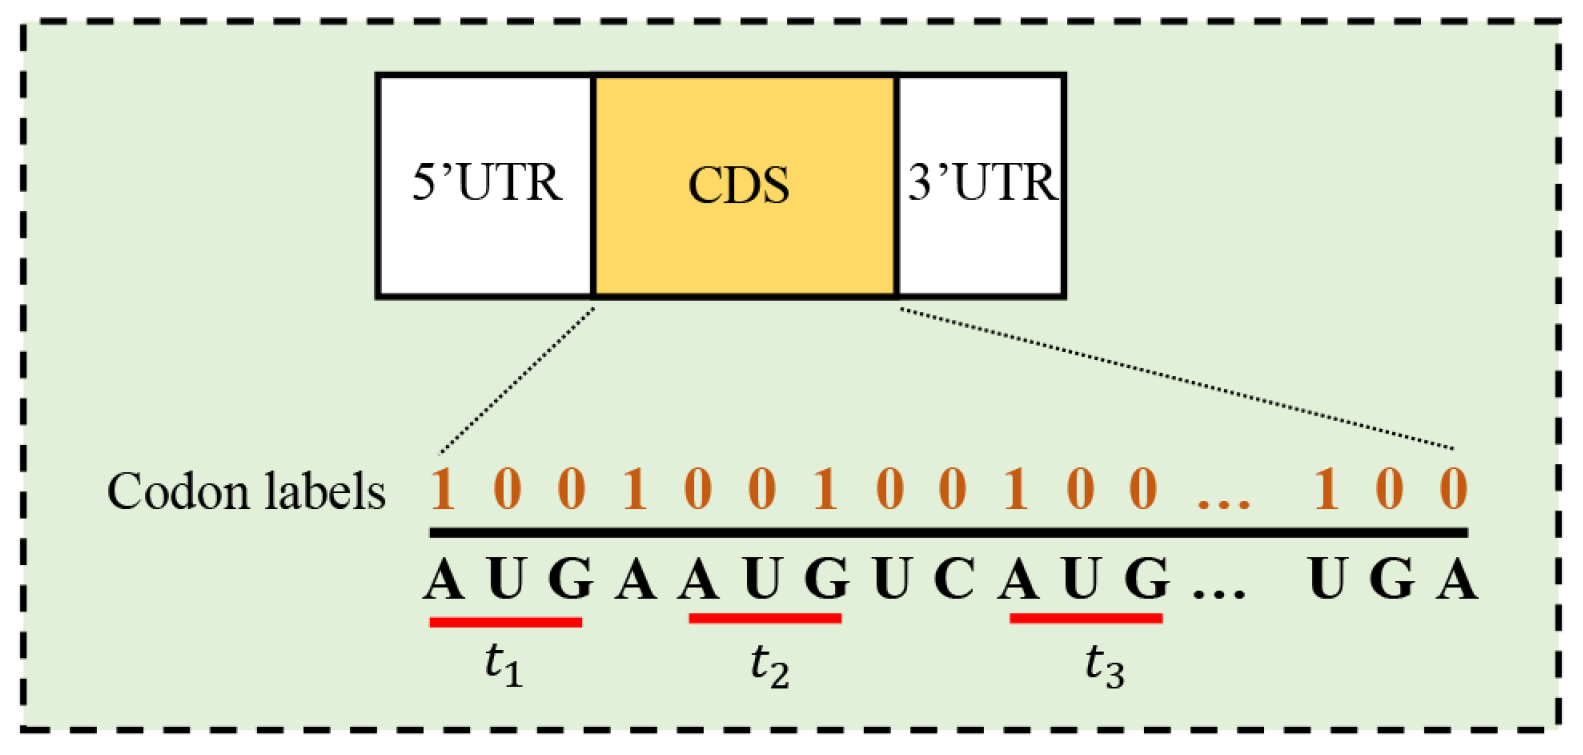
2.1. Codon Label Consistency

The idea of exploiting label consistency information for promoting model performance is widely used in image and video analysis. For example, when identifying human actions in videos, since the actions in adjacent video frames are often consistent, this constraint can be exploited to improve the accuracy of action recognition [26]. Similarly, in multi-label image classification tasks [27], objects of different categories in the image may have label dependencies, and considering this dependency information often improves the classification accuracy. All the aforementioned applications indicate that we can also benefit from considering codon label dependencies in the coding sequence prediction of an mRNA sequence. Based on this idea, our previous work proposed a skipBRNN for CDS prediction, which models codon label consistency by integrating the three most informative neighboring positions. However, it cannot fully model dependencies among multiple codon labels. In this paper, we employ a TCN for CDS prediction for the first time. A TCN is a common approach for modeling time sequences. It can effectively aggregate the local information of time sequences by virtue of temporal convolution. Hence, it is suitable for problems where there exists local label dependency, such as human action recognition [28], named entity recognition [29], etc. In addition, TCNs exhibit the powerful capability of automatic feature learning. Hence, most of the aforementioned applications often directly perform TCNs on their raw data, which saves the efforts of handcrafted features. In contrast, we incorporate codon usage statistics into the TCN, which not only obtains more meaningful results but also requires less data and is easier to train.

2.2. Non-Homogeneous Negative TIS

The problem of data heterogeneity is common in federated learning [30]; e.g., data have different feature distributions but the same label (domain shift [31]). Data heterogeneity induces the “catastrophic forgetting” problem for classification models; the global parameters might not be optimal simultaneously on data with different distributions. The model gradually “forgets” the knowledge learned from previous tasks during the continuous learning process [25]. Indeed, the data heterogeneity problem also occurs in TIS prediction. Negative TISs are often located in different regions in an mRNA sequence, and the contextual information of these TISs is very different. To our best knowledge, only a few works have paid attention to the non-homogeneous property of negative TISs in genomic sequences. TriTISA [32] is a method for detecting TISs in microbial genomes, which classifies all candidate TISs into three categories based on evolutionary properties, e.g., positive TISs, negative TISs upstream of positive TISs, and negative TISs downstream of positive TISs. Then, TriTISA characterizes them using Markov models. The work [33] extended TriTISA to genome sequences. This method divides all TISs into different groups, e.g., introns, UTRs, and exons. Then, different classifiers are trained for each group, and the trained classifiers are combined for the final TIS prediction.
Our work differs from the aforementioned works in two aspects. First, these methods divide candidate TISs according to the regions where they are located. However, this kind of division strategy is rough; e.g., the negative TISs in the same CDS may be located in different reading frames. In contrast, our proposed method divides the candidate TISs according to the predicted reading frame where they are located. Second, these methods divide the candidate TISs by using labeled data. However, in the test process, the labeled information of the test data is lacking. These methods must combine the prediction results of all the local classifiers, which inevitably induces prediction noise from different classifiers, whereas, in our proposed method, a local classifier is assigned to each sample in an adaptive manner according to predicted frame information.

3. The Proposed Method

In this section, the preliminaries, the dependency network representation of NeuroTIS and NeuroTIS+, and the pipeline of NeuroTIS+ are introduced. The probabilistic representation and graphical illustration of NeuroTIS+ are respectively shown in Figure 2 and Figure 3.

3.1. Preliminaries

In what follows, s = s 1 s 2 s n is an mRNA sequence and z = z 1 z 2 z n is the label sequence of s , where s i { A , C , U , G } and z i { 1 , 0 } , and  p ( · ) denotes the output probability of a computational model. The TIS prediction is equivalent to solve the following maximum a posteriori (MAP) estimation problem:
z κ = arg max z κ p ( z κ | s )
where κ denotes the position of k-th tri-nucleotides AUG in the sequence s , and  z κ denotes whether the position κ in s is a positive TIS ( z κ = 1 ) or not ( z κ = 0 ) .

3.2. NeuroTIS

NeuroTIS considers the label dependencies among codon labels, and, between codon labels and TISs, it receives the input of mRNA sequences and outputs the probability of a codon and translation initiation site; hence, the problem of Equation (1) can be reduced to solve the following MAP estimation problem:
( z κ , y ) = arg max z κ , y p ( z κ , y | s )
where y = y 1 y 2 y n represents the codon labels of s and y i ; { 1 , 0 } denotes whether the position i in s is the first nucleotide of a codon ( y i = 1 ) or not ( y i = 0 ).
NeuroTIS introduces a dependency network to represent and simplify the dependency relationships among variables. As shown in Figure 2, it is assumed that there exists weak interdependency among codon labels. TIS is dependent on codon labels and mRNA sequence. Then, according to the chain rule of probability [34], Equation (2) can be reduced to the problem as follows:
( z κ , y ) = arg max z κ , y p ( z κ | y , s ) p ( y | s )
Despite the above reduction, Equation (3) is still an NP-hard problem; NeuroTIS adopts a greedy inference and decomposes the TIS prediction problem into two following subproblems:
y ^ = arg max y i = 1 n p ( y i | s , y i v , y i + v )
z ^ κ = arg max z κ p ( z κ | s , y ^ )
where NeuroTIS efficiently infers variables ( z κ , y ) in two stages: the first stage outputs CDS probabilities y ^ , which are then processed along with TIS sequence data through a second inference stage to infer TIS z ^ κ . Note that NeuroTIS assumes that there exists weak interdependency among codon labels and models the codon labels’ consistency among three positions with a step interval v to avoid the information redundancy among neighboring positions. In practice, NeuroTIS employs a skipBRNN to estimate conditional probability distributions p ( y i | s , y i v , y i + v ) . With regard to conditional probability distribution p ( z κ | s , y ^ ) , NeuroTIS employs a CNN for the fact that it can effectively capture local patterns and model non-linearity in data.

3.3. NeuroTIS+

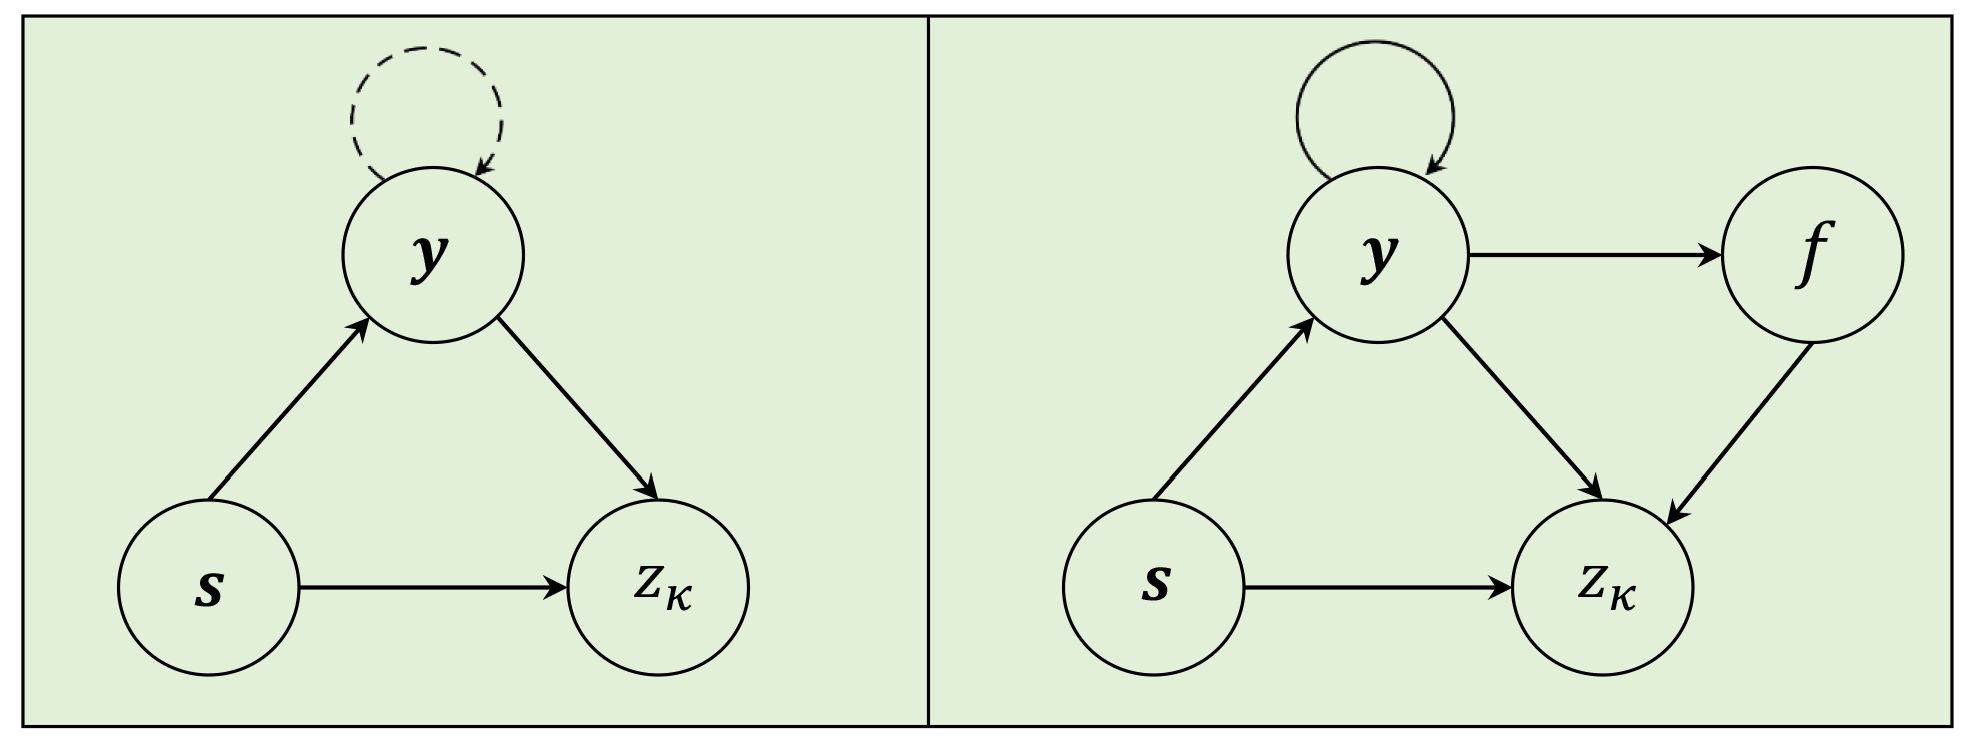
3.3.1. Dependency Network Representation

In this paper, apart from label dependency between CDSs and TISs, we also consider the heterogeneity of negative TISs and introduce frame information that has an influence on the final TIS prediction for the first time. To be specific, we can reformulate Equation (2) as follows:
( z κ , f , y ) = arg max z κ , f , y p ( z κ , f , y | s )
where variable f { 0 , 1 , 2 } denotes which frame that the CDS of an mRNA sequence s is located in. NeuroTIS+ also builds a dependency network to represent and simplify dependency relationships among multiple variables. As shown in Figure 2, NeuroTIS+ assumes denser and stronger codon label dependencies compared with NeuroTIS; that is, each codon label is interdependent on all the left codon labels of the mRNA sequence s . Moreover, frame variable f is dependent on codon labels, and TIS variable is dependent on mRNA sequence s , codon variables y , and frame information. Based on the probability chain rule, the joint inference of TIS and coding regions can be formally transformed into a MAP estimation problem as follows:
( z κ , f , y ) = arg max z κ , f , y p ( z κ | s , y , f ) p ( f | y ) i p ( y i | s , y i )
where i denotes all the indices of an mRNA sequence except i. It should be noted that Equation (7) constitutes an NP-hard problem where exact inference is computationally infeasible. To address this, we propose a practical greedy inference approach to obtain approximate solutions as follows:
y ^ = arg max y i p ( y i | s , y i )
f ^ = arg max f p ( f | y ^ )
z ^ κ = arg max z κ p ( z κ | s , y ^ , f ^ )
Using the above three equations, NeuroTIS+ can efficiently infer variables ( z κ , f , y ) in three stages: one stage to predict CDSs, the second stage to predict frames of CDSs, and the third stage to combine frame information and coding scores for TIS prediction. In the following sections, we introduce a TCN to estimate the conditional probability distribution p ( y i | s , y i ) and a simple strategy to calculate f according to y ^ , and, as for the conditional probability distribution p ( z κ | s , f ^ , y ^ ) , we estimate it by utilizing frame-specific CNN.

3.3.2. Temporal Convolutional Network for CDS Prediction

TCN [35] represents a specialized neural architecture designed for processing sequential temporal data by capturing inter-temporal dependencies through convolutional operations. Unlike traditional recurrent neural networks (RNNs) or long short-term memory (LSTM) networks, TCN uses convolutional layers to capture dependencies in sequential data in a parallel way, which makes the training process efficient. In this subsection, we employ a TCN to model codon label consistency; it is based on our intuition that the network can not only naturally perform multiple coding labels’ message aggregation by using convolutional layers but can also easily implement this aggregation over a long distance by using dilated convolution. In the following parts, we first propose a fast codon usage matrix generation strategy and position encoding of a reading frame, and then the two features are fed into TCN for CDS prediction.
Fast Codon Usage Matrix Generation. NeuroTIS+ and NeuroTIS both use codon usage as an entity feature to predict coding and non-coding regions in mRNA sequences; hence, codon usage is calculated at each position of a reading frame. To attain this goal, a sliding window is performed with a step of 3 and window size m along a reading frame, and then the frequency of each codon (from 1 to 64) occurring in the window is calculated and summed in a 64-dimensional feature vector. Assume that scanning a codon is a basic operation and a reading frame of length n must perform m n / 3 times in total. In fact, the computational complexity can be reduced due to many repeated scanning operations; e.g., two sliding widows overlap with only exception of the first codon and the last codon; hence, once the feature vector of the first sliding window has been calculated, the next feature vector can be calculated directly by adding 1 for the last codon and subtracting 1 for the first codon. The detailed process is shown in Algorithm 1.
Algorithm 1 Fast CU matrix generation strategy
Input: one reading frame of an mRNA sequence with length n and a sliding window.
Output: CU matrix X with size of 64 × ( n / 3 ) , in which each column is 64-dimensional codon usage statistics.
 1: pad the reading frame with ‘N’ on two sides.
 2: initialize an array of size 64, u = 0 , an empty queue Q,
 3: calculate the index l 0 of each codon in sliding window, u [ l 0 ] = u [ l 0 ] + 1 , and enqueue them into Q one by one,
 4: the 1st column of X 0 = u , initialize a scaler variable, k = 1 ,
 5: dequeue an element l 1 from Q,
 6: Slide the window with step 3 (one codon), and calculate the index of the codon l 2 ,
 7: u [ l 1 ] = u [ l 1 ] 1 , u [ l 2 ] = u [ l 2 ] + 1 ,
 8: X k = u , k = k + 1 ,
 9: enqueue an element l 2 to Q,
10: goto step 5 until the sliding window stops,
11: return CU matrix X .
Position Encoding. In this paper, we introduce position encoding for CDS prediction based on our observation that the CDS portion is flanked by 5′ and 3′ UTRs, where codon labels are zeros, and hence codon labels are dependent on position in an mRNA sequence in some way. To exploit this simple statistical dependency information, we add 1-dimensional features to codon usage measures by calculating the ratio of position and length of the reading frame, p i = i / l . This encoding can slightly improve the prediction results; therefore, we did not conduct this ablation study.
TCN. Due to the triplet structure characteristics of codons in the CDSs of mRNA sequences, there are three kinds of reading frames in mRNA sequences, and each reading frame satisfies the constraint of label consistency. Hence, without loss of generality, we consider one reading frame regarding whether it contains CDSs at a time, and the other two reading frames can be processed in the same way. Assume that u represents the reading frame to be examined, and x i is the entity feature generated by a sliding window at the i-th position of u (e.g., position encoding and codon usage). h i ( l ) represents the hidden neuron at the i-th position on the l-th layer of the network, and w k ( l ) represents the k-th component of the convolution kernel w ( l ) on the l-th layer. Then, the hidden neuron h i ( l + 1 ) at the i-th position of the sequence can be expressed as
h i ( l + 1 ) = σ ( k I , j N i w k ( l ) h j ( l ) )
where I = 0 : r represents the index of the convolution kernel of length r + 1 , N i = i r / 2 : i + r / 2 represents the r + 1 adjacent positions to the left and right of the i-th position in the sequence, and σ represents a non-linear activation function. Note that the input layer uses a linear transformation to capture attribute features; that is, h i ( 0 ) = x i . Compared with our previously proposed skipBRNN, TCN has good properties: (1) Hidden neuron is the weighted sum of its neighboring positions via convolutional layers, which makes message passing for multiple labels easier. (2) Each convolutional kernel can be performed independently, which makes parallel calculation possible. (3) It is natural to enhance the expressive power of the network by adding the number of convolutional layers, which helps to handle large data.

3.3.3. Frame-Specific CNN with Adaptive Grouping Strategy for TIS Prediction

Given the coding scores of an mRNA sequence, does one determine the correct frame where a CDS is located and then divide all the TISs into different groups? We here adopt a simple strategy to calculate the max mean scores of each frame. It is based on the fact that each coding score tends to be close to 1 in the correct frame and close to zero in the other two frames. Then, we can formulate the process as follows:
f ^ = arg max f i = [ f , 3 , n ] y ^ i , s . t . f { 0 , 1 , 2 }
where [ f , 3 , n ] denotes all the indices from f to n with step 3. It is worth noting that f ^ is the predicted frame information of the positive TIS in an mRNA sequence. Hence, to group homogeneous TISs in all mRNA sequences, we must calculate which frame a TIS is located in; then, the group of k-th TISs in an mRNA sequence with position κ can be calculated as follows:
g ^ k = ( κ f ^ ) mod 3
where g ^ k { 0 , 1 , 2 } denotes three kinds of groups, in which g ^ k = 0 denotes that the candidate TIS is located in the same frame as positive TIS. After grouping all the TISs, we can build homogeneous features from each group.
We adopt the same feature set as NeuroTIS for each group, and three specific CNNs are separately trained using samples that belong to the same group. To be specific, for a TIS to be predicted, once its group has been determined, the features of coding scores, the scanning model, and one-hot encoding of sequence around AUG are generated and fed into a specific CNN for final TIS prediction. It is observed that NeuroTIS+ and NeuroTIS employ the same features for the final TIS prediction; the difference lies in that NeuroTIS+ builds homogenous features according to the predicted frame information.

4. Experiments

In this section, we conduct four experiments on two benchmark gene datasets. The first is to verify the significance of the adaptive grouping strategy. The second is to evaluate the performance of TCN for CDS prediction. In the third experiment, we compare NeuroTIS+ with the other existing state-of-the-art methods, such as NeuroTIS [24], TISRover [13], and TITER [3]. The last experiment is to evaluate the time cost and running status of NeuroTIS+.

4.1. Datasets

We selected transcript datasets from Refseq (ftp://ftp.ncbi.nih.gov/refseq/ (accessed on 2 January 2025)), which provides a complete well-annotated collection of biological molecules for various types of species. We downloaded transcriptome-wide mRNA sequences with prefixes ‘NM_’, and a total number of 24,842 human and 19,900 mouse transcripts are obtained after clean up procedure. All these transcripts have canonical TISs. After redundancy removal by using CD-hit [36] with sequence identity cutoff 80%, there are 20,488 and 11,613 sequences left for human and mouse transcripts, respectively, from which we adopted the hold-out strategy and randomly selected 4/5 and 3/4 sequences as training set and 1/5 and 1/4 sequences as test set for human and mouse datasets, respectively.
To further validate the effectiveness of our method in discovering novel TISs, we leveraged a curated A. thaliana mRNA dataset, which comprises 6974 experimentally validated TISs via ribosome profiling alongside 258,553 high-confidence false TISs, providing a test benchmark for assessing cross-species predictive performance under biologically realistic conditions.

4.2. Performance Measurements

In order to evaluate the performance of NeuroTIS+, we employ the standard performance evaluation criteria in terms of sensitivity (SN), specificity (SP), accuracy (ACC), precision (PRE), F1-score, area under the receiver operating characteristic (auROC), area under the precision recall curve (auPRC), and MCC. These metrics can be calculated as follows:
S N = T P T P + F N S P = T N F P + T N P R E = T P T P + F P A C C = T P + T N T P + T N + F P + F N F 1 s c o r e = 2 P R E S N P R E + S N M C C = T P T N F P F N ( T P + F N ) ( T P + F P ) ( T N + F P ) ( T N + F N )
These evaluation metrics are fundamentally derived from four basic elements: true positives (TPs, correctly classified positive instances), false positives (FPs, misclassified negative instances), true negatives (TNs, correctly classified negative instances), and false negatives (FNs, misclassified positive instances). Among them, Matthews correlation coefficient (MCC) serves as a comprehensive performance metric. While receiver operating characteristic (ROC) curves are widely adopted for binary classification assessment, precision–recall curves (PRCs) prove more reliable for imbalanced datasets. Both auROC and auPRC values are derived via trapezoidal rule integration between consecutive thresholds. Implementation details are documented in [37,38].

4.3. Significance of Adaptive Grouping Strategy

In order to verify the significance of an adaptive grouping strategy, we conduct an ablation study and compare the prediction performance of NeuroTIS+ with and without adaptive grouping. As is evident from Table 1 and Table 2, NeuroTIS+ (G) consistently outperforms NeuroTIS+ (nG) in all the datasets and measures, especially PRE, F1-score, auPRC, and MCC scores. Figure 4 also shows the training and test process of the second phase of NeuroTIS+ (G) and NeuroTIS+ (nG). It is observed that mixture of all the negative TISs leads to heavier predictive oscillation and more convergence time in the training and test process, while adaptive grouping strategy makes the training process more stable and converge quickly. It is worth noting that groups 1 and 2 show more stable and accurate predictive results. This is because the positive TIS is located in the first frame, so negative TISs in the first frame have higher false positives than in the other two reading frames. All the above analysis demonstrates that features of negative TISs are heterogeneous, and construction of homogenous features according to frame information not only facilitates more accurate prediction performance but also promotes the stability of the model training process.

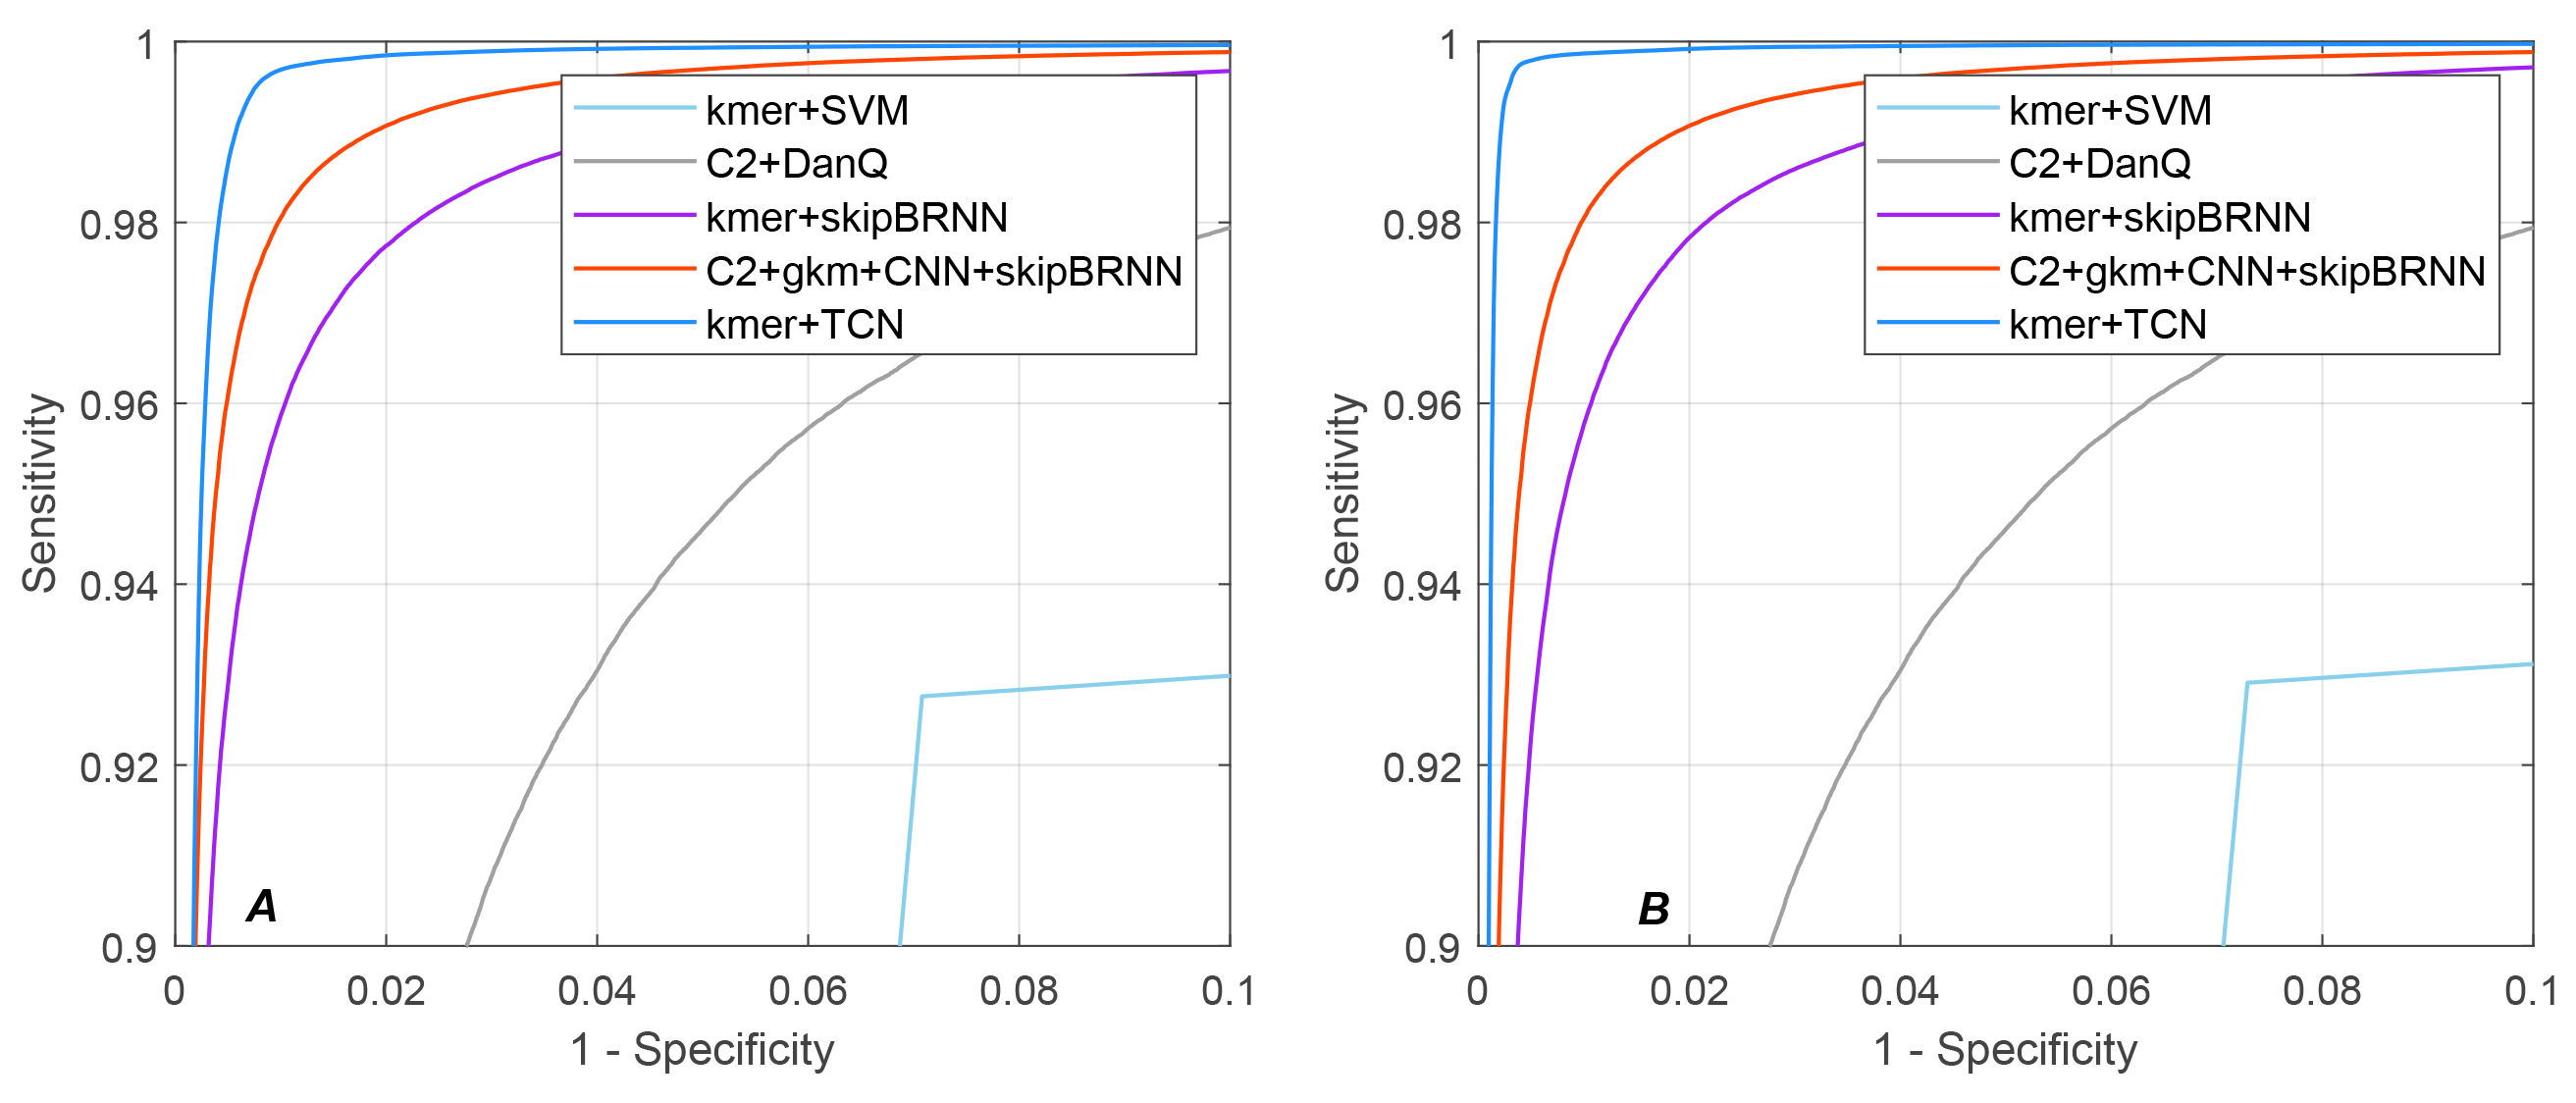
4.4. Performance Comparison for CDS Prediction

In order to verify the effectiveness of TCN for CDS prediction, we compare kmer+TCN with existing state-of-the-art methods, including kmer+SVM [23], C2+DanQ [39], kmer+ skipBRNN [24], and C2+gkm+CNN+skipBRNN [40]. For fairness, all methods were trained and tested on the same datasets. All the comparable methods were implemented according to the parameter settings in their original studies. As for DanQ network, C2 encoding was used instead of C4 encoding because C2 encoding is more efficient. DanQ sets the input sequence length to 1000, while 90 is used here like other methods. Moreover, in order to prevent underfitting or overfitting, the scale of the neural networks is set large enough, and two regularization techniques, Dropout [41] and early stopping [42], are adopted. Moreover, to avoid the side effect of data imbalance on predictive model, we use random undersampling for the negative samples and make the ratio of positive samples to negative samples approximately 1:1.
Table 3 shows the performance comparison of kmer+TCN with existing state-of-the-art methods on human and mouse datasets. It is observed that kmer+TCN achieves the best prediction performance and consistently outperforms the other methods on all the datasets, with an average sensitivity of 99.7%, specificity of 99.2%, and auROC of 0.9992, improvements of 0.61%, 1.15%, and 0.0007 over the second best method, C2+gkm+CNN+skipBRNN. Moreover, kmer+TCN only uses 64-dimensional codons and 1-dimensional position encoding, and the scale of TCN is very small, so it is easy to train and requires very little time to converge, while C2+gkm+CNN+skipBRNN requires several hours to train due to large dimensions of C2 encoding and gkm features. Moreover, Figure 5 plots the ROC curves of different methods on human and mouse transcripts, from which we can observe that kmer+TCN not only achieves competitive performance in human and mouse transcript sequences but also consistently outperforms the other existing state-of-the-art methods, which verifies the significance of biological features (e.g., codon usage) and primary structural information (e.g., codon label consistency). All the experimental results demonstrate that kmer+TCN is a highly accurate method for predicting CDSs.

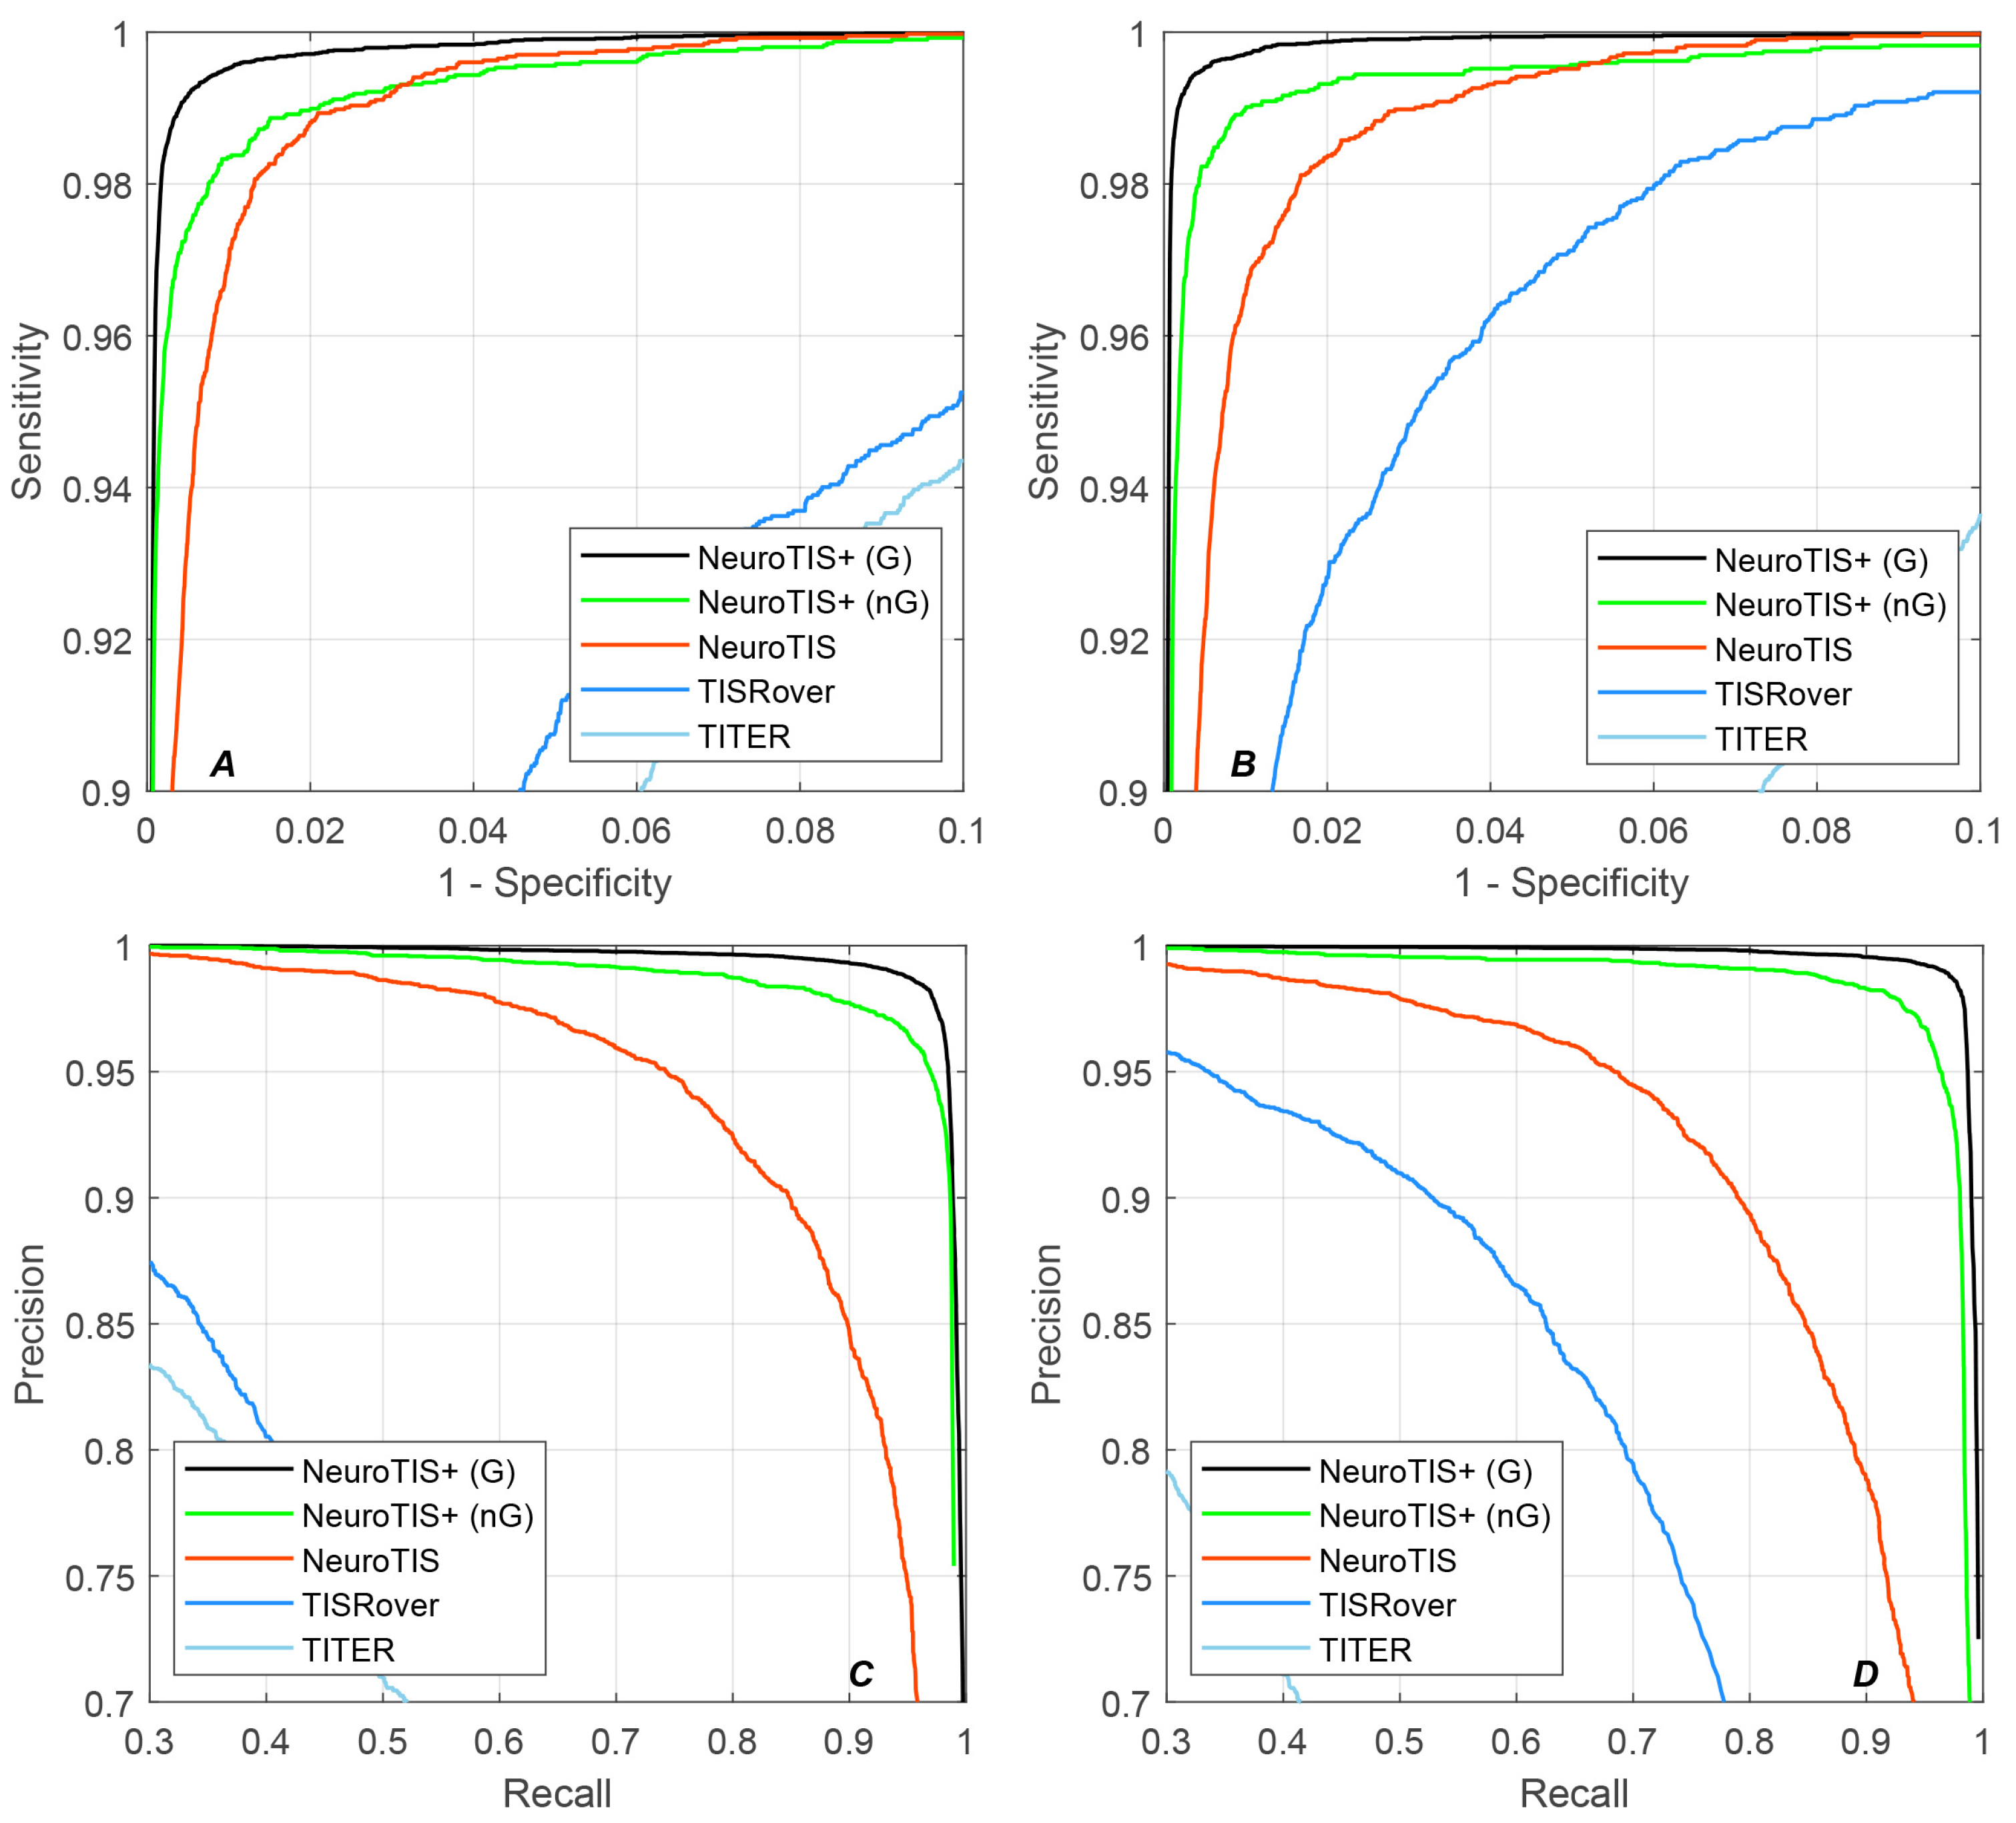
4.5. Performance Comparison for TIS Prediction

We compare the performance of our proposed method, NeuroTIS+, with existing state-of-the-art methods such as TITER, TISRover, and NeuroTIS. To conduct a fair comparison, all the methods are trained and tested on the same dataset. In order to avoid the side effect of imbalanced dataset, we also limit the number of negative samples in training set like kmer+TCN, but, in the test set, all the negative samples are selected. The other comparable methods are implemented with reference to their original papers. Note that, for all the neural network-based methods, the network size is set large enough to ensure that the model training will not be underfitted. Also, two regularization methods (i.e., Dropout and early stopping) are used to ensure that the model will not be overfitted.
As shown in Table 1 and Table 2, NeuroTIS+ performed the best among all the existing state-of-the-art methods and achieved the highest scores in all the evaluation metrics, especially in PRE, F1-score, and MCC, an average improvement of 41.26%/0.2803/0.0332/0.2508 over the second best method, NeuroTIS, on human and mouse datasets. This improvement indicates that NeuroTIS+ can effectively reduce false positives, which verifies the significance of promoting the CDS prediction and adaptive grouping strategy. Figure 6 also illustrates the ROC and PRC curve comparison of all the methods on the human and mouse datasets. It can be seen that NeuroTIS+ is consistently higher than other state-of-the-art methods on both curves. Given a false positive rate of 0.5%, NeuroTIS+ achieved 99.2% and 99.56% sensitivity on human and mouse genome sequences, respectively, which is 5.45% and 7.04% higher than the second best method, NeuroTIS. For the PRC curve, given a recall rate of 95%, NeuroTIS+ achieved 98.8% and 99.15% precision on human and mouse genome sequences, respectively, 24.33% and 30.12% higher than NeuroTIS, respectively.
From the above analysis, we can conclude that accurate prediction of CDSs and homogenous feature building by adaptive grouping strategy play an important role in predicting TISs. All the experimental results demonstrate that NeuroTIS+ is a high-precision TIS prediction method.

4.6. Performance on TISs Experimentally Validated via Ribosome Profiling

To rigorously evaluate cross-species generalization capability, we applied NeuroTIS+ trained exclusively on human transcriptome data without fine-tuning to a curated A. thaliana dataset containing 6947 Ribo-seq validated translation initiation sites (TISs) and 258,553 negative TISs. The model demonstrated remarkable performance across all evaluation metrics, achieving near-perfect detection of experimentally verified TISs with 99.49% sensitivity while maintaining 99.12% specificity. This robust performance was further evidenced by outstanding metric scores: near-perfect class separation (auROC = 0.9996), exceptional precision–recall balance under extreme class imbalance (auPRC = 0.9953), and strong overall prediction consistency (MCC = 0.944). The remarkable performance underscores NeuroTIS+’s utility as a universal TIS prediction tool capable of accurate annotation in uncharacterized plant transcriptomes without species-specific retraining, which verifies its biological generalizability.

4.7. Time Cost of NeuroTIS+

We briefly introduce the computational cost of the proposed method. All the experiments are performed on an Intel Core i7-11700 CPU 2.50 GHz PC with 16 GB RAM. As NeuroTIS+ preserves the basic computational framework of NeuroTIS, it exhibits very similar cost as NeuroTIS. As shown in Table 4, NeuroTIS is efficient and takes only about 20 min to complete the training process for CDS and TIS prediction. kmer+TCN converges quickly in 20 min for human dataset because it only requires 65-dimensional features and the network scale is small. In contrast, CNN+gkm+C2+skipBRNN requires much more time and memory resources to train for large-dimensional C2 encoding and gkm features. Furthermore, in the second phase of NeuroTIS+, frame-specific CNN is also very efficient owing to the efficiency of 1D-CNN and proper feature dimension. Moreover, the homogenous feature building by using an adaptive grouping strategy also facilitates the convergence time of CNN.

5. Discussion

Translation site prediction is an important step for gene annotation. The accurate prediction of TISs in mRNA sequences facilitates understanding the gene regulating mechanism and plays an important role in studying the occurrence and development mechanisms of diseases. Many computational methods have been proposed to avoid expensive and time-consuming wet-lab experiments and achieve acceptable prediction accuracy by exploiting features such as consensus motifs around TISs, coding features around TISs, and the scanning model. However, how to fully exploit the aforementioned features so far is still an open problem. Most of the existing computational methods directly capture the above features from raw data, whereas it has been verified by a few works that it is more beneficial to design a series of more sophisticated submodels for feature extraction, e.g., NeuroTIS. This paper extends that idea and explores a method for TIS prediction by fully exploiting the primary structural information in mRNA sequences. Tests on transcriptome-wide human and mouse datasets demonstrate that our proposed method shows remarkable prediction performance.
The superior performance of NeuroTIS+ compared to NeuroTIS can be primarily attributed to its comprehensive utilization of mRNA primary structural information in our implementation. First, regarding codon label dependency, NeuroTIS only realizes the process of message passing among three neighboring codon labels by using a skip connection in a BRNN, whereas NeuroTIS+ realizes the process of message passing among all the codon labels in a local region by using temporal convolution. Moreover, NeuroTIS+ has stronger expressive power by increasing the number of network layers and convolution kernels. Second, NeuroTIS+ considers the heterogeneity of negative TISs and built homogenous features for TISs by using an adaptive grouping strategy. Then, three frame-specific CNNs are trained for TIS prediction, leading to substantial enhancements in NeuroTIS’s predictive performance.
Although demonstrating enhanced predictive capability, NeuroTIS+ presents certain constraints. First, the generation of global features necessitates a full-length mRNA sequence. Fortunately, the availability of full-length mRNA sequences is increasing. Second, it only considers canonical downstream TISs, while numerous mRNAs contain alternative TISs that exhibit short CDSs, so NeuroTIS+ primarily trained on long CDSs may struggle to detect reliably. Despite this fact, NeuroTIS+ could provide indirect support for alternative TIS discovery through precise CDS boundary delineation. Third, NeuroTIS+ specializes in canonical TISs for its biological prevalence. However, considerable non-canonical TISs exist (e.g., CUG, AUU, and GUG). Fourth, its assumption of a directed TIS–CDS dependency enables efficient inference, but cyclic dependencies might offer additional benefits. Future studies on these points are warranted.

6. Conclusions

Translation initiation site prediction is an important problem in transcriptome annotation, which plays a key role in transcript function annotation. In this paper, in view of the shortcomings of our previous method—specifically that it does not fully utilize the primary structural information in mRNA sequences—we propose an improved version, NeuroTIS+. This model enables more sophisticated codon label dependency modeling through a temporal convolutional network and achieves homogeneous feature construction using an adaptive sample grouping strategy. The experimental results demonstrate that our proposed method not only outperforms the existing state-of-the-art methods for coding sequence and translation initiation site prediction but also exhibits a more stable model training process.

Author Contributions

Conceptualization, methodology, writing—original draft preparation, funding acquisition, C.W.; data curation, writing—review and editing, investigation, W.X. All authors have read and agreed to the published version of the manuscript.

Funding

This work is supported by the research initiation fund of Hubei University of Technology under Grant XJ2022007201.

Institutional Review Board Statement

Not applicable.

Informed Consent Statement

Not applicable.

Data Availability Statement

We selected transcript datasets from Refseq (ftp://ftp.ncbi.nih.gov/refseq/ (accessed on 2 June 2025)).

Acknowledgments

The authors extend their gratitude to all researchers whose work contributed to this study, as well as the anonymous reviewers for their invaluable feedback, which significantly improved the manuscript.

Conflicts of Interest

The authors declare no conflicts of interest.

References

  1. Sonenberg, N.; Hinnebusch, A.G. Regulation of Translation Initiation in Eukaryotes: Mechanisms and Biological Targets. Cell 2009, 136, 731–745. [Google Scholar] [CrossRef]
  2. Barbosa, C.; Peixeiro, I.; Romão, L. Gene expression regulation by upstream open reading frames and human disease. PLoS Genet. 2013, 9, e1003529. [Google Scholar] [CrossRef] [PubMed]
  3. Zhang, S.; Hu, H.; Jiang, T.; Zhang, L.; Zeng, J. TITER: Predicting translation initiation sites by deep learning. Bioinformatics 2017, 33, i234–i242. [Google Scholar] [CrossRef] [PubMed]
  4. Venket, R.; Louis, K.; Fantin, M.; Linda, R. A simple guide to de novo transcriptome assembly and annotation. Briefings Bioinform. 2022, 2, bbab563. [Google Scholar]
  5. Kozak, M. Translation of insulin-related polypeptides from messenger RNAs with tandemly reiterated copies of the ribosome binding site. Cell 1983, 34, 971–978. [Google Scholar] [CrossRef]
  6. Malys, N. Shine-Dalgarno sequence of bacteriophage T4: GAGG prevails in early genes. Mol. Biol. Rep. 2012, 39, 33–39. [Google Scholar] [CrossRef]
  7. Bernal, A.; Crammer, K.; Hatzigeorgiou, A.; Pereira, F. Global discriminative learning for higher-accuracy computational gene prediction. PLoS Comput. Biol. 2007, 3, e54. [Google Scholar] [CrossRef]
  8. Hinnebusch, A.G.; Ivanov, I.P.; Sonenberg, N. Translational control by 5′-untranslated regions of eukaryotic mRNAs. Science 2016, 352, 1413–1416. [Google Scholar] [CrossRef]
  9. Boersma, S.; Khuperkar, D.; Verhagen, B.M.; Sonneveld, S.; Grimm, J.B.; Lavis, L.D.; Tanenbaum, M.E. Multi-color single-molecule imaging uncovers extensive heterogeneity in mRNA decoding. Cell 2019, 178, 458–472. [Google Scholar] [CrossRef]
  10. Khuperkar, D.; Hoek, T.A.; Sonneveld, S.; Verhagen, B.M.; Boersma, S.; Tanenbaum, M.E. Quantification of mRNA translation in live cells using single-molecule imaging. Nat. Protoc. 2020, 15, 1371–1398. [Google Scholar] [CrossRef]
  11. Pedersen, A.G.; Nielsen, H. Neural network prediction of translation initiation sites in eukaryotes: Perspectives for EST and genome analysis. In Proceedings of the International Conference on Intelligent Systems for Molecular Biology, Halkidiki, Greece, 21–26 June 1997. [Google Scholar]
  12. Rajapakse, J.C.; Ho, L.S. Markov encoding for detecting signals in genomic sequences. IEEE/ACM Trans. Comput. Biol. Bioinform. 2005, 2, 131–142. [Google Scholar] [CrossRef] [PubMed]
  13. Zuallaert, J.; Kim, M.; Soete, A.; Saeys, Y.; Neve, W.D. TISRover: ConvNets learn biologically relevant features for effective translation initiation site prediction. Int. J. Data Min. Bioinform. 2018, 20, 267–284. [Google Scholar] [CrossRef]
  14. Zien, A.; Rätsch, G.; Mika, S.; Schölkopf, B.; Lengauer, T.; Müller, K.R. Engineering support vector machine kernels that recognize translation initiation sites. Bioinformatics 2000, 16, 799. [Google Scholar] [CrossRef]
  15. Li, H.; Jiang, T. A class of edit kernels for SVMs to predict translation initiation sites in eukaryotic mRNAs. In Proceedings of the Eighth International Conference on Resaerch in Computational Molecular Biology, San Diego, CA, USA, 27–31 March 2004. [Google Scholar]
  16. Chen, W.; Feng, P.M.; Deng, E.Z.; Lin, H.; Chou, K.C. iTIS-PseTNC: A sequence-based predictor for identifying translation initiation site in human genes using pseudo trinucleotide composition. Anal. Biochem. 2014, 462, 76–83. [Google Scholar] [CrossRef]
  17. Salamov, A.A. Assessing protein coding region integrity in cDNA sequencing projects. Bioinformatics 1998, 14, 384. [Google Scholar] [CrossRef]
  18. Li, G.; Leong, T.Y.; Zhang, L. Translation Initiation Sites Prediction with Mixture Gaussian Models. IEEE Trans. Knowl. Data Eng. 2005, 17, 1152–1160. [Google Scholar] [CrossRef]
  19. Nishikawa, T.; Ota, T.; Isogai, T. Prediction of Fullness of cDNA Fragment sequences by combining Statistical Information and Similarity with Protein Sequences. Bioinformatics 2000, 16, 960–967. [Google Scholar] [CrossRef]
  20. Hatzigeorgiou, A.; Mache, N.; Reczko, M. Functional site prediction on the DNA sequence by artificial neural networks. In Proceedings of the IEEE International Joint Symposia on Intelligence and Systems, Rockville, MD, USA, 4–5 November 1996; pp. 12–17. [Google Scholar]
  21. Hatzigeorgiou, A.G. Translation initiation start prediction in human cDNAs with high accuracy. Bioinformatics 2002, 18, 343–350. [Google Scholar] [CrossRef]
  22. Tzanis, G.; Berberidis, C.; Vlahavas, I. MANTIS: A data mining methodology for effective translation initiation site prediction. In Proceedings of the International Conference of the IEEE Engineering in Medicine and Biology Society, Lyon, France, 22–26 August 2007. [Google Scholar]
  23. Tzanis, G.; Berberidis, C.; Vlahavas, I. StackTIS: A stacked generalization approach for effective prediction of translation initiation sites. Comput. Biol. Med. 2012, 42, 61–69. [Google Scholar] [CrossRef]
  24. Wei, C.; Zhang, J.; Yuan, X.; He, Z.; Liu, G.; Wu, J. Neurotis: Enhancing the prediction of translation initiation sites in mrna sequences via a hybrid dependency network and deep learning framework. Knowl.-Based Syst. 2021, 212, 106459. [Google Scholar] [CrossRef]
  25. Kirkpatrick, J.; Pascanu, R.; Rabinowitz, N.; Veness, J.; Desjardins, G.; Rusu, A.A.; Milan, K.; Quan, J.; Ramalho, T.; Grabska-Barwinska, A.; et al. Overcoming catastrophic forgetting in neural networks. Proc. Natl. Acad. Sci. USA 2017, 114, 3521–3526. [Google Scholar] [CrossRef] [PubMed]
  26. Lea, C.; Flynn, M.D.; Vidal, R.; Reiter, A.; Hager, G.D. Temporal convolutional networks for action segmentation and detection. In Proceedings of the IEEE Conference on Computer Vision and Pattern Recognition, Honolulu, HI, USA, 21–26 July 2017; pp. 156–165. [Google Scholar]
  27. Guo, Y.; Gu, S. Multi-Label Classification Using Conditional Dependency Networks. In Proceedings of the IJCAI 2011, Proceedings of the 22nd International Joint Conference on Artificial Intelligence, Barcelona, Spain, 16–22 July 2011. [Google Scholar]
  28. Li, S.; Farha, Y.A.; Liu, Y.; Cheng, M.M.; Gall, J. Ms-tcn++: Multi-stage temporal convolutional network for action segmentation. IEEE Trans. Pattern Anal. Mach. Intell. 2020, 45, 6647–6658. [Google Scholar] [CrossRef] [PubMed]
  29. Collobert, R.; Weston, J.; Bottou, L.; Karlen, M.; Kavukcuoglu, K.; Kuksa, P. Natural language processing (almost) from scratch. J. Mach. Learn. Res. 2011, 12, 2493–2537. [Google Scholar]
  30. Li, L.; Fan, Y.; Tse, M.; Lin, K.Y. A review of applications in federated learning. Comput. Ind. Eng. 2020, 149, 106854. [Google Scholar] [CrossRef]
  31. Huang, W.; Ye, M.; Du, B. Learn from others and be yourself in heterogeneous federated learning. In Proceedings of the IEEE/CVF Conference on Computer Vision and Pattern Recognition, New Orleans, LA, USA, 18–24 June 2022; pp. 10143–10153. [Google Scholar]
  32. Hu, G.Q.; Zheng, X.; Zhu, H.Q.; She, Z.S. Prediction of translation initiation site for microbial genomes with TriTISA. Bioinformatics 2009, 25, 123–125. [Google Scholar] [CrossRef]
  33. Pérez-Rodríguez, J.; Arroyo-Peña, A.G.; García-Pedrajas, N. Improving translation initiation site and stop codon recognition by using more than two classes. Bioinformatics 2014, 30, 2702–2708. [Google Scholar] [CrossRef]
  34. Schum, D.A. The Evidential Foundations of Probabilistic Reasoning by David A. Schum; Northwestern University Press: Evanston, IL, USA, 1994. [Google Scholar]
  35. Goodfellow, I.; Bengio, Y.; Courville, A. Deep Learning; MIT Press: Cambridge, MA, USA, 2016. [Google Scholar]
  36. Li, W.; Godzik, A. Cd-hit: A fast program for clustering and comparing large sets of protein or nucleotide sequences. Bioinformatics 2006, 22, 1658–1659. [Google Scholar] [CrossRef]
  37. Mitchell, T.M.; Carbonell, J.G.; Michalski, R.S. Machine Learning; Springer: Berlin/Heidelberg, Germany, 1997. [Google Scholar]
  38. Davis, J.; Goadrich, M. The relationship between Precision-Recall and ROC curves. In Proceedings of the 23rd International Conference on Machine Learning, Pittsburgh, PA, USA, 25–29 June 2006; pp. 233–240. [Google Scholar]
  39. Daniel, Q.; Xiaohui, X. DanQ: A hybrid convolutional and recurrent deep neural network for quantifying the function of DNA sequences. Nucleic Acids Res. 2016, 44, e107. [Google Scholar]
  40. Wei, C.; Zhang, J.; Yuan, X. Enhancing the prediction of protein coding regions in biological sequence via a deep learning framework with hybrid encoding. Digit. Signal Process. 2022, 123, 103430. [Google Scholar] [CrossRef]
  41. Srivastava, N.; Hinton, G.; Krizhevsky, A.; Sutskever, I.; Salakhutdinov, R. Dropout: A Simple Way to Prevent Neural Networks from Overfitting. J. Mach. Learn. Res. 2014, 15, 1929–1958. [Google Scholar]
  42. Treadgold, N.K.; Gedeon, T.D. Exploring constructive cascade networks. IEEE Trans. Neural Netw. 1999, 10, 1335–1350. [Google Scholar] [CrossRef] [PubMed]
Figure 1. Illustration of the primary structural information exploited in the paper. (1) CDS is continuous and codon labels are consistent with a multiple of three. (2) Positive TISs are always located in the first reading frame (e.g., t 1 ), while negative TISs might occur in any of the three reading frames (e.g., t 2 , t 3 ).
Applsci 15 07866 g001
Figure 2. The dependency network representation of NeuroTIS (left) and NeuroTIS+ (right) in which nodes denote random variables and arcs denote probabilistic dependencies between variables; dashed and solid circle directions, respectively, denote weak and strong dependency relationships among variables.
Applsci 15 07866 g002
Figure 3. The pipelines of NeuroTIS+. It mainly includes two stages: CDS prediction and TIS prediction. In stage 1, TCN is used to predict CDSs from the three frames of an mRNA sequence. Then, in stage 2, a candidate TIS is grouped according to the predicted frame information of a CDS, and its features are fed into the specified CNN for TIS prediction.
Applsci 15 07866 g003
Figure 4. Training and test process of NeuroTIS+ on human dataset. (A) Without grouping; (B) CNN0 with group 0; (C) CNN1 with group 1; (D) CNN2 with group 2.
Applsci 15 07866 g004
Figure 5. Comparison of the ROCs of different methods on (A) human dataset; (B) mouse dataset.
Applsci 15 07866 g005
Figure 6. Comparison of ROC and PRC results of different methods. (A) ROC performance on human data; (B) ROC performance on mouse data; (C) PRC performance on human data; (D) PRC performance on mouse data.
Applsci 15 07866 g006
Table 1. Performance comparison of NeuroTIS+ with the other state-of-the-art methods on human dataset.
HumanSN (%)SP (%)PRE (%)ACC (%)F1-ScoreauROCauPRCMCC
TITER0.02100-98.31-0.97880.6186-
TISRover92.5293.7720.2693.750.33240.97600.39980.4167
NeuroTIS98.1998.5456.2998.530.71560.99850.91500.7377
NeuroTIS+ (nG)98.3898.9484.2998.910.90790.99890.92660.9052
NeuroTIS+ (G)99.0899.5692.8799.530.95880.99960.93850.9569
Table 2. Performance comparison of NeuroTIS+ with the other state-of-the-art methods on mouse dataset.
MouseSN (%)SP (%)PRE (%)ACC (%)F1-ScoreauROCauPRCMCC
TITER0.03100-98.36-0.97660.5879-
TISRover95.2996.7432.5296.720.48490.99360.73990.5463
NeuroTIS98.1298.3148.9098.300.65270.99820.90360.6865
NeuroTIS+ (nG)98.6399.2686.9699.230.92430.99910.93630.9223
NeuroTIS+ (G)99.2699.7394.8599.710.97010.99970.94600.9688
Table 3. Performance comparison of kmer+TCN with existing state-of-the-art methods on human and mouse datasets.
MethodsHumanMouse
SN (%) SP (%) auROC SN (%) SP (%) auROC
kmer+SVM92.7692.92-92.9192.71-
C2+DanQ95.4794.270.988995.3294.370.9884
kmer+skipBRNN98.2597.390.997597.9397.910.9973
C2+gkm+CNN+skipBRNN99.0897.970.998699.1098.140.9985
kmer+TCN99.6499.670.999599.7698.740.9988
Table 4. Brief description of time cost on human and mouse datasets with regard to NeuroTIS+.
DatasetCoding NumberTIS NumberTime Cost (min)
kmer+TCN Frame-Specific CNN
Human9,545,91532,780200.8
Mouse7,883,21617,420150.5
Disclaimer/Publisher’s Note: The statements, opinions and data contained in all publications are solely those of the individual author(s) and contributor(s) and not of MDPI and/or the editor(s). MDPI and/or the editor(s) disclaim responsibility for any injury to people or property resulting from any ideas, methods, instructions or products referred to in the content.

