Article

Ornamental Potential Classification and Prediction for Pepper Plants (Capsicum spp.): A Comparison Using Morphological Measurements and RGB Images as Data Source

by
Antonia Maiara Marques do Nascimento
1,*,
Ruben Ruiz-Gonzalez
1,
Víctor Martínez-Martínez
2,
Artur Mendes Medeiros
3,
Fábio Sandro dos Santos
3,
Elizanilda Ramalho do Rêgo
4,
Samy Pimenta
5,
Cláudia Pombo Sudré
6,
Cintia dos Santos Bento
7,
Carlos Cambra
1 and
Priscila Alves Barroso
3
1
Department of Digitalization, Higher Polytechnic School, University of Burgos, Avda. Cantabria S/N, 09006 Burgos, Spain
2
Faculty of Science and Technology, Universidad Isabel I, C/ Fernán González, 76, 09003 Burgos, Spain
3
Coordenação de Agronomia, Universidade Federal Do Piauí, Campus Professora Cinobelina Elvas, Bom Jesus 64900-000, PI, Brazil
4
Departamento de Ciências Fundamentais e Sociais, Universidade Federal da Paraíba, Campus de Areia, Areia 58397-000, PB, Brazil
5
Departamento de Ciências Agrárias, Universidade Estadual de Montes Claros, Janaúba 39448-581, MG, Brazil
6
Laboratório de Melhoramento Genético Vegetal, Universidade Estadual do Norte Fluminense Darcy Ribeiro, Campos dos Goytacazes 28013-602, RJ, Brazil
7
Departamento de Agronomia, Universidade Federal do Espirito Santo, Alegrete 29500-000, ES, Brazil
*
Author to whom correspondence should be addressed.
Appl. Sci. 2025, 15(14), 7801; https://doi.org/10.3390/app15147801
Submission received: 6 May 2025 / Revised: 30 June 2025 / Accepted: 8 July 2025 / Published: 11 July 2025

Abstract

Featured Application

This study offers a novel approach for the classification and prediction of ornamental potential in pepper plants (Capsicum spp.) using both morphological measurements and RGB image analysis. The findings can be directly applied in horticulture and ornamental plant breeding programs, enabling breeders and growers to efficiently identify and select pepper varieties with high ornamental value, even several weeks ahead of fruit maturation. By leveraging non-invasive imaging techniques, this method provides a cost-effective and scalable solution for assessing aesthetic traits, such as plant architecture, leaf color, and fruit appearance, which are critical for the ornamental plant market. Additionally, the developed models can be integrated into automated systems for real-time evaluation and decision-making in commercial nurseries, enhancing productivity and marketability of ornamental pepper plants.

Abstract

Anticipating the ornamental quality of plants is of significant importance for genetic breeding programs. This study investigated the potential of predicting and classifying whether ornamental pepper plants will exhibit desirable ornamental traits based on RGB images, comparing these results with an approach relying on morphological measurements. To achieve this, pepper plants from fifteen accessions were cultivated, and photographs were taken weekly throughout their growth cycle until fruit maturation. A Vision Transformer (ViT)-based model was employed to predict the suitability of the plants for ornamental purposes, and its predictions were validated against assessments conducted by eight experts. An XGBoost-based classifier was employed as well for estimations based on morphological measurements with an accuracy over 92%. The results showed that the ornamental suitability of plants can be accurately estimated and predicted up to seven weeks in advance from photos, with accuracy over 80%. Interestingly, higher-resolution RGB images did not significantly improve the accuracy of the ViT model. Furthermore, the estimation of ornamental potential using morphological measurements and RGB images yielded similar accuracy, indicating that a single photograph can effectively replace costly and time-consuming morphological measurements. As far as the authors are aware, this work is the first to forecast the ornamental potential of pepper plants (Capsicum spp.) multiple weeks ahead of time using image-based deep learning models.

1. Introduction

The ornamental horticulture industry has witnessed a significant increase in demand for unique and aesthetically pleasing plant varieties, particularly in urban [1] and residential landscapes [2]. Among these, pepper plants (Capsicum spp.) have garnered attention not only for their culinary uses but also for their ornamental potential due to their vibrant fruits and diverse foliage characteristics [3,4,5,6]. As the market for ornamental plants continues to expand [7,8,9], there is a pressing need for effective classification and prediction methods to identify and promote the most desirable varieties [10,11].
Anticipating the ornamental value of pepper plants is crucial for genetic breeding programs and genotype selection because it enables breeders to focus on traits that enhance the aesthetic appeal and marketability of plants [12]. By evaluating characteristics such as plant habit, leaf density, fruit color, size, and arrangement at early developmental stages, breeders can identify promising genotypes with high ornamental potential. This early selection reduces time, effort, and resources spent on less desirable lines, streamlining the breeding process. Additionally, it allows breeders to cater to specific consumer preferences or landscaping needs, such as compact growth for container gardening or vibrant fruit colors for decorative purposes. Accurate anticipation of ornamental traits supports the development of unique and competitive cultivars, ensuring the success and sustainability of breeding programs in meeting market demands [13].
Recent advancements in imaging technology and physiological measurement techniques have engendered novel opportunities for plant phenotyping, enabling researchers to assess ornamental traits more efficiently than traditional methods [14,15,16]. Physiological and morphological measurements, such as chlorophyll content, leaf area, gas exchange rates, plant height, number of fruits, among others, provide critical insights into the health and vigor of plants, which are essential for ornamental quality assessment [17,18,19]. On the other hand, RGB imaging has emerged as a powerful tool for non-destructive monitoring of plant traits, allowing for rapid assessment of morphology, color, and spatial distribution of features [20,21,22]. The integration of these two approaches could enhance the accuracy of classification and prediction models for ornamental potential.
RGB images also allow for rapid assessment of morphology, color, and spatial distribution of organs such as flowers and fruits [20,21,22]. In rapeseed (Brassica napus), models for counting the number of flowers, as well as estimating pod length and width, have been developed [23]. RGB images combined with simple color index transformations have also been effective in quantifying color diversity in ornamental pepper fruits, providing useful results for breeding programs [21].
Despite many studies in horticulture having used deep learning [24], especially Convolutional Neural Networks (CNNs) such as ResNet, VGG, and EfficientNet, little work has been conducted regarding ornamental potential estimation from RGB images [25].
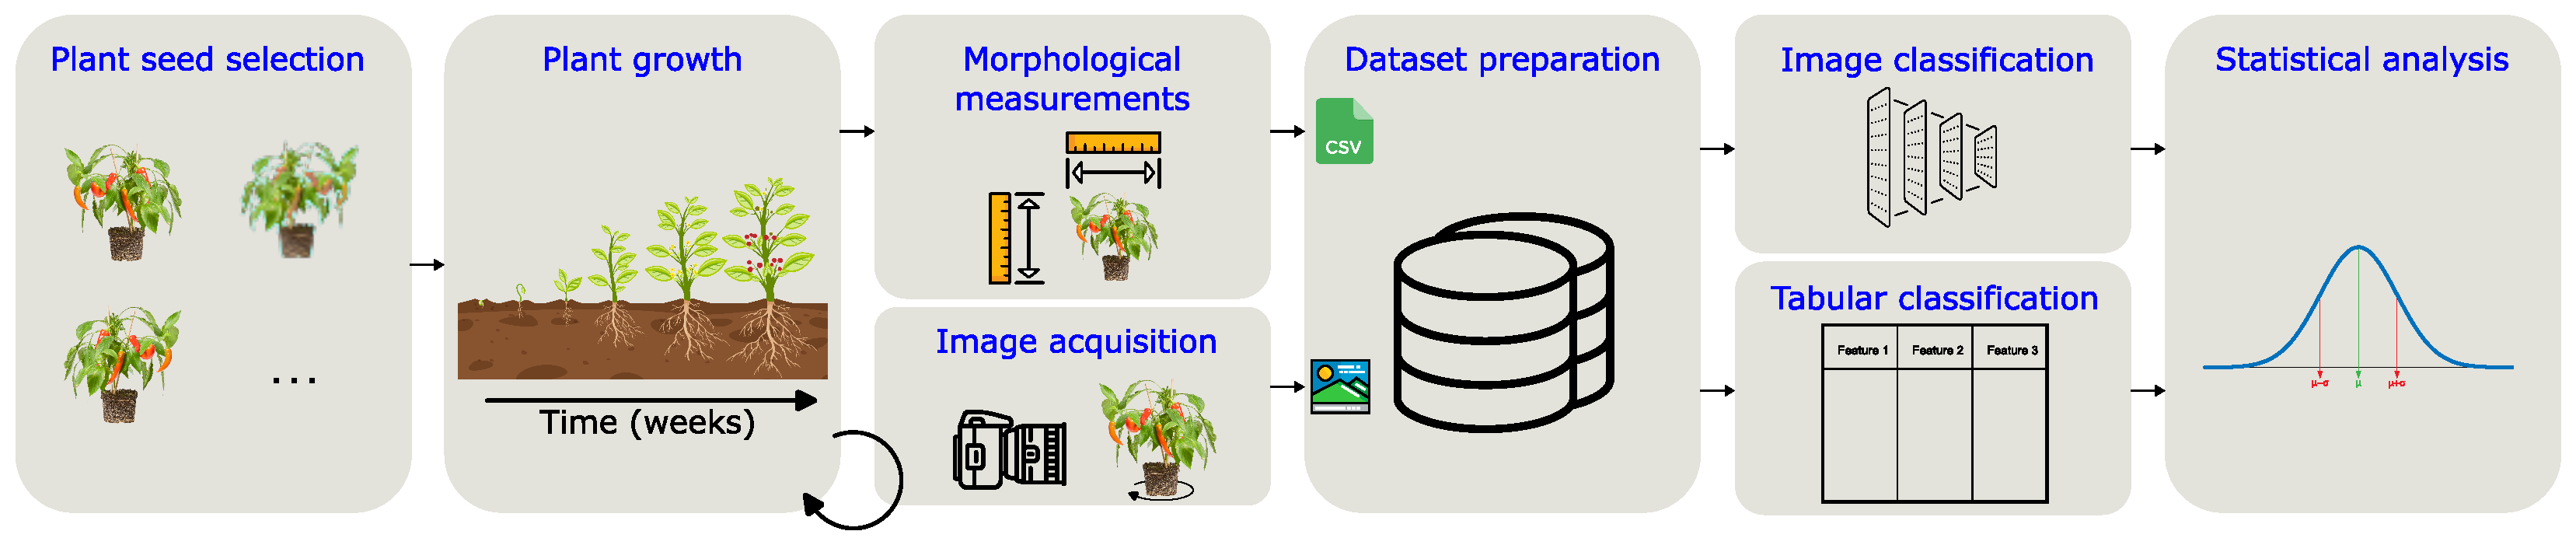
This study aimed to compare the efficacy of morphological measurements and RGB images as data sources for classifying the ornamental potential of various pepper plant genotypes. In addition, the capability of undertaking predictions based on photos taken weeks before assessment is studied too. This comparison aims at identifying the feasibility of getting rid of costly measurements and replacing them by simply taking photos and further processing them. By employing machine learning algorithms, the capability of each data source to accurately distinguish between ornamental and non-ornamental varieties will be evaluated. This research not only highlights the ornamental potential of pepper plants but also contributes to the broader field of plant phenotyping, facilitating the selection of superior cultivars for ornamental purposes. As far as the authors are aware, this work is the first to forecast the ornamental potential of pepper plants (Capsicum spp.) multiple weeks ahead of time using image-based deep learning models.
The findings from this study may provide valuable insights for horticulturists, breeders, and landscape designers in promoting and utilizing pepper plants more effectively in ornamental applications.

2. Materials and Methods

This section summarizes the methodology employed in the study as depicted in Figure 1. Subsequent subsections explore these steps in more depth.
It is worth remarking that the same pepper plants obtained by Ruiz-Gonzalez et al. [26] were used in the below-mentioned experiments. Thus, most of the information regarding plant growth, detailed in Section 2.1, Section 2.2, and Section 2.5 is the same as in the already published article and is only repeated for the sake of clarity.

2.1. Pepper Plant Seed Selection

Fifteen ornamental pepper (Capsicum spp.) accessions were used in this research. Their seeds, documented in Table 1, were obtained from the Active Germplasm Bank of the Federal University of Piauí/Campus Professora Cinobelina Elvas (UFPI/CPCE).

2.2. Pepper Plants Growth Conditions

Two experimental setups were evaluated: (i) a greenhouse equipped with temperature and humidity control systems, and (ii) a standard greenhouse lacking environmental controls (Figure 2). Further details about the process can be found in Ruiz-Gonzalez et al. [26].

2.3. Morphological Measurements

In the reproductive phase, some of the main descriptors suggested by the IPGRI (International Plant Genetic Resources Institute) for pepper (Capsicum spp.) [27] were measured for all the plants. In particular, guided by the Classification Criteria of the Veiling Holambra Cooperative [28], only the descriptors with a direct relationship with ornamental quality parameters for ornamental pepper plants were chosen. Specifically, those descriptors were the following: plant height (PH), canopy diameter (CD), growth habit (GH), leaf density (LD), and fruit count per plant equal to or greater than 10 (FC ≥ 10). The plant height was determined by measuring the vertical distance from the stem base (neck) to the apex of the tallest leaf or branch using a millimeter-scale ruler. Canopy diameter was determined with a forest caliper held horizontally, measuring the plant’s width at two different orientations (longitudinal diameter and transverse diameter). These measurements (denoted as D and d, for the largest and shortest, respectively) were then averaged to obtain a more accurate estimate of the canopy diameter. Growth habit was assessed by classifying the plant as erect (upright), intermediate, or prostrate based on its natural shape and structure. Leaf density was assessed by observing the plant canopy to gauge the extent to which the leaves covered stems and branches. Dense foliage implies minimal gaps, whereas sparse/scarce foliage implies that inner branches can be seen. An additional category (intermediate) was created for plants exhibiting behavior between these two classes. The measurements were recorded once on 10 August 2023 when 50% of the plants had reached full maturity of their first fruits, which corresponded to 15 weeks after seeding.

2.4. Ornamental Potential Assessment

Once again, in the reproductive phase, all of the plants were assessed for their ornamental value. This assessment was once again conducted when half of the plants exhibited their earliest fruit maturation. In this case, this event occurred on 10 August 2023, fifteen weeks after seed planting. First, an objective assessment was performed according to the quality indicators for ornamental pepper plants recommended by the Classification Criteria of the Veiling Holambra Cooperative [28].
In particular, following this criterion, plants were considered to have ornamental value only if they met all of the following conditions simultaneously:
  • Plant height between 12 and 38.5 cm;
  • Canopy diameter over 14.5 cm;
  • Plant height to canopy diameter ratio below 1;
  • Growth habit being either erect or intermediate;
  • Leaf density being dense;
  • Fruit count per plant being higher or equal to ten.
In addition, eight specialists/experts from several institutions in Brazil, all of whom had extensive experience working with ornamental peppers and the selection of fit individuals for genetic breeding programs, assessed all plants based on photos taken from different viewpoints. Each expert independently provided a numerical integer value from 1 to 10, where grades above or equal to five indicate that plants exhibit ornamental potential. The closer the grades were to 10, the more apt they were for ornamental purposes.
To minimize the effect of one expert excessively affecting the final result, the median among all experts was calculated.
To convert this median value into a binary class, a threshold of 5 was applied. Values equal to or greater than five were considered ornamental, whereas values below five were deemed to be non-ornamental.

2.5. Image Acquisition of Pepper Plants During Growth Stages

Once the plants reached the juvenile stage, characterized by the first branches splitting into two, digital image capture took place at the UFPI/CPCE Data Improvement and Analysis Laboratory. Further details about the image acquisition process can be found in Ruiz-Gonzalez et al. [26].
Nineteen photographs were acquired weekly for each plant across all sampling dates. This photographic documentation was carried out systematically for the 15 treatments, each comprising four greenhouse replicates (see Section 2.2). Thus, a total of 15 × 4 × 2 × 19 = 2280 photos were taken for each date. Photography concluded during the same week as morphological assessment. Images were preserved in dual formats (JPEG and RAW), each at a resolution of 6000 × 4000 pixels.

2.6. Dataset Preparation/Curation

The morphological measurements (Section 2.3), together with the binary value for whether the plant is classified as ornamental or not, were recorded in a CSV file following the specified layout shown in Table 2.
The collected data also encompassed all photographs taken of each plant during weekly monitoring. Additionally, each photograph was downsampled from its initial 6000 × 4000 px size to both 300 × 200 px and 600 × 400 px in order to compare the accuracy when a higher resolution is used. The Lanczos algorithm was used for downsampling in both cases. These images were arranged in a folder hierarchy following the structure shown in Figure 3. The resulting dataset, after full curation, was deposited in a public repository at Zenodo [29].

2.7. XGBoost-Based Model Ornamental Classification from Tabular Data

Another important aspect is assessing the feasibility of accurately estimating ornamental quality from tabular data with morphological measurements, and a later comparison with the estimation obtained from images. This classification is deemed as estimation since the ornamental potential is determined from tabular data obtained at the same date as the date when the assessment is made.
In order to answer this research question, an XGBoost model is employed. The rationale behind the use of this algorithm is that it handles structured data efficiently, it is computationally efficient, and it provides insights about feature importance as well. Since the dataset was small, with only 120 instances, 70% of the data was selected for the train dataset, 10% for the validation dataset, and the remaining 20% for the test dataset. In addition, the importance of each feature is calculated. In XGBoost, the feature importance (gain) measures the extent to which each feature contributes to improving the model’s predictive performance across all trees in the ensemble. The importance is calculated based on the total reduction in loss (gain) attributed to each feature when it is used in the splits. All models were run using the scikit-learn library [30].
Table 3 summarizes the most important hyperparameters employed for the XGBoost model.

2.8. Image Processing for Forecasting Using a ViT-Based Model

The experiments described in this subsection were repeated for images with a resolution of 300 × 200 px (Section 2.8.1) and 600 × 400 px (Section 2.8.2) in order to evaluate whether accuracy improvements can be expected from increasing image resolution.
Models were trained and subsequently assessed using the carefully prepared dataset (Section 2.6). As a first step, the complete dataset was partitioned into three discrete subsets: training (80%), validation (10%), and test (10%). Dataset partitioning was performed at the plant level to prevent data leakage. All 19 rotational images of a single plant were assigned to the same partition (train, validation, or test), ensuring that the model’s performance reflects generalization to new plants under consistent conditions. Partitions were stratified by treatment and growth conditions to maintain balanced representation across experimental factors. All follow-up experiments utilized identical datasets to maintain comparability between different test conditions. To expand the training dataset, image augmentation through random horizontal and vertical flips was implemented, effectively quadrupling the number of training instances for the ViT model. All ViT architectures presented in this section were developed using Python language [31], version 3.11, using PyTorch [32] library in version 2.7. The model underwent 10 independent training runs (200 epochs maximum per run) to mitigate the impact of random weight initialization. Early stopping was implemented to prevent overfitting and checkpointing was employed to preserve the weights yielding optimal validation performance. The trained models were evaluated by feeding the test dataset images into them, generating predicted values, and comparing these predictions with the ground truth measurements from Section 2.4, as detailed in Section 2.9. The entire experimental pipeline, including model training and evaluation, was implemented in Python and deployed on Google Colab’s cloud infrastructure [33] running on a server with these specs:
  • CPU: Intel® Xeon® @ 2.20 GHz
  • RAM: 12.7 GB
  • GPU: NVIDIA Tesla T4 (15 GB)

2.8.1. Model Employed for an Image Resolution of 300 × 200 px

A Vision Transformer (ViT) model was used for image-based classification due to their state-of-the-art capabilities and global context modeling over other alternatives such as CNNs that focus on local context instead. The ViT architecture follows the original implementation of Dosovitskiy et al. [34], with several modifications for efficiency and was built upon the following GitHub repository [35]. The model processes input images of size 300 × 200 pixels divided into 20 × 20 px non-overlapping patches ( 15 × 10 grid), producing a sequence length of 150. Each patch is linearly embedded into a 128-dimensional space (denoted as dim) using a trainable projection. The main parameters of the ViT-based architecture are shown in Table 4.
The Linformer variant [36] was employed as the transformer backbone, which reduces the O ( n 2 ) attention complexity to O ( n ) through learned low-rank projections. The transformer consists of 12 layers (depth), 8 attention heads (heads), and uses a projection dimension k = 64 for the Linformer’s efficient attention mechanism. A learnable classification token is prepended to the patch sequence following standard ViT practice [34].
The model processes RGB images (channels = 3) and outputs class predictions for binary classification task (num_classes = 2). All computations were performed on GPU hardware.

2.8.2. Model Employed for an Image Resolution of 600 × 400 px

The employed Vision Transformer (ViT) architecture builds upon the original design of Dosovitskiy et al. [34], optimized for efficiency using the Linformer approach [36]. The model processes higher-resolution 600 × 400 pixel images, divided into 20 × 20 px patches, resulting in a 30 × 20 grid (600 total patches). Each patch is projected into a 128-dimensional embedding space (dim). The main parameters of the ViT-based architecture are shown in Table 5.
The Linformer backbone [36] reduces the quadratic complexity of standard self-attention to linear through low-rank projections (projection dimension k = 64). The transformer consists of 12 layers (depth) with 8 attention heads (heads) per layer. Following ViT conventions [34], a learnable classification token was prepended, extending the effective sequence length to 601 (seq_len = 600 + 1).
The architecture maintains RGB input processing (channels = 3) and binary classification output (num_classes = 2), with all computations accelerated on GPU hardware.

2.9. Statistical Analysis of the Obtained Results

The performance scores of the proposed models (Section 2.8) were evaluated using confusion matrices together with metrics derived from them, such as accuracy, precision, recall, and F1-score [37]. Python [31] was used for all computations and visualizations employing the scikit-learn library [30].

3. Results

In this section, all results obtained by following the aforementioned methodology are presented.
From Section 3.1 and Section 3.2, the results show the behavior while estimating the ornamental potential, i.e., when the date of the tabular data or images match those of the assessment. From Section 3.3 onward, the results show the behavior while predicting the ornamental potential, i.e., when the images were taken prior to the assessment date.

3.1. XGBoost-Based Model for Ornamental Classification from Tabular Data

3.1.1. Median of Experts Marks

The XGBoost model achieved an accuracy of 91.67% on the test set, demonstrating its effectiveness in classifying ornamental plants based on morphological measurements. The confusion matrix is presented in Figure 4.
The precision, recall, and F1-score values were all 92.86%, indicating balanced performance in terms of both false positives and false negatives.
Feature importance analysis (Figure 5) revealed that plant height (PH) and plant height to canopy diameter ratio (PH/CD) were the most significant contributors to the decision-making process of the model, followed by largest diameter (D) and leaf density (LD). This highlights that a simpler model can be used using only these features to obtain very similar accuracy.

3.1.2. Veiling Holambra Criterion

The XGBoost model achieved an accuracy of 95.83% on the test set, demonstrating its effectiveness in classifying ornamental plants based on morphological measurements. The confusion matrix is presented in Figure 6.
The precision, recall, and F1-score values were 100%, 75%, and 85.71%, respectively.
Feature importance analysis (Figure 7) revealed that leaf density (LD) and growth habit (GH) were the most significant contributors to the decision-making process of the model, followed by plant height to canopy diameter ratio (PH/CD) and canopy diameter (CD). This highlights that a simpler model can be used using only these features to obtain very similar accuracy.
A comparison between Figure 4 and Figure 6 shows that both criteria (experts and Veiling Holambra) differ greatly in which features are more relevant in assessing ornamental potential. These findings suggest that the Veiling Holambra criterion may not align well with consumer perception, as inferred from expert evaluations. This discrepancy highlights the necessity for the refinement of selection criteria in breeding programs, a subject that merits further investigation.

3.2. ViT-Based Model for Ornamental Classification from Images

3.2.1. Using Images of Resolution 300 × 200 px

When using the experts criterion for ornamental potential, the ViT-based model achieved an accuracy of 99.20% on the test set, demonstrating its effectiveness in classifying ornamental plants based on images. The precision, recall, and F1-score values were 100%, 98.83%, and 99.41%, respectively, indicating balanced performance in terms of both false positives and false negatives. The confusion matrix is shown in Figure 8.
When using the Veiling Holambra criterion for ornamental potential, the ViT-based model achieved an accuracy of 88.26% on the test set, demonstrating its effectiveness in classifying ornamental plants based on images. The precision, recall, and F1-score values were 85%, 59.65%, and 70.10%, respectively, indicating a much worse performance. This fact highlights that there is not a correlation between image information and the Veiling Holambra criterion, suggesting that this criterion does not accurately represent what can be observed visually. The confusion matrix is shown in Figure 9.

3.2.2. Using Images of Resolution 600 × 400 px

When using the experts criterion for ornamental potential, the ViT-based model achieved an accuracy of 97.98% on the test set, demonstrating its effectiveness in classifying ornamental plants based on images. The precision, recall, and F1-score values were 100%, 97.08%, and 98.52%, respectively, indicating almost the same behavior as when using 300 × 200 px images. The confusion matrix is shown in Figure 10.
When using the Veiling Holambra criterion for ornamental potential, the ViT-based model achieved an accuracy of 89.47% on the test set, demonstrating its effectiveness in classifying ornamental plants based on images. The precision, recall, and F1-score values were 87.80%, 63.16%, and 73.47%, respectively, indicating once again that very similar behavior can be expected as when using 300 × 200 px images. The confusion matrix is shown in Figure 11.

3.3. ViT-Based Model for Ornamental Potential Forecasting

In this subsection, the capability of predicting the future ornamental potential of pepper plants, merely based on current images, is assessed.
As it can be seen in Table 6, very accurate predictions can be made about ornamental potential up to 7 weeks before assessment, with almost perfect estimations being attainable when using images from the same date as the assessment date, i.e., when plants achieve fruit ripening. It is worth highlighting that the precision stays at 100% for every date, which means none of the non-ornamental plants is misclassified. This is of special importance for commercial purposes since breeding programs can guarantee all selected genotypes will exhibit ornamental capability.

4. Discussion

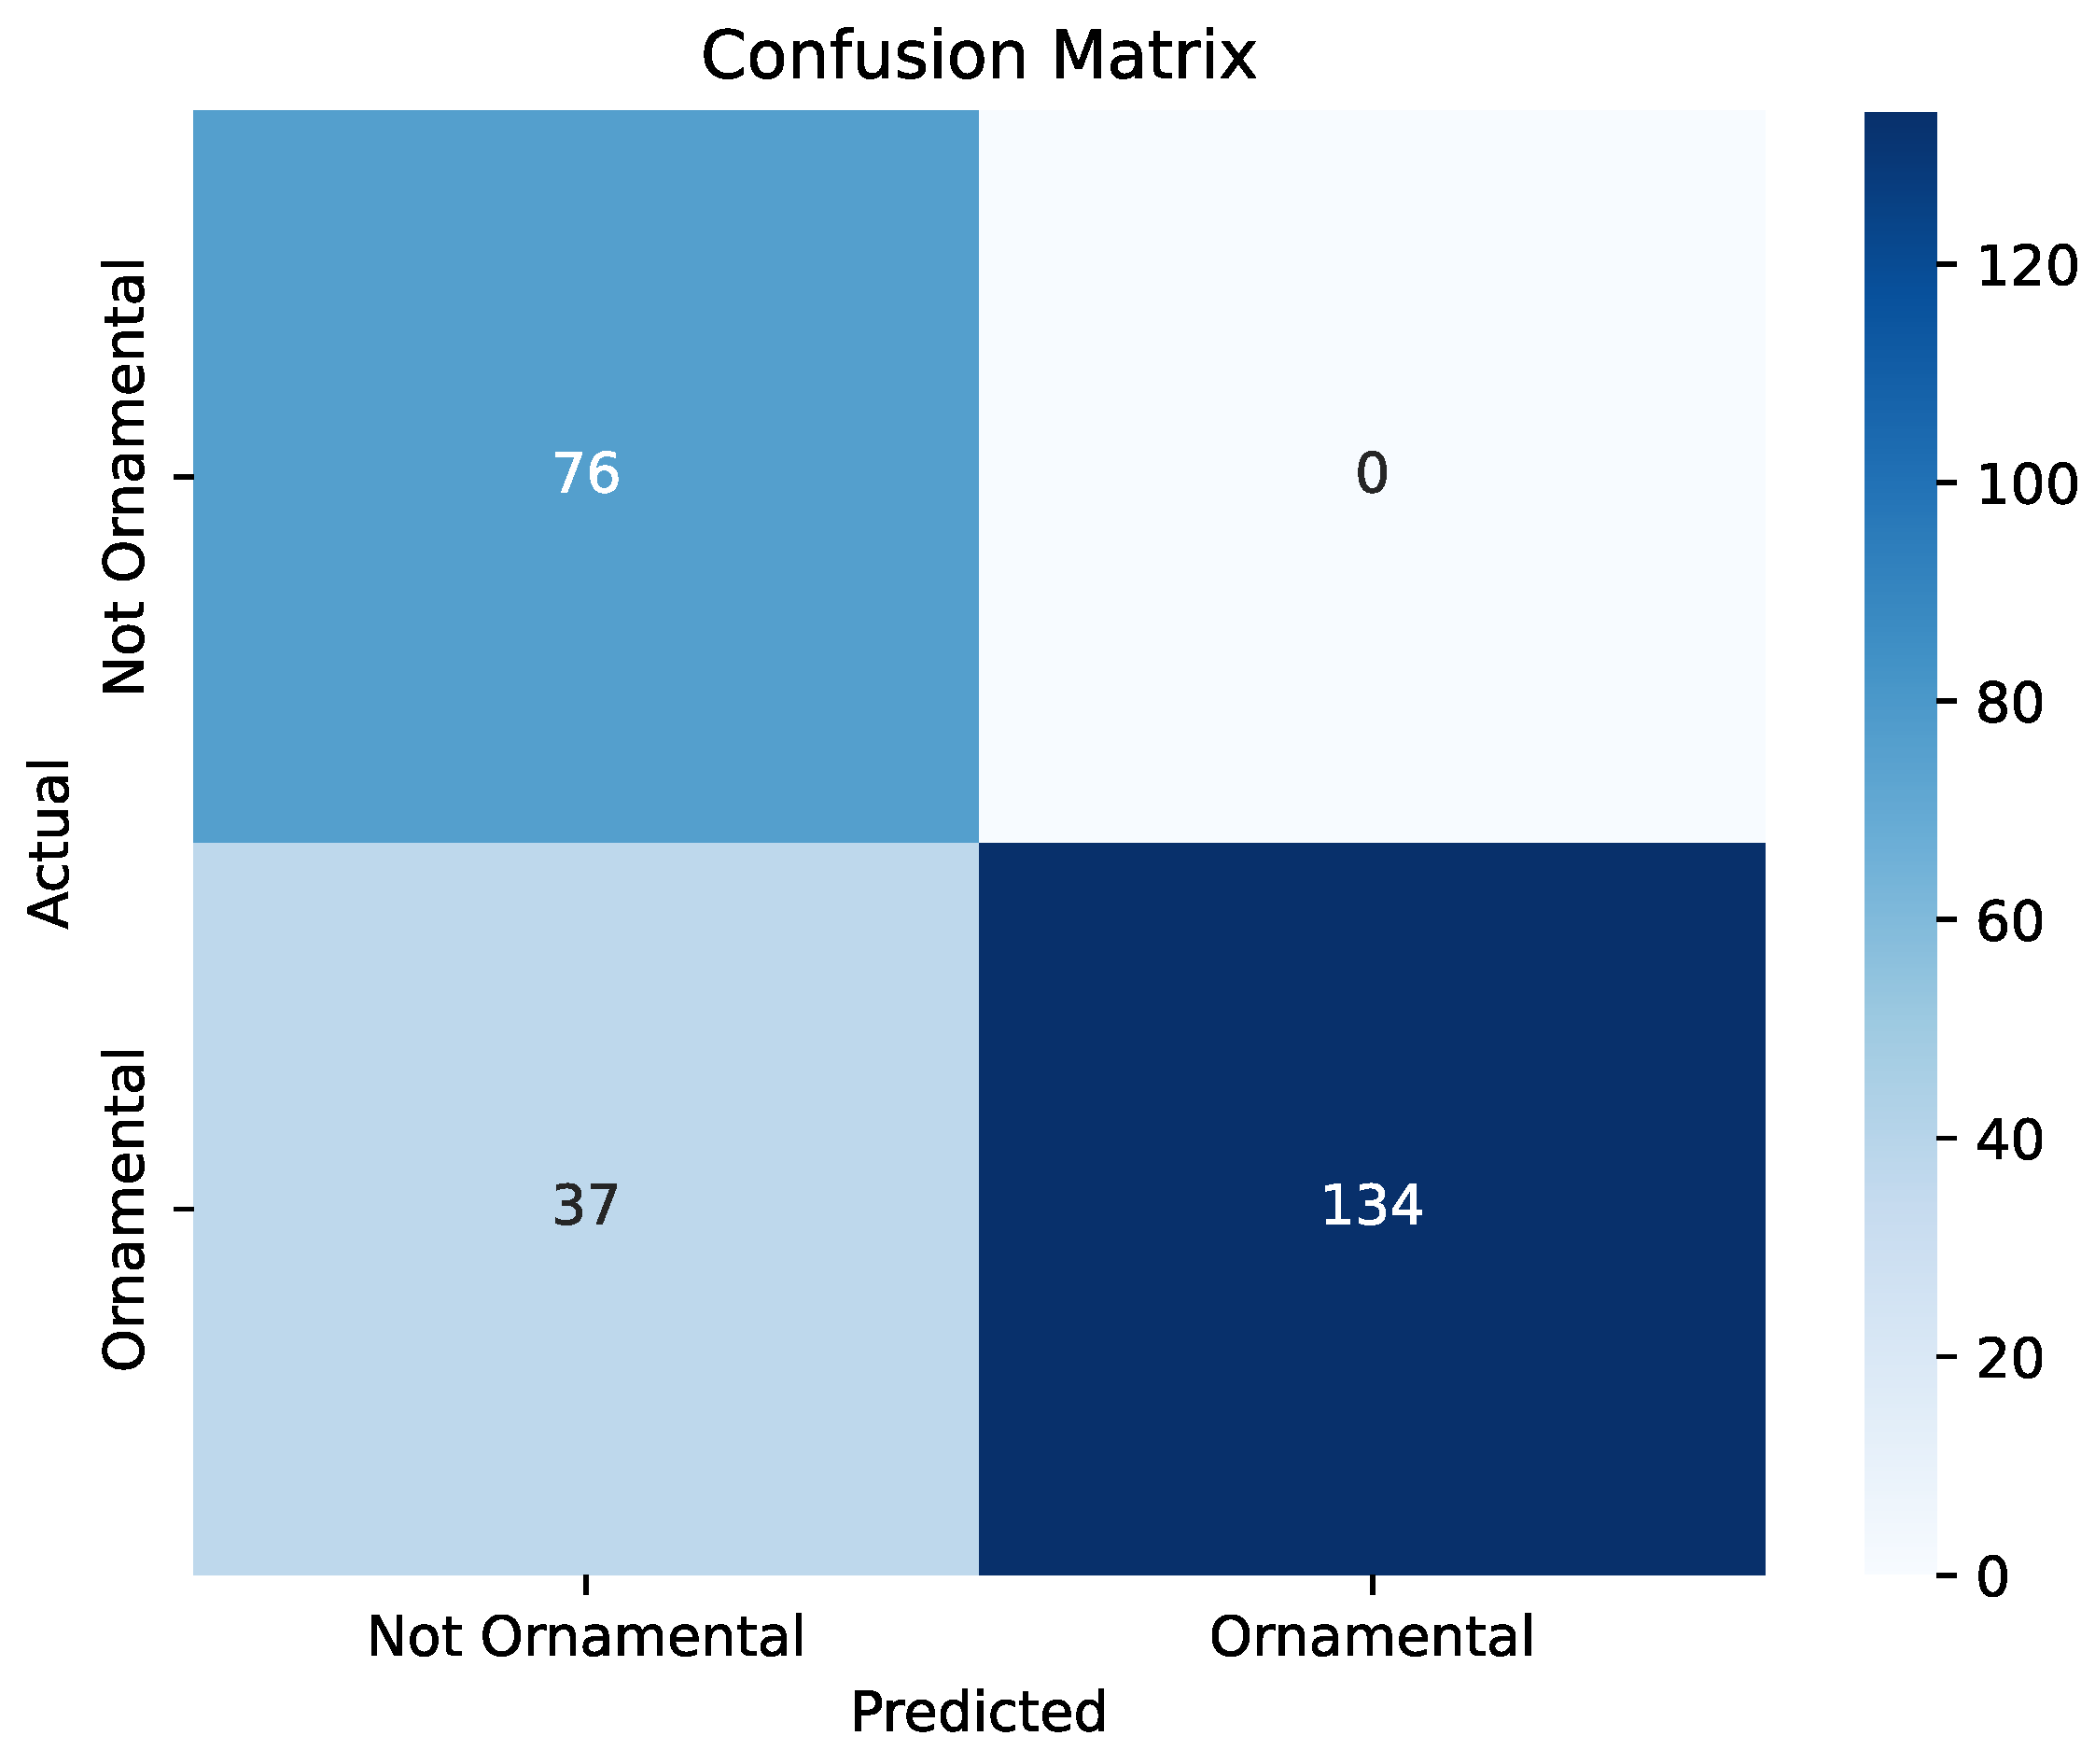
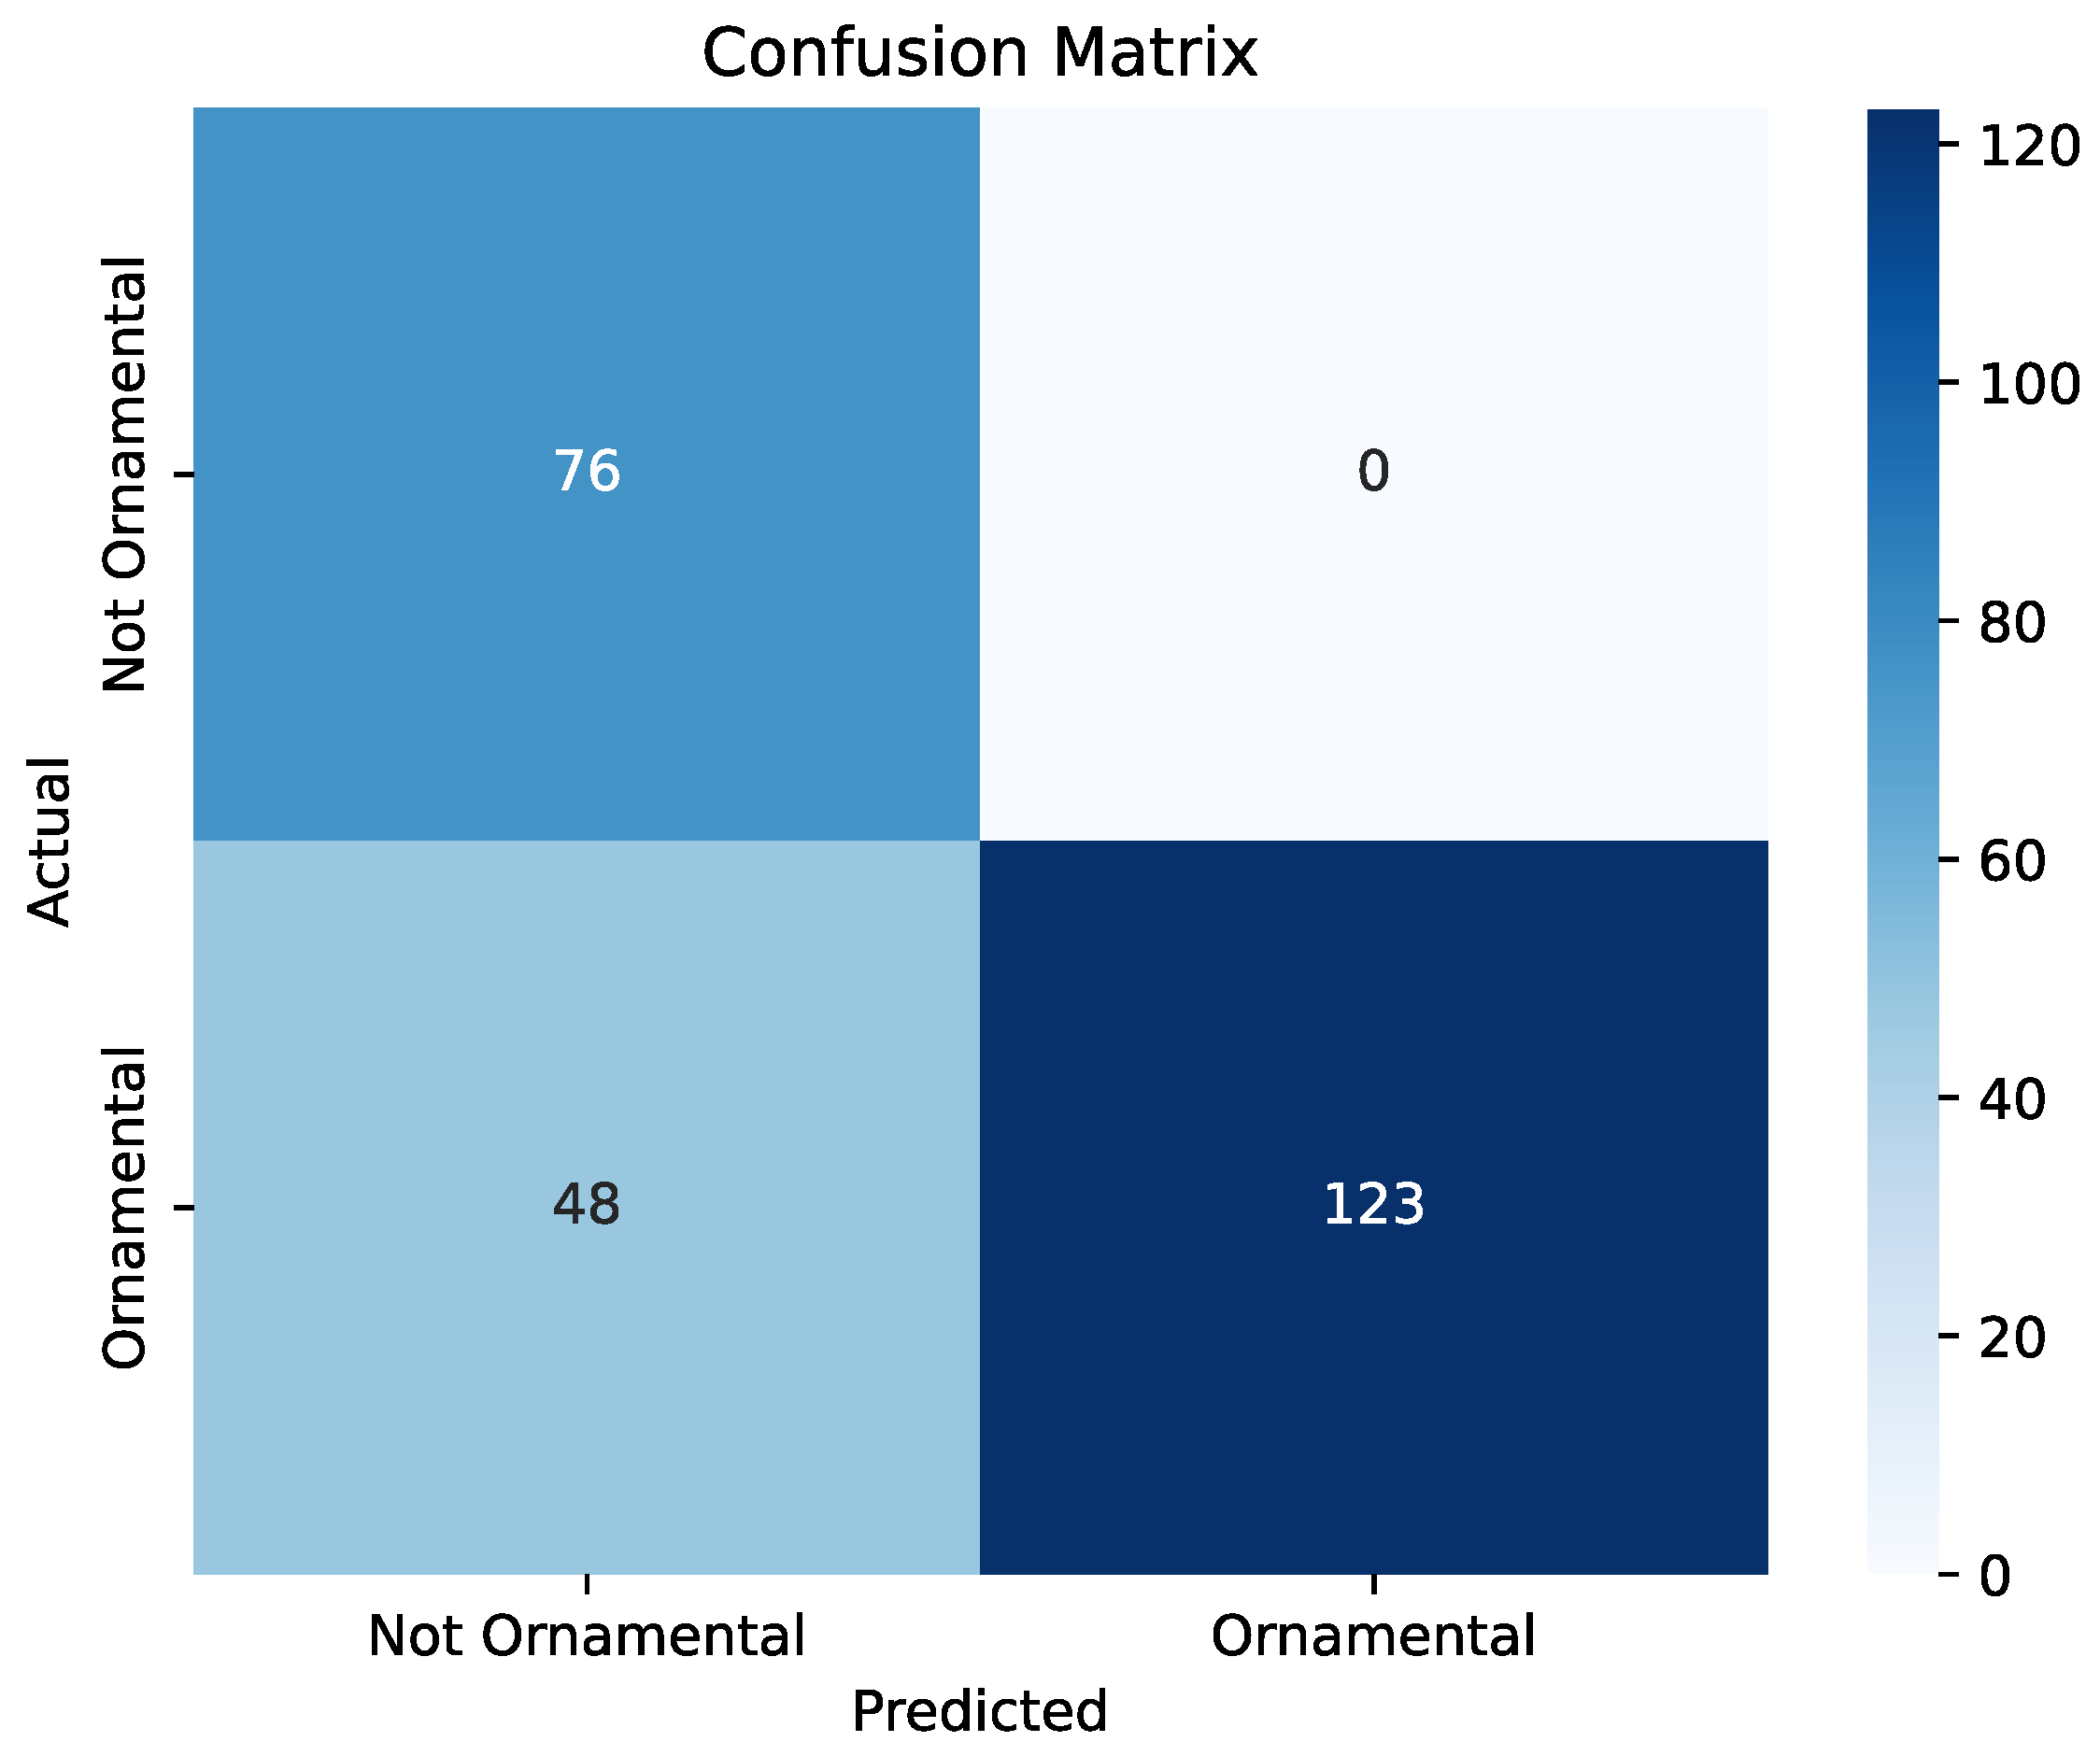
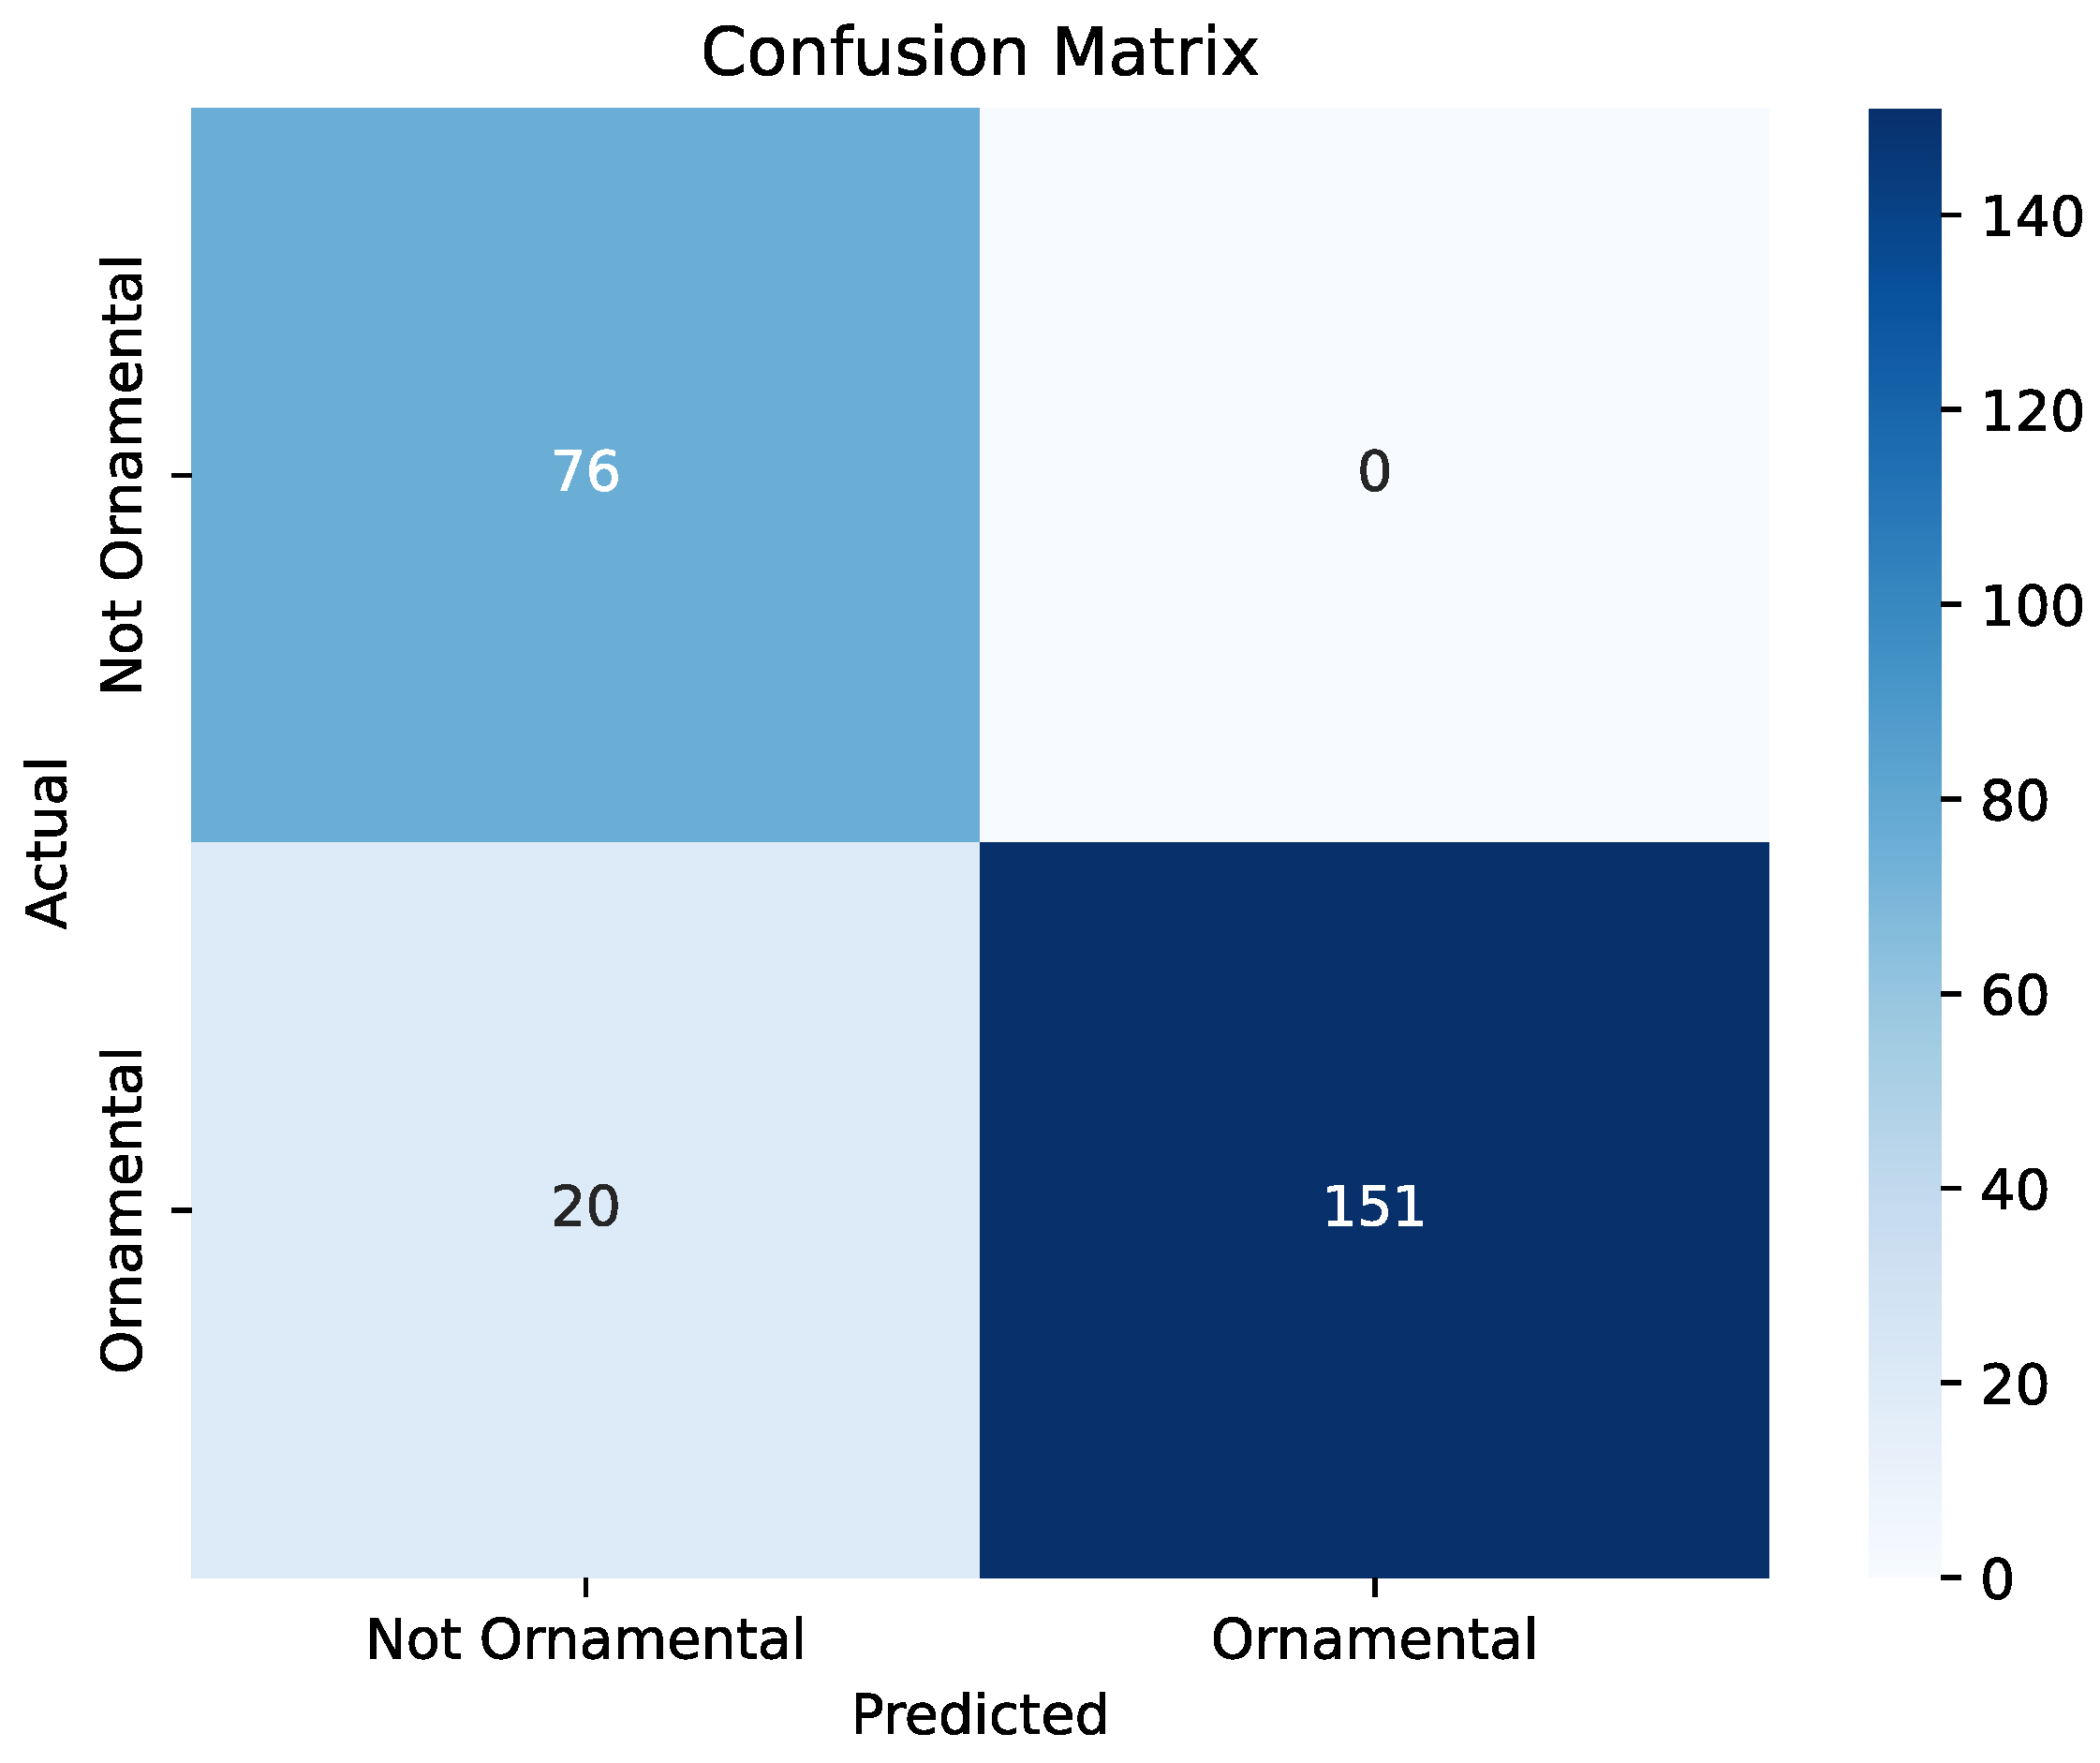
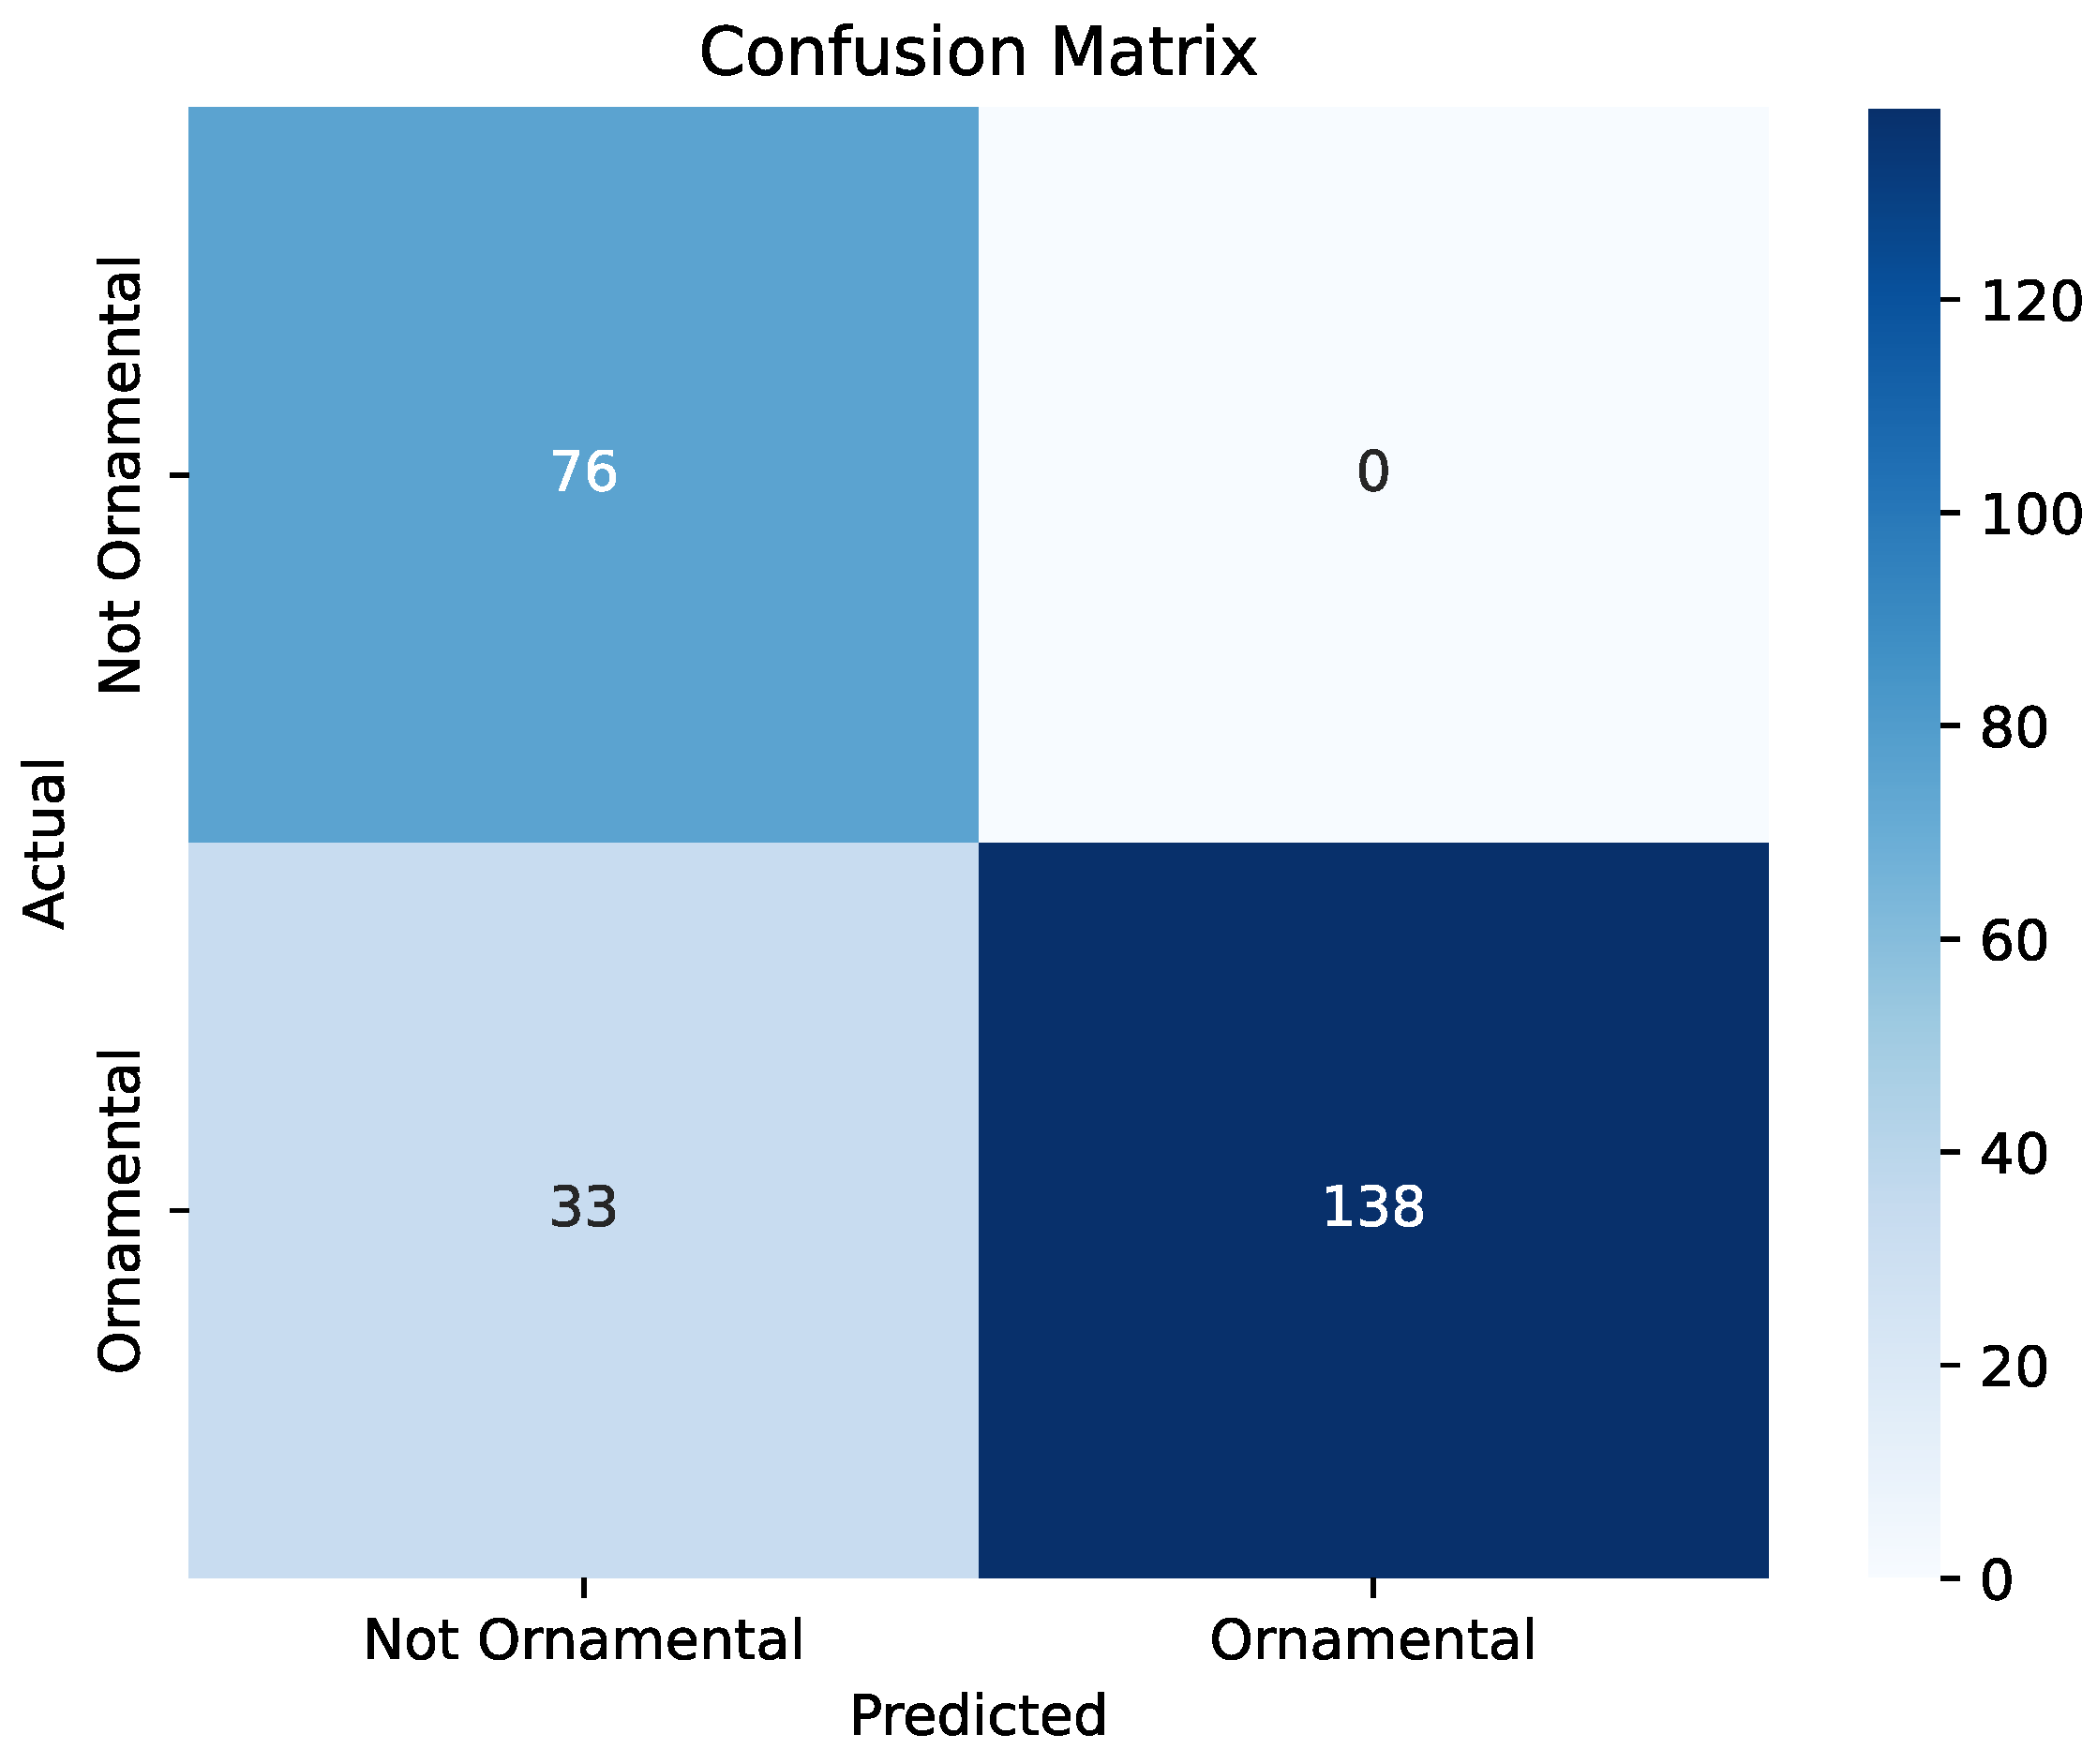
Four significant findings emerge from this investigation. Firstly, and mainly, the capability of estimating the ornamental potential of pepper plants from morphological measurements as well as from a single RGB image has been demonstrated feasible with similar accuracy in both cases. Importantly, this accurate prediction can be achieved both for plants growing under controlled and stress conditions. Second, when employing a single RGB image to predict ornamental potential, the accuracy is kept within acceptable values up to seven weeks in advance. Third, more accurate results are achieved when the image acquisition date is closer to the morphological assessment date, as this reduces uncertainty about the plant’s developmental stage. Fourth, increasing the RGB image resolution beyond 200 × 300 px does not improve the accuracy and thus seems sufficient for the model to keep enough level of detail about the plant under assessment. Nevertheless, this should be further validated in future work by testing more resolutions with a bigger dataset as well.
These demonstrated capabilities show particular promise for agronomic and horticultural use cases, specially in genetic breeding programs, as shown, for example, by a previous review article for ornamental potential prediction by Opara et al. [38]. In particular, being able to accurately predict the ornamental potential of pepper plants is critical for early screening of seedlings and juvenile plants to avoid investing resources in specimens with anticipated poor ornamental characteristics [39]. The models applied in this study demonstrated high accuracy in predicting the ornamental quality of pepper plants, even up to seven weeks in advance. This performance is due to the use of advanced feature transformations combined with deep neural network structures, capable of capturing and qualitatively describing subtle morphological variations between plants [40].
As far as the authors are aware, this work is the first to forecast the ornamental potential of pepper plants (Capsicum spp.) multiple weeks ahead of time using image-based deep learning models. In autogamous plants, such as pepper plants, seven to eight generations are typically required to obtain homozygous lines [41]. Each selection cycle lasts on average 215 days [42], that is, around 31 weeks. In each generation, hundreds or thousands of lines can be evaluated, depending on the crop. In pepper plants, 90 to 730 plants can be evaluated in a single F2 population [43,44]. Anticipating each selection cycle in the breeding program by 7 weeks would allow accessions that are unfeasible to be discarded in the 24th week, which will save time and inputs used to maintain the plants. Thus, this innovative approach not only opens new avenues for integrating phenotyping and forecasting into breeding and production decision-making processes, but also creates opportunities to optimize the management of breeding populations, reduce resource waste, and accelerate the development of new cultivars. The predictive capacity of these models makes them particularly valuable for early-stage phenotypic selection, reducing reliance on late-stage evaluations and subjective visual assessments by experts.
In a broader context, in ornamental pepper plants, neural network models have been used to predict plant diameter and height but not before, up to our knowledge, to classify them as ornamental based on the estimated parameters [26]. Chan et al. [45], by combining multiple prediction models, were able to forecast a population of western flower thrips (Frankliniella occidentalis), a notorious greenhouse pest, one week in advance in sweet pepper crops. Most studies applying prediction models in ornamental plants focus on species classification [46,47,48,49] and the classification of biotic and abiotic stresses [50] as well, making it difficult to compare the results of this article with the literature.
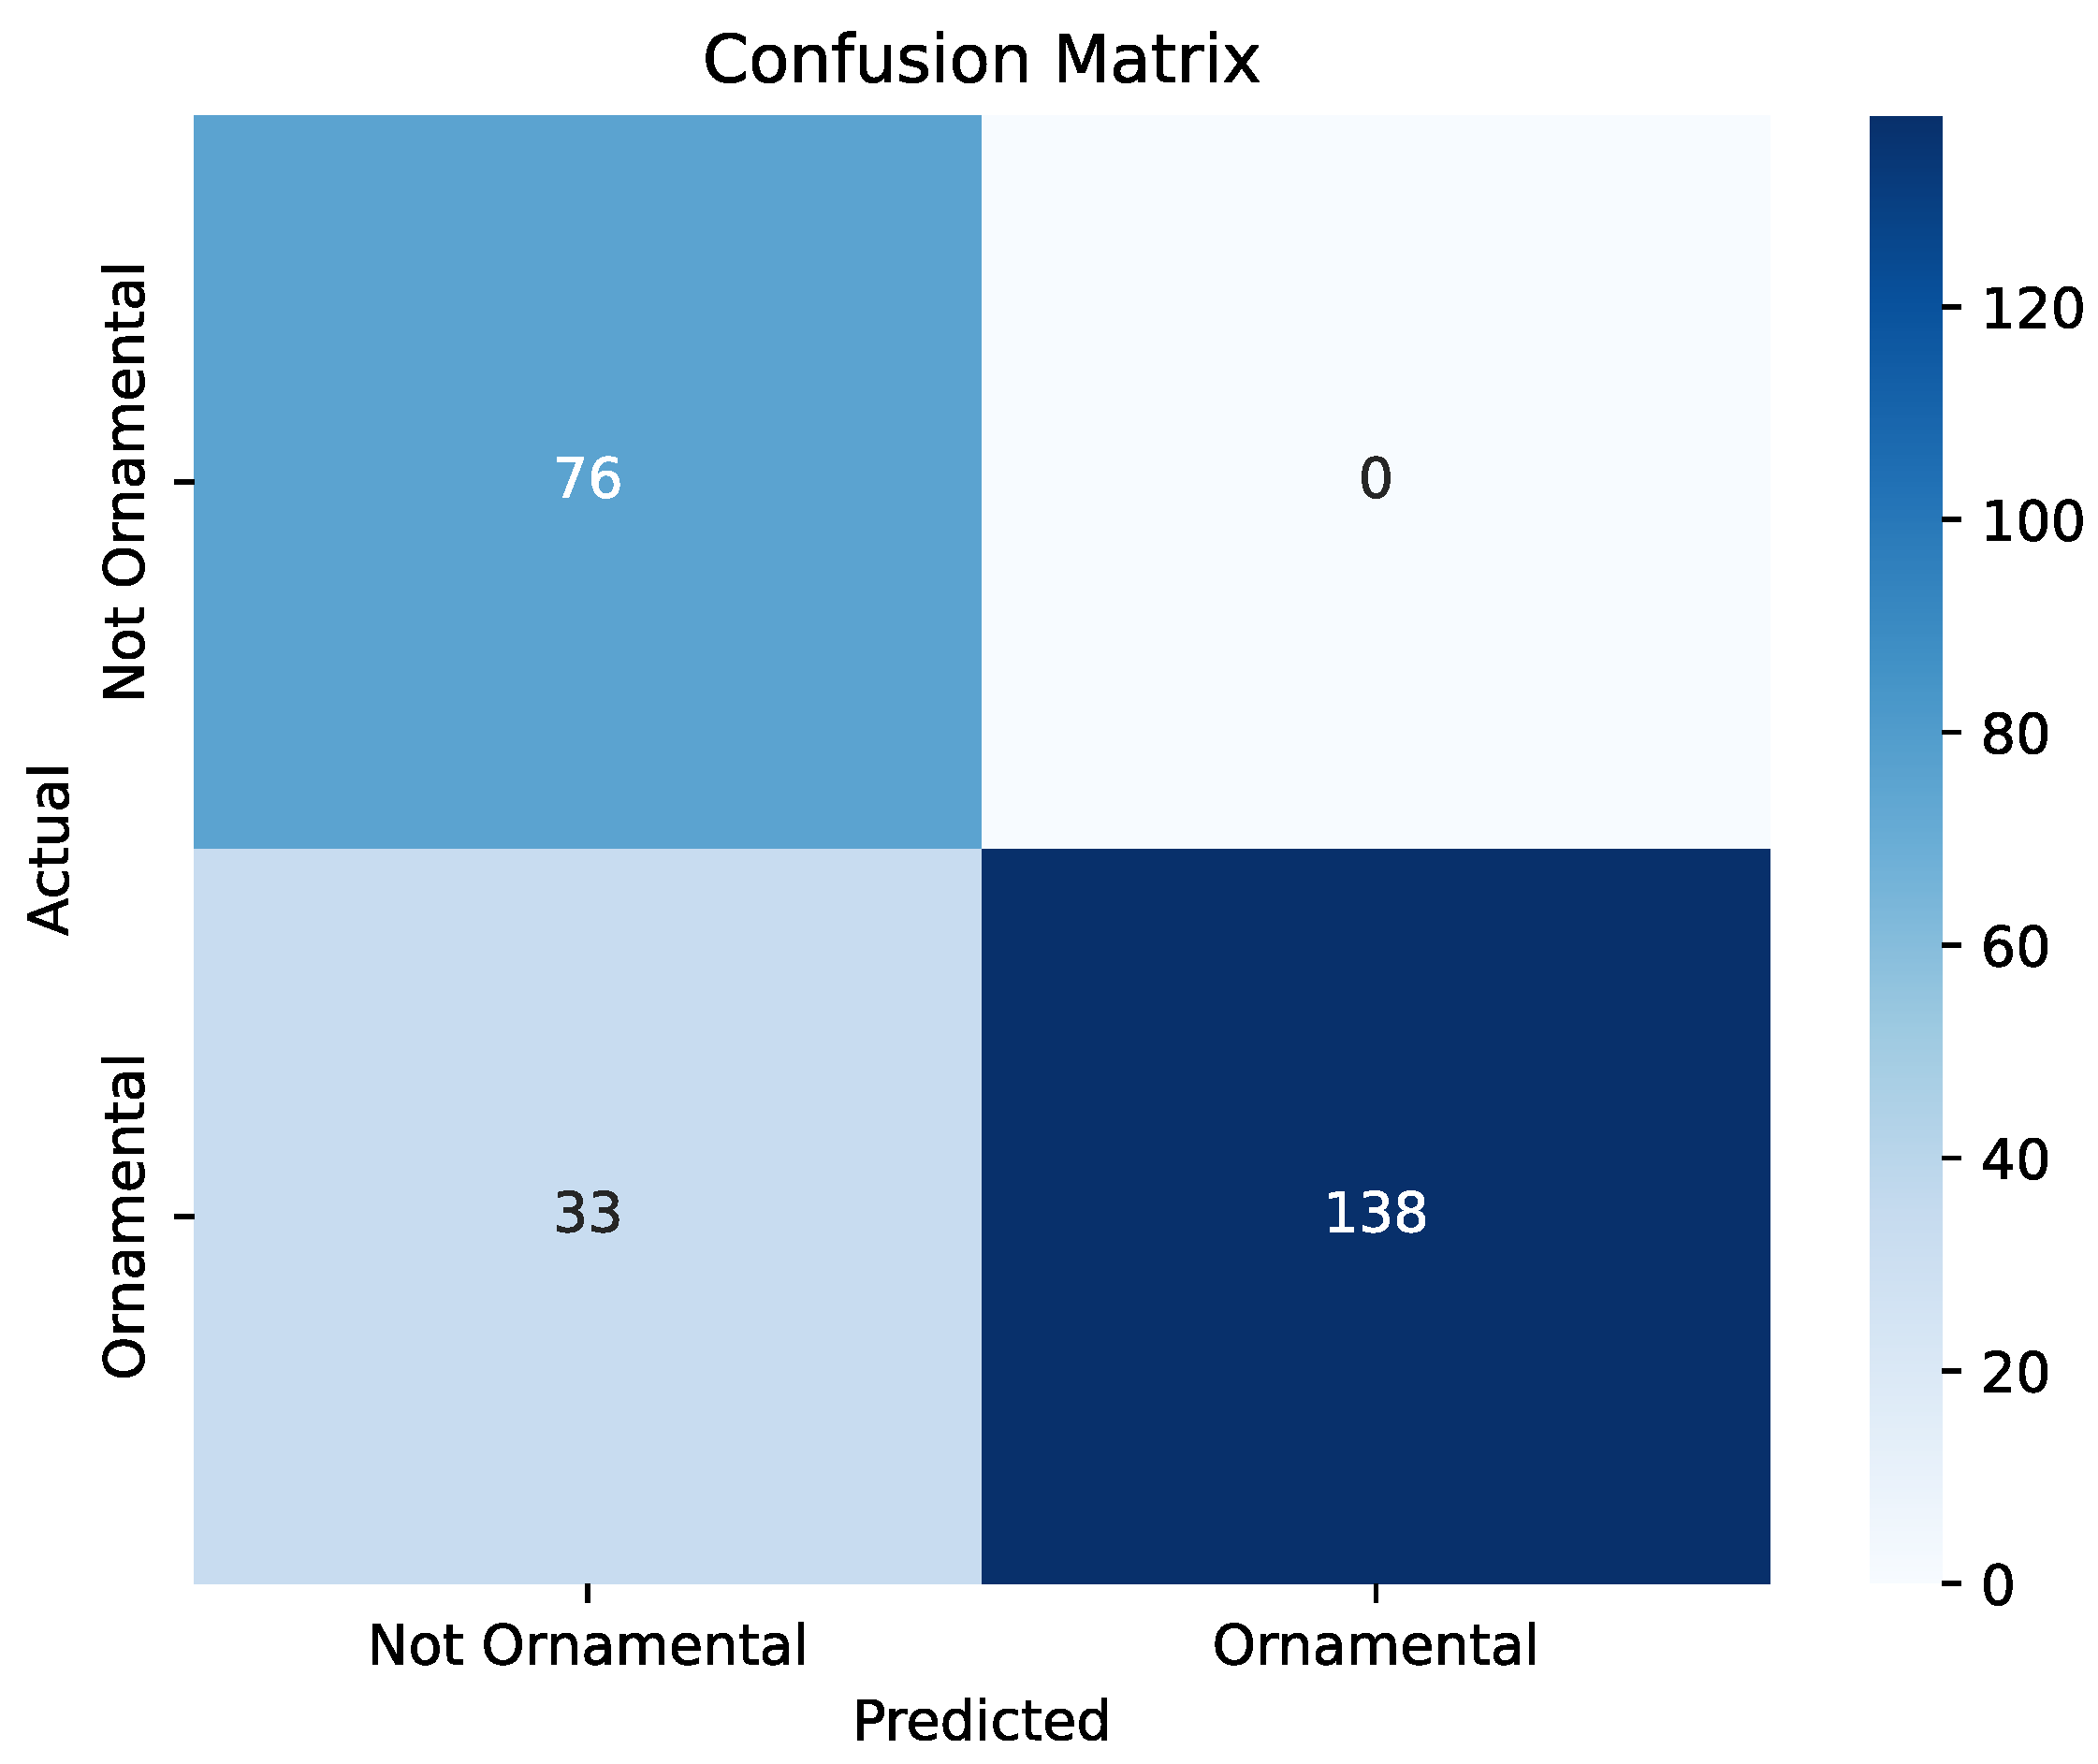
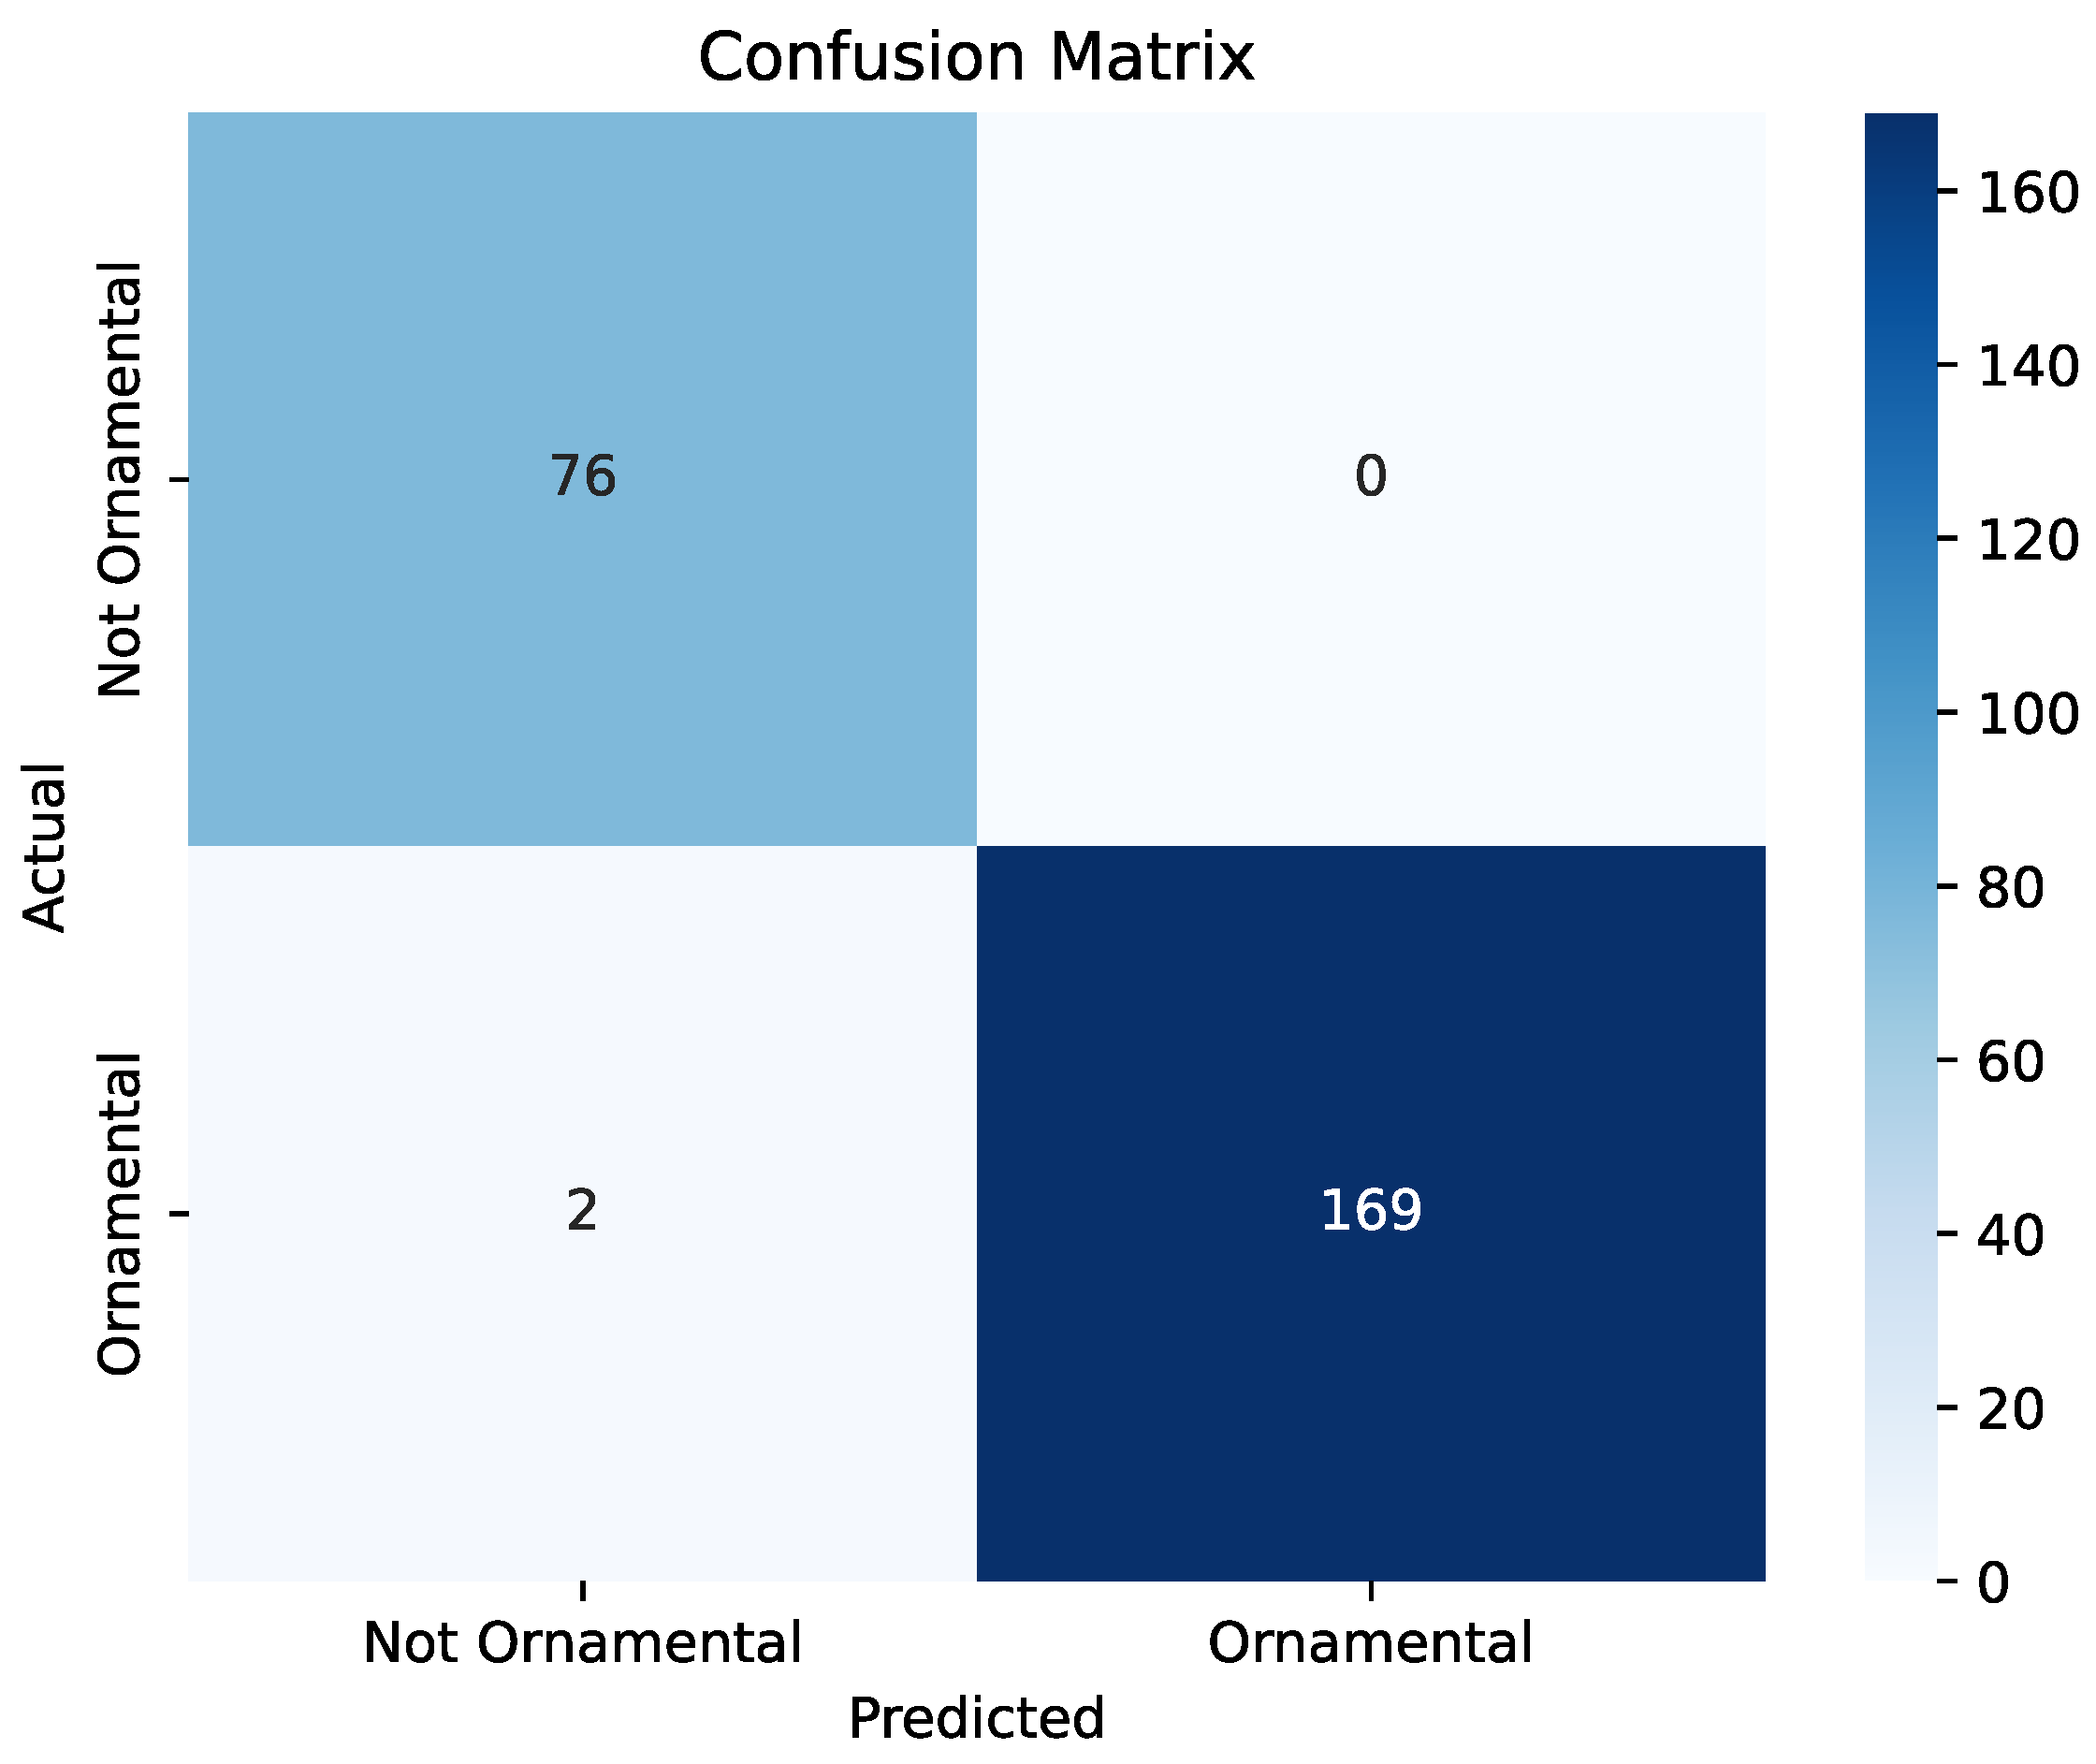
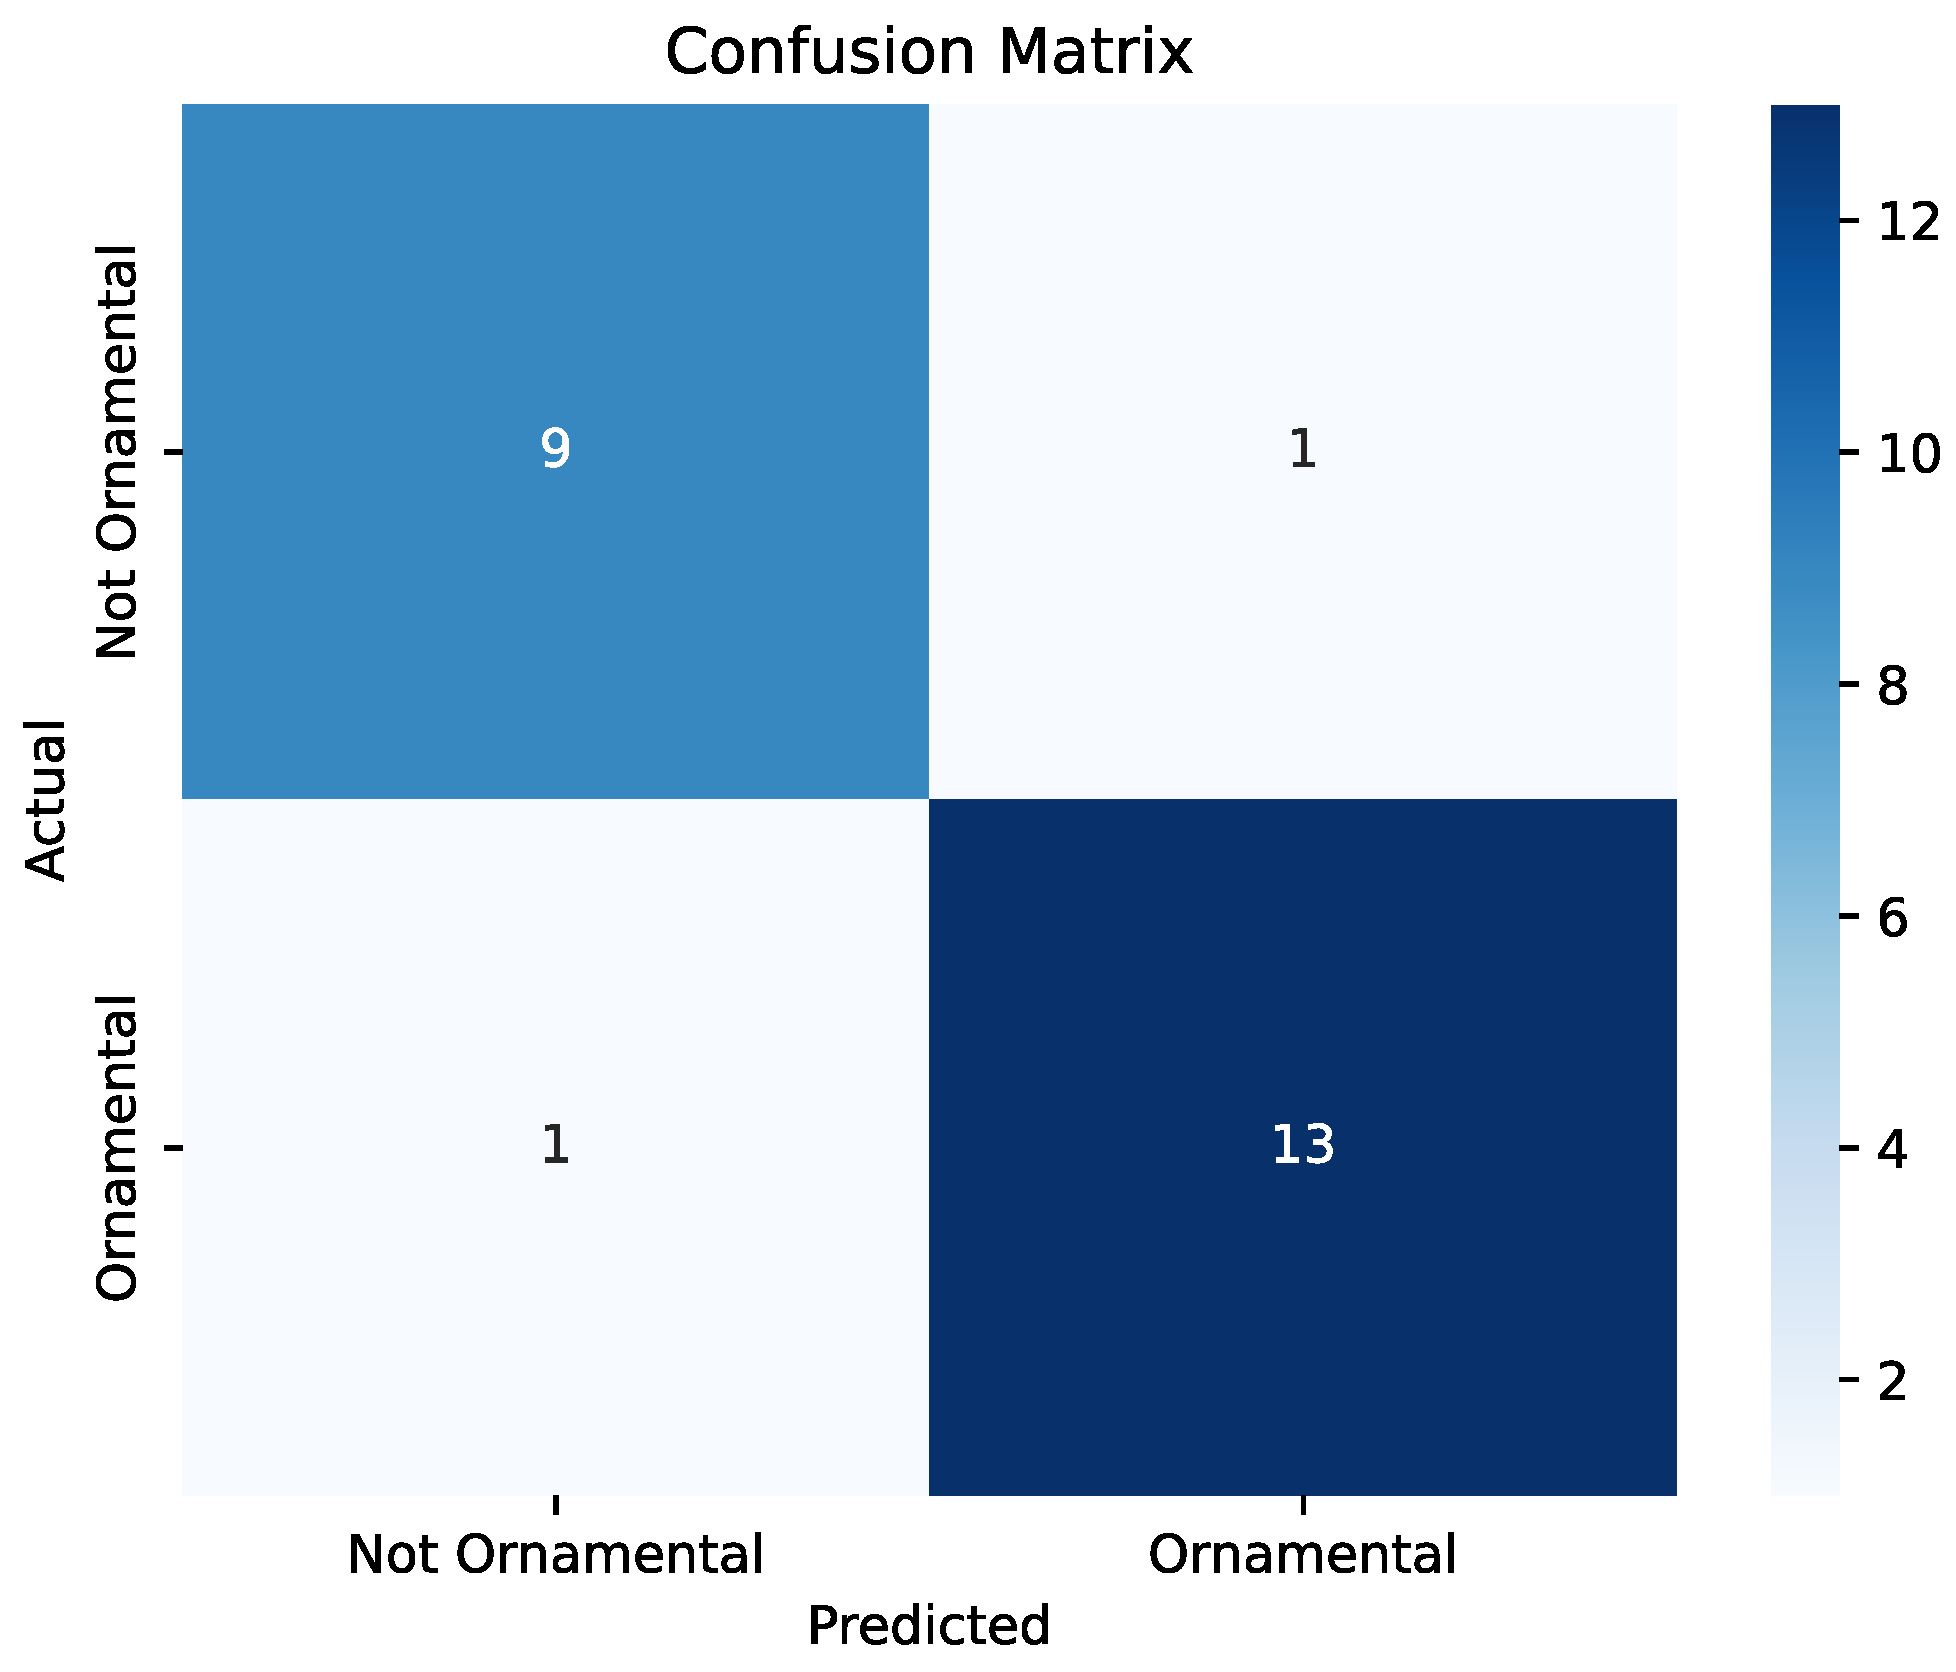
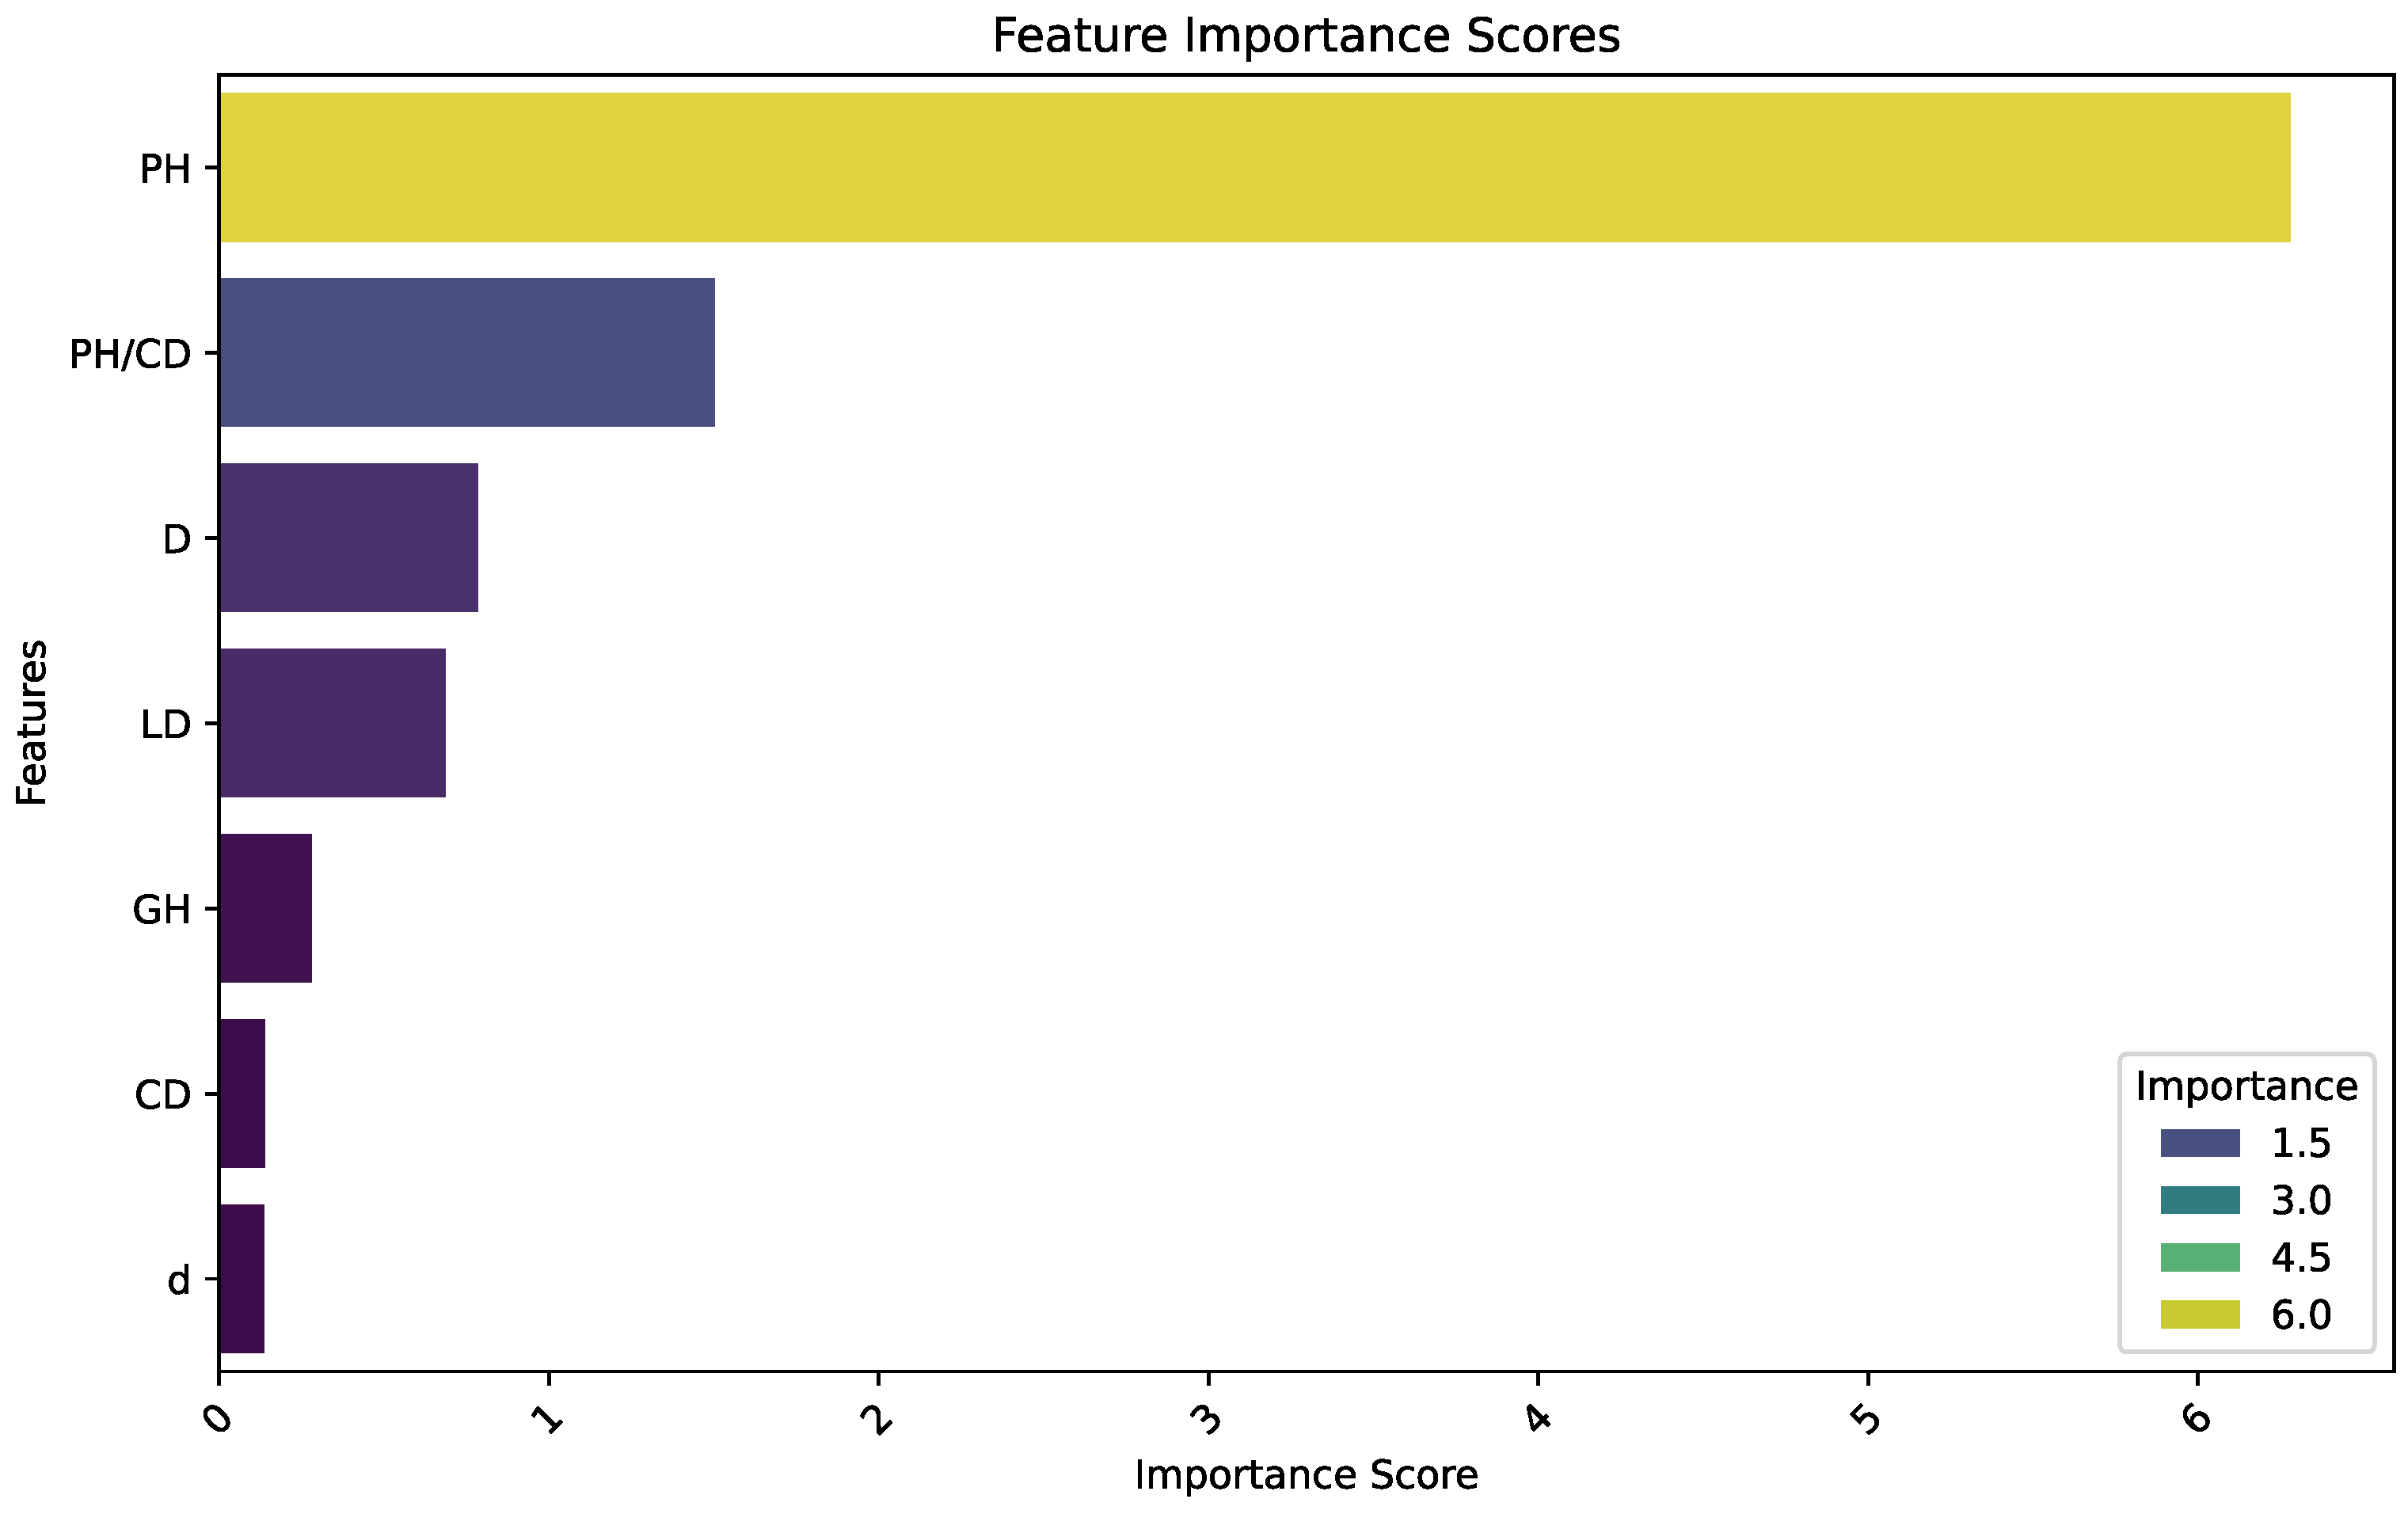
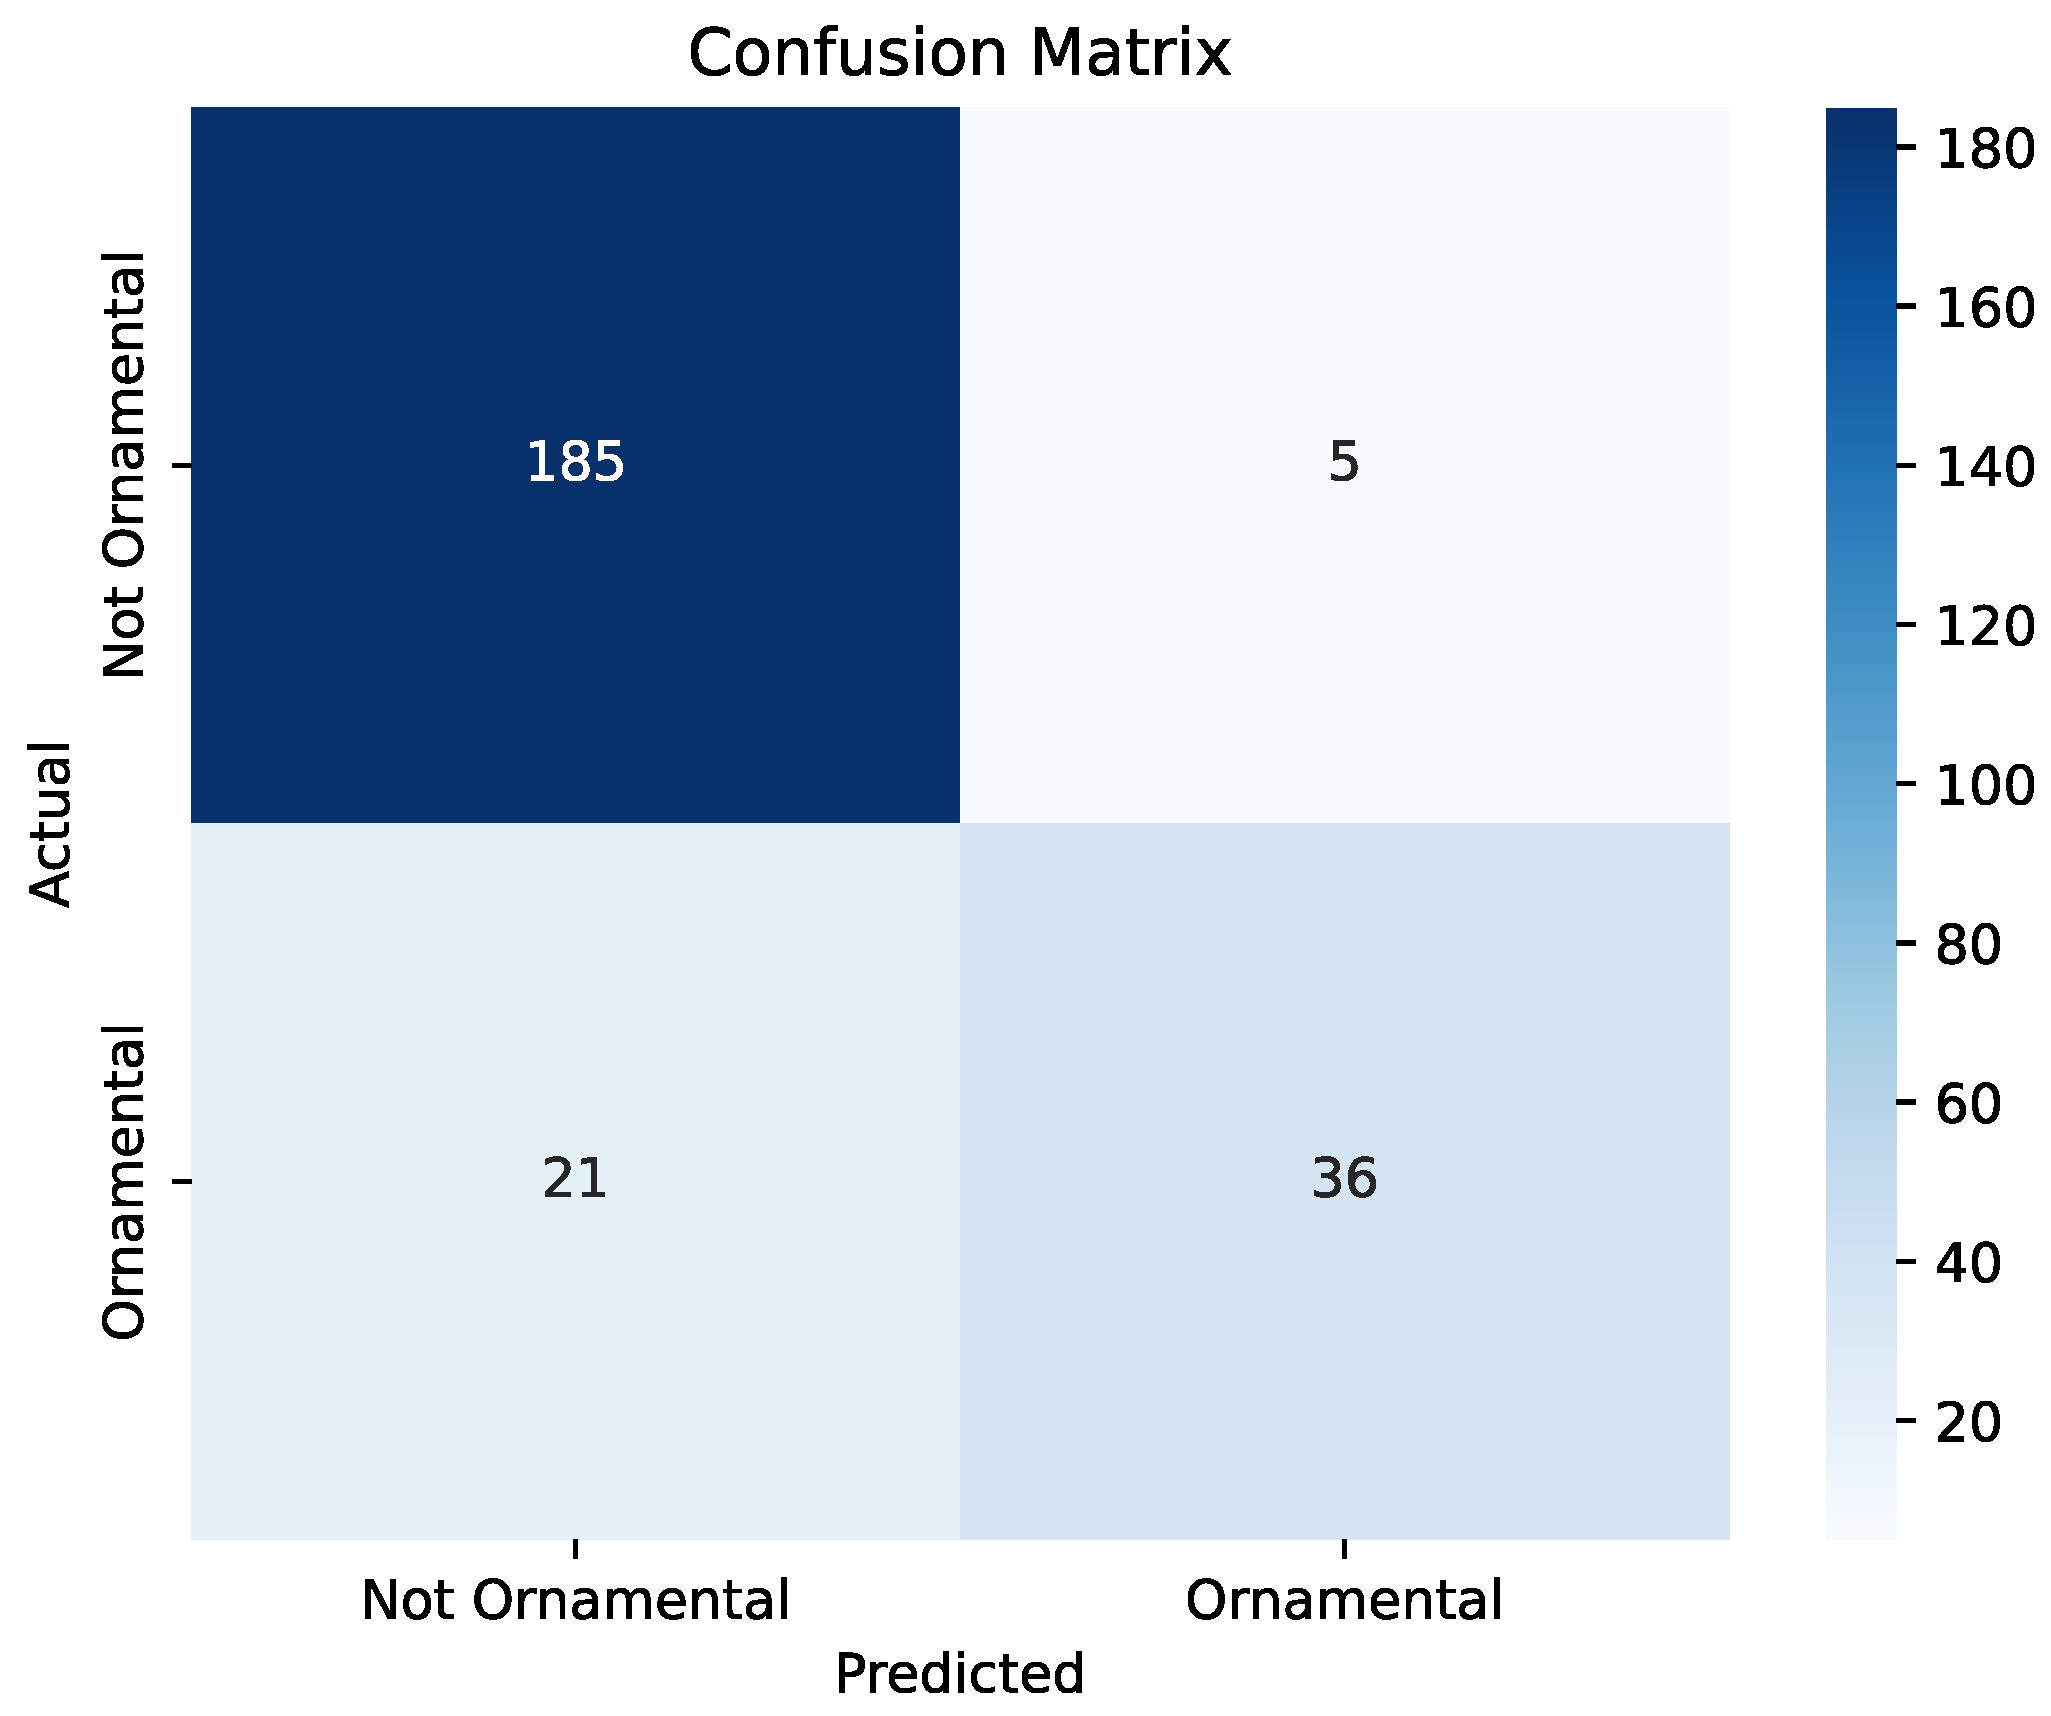
Interestingly, a comparison of Figure 5 and Figure 7 reveals significant differences in feature relevance for classification, depending on the criterion used. This divergence highlights how the choice of criterion prioritizes distinct morphological or aesthetic traits, underscoring the subjectivity or contextual dependence of ornamental plant evaluation. In pepper plants, growth habit and leaf density depend on the genotype used [51] and directly influence the photosynthetic rate, affecting plant vigor and size. In plants with erect architecture and dense foliage, self-shading can reduce light absorption, and this effect is also dependent on leaf orientation [52]. Thus, even if still small, it is possible to detect variations in leaf density and growth habit that will directly influence ornamental quality in more advanced stages of development. The ornamental plant market, including cooperatives such as Veiling Holambra, adopts technical standards for uniformity of size, resistance, health, post-harvest life, and packaging to facilitate logistics, comply with phytosanitary legislation, and maintain consistent commercial value. According to Silveira [53], standardization serves as a basis for evaluation. On the other hand, consumers of ornamental plants value aesthetic and symbolic aspects such as color, size, ease of maintenance, sustainability, and uniqueness. In pepper plants, aspects such as plant architecture, quantity, shape, color, and position of the fruits, as well as their durability in the vase, are valued [54]. Plant breeders can use the gap between market standards and consumer taste as a strategic opportunity to guide the selection process for the development of cultivars within an ornamental genetic improvement program. This explains the divergence between the classification observed when using the Holambra criterion and the opinion of experts.
In this study, data from the two growth conditions (controlled and uncontrolled) were aggregated for analysis, as our primary objective was to assess overall patterns rather than condition-dependent effects. However, future work could reveal biologically meaningful insights by analyzing each condition separately, given that plants dynamically perceive and adapt their development in response to environmental cues such as light, temperature, and humidity [55]. Furthermore, it is known that temperature is the main factor for plant growth and development, influencing characteristics such as root and shoot growth, seed yield, flowering and flower size, as well as sensitivity to pests [56,57,58]. Environmental temperature influences the speed at which plants process energy. Thus, changes in relative humidity and temperature have a direct impact on the process of stomatal opening and photosynthesis, justifying the influence on plant growth and development [59,60]. In the literature, some authors have reported differences in the prediction of morphological characteristics of plants grown under stress conditions. Wen et al. [61] investigated several factors that can influence the predictive modeling of plant growth, especially under stress conditions. The authors highlighted the use of temperature indices, environmental conditions during measurement, and the choice of appropriate statistical metrics to improve the accuracy and robustness of predictive models. In the study by Li et al. [62], the correlation between environmental parameters and the growth of tea seedling biomass in different varieties was analyzed. To model this growth, the authors used a neural network architecture combining CNN and LSTM (CNN-LSTM). The environmental variables used in the predictive model included air temperature, soil temperature, and soil moisture, resulting in a significant improvement in the accuracy of predictions. In the study by Nabaei et al. [63], a new framework integrating computer vision, machine learning, and environmental sensing was proposed for plant growth monitoring. The approach combined RGB images, plant phenotypic data, and environmental variables, such as temperature and humidity, with the aim of predicting water stress in controlled cultivation environments. The results indicated that the inclusion of environmental variables contributed significantly to increasing the predictive accuracy of the model. The inclusion of these variables in the ornamental classification models of pepper plants can be included in future lines of study.
The main drawback of this study is the relatively small dataset used, which may constrain the generalizability of the results, particularly for more complex or deeper model architectures. Future work should aim to expand the dataset across different growing conditions, developmental stages, and genotypic backgrounds.
Based on the results from this study, as well as the previous literature [26], it can be expected that a two-stage approach using forecasting of morphological parameters and later estimation based on the predicted values from the first stage can be feasible and even improve the results of this study. It is strongly suggested that future work should follow this line of research.
A future line of research could study the capability of improving the predictions by including several photos instead of only one, gathering into the prediction model information about possible asymmetries of the plant. An important next step involves benchmarking these architectures with larger datasets and greater model capacity. The potential benefits of developing environment-specific ViT models (for controlled vs. uncontrolled greenhouses) or treatment-specific variants warrant further investigation. This may require a larger dataset to make this task feasible. Finally, this study reveals a significant divergence between the Veiling Holambra criterion and expert assessments. The weak alignment between this commercial standard and image-based or expert-informed evaluations suggests a need to critically reassess its role in breeding and selection programs. It would be insightful to focus on the development of more market-aligned criteria that better capture consumer preferences and ornamental value.

5. Conclusions

The main conclusions of this study are as follows:
  • Higher resolution of the images does not improve the accuracy of the models, as demonstrated by the results conducted for estimation. Similar results are to be expected for prediction, but future studies should confirm this hypothesis.
  • Accurate anticipation of which plants will exhibit ornamental traits, losing less than 20% of accuracy with respect to assessment when plants are fully developed, can be performed up to seven weeks ahead of complete development of the plants. In addition, no loss was observed with regard to precision, i.e., the model exhibited a perfect capability to discard non-ornamental plants.
  • Estimation of ornamental potential from morphological measurements and RGB images provide similar accuracy, and even better when using images, and thus, costly assessment of each morphological trait can be substituted by taking a single photograph.
Future research might focus on studying the capability of improving the predictions by including several photos instead of only one. Research on the development of more market-aligned criteria that better reflect consumer preferences and actual ornamental value is encouraged as well.

Author Contributions

Conceptualization, P.A.B., A.M.M.d.N., R.R.-G., A.M.M. and V.M.-M.; methodology, P.A.B., R.R.-G., A.M.M.d.N. and V.M.-M.; software, R.R.-G., A.M.M.d.N. and V.M.-M.; validation, P.A.B., R.R.-G., V.M.-M. and C.C.; investigation, P.A.B., R.R.-G., A.M.M., F.S.d.S., A.M.M.d.N., E.R.d.R., S.P., C.P.S. and C.d.S.B.; resources, P.A.B.; data curation, P.A.B., R.R.-G., A.M.M.d.N., V.M.-M., E.R.d.R., S.P., C.P.S. and C.d.S.B.; writing—original draft preparation, A.M.M.d.N. and R.R.-G.; writing—review and editing, P.A.B., A.M.M., F.S.d.S., V.M.-M., C.C., E.R.d.R. and C.P.S.; visualization, R.R.-G., A.M.M.d.N. and V.M.-M.; supervision, R.R.-G., C.C. and V.M.-M.; project administration, P.A.B.; funding acquisition, P.A.B. All authors have read and agreed to the published version of the manuscript.

Funding

This research was funded by CNPq (Conselho Nacional de Desenvolvimento Científico e Tecnológico), grant number 408444/2021-5.

Institutional Review Board Statement

Not applicable.

Informed Consent Statement

Not applicable.

Data Availability Statement

The data presented in this study are openly available in Zenodo’s repository at https://doi.org/10.5281/zenodo.15172723 [29].

Acknowledgments

The authors would like to thank Guilherme Jose Bolzani de Campos Ferreira for his support in setting up the boxes to acquire the photos. The authors would also like to thank the Postgraduate Program in Agricultural Sciences at CPCE/UFPI for providing the controlled vegetation house used to conduct the experiments during plant growth.

Conflicts of Interest

The authors declare no conflicts of interest.

Abbreviations

The following abbreviations are used in this manuscript:
CDCanopy Diameter
CGControlled Greenhouse
CNNsConvolutional Neural Networks
CPCECampus Professora Cinobelina Elvas
CSVComma-Separated Values
F2Generation produced by crossing individuals from the F1 generation
FC ≥ 10Fruit Count per plant above or equal to ten
GHGrowth Habit
GPUGraphics Processing Unit
IPGRIInternational Plant Genetic Resources Institute
JPEGJoint Photographic Experts Group
LEDLight-Emitting Diode
LDLeaf Density
LSTMLong Short-Term Memory
OPOrnamental Potential
PHPlant Height
PH/CDPlant Height to Canopy Diameter ratio
RAMRandom-access memory
RBDRandomized Block Design
RGBRed Green Blue
UFPIUniversidade Federal do Piauí
UGUncontrolled Greenhouse
ViTVision Transformer
XGBoosteXtreme Gradient Boosting

Appendix A

This appendix contains all the confusion matrices from Section 3.3.
Figure A1. Confusion matrix obtained with the test dataset for the classification of ornamental pepper plants when using images from June 22 and a ViT-based model. Ornamental classification according to experts criterion.
Applsci 15 07801 g0a1
Figure A2. Confusion matrix obtained with the test dataset for the classification of ornamental pepper plants when using images from June 29 and a ViT-based model. Ornamental classification according to experts criterion.
Applsci 15 07801 g0a2
Figure A3. Confusion matrix obtained with the test dataset for the classification of ornamental pepper plants when using images from July 6 and a ViT-based model. Ornamental classification according to experts criterion.
Applsci 15 07801 g0a3
Figure A4. Confusion matrix obtained with the test dataset for the classification of ornamental pepper plants when using images from July 13 and a ViT-based model. Ornamental classification according to experts criterion.
Applsci 15 07801 g0a4
Figure A5. Confusion matrix obtained with the test dataset for the classification of ornamental pepper plants when using images from July 20 and a ViT-based model. Ornamental classification according to experts criterion.
Applsci 15 07801 g0a5
Figure A6. Confusion matrix obtained with the test dataset for the classification of ornamental pepper plants when using images from July 27 and a ViT-based model. Ornamental classification according to experts criterion.
Applsci 15 07801 g0a6
Figure A7. Confusion matrix obtained with the test dataset for the classification of ornamental pepper plants when using images from August 3 and a ViT-based model. Ornamental classification according to experts criterion.
Applsci 15 07801 g0a7
Figure A8. Confusion matrix obtained with the test dataset for the classification of ornamental pepper plants when using images from August 10 and a ViT-based model. Ornamental classification according to experts criterion.
Applsci 15 07801 g0a8

References

  1. Francini, A.; Romano, D.; Toscano, S.; Ferrante, A. The Contribution of Ornamental Plants to Urban Ecosystem Services. Earth 2022, 3, 1258–1274. [Google Scholar] [CrossRef]
  2. Rudnyk-Ivashchenko, O.; Victor, S.; Mykhalska, L. Development of ornamental horticulture for residential areas. J. Nativ. Alien Plant Stud. 2021, 17, 198–205. [Google Scholar] [CrossRef]
  3. Bosland, P.W.; Votava, E.J. Peppers: Vegetable and Spice Capsicums, 2nd ed.; CABI Publishing: Wallingford, UK, 2012; pp. 1–230. [Google Scholar] [CrossRef]
  4. Zhang, X.; Zhang, Z.; Gu, X.; Mao, S.; Li, X.; Chadœuf, J.; Palloix, A.; Wang, L.; Zhang, B. Genetic diversity of pepper (Capsicum spp.) germplasm resources in China reflects selection for cultivar types and spatial distribution. J. Integr. Agric. 2016, 15, 1991–2001. [Google Scholar] [CrossRef]
  5. Stommel, J.R.; Bosland, P.W. Ornamental pepper: Capsicum annuum. In Flower Breeding and Genetics: Issues, Challenges and Opportunities for the 21st Century; Anderson, N.O., Ed.; Springer: Berlin/Heidelberg, Germany, 2007; pp. 561–599. [Google Scholar] [CrossRef]
  6. Fortunato, F.L.G.; do Rêgo, E.R.; de Carvalho, M.G.; dos Santos, C.A.P.; do Rêgo, M.M. Genetic diversity in ornamental pepper plants. Comun. Sci. 2019, 10, 364–375. [Google Scholar] [CrossRef]
  7. Global Flower and Ornamental Plant Market Report 2024. 2024. Available online: https://www.thebusinessresearchcompany.com/report/flower-and-ornamental-plant-global-market-report (accessed on 11 June 2025).
  8. Salachna, P. Trends in Ornamental Plant Production. Horticulturae 2022, 8, 413. [Google Scholar] [CrossRef]
  9. Ornamental Horticulture Market Size, Share|CAGR of 6.4. Available online: https://market.us/report/ornamental-horticulture-market/ (accessed on 11 June 2025).
  10. Danilevicz, M.F.; Gill, M.; Anderson, R.; Batley, J.; Bennamoun, M.; Bayer, P.E.; Edwards, D. Plant Genotype to Phenotype Prediction Using Machine Learning. Front. Genet. 2022, 13, 822173. [Google Scholar] [CrossRef]
  11. Czedik-Eysenberg, A.; Seitner, S.; Güldener, U.; Koemeda, S.; Jez, J.; Colombini, M.; Djamei, A. The ‘PhenoBox’, a flexible, automated, open-source plant phenotyping solution. New Phytol. 2018, 219, 808–823. [Google Scholar] [CrossRef]
  12. Custódio, G.C.A.; Pimenta, S.; de Souza Gomes, F.; Silva, N.S.; Rodrigues, B.R.A.; Oliveira, F.C.; de Abreu Delvaux Júnior, N.; Pereira, M.C.T. Selection of ideal genotypes in peppers with ornamental potential. Folia Hortic. 2023, 35, 467–478. [Google Scholar] [CrossRef]
  13. Stommel, J.R.; Griesbach, R.J. Inheritance of Fruit, Foliar, and Plant Habit Attributes in Capsicum. J. Am. Soc. Hort. Sci. 2008, 133, 396–407. [Google Scholar] [CrossRef]
  14. Fiorani, F.; Schurr, U. Future scenarios for plant phenotyping. Annu. Rev. Plant Biol. 2013, 64, 267–291. [Google Scholar] [CrossRef]
  15. Maraveas, C. Image Analysis Artificial Intelligence Technologies for Plant Phenotyping: Current State of the Art. AgriEngineering 2024, 6, 3375–3407. [Google Scholar] [CrossRef]
  16. Lee, U.; Chang, S.; Putra, G.A.; Kim, H.; Kim, D.H. An automated, high-throughput plant phenotyping system using machine learning-based plant segmentation and image analysis. PLoS ONE 2018, 13, e0196615. [Google Scholar] [CrossRef] [PubMed]
  17. Jiménez-Lao, R.; Garcia-Caparros, P.; Pérez-Saiz, M.; Llanderal, A.; Lao, M.T. Monitoring Optical Tool to Determine the Chlorophyll Concentration in Ornamental Plants. Agronomy 2021, 11, 2197. [Google Scholar] [CrossRef]
  18. Chaudhary, P.; Godara, S.; Cheeran, A.N.; Chaudhari, A.K. Fast and Accurate Method for Leaf Area Measurement. Int. J. Comput. Appl. 2012, 49, 22–25. [Google Scholar] [CrossRef]
  19. Long, S.P.; Bernacchi, C.J. Gas exchange measurements, what can they tell us about the underlying limitations to photosynthesis? Procedures and sources of error. J. Exp. Bot. 2003, 54, 2393–2401. [Google Scholar] [CrossRef]
  20. Li, Z.; Guo, R.; Li, M.; Chen, Y.; Li, G. A review of computer vision technologies for plant phenotyping. Comput. Electron. Agric. 2020, 176, 105672. [Google Scholar] [CrossRef]
  21. Santos, M.; Melo, R.; Sousa, V.; Medeiros, A.; Pessoa, A.; Silva, S.; do Nascimento, A.; Barroso, P. A Computer Vision-Based Methodology to Estimate Fruit Colour Diversity in Ornamental Pepper (Capsicum spp.). Plant Breed. 2024. [Google Scholar] [CrossRef]
  22. Afonso, M.; Paulo, M.J.; Fonteijn, H.; van den Helder, M.; Zwinkels, H.; Rijsbergen, M.; van Hameren, G.; Haegens, R.; Wehrens, R. Automatic trait estimation in floriculture using computer vision and deep learning. Smart Agric. Technol. 2024, 7, 100383. [Google Scholar] [CrossRef]
  23. Wang, N.; Liu, H.; Li, Y.; Zhou, W.; Ding, M. Segmentation and Phenotype Calculation of Rapeseed Pods Based on YOLO v8 and Mask R-Convolution Neural Networks. Plants 2023, 12, 3328. [Google Scholar] [CrossRef]
  24. Yang, B.; Xu, Y. Applications of deep-learning approaches in horticultural research: A review. Hortic. Res. 2021, 8, 123. [Google Scholar] [CrossRef]
  25. Bayraktar, E.; Basarkan, M.E.; Celebi, N. A low-cost UAV framework towards ornamental plant detection and counting in the wild. ISPRS J. Photogramm. Remote Sens. 2020, 167, 1–11. [Google Scholar] [CrossRef]
  26. Ruiz-Gonzalez, R.; do Nascimento, A.M.M.; Santos, M.B.d.C.; Porto, R.K.S.d.B.; Medeiros, A.M.; dos Santos, F.S.; Martínez-Martínez, V.; Barroso, P.A. Temporal forecasting of plant height and canopy diameter from RGB images using a CNN-based regression model for ornamental pepper plants (Capsicum spp.) growing under high-temperature stress. Neural Comput. Appl. 2024, 2024, 1–22. [Google Scholar] [CrossRef]
  27. International Plant Genetic Resources Institute (IPGRI). Descriptors for Capsicum (Capsicum spp.); International Plant Genetic Resources Institute (IPGRI): Rome, Italy, 1995. [Google Scholar]
  28. Veiling Holambra. Critérios de Classificação Pimenta Ornamental; Veiling Holambra: Santo Antônio de Posse, SP, Brazil, 2018. [Google Scholar]
  29. Barroso, P.A.; Marques do Nascimento, A.M.; Ruiz-Gonzalez, R.; da Costa Santos, M.B.; Soares de Brito Porto, R.K.; Mendes Medeiros, A.; dos Santos, F.S.; Martínez-Martínez, V.; Elizanilda Ramalho, d.R.; Samy, P.; et al. Ornamental Potential, Morphological Measurements and Weekly Sequence of Photographs from Several Subspecies of Pepper Plants (Capsicum spp.). 2025. Available online: https://zenodo.org/records/15172723 (accessed on 11 June 2025).
  30. Buitinck, L.; Louppe, G.; Blondel, M.; Pedregosa, F.; Mueller, A.; Grisel, O.; Niculae, V.; Prettenhofer, P.; Gramfort, A.; Grobler, J.; et al. API design for machine learning software: Experiences from the scikit-learn project. In Proceedings of the ECML PKDD Workshop: Languages for Data Mining and Machine Learning, Prague, Czech Republic, 23–27 September 2013; pp. 108–122. [Google Scholar]
  31. Python Software Foundation. PythonTM|Python.org. Available online: https://www.python.org/ (accessed on 16 December 2024).
  32. Paszke, A.; Gross, S.; Massa, F.; Lerer, A.; Bradbury, J.; Chanan, G.; Killeen, T.; Lin, Z.; Gimelshein, N.; Antiga, L.; et al. PyTorch: An Imperative Style, High-Performance Deep Learning Library. In Advances in Neural Information Processing Systems 32; Curran Associates, Inc.: Red Hook, NY, USA, 2019; pp. 8024–8035. [Google Scholar]
  33. Google LLC. Google Colab. Available online: https://colab.research.google.com/?hl=en (accessed on 16 December 2024).
  34. Dosovitskiy, A.; Beyer, L.; Kolesnikov, A.; Weissenborn, D.; Zhai, X.; Unterthiner, T.; Dehghani, M.; Minderer, M.; Heigold, G.; Gelly, S.; et al. An Image is Worth 16 × 16 Words: Transformers for Image Recognition at Scale. arXiv 2021, arXiv:cs.CV/2010.11929. [Google Scholar]
  35. Phil Wang (lucidrains). Vision Transformer (ViT)—PyTorch Implementation—GitHub repository. 2020. Available online: https://github.com/lucidrains/vit-pytorch (accessed on 11 June 2025).
  36. Wang, S.; Li, B.Z.; Khabsa, M.; Fang, H.; Ma, H. Linformer: Self-Attention with Linear Complexity. arXiv 2020, arXiv:cs.LG/2006.04768. [Google Scholar]
  37. Grandini, M.; Bagli, E.; Visani, G. Metrics for Multi-Class Classification: An Overview. arXiv 2020, arXiv:stat.ML/2008.05756. [Google Scholar]
  38. Opara, I.K.; Opara, U.L.; Okolie, J.A.; Fawole, O.A. Machine Learning Application in Horticulture and Prospects for Predicting Fresh Produce Losses and Waste: A Review. Plants 2024, 13, 1200. [Google Scholar] [CrossRef]
  39. Basak, J.K.; Qasim, W.; Okyere, F.G.; Khan, F.; Lee, Y.J.; Park, J.; Kim, H.T. Regression Analysis to Estimate Morphology Parameters of Pepper Plant in a Controlled Greenhouse System. J. Biosyst. Eng. 2019, 44, 57–68. [Google Scholar] [CrossRef]
  40. Liu, Z.; Zhang, K.; Wang, C.; Huang, S. Research on the identification method for the forest fire based on deep learning. Optik 2020, 223, 165491. [Google Scholar] [CrossRef]
  41. Seguí-Simarro, J.M. Androgenesis Revisited. Bot. Rev. 2010, 76, 377–404. [Google Scholar] [CrossRef]
  42. Barroso, P.A.; Rêgo, M.M.d.; Crispim, J.G.; Costa, M.d.P.S.D.; Rêgo, E.R.d. How to shorten a plant breeding program? A case study with ornamental peppers. Crop. Breed. Appl. Biotechnol. 2019, 19, 123–131. [Google Scholar] [CrossRef]
  43. Rêgo, E.R.d.; Fortunato, F.L.G.; Carvalho, M.G.d.; Santos, C.A.P.d.; Lima, J.A.M.d.; Rêgo, M.M.d. Genetic control of plant size-related traits and fruit in ornamental pepper (Capsicum annuum L.). Comun. Sci. 2022, 13, e3643. [Google Scholar] [CrossRef]
  44. Custódio, G.C.A.; Pimenta, S.; Delvaux Júnior, N.d.A.; Pimenta, A.M.L.; Gomes, W.S.; Monteiro, H.C.d.F.; Gomes, F.d.S.; Bento, C.d.S. Genetic variability and interaction between variables of ornamental interest in a segregating pepper population. Contrib. Cienc. Soc. 2024, 17, 6056–6070. [Google Scholar] [CrossRef]
  45. Chan, K.H.; Moerkens, R.; Brenard, N.; Huysmans, M.; Leirs, H.; Sluydts, V. Data-driven approach to weekly forecast of the western flower thrips (Frankliniella occidentalis Pergande) population in a pepper greenhouse with an ensemble model. Pest Manag. Sci. 2025, 81, 3378–3390. [Google Scholar] [CrossRef] [PubMed]
  46. Anjani, I.A.; Pratiwi, Y.R.; Norfa Bagas Nurhuda, S. Implementation of Deep Learning Using Convolutional Neural Network Algorithm for Classification Rose Flower. J. Phys. Conf. Ser. 2021, 1842, 012002. [Google Scholar] [CrossRef]
  47. Agushinta Rahayu, D.; Hustinawaty; Jatnika, I.; Lolita, B. A Method of CNN Deep Learning for Indonesia Ornamental Plant Classification. In Electrical and Computer Engineering; Seyman, M.N., Ed.; Springer: Cham, Switzerland, 2022; pp. 148–156. [Google Scholar]
  48. Sarachai, W.; Bootkrajang, J.; Chaijaruwanich, J.; Somhom, S. Orchid classification using homogeneous ensemble of small deep convolutional neural network. Mach. Vis. Appl. 2022, 33, 17. [Google Scholar] [CrossRef]
  49. Praskatama, V.; Shidik, G.F.; Ningrum, A.P. Comparative Study: Flower Classification using Deep Learning, SMOTE and Fine-Tuning. J. Appl. Inform. Comput. 2024, 8, 557–568. [Google Scholar] [CrossRef]
  50. ali Biswas, M.S.; Ahmad, M.H.; Bormon, S.; Rimon; Sohag, S.R.; Akhi, A.B. Money plant disease atlas: A comprehensive dataset for disease classification in ornamental horticulture. Data Brief 2025, 58, 111216. [Google Scholar] [CrossRef]
  51. Costa, M.d.P.S.D.; Rêgo, E.R.d.; Barroso, P.A.; Silva, A.R.d.; Rêgo, M.M.d. Selection in segregating populations of ornamental pepper plants (Capsicum annuum L.) using multidimensional scaling. Rev. Ceres 2020, 67, 474–481. [Google Scholar] [CrossRef]
  52. Goo, H.; Roh, Y.; Lee, J.; Park, K.S. Analysis of Bell Pepper (Capsicum annuum L.) Leaf Spectral Properties and Photosynthesis According to Growth Period. Horticulturae 2024, 10, 646. [Google Scholar] [CrossRef]
  53. de, A. Silveira, R.B. Tentativas de padronização de crisântemos de corte para o Estado de São Paulo. Ornam. Hortic. 1997, 3, 1–5. [Google Scholar] [CrossRef]
  54. Neitzke, R.S.; Fischer, S.Z.; Vasconcelos, C.S.; Barbieri, R.L.; Treptow, R.O. Pimentas ornamentais: Aceitação e preferências do público consumidor. Hortic. Bras. 2016, 34, 102–109. [Google Scholar] [CrossRef]
  55. Li, X.; Liang, T.; Liu, H. How plants coordinate their development in response to light and temperature signals. Plant Cell 2021, 34, 955–966. [Google Scholar] [CrossRef]
  56. Quint, M.; Delker, C.; Franklin, K.A.; Wigge, P.A.; Halliday, K.J.; van Zanten, M. Molecular and genetic control of plant thermomorphogenesis. Nature Plants 2016, 2, 15190. [Google Scholar] [CrossRef] [PubMed]
  57. Ferrante, A.; Mariani, L. Agronomic Management for Enhancing Plant Tolerance to Abiotic Stresses: High and Low Values of Temperature, Light Intensity, and Relative Humidity. Horticulturae 2018, 4, 21. [Google Scholar] [CrossRef]
  58. Wiszniewski, A.; Uberegui, E.; Messer, M.; Sultanova, G.; Borghi, M.; Duarte, G.T.; Vicente, R.; Sageman-Furnas, K.; Fernie, A.R.; Nikoloski, Z.; et al. Temperature-mediated flower size plasticity in Arabidopsis. iScience 2022, 25, 105411. [Google Scholar] [CrossRef]
  59. Driesen, E.; Van den Ende, W.; De Proft, M.; Saeys, W. Influence of Environmental Factors Light, CO2, Temperature, and Relative Humidity on Stomatal Opening and Development: A Review. Agronomy 2020, 10, 1975. [Google Scholar] [CrossRef]
  60. Chia, S.Y.; Lim, M.W. A critical review on the influence of humidity for plant growth forecasting. IOP Conf. Ser. Mater. Sci. Eng. 2022, 1257, 012001. [Google Scholar] [CrossRef]
  61. Wen, T.; Li, J.H.; Wang, Q.; Gao, Y.Y.; Hao, G.F.; Song, B.A. Thermal imaging: The digital eye facilitates high-throughput phenotyping traits of plant growth and stress responses. Sci. Total. Environ. 2023, 899, 165626. [Google Scholar] [CrossRef]
  62. Li, H.; Mao, Y.; Wang, Y.; Fan, K.; Shi, H.; Sun, L.; Shen, J.; Shen, Y.; Xu, Y.; Ding, Z. Environmental Simulation Model for Rapid Prediction of Tea Seedling Growth. Agronomy 2022, 12, 3165. [Google Scholar] [CrossRef]
  63. Nabaei, S.H.; Zheng, Z.; Chen, D.; Heydarian, A. Multimodal Data Integration for Sustainable Indoor Gardening: Tracking Anyplant with Time Series Foundation Model. arXiv 2025, arXiv:cs.CV/2503.21932. [Google Scholar]
Figure 1. Schematic diagram summarizing the proposed methodology for estimating and predicting the ornamental potential of pepper plants from RGB images and morphological measurements in tabular data.
Applsci 15 07801 g001
Figure 2. Experimental conditions for pepper plant growth: (a) seeds from the active germplasm bank preserved in plastic bags, (b) pepper seedlings cultivated in 200-cell polyethylene trays, (c) transplanting process showing a seedling with substrate into a #15 pot, (d) mature plants in a climate-controlled greenhouse, and (e) mature plants in a non-controlled greenhouse environment. Reproduced from [26] (CC BY 4.0).
Applsci 15 07801 g002
Figure 3. The organized image collection adopted a multi-level directory system. Level 1: Photography session (Week #). Level 2: Growth conditions (CG: controlled greenhouse; UG: uncontrolled). Level 3: Experimental replicates (Block #). Level 4: Treatment identifiers (T#). Within each treatment directory, nineteen rotational images (I#.JPG) documented each plant at 20° intervals, including both 0° and 360° views to ensure full circumferential coverage. Reproduced from [26] (CC BY 4.0).
Applsci 15 07801 g003
Figure 4. Confusion matrix obtained with the test dataset for the classification of ornamental pepper plants when using tabular data with morphological measurements and an XGBoost model when classifying based on the median of experts.
Applsci 15 07801 g004
Figure 5. Feature importance scores (gain) obtained with the train dataset for the classification of ornamental pepper plants when using tabular data with morphological measurements and an XGBoost model when classifying based on the median of experts. Acronyms: plant height (PH), canopy diameter (CD), plant height to canopy diameter ratio (PH/CD), growth habit (GH), leaf density (LD), largest diameter (D), and smallest diameter (d).
Applsci 15 07801 g005
Figure 6. Confusion matrix obtained with the test dataset for the classification of ornamental pepper plants when using tabular data with morphological measurements and an XGBoost model when classifying based on the Veiling Holambra criterion.
Applsci 15 07801 g006
Figure 7. Feature importance scores (gain) obtained with the train dataset for the classification of ornamental pepper plants when using tabular data with morphological measurements and an XGBoost model when classifying based on the Veiling Holambra criterion. Acronyms: plant height (PH), canopy diameter (CD), plant height to canopy diameter ratio (PH/CD), growth habit (GH), leaf density (LD), largest diameter (D), and smallest diameter (d).
Applsci 15 07801 g007
Figure 8. Confusion matrix obtained with the test dataset for the classification of ornamental pepper plants when using images and a ViT-based model. Ornamental classification according to experts criterion.
Applsci 15 07801 g008
Figure 9. Confusion matrix obtained with the test dataset for the classification of ornamental pepper plants when using images and a ViT-based model. Ornamental classification according to Veiling Holambra criterion.
Applsci 15 07801 g009
Figure 10. Confusion matrix obtained with the test dataset for the classification of ornamental pepper plants when using 600 × 400 px images and a ViT-based model. Ornamental classification according to experts criterion.
Applsci 15 07801 g010
Figure 11. Confusion matrix obtained with the test dataset for the classification of ornamental pepper plants when using 600 × 400 px images and a ViT-based model. Ornamental classification according to Veiling Holambra criterion.
Applsci 15 07801 g011
Table 1. Identification of the pepper accessions employed in the experiments coming from the Federal University of Piauí/Campus Professora Cinobelina Elvas (UFPI/CPCE) Active Germplasm Bank.
Treatment NumberGermplasm CodeCommon NameScientific Name
1CPCE 008Maya black bloodCapsicum annuum
2CPCE 012MasqueradeCapsicum frutescens
3CPCE 003FloribellaCapsicum sp.
4CPCE 013Bolivian rainbowCapsicum annuum
5CPCE 005CalypsoCapsicum annuum
6CPCE 006Pyramid ornamentalCapsicum annuum
7CPCE 007Black pyramidCapsicum frutescens
8CPCE 009Black cubanCapsicum annuum
9CPCE 010Black pearlCapsicum annuum
10CPCE 011Purple tiger variegatedCapsicum annuum
11CPCE 014JellyfishCapsicum annuum
12CPCE 017Bird’s eye baby ornamentalCapsicum annuum
13CPCE 018Not identifiedCapsicum sp.
14CPCE 019Not identifiedCapsicum sp.
15CPCE 020Not identifiedCapsicum sp.
Table 2. Layout of the CSV file used for recording the morphological measurements as well as the ornamental classification of pepper plants (Capsicum spp.). Plant height (PH), canopy diameter (CD), plant height to canopy diameter ratio (PH/CD), growth habit (GH), leaf density (LD), fruit count per plant above or equal to ten (FC ≥ 10), and ornamental potential (OP). There are two different OP values: OP VH stands for the value coming from using the Veiling Holambra Cooperative criterion and OP EXP stands for the value coming from using the experts criterion.
FolderPHCDPH/CDGHLDFC ≥ 10 OP VH OP EXP
CG/B1/T123.523.850.99ErectDenseYesYesYes
UG/B4/T1533.731.051.09IntermediateDenseYesNoYes
Table 3. Summary of the main XGBoost hyperparameters employed in this paper for ornamental quality estimation for pepper plants based on morphological measurements.
ParameterValue
objectivebinary:logistic
eval_metriclogloss
max_depth3
eta0.1
enable_categoricalTrue
num_boost_round100
Table 4. Vision Transformer (ViT) configuration for 300 × 200 px images.
ParameterValue
Input resolution300 × 200 px
Patch size20 × 20 px
Patch grid15 × 10 (150 total)
Embedding dimension (dim)128
Sequence length (seq_len)151 (150 + class token)
Transformer layers (depth)12
Attention heads (heads)8
Linformer projection dim (k)64
Input channels3 (RGB)
Output classes2 (binary)
Table 5. Vision Transformer (ViT) configuration for 600 × 400 px images.
ParameterValue
Input resolution600 × 400 px
Patch size20 × 20 px
Patch grid30 × 20 (600 total)
Embedding dimension (dim)128
Sequence length (seq_len)601 (600 + class token)
Transformer layers (depth)12
Attention heads (heads)8
Linformer projection dim (k)64
Input channels3 (RGB)
Output classes2 (binary)
Table 6. ViT-based model performance metrics across dates when assessing the capability for ornamental potential forecasting. All metrics provided in this table have been calculated from Figure A1, Figure A2, Figure A3, Figure A4, Figure A5, Figure A6, Figure A7 and Figure A8, shown in Appendix A.
DateAccuracyPrecisionRecallF1-Score
June 2285.02%100%78.36%87.87%
June 2980.57%100%71.93%83.67%
July 691.90%100%88.30%93.79%
July 1386.64%100%80.70%89.32%
July 2091.90%100%88.30%93.79%
July 2786.64%100%80.70%89.32%
August 388.26%100%83.04%90.73%
August 1099.20%100%98.83%99.41%
Disclaimer/Publisher’s Note: The statements, opinions and data contained in all publications are solely those of the individual author(s) and contributor(s) and not of MDPI and/or the editor(s). MDPI and/or the editor(s) disclaim responsibility for any injury to people or property resulting from any ideas, methods, instructions or products referred to in the content.

