1. Introduction
Sugarcane is a cash crop widely grown in subtropical and tropical regions and has an important place in the global economy and culture. Its stalks are rich in sugar, which is an important raw material for sugar production and the production of biofuels and bioenergy [
1,
2]. However, the current planting and management of sugarcane is still highly dependent on manual operations. The high degree of labor intensity and low level of mechanization have become the main bottlenecks restricting the modernization of its industry. Enhancing the automatic operation capability in the process of sugarcane planting and management has become a key issue that needs to be solved urgently [
3]. In recent years, UAVs with high flexibility, efficiency, and wide-area data collection capabilities have provided strong data support for the automated operations of agricultural machinery through remote sensing imagery [
4]. Meanwhile, object detection technology can automatically extract features of images and perform target classification and localization [
5]. The use of object detection technology for high-resolution imagery from drones can effectively improve the automated operation capability of sugarcane planting and management and promote modernization to the industry.
Currently, the crop row detection method based on object detection can directly achieve crop row fitting through the center of the object bounding box, showing significant advantages in practical applications. Accurate detection of crop position is the key to extracting crop rows. Therefore, object detection techniques play a crucial role in enabling precise and efficient crop row extraction. Liu et al. [
6] integrated a triplet attention mechanism and a focal loss function into YOLOv4, achieving high-precision tomato pest detection with an accuracy of 95.2%. To mitigate the impact of weeds and lighting variations on crop position extraction, Diao et al. [
7] focused on maize crop row identification across different fertility stages by introducing a novel spatial pyramid structure into the YOLOv8s framework. In a follow-up study [
8], they further improved detection accuracy by employing a Swin Transformer as the model’s backbone. Nan et al. [
9] proposed WGB-YOLO for multi-class dragon fruit detection in dense orchard rows, featuring a WFE-C4 backbone, GF-SPP, and BiFPN, providing a robust foundation for robotic fruit harvesting. To cope with severe occlusion and small object detection challenges in pineapple crop, Liu et al. [
10] integrated a small object detection module into the neck of YOLOv5 and improved training stability and speed by combining the EIOU loss function. Ju et al. [
11] proposed MW-YOLOv5s by replacing the YOLOv5s backbone with MobileViTv3 and incorporating the WIOU loss function, thereby enhancing both the recognition speed and accuracy in rice seedling detection. Furthermore, Bao et al. [
12] developed an apple disease detection approach based on YOLOv11, integrating PMFEM, EHFPN, and LKAP modules to achieve efficient and accurate detection. Lin et al. [
13] enhanced the feature extraction capability of YOLOv8 by introducing the C2f module and an anchor-free mechanism, and proposed a multitask architecture for accurate weed detection and effective extraction of navigation line regions.
After the completion of object detection, post-processing is required to enable accurate crop row fitting. The Hough transform is one of the most commonly used methods for crop row fitting in the early stages [
14]. Zhang et al. [
15] determined the feature point set by combining position clustering and the shortest path method, and then fitted the crop rows using linear regression based on the least squares method. To mitigate the interference from missing seedlings and wheel ruts during navigation line extraction in the cotton seedling stage, Liang et al. [
16] extracted crop row contours and used the least squares method to fit the navigation line. Zhou et al. [
17] used adaptive clustering and segmented point clustering, combined with lateral distance and point-to-line distance methods, to optimize the feature points, and fitted the crop row centerline using linear regression based on the Huber loss function. Addressing the extraction of vegetable seedling rows in the field, Zhang et al. [
18] used the Random Sample Consensus (RANSAC) algorithm and the least squares method. Among these methods, clustering and least squares are effective techniques for row line fitting, providing important references for improving the accuracy and robustness of crop row extraction and fitting.
Notably, research on sugarcane row detection is still in its infancy. Compared to conventional row crops such as rice and corn, sugarcane exhibits greater variability in row and plant spacing during cultivation and often displays an irregular distribution pattern, which poses significant challenges for accurate row detection. Furthermore, sugarcane leaves and stalks frequently cross and overlap extensively during growth, creating a complex occlusion structure [
19] that further complicates image feature extraction. In some studies that improve upon YOLO-based algorithms, enhancements in detection accuracy often come at the cost of increased computational overhead, thereby raising the hardware requirements for agricultural equipment. To address this challenge, this paper proposes SugarRow-YOLO, a sugarcane detection model based on YOLOv11n, which effectively improves detection performance without significantly increasing the number of parameters or computational complexity. This optimization not only aligns with the deployment needs of modern agricultural equipment but also enhances the accuracy of target detection.
Compared with YOLOv11n, SugarRow-YOLO mainly makes the following improvements: 1. WTConv is used to replace the deep convolutional layers in the YOLOv11n backbone network, which not only expands the model’s receptive field but also reduces over-parameterization. 2. The original multi-head attention in the C2PSA module was replaced with the Inverted Residual Mobile Block (iRMB) inverted residual block attention mechanism to improve the model’s ability to capture the crop’s location, geometry, and spatial relationships. 3. By using the UIOU loss function, the model effectively addresses the issues of missed detections and false positives commonly encountered with dense and overlapping objects. With the above enhancements, SugarRow-YOLO is capable of accurately locating sugarcane plants. Subsequently, the spatial distribution of the detected sugarcane is processed using the DBSCAN clustering algorithm and spline curve fitting to achieve precise identification of sugarcane rows.
2. Materials and Methods
2.1. Image Acquisition and Preprocessing
The image data used in the experiment were collected from the Guangxi Subtropical Agricultural Science New City Experimental Base, located in Liku Town, Fusui County, Chongzuo City, Guangxi Zhuang Autonomous Region. The sugarcane crop was sown in late March 2024 and was scheduled for harvest in mid December 2024. Data acquisition was performed using a DJI Matrice 300 RTK UAV (DJI, Shenzhen, China) at a flight altitude of 30 m, with a forward overlap of 70% and a side overlap of 80%. The survey was conducted in June 2024, coinciding with the early elongation stage of sugarcane growth, which is a critical period for in-field weed management and the removal of redundant tillers. A total of 1540 original images were captured at a resolution of 8192 × 5460 pixels, and all images were stored in jpg format. The diversity of the dataset enhances the model’s adaptability to complex environments. Due to the high resolution of the original images, direct visualization is not conducive to detailed observation. To more intuitively present the variability among samples, representative regions were cropped from the original images for illustration, as shown in
Figure 1.
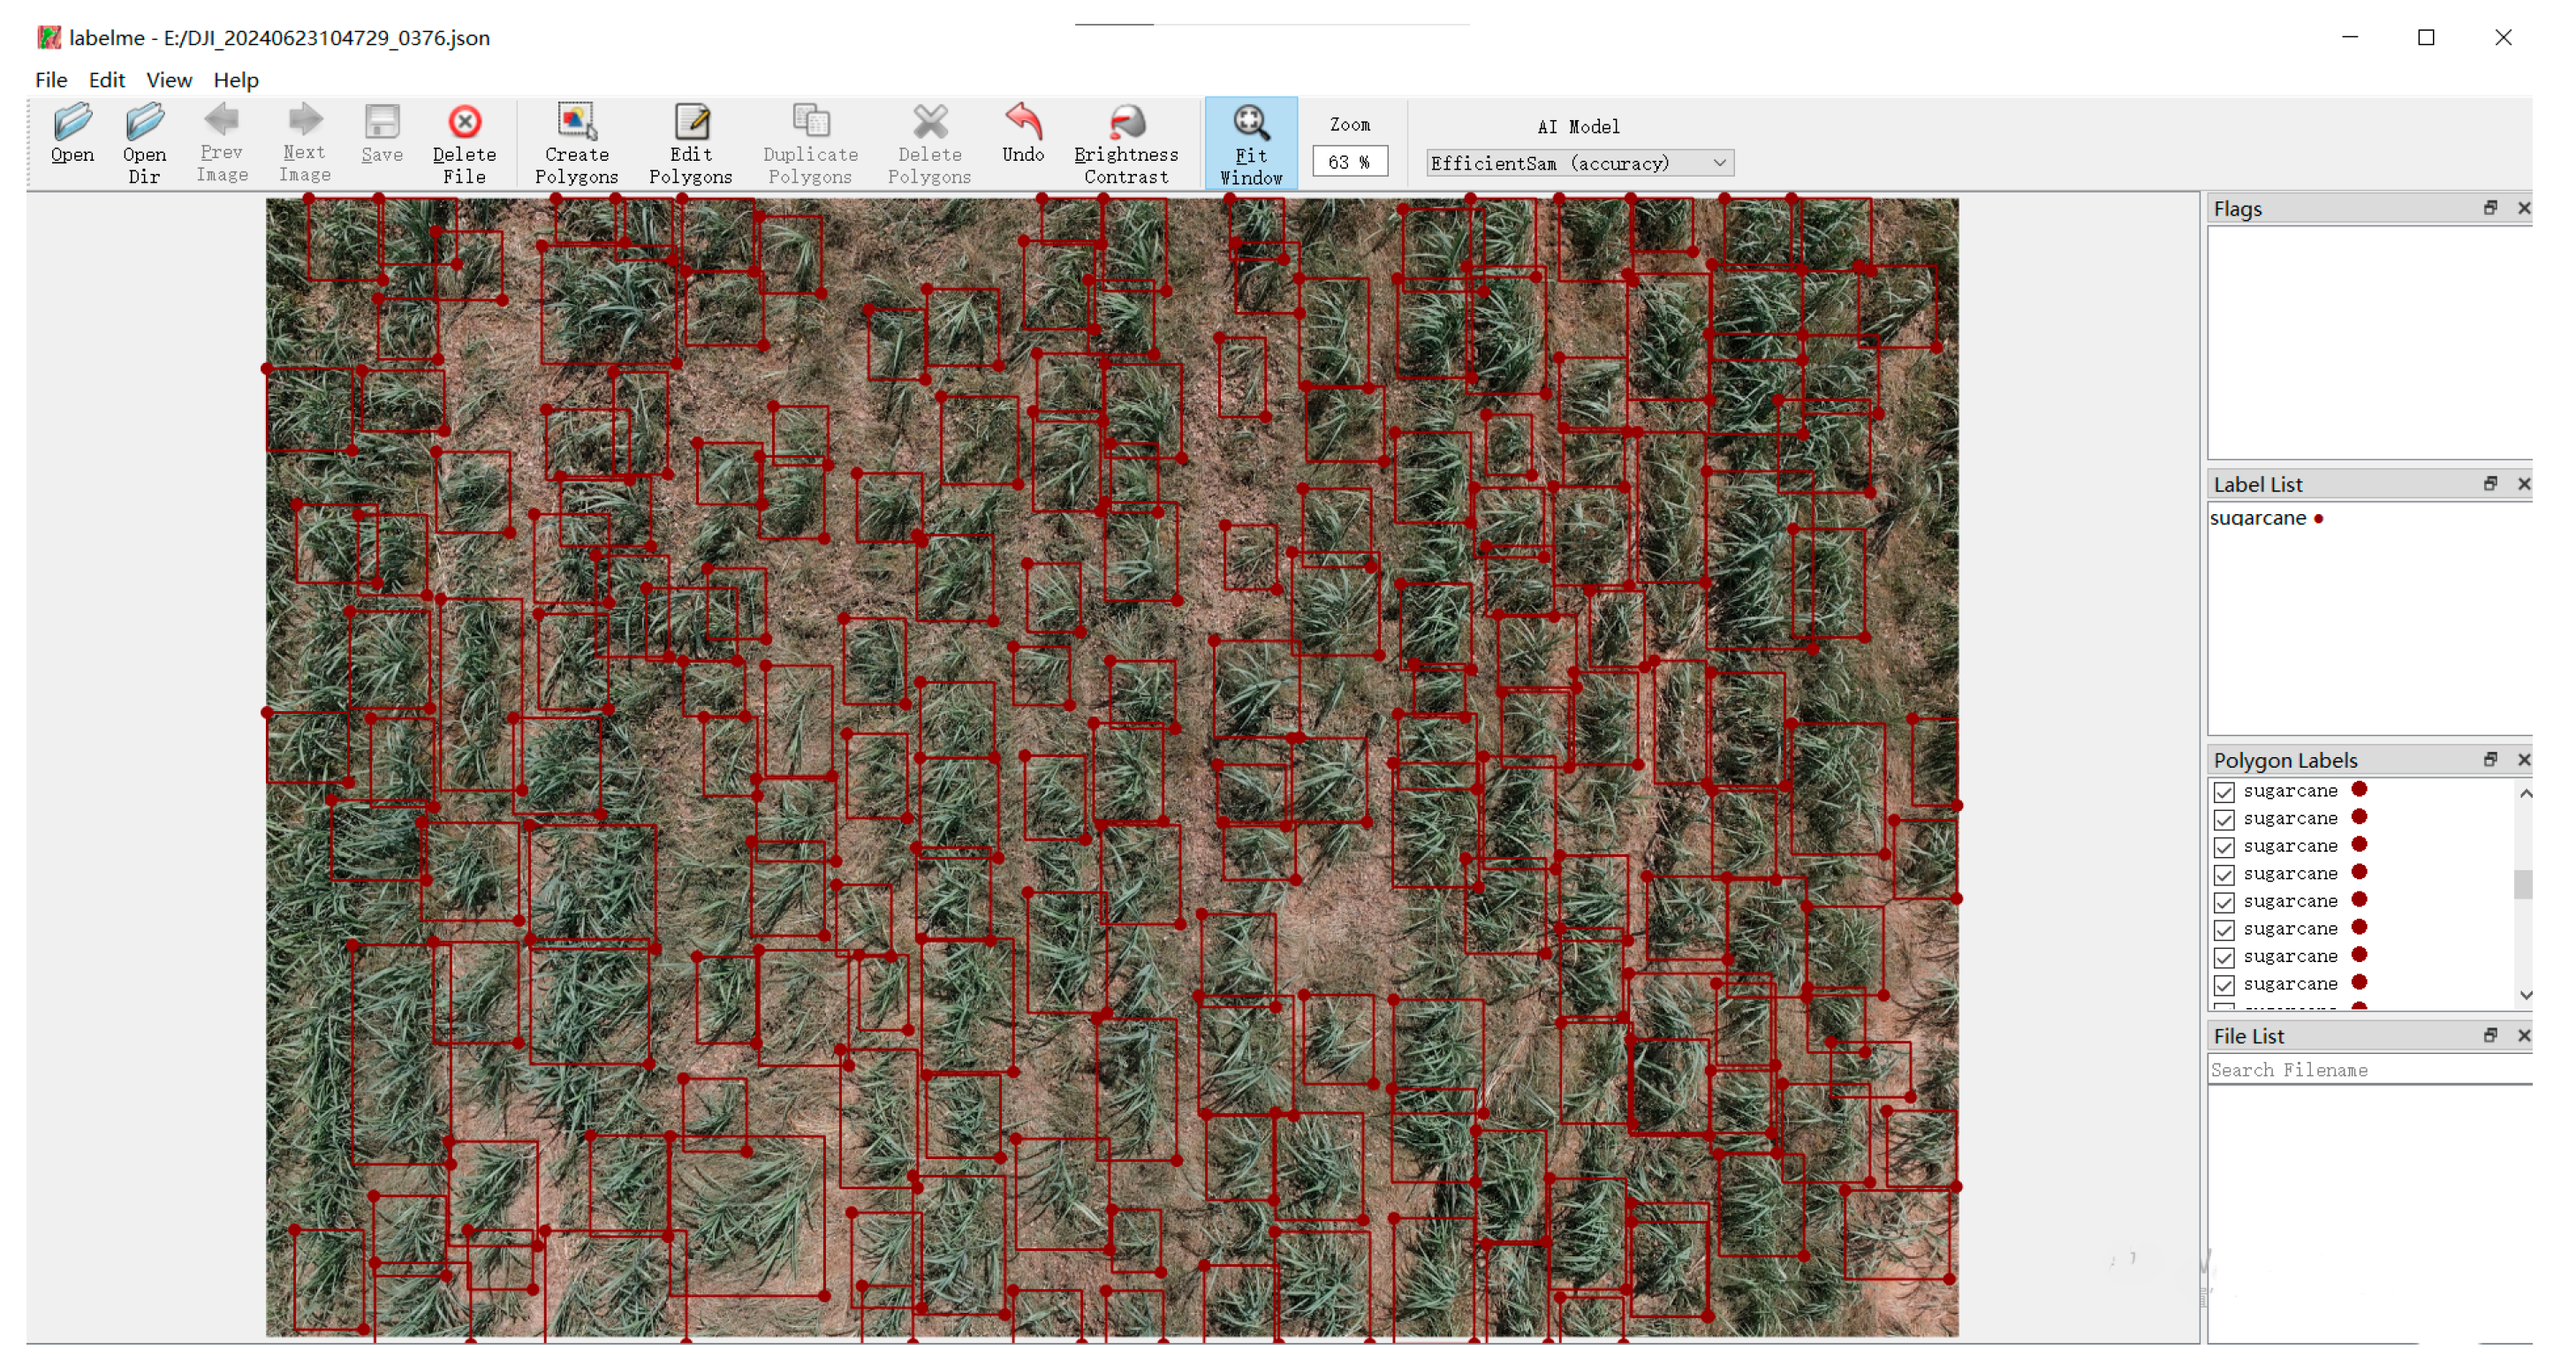
To balance training efficiency and maintain the original aspect ratio, the resolution was uniformly resized to 1024 × 640 pixels. During the labeling stage, the Labelme tool (version 5.5.0) was employed to annotate sugarcane with rectangular bounding boxes, using a consistent label category of “sugarcane.” All information related to the annotated objects, including target categories and bounding box coordinates, was saved in json format (an example is provided in
Figure 2). Subsequently, the labeling results were converted to text files in YOLO format for model training. As illustrated by the labeling examples, the annotated bounding boxes are densely packed and exhibit some degree of overlap, which presents a significant challenge for the accurate extraction of sugarcane.
After completing all data labeling, the dataset was partitioned into training, validation, and test sets in a 3:1:1 ratio. To prevent data leakage that could compromise the reliability of evaluation results, data augmentation was applied exclusively to the training set. To improve the model’s generalization ability across diverse scenarios and effectively mitigate overfitting, various data augmentation techniques were applied to the original training images, including vertical flipping, rotation, brightness adjustment, saturation adjustment, and noise injection. Following augmentation, the proportions of samples in the training, validation, and test sets were adjusted to 8:1:1, with 2321 training samples, 308 validation samples, and 308 test samples, respectively.
2.2. Object Detection Model
2.2.1. YOLO Series Model
YOLO (You Only Look Once) is a deep learning-based single-stage object detection model widely adopted for real-time detection tasks due to its high efficiency. Unlike traditional two-stage methods such as Faster R-CNN, YOLO formulates object detection as a regression problem, simultaneously localizing object positions and classifying categories within a single forward pass. This approach significantly enhances detection speed and efficiency. Due to its outstanding real-time performance, YOLO has been extensively applied in agriculture for tasks including crop detection and classification, pest and disease monitoring, and farmland management [
20]. Since the introduction of YOLOv1 in 2015 [
21], the YOLO series has undergone multiple iterations and optimizations, achieving continuous improvements in detection accuracy, inference speed, and model architecture.
YOLOv11 introduces a scalable lightweight backbone network and an enhanced feature fusion module, effectively improving feature extraction and multi-scale information integration. While maintaining high detection accuracy, YOLOv11 significantly increases inference speed, thereby enhancing real-time performance. The overall architecture of YOLOv11 is illustrated in
Figure 3. With its efficient design, strong generalization capability, and low computational overhead, YOLOv11 demonstrates broad applicability and practical value.
2.2.2. Proposed Network Architecture for SugarRow-YOLO
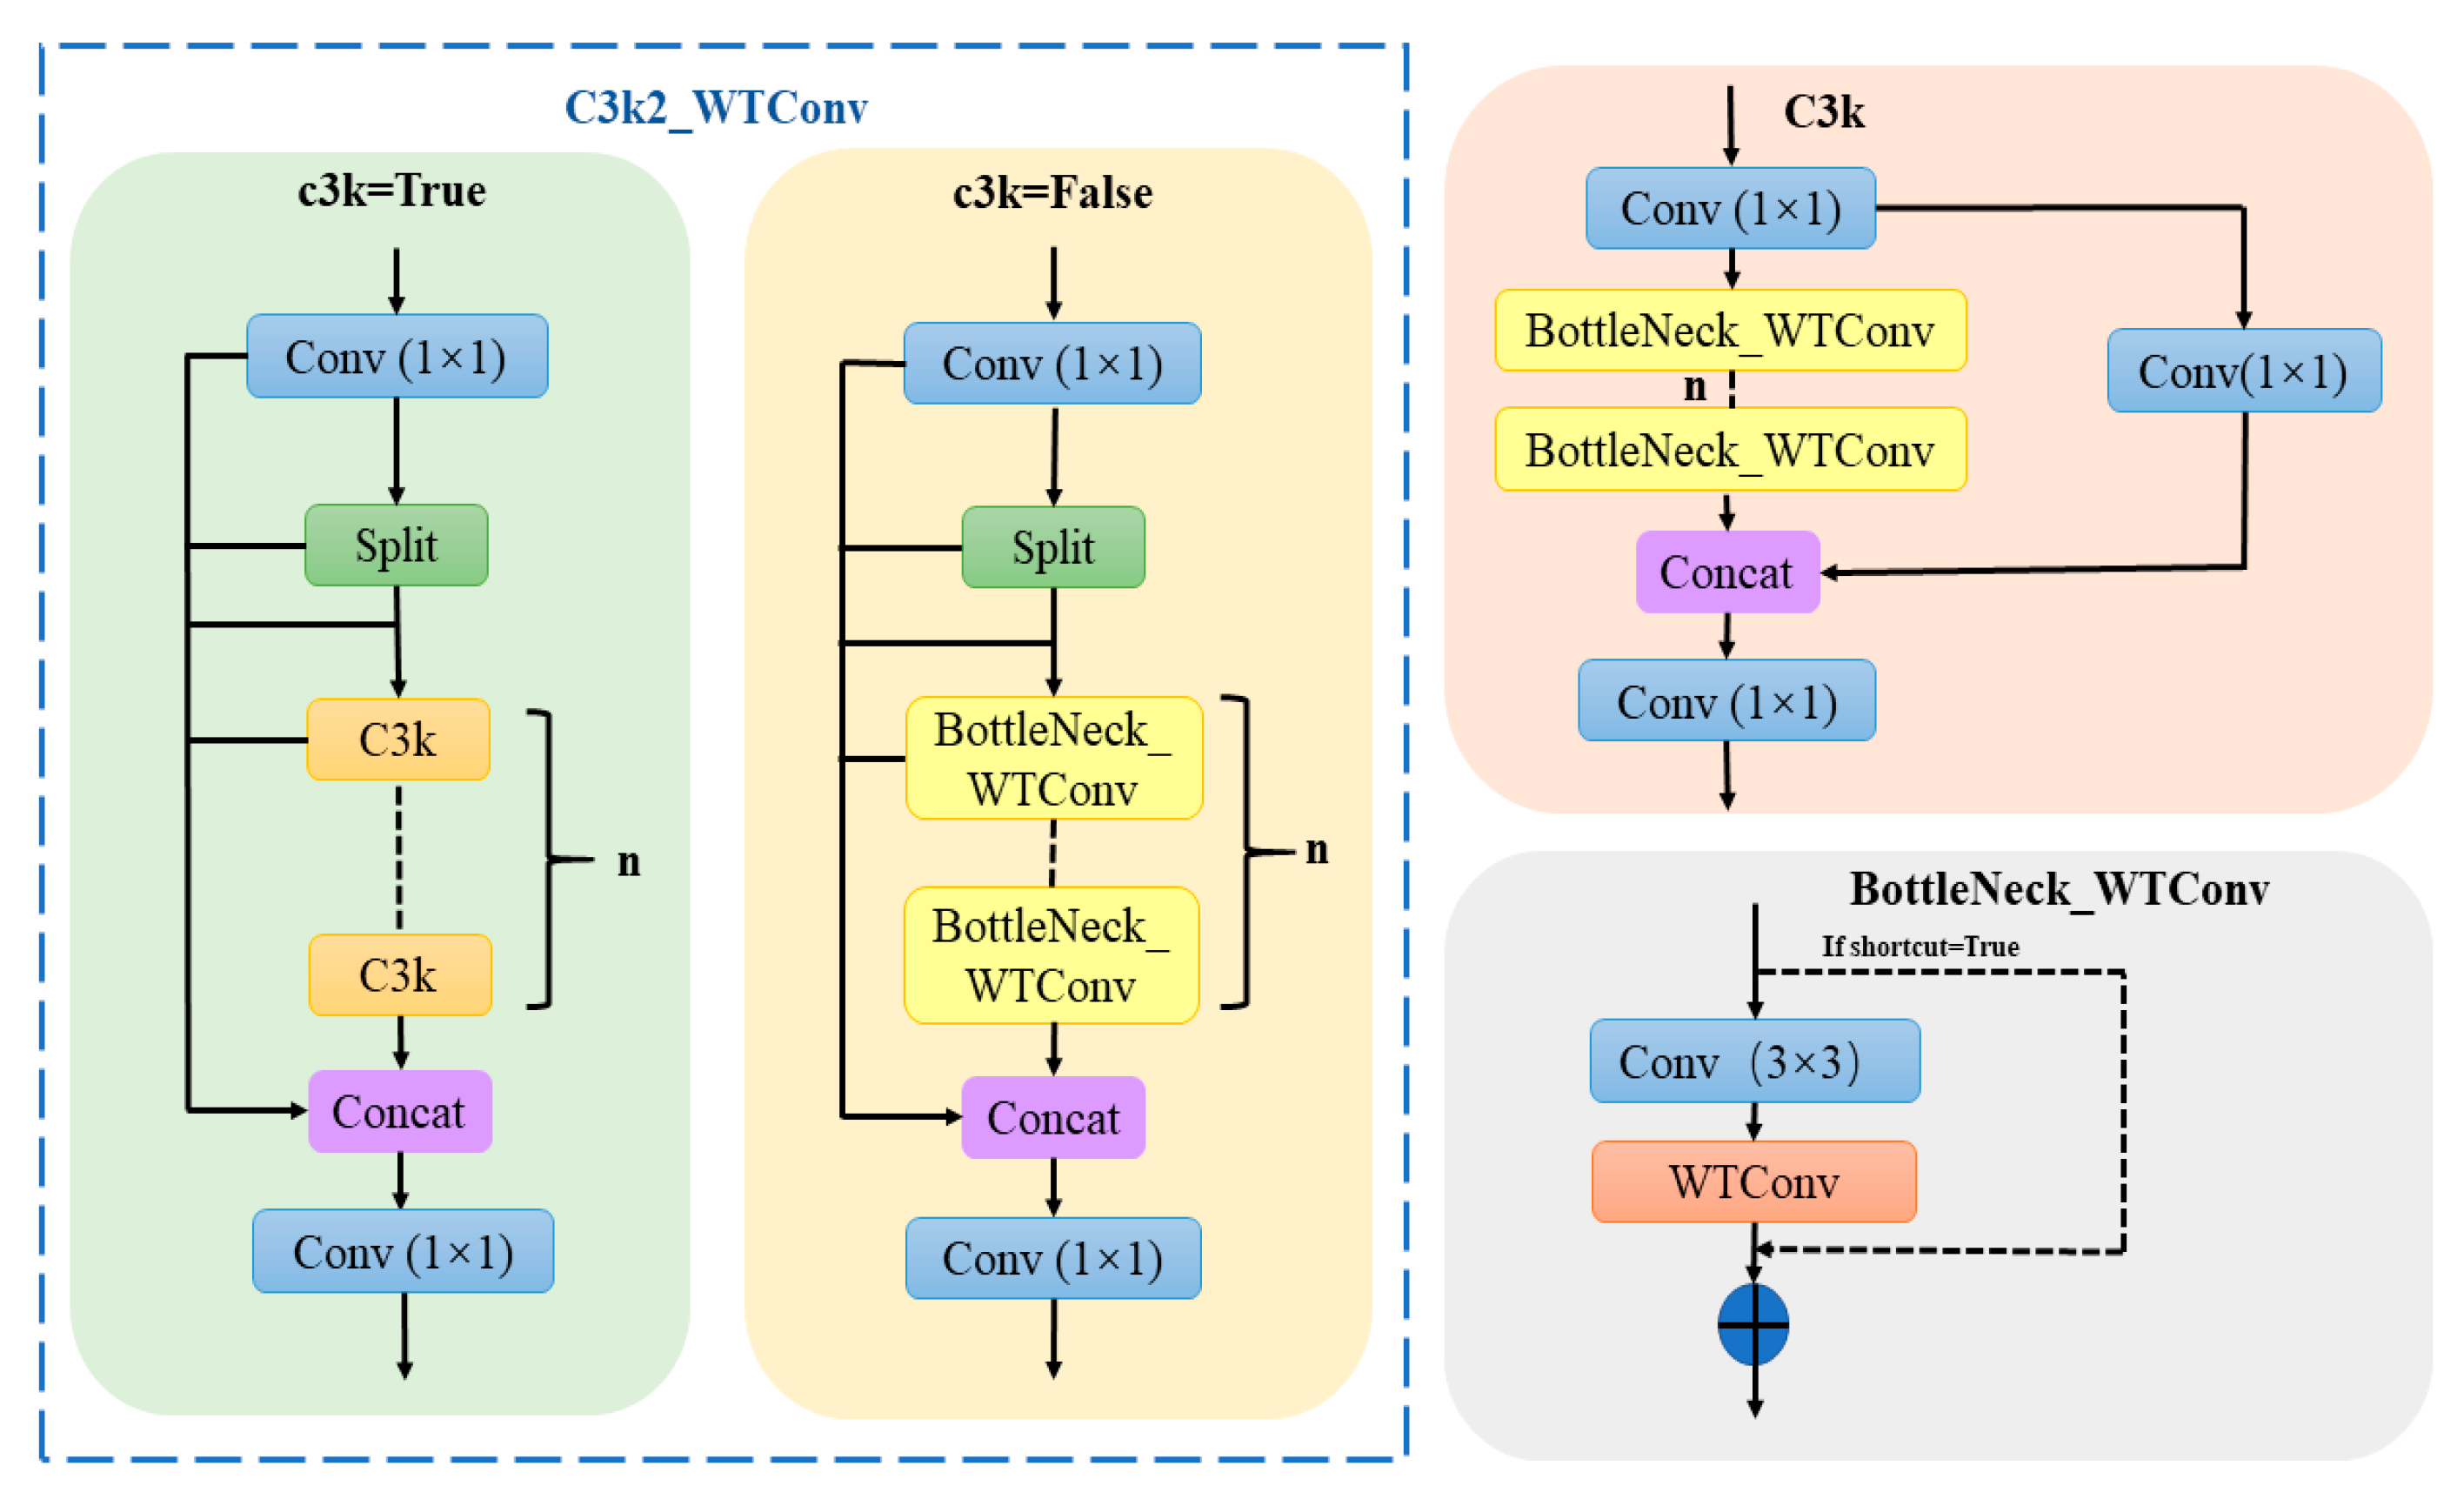
In this study, the YOLOv11n model was selected as the improved baseline. To further enhance the feature extraction capability, the C3k2_WTConv module (see
Figure 4) was proposed to replace the original C3k2 module in YOLOv11n. Specifically, WTConv [
22] was introduced to replace the deep convolutional layer within the Bottleneck module of C3k2. WTConv can directly substitute depthwise separable convolutions in neural network architectures without requiring additional modifications. The core concept of WTConv is implemented through the following three key steps: 1. Wavelet Transform: Multi-level decomposition of the input image using wavelet transform separates it into low- and high-frequency components. Through recursive application of the transform, the image is further decomposed into subbands at multiple scales. The low-frequency subbands primarily capture the global structure and overall content of the image, whereas the high-frequency subbands preserve localized edge and fine-detail information. 2. Multi-frequency Convolution: Distinct convolution operations are applied to different frequency subbands. As the wavelet transform reduces the spatial resolution of each subband, smaller convolutional kernels can achieve relatively larger receptive fields. This design effectively expands the receptive field while limiting the increase in model parameters. 3. Wavelet Decomposition: The convolution results from different frequency subbands are fused to reconstruct the image through filtering, upsampling, and weighted summation. This process effectively integrates multi-scale features, enabling the model to capture richer and more detailed information. By replacing the conventional convolutional layer in the C3k2 module with the WTConv module, the model effectively reduces parameter redundancy while expanding the receptive field, thereby mitigating the issue of over-parameterization.
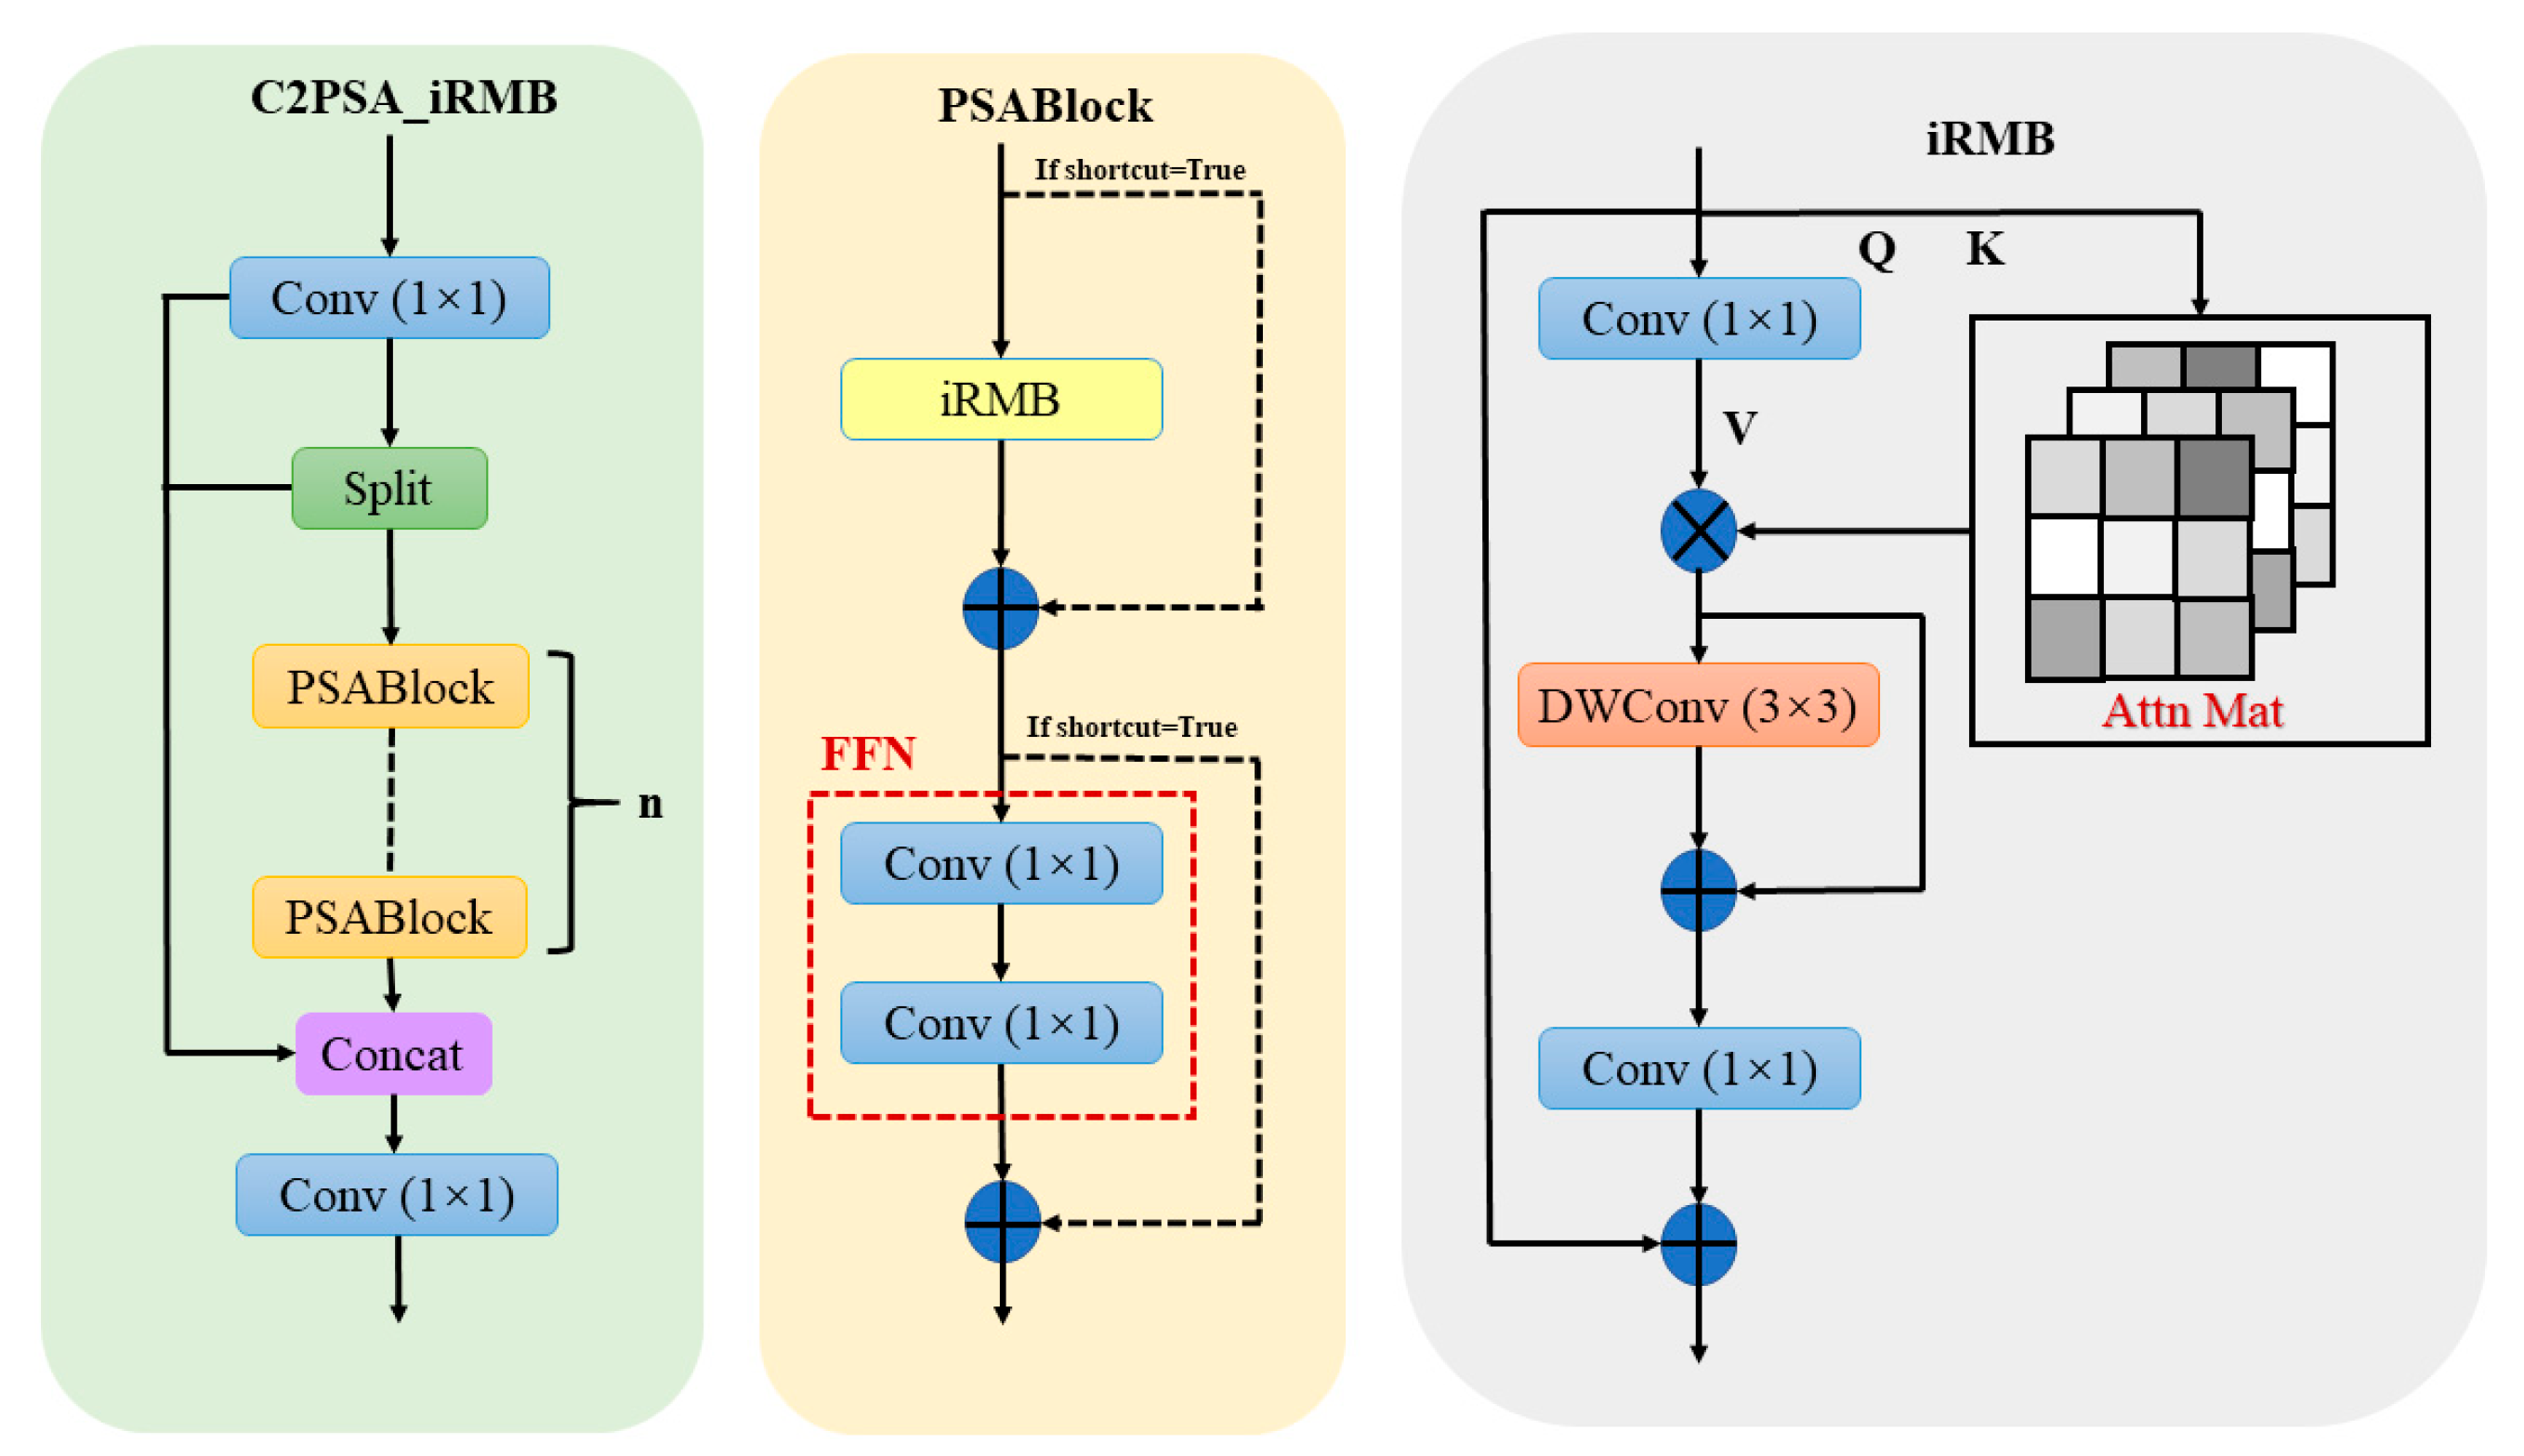
Secondly, given the demonstrated effectiveness of attention mechanisms in agricultural target detection [
23], this study further strengthens the model’s ability to capture spatial relationship features within images by introducing the C2PSA_iRMB module. This is achieved by replacing the original multi-head attention mechanism in C2PSA with the iRMB [
24], as illustrated in
Figure 5. The Inverted Residual Block (IRB) effectively reduces computational complexity by first expanding the number of channels, then applying DWConv, and finally reducing the dimensionality. Furthermore, the iRMB extends the IRB framework to attention-based models by combining the static short-range modeling advantages of convolutional neural networks (CNNs) with the dynamic long-range feature interaction capabilities of Transformers, thereby enabling more robust and expressive feature representations. The core components of the iRMB module include DWConv and a self-attention mechanism. Specifically, DWConv is employed to capture local spatial features, while the self-attention mechanism models global dependencies among features. This combination enables the model to more accurately perceive the spatial arrangement and geometric relationships of different crop regions within an image.
Finally, to address the issue of potential false positives and missed detections in high-density crop scenarios, this study adopts the UIOU loss function [
25] as a replacement for the original CIOU loss used in YOLOv11n. The CIOU loss primarily focuses on the geometric discrepancies between predicted and ground truth bounding boxes. However, its representational capacity is limited when significant size or positional deviations exist between the two. In contrast, the UIOU loss emphasizes the weighting of bounding boxes with varying quality. By incorporating dynamic weight allocation and a dual attention mechanism, UIOU is better suited to handle dense object detection scenarios with improved adaptability and robustness. At the core of the UIoU loss is the dynamically adjusted hyperparameter termed “ratio,” which is designed to balance the model’s attention and convergence speed during training. The scaling of the bounding boxes directly influences the regression loss associated with the predicted boxes, thereby affecting the degree of attention the model allocates to them. Specifically, enlarging the bounding box reduces the regression loss associated with high-quality predicted boxes, thereby encouraging the model to focus more on low-quality predictions. The hyperparameter “ratio” controls the scaling of the bounding boxes and plays a key role in this process. By dynamically adjusting the “ratio,” the model progressively shifts its attention from low-quality to high-quality prediction frames over the course of training. The initial value of the “ratio” is set to 2, gradually decreasing to a final value of 0.5. Throughout the training process, the value of “ratio” evolves with each epoch (one full training cycle), according to three distinct scaling strategies, as defined in Equations (1)–(3).
Fractional decay strategy:
For field object detection scenarios with complex backgrounds, this mechanism contributes to improved accuracy in both target recognition and localization. Furthermore, the dual-attention mechanism introduced by UIOU integrates confidence information from IoU values and predicted bounding boxes, thereby enhancing the model’s ability to detect overlapping and occluded objects. The overall architecture of the proposed SugarRow-YOLO network is illustrated in
Figure 6, where the module highlighted by the red box represents the improvement introduced in this study.
2.2.3. Crop Row Fitting
Based on the sugarcane detected by SugarRow-YOLO, the spatial location of each plant was represented using the coordinates of the center point of its corresponding bounding box [
26,
27]. Subsequently, all detected crop points were clustered into distinct crop rows according to their spatial representations. DBSCAN is an efficient density-based clustering algorithm that groups data points into clusters based on density connectivity [
28]. It classifies data points into core, border, and noise points using two parameters: the neighborhood radius (eps) and the minimum number of points (min_samples). During the clustering process, DBSCAN iteratively assigns border points within the neighborhood of a core point to the same cluster. This property enables DBSCAN to effectively handle crop rows with varying shapes, sizes, and densities, as well as to manage the uncertainty in the number of crop rows across different images.
Traditional methods such as Hough transform [
29] and LSM [
30,
31] are primarily employed for the linear fitting of straight crop rows. However, in practical field conditions, crop rows are often curved, rendering linear fitting methods prone to significant fitting errors or even complete failure. In contrast, the smoothing spline technique offers greater adaptability to irregular and nonlinear crop row patterns by achieving an effective balance between fitting accuracy and curve smoothness. Moreover, the continuous and smooth paths generated through spline fitting contribute to enhancing the stability and reliability of agricultural machinery operations.
Smoothing spline approximates a target curve by fitting a spline function composed of piecewise polynomials of degree k to a set of given data points, ensuring both smoothness and continuity across the entire curve [
32]. In this study, spline orders of k = 1 and k = 3 are employed. When k = 1, the resulting fit is a piecewise linear function composed of connected straight segments, which is suitable for scenarios where crop rows are approximately straight. The corresponding formulation is provided in Equation (4). In contrast, when k = 3, a cubic spline function is constructed to better represent curved crop rows, as detailed in Equation (5). To balance fitting accuracy and curve smoothness, a smoothing factor s is introduced. The fitting process constrains the weighted sum of squared residuals to remain below this threshold, thereby preventing overfitting. Additionally, weights wi are applied to control the influence of individual data points, allowing for more targeted and adaptive fitting. The mathematical formulation of this process is presented in Equation (6).
Here, and are the left and right endpoints of the interval, is the function value at the corresponding node, and , , , and are the coefficients of the piecewise cubic polynomial that describe the shape and variation in the curve within that interval. Based on a well-established theoretical foundation and corresponding continuity constraints, the parameter estimation process can be effectively conducted without the need for a separate preliminary identifiability analysis.
2.3. Experimental Setup
The experiments in this study were conducted on an Ubuntu 18.04.5 system equipped with an NVIDIA GeForce RTX 3080 Ti GPU (NVIDIA Corporation, Santa Clara, CA, USA). The software environment consisted of Python 3.9.7, CUDA 11.3, and PyTorch 1.12.1. Details of the experimental setup and specific parameter configurations are summarized in
Table 1.
The input image size for model training is set to 1024 × 640 pixels. After extensive experimentation with different hyperparameter combinations, the batch size is set to 8, the initial learning rate is set to 0.01, and the total number of training epochs is set to 200. The detailed training hyperparameters are summarized in
Table 2.
2.4. Evaluation Index
In this study, precision, recall, and mean average precision (mAP) are employed to evaluate the model’s performance. Precision is defined as the ratio of correctly predicted positive samples to the total number of samples predicted as positive. Recall refers to the ratio of correctly predicted positive samples to the total number of actual positive samples. The mean average precision (mAP) is calculated as the average of the average precision (AP) across all categories, providing a comprehensive measure of the model’s overall detection accuracy. The corresponding formulas for these evaluation metrics are presented in Equations (7)–(10).
Here, TP (true positive) denotes the number of sugarcane instances correctly detected by the model, FP (false positive) refers to the number of non-sugarcane instances incorrectly identified as sugarcane, and FN (false negative) indicates the number of sugarcane that the model failed to detect. The average precision (AP) represents an approximation of the area under the precision–recall (PR) curve and serves as a summary measure of the model’s performance in detecting a specific category. The mAP is computed as the mean AP across all n categories. mAP50 refers to the mean average precision calculated at an IoU threshold of 0.5, primarily evaluating the overlap between predicted and ground truth bounding boxes. In contrast, mAP50-95 is computed over multiple IoU thresholds ranging from 0.5 to 0.95 in increments of 0.05. This metric imposes stricter evaluation criteria, requiring not only sufficient overlap but also high spatial consistency between the predicted and ground truth boxes in terms of location and shape.
3. Results
3.1. SugarRow-YOLO Training Result
The SugarRow-YOLO model was systematically evaluated after 200 training epochs.
Figure 7 illustrates the performance trends of SugarRow-YOLO and YOLOv11n throughout the training process. As the number of training epochs increases, both models exhibit significant improvements in precision, recall, mAP
50, and mAP
50-95, with all metrics gradually stabilizing after approximately the 100th epoch. During the early stages of training, the values of precision, recall, mAP
50, and mAP
50-95 remain relatively low, indicating that the model is still in the initial phase of feature learning and parameter optimization. As training progresses, the model gradually captures more discriminative feature representations, leading to continuous improvements in performance metrics. In the later stages, the fluctuations in these metrics tend to stabilize, suggesting that the model has largely converged, demonstrates good robustness, and exhibits strong object detection capability. After 200 training epochs, the SugarRow-YOLO model achieves a precision of 83%, a recall of 87.8%, and mAP
50 and mAP
50-95 values of 90.2% and 69.2%, respectively. Compared to YOLOv11n, these results represent improvements of 2.0%, 1.9%, 1.6%, and 4.7%, respectively, thereby validating the effectiveness of the proposed method.
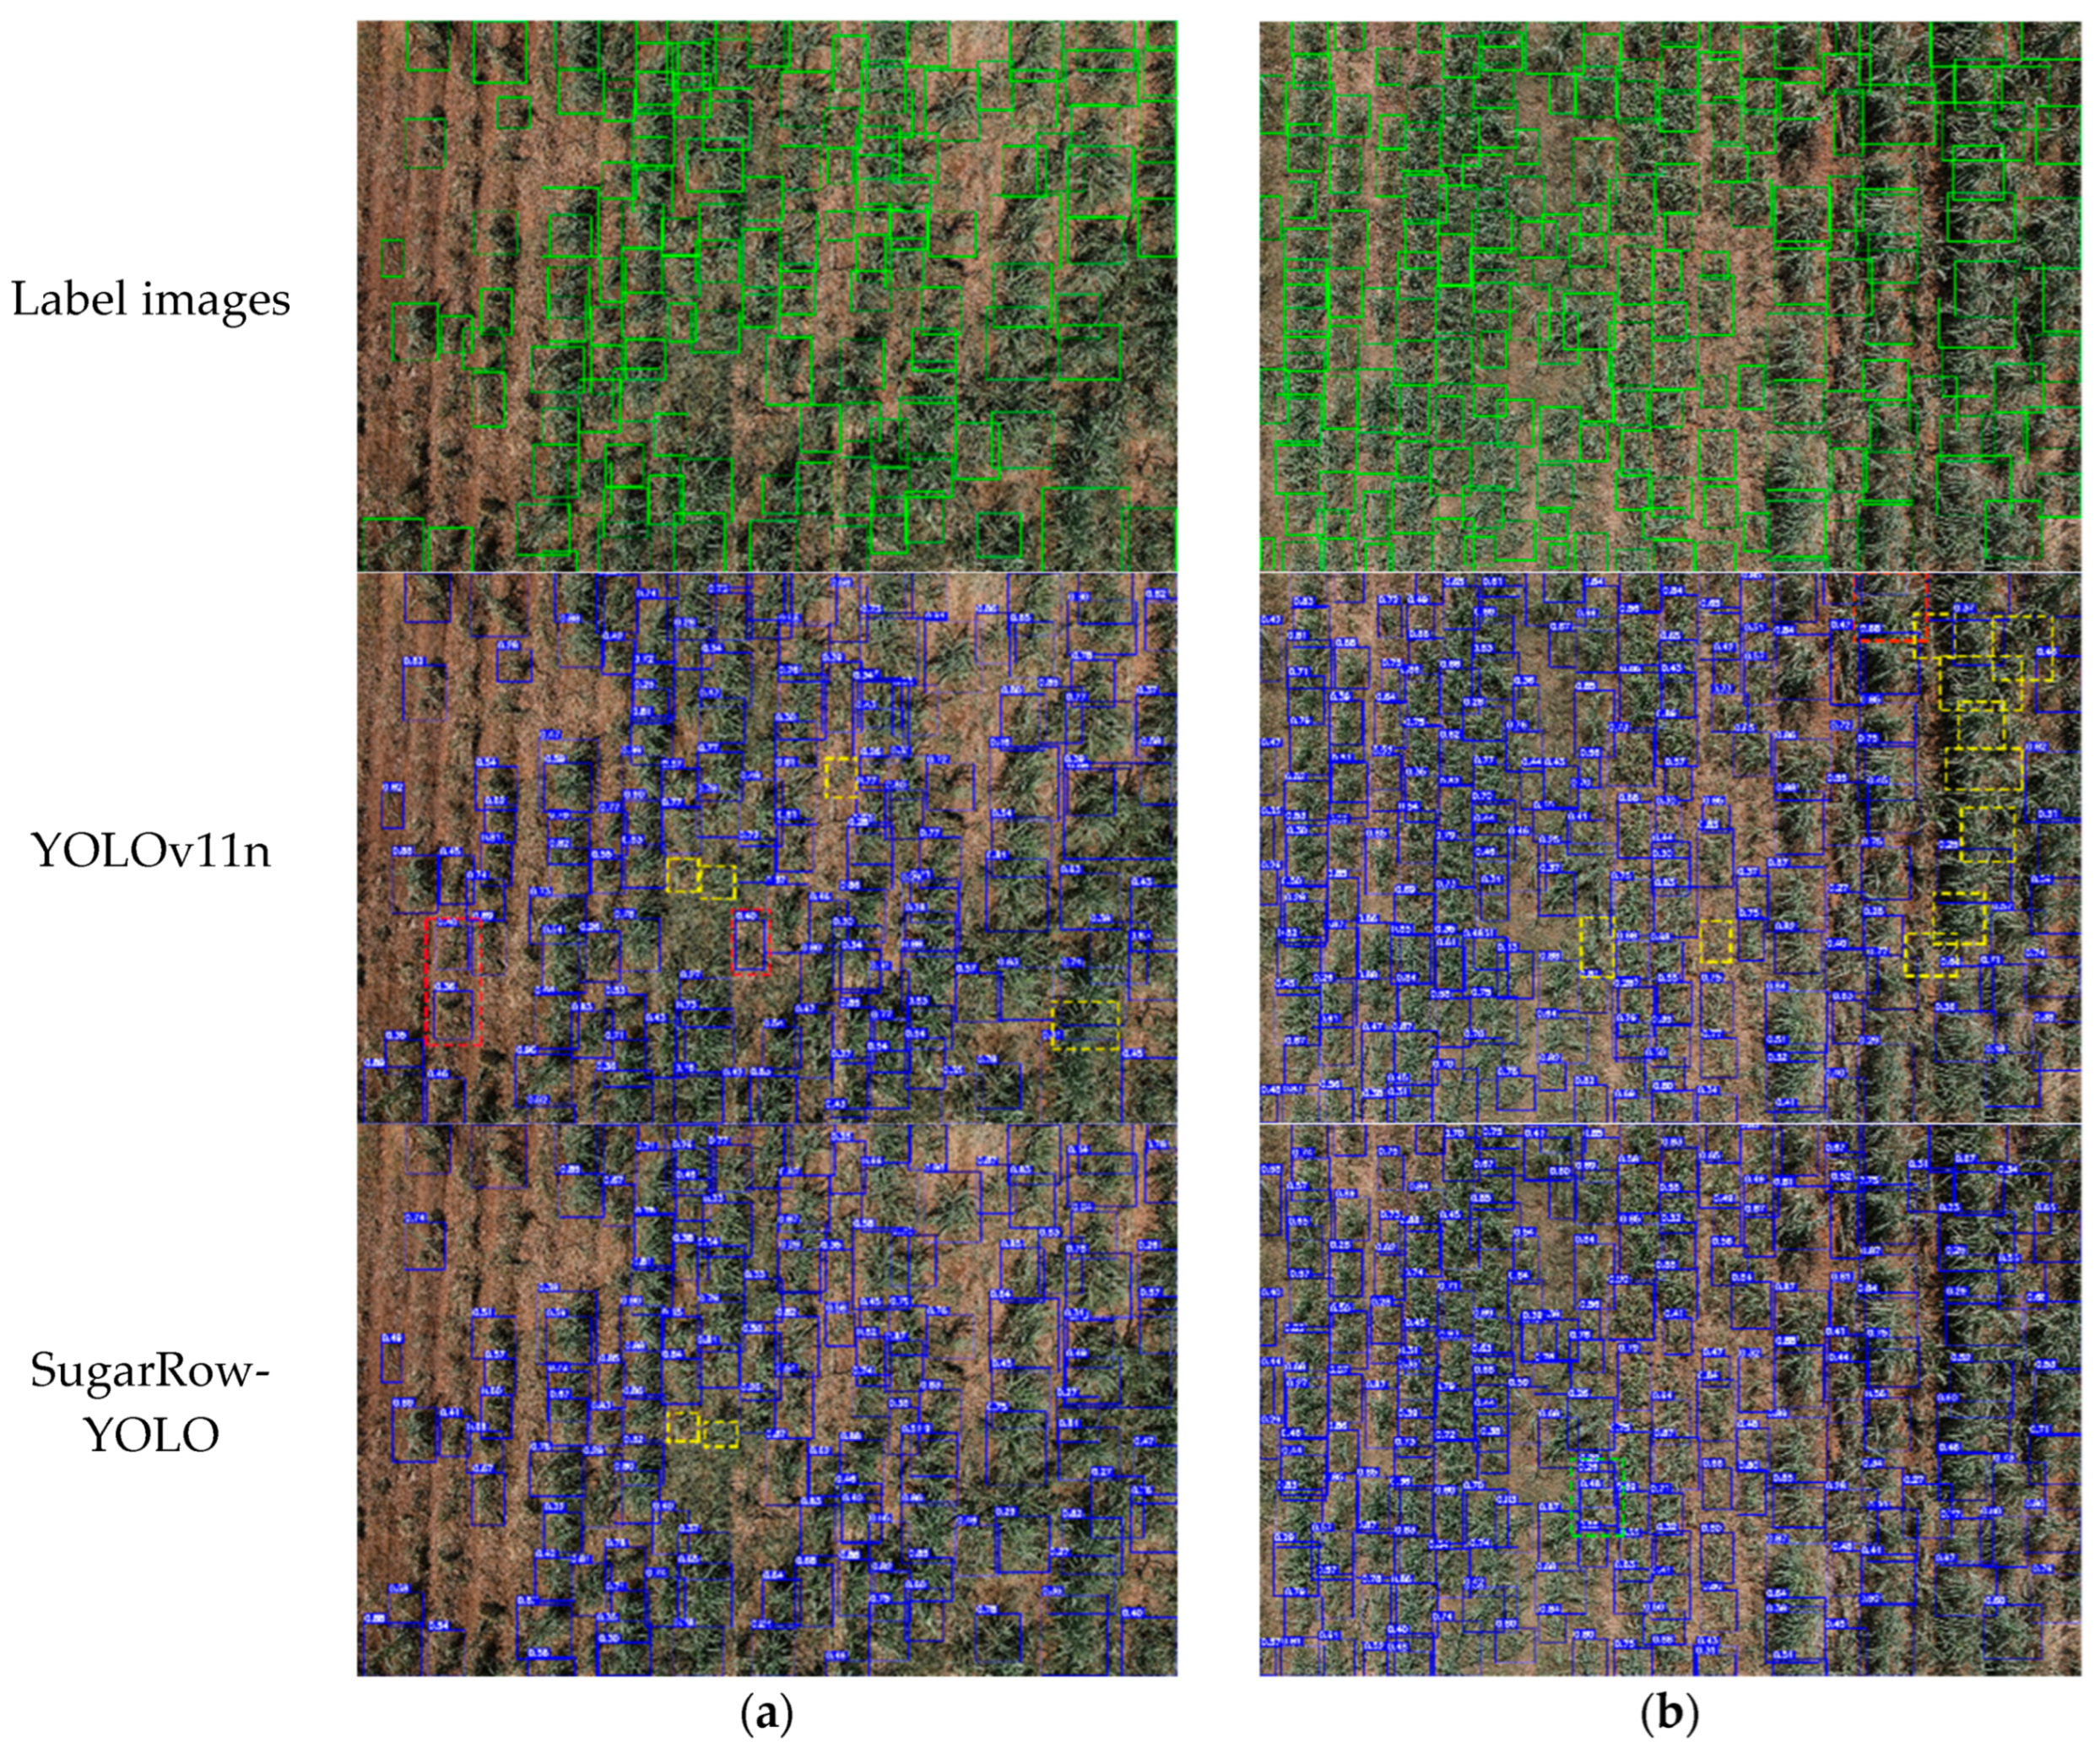
Figure 8 presents representative detection results from the test set. Panel (a) depicts complex scenarios including missing and discontinuous crop rows, as well as inter-row weed interference. Panel (b) illustrates a case of row closure caused by dense crop growth on the right side of the image. In most scenarios, both YOLOv11n and SugarRow-YOLO accurately identify sugarcane targets. However, YOLOv11n exhibits a noticeable degree of missed detections and false positives, whereas SugarRow-YOLO demonstrates more robust performance under challenging conditions. Specifically, in panel (a) of
Figure 8, YOLOv11n incorrectly identifies weeds in regions with missing or broken crop rows as sugarcane, whereas SugarRow-YOLO effectively avoids such misclassifications. Both models exhibit some degree of missed detection of sugarcane; however, YOLOv11n is more prone to falsely detecting weeds as sugarcane, which may interfere with the subsequent crop row fitting process. Additionally, in the presence of sugarcane seedlings within the rows, YOLOv11n shows a tendency toward underdetection. In panel (b), YOLOv11n demonstrates a high rate of missed and false detections in densely populated crop regions, particularly near the edges. In contrast, SugarRow-YOLO effectively mitigates these issues. YOLOv11n frequently fails to accurately detect crop targets exhibiting significant morphological variations, whereas SugarRow-YOLO successfully identifies such instances. However, it occasionally segments a single crop target into multiple bounding boxes, introducing some false positives. Nonetheless, this segmentation has minimal impact on subsequent crop row identification. Overall, SugarRow-YOLO exhibits superior detection performance under complex field conditions and is better suited for sugarcane row detection tasks.
3.2. Comparison with Other Mainstream Detection Models
This study is based on architectural improvements to the YOLO v11n series. Considering the widespread application and strong performance of YOLOv5, YOLOv7, YOLOv8, and YOLOv10 in agricultural tasks, these versions were selected as the primary comparison models. To provide a comprehensive and fair evaluation of detection performance under comparable network scale and architectural conditions, the corresponding n-series and tiny-series models were included as baseline comparisons.
To assess the performance benefits of the proposed SugarRow-YOLO model, it was systematically compared against several mainstream models. The comparative results are summarized in
Table 3. The experimental findings reveal that SugarRow-YOLO provides substantial improvements in precision, recall, average precision, and computational efficiency. Notably, it achieves a mAP
50-95 of 69.2%, markedly surpassing other benchmark models. This highlights its enhanced suitability for challenging agricultural object detection tasks. Furthermore, the recall rates of SugarRow-YOLO are comparable to those of YOLOv5n and YOLOv7-tiny, while reducing computational complexity by nearly 50% compared to YOLOv7-tiny. In addition, SugarRow-YOLO achieves higher accuracy and mean Average Precision (mAP) than YOLOv5n. Moreover, although YOLOv8n performs well in terms of precision and mAP
50-95, crop row detection tasks place greater emphasis on recall. A high recall is more beneficial for ensuring the complete detection of all true targets, thereby laying a solid foundation for the subsequent continuous modeling of crop row structures. Therefore, considering the trade-off between recall and efficiency, SugarRow-YOLO demonstrates greater practical value compared to YOLOv8n. Compared to YOLOv11n, SugarRow-YOLO achieves improvements of 2.0% in precision, 1.9% in recall, 1.6% in mAP
50, and 4.7% in mAP
50-95, while maintaining comparable computational complexity. SugarRow-YOLO achieves an inference speed of 53.6 FPS while maintaining a moderate computational complexity and significantly improving detection accuracy. Although its FPS is slightly lower compared to some lightweight models such as YOLOv7-tiny and YOLOv8n, considering the overall performance improvement and well-controlled computational cost, SugarRow-YOLO still demonstrates potential for practical applications.
3.3. Ablation Experiment
To validate the effectiveness of the WTConv, iRMB, and UIOU modules, a series of systematic ablation experiments were conducted under identical testing conditions, using YOLOv11n as the baseline model. The results are summarized in
Table 4. The experimental results demonstrate that each proposed module contributes significantly to the performance improvement of SugarRow-YOLO. Specifically, the introduction of WTConv alone leads to noticeable enhancements in precision, recall, mAP
50, and mAP
50-95. This suggests that WTConv effectively improves the model’s feature extraction capability by optimizing the convolutional structure. Second, a notable improvement in recall is observed when the iRMB attention mechanism is introduced independently. This enhancement is primarily attributed to the fine-grained feature weighting strategy of iRMB. It enables the model to better perceive object regions. This effect is especially evident in scenarios with densely distributed targets. By adopting UIOU as the regression loss function, the precision increases to 82.9% and the mAP
50-95 improves by 1.3%. These gains are attributed to UIOU’s incorporation of dynamic weight allocation and a dual attention mechanism, which results in more accurate bounding box regression and significantly enhances target localization performance. The performance of the model is further enhanced when the two are used in combination. The synergistic effect of feature extraction enhancement and attention mechanism helps to improve the recall rate and optimize the detection accuracy; the combination of feature extraction and regression optimization excels in terms of localization accuracy and prediction frame stability; and the combination of the attention mechanism and high-quality regression strategy significantly enhances the overall detection performance, especially in the dense target detection task. These results indicate that the three modules complement each other effectively in terms of feature representation, target perception, and boundary regression, thereby significantly enhancing the overall detection capability of the model. In conclusion, the ablation study thoroughly validates the effectiveness and synergistic benefits of each proposed module in improving the performance of the SugarRow-YOLO model. This provides strong support for the subsequent modeling of crop rows in complex field environments.
To further evaluate the impact of different architectural modules on model complexity,
Table 5 summarizes the changes in parameter count and GFLOPs when integrating various improvements into YOLOv11. It is worth noting that the UIoU loss function introduced during training does not contain any learnable parameters and incurs only minimal computational overhead during the training phase. As it has no impact on inference complexity or model size, it is not included in the table.
As shown in the table, compared to the baseline YOLOv11, the incorporation of WTConv and C2PSA_iRMB modules leads to a moderate increase in the number of layers (from 319 to 358), while the total number of parameters remains at a comparable level, ranging between approximately 2.48 million and 2.62 million. Notably, the FLOPs increase modestly from 10.6 G to 13.1 G, indicating that although the model becomes deeper and computationally more intensive, the overhead introduced by the additional modules is controlled. Specifically, the YOLOv11n + WTConv + C2PSA_iRMB variant achieves a deeper architecture with only a slight increase in parameters compared to the baseline, demonstrating a favorable balance between model complexity and computational cost. These results suggest that the proposed modules effectively enhance the model’s representational capacity without causing excessive computational burden, supporting their practical applicability in scenarios demanding improved accuracy with manageable resource consumption.
3.4. Analysis of Crop Row Fitting Results
The model’s predictions include the coordinates of the center points of the object bounding boxes, which can be directly used to indicate the locations of individual sugarcane. Given the characteristics of the collected dataset, where crop rows are primarily distributed along the vertical direction, only the x coordinates of the center points were used for clustering. Based on the environmental features of the farmland, the parameters of the DBSCAN clustering algorithm were set as follows: eps = 0.01 and min_samples = 3. Additionally, since edge points unlikely to form complete crop rows were excluded before clustering, a distance-based thresholding method was applied to remove these edge points before DBSCAN clustering.
Based on the clustering results obtained from the DBSCAN algorithm, a smoothed spline curve was employed to fit the centroids of the crop rows. To achieve an optimal balance between fitting accuracy and curve smoothness, the smoothing parameter s was set to 0.1. Experimental observations indicate that, for the dataset used in this study, setting the smoothing parameter s to 0.1 effectively suppresses local noise while avoiding overfitting to individual data points. This configuration enhances the stability and robustness of the curve fitting results. To accommodate potential variations in crop row morphology and enhance the adaptability of the fitting process, order k of the spline curve was adaptively determined based on the number of data points within each cluster. For clusters containing fewer than four points, where the distribution trend tends to approximate a straight line, a first-order spline (k = 1) was employed for linear fitting. In contrast, for clusters with four or more points, where crop rows may exhibit curved or nonlinear patterns, a third-order spline (k = 3) was utilized to more accurately capture the underlying geometric characteristics.
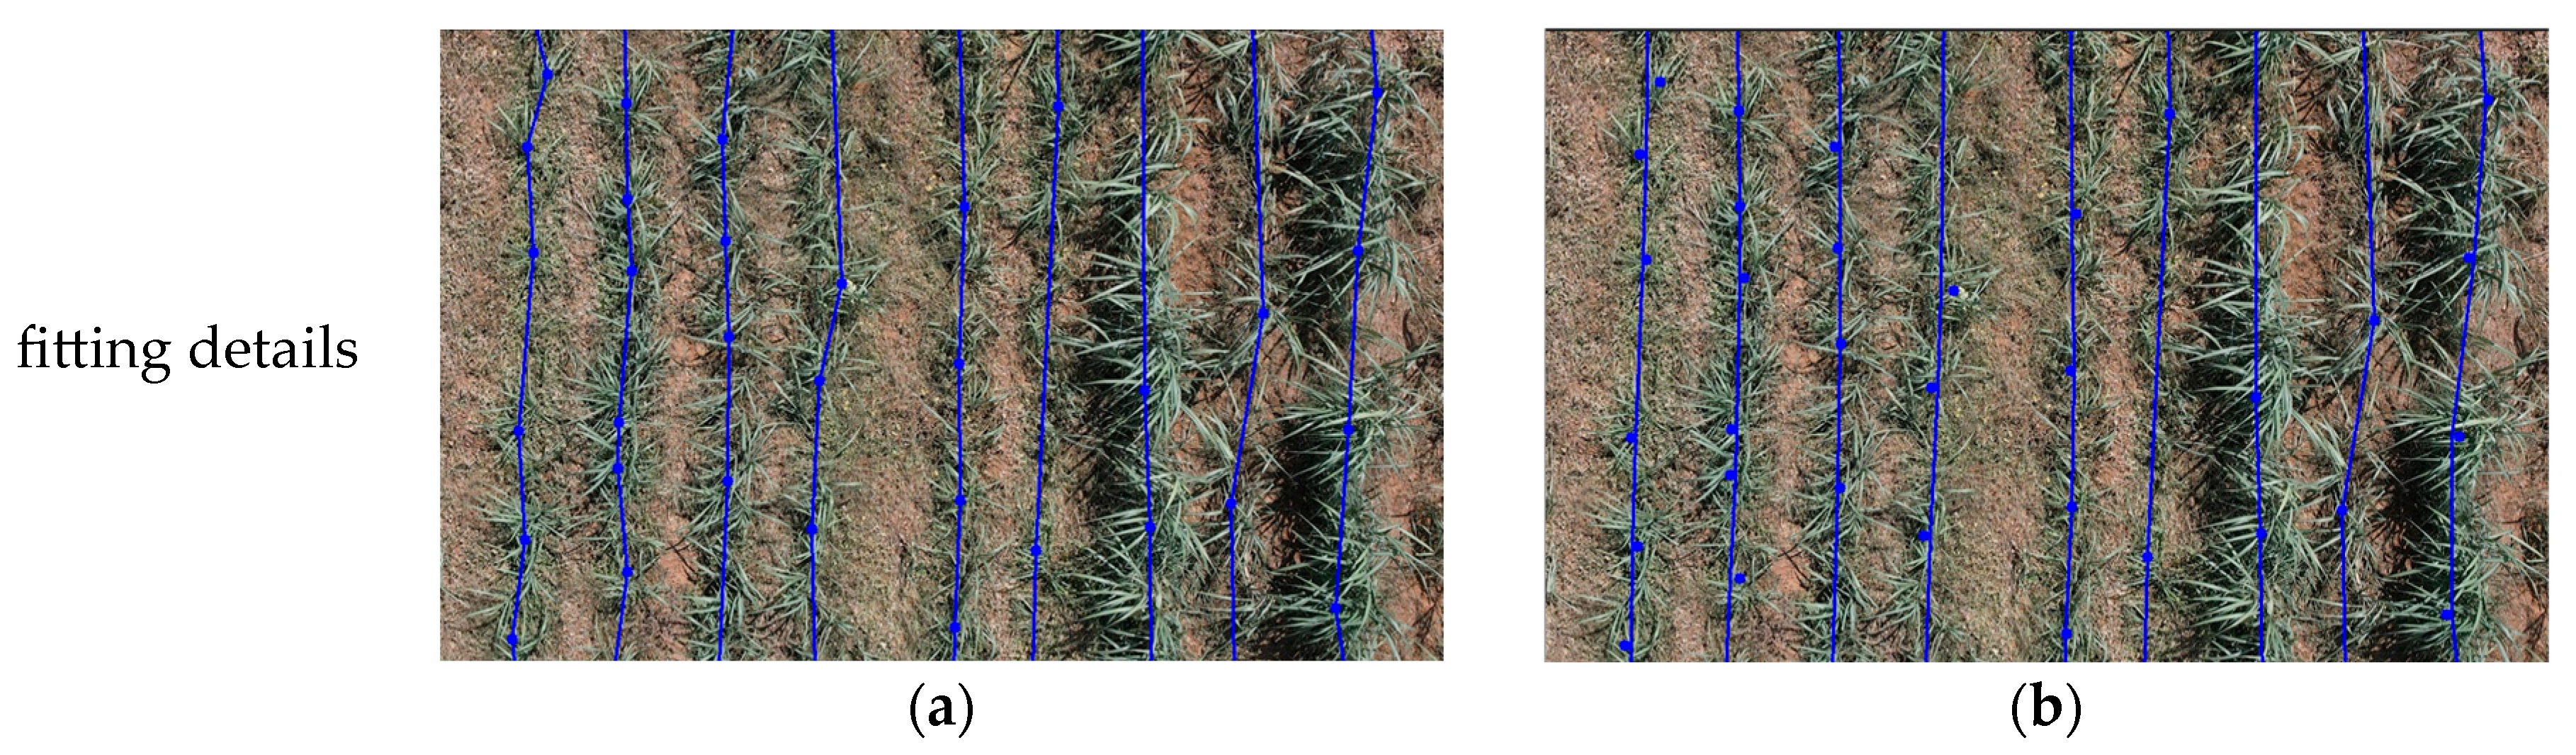
To compare the effectiveness of row fitting, this study conducts a comparative analysis using the smoothed spline curve and the least squares method. Due to the irregular spatial distribution and pronounced curvature of sugarcane rows, traditional LSM is insufficient to accurately characterize their overall trajectories. Therefore, this study employs a polynomial fitting method based on the least squares principle as a baseline to compare against the proposed smoothing spline method.
Figure 9 shows the fitting performance of different methods. According to the image results, when the data points along the crop rows are densely and continuously distributed, both polynomial fitting and spline curves can accurately capture the overall trend of the crop rows. However, in regions with missing rows, broken rows, or abrupt changes in trend, polynomial fitting often exhibits large oscillations due to its global nature, making it difficult to accurately represent the actual shape. When examining local segments in detail, polynomial fitting often fails to fully capture all data points, and in regions with pronounced curvature, the polynomial fitting results tend to exhibit a linear trend, making it difficult to represent the actual curvature variation. In contrast, spline fitting can better capture local nonlinear characteristics and more accurately reflect the curved shape of the crop rows.
In the context of crop row recognition, recognition accuracy is defined as the ratio of successfully identified crop rows to the total number of actual crop rows [
33,
34]. A crop row is considered successfully recognized if the majority of its constituent plants are accurately included within the row line generated by the algorithm. Conversely, if a substantial number of plants deviate from the generated row line or if significant omissions are observed within a given row, the recognition is deemed to have failed.
To comprehensively and systematically evaluate the performance of the proposed method under varying planting densities, images were categorized based on the number of actual crop rows: those containing fewer than 19 rows and those with 19 or more. From each category, 20 images were randomly selected for accuracy evaluation. The recognition results are summarized in
Table 6. The proposed algorithm achieves an overall recognition accuracy of 96.6%, demonstrating strong robustness and promising practical applicability in the task of sugarcane crop row recognition.
4. Discussion
In this study, an enhanced object detection model, SugarRow-YOLO, was proposed to address the challenges of severe leaf–stem overlap and dense target occlusion commonly observed during the sugarcane elongation stage. Experimental results demonstrate that the proposed method outperforms the baseline YOLOv11n model across several key performance metrics, thereby validating the effectiveness and practical relevance of the proposed improvements. Furthermore, to accommodate the high variability in sugarcane row spacing, accurate crop row fitting was achieved by integrating DBSCAN clustering with a smoothing spline curve, based on the detection results.
In terms of sugarcane detection, the proposed SugarRow-YOLO model demonstrates superior detection accuracy and robustness compared with other mainstream recognition models. First, the incorporation of the WTConv module effectively expands the receptive field and enhances computational efficiency, enabling the model to maintain strong detection performance even in complex background conditions. Second, the iRMB attention mechanism improves the model’s ability to capture spatial structural features, offering enhanced robustness when dealing with morphological variations and complex structural patterns in sugarcane rows. Additionally, the UIOU loss function exhibits clear advantages in recognizing densely overlapping targets, significantly reducing both false positives and missed detections. However, in scenarios where sugarcane plants exhibit severe leaf–stem overlap and large morphological differences, the target boundaries may become indistinct, causing the model to potentially misinterpret a single plant as multiple objects. This issue may arise from the current methodology lacking dedicated modules specifically designed to handle occlusion and dense object detection. Despite this limitation, SugarRow-YOLO maintains high detection accuracy overall. The predicted results still effectively capture the spatial distribution trends of the crops, ensuring that the subsequent fitting of crop row centerlines is not adversely affected. To address this challenge, future work will consider introducing occlusion-aware feature enhancement modules or context aggregation mechanisms to explicitly model occlusion relationships.
To better evaluate the robustness and cross-domain generalizability of SugarRow-YOLO, we directly evaluated the trained model on the dataset proposed by Rehman et al. [
35]. This dataset was collected in soybean fields under different lighting conditions. It covers multiple growth stages and includes various weed species. Identifying these weeds accurately makes the dataset particularly challenging for recognition tasks. SugarRow-YOLO achieved a precision of only 25.8% when evaluated on this challenging dataset, indicating that the current model’s generalizability is still limited. To address this limitation, future work will focus on employing domain adaptation techniques [
36] and data fusion methods [
37] to enhance the model’s generalization capability.
In the task of crop row extraction, the DBSCAN clustering combined with spline curve fitting, as proposed in this study and based on the target detection results, overcomes the limitations of traditional methods that rely on assumptions of uniform planting patterns. This approach effectively adapts to the real-world variability in sugarcane row and plant spacing. The method achieves an overall recognition accuracy of 96.6%, demonstrates good practicality and considerable potential for broader application. However, this method is mainly suitable for scenarios where crop rows have clear and distinct structures. In the later stages of crop growth, as the overlap and intersection between rows become more pronounced, the complexity of the field layout increases, and traditional clustering methods based on single-cluster assignments face certain limitations when handling overlapping and transitional regions. Therefore, future research should consider introducing clustering frameworks that can characterize the uncertainty and imprecision between clusters, such as the Belief-Peak Evidential Clustering method [
38], to more accurately represent the structure of crop rows under complex field conditions and provide more robust and reliable support for subsequent autonomous navigation and precision agricultural operations.
Overall, although the proposed SugarRow-YOLO model and crop row extraction method demonstrate potential for practical application, they have not yet been deployed or validated in real field environments or actual agricultural equipment. Future research will focus on the deployment and performance validation of the method in practical scenarios to further promote its engineering implementation and real-world application. Additionally, we will explore techniques such as model pruning and quantization to improve inference speed and meet real-time processing requirements.
5. Conclusions
In this study, we propose SugarRow-YOLO, a target detection model integrating the WTConv module, iRMB attention mechanism, and UIOU loss function to address the challenges of complex occlusion and structural variability in sugarcane elongation target recognition and crop row extraction tasks. Compared to YOLOv5n, YOLOv7-tiny, YOLOv8n, and YOLOv10n, SugarRow-YOLO improves mAP50-95 by 3.5%, 4.7%, 3.3% and 3.7%, respectively. Relative to the baseline YOLOv11n model, SugarRow-YOLO achieves improvements of 2.0%, 1.9%, 1.6%, and 4.7% in precision, recall, mAP50, and mAP50-95, respectively. To address the irregularity of plant and row spacing in sugarcane fields, the DBSCAN clustering algorithm is combined with smoothing spline curves for crop row modeling, resulting in an overall recognition accuracy of 96.6%. Although the proposed method performs well, it has not yet been validated in real agricultural environments. Future research will focus on practical deployment and testing, optimizing model lightweight design to improve inference speed, and exploring cross-domain techniques and multi-source data fusion to enhance model generalization, thereby facilitating its application in complex scenarios.


