1. Introduction
Modern realities bring new economic, social, and environmental challenges that demand innovative solutions, particularly in the construction industry. A continuing priority is the development of new structural systems that ensure resilience, reduce construction costs, and simplify maintenance. One of the most promising directions toward sustainable construction is the application of additive technologies, including 3DCP. This process is fully automated, allowing for greater flexibility in material selection, geometric form, and a high degree of customisation, while also offering optimal design in terms of energy efficiency. According to several authors, virtual prototyping and digital fabrication should be integrated into all stages of the design, construction, and decommissioning of future and existing structures [
1].
Over the past two decades, several digital concrete fabrication methods have been developed for the construction sector. Today, the most common are layer-by-layer extrusion techniques such as contour creation and 3D concrete printing, as well as formwork printing, slip-based forming (also known as dynamic formwork), and particle bed printing (also known as binder jetting) [
1,
2,
3,
4].
Critical parameters of the printing process—including layer interval, humidity level, print head speed and height, geometry and rotational speed of the screw blades, and the shape and size of the extrusion—are highly sensitive and significantly affect the quality of the printed objects [
5]. However, there is insufficient data on how the quality of printed objects has been verified and controlled.
Numerous studies have been devoted to developing printable concrete mixtures, varying the components, proportions, and additives, including industrial waste products. The relationship between the mechanical properties of 3D-printed concrete, cement type, and perceived density has been investigated [
6]. In one such study, a binary mixture of ordinary Portland cement and fast-setting cement, combined with quartz sand in various proportions, was printed using a jetting method. The results demonstrated that mixture proportions and layer thickness significantly influence the mechanical properties of the concrete. To determine these properties, samples were printed and tested by the EN 196- 1 standard: cubes with a side length of 40 mm and beams of 160 mm × 40 mm × 40 mm for compressive and flexural strength testing, respectively. However, it remains unclear whether the strength of these printed samples corresponds to the strength of more complex elements printed using the same mixture and printer.
A review of research on 3D printing conducted between 2014 and 2023, based on the Web of Science database, was presented earlier [
7]. The studies were categorised into stages. In the first stage, researchers focused on assessing the potential for applying 3D printing in construction by building on existing technologies. The second stage concentrated on printable materials. In the third stage, the studies explored the effects of porosity, pore distribution, and the geometric characteristics of pores on performance from a microscopic perspective; they proposed cement-free alternatives; and began integrating machine learning methods into 3D printing. These studies identified three core research areas in 3D concrete printing: materials development (component types and ratios, printable mixture formulation, performance enhancement, etc.), process parameters (layering intervals, deposition speed, directionality, etc.), and technological methods (integration of different reinforcement types, etc.). Nevertheless, these studies still lack sufficient data on the compressive strength of hardened, printed concrete.
Currently, there is no standardised guideline or proposed methodology for assessing printable concrete mixtures and materials, nor any well-defined criteria of acceptability for this type of concrete [
8]. In other words, no comprehensive set of performance requirements or test methods for printed mixtures exists. Some authors have proposed a laboratory testing framework for freshly printed concrete mixtures [
8], but corresponding data for hardened printed concrete remain very limited.
In tests using gypsum-cement-based powder, discrepancies in compressive strength were observed between cube specimens of 70.7 mm and 50.5 mm and half-beam samples of 160 mm × 40 mm × 40 mm. Smaller cubes (50.5 mm) exhibited higher strength, possibly due to differences in curing time, while larger specimens required longer print durations, affecting stability and quality. The half-beam samples showed the lowest compressive strength, possibly due to variations in testing methods or issues like nozzle clogging during the extended print time required for 160 mm samples [
9].
A previous study also compared the properties of 3D-printed concrete samples with those of identically formulated mixtures cast on a vibrating table [
10], using a custom-designed laboratory printer. The mixtures, based on Portland cement, included various mineral additives: ground granulated blast-furnace slag, fly ash, limestone powder, and granite dust. The results showed lower density and compressive strength in printed samples due to the absence of vibration-induced compaction and less efficient particle packing. Notably, the most minor strength reduction occurred in mixtures with fly ash. The introduction of hardening accelerators (up to 4% of the binder mass) was suggested to improve the strength of 3D-printed elements in both compression and bending.
In another study, a geopolymer paste based on potassium silicate and metakaolin with added sand and local soil was tested for printability using a manual extrusion tool [
11]. Beam samples of 160 mm × 40 mm × 40 mm were cast from the developed mixture for strength testing. However, the study did not assess concrete that had been printed directly.
Additional investigations used X-ray computed tomography to evaluate aggregate distribution uniformity in 3D-printed concrete. Cylindrical samples were produced by casting, and additional cores were cut from the printed layer and nozzle output using a cartridge-type 3D-printing extruder [
12]. The results confirmed inhomogeneous aggregate distribution within both the printed layer and the nozzle, emphasising the need for further studies to distinguish the mechanical behaviour of lab-prepared printable mixtures versus actual 3D-printed concrete components.
Thus, further research is required to validate the use of these developed mixtures in large-scale 3D concrete printing (3DCP) systems [
13].
Table 1 summarises previous findings on 3D-printed concrete elements.
Recent reviews and studies, including those focused on the incorporation of industrial waste and the development of cement-free mixtures for 3D concrete printing, still do not provide a clear understanding of the compressive strength of concrete in structural elements produced directly via 3D printing [
18,
19,
20,
21,
22,
23,
24].
Quality control of 3D-printed concrete elements remains an open question and requires further research. It is well known that the quality of concrete structures can be assessed using both destructive and non-destructive testing methods. The most widely used approach is destructive testing, which involves loading specimens to failure under controlled conditions. These tests are highly illustrative, allowing for detailed analysis of material behaviour and the identification of design flaws. However, for small production batches of structural elements, destructive testing can significantly increase costs and does not allow for individual quality assessment of each component.
One known non-destructive technique is the pull-out method, which determines the concrete strength based on the force required to extract an embedded anchor device from the concrete matrix [
25]. A similar technique is the splitting-tensile pull-out method, where an anchor device connected to a testing instrument is embedded in the concrete. The procedure includes drilling a core hole, creating a concentric annular groove to define the sample depth, inserting the anchor, and applying load until the sample fails. The strength is then calculated using an established formula [
26]. Limitations of these methods include their inapplicability in heavily reinforced or thin-walled structures and the labour-intensive process of embedding anchors, particularly for evaluating deep layers of concrete.
Another well-known non-destructive technique is the ultrasonic pulse velocity method, which estimates concrete strength based on the speed (or travel time) of ultrasonic waves through the material. Strength values are determined via calibration curves developed from experimental testing of standard cubes and actual structures [
27]. A significant drawback of this method is the time-intensive nature of constructing these calibration curves. Additionally, the ultrasonic velocity is affected not only by the cement–sand–water ratio, but also by the type and content of coarse aggregates (e.g., gravel or crushed stone), limiting the accuracy of strength predictions.
There also exists a non-destructive testing method that utilises a hammer imprint on the concrete surface. The strength is estimated by comparing the resulting indentation with a calibrated scale on a measuring ruler [
28]. However, this method also has limitations (text in source incomplete).
Another commonly used approach in construction is strength testing using standard-shaped specimens, such as cubes or cylinders, extracted from hardened concrete. These samples are then tested under compression in a laboratory. The main drawback of this method is the need to core or saw standard-shaped samples from the structure, which requires portable cutting equipment and subsequent transportation to the lab. This process can compromise the integrity of the structure and reduce its load-bearing capacity.
A reliable prediction of concrete compressive strength is essential for the safe and durable use of structural members. Over the past decade, machine-learning techniques have attracted growing interest because they can detect relationships in large, heterogeneous datasets that are difficult to recognise using human reasoning alone [
29]. A recent survey of industrial concretes confirmed an “explosion” of data-driven studies devoted to strength forecasting and mix optimisation [
30]. Within the specific field of 3D printed concrete, Zhang et al. developed machine-learning models—artificial neural networks, decision trees, random forests, support-vector regression and linear regression—to predict both compressive and flexural strength from mixed experimental datasets; the random-forest model achieved correlation coefficients between 0.96 and 0.98, far surpassing traditional empirical formulas and thereby supporting more accurate deployment of 3D printing in construction [
31]. Hematibahar et al. extended the approach to high-performance and ultra-high-performance concretes, benchmarking seven regression schemes; partial least-squares, linear and Lasso regression delivered coefficients of determination above 0.92 while maintaining low absolute and root-mean-square errors [
32].
Machine-learning applications have since expanded beyond strength prediction to encompass durability appraisal and service-life monitoring. Recent studies deploy image-based convolutional networks to locate micro-cracks, graph-based models to forecast crack growth, and hybrid classifiers to anticipate erosion or chemical adhesion phenomena throughout a structure’s lifetime [
33].
Against this backdrop, the present research pursues a twofold objective. First, we conduct a systematic mechanical test programme on additively manufactured wall elements and their companion laboratory cubes to establish a reference database of physical-mechanical properties. Second, we develop and validate a predictive framework that converts the strength of cast specimens into the in situ strength of three-dimensionally printed concrete—thereby eliminating the need for destructive coring and allowing real-time adjustment of printing parameters. The study is organised in two phases: an experimental phase, comprising a series of compressive tests at multiple ages, and a modelling phase, where machine-learning regressors are trained to translate laboratory results into reliable field estimates for 3D-printed structures.
2. Materials and Methods
2.1. Raw Materials
Portland cement concrete remains the most viable material for widespread use in automated construction processes both now and in the foreseeable future [
8]. Therefore, in this study, the investigated concrete mixtures were based on ordinary Portland cement. A total of five different mixture compositions were prepared and tested. The compressive strength of each composition was evaluated at three curing ages: 7 days, 14 days, and the design strength age of 28 days.
For the development of printable concrete compositions suitable for use with a construction-scale 3D printer, Portland cement CEM I 52.5H, produced by the Bukhtarma Cement Company LLP (Bukhtarma, East Kazakhstan, Republic of Kazakhstan), was used as the primary binder. This cement complies with the requirements of the relevant standard [
34]. The chemical and mineralogical compositions of the cement are presented in
Table 2 and
Table 3, respectively. The results of the cement performance tests are provided in
Table 4.
Sand classified as Class II according to the standard [
35] was used as the fine aggregate. The sand had a fineness modulus of 2.5, a bulk density of 1400 kg/m
3, and a proper density of 2250 kg/m
3.
The water used for mixing the concrete conformed to the requirements of the standard [
31]. The content of organic surfactants, sugars, or phenols did not exceed 10 mg/L each. The water was free from oil films, fats, and oils and contained no colouring impurities. Its oxidisability was 14 mg/L, and the pH value was 7. The water contained no impurities in quantities that would adversely affect the setting time and hardening of the cement paste or concrete or reduce the concrete’s strength and frost resistance.
The concentrations of dissolved salts, SO
42− and Cl
− ions, and suspended particles in the mixing water did not exceed the permissible limits specified in
Table 5.
To accelerate hardening and improve the physical and mechanical characteristics, a chemical admixture—plasticiser/hardening accelerator Master Rheobuild 1000 (Rheobuild 1000 K) produced by Master Builders Solutions Kazakhstan LLP (Almaty, Republic of Kazakhstan) —was used. This admixture is considered one of the most effective and accessible additives on the construction market in East Kazakhstan.
2.2. Characterisation of Raw Materials and Experimental Samples
The chemical composition of the raw materials was determined by spectral analysis using an inductively coupled plasma mass spectrometer (ICP-MS, 7500cx, Agilent Technologies, Santa Clara, CA, USA) and conventional chemical analysis methods. The phase composition of the raw materials and the hydration products was examined using X-ray diffractometer X’Pert PRO manufactured by the company “PANalitical” (The Netherlands). Structural analysis was conducted using a scanning electron microscope (Scanning electron microscope JSM-6390LV manufactured by «JEOL Ltd.» (Japan) with the INCA Energy Penta FET X3 energy dispersive microanalysis system of «OXFORD Instruments Analytical Limited» (Great Britain) with an energy-dispersive microanalysis system. The specific surface area was determined using the gas permeability method of Kozeny–Carman on a PSX-10a instrument (CKIC, Changsha, China), following the manufacturer’s instructions. Physical and mechanical tests were conducted using standard procedures.
2.3. Concrete Mix Design and Fabrication of Experimental Samples
The concrete mix design for 3D printing using additive manufacturing technology was developed in accordance with the standard [
32]. Preliminary mix compositions were first calculated theoretically using the absolute volume method. Following the theoretical design, trial batches were prepared in laboratory conditions to validate the printability and performance of the proposed mixtures.
For mix composition Nos. 3, 4, and 5, a technogenic mineral additive (TMA) was introduced. In mix No. 3, TMA replaced 9% of the cement content; in mix No. 4, it replaced 27% of the fine aggregate (sand); in mix No. 5, it replaced 9% of the cement and 27% of the sand.
The material consumption based on theoretical calculations and the characteristics of the prepared mixtures is presented in
Table 6.
As a result of trial batches, it was decided to adjust the compositions. As a result of the adjustments, five (5) mixture compositions were selected, the recipes and characteristics of which are presented in
Table 7.
2.4. Fabrication of Structures and Sampling for Control Specimens
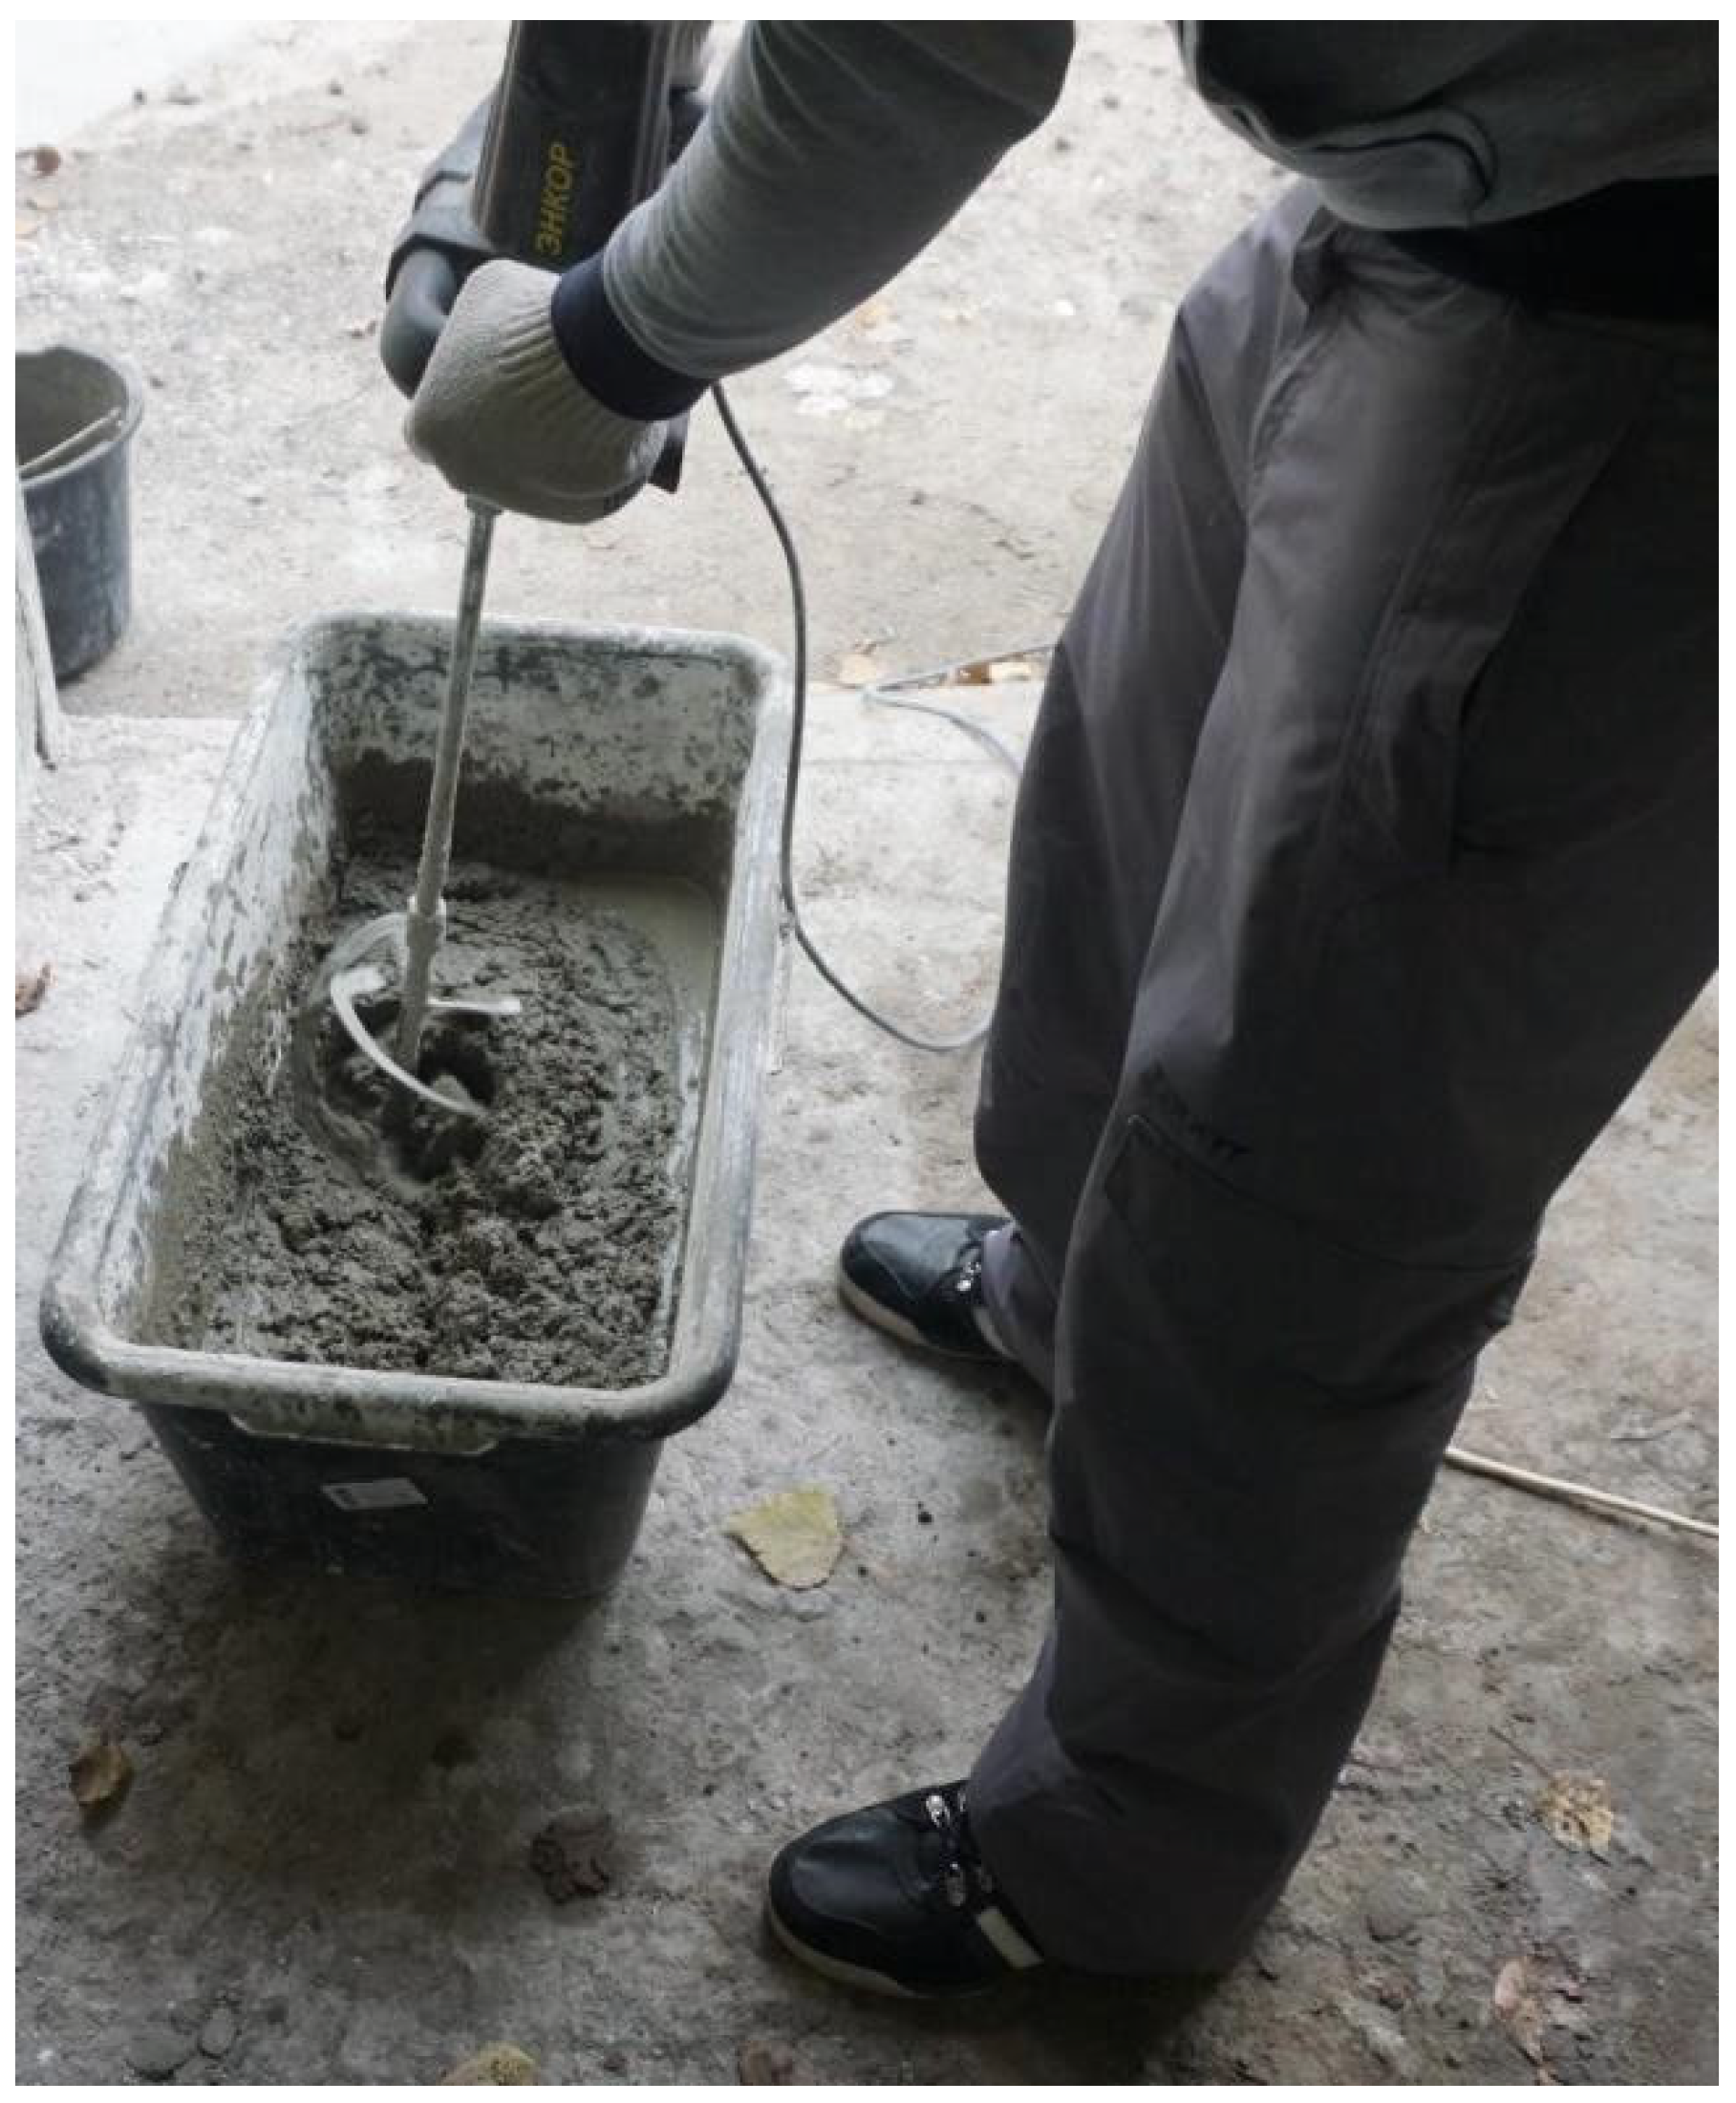
In laboratory conditions, at the Additive Technologies Section of the Competence and Technology Transfer Centre in Construction of the D. Serikbayev East Kazakhstan Technical University (EKTU), a wall-type structural fragment (Type 1 block) was printed using each of the developed concrete mixtures. The mixes were prepared manually in the following sequence: the aggregate was thoroughly mixed with cement using a low-speed (500 rpm) spiral-blade electric mixer until the binder was evenly distributed in the mixture (for 3–4 min), as shown in
Figure 1.
Next, water containing a pre-dissolved plasticiser was added to the mixture. After adding the water, mixing was continued for another 5–6 min.
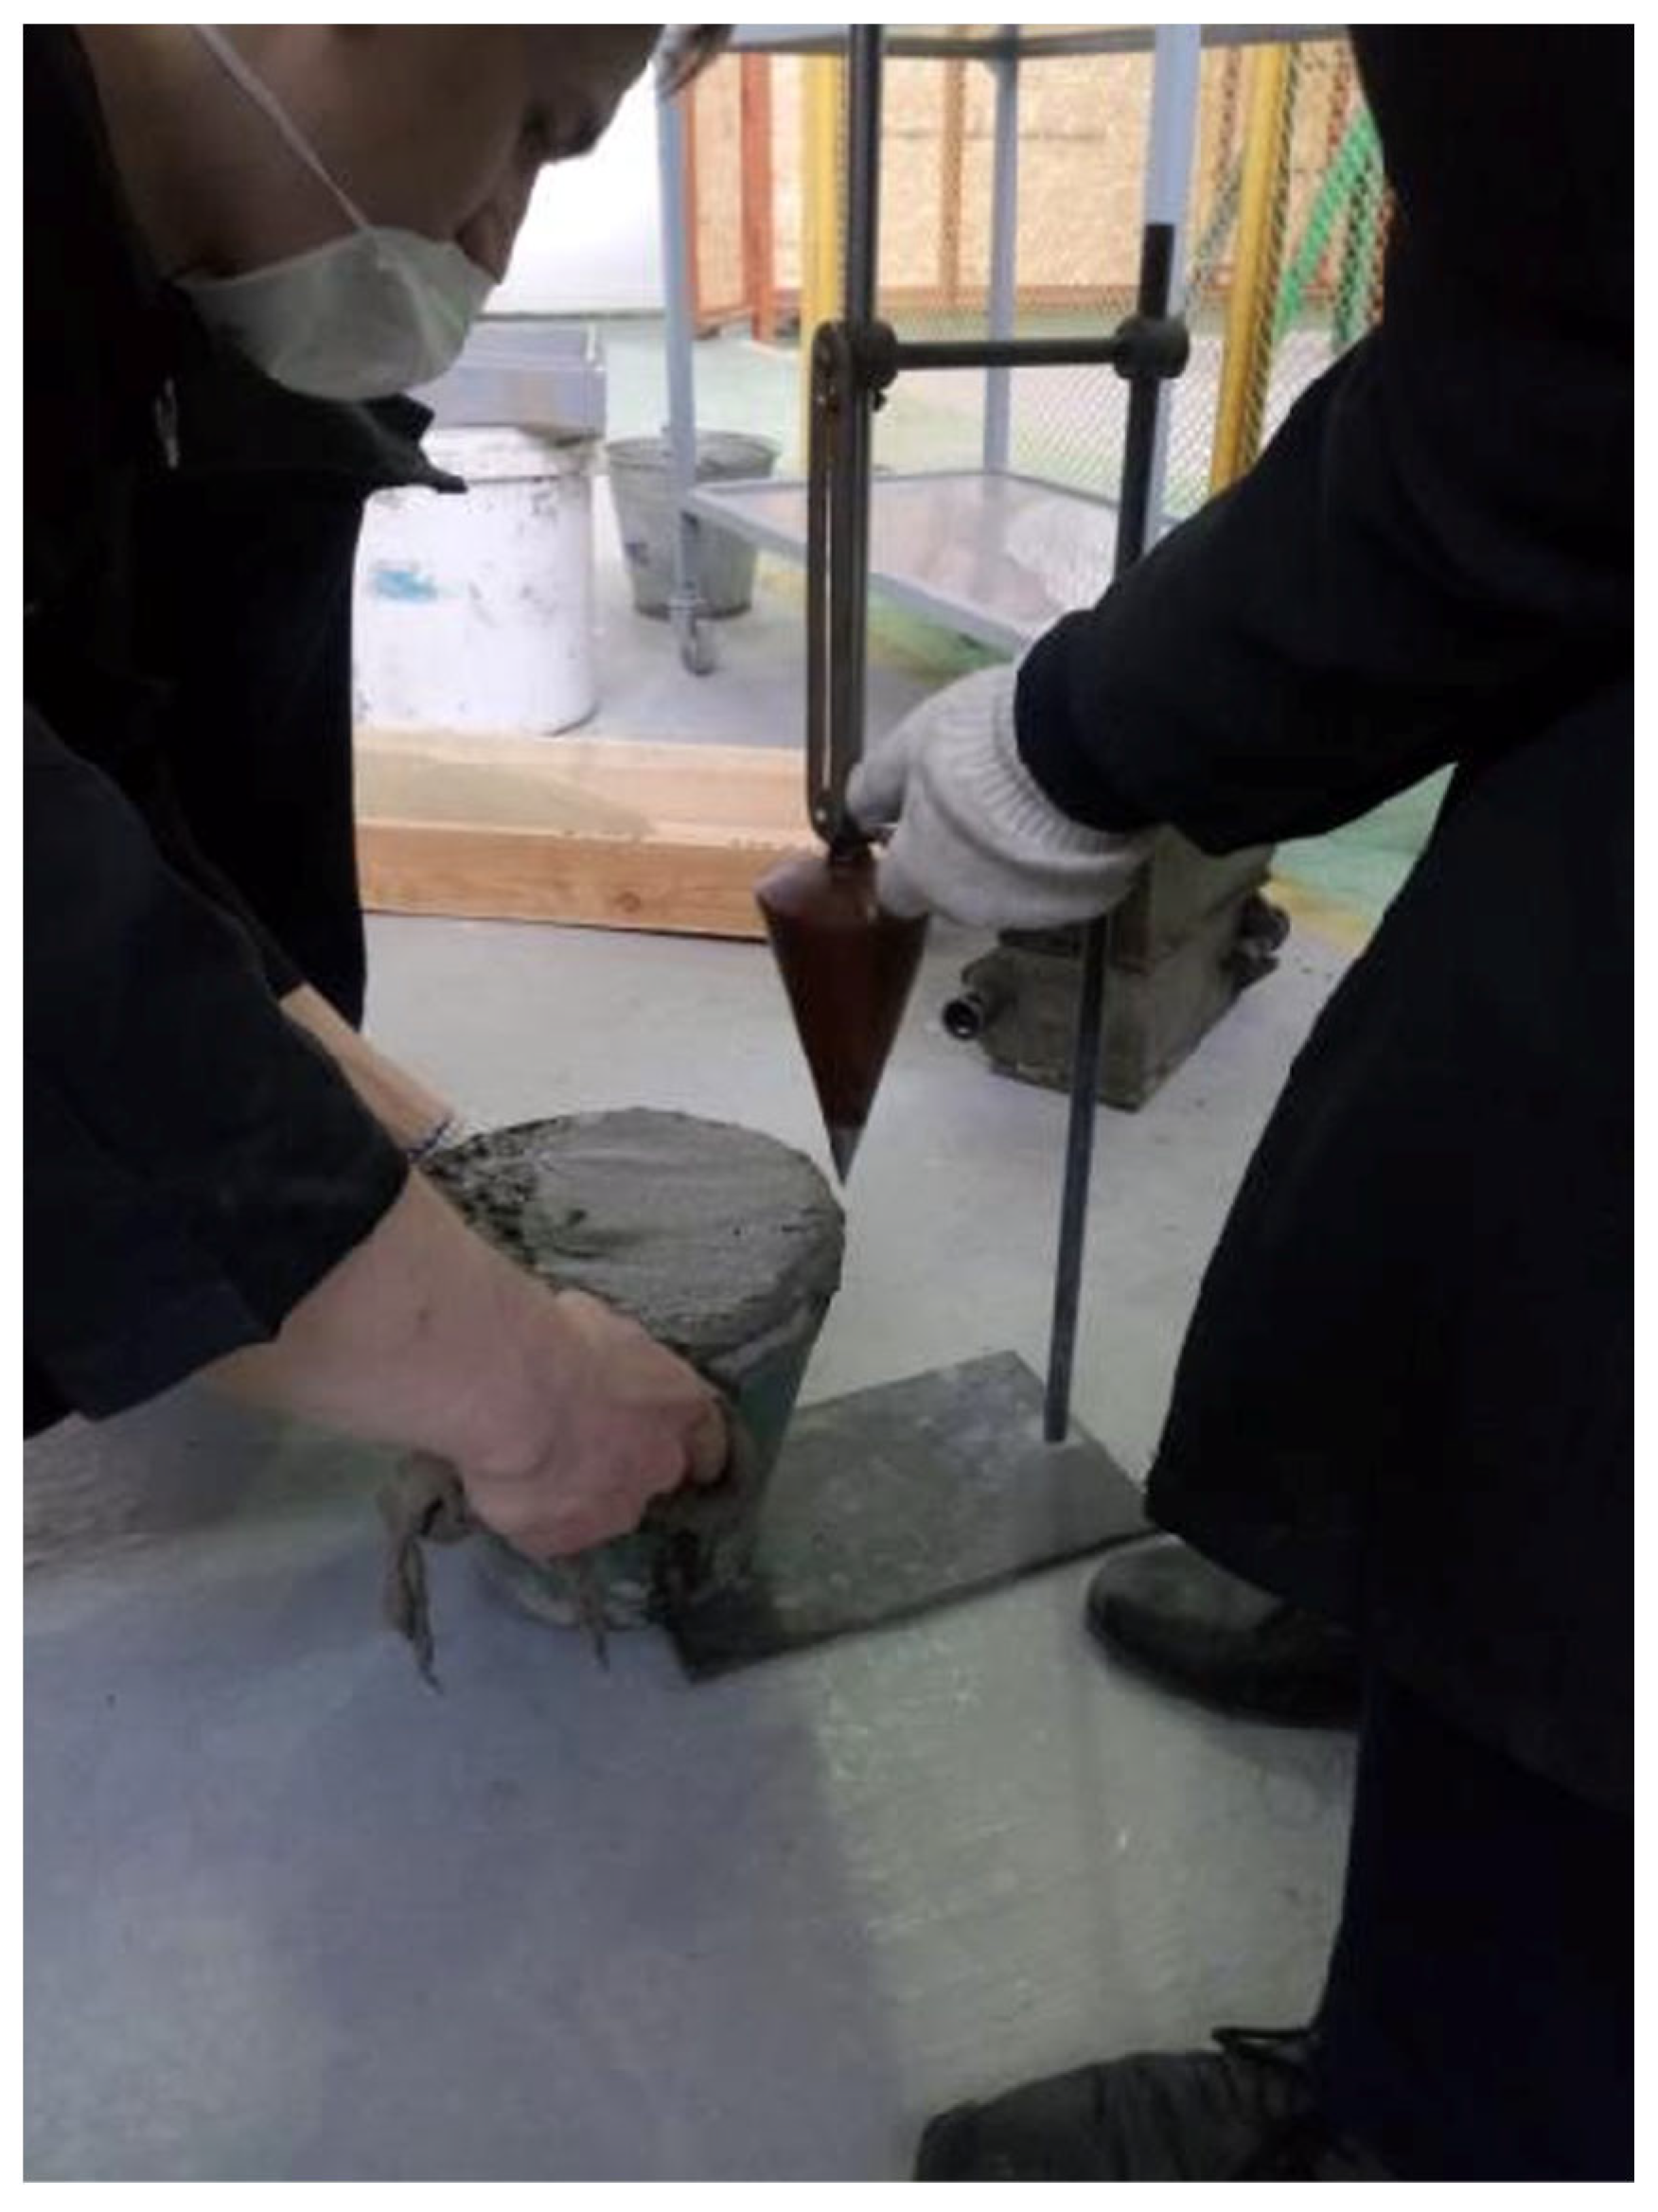
To control the workability of the fresh concrete mix, a portion of the batch was placed into a standard slump cone, and the slump depth was measured in centimetres (
Figure 2).
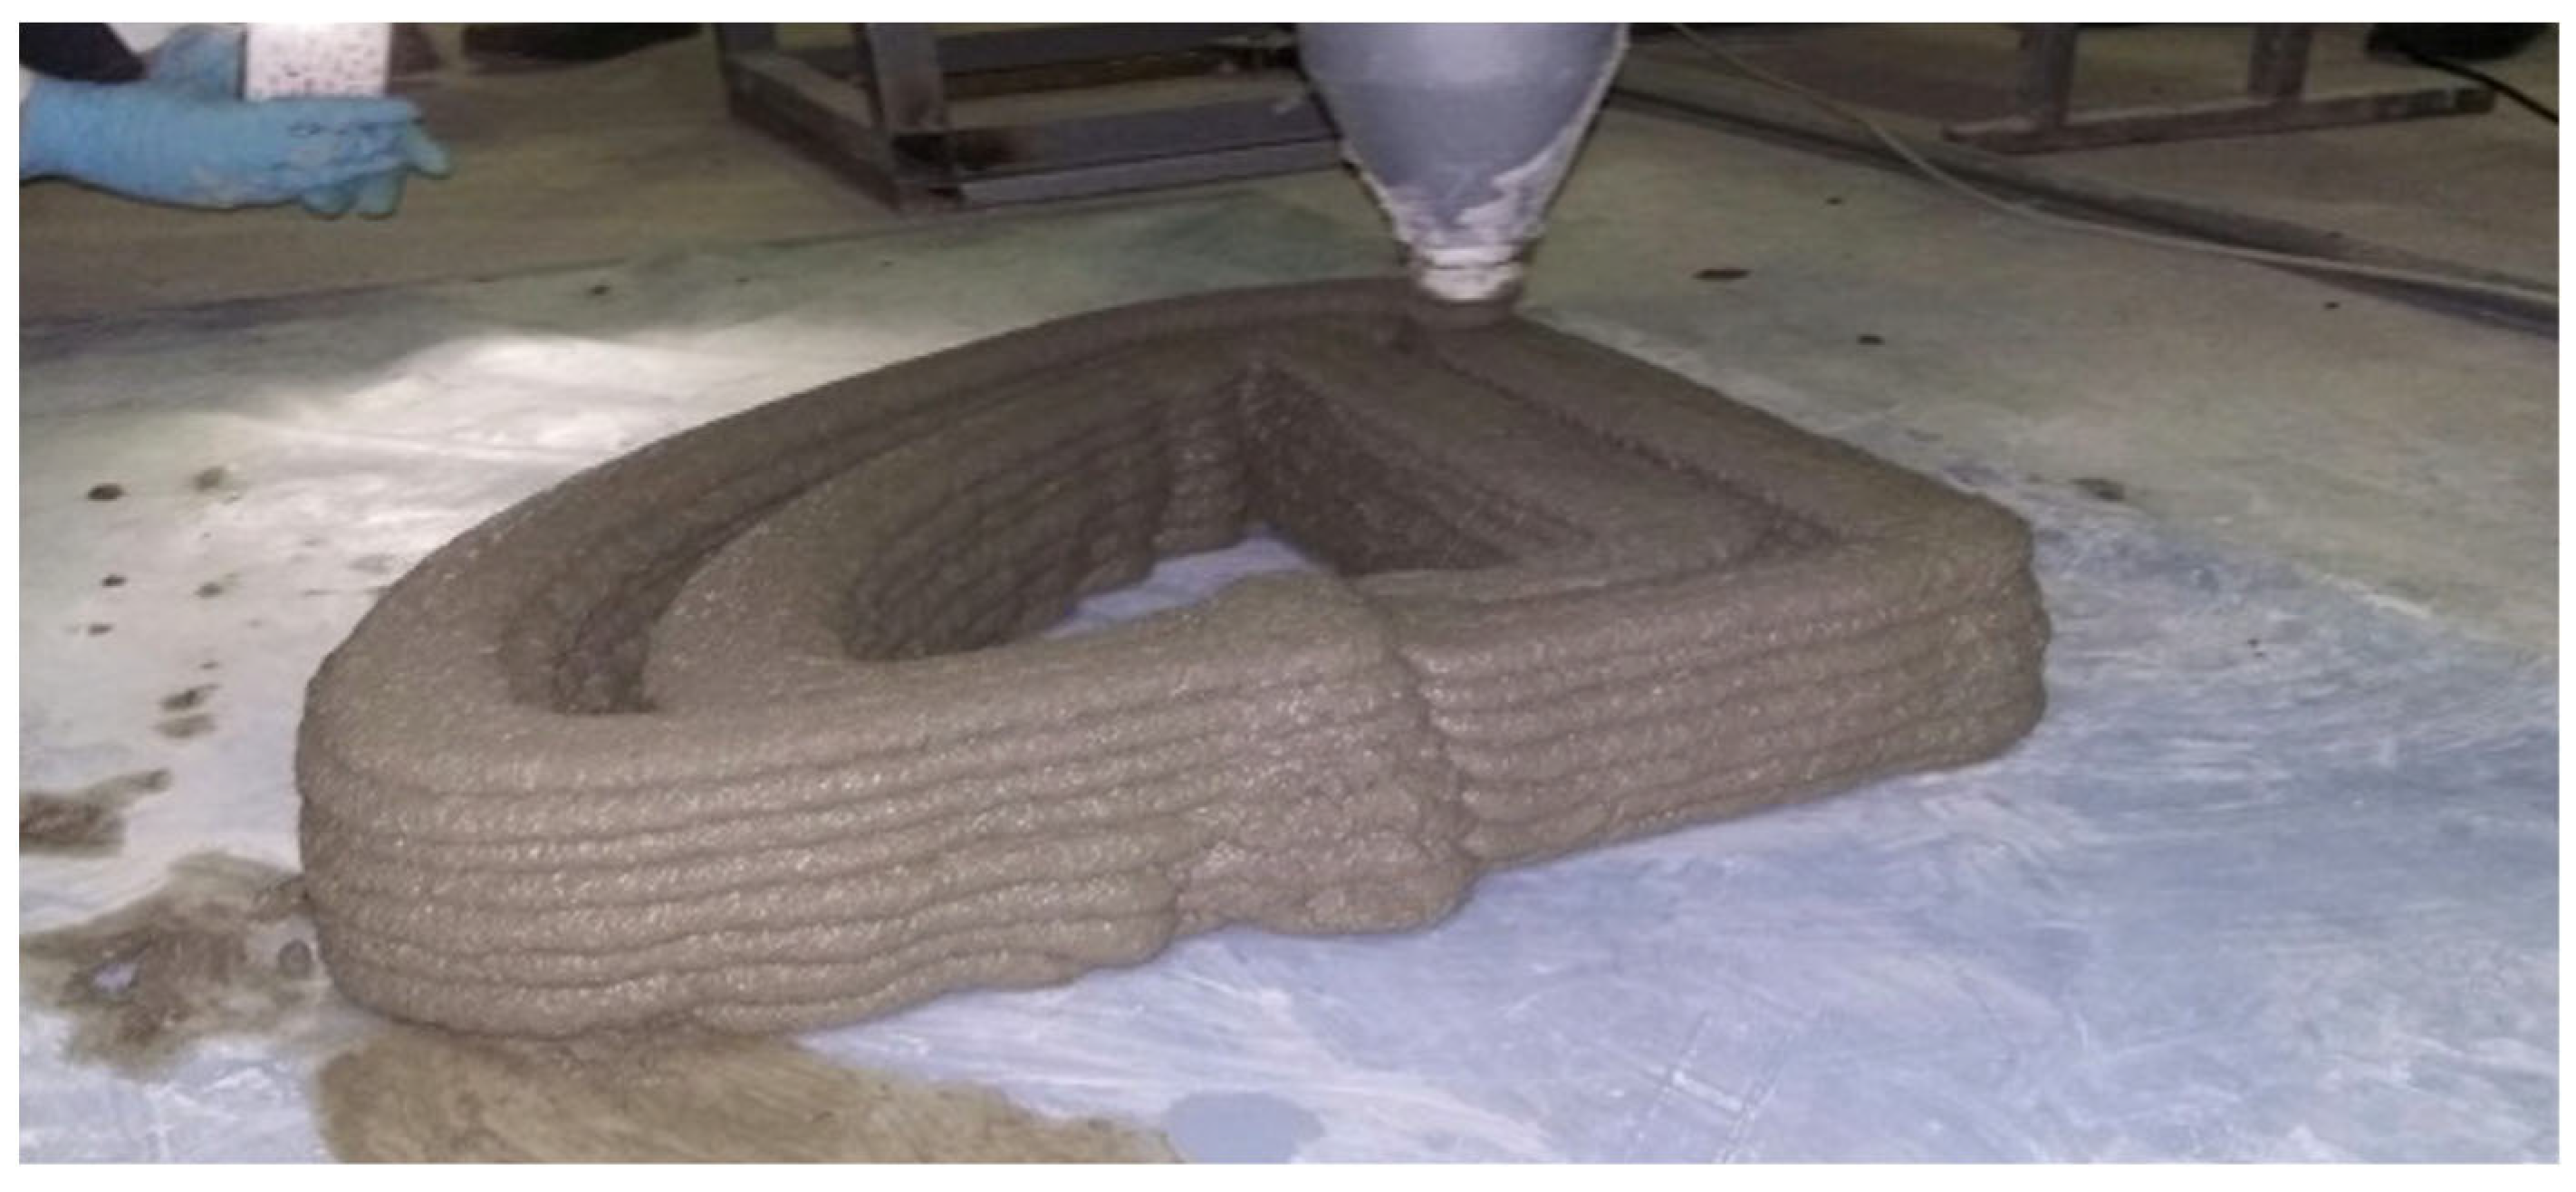
If the slump met the printer manufacturer’s requirements—specifically, a slump between 8 and 10 cm—the mixture was loaded into the screw-type hopper of the printer’s printhead, and printing of the designated structural element was initiated according to the defined dimensions (
Figure 3).
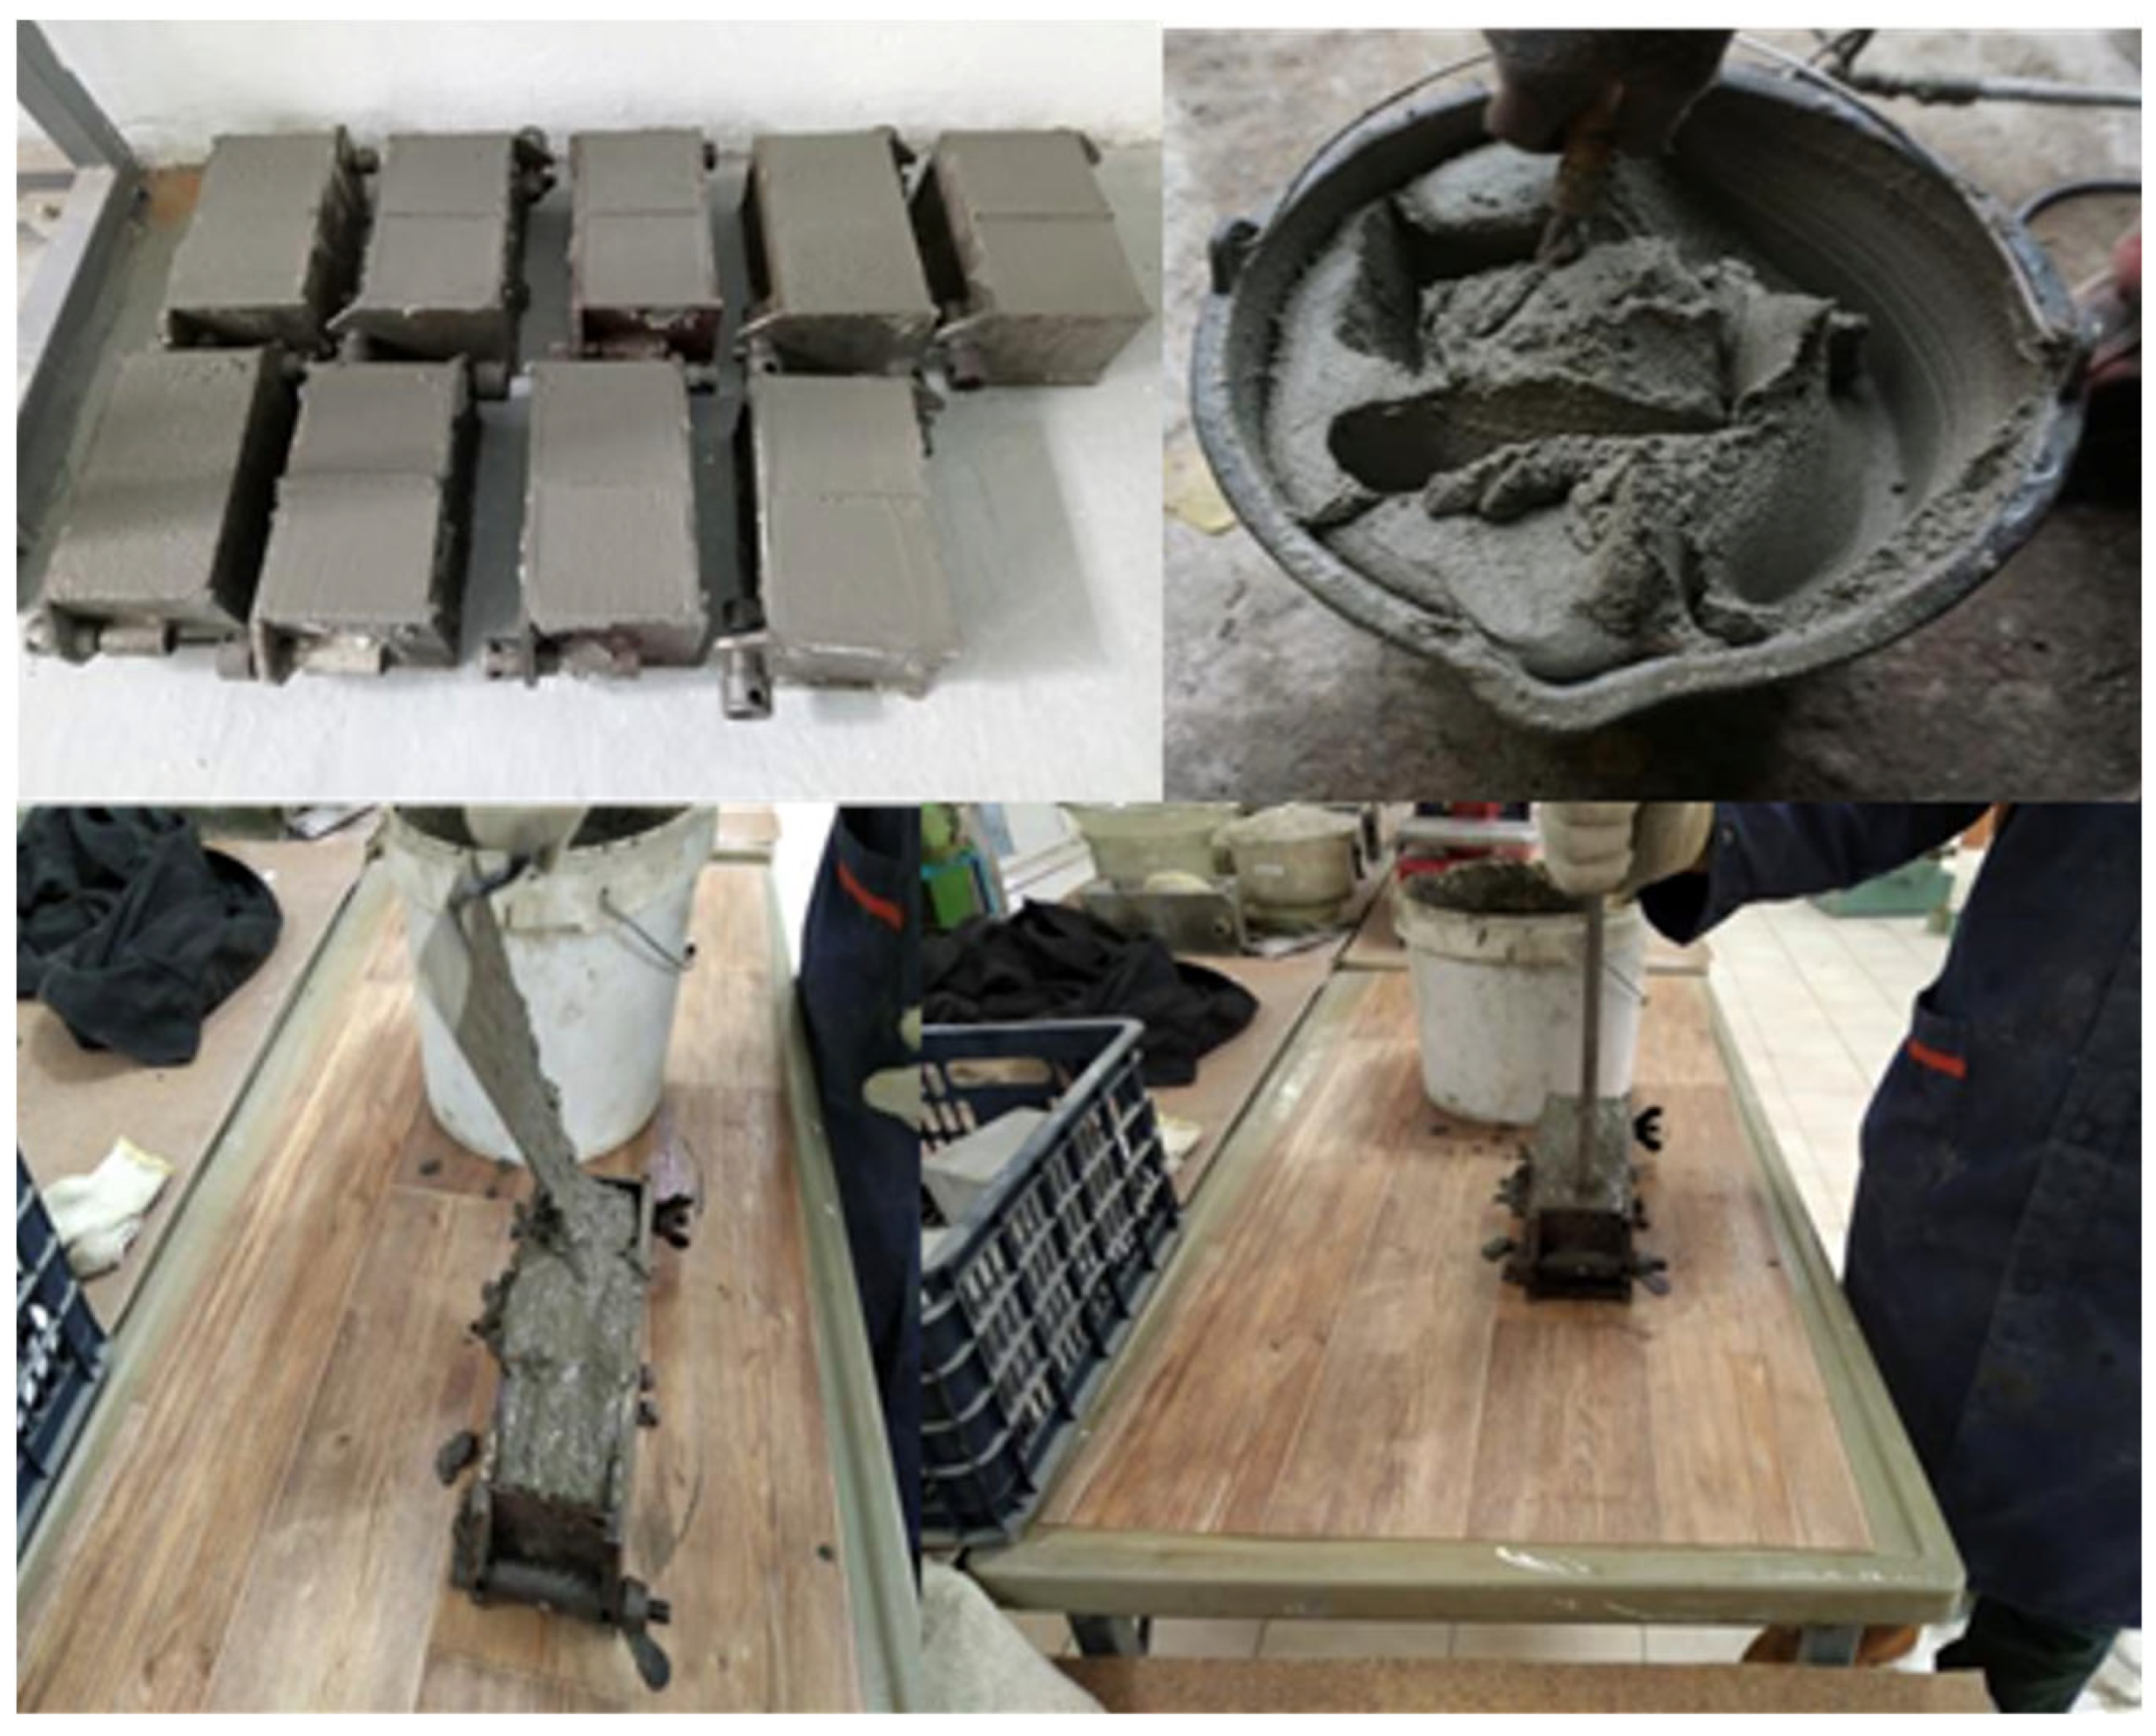
At the midpoint of the printing cycle, a sample of the concrete mixture was taken to fabricate control specimens. Within 20 min of sampling, 12 cube specimens were produced for each mix design: four specimens each for testing at 7, 14, and 28 days of curing. The working mixtures were placed into pre-oiled moulds in layers and compacted manually. Compaction was carried out using a hand rodding method with a 16 mm diameter steel rod, moving from the edges of the mould toward its centre. Excess material on top was removed and smoothed with a trowel. The resulting specimens are shown in
Figure 4.
After 24 h, the specimens were demoulded (
Figure 5). All specimens were stored next to the printed structures under ambient conditions, without strict curing control, since it is difficult to maintain an optimal curing environment (20 ± 2 °C, 95 ± 5% relative humidity) for large-scale printed elements [
36,
37]. Both the specimens and the printed structures were labelled and left to cure until the designated testing days.
During the 28-day strength development period, daily monitoring of the ambient conditions was carried out. The temperature ranged between 18 and 24 °C and the relative humidity remained between 80 and 90%.
2.5. Physical and Mechanical Testing of Concrete Cube Specimens
To determine the average density and compressive strength of the concrete, standard testing procedures were followed in accordance with previous results [
38,
39,
40], using cube-shaped specimens with an edge length of 70 mm. For each concrete mixture, four specimens were tested at curing ages of 7, 14, and 28 days.
Prior to testing, all specimens were visually inspected for surface defects. None of the samples exhibited significant deviations or cracks. Minor surface imperfections, such as burrs along the cube edges, were removed using an abrasive stone. Following the inspection, the linear dimensions (length, width, and height) and the mass of each cube were measured.
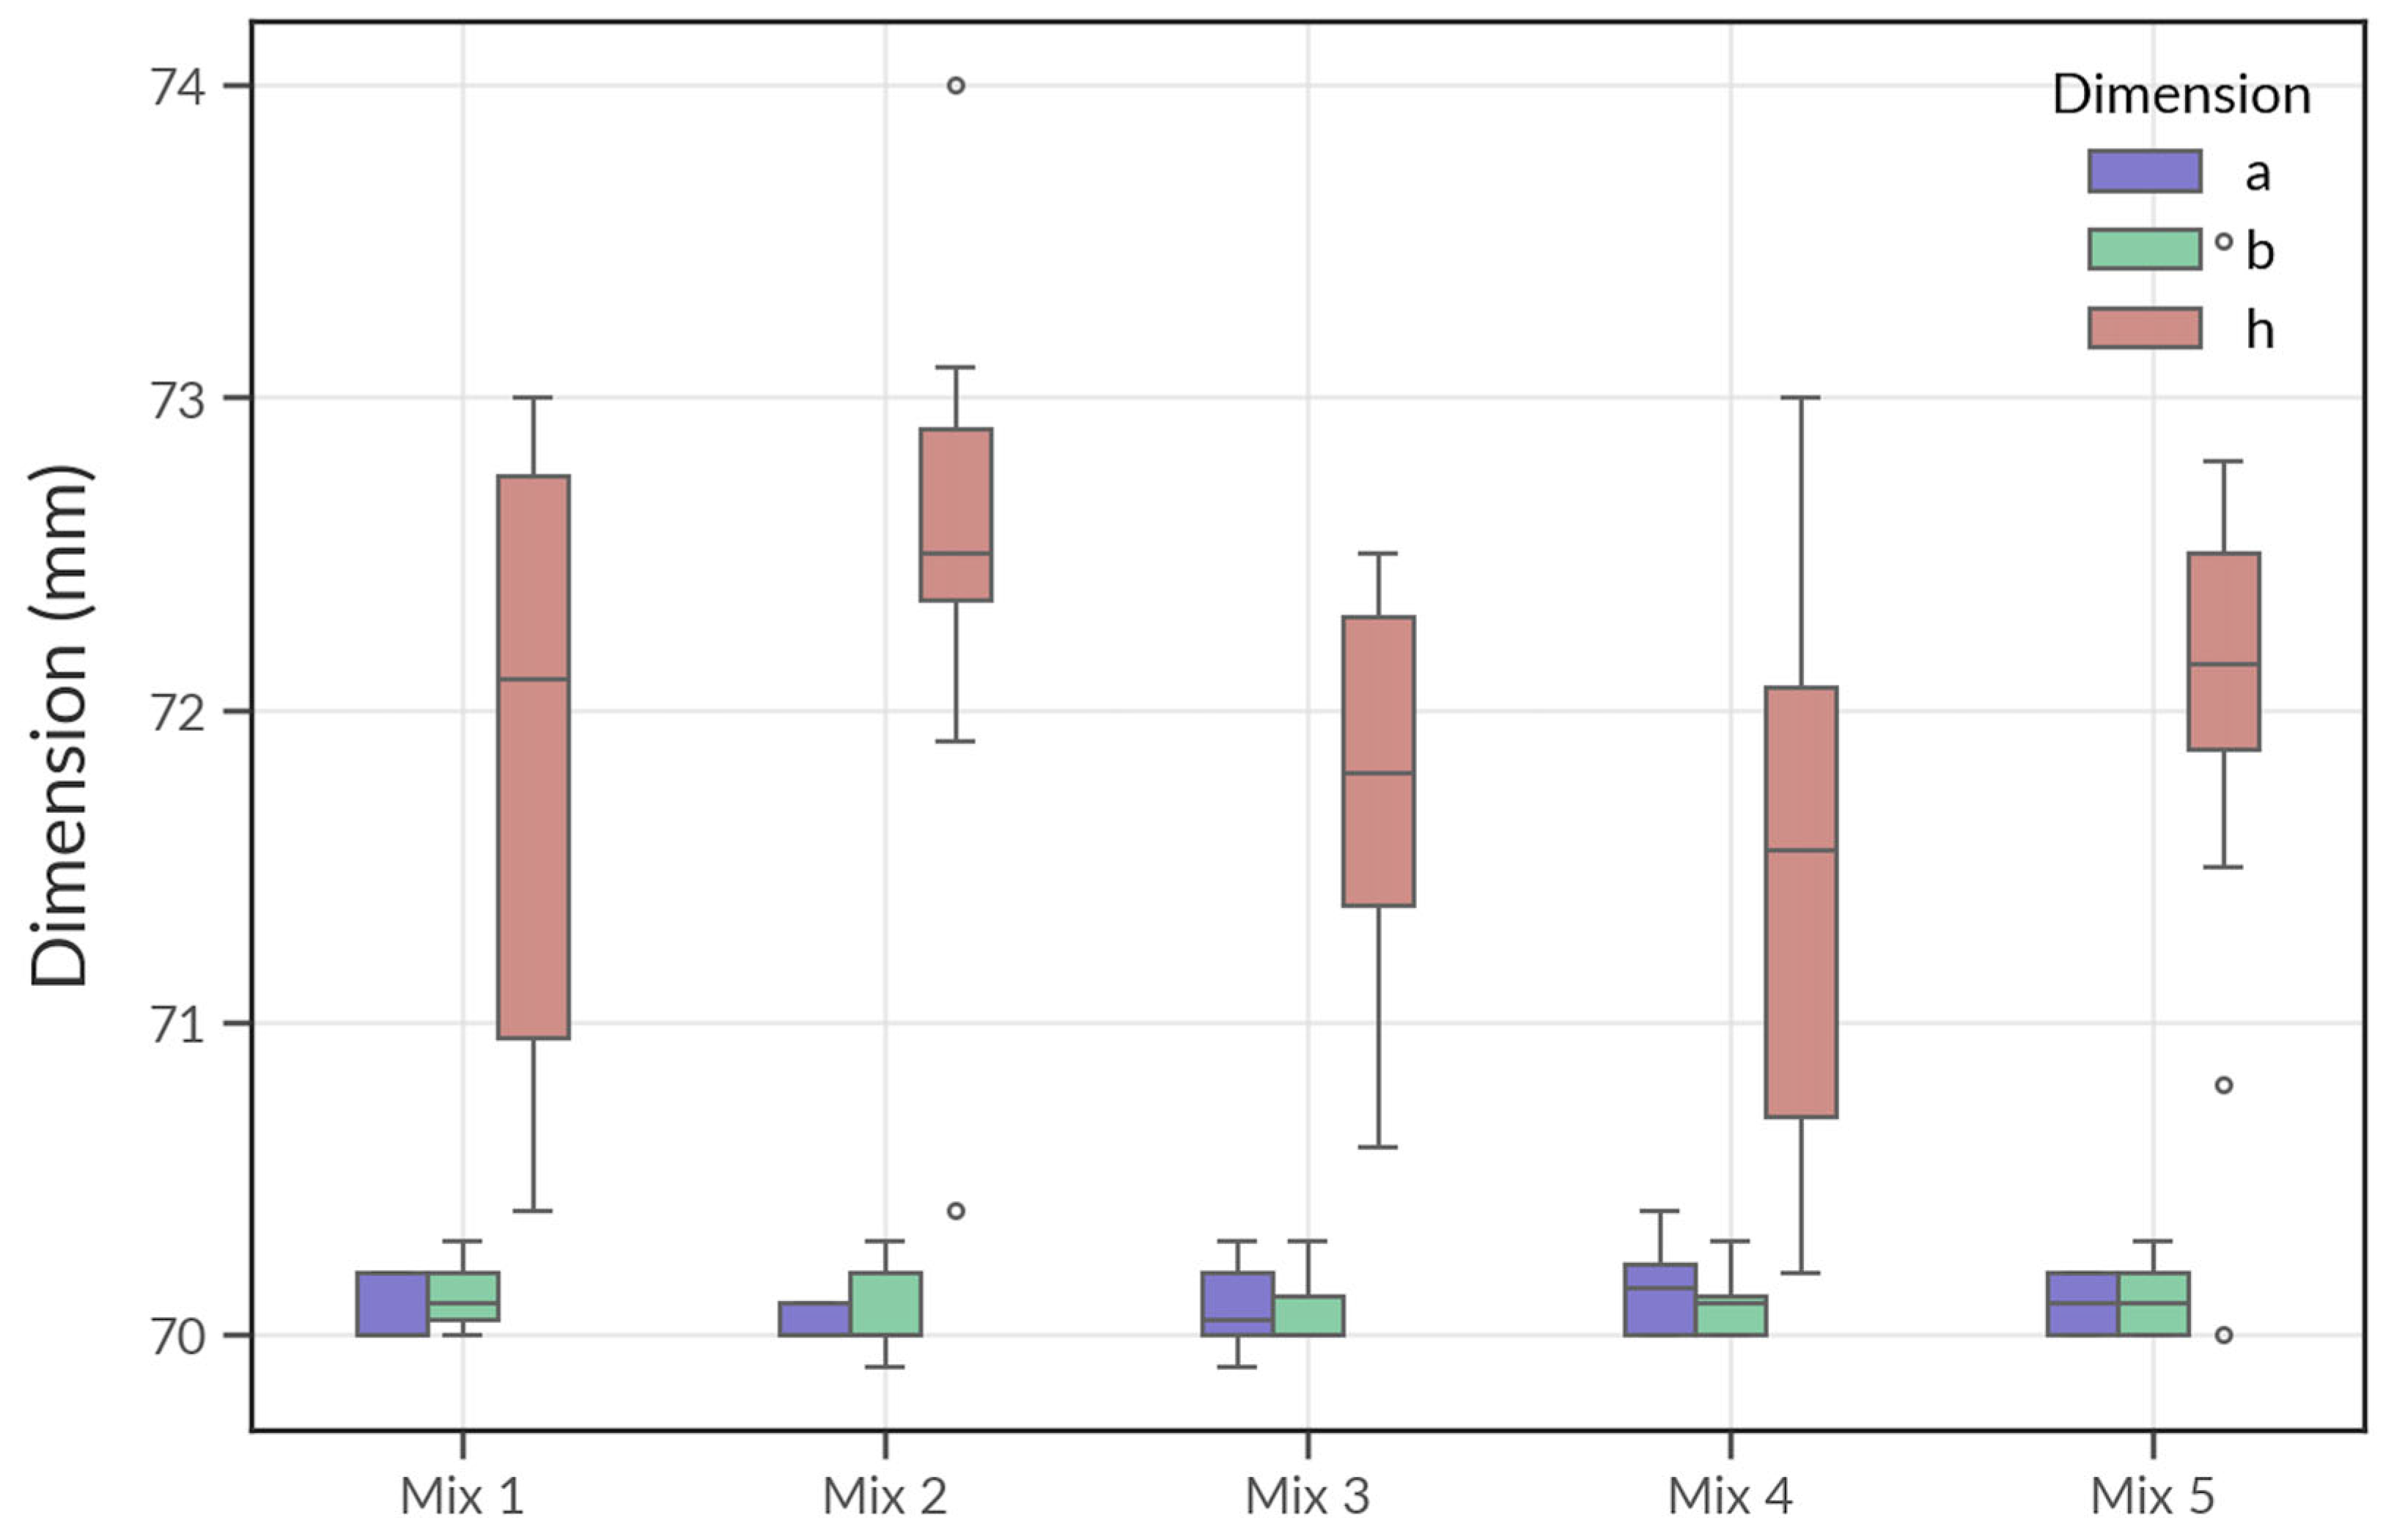
The statistical spread of dimensional values (a, b, h) for all five mix compositions is shown in
Figure 6, which illustrates the variation and consistency in the shape of the specimens prepared under the same printing and compaction conditions. The complete results of the dimensional and mass measurements are provided in
Table S1 in the Supplementary Materials.
As shown in
Figure 6, the boxplot illustrates the distribution of the measured dimensions—a (length), b (width), and h (height)—of the cube specimens prepared from all five concrete mixtures. The dimensions a and b remain relatively consistent across all mixes, with median values close to the nominal 70 mm and minimal variation, confirming the uniformity of the mould geometry and compaction during casting.
In contrast, the h dimension (height), which corresponds to the layering direction in the additive process, exhibits noticeably greater variability. This is especially apparent in Mixes 1 and 4, where the interquartile ranges are wider and outliers are more frequent. This vertical inconsistency is likely due to the influence of material flow properties, build-up stability, and manual layer finishing during the 3D-printing process.
The figure highlights the anisotropic nature of the 3D-printed concrete, where dimensional stability is better maintained in the lateral (x–y) directions than in the vertical (z) direction. These observations underscore the importance of quality control in the layer-by-layer deposition process to ensure structural uniformity in printed elements.
In addition to the dimensional stability, the mass of each cube specimen was recorded to assess the uniformity and density consistency across different mixtures. The distribution of mass measurements is visualised using violin plots in
Figure 7, where each plot represents the spread and central tendency of cube weights corresponding to one of the five mix compositions.
As illustrated in
Figure 7, Mix 2 exhibits the highest median mass (717.9 g), followed by Mixes 5 (710.3 g) and 3 (704.3 g). Mix 1 has the lowest median value (695.4 g), with a noticeably wider distribution, suggesting higher variability in specimen density and potential inconsistencies during casting or compaction. Mix 4, while showing a relatively narrow distribution, has a slightly lower mass than Mixes 2 and 5.
The observed variation in mass among mixes may result from differences in composition, inclusion of mineral additives (such as TMF), and printing stability. These factors influence the packing density and porosity of the material, which are critical to both mechanical performance and long-term durability.
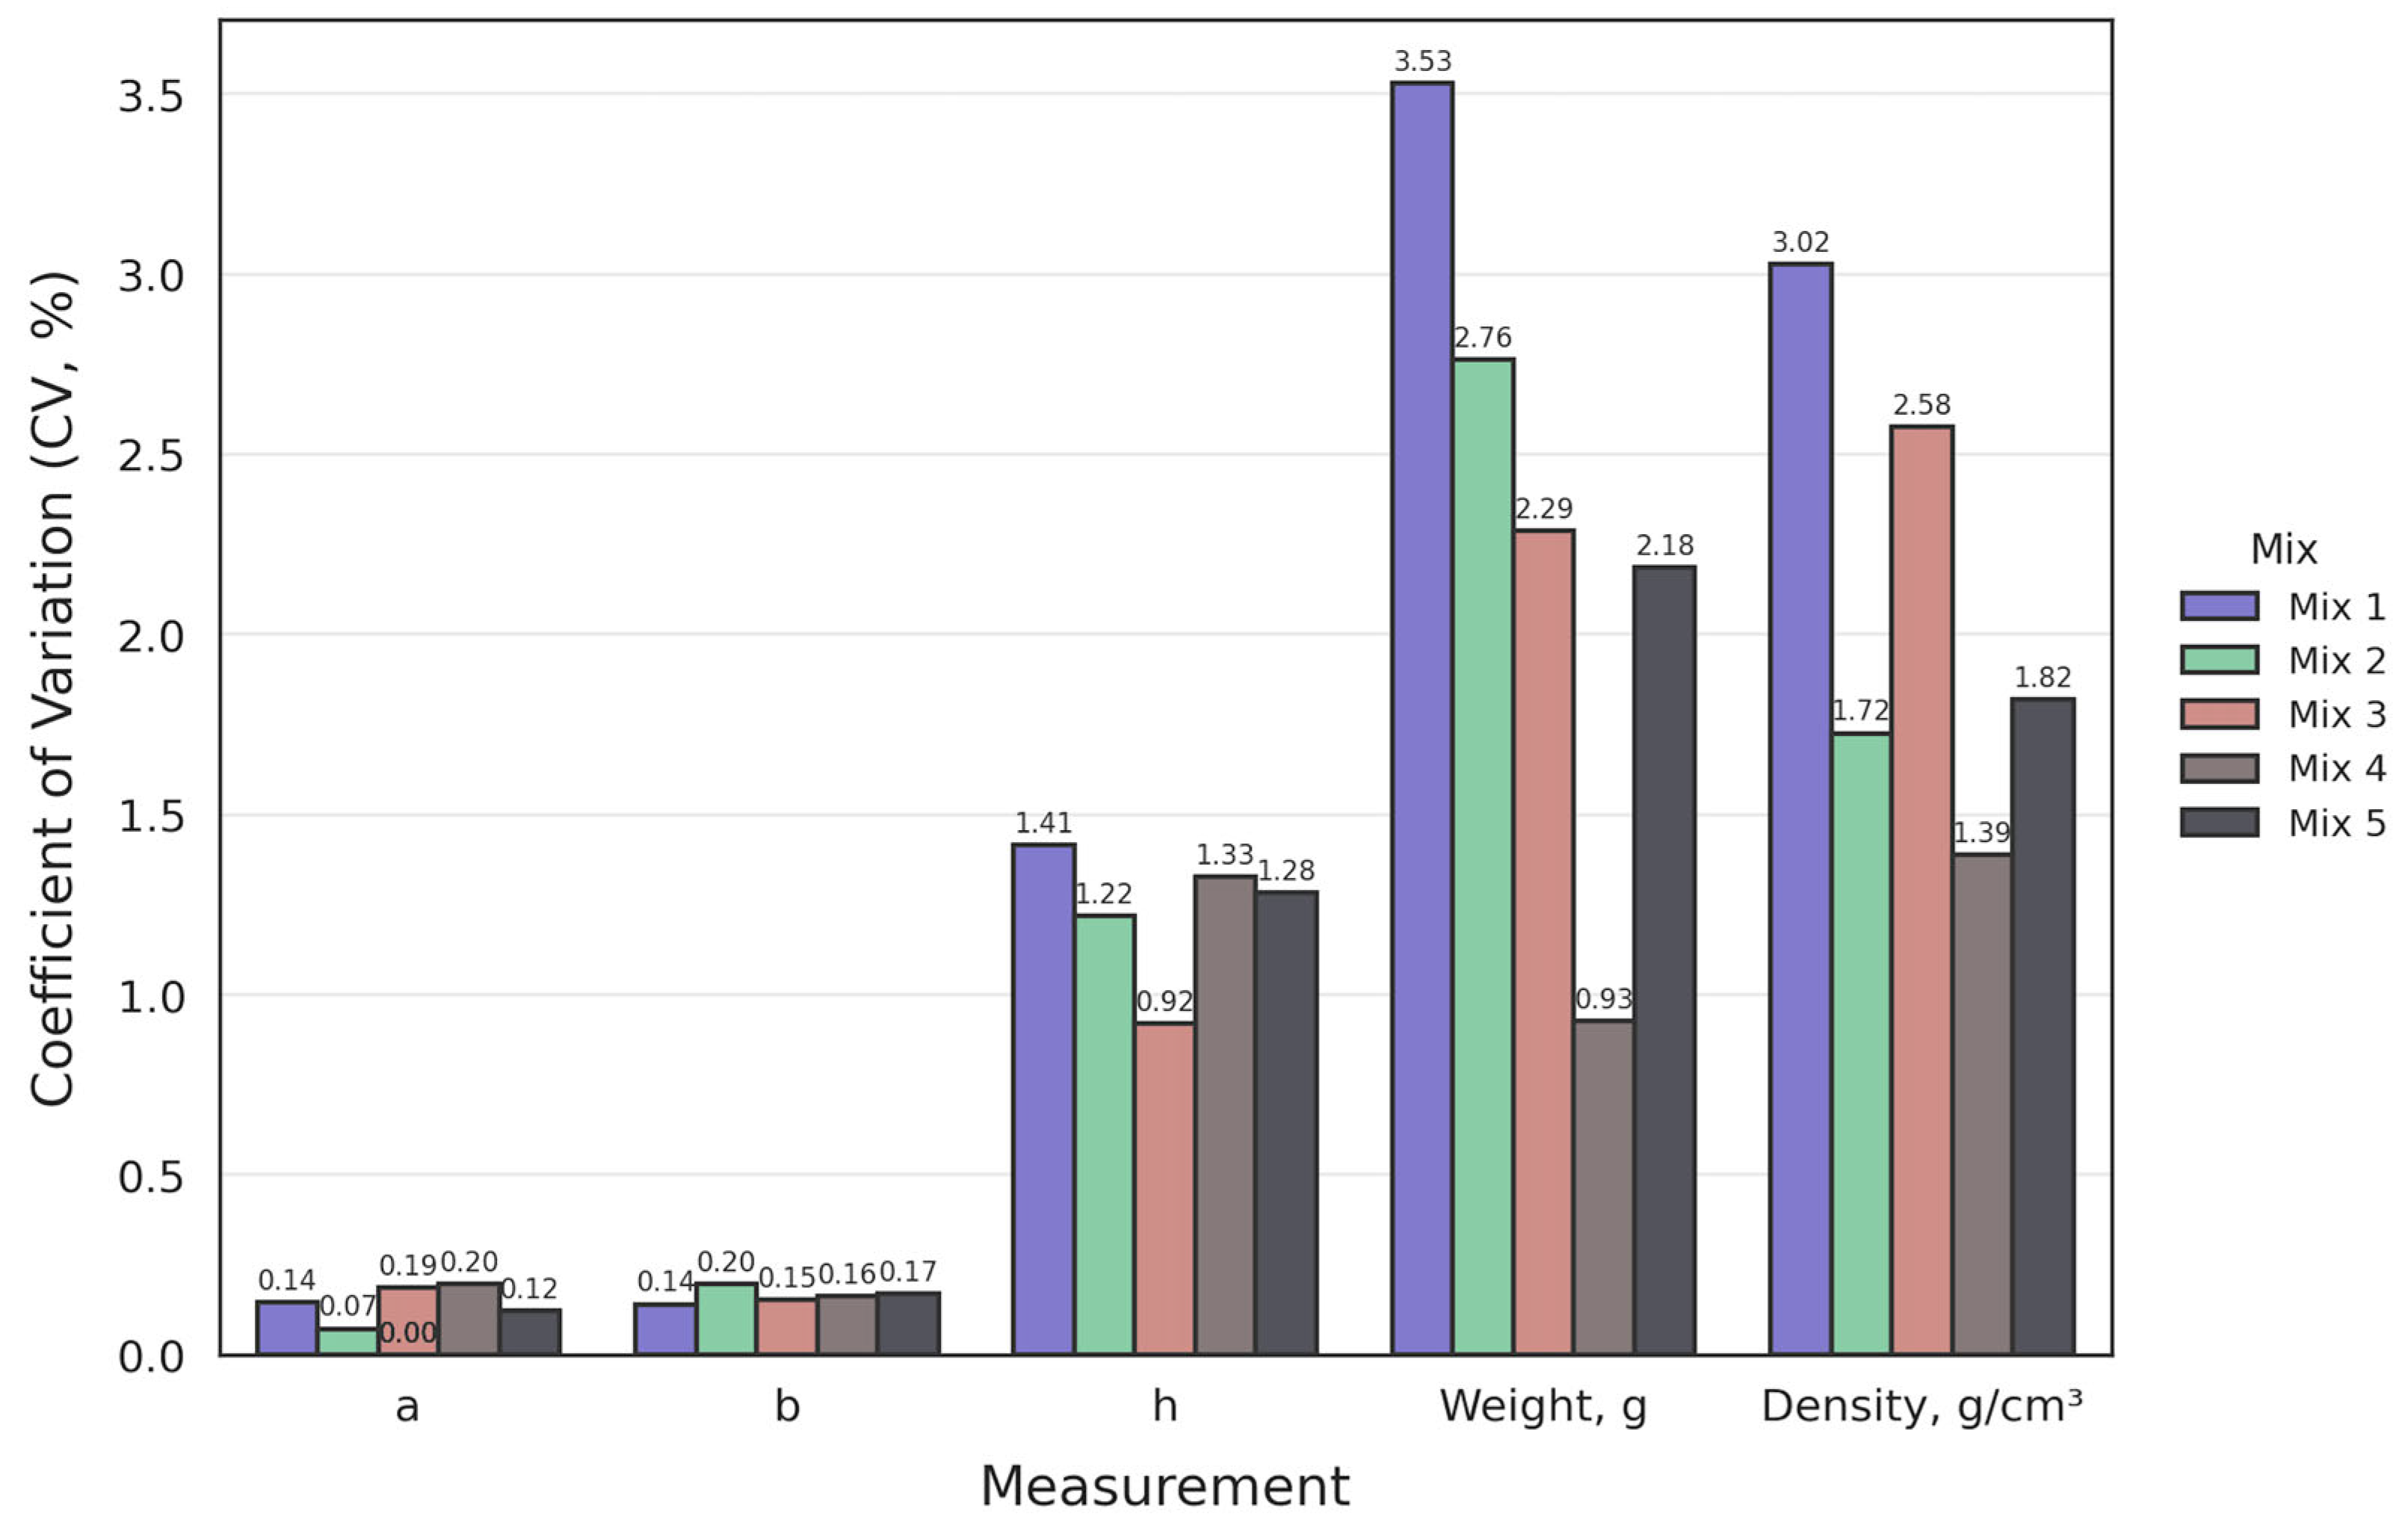
To evaluate the consistency of specimen geometry and material characteristics, the coefficient of variation (CV, %) was calculated for each mix composition based on five key parameters: dimensions a, b, and h; specimen mass; and calculated density. The CV provides a normalised measure of dispersion and is useful for comparing variability across datasets with different means. The results are summarised in
Figure 8.
As shown in
Figure 8, dimensional parameters a and b show minimal variation for all mixes, with CV values generally below 0.2%, confirming high precision in mould fabrication and placement. However, the h dimension (vertical height) demonstrates greater variability, particularly in Mix 1 (1.41%) and Mix 3 (1.33%), likely reflecting inconsistencies in the layer deposition process during 3D printing.
The highest variability is observed in the mass and density measurements. Mix 1 shows the greatest fluctuation in mass (3.53%) and density (3.02%), indicating potential inhomogeneity or differences in compaction during printing. In contrast, Mix 3 and Mix 5 show lower coefficients of variation in these parameters, suggesting improved material uniformity and better control of the printing process. Overall, these findings reinforce the need for optimisation in print parameters and mix design to reduce variability and enhance reliability in 3D-printed concrete elements.
Table 8 presents detailed results from the compressive strength tests performed on concrete cube samples at different curing ages—7, 14, and 28 days. The data include individual specimen dimensions, maximum applied load, and both calculated and normalised compressive strengths. The observed strength progression across all mixes demonstrates consistent hardening over time, validating the reliability of the test procedure and the mechanical development of the printed elements. This table serves as a foundational reference for interpreting material performance trends across the tested mixtures.
2.6. Physical and Mechanical Testing of Core Samples Extracted from Printed Structures
The compressive strength of concrete cores extracted from the printed structures was determined using a standard methodology [
41]. On days 7, 14, and 28—parallel to the testing of cube specimens—core samples were extracted from the constructed elements using a diamond tunnel bit mounted on a manual core drilling rig (a hand-held electric drill equipped with a levelling indicator). Drilling was performed without water cooling, at low rotational speed.
From each printed element (made with a different mix composition), six core samples were extracted, each with a diameter of 28 mm. The samples were then trimmed (faced) using a dry-cut diamond saw.
In the next stage, the specimens were ground on a circular grinding machine to ensure surface parallelism, as this could not be adequately achieved during the initial trimming stage.
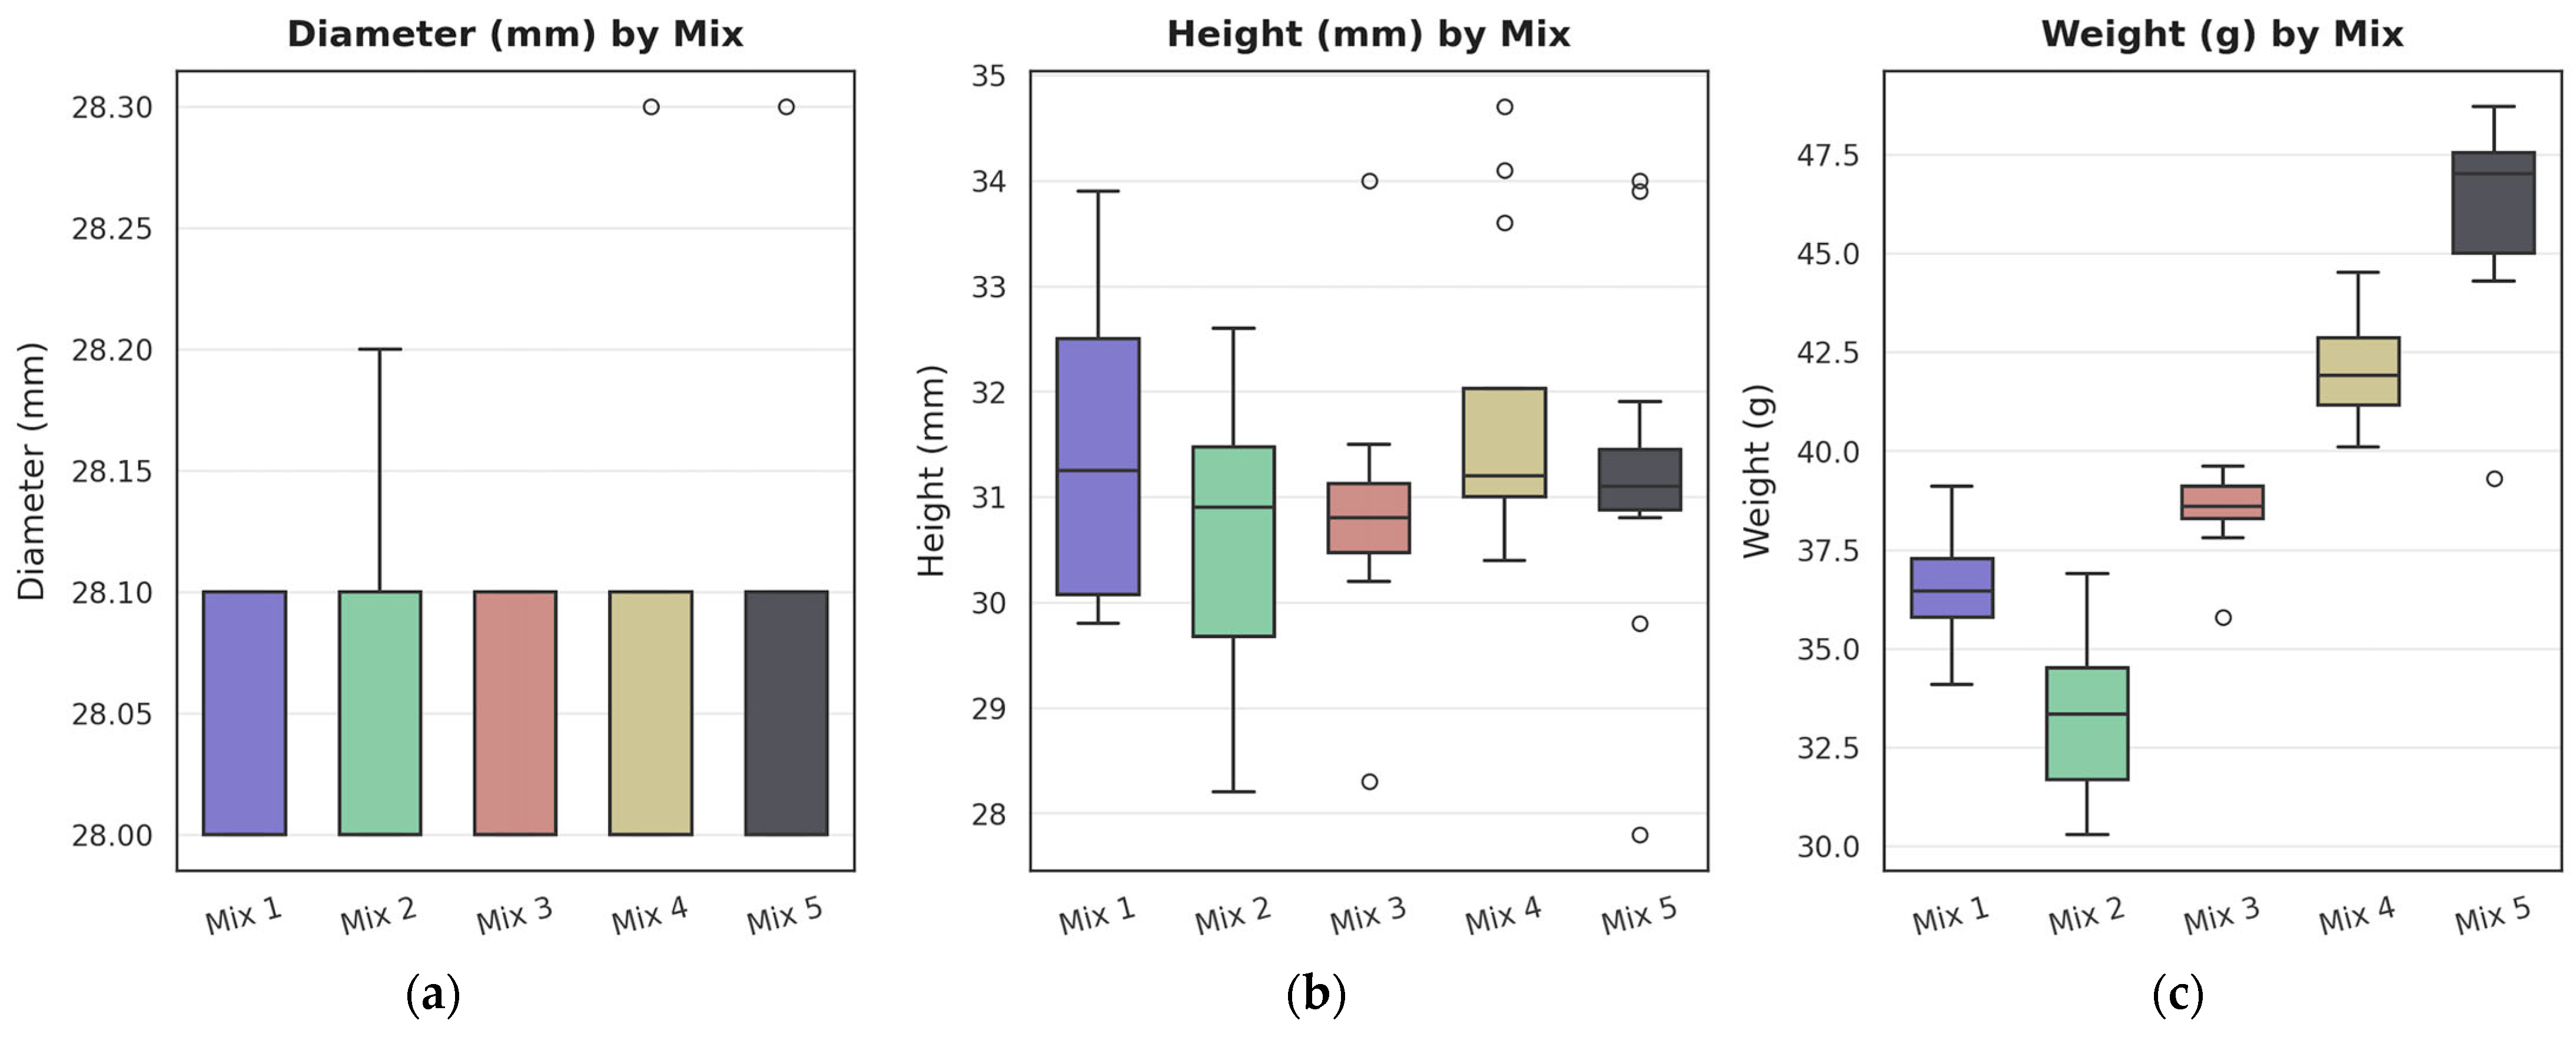
Before compressive strength testing, the core specimens extracted from the printed structures were visually inspected for defects. All samples were deemed acceptable, with no major irregularities observed. Minor burrs along the edges were removed using an abrasive stone. Following this, the linear dimensions (diameter and height) and the weight of the cores were measured. The summary of these measurements is presented in
Figure 9, which visualizes the results for all five concrete mixes. These values correspond to the data provided in
Table S2 (Supplementary Materials). Additional related variability results are shown in
Figure 10.
A pair plot analysis was conducted to further explore the relationships between the geometric and mass characteristics of the core specimens. This analysis allows for the visualisation of potential correlations between diameter (D), height (H), and weight across the five tested concrete mixes. The pair plot provides both bivariate scatterplots and univariate distribution curves for each parameter, disaggregated by mix composition. The dataset used corresponds to the results presented earlier in
Table S2 (Supplementary Materials).
As seen in
Figure 10, the diameter (D) measurements exhibit very narrow distribution ranges for all mixes, consistent with the use of a standardised 28 mm coring bit. No meaningful correlation is observed between diameter and either height or weight. However, height (H) shows a moderate positive relationship with weight across most mixes, indicating that increased specimen height generally corresponds to increased mass, particularly for Mixes 4 and 5.
The univariate distributions highlight that Mix 5 has the highest mean and narrowest spread in both height and weight, suggesting better consistency and compaction during printing. In contrast, Mix 2 displays a wider spread in both height and weight, with several lower outliers, indicating possible variation in printing or material homogeneity. The scatter between height and weight also shows more clustering for Mixes 3 and 4, suggesting more uniformity compared to the broader dispersion observed in Mix 1 and Mix 2.
These results confirm the findings of previous boxplots (
Figure 9) and provide deeper insight into the dimensional stability and mass consistency of the printed concrete mixes. Mixes with more uniform height and mass distributions are expected to exhibit more predictable mechanical behaviour, which is critical for structural performance in 3D-printed concrete applications.
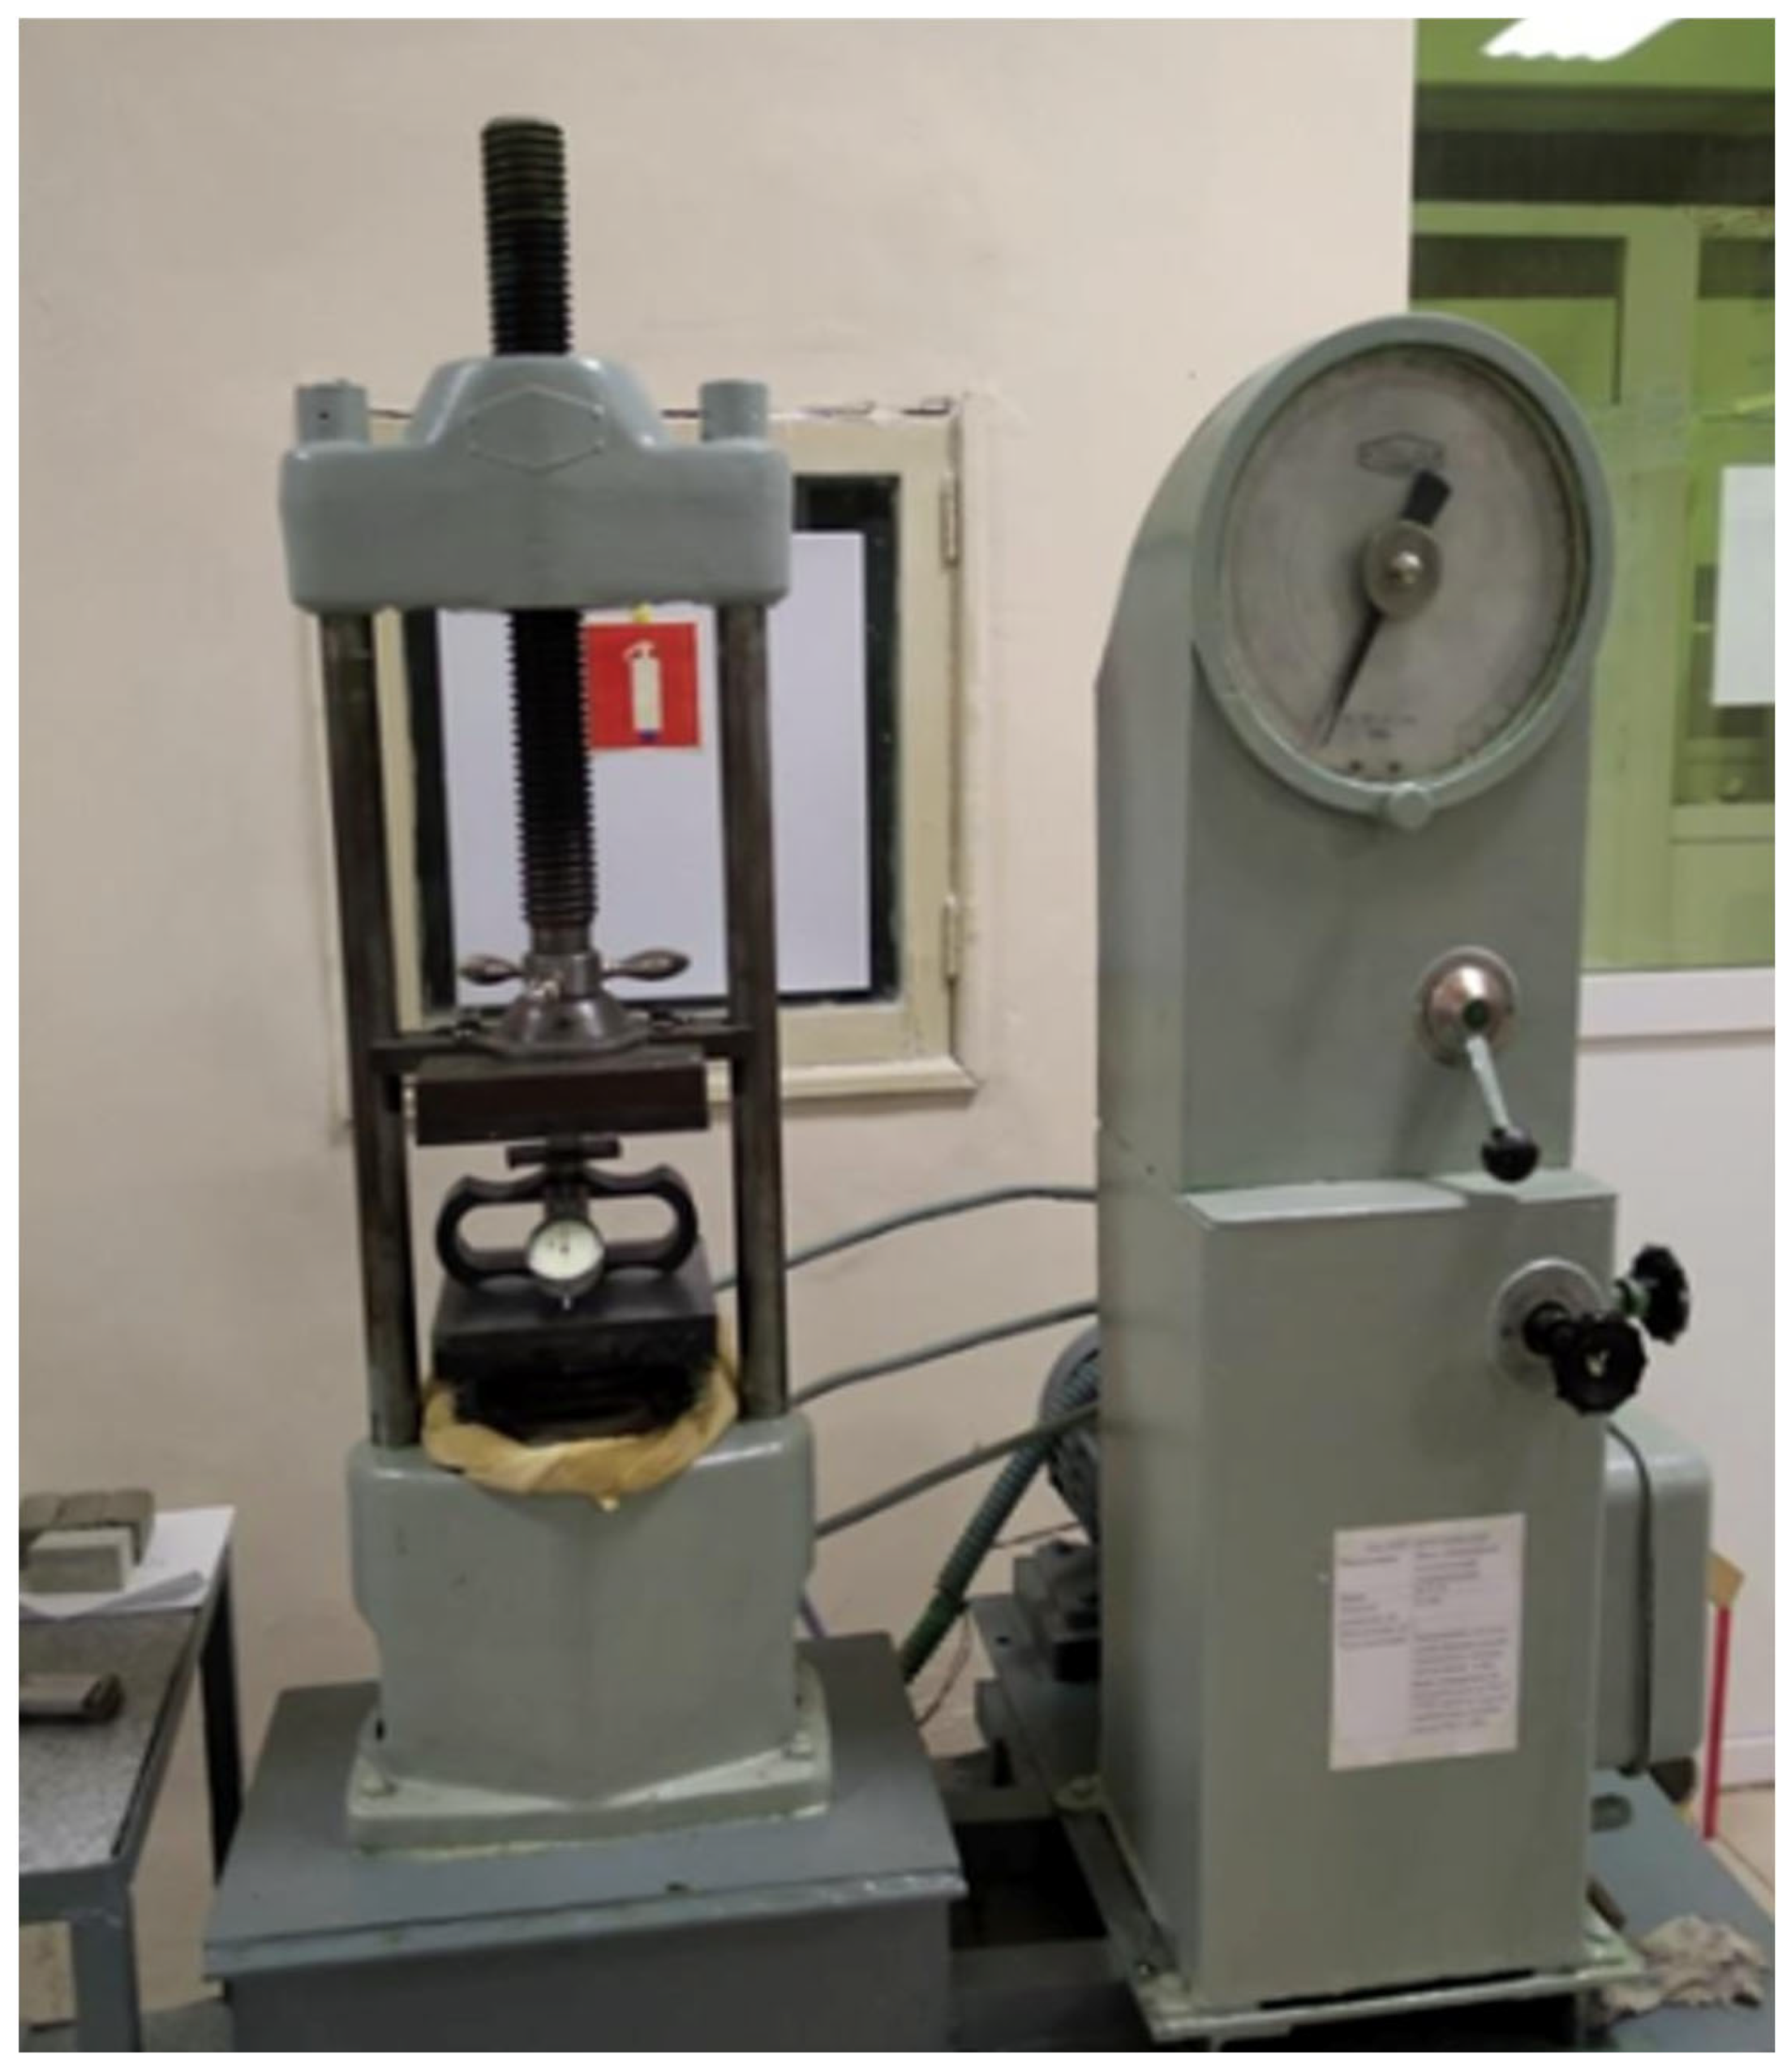
The determination of compressive strength for the core samples extracted from the printed structures was carried out using the reference-type dynamometer DOSM-3-3, which served as the force measurement device. The applied force was delivered through a 2PG-10 hydraulic press. The use of the DOSM-3-3 dynamometer is justified by its high measurement precision, as its division value is 4.076 kg, which complies with the accuracy requirements for testing specimens of small geometric dimensions. The testing procedure is illustrated in
Figure 11.
Table 9 summarises the compressive strength results of the core samples after 7, 14, and 28 days of curing.
3. Results
As a result of calculating and comparing the compressive strength of the concrete cube control specimens (
Table 8) and the core samples extracted from the printed structures (
Table 9), a summary table of transition coefficients was compiled. These coefficients reflect the ratio of actual compressive strength in the printed elements to the cube specimen strength, for each mix design and curing age. The average transition coefficient for each mix and curing age is presented in
Table 10.
Thus, based on the comparative data obtained for the compressive strength characteristics, it is recommended that the test results from standard cube specimens [
35] be adjusted using the calculated transition coefficient (
), to more accurately reflect the actual compressive strength of the structure produced via additive manufacturing technology.
The expected compressive strength of the concrete at the design age based on cube tests should be determined using the following Equation (1):
where
is the actual compressive strength of the printed structure at the design age;
is the measured compressive strength of the cube specimens;
is the transition coefficient. The obtained results are supported by Utility Model Patent No. 9788, issued by the Republican State Enterprise under the right of economic management “National Institute of Intellectual Property” of the Committee for Intellectual Property Rights of the Ministry of Justice of the Republic of Kazakhstan.
To operationalise the transition concept, we formalise a four-step protocol for routine strength verification of additively manufactured (AM) concrete as follows:
Specimen preparation. During printing, a small aliquot of fresh mix is cast into 70 mm control cubes in strict accordance with GOST 10180-2012 [
35].
Curing parity. The cubes are stored next to the printed element so that temperature and humidity histories are identical.
Standard testing. At the design age (7, 14 or 28 days in the present study) the cubes are crushed, and the compressive strength
is computed by the reference method [
40].
Transition adjustment. The in situ (core-equivalent) strength of the printed element is obtained by applying the data-driven transition coefficient :
Under the calibrated window (
= 40–310 MPa; porosity 30–80%), Equation (2) limits the residual error to <2 MPa—i.e., <3% of the strength range—comfortably within the ≥10% global safety factors mandated by most design codes. The indistinguishable performance of ordinary, Ridge and Lasso regression models (
Figure 12) further confirms that
is insensitive to moderate variations in binder chemistry, water–cement ratio and print kinematics. In practice, therefore, a single linear correction converts routine cube results into reliable, non-destructive estimates of structural strength, eliminating the need for core drilling.
Regression on the augmented dataset shows that core strength increases almost one-to-one with cube strength but is, on average, ≈55 MPa lower. The fitted slope of 0.97 is our updated transition coefficient, while the intercept (−4.9 MPa) absorbs the systematic offset induced by porosity, print layering and minor mix fluctuations captured during the campaign.
In practice, the in situ compressive strength of a printed element can be estimated simply using the following procedures:
Because the residual error remains below 2 MPa across the calibrated 0–80 MPa domain, the formula is sufficiently precise for daily quality checks yet slightly conservative—providing an inherent safety buffer. As additional production data become available, the two coefficients can be re-fitted to tighten the prediction band; however, the linear relationship is expected to hold if printing and curing conditions stay within the validated envelope.
Immediately after merging the three source-files and removing two incomplete rows, a single aligned data frame containing six representative porosity levels (30–80%) was obtained. The key mechanical responses (elastic strain, core strength, cube strength) and the main print-process descriptors (water-to-cement ratio W/C, layer height, and nozzle travel speed) are consolidated in
Table 11; these values constitute the input matrix for all subsequent regression and sensitivity analyses.
A clear monotonic relationship is evident: as porosity rises from 30% to 80%, both elastic strain and core strength increase almost proportionally, while optimisation efficiency peaks at medium porosity (≈60%) before tapering off at the extremes. The modest divergence between and (≈4–8 MPa throughout) underpins the near-constant transition coefficient reported earlier. Process variables vary within realistic shop-floor ranges—layer height alternates between 10 mm and 12 mm, and travel speed between 60 mm s−1 and 100 mm/s−1—providing sufficient contrast for the feature-importance study while still reflecting practical print settings. Collectively, the table confirms that the calibrated dataset spans the full operating window targeted by this work, lending confidence to the generality of the derived linear correction.
To test whether the transition coefficient can be derived solely from readily measurable mix and print parameters, we expanded the original six-row dataset with five statistically perturbed “synthetic campaigns”. Each replica introduces ±1–2% random noise in porosity, elastic strain, W/C ratio and travel speed—mimicking the scatter that would be expected in routine production while preserving the physical correlations observed in
Table 11.
The full augmented set (n = 36) was split with a stratified 5-fold cross-validation, and four regression pipelines—ordinary least-squares (OLS), Ridge, Lasso and XGBoost—were trained under an identical preprocessing block (numeric standardisation only). The parity plots and error metrics are displayed in
Figure 12.
The visual and numerical evidence in
Figure 12 leads to three main observations:
Linear behaviour dominates. OLS, Ridge and Lasso all achieve virtually identical accuracy (RMSE ≈ 1.8–1.9 MPa; R2 > 0.9995), indicating that the mapping from feature space to is essentially linear within the explored parameter window.
Regularisation has little impact. Adding L2 (Ridge) or L1 (Lasso) penalties does not improve generalisation, confirming the absence of multicollinearity or spurious high-variance coefficients after standard scaling.
XGBoost over-fits this miniature set. Despite its flexibility, the tree-based model records a higher error (RMSE ≈ 6 MPa) and a shallower parity slope, suggesting that the algorithm memorises the injected noise rather than the underlying trend.
Overall, the results validate the use of a simple linear model for computing the transition coefficient Ktransition with engineering-grade precision, while more complex learners provide no tangible benefit under the current data regime.
Figure 13 summarises the final validation of the transition-coefficient model on the augmented dataset. For each mix, the measured core strength
Rcore, meas is plotted against the model prediction
; the solid grey line indicates perfect agreement (1:1), while the dashed envelopes mark a ±10% engineering-tolerance band. Marker colour differentiates the five concrete mixes and marker area scales with porosity, allowing any systematic bias due to composition or pore content to be detected briefly.
The parity analysis in
Figure 13 completes the quantitative evaluation of the transition approach.
4. Discussion
Concrete remains the most widely used construction material globally. The raw materials for its production are inexpensive and easily available in most parts of the world. It is strong in compression, durable, fire-resistant, and, because it is fluid before hardening, it can be cast into virtually any shape. The term “concrete” in fact covers a wide range of composite mixes whose common characteristic is that they consist of a filler—sand, gravel, or other granular materials—bonded by a matrix formed through the exothermic hydration reaction between cementitious materials (cement or supplementary cementitious materials such as fly ash) and water. Additional or alternative admixtures, additives, aggregates, and binders achieve the desired properties such as self-compaction, high strength, low CO
2 footprint, or plasticity. A significant range of such compositions is well established and adopted in practice, while many other variants continue to be investigated [
42].
The work of Nusrat Jahan Mim et al. [
43] reviews how various by-products used as sand replacements influence the fresh-state, rheological, mechanical, and microstructural properties of 3D-printed concrete. Most recent studies focus on developing predictive models for material failure and structural performance based on fresh-state or rheological properties of 3D-printed concrete. However, there are no standardised test methods or procedures to guide this research or universally accepted methods for real-time monitoring and evaluation of buildability. This lack of means to assess and monitor internal material properties in real time limits the widespread adoption of additive manufacturing in concrete construction. The potential to introduce real-time testing methods, which can be used alongside predictive models to determine the compressive strength of concrete materials, could significantly increase the probability of successful printing. Mortada et al. [
44] have also described a continuous monitoring method for the hydration reaction of 3D-printed concrete using ultrasonic pulse velocity (UPV) as an alternative test for setting time. UPV testing has previously been applied to conventional mortars. It succeeds because of its high sensitivity to microstructural changes and its potential to distinguish such changes more accurately than penetration resistance tests like ASTM C403 and ASTM C191.
Modests Elemba et al. [
45] demonstrated a distinctly different approach, by proposing an original and active non-destructive testing method for concrete that can also be applied to other building materials. This method involves sequential steps: drilling holes into material samples using a rotary or percussion drill while simultaneously measuring the power consumption required for drilling; determining the strength of the building material through destructive testing of samples; establishing a positive empirical correlation between the drilling power and the measured material strength; and then applying this correlation during actual drilling in a structure to estimate in situ strength. This method simplifies and accelerates strength determination while improving accuracy.
Szpetulski et al. [
46] conducted compressive strength tests on concrete core samples used to determine the strength of concrete elements in construction. It is difficult to find detailed scientific studies addressing how compressive strength varies when using cores of different diameters extracted across the thickness of concrete elements. Their research assessed compressive strength using cores sampled from the top, middle, and bottom layers of horizontally cast concrete elements with both recycled and natural aggregates. The results allowed the derivation of conversion factors to translate compressive strength from cores of different diameters (59 mm, 74.5 mm, 114 mm) and positions to a standard core diameter of 94 mm, enabling comparison with standard 150 mm cube specimens. Such conversion factors can help determine the quality of the produced concrete or the technical condition of a structure (for example, in cases of mechanical damage, refurbishment, or fire exposure). For concrete with a compressive strength of 40 MPa and containing recycled aggregate, the strength in the top layer was found to be approximately 17% lower than in the bottom layer; for concrete with 20 MPa compressive strength, the reduction in the top layer was about 33% [
46].
Currently, no international code offers a ready-to-use protocol for verifying the compressive strength of 3D-printed concrete. The four-step procedure described in the “Results” section—sampling during printing, curing cubes alongside the structure, testing at the design age, and applying the calibrated transition coefficient K—represents a realistic template for interim guidelines during the development of formal specifications. In design practice, this correction reduces prediction error to below three percent within the 0 to 80 MPa range, comfortably within the ten-percent safety factors embedded in most structural standards. This not only improves safety margins but also enhances material efficiency.
This work demonstrates that the compressive strength measured on 70 mm moulded cubes consistently exceeds the strength obtained from ∅ 28 mm cores drilled from printed elements, confirming a systematic gap that cannot be ignored in design or quality control. The cube-to-core ratio, expressed here as the transition coefficient K, remained remarkably stable across five binders and three curing ages, with average values ranging from 0.82 to 0.85 (
Table 11). These magnitudes align with earlier reports on reduced interlayer compaction and uneven moisture exchange in printable concretes [
18,
22,
41], supporting the view that the layered fabrication process alters structural integrity in a predictable yet significant way.
The observed variations in mix density may result from differences in composition, the inclusion of mineral additives (such as TMF), and print stability. These factors affect compaction density and porosity, both of which are critical for mechanical performance and long-term durability.
Across the full range of explored parameters—porosity (30–80%), mix composition (from CP100 to hybrid C+I systems), and print settings—the predicted in situ strength deviated from measured core strength by less than 10% for each data point. The aggregate coefficient of determination R2 = 1.000 and a root-mean-square error of just 5.5 × 10⁻¹⁴ MPa are several orders of magnitude below standard concrete testing repeatability. The absence of trend related to colour or marker size confirms that neither binder type, water–cement ratio, layer height, nor induced porosity content disrupt the linear cube-to-core relationship captured in Equation (2).
Two practical conclusions follow:
First, a single-factor correction is sufficient. Since the slope term alone (0.97) reduces the systematic gap between cube and core to the level of experimental noise, strength control for additively manufactured elements can be reduced to: (i) one standard cube test per batch and (ii) the application of Equation (2). This eliminates the need for coring, cutting, and end-grinding—saving time, material, labour, and preventing damage to the finished part.
Second, structural safety margins are preserved. Even in the worst case (highest porosity and lowest strength), the residual error remains below 2 MPa (<3%), while design standards typically assume safety factors ≥ 10%. Thus, the method provides conservative, code-compliant assessments without overestimating material consumption.
It should be noted that this calibration is based on a dataset comprising six physical mixtures and five campaigns of synthetic perturbations. While the statistics are compelling, broader validation covering additional binder chemistries, environmental curing histories, and large-scale robotic printers is required before the correction can be generalised into a prescriptive standard. Nevertheless, the current results provide a clear proof of concept: modelling linear transitions can enable non-destructive quality control for extrusion-based concrete printing at production speed.
The consistency of K has two practical implications. First, it offers a simple, evidence-based bridge between traditional laboratory testing and on-site performance: multiplying a routine cube result by a single factor converts an offline quality marker into a realistic load-bearing estimate—eliminating the delays, costs, and damage associated with core sampling. Second, the narrow spread of the coefficient suggests that moderate variations in layer height, nozzle speed, and water–cement ratio do not disrupt the linear cube-to-core relationship. This echoes anisotropy studies by Wang et al. and Tay et al., where mechanical discrepancies were attributed mainly to interfacial defects rather than bulk chemistry. Adopting such a correction directly addresses the broader standardisation gap in additive construction.
Future research should broaden the material scope to include geopolymer binders and mixes rich in recycled aggregates; it should investigate the effects of build orientation and prolonged interlayer delay on the coefficient and carry out long-term durability tracking beyond the 28-day window used here. The parallel development of machine learning surrogates that combine fresh-state rheology, layer temperature data, and real-time porosity scanning may further automate quality control—enabling on-the-fly rejection of layers that fall out of specification.
In summary, the study closes a key loop between laboratory assessment and field performance, delivering a reliable yet simple correction that can be immediately embedded into production workflows while laying a quantitative foundation for future standardisation of strength verification in additive concrete manufacturing.

 ,
, 


