Article

Information Merging for Improving Automatic Classification of Electrical Impedance Mammography Images

by
Jazmin Alvarado-Godinez
1,
Hayde Peregrina-Barreto
1,*,
Delia Irazú Hernández-Farías
1 and
Blanca Murillo-Ortiz
2
1
Instituto Nacional de Astrofísica, Óptica y Electrónica, Luis Enrique Erro 1, Puebla 72840, Mexico
2
Unidad de Investigación en Epidemiología Clínica, OOAD Guanajuato, Instituto Mexicano del Seguro Social, Blvd. Adolfo López Mateos, León Guanajuato 37320, Mexico
*
Author to whom correspondence should be addressed.
Appl. Sci. 2025, 15(14), 7735; https://doi.org/10.3390/app15147735
Submission received: 18 June 2025 / Revised: 4 July 2025 / Accepted: 7 July 2025 / Published: 10 July 2025
(This article belongs to the Special Issue Novel Insights into Medical Images Processing)

Abstract

Breast cancer remains one of the leading causes of mortality among women worldwide, highlighting the critical need for early and accurate detection methods. Traditional mammography, although widely used, has limitations, including radiation exposure and challenges in detecting early-stage lesions. Electrical Impedance Mammography (EIM) has emerged as a non-invasive and radiation-free alternative that assesses the density and electrical conductivity of breast tissue. EIM images consist of seven layers, each representing different tissue depths, offering a detailed representation of the breast structure. However, analyzing these layers individually can be redundant and complex, making it difficult to identify relevant features for lesion classification. To address this issue, advanced computational techniques are employed for image integration, such as the Root Mean Square ( C RMS ) Contrast and Contrast-Limited Adaptive Histogram Equalization (CLAHE), combined with the Coefficient of Variation (CV), CLAHE-based fusion, weighted average fusion, Gaussian pyramid fusion, and Wavelet–PCA fusion. Each method enhances the representation of tissue features, optimizing the image quality and diagnostic utility. This study evaluated the impact of these integration techniques on EIM image analysis, aiming to improve the accuracy and reliability of computational diagnostic models for breast cancer detection. According to the obtained results, the best performance was achieved using Wavelet–PCA fusion in combination with XGBoost as a classifier, yielding an accuracy rate of 89.5% and an F1-score of 81.5%. These results are highly encouraging for the further investigation of this topic.

1. Introduction

Breast cancer stands as one of the leading causes of mortality in women worldwide, highlighting the need to implement accessible and effective diagnostic tools facilitating early risk detection [1]. In Mexico, this disease is a critical public health issue, with an increasing incidence rate and an approximate rate of 27 cases per 100,000 people [2]. Many cases remain undetected until they reach advanced stages, limiting the therapeutic options and reducing the survival rates; therefore, early detection is essential [3]. However, conventional diagnostic methods have limitations, especially in patients with a high breast density. The breast density is a key factor, as an increase in it is associated with a higher risk of breast cancer diagnosis. Various factors, especially hormonal ones, influence changes in the breast density over time. Studies have shown that women with a higher breast density have elevated estrogen levels compared to their lower-density counterparts, which is an additional risk factor for breast cancer [4]. Furthermore, a higher breast density can reduce the effectiveness of conventional mammograms, making early lesion detection more difficult and increasing the likelihood of false negatives.
Conventional mammograms remain the reference technique for breast cancer diagnosis due to their high sensitivity in detecting microcalcifications and small lesions. However, they have certain limitations, such as exposing patients to ionizing radiation, difficulties in detecting early-stage lesions in patients with a high breast density, and the possibility of false negatives in some cases. Complementary technologies such as ultrasound, magnetic resonance imaging (MRI), and breast tomosynthesis have been developed. Ultrasound is particularly useful for differentiating cysts from solid masses without the need for ionizing radiation; however, it has limitations in detecting microcalcifications [5]. MRI, on the other hand, offers high sensitivity and is particularly beneficial for patients with a high breast density or an increased risk of developing breast cancer. Breast tomosynthesis provides three-dimensional images, reducing tissue overlaps and improving the visualization of small lesions. However, its application requires a higher radiation dose compared to that of conventional mammograms [6,7].
Various studies have shown that combining multiple diagnostic techniques, such as mammograms, ultrasounds, and emerging methods like Electrical Impedance Mammography (EIM), can significantly improve the accuracy of identifying suspicious lesions [4,8]. Unlike conventional mammograms, EIM is non-invasive and radiation-free and can be performed on young women, making it a safe alternative to more traditional methods [9]. Additionally, it enables real-time evaluation and complements the information obtained using conventional techniques for the early detection of breast cancer [10,11]. EIM is based on the analysis of the breast density and electrical conductivity, providing a set of images representing different layers of the breast tissue [12]. This layered representation enables a more detailed view of the internal characteristics of the tissue, facilitating the identification of potential anomalies. However, handling these images individually could generate information redundancy and complexity in the extraction of relevant features to detect possible lesions. Currently, EIM images are analyzed independently [13,14,15], which can hinder the identification of subtle tissue changes as well as the assessment of potential anomalies. Figuring out how to integrate the layers into a single representation while preserving the relevant features at each depth layer could help to address the current constraints.
In this paper, the detection of anomalies related to breast cancer in EIM mammograms was addressed by casting it as a binary classification task. Given the nature of these medical images, this task can be accomplished by analyzing the images from different perspectives. For example, this can be achieved by considering each image in isolation, without taking into account the layer to which it belongs, or by performing classification at the layer level [16]. Unlike previous reports in the literature, an approach is proposed to merge the images corresponding to the EIM layers into a single image by leveraging various methods for integrating this information. To the best of our knowledge, this is the first approach to handle this task by considering image merging for classification purposes. Having only one image comprising this information could help to improve not only the classification performance but also the understanding of the information captured using this method. For achieve this, different computational methods were analyzed: the Coefficient of Variation (CV), the Root Mean Square Contrast ( C RMS ), and Contrast-Limited Adaptive Histogram Equalization (CLAHE) in combination with the CV. The impact of using advanced fusion methods, including weighted averaging, Gaussian pyramid fusion, and Wavelet–PCA fusion, was explored. The obtained results demonstrate that classification based on the variability map generated through the integration and fusion of the different depth layers achieved an accuracy of 85 ± 0.07 , showing an improvement in the reliability of the automatic classification process. Furthermore, this result highlights the impact of integration and fusion on optimizing EIM image analysis, enabling a more homogeneous and structured representation of the tissue and enhancing the extraction of relevant information, thereby facilitating its application in the early detection of breast cancer. In this sense, integration and fusion approaches not only enhance the accuracy and reliability of computer-aided diagnosis systems but also increase their applicability in clinical settings, providing a promising tool for medical imaging.

2. Related Work

Image integration is used in the computational analysis of medical images, mainly when information is distributed between different depth levels. Methods such as the Coefficient of Variation (CV), the Root Mean Square Contrast ( C RMS ), Contrast-Limited Adaptive Histogram Equalization (CLAHE), Gaussian pyramid fusion, and Wavelet–PCA fusion have been successfully explored for integrating medical images [17,18]. According to [19], applying the C RMS over color SONAR images to combine information from different chromatic channels resulted in significant improvements in the perception of details. On the other hand, the use of Gaussian pyramid fusion allows for the integration of multiscale information while preserving relevant details at different resolution levels, making it effective for hyperspectral image classification [20]. Regarding mammography, this method has been used to improve the segmentation and detection of relevant anatomic structures [17].
Methods such as CLAHE, in combination with the CV, enhance the local contrast and highlight areas of interest in medical images [18,21]. Wavelet–PCA has been utilized to fuse high-resolution images with detailed spectral data, thereby enhancing the visual quality and classification in medical applications [22]. In particular, for fusing images obtained using computed tomography and magnetic resonance imaging, it has optimized the differentiation of relevant anatomic structures and identified pathological tissues [23].
Hybrid approaches combining techniques such as the weighted average and Brovey Transform have enabled an increase in the quality of fusion images, resulting in improvements in the PSNR (signal-to-peak noise ratio) and mean quadratic error [24]. For the binary classification of medical images, integration is crucial for enhancing the precision and sensitivity of models. Recently, the combination of the Wavelet Transform and PCA has enabled discriminative features to be highlighted that facilitate the differentiation between classes, achieving significant improvements in the classification of breast lesions [23].
Previous studies have highlighted the advantages of image integration and fusion in medical images from diverse modalities. Recent advances in multimodal data fusion have demonstrated significant potential in enhancing clinical diagnostics and prognostics by integrating heterogeneous medical data sources. Petmezas et al. [25] introduced a dual-input CNN that processes raw audio signals and STFT spectrograms to classify pediatric respiratory sounds, achieving state-of-the-art performance. In critical care scenarios, Wu et al. [26] combined chest X-rays, respiratory sound-derived features, and routine ICU parameters using deep learning and Logistic Regression, resulting in an AUC rate of 0.759, substantially outperforming single-modality models. Moreover, Azam et al. [27] reported that image-to-image fusion is the most prevalent strategy and that most methods leverage deep or machine learning to combine data modalities. However, this has not been explored in the case of IEM images. These approaches could help integrate EIM images, where the detection of subtle variations in the conductivity is fundamental for identifying abnormalities. In automatic classification, information integration has been shown to enhance the precision and robustness of classification models.

3. Materials and Methods

For a more comprehensive analysis of EIM images, applying methods that enable the capture of relevant information across layers and its integration into a single image is crucial. Several experiments were conducted to evaluate various image integration and fusion approaches. Integration methods enable multiple medical images to be combined into a single image, highlighting key aspects of the tissues. Statistical metrics and contrast transformations were explored to maximize the structural information in the final image. On the other hand, fusion methods use diverse processing and mathematical strategies to combine images, resulting in a homogeneous and detailed representation of the breast. These techniques enable the generation of images with greater clarity and contrast. To evaluate the aforementioned approaches and their impact on the binary classification of breast lesions, a set of validation metrics widely used in medical image classification was implemented. In the following sections, concepts related to the integration and fusion of EIM images are described.

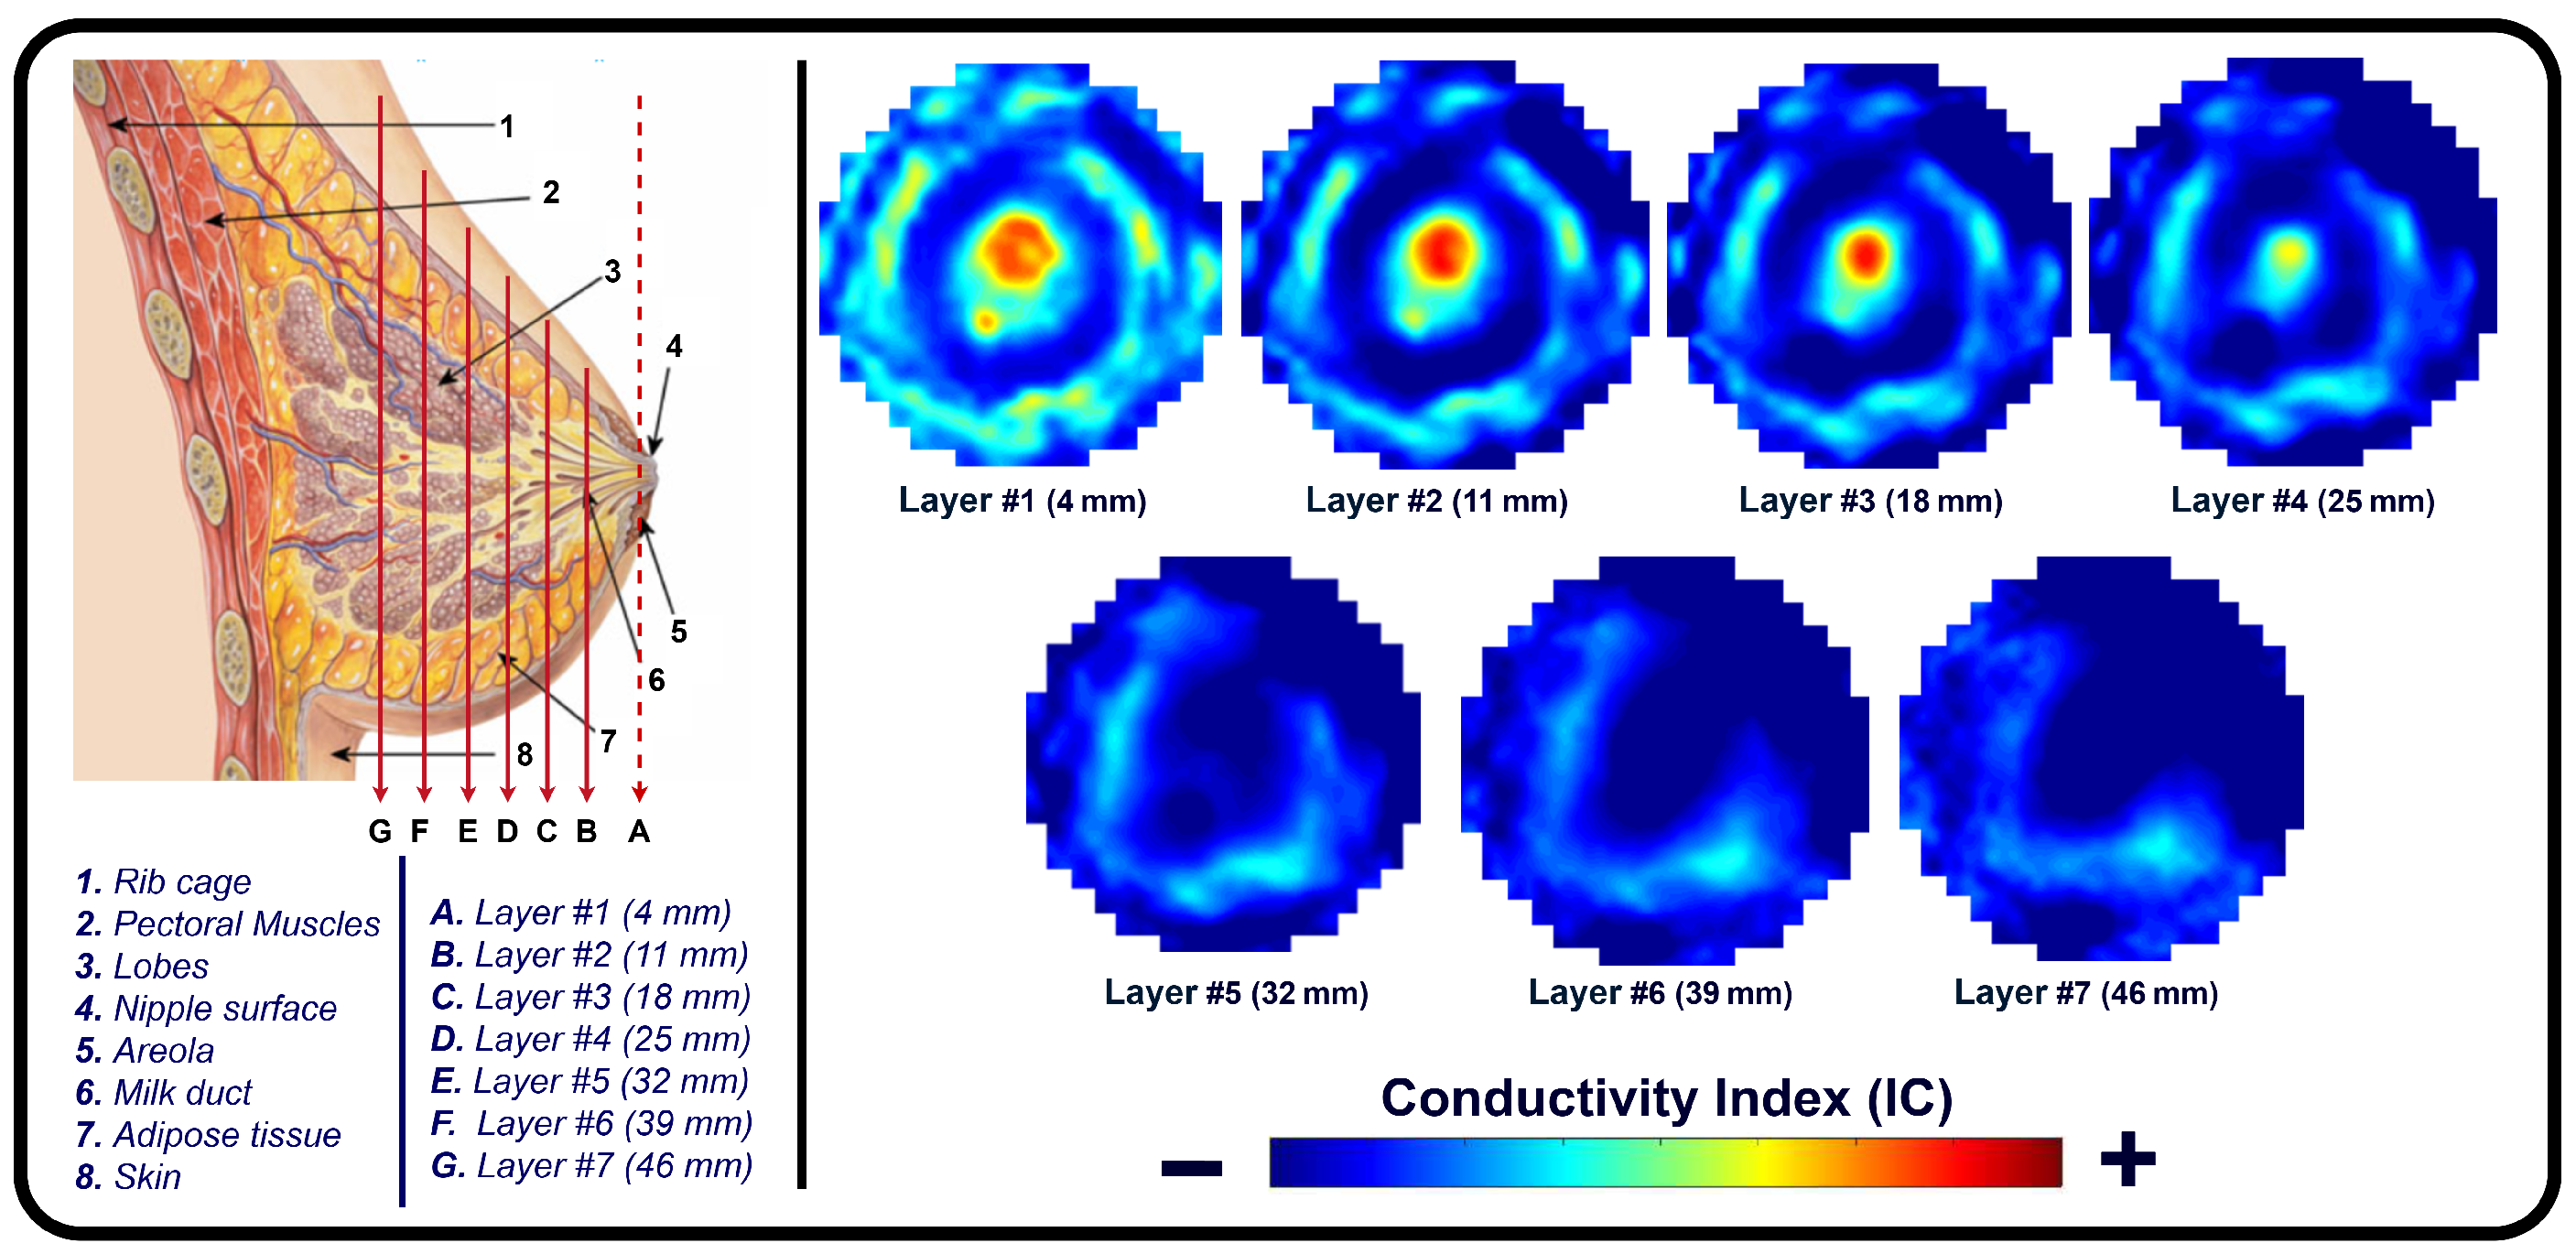
3.1. Electrical Impedance Mammography (EIM)

EIM is an imaging technique that, unlike X-ray mammography, which is based on the differential absorption of radiation in tissues, takes advantage of the differences in the electrical conductivity and permittivity between tissues, making it possible to infer structural and functional information without using ionizing radiation [28]. Malignant cells tend to have a higher presence of water and electrolytes (such as sodium, calcium, and potassium), presenting higher conductivity than healthy cells. As a result, tumor regions exhibit a lower impedance to the passage of an electric current, whereas normal tissue has a higher impedance [29,30]. While EIM does not replace conventional mammography, it has the advantage of being radiation-free, making it a promising complementary tool for detecting malignant lesions, especially in patients with a high breast density. To promote its application in diagnosis, an impedance scale has been developed to assess the risk of cancer based on the electrical properties of the tissue [31], as shown in Table 1.

3.2. MEX-IEM Dataset

For experimental purposes, the MEX-IEM dataset was developed at UMAE No. 1 Bajío Public Hospital, part of the Mexican Social Security Institute (denoted as the IMSS, its acronym in Spanish), located in Guanajuato, Mexico. The MEX-IEM dataset comprises 4760 IEM images from 340 women with an age range of 25 to 70 years, annotated by physicians in terms of their corresponding BI-RADS level. Anthropometric and clinical data, such as data on pregnancy, lactation, antecedents of hormonal or surgical treatments, and the electrical conductivity of the breast glands, as well as the risk factors associated with breast cancer, were collected. The data collection followed the ethical norms established by the IMSS National Commission for Scientific Research and was approved by its Research Ethics Committee under the protocol number R-2017-785-108. All the participants were informed about the procedures and provided their written consent to participate voluntarily in the study. Table 2 presents a summary of the features of the MEX-IEM dataset as well as the inclusion and exclusion criteria used during recruitment.
Figure 1 illustrates the appearance of breast cross-sections from an EIM package and their corresponding depth, allowing for the analysis of the variation in the conductivity distribution at different tissue levels. The separation between the first and second slices is 4 mm and increases to 7 mm for subsequent levels, optimizing the visibility and allowing for the detailed analysis of breast structures across the different slices. In the color maps, a high conductivity index (red) is associated with high-density breast tissue, while lower conductivity values (blue) are observed in areas with a predominance of fatty tissue [32]. For example, the nipple in the first layer (reference region) presents a high conductivity index since it is composed of more fibrous and dense tissue compared to adipose tissue. However, in deeper layers, this composition shifts towards a predominance of fatty tissue, resulting in a decrease in the conductivity index value.

3.3. EIM Data Processing and Classification

Figure 2 presents a schematic representation of the analysis and classification process followed for EIM images. The process began with the generation of a variability map from the input EIM package using integration or fusion methods. This variability map captured essential information regarding the conductivity index values across all the EIM layers. Next, the extraction of features for classification was conducted using a convolutional neural network based on the VGG19 architecture. Ultimately, each variability map was labeled as either low suspicion (BI-RADS grades 1–3) or high suspicion (BI-RADS grades 4–5) of a breast lesion based on the density information derived from the EIM images.

3.3.1. Integration Methods

A. The CV measures the relative dispersion of a set of data in a range of values [0, 1] [33], where values near 0 suggest little dispersion (homogeneity). At the same time, those near 1 indicate a greater dispersion (heterogeneity) of the pixels. The CV is calculated as the ratio between the standard deviation σ and the mean μ of a set of values (in this case, the image pixels), as is shown in Equation (1).
CV = σ μ
B. The CLAHE method adjusts the local image contrast by dividing the image into small regions and redistributing the pixel intensities within each region to increase the contrast locally, while avoiding overexposure [21]. When combined with the CV ( C V CLAHE ), it helps to highlight local details, improving the discrimination of structures in the breast tissue. Equation (2) shows how this combination was performed. Each of the seven EIM images was processed using CLAHE to enhance the local contrast. Then, the CV of the improved images was calculated, allowing for the identification of the relative variations between the layers and emphasizing the regions associated with lesions and anomalies [34].
CV CLAHE = σ CLAHE μ CLAHE
C. The Root Mean Square Contrast ( C RMS ) measures the dispersion of the grayscale intensities [35], providing a reference for evaluating the differences in the tissue structure. The sum of the differences in the coordinates ( x , y ) between the seven depth pixels (layers) from the EIM images and their corresponding mean intensities was computed (Equation (3)). This process allowed us to obtain the local variability. Consequently, the C RMS integrated information from the different layers of the EIM, taking into account the variations in the breast tissues found in each of them. Figure 3 illustrates the integration of EIM images using the C RMS , resulting in a single image that emphasizes the key structural differences across the layers. This enhancement facilitated the identification of patterns related to anomalies, such as tumors or calcifications.
C RMS = 1 N k = 1 N ( I x , y , k μ x , y ) 2

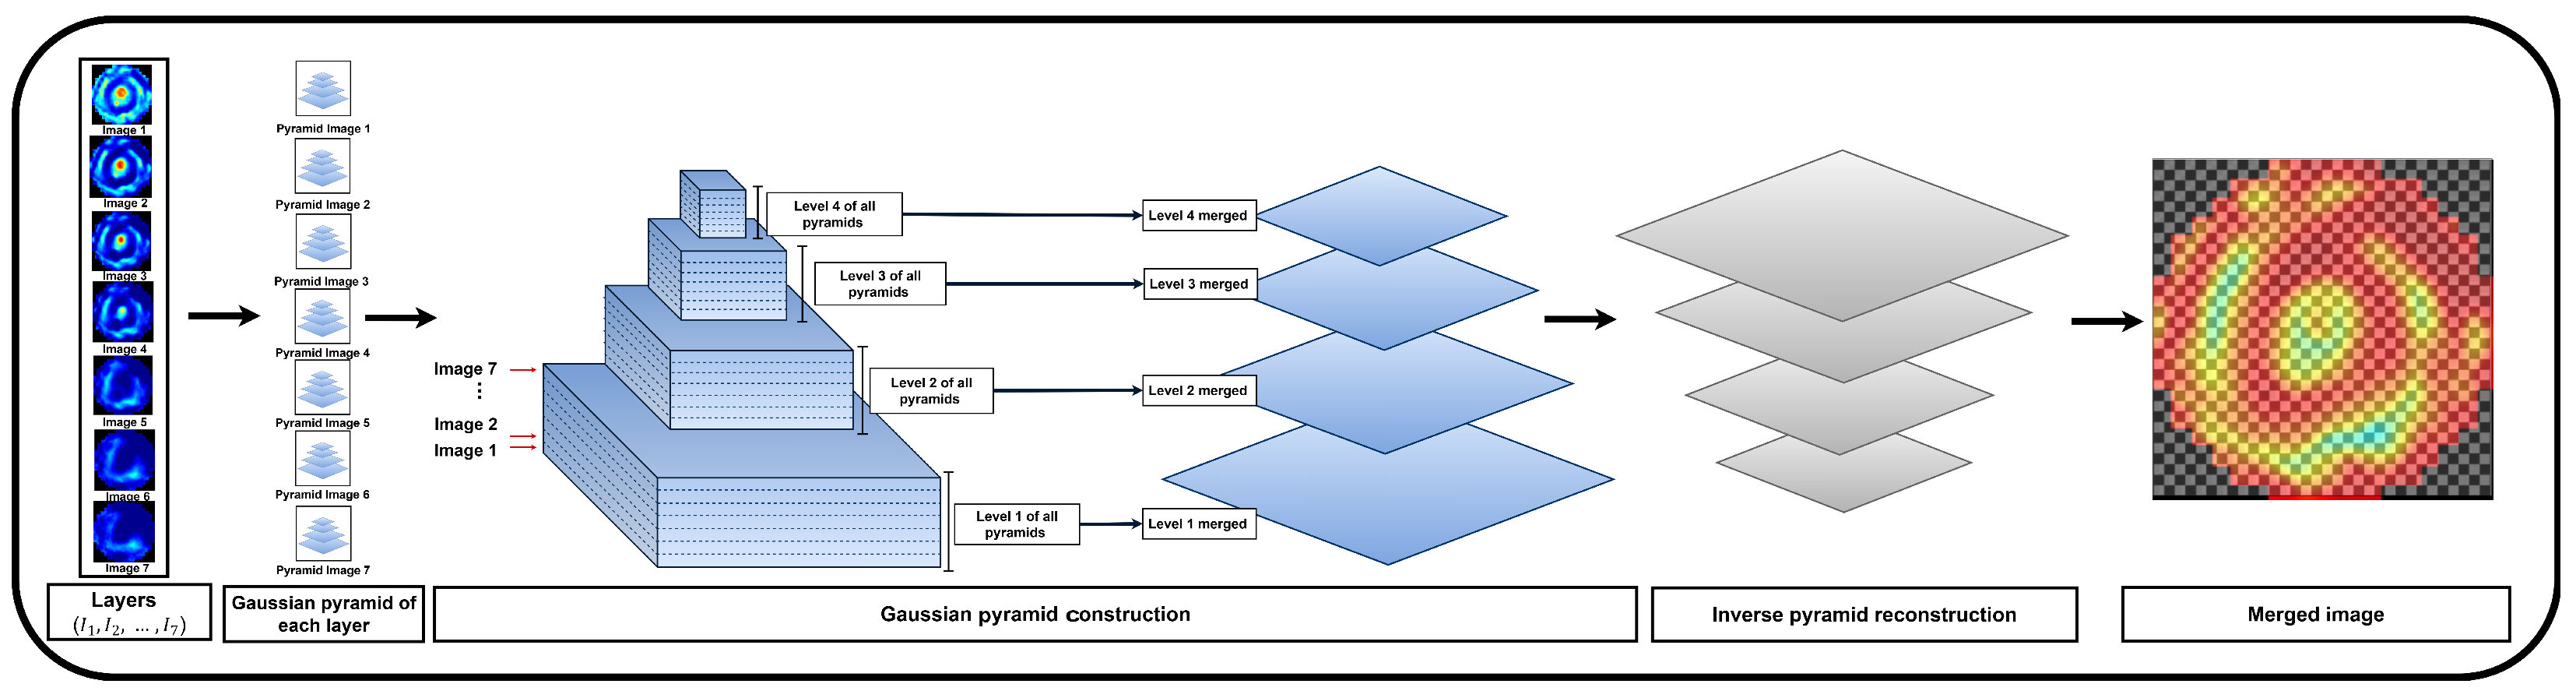
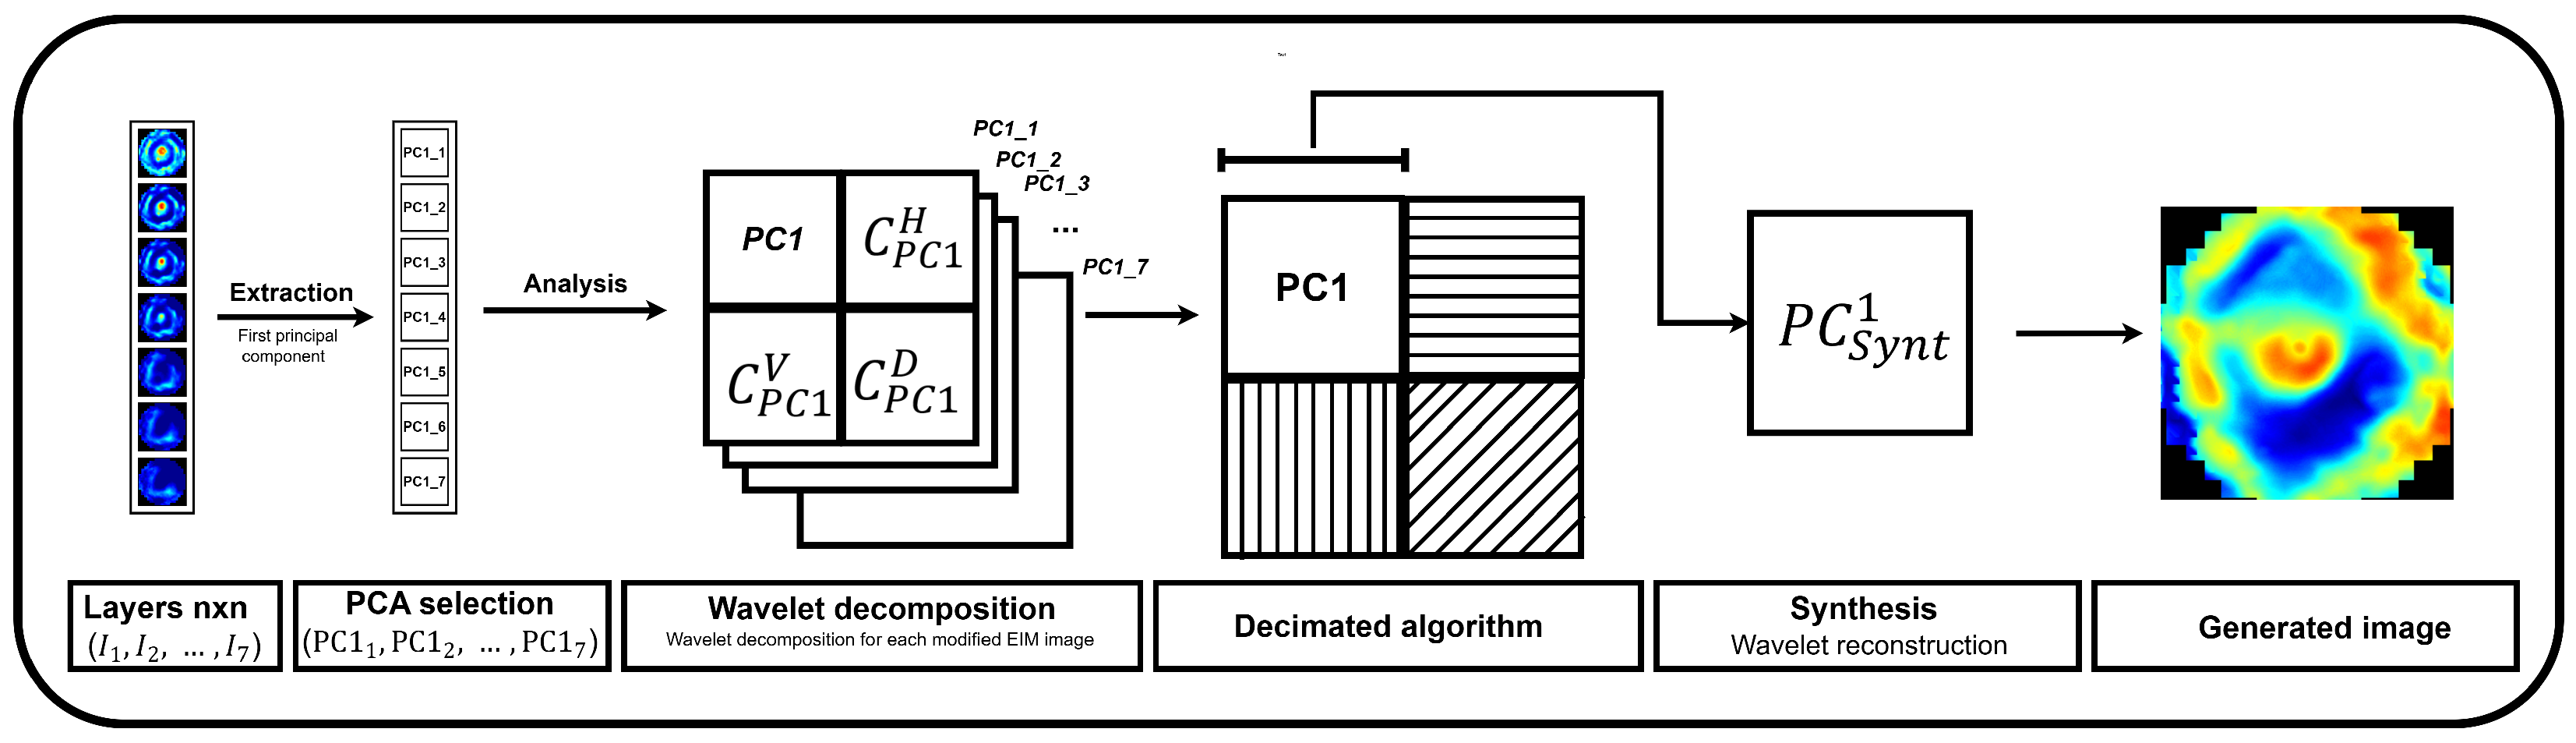
3.3.2. Fusion Methods

A. The CLAHE fusion method enhanced the local contrast of the EIM images. CLAHE was applied individually to each layer; subsequently, the final fused image was generated using a weighted integration scheme. Equation (4) shows how the fusion was performed, where I k CLAHE represents the kth EIM layer ( N = 7 ) after applying CLAHE, and the parameter α k corresponds to the weight assigned to each layer, determining its relative contribution to the final image.
C = k = 1 N α k · I k CLAHE
Since greater importance was given to the superficial layers, the weight assignment was based on a decreasing linear sequence, in which the first value was the highest and the last was the lowest. This sequence was defined as a uniform arithmetic progression starting at 1.0 and ending at 0.1, evenly distributed among the N = 7 layers. The increment between each term was calculated using the following expression, which corresponds to the difference between the extremes divided by the number of intervals:
Δ = 1.0 0.1 N 1 = 0.15
Subsequently, the weights were defined and then normalized so that their sum would equal 1. The complete normalization shown in Equation (6) was used:
α k = 1.0 ( k 1 ) · Δ j = 1 N 1.0 ( j 1 ) · Δ
The total sum of the unnormalized weights was
j = 1 7 1.0 ( j 1 ) · 0.15 = 3.85
Thus, the final values of α k that we used were
α = [ 0.2597 ,   0.2208 ,   0.1818 ,   0.1429 ,   0.1039 ,   0.0649 ,   0.0260 ]
A recent implementation of CLAHE with automatic parameter selection—designed especially for contrast enhancement—combined with fusion schemes was demonstrated by Chang et al. (2018), who introduced automatic Contrast-Limited Adaptive Histogram Equalization with dual gamma correction targeting both contrast and luminance preservation [36].
B. The Gaussian pyramid fusion method is based on the multiscale decomposition of each image, allowing for an integrated representation that preserves both the local and global features of the EIM. To optimize the method’s performance, the number of pyramid levels was set to L = 4 , ensuring a balance between information retention and computational efficiency through progressive subsampling.
Each image was hierarchically decomposed using its corresponding Gaussian pyramid, where at each level, L, a smoothing filter was applied, followed by image downsampling. The fusion process assumed an equal contribution from all decomposition levels, assigning a uniform weight of w L = 1 7 to each of the seven images. As shown in Equation (7), the fused pixel value G f L ( x , y ) at position ( x , y ) and level L was computed as the sum of the corresponding pixel values, G i L ( x , y ) , from each image, i, weighted by w L :
G f L ( x , y ) = i = 1 7 w L · G i L ( x , y )
Afterward, an inverse pyramid reconstruction was performed to obtain the final fused image. This process began at the lowest resolution level and progressively upsampled each level through interpolation, adding the fused details from the higher resolution level at each step. This procedure, defined by the Inverse Pyramid Reconstruction Equation, is expressed as
I ( l ) = Expand ( I ( l + 1 ) ) + G f ( l )
where I ( l ) is the reconstructed image at level l, Expand ( I ( l + 1 ) ) represents the image from level l + 1 upsampled to match the size of the image from level l, and  G f ( l ) is the fused image at level l. The inverse pyramid reconstruction approach was originally introduced by Burt and Adelson [37].
The complete Gaussian pyramid fusion process is illustrated in Figure 4. This method enables the generation of a multiscale, integrated representation of breast tissue, dynamically adapted to the image size, ensuring efficient and robust fusion.
C. Weighted average fusion is used to combine images by assigning them different weights depending on the contribution in terms of specific features, such as the global or local similarity, of each input image [38]. This method aims to assign greater relevance to the most significant regions within the fusion context, thereby ensuring the optimal integration of information while maintaining the coherence of the resulting image. Weighted average fusion was based on a linear combination of the intensities of the pixels in the input images (Equation (9)), where the fused pixel value I fused ( x , y ) at position ( x , y ) is derived from the input image intensities I i ( x , y ) using normalized weights, w i , to avoid bias. A decreasing weight scheme was applied from the superficial to inner layers as w = [ 0.2381 ,   0.2032 ,   0.1683 ,   0.1333 ,   0.0984 ,   0.0635 ,   0.0286 ] . The outer layers were prioritized, assuming that they may have contained relevant information for diagnosis. In this way, the fused image I f u s e d integrated the superficial and deep features of the tissue, preserving the variations in the density and contrast (Figure 5).
I fused ( x , y ) = i = 1 N w i · I i ( x , y )
D. Fusion using Wavelet–PCA is a multi-scale approach that enables the integration of multiple images, thereby optimizing the representation after merging the different layers. PCA was applied to obtain an image that summarized the most significant variance in the set. The first seven principal components were considered to generate a fused image containing the global structure represented by a low-frequency sub-band, L L fus . Afterward, the surface layer P C Synt 1 was selected as a reference to apply a level-1 Wavelet decomposition using the Daubechies-4 (db2) filter. From this, the high-frequency bands L H ref ,   H L ref ,   and   H H ref , which contained information regarding the edges and textures, were extracted. The final image was reconstructed using the Inverse Wavelet Transform (IWT), integrating the global structure obtained through PCA and the finer details from the reference image (Equation (10)). Figure 6 shows a schematic representation of this method.
W = IWT ( L L fus ,   L H ref ,   H L ref ,   H H ref )

3.3.3. Feature Extraction and Classification

Each of the variation maps generated using the previous integration and fusion methods offers a representation of the changes captured in the breast tissues, merging all the information contained in the EIM layers. The proposed EIM image analysis method focuses on distinguishing between cases with malignant lesions and those without (healthy). It is expected that a simplified representation of the EIM layers will enable an integrated view that helps to improve the performance in automatic breast cancer classification based on a complementary non-invasive sieving technique. In addition, a variability map simplifies the application of machine learning techniques, particularly automatic classification. Each image was resized to 224 × 224 and normalized to standardize the input for the classifiers.
To perform feature extraction, a VGG19 architecture pre-trained on ImageNet [39] was used as a fixed feature extractor (include_top=False). This configuration excluded the fully connected layers and retained the convolutional base, which consisted of 16 convolutional layers organized into five blocks. Each block was followed by a max-pooling layer, progressively reducing the spatial dimensions while increasing the abstraction. The resized EIM images were passed through this convolutional base, and the resulting feature maps output by the final block were flattened into one-dimensional vectors, preserving the hierarchical and spatial structure learned by the network. This approach followed the standard design and usage patterns of CNNs, as described in [40]. In the context of medical image analysis, using deep networks as fixed extractors has been shown to enhance the classification robustness, particularly when working with uncertainty-aware or noise-sensitive data [41]. Even in related domains such as ECG signal classification, the extraction of deep, abstract features using pre-trained architectures has proven helpful in improving the prediction quality [42]. After processing an EIM image, the output of the last convolutional block in VGG19 provided a vector with a length of 7 × 7 × 512 = 25,088 features, which served as the input for the classifiers. In this way, the deep visual descriptors encapsulated the most relevant spatial and semantic information in the image, allowing traditional classifiers to operate effectively in this transformed feature space. For experimental purposes, the performance of several classifiers, including Logistic Regression, Random Forest, bagging, and XGBoost [43,44,45,46], were tested with the features described in the variability maps.

4. Results

This section presents the results obtained by applying the aforementioned methodology for combining the information in the EIM layers, casting the problem as a classification task for experimental purposes using different classifiers, including Logistic Regression and Random Forest, as well as two well-known ensemble methods: bagging and XGBoost. A cross-validation was implemented to ensure data variability using seven folds. All the experiments were implemented using Python 3.10 (Python Software Foundation), including the NumPy and Pandas libraries for data handling, OpenCV and scikit-image for image preprocessing, TensorFlow/Keras for feature extraction using pre-trained CNNs (e.g., VGG19), and scikit-learn for training and evaluating traditional classifiers. Visualization tasks were carried out using Matplotlib version 3.7.5 (maintained by NumFOCUS).
Table 3 shows some examples of EIM images labeled with their corresponding BI-RADS grade after applying the integration and fusion methods. The color scale (Figure 1) shows the more dense zones in yellow-red tones, while the less dense zones appear in blue-cyan tones. The integration methods maintained a dense central zone (nipple) with a low level of suspicion (BI-RADS grades 1–2), which is often used as a reference. However, in the case of a high level of suspicion (BI-RADS grades 3–5), the CV appears to fail in maintaining this type of information. When using CVCLAHE, the transitions towards the peripheral areas were progressive, improving the differentiation between regions with heterogeneous densities and facilitating the identification of patterns associated with glandular structures or suspicious lesions. On the other hand, the CRMS accentuated the dense regions with more abrupt transitions and tended to thicken the denser areas, which could generate a loss of continuity in the transition towards less dense regions and make interpretation difficult for a clinic, as visual artifacts may be mistaken for real anomalies.
Fusion methods also highlighted the dense central zone, although in a more limited manner compared to the integration methods, retaining this information only up to a BI-RADS grade of 3. CLAHEF equilibrated the enhancement of high-density zones, generating a homogeneous representation that minimized visual noise. However, it also maintained the definition of structures and the subtle changes in peripheral areas, which was very useful for highlighting the differences between regions. The results obtained using the Gaussian pyramid and weighted average fusion methods were very similar to those obtained using CLAHEF. However, lower definition was observed between adjacent areas in the former. Finally, with Wavelet–PCA, defined areas were generated in the central and peripheral regions. High-density zones presented considerable definition, while those of a lower density maintained a gradual transition.
To complement the analysis presented in Table 3, the original set of EIM images used as the input for each of the methods evaluated is included in Figure 7. The set comprises seven layers corresponding to different tissue depths in the breast. These original images are presented to provide a visual context for the structural composition prior to the application of integration and fusion methods.
When interpreting EIM images, the choice of the method can significantly influence the perception of their features. Some techniques may enhance the ability to identify critical information, while others may introduce barriers to proper interpretation. This distinction is vital, especially in the realm of automatic medical image analysis, where it can make a significant difference in achieving an opportune and accurate diagnosis. To assess the usefulness of these methods in the context of an image classification task, experiments were conducted using the different classifiers to identify the EIM images as causing low or high suspicion. Utilizing metrics such as the accuracy and F1-score allowed us to assess the effectiveness of the predictions while also taking the class imbalance into account, an essential factor in medical data. Moreover, metrics like the recall and precision provided critical insights into the positive classification of the samples.
Before presenting the classification results, we will describe a series of preliminary experiments that were conducted to determine the most suitable CNN for feature extraction. Three widely used architectures were tested: VGG19, VGG16, and ResNet. Although VGG16 required a lower computational cost, it slightly underperformed in terms of capturing the subtle structures present in EIM images. ResNet, on the other hand, exhibited unstable behavior and high variability across the metrics, likely due to its residual architecture not adapting well to the particular texture and contrast of medical images. VGG19 emerged as the most effective and reliable extractor. Its deeper structure allowed it to capture more complex spatial patterns and subtle variations in the tissue density. Across the board, classification models using features extracted with VGG19 achieved higher accuracy and F1-scores, along with lower standard deviations. Based on these findings, the main experiments proceeded using VGG19, ensuring a more stable and robust analysis of the classification of EIM images.
To prevent overfitting during classification using VGG19 caused by potentially correlated features, an assessment of the multicollinearity was conducted. To verify this, the Variance Inflation Factor (VIF) was computed for the features extracted by VGG19, of which 14 produced valid VIF scores with values ranging between 1 and 5 and only 1 slightly exceeded 5 (VIF ≈ 5.27), indicating low-to-moderate correlations. These results confirm that multicollinearity was not a limiting factor in the performance or interpretability of the logistic regression classifier used in this study [47,48].
Table 4 shows the classification results obtained with the use of the integration methods. Overall, the CV achieved the best performance when used with different classifiers, particularly Logistic Regression. However, the best performance in terms of the precision and recall was achieved by CVCLAHE with the same classifier. Finally, the CRMS showed the lowest results with most classifiers. On the other hand, the results of the fusion methods (Table 5) stand out, suggesting these were the most efficient approaches. Notably, the best results across the different metrics were achieved with Random Forest and XGBoost.

Discussion

The results obtained in this study reinforce the hypothesis that the quality of the visual representation derived from EIM images significantly impacts the performance of automatic classifiers. By generating variability maps using integration and fusion methods, it was possible to enhance the visibility of relevant patterns and reduce the inter-layer variability, thereby enabling traditional classifiers such as Random Forest, XGBoost, and Logistic Regression to achieve performance levels comparable to—or even surpassing—those reported using more complex approaches.
These findings expand upon the contributions made in earlier work by Romero et al. [9,16], where EIM images were classified using a multiclass BI-EIM labeling scheme (levels 1 to 5). In their first study [9], various feature selection techniques and classifiers such as SVM and k-NN were explored, achieving a maximum accuracy of 76.0% with raw, unnormalized images using k-NN. Later, in [16], deep learning models like VGG-16 and Inception were incorporated via transfer learning, showing improved performance, particularly for the high-risk BI-EIM5 class, with F1-scores above 85% when combined with 5-NN.
In contrast, the proposed approach focuses on selecting only the relevant information from all the layers and performing a binary classification task (low suspicion vs. high suspicion). This early fusion generates variability maps that enhance the representation of diagnostically relevant information. Among the methods tested, Wavelet–PCA fusion achieved the best results, with an accuracy of 89.5% and an F1-score of 81.5% when used with XGBoost. Additionally, strong performances were achieved with Random Forest and Logistic Regression, utilizing both Wavelet–PCA and the CV, with F1-scores exceeding 80%.
While previous studies focused on analyzing the statistical conductivity values or classifying individual EIM slices, our proposed method directly employs complete EIM images to build integrated representations. This approach demonstrates that it is possible to identify patterns associated with breast lesions by fusing EIM layers rather than analyzing each one separately. Moreover, the results suggest that such an integration allows for the preservation of relevant diagnostic details across the depths while simplifying both visual interpretation and the automatic classification process.
Overall, the results suggest that integration using the CV and fusion through Wavelet–PCA are the most effective strategies for enhancing the discriminative power of EIM images. When comparing the two types of preprocessing, Wavelet–PCA ranked as the most effective global approach, consistently outperforming integration techniques in terms of its accuracy and F1-score. However, the CV remains a highly competitive option, especially when paired with simpler, computationally efficient classifiers. These findings confirm that the success of EIM-based classification is closely linked not only to the model architecture but also, more importantly, to the quality of the image representation used as the input.
The current methodology is restricted to binary classification based on the grade. While this approach is practical, it requires a more extensive and balanced dataset. Therefore, it is essential to increase the number of samples, which would also enable testing with advanced machine learning techniques, such as convolutional neural networks (CNNs) or deep learning (DL) models.

5. Conclusions

This study addressed the impact of applying integration and fusion image techniques to EIM images. The aim of applying these methods was to identify the most relevant regions of variability across the EIM layers. The results showed that the image processing technique used had a direct impact on the classifier’s performance. In particular, Wavelet–PCA fusion achieved the best global results since it combined multiscale components with dimensionality reduction techniques. On the other hand, integration with the CV offers an effective alternative that could be particularly useful when employing linear models, such as Logistic Regression. In essence, these classification measures reflect the potential of the computed information to improve the classification results.
Furthermore, it was demonstrated that the information in EIM images can be enhanced by employing image processing and artificial intelligence techniques without using more complex computational approaches. The results of the proposed methodology represent a step towards more useful and explainable diagnostic support tools in the context of complementary screening techniques for breast cancer prevention. To continue exploring the information that EIM images could bring to breast cancer research, more data are required. Increasing the number of annotated samples is considered a key component to focus on in the future and will enable tests using other advanced machine learning techniques under a multiclass scheme. Additionally, anthropometric and clinical data could also be analyzed.

Author Contributions

Conceptualization, D.I.H.-F. and H.P.-B. and B.M.-O.; methodology, J.A.-G.; software, J.A.-G.; validation, J.A.-G. and D.I.H.-F. and B.M.-O.; investigation, J.A.-G. and D.I.H.-F. and H.P.-B. and B.M.-O.; resources, and B.M.-O.; writing—original draft preparation, J.A.-G. and D.I.H.-F. and H.P.-B.; writing—review and editing, D.I.H.-F. and H.P.-B. and B.M.-O.; supervision, D.I.H.-F. and H.P.-B.; funding acquisition, and B.M.-O. All authors have read and agreed to the published version of the manuscript.

Funding

This research was funded by the IMSS through the project R-2017-785-108.

Institutional Review Board Statement

The study was conducted according to the guidelines of the Declaration of Helsinki, and approved by the Ethics Committee of IMSS (R-2017-785-108, 16 October 2017).

Informed Consent Statement

Informed consent was obtained from all subjects involved in the study.

Data Availability Statement

The data used in this research are part of an ongoing project by the IMSS and are available upon request. To request them, please contact Blanca Murillo-Ortiz at blanca.murillo@imss.gob.mx.

Acknowledgments

The authors thank the support provided by the IMSS through the project R-2017-785-108, as well as the Secretariat of Science, Technology, and Innovation (SECIHTI, Mexico) for the scholarship, which was fundamental to the development of this research.

Conflicts of Interest

The authors declare no conflict of interest.

References

  1. World Health Organization. Breast Cancer. In WHO Fact Sheets; World Health Organization: Geneva, Switzerland, 2020. [Google Scholar]
  2. INEGI. Estadisticas a Propósito del Día Internacional de la Lucha Contra el Cáncer de Mama (19 de Octubre); Comunicado de prensa número 595/23; INEGI: Aguascalientes, Mexico, 2023. [Google Scholar]
  3. Ghadge, D.; Hon, S.; Saraf, T.; Wagh, T.; Tambe, A.; Deshmukh, Y. Analysis on Machine Learning-Based Early Breast Cancer Detection. In Proceedings of the 2024 4th International Conference on Innovative Practices in Technology and Management (ICIPTM), Noida, India, 21–23 February 2024; pp. 1–5. [Google Scholar] [CrossRef]
  4. National Breast and Ovarian Cancer Centre. Breast Cancer Risk Factors: A Review of the Evidence; National Breast and Ovarian Cancer Centre: Surry Hills, NSW, Australia, 2009. [Google Scholar]
  5. Mendelson, E.B.; Baum, J.K.; Berg, W.A.; Merritt, C.R.; Rubin, E. ACR BI-RADS® Mammography. Breast Imaging Report. Data Syst. (BI-RADS) 2001, 4, 43–53. [Google Scholar]
  6. Samala, R.K.; Chan, H.P.; Hadjiiski, L.; Helvie, M.A.; Richter, C.D.; Cha, K.H. Breast Cancer Diagnosis in Digital Breast Tomosynthesis: Effects of Training Sample Size on Multi-Stage Transfer Learning Using Deep Neural Nets. IEEE Trans. Med Imaging 2019, 38, 686–696. [Google Scholar] [CrossRef]
  7. Poplack, S.P.; Tosteson, A.N.; Kogel, C.A.; Nagy, H.M. Digital breast tomosynthesis: Initial experience in 98 women with abnormal digital screening mammography. AJR Am. J. Roentgenol. 2007, 189, 616–623. [Google Scholar] [CrossRef]
  8. Henry, N.; Wagner, M.D., Jr.; Peter, S.; Conti, M.D.P. The impact of early detection on cancer survival. J. Clin. Oncol. 2019, 37, 123–132. [Google Scholar]
  9. Romero Coripuna, R.L.; Hernández Farías, D.I.; Murillo Ortiz, B.O.; Padierna, L.C.; Fraga, T.C. Machine Learning for the Analysis of Conductivity From Mono Frequency Electrical Impedance Mammography as a Breast Cancer Risk Factor. IEEE Access 2021, 9, 152397–152407. [Google Scholar] [CrossRef]
  10. Chen, H.; Zhang, L.; Wu, Z.; Li, P. Electrical impedance tomography of breast cancer: Clinical trial results. IEEE Trans. Med Imaging 2016, 35, 722–730. [Google Scholar]
  11. Brown, J.; Wilson, E.; Bradley, P. Electrical impedance spectroscopy for breast cancer diagnosis: A clinical study. J. Clin. Oncol. 2017, 35, 45–52. [Google Scholar]
  12. Sotskova, N.; Karpov, A.; Korotkova, M.; Sentcha, A. Particularities of electrical impedance images in different forms of growth of infiltrative breast cancer. In Proceedings of the 11th International Conference on Electrical Bioimpedance (ICEBI), Graz, Austria, 29 August–2 September 2007; Scharfetter, H., Merwa, R., Eds.; Springer: Berlin/Heidelberg, Germany, 2007; pp. 560–563. [Google Scholar] [CrossRef]
  13. Raneta, O.; Ondruš D., B.V. Utilisation of Electrical Impedance Tomography in Breast Cancer Diagnosis. Klin Onkol. 2012, 25, 36–41. [Google Scholar]
  14. Korotkova, M.; Karpov, A.; Machin, M.; Tsofin, Y.; Tsyplyonkov, V.; Tchayev, A. Electric Impedance Imaging of the Mammary Gland in Circumstances of Skin Abnormality or Damage; Clinical Hospital №9: Yaroslavl, Russia, 2002. [Google Scholar]
  15. Karpov, A.; Korotkova, M. Diagnostic criteria for mass lesions differentiating in electrical impedance mammography. J. Physics Conf. Ser. 2013, 434, 012053. [Google Scholar] [CrossRef]
  16. Romero Coripuna, R.L.; Hernández Farías, D.I.; Murillo Ortiz, B.O.; Córdova Fraga, T. Electro-impedance mammograms for automatic breast cancer screening: First insights on Mexican patients. J. Intell. Fuzzy Syst. 2021, 42, 4659–4671. [Google Scholar] [CrossRef]
  17. Kurinjimalar, R.; Pradeep, J.; Harikrishnan, M. Underwater Image Enhancement Using Gaussian Pyramid, Laplacian Pyramid and Contrast Limited Adaptive Histogram Equalization. In Proceedings of the 2024 IEEE 3rd World Conference on Applied Intelligence and Computing (AIC), Gwalior, India, 27–28 July 2024; pp. 729–734. [Google Scholar] [CrossRef]
  18. Bhat, M.; S, T.P.M. Adaptive clip limit for contrast limited adaptive histogram equalization (CLAHE) of medical images using least mean square algorithm. In Proceedings of the 2014 IEEE International Conference on Advanced Communications, Control and Computing Technologies, Ramanathapuram, India, 8–10 May 2014; pp. 1259–1263. [Google Scholar] [CrossRef]
  19. Sousa, A.L.; Villar, S.A.; Korneta, W.; Acosta, G.; Rozenfeld, A. Resonancia estocástica para el mejoramiento del contraste y calidad en imágenes acústicas de sonar de barrido lateral. In Proceedings of the 2016 IEEE Biennial Congress of Argentina (ARGENCON), Buenos Aires, Argentina, 15–17 June 2016; pp. 1–6. [Google Scholar] [CrossRef]
  20. Chang, C.I.; Liang, C.C.; Hu, P.F. Iterative Gaussian–Laplacian Pyramid Network for Hyperspectral Image Classification. IEEE Trans. Geosci. Remote Sens. 2024, 62, 5510122. [Google Scholar] [CrossRef]
  21. Reza, A. Realization of the Contrast Limited Adaptive Histogram Equalization (CLAHE) for Real-Time Image Enhancement. J. Vlsi Signal-Process.-Syst. Signal Image Video Technol. 2004, 38, 35–44. [Google Scholar] [CrossRef]
  22. Wu, J.; Liu, J.; Tian, J.; Yin, B. Wavelet-based Remote Sensing Image Fusion with PCA and Feature Product. In Proceedings of the 2006 International Conference on Mechatronics and Automation, Luoyang, China, 25–28 June 2006; pp. 2053–2057. [Google Scholar] [CrossRef]
  23. Krishn, A.; Bhateja, V.; Himanshi; Sahu, A. Medical image fusion using combination of PCA and wavelet analysis. In Proceedings of the 2014 International Conference on Advances in Computing, Communications and Informatics (ICACCI), Delhi, India, 24–27 September 2014; pp. 986–991. [Google Scholar] [CrossRef]
  24. Taxak, N.; Singhal, S. High PSNR based Image Fusion by Weighted Average Brovery Transform Method. In Proceedings of the 2019 Devices for Integrated Circuit (DevIC), Kalyani, India, 23–24 March 2019; pp. 451–455. [Google Scholar] [CrossRef]
  25. Pessoa, D.; Petmezas, G.; Papageorgiou, V.E.; Rocha, B.M.; Stefanopoulos, L.; Kilintzis, V.; Maglaveras, N.; Frerichs, I.; de Carvalho, P.; Paiva, R.P. Pediatric Respiratory Sound Classification Using a Dual Input Deep Learning Architecture. In Proceedings of the IEEE BioCAS Grand Challenge, Toronto, ON, Canada, 19–21 October 2023. [Google Scholar]
  26. Wu, Y.; Rocha, B.M.; Kaimakamis, E.; Cheimariotis, G.A.; Petmezas, G.; Chatzis, E.; Kilintzis, V.; Stefanopoulos, L.; Pessoa, D.; Marques, A.; et al. A Deep Learning Method for Predicting the COVID-19 ICU Patient Outcome Fusing X-rays, Respiratory Sounds, and ICU Parameters. Expert Syst. Appl. 2024, 235, 121089. [Google Scholar] [CrossRef]
  27. Azam, K.S.F.; Ryabchykov, O.; Bocklitz, T. A Review on Data Fusion of Multidimensional Medical and Biomedical Data. Molecules 2022, 27, 7448. [Google Scholar] [CrossRef]
  28. Murillo-Ortiz, B.; Rodríguez-Penin, A.; Hernández-Ramírez, A.; Rivera-Villanueva, T.; Moran-Gonzalez, A.E.; Martínez-Garza, S.; Suárez-García, D.; Pérez-Murguía, M.; Romero-Coripuna, R. Diagnóstico de cáncer de mama mediante mamografía por electroimpedancia computarizada MEIK. Rev. Mex. Mastología 2019, 9, 20–28. [Google Scholar]
  29. Zarafshani, A.; Bach, T.; Chatwin, C.R.; Tang, S.; Xiang, L.; Zheng, B. Conditioning Electrical Impedance Mammography System. Measurement 2018, 116, 38–48. [Google Scholar] [CrossRef]
  30. Daglar, G.; Senol, K.; Yakut, Z.; Yuksek, Y.; Tutuncu, T.; Tez, M.; Yesiltepe, C. Effectiveness of breast electrical impedance imaging for clinically suspicious breast lesions. Bratisl. Med. J. 2016, 117, 505–510. [Google Scholar] [CrossRef]
  31. Aibar, L.; Santalla, A.; López-Criado, M.S.; González–Pérez, I.; Calderón, M.; Gallo, J.; Fernández-Parra, J. Clasificación radiológica y manejo de las lesiones mamarias. Clínica Investig. Ginecol. Obstet. 2011, 38, 141–149. [Google Scholar] [CrossRef]
  32. Alexander Karpov, A.K.; Korotkova, M. An Electrical Impedance Mammographic Scheme—Norms and Pathology. In Mammography Techniques and Review; IntechOpen: London, UK, 2015. [Google Scholar] [CrossRef]
  33. Gonzalez, R.C.; Woods, R.E. Digital Image Processing; Pearson: Upper Saddle River, NJ, USA, 2008. [Google Scholar]
  34. Alvarado-Godínez, J.; Peregrina-Barreto, H.; Farías, D.I.H.; Ortiz, B.O.M. Automatic Breast Lesions Classification in Electrical Impedance Mammography. In Proceedings of the 2024 IEEE International Autumn Meeting on Power, Electronics and Computing (ROPEC 2024), Ixtapa, Mexico, 11–13 November 2024. [Google Scholar]
  35. Peli, E. Contrast in complex images. J. Opt. Soc. Am. A 1990, 7, 2032–2040. [Google Scholar] [CrossRef]
  36. Chang, Y.; Jung, C.; Ke, P.; Song, H.; Hwang, J. Automatic Contrast-Limited Adaptive Histogram Equalization with Dual Gamma Correction. IEEE Access 2018, 6, 11782–11792. [Google Scholar] [CrossRef]
  37. Burt, P.J.; Adelson, E.H. The Laplacian Pyramid as a Compact Image Code. IEEE Trans. Commun. 1983, 31, 532–540. [Google Scholar] [CrossRef]
  38. Yin, H. Tensor Sparse Representation for 3-D Medical Image Fusion Using Weighted Average Rule. IEEE Trans. Biomed. Eng. 2018, 65, 2622–2633. [Google Scholar] [CrossRef]
  39. Simonyan, K.; Zisserman, A. Very deep convolutional networks for large-scale image recognition. arXiv 2014, arXiv:1409.1556. [Google Scholar]
  40. Zhao, X.; Wang, L.; Zhang, Y.; Han, X.; Deveci, M.; Parmar, M. A review of convolutional neural networks in computer vision. Artif. Intell. Rev. 2024, 57, 99. [Google Scholar] [CrossRef]
  41. Papageorgiou, V.E.; Petmezas, G.; Dogoulis, P.; Cordy, M.; Maglaveras, N. Uncertainty CNNs: A path to enhanced medical image classification performance. Math. Biosci. Eng. 2025, 22, 528–553. [Google Scholar] [CrossRef]
  42. Papageorgiou, V.E.; Zegkos, T.; Efthimiadis, G.; Tsaklidis, G. Analysis of digitalized ECG signals based on artificial intelligence and spectral analysis methods specialized in ARVC. Int. J. Numer. Methods Biomed. Eng. 2022, 38, e3644. [Google Scholar] [CrossRef]
  43. Berkson, J. Application of the Logistic Function to Bio-Assay. J. Am. Stat. Assoc. 1944, 39, 357–365. [Google Scholar] [CrossRef]
  44. Segal, M.R. Machine Learning Benchmarks and Random Forest Regression; UCSF: Center for Bioinformatics and Molecular Biostatistics: San Francisco, CA, USA, 2004. [Google Scholar]
  45. Breiman, L. Bagging predictors. Mach. Learn. 1996, 24, 123–140. [Google Scholar] [CrossRef]
  46. Chen, T.; Guestrin, C. XGBoost: A Scalable Tree Boosting System. In Proceedings of the KDD ’16: 22nd ACM SIGKDD International Conference on Knowledge Discovery and Data Mining, New York, NY, USA, 13–17 August 2016; pp. 785–794. [Google Scholar] [CrossRef]
  47. Georgakis, A.; Papageorgiou, V.E.; Gatziolis, D.; Stamatellos, G. Temporal-Like Bivariate Fay-Herriot Model: Leveraging Past Responses and Advanced Preprocessing for Enhanced Small Area Estimation of Growing Stock Volume. SN Oper. Res. Forum 2024, 5, 9. [Google Scholar] [CrossRef]
  48. Georgakis, A.; Papageorgiou, V.E.; Stamatellos, G. A new approach to small area estimation: Improving forest management unit estimates with advanced preprocessing in a multivariate Fay–Herriot model. Forestry 2024, 1–18. [Google Scholar] [CrossRef]
Figure 1. Images of the seven layers in an EIM package representing the breast tissue information at different depths, from the most superficial (Layer 1) to the deepest (Layer 7). The color bar is associated with the conductivity index (IC) scale.
Applsci 15 07735 g001
Figure 2. Diagram of the process followed to analyze the EIM images.
Applsci 15 07735 g002
Figure 3. Scheme of EIM integration using C RMS .
Applsci 15 07735 g003
Figure 4. Graphical representation of Gaussian pyramid fusion applied to EIM.
Applsci 15 07735 g004
Figure 5. Image fusion using weighted average.
Applsci 15 07735 g005
Figure 6. Wavelet–PCA fusion applied to EIM images.
Applsci 15 07735 g006
Figure 7. The original sample of EIM images consisting of seven layers used as the input for the integration and fusion methods, whose results are presented in Table 3.
Applsci 15 07735 g007
Table 1. Correspondence between BI-RADS and EIM scales.
BI-RADSEIM InterpretationEIM Scale
0Insufficient sampleNo score
1Undefined lesion0–1
2Benign tumors—routine mammography2–3
3Probably benign4
4Suspicious anomaly—biopsy recommended5–7
5High suspicion of malignancy—biopsy and treatment8–10
Table 2. Description summary of MEX-IEM-DB database.
FeatureDescription
Number of patients340 (BR1 = 85, BR2 = 85, BR3 = 128, BR4 = 38, BR5 = 4)
EIM package7 images per breast
Number of images4760 ( 288 × 288 pixels)
Age range25 to 70 years old
Study designClinical, epidemiological, observational, prospective, cross-sectional, and serial screening study
Device usedMEIK v.5.6 (SIM-technika, Russia, Yaroslavl)
Exploration depthsFrom the surface to the inner layers of the breast tissue
Physiological conditions consideredPregnancy, breastfeeding, recent hormonal or surgical treatments, breast prostheses due to mastectomy or cosmetic surgery, etc.
Risk factorsAge of patient, body mass index, parity, age at menarche, age at menopause, hormonal therapy, family history of breast cancer, alcohol consumption, and smoking
Table 3. Visual comparison of the integration and fusion methods applied to the EIM images. Each row (B1–B5) represents a different BI-RADS grade. According to the color scale, red tones indicate regions of higher electrical conductivity (denser fibroglandular tissue), while blue tones represent areas of lower conductivity (fatty tissue).
Integration MethodsFusion Methods
CVCVCLAHECRMSCLAHEFGaussian PyramidWeighted Avg.Wavelet–PCA
B1Applsci 15 07735 i001Applsci 15 07735 i002Applsci 15 07735 i003Applsci 15 07735 i004Applsci 15 07735 i005Applsci 15 07735 i006Applsci 15 07735 i007
B2Applsci 15 07735 i008Applsci 15 07735 i009Applsci 15 07735 i010Applsci 15 07735 i011Applsci 15 07735 i012Applsci 15 07735 i013Applsci 15 07735 i014
B3Applsci 15 07735 i015Applsci 15 07735 i016Applsci 15 07735 i017Applsci 15 07735 i018Applsci 15 07735 i019Applsci 15 07735 i020Applsci 15 07735 i021
B4Applsci 15 07735 i022Applsci 15 07735 i023Applsci 15 07735 i024Applsci 15 07735 i025Applsci 15 07735 i026Applsci 15 07735 i027Applsci 15 07735 i028
B5Applsci 15 07735 i029Applsci 15 07735 i030Applsci 15 07735 i031Applsci 15 07735 i032Applsci 15 07735 i033Applsci 15 07735 i034Applsci 15 07735 i035
Applsci 15 07735 i036
Table 4. Classification results for EIM images processed using integration methods.
ClassifierMethodPositive PredictionsClassifier Performance
RecallPrecisionAccuracyF1–Score
Logistic RegressionCVCLAHE 76.7 ̲ ± 1.3 84.8 ̲ ± 1.6 81.2 ± 0.5 80.1 ± 1.2
C RMS 72.8 ± 1.5 80.8 ± 2.0 78.4 ± 1.2 76.6 ± 1.6
CV 74.0 ± 0.1 83.0 ± 0.1 87.0 ̲ ± 0.1 81.0 ̲ ± 0.1
Random ForestCVCLAHE 73.2 ± 1.6 82.9 ̲ ± 1.9 81.5 ̲ ± 1.5 79.9 ̲ ± 1.2
C RMS 75.7 ± 1.4 78.7 ± 1.9 77.1 ± 1.6 77.2 ± 1.5
CV 78.0 ̲ ± 0.2 78.0 ± 0.1 79.0 ± 0.1 77.0 ± 0.1
BaggingCVCLAHE 72.0 ̲ ± 1.7 81.6 ̲ ± 1.8 77.0 ± 1.4 75.7 ± 1.7
C RMS 71.3 ± 1.6 79.1 ± 1.7 76.6 ± 1.7 75.0 ± 1.5
CV 71.0 ± 0.1 80.0 ± 0.0 84.0 ̲ ± 0.1 78.0 ̲ ± 0.1
XGBoostCVCLAHE 71.5 ± 1.9 83.1 ̲ ± 1.8 79.4 ± 1.6 76.7 ̲ ± 1.8
C RMS 71.1 ± 1.6 79.6 ± 1.7 77.4 ± 1.8 75.2 ± 1.7
CV 74.0 ̲ ± 0.1 81.0 ± 0.1 83.0 ̲ ± 0.1 79.0 ± 0.1
Higher values are shown in bold underlined text.
Table 5. Classification results for EIM images processed using fusion methods.
ClassifierMethodPositive PredictionsClassifier Performance
RecallPrecisionAccuracyF1-Score
Logistic RegressionCLAHEF 76.2 ± 1.6 83.1 ± 1.8 80.6 ± 1.3 79.5 ± 1.7
Gaussian pyramid 76.0 ± 1.8 82.1 ± 1.8 80.7 ± 0.8 79.1 ± 1.3
Weighted Average 75.2 ± 1.6 79.7 ± 1.6 77.8 ± 1.5 77.2 ± 1.7
Wavelet-PCA 77.7 ̲ ± 1.2 85.0 ̲ ± 1.4 81.4 ̲ ± 0.8 81.2 ̲ ± 1.0
Random ForestCLAHEF 75.8 ± 1.6 83.2 ± 1.5 81.1 ± 1.4 79.3 ± 1.4
Gaussian pyramid 76.1 ± 1.6 82.0 ± 1.5 81.6 ± 1.6 78.6 ± 1.6
Weighted Average 74.7 ± 1.7 86.9 ± 1.5 81.9 ± 1.5 80.5 ± 1.6
Wavelet-PCA 77.4 ̲ ± 1.5 91.1 ̲ ± 1.6 87.9 ̲ ± 1.7 83.6 ̲ ± 1.0
BaggingCLAHEF 75.2 ̲ ± 1.4 82.1 ± 1.6 80.0 ± 1.5 78.5 ± 1.5
Gaussian pyramid 74.1 ± 1.5 82.0 ± 1.6 79.9 ± 1.7 77.9 ± 1.6
Weighted Average 73.2 ± 1.5 80.1 ± 1.8 77.4 ± 1.6 76.5 ± 1.7
Wavelet-PCA 74.6 ± 1.8 88.6 ̲ ± 1.6 87.2 ̲ ± 1.4 80.7 ̲ ± 1.2
XGBoostCLAHEF 75.5 ± 1.6 84.0 ± 1.6 81.6 ± 1.3 79.6 ± 1.4
Gaussian pyramid 75.1 ± 1.6 84.0 ± 1.7 80.4 ± 1.5 78.7 ± 1.6
Weighted Average 75.7 ± 1.5 81.4 ± 1.7 78.9 ± 1.6 78.5 ± 1.6
Wavelet-PCA 78.0 ̲ ± 1.5 91.8 ̲ ± 1.5 89.5 ̲ ± 1.6 81.5 ̲ ± 1.5
Higher values are shown in bold underlined text.
Disclaimer/Publisher’s Note: The statements, opinions and data contained in all publications are solely those of the individual author(s) and contributor(s) and not of MDPI and/or the editor(s). MDPI and/or the editor(s) disclaim responsibility for any injury to people or property resulting from any ideas, methods, instructions or products referred to in the content.

