Article

Multiscale Eight Direction Descriptor-Based Improved SAR–SIFT Method for Along-Track and Cross-Track SAR Images

1
College of Surveying and GEO-Informatics, Tongji University, No. 1239 Si Ping Road, Shanghai 200092, China
2
Shanghai Surveying and Mapping Institute, No. 419 Wu Ning Road, Shanghai 200063, China
3
College of Information Technology, Shanghai Ocean University, Shanghai 201306, China
*
Author to whom correspondence should be addressed.
Appl. Sci. 2025, 15(14), 7721; https://doi.org/10.3390/app15147721
Submission received: 1 June 2025 / Revised: 1 July 2025 / Accepted: 5 July 2025 / Published: 10 July 2025
(This article belongs to the Section Earth Sciences)

Abstract

Image matching between spaceborne synthetic aperture radar (SAR) images are frequently interfered with by speckle noise, resulting in low matching accuracy, and the vast coverage of SAR images renders the direct matching approach inefficient. To address this issue, the study puts forward a multi-scale adaptive improved SAR image block matching method (called STSU–SAR–SIFT). To improve accuracy, this method addresses the issue of the number of feature points under different thresholds by using the SAR–Shi–Tomasi response function in a multi-scale space. Then, the SUSAN function is used to constrain the effect of coherent noise on the initial feature points, and the multi-scale and multi-directional GLOH descriptor construction approach is used to boost the robustness of descriptors. To improve efficiency, the method adopts the main and additional image overlapping area matching method to reduce the search range and uses multi-core CPU+GPU collaborative parallel computing to boost the efficiency of the SAR–SIFT algorithm by block processing the overlapping area. The experimental results demonstrate that the STSU–SAR–SIFT approach presented in this paper has better accuracy and distribution. After the algorithm acceleration, the efficiency is obviously improved.

1. Introduction

Image matching is fundamental to methods such as image detection, image stitching, image fusion, and 3D reconstruction [1,2,3,4], with the final accuracy of these methods directly influenced by the number and precision of keypoints. Currently, SAR image matching faces two major challenges: firstly, the ubiquitous speckle noise in SAR images severely degrades the precision of keypoint extraction; secondly, the immense size of these images results in extremely low efficiency of direct matching.
At present, two main strategies can be employed for SAR image matching: area-based and feature-based methods [5,6,7]. Area-based methods register images via the similarity criteria, commonly used ones of which include cross-correlation [8] and mutual information [9], as well as a series of improved methods based on these criteria [10]. Area-based methods mostly estimate matching parameters by computing the information entropy of both the reference and target images, using mutual information between the two images as a similarity criterion, and maximizing the mutual information to convert the matching problem into an optimization problem. However, the primary limitation of this method is that optimization search consumes a lot of time, leading to low matching efficiency. In contrast, feature-based methods extract characteristics from images and determine matching points among these characteristics. Extracting features based on lines and surfaces is a challenging task, and some of these features may not even be present in remote-sensing images [11]. Commonly used features include points, lines, and areas, with point-based feature methods of high accuracy and effectiveness [12], being more widely used in image matching, such as the Scale-invariant feature transform (SIFT) [13] and speeding up robust feature (SURF) [14] algorithms. However, since algorithms like SIFT and SURF amplify speckle noise in SAR images during the establishment of Gaussian difference pyramids, they tend to produce many false feature points during the feature extraction process. To address this issue, numerous scholars have put forward a series of improved algorithms based on the SIFT algorithm [15]. Sedaghat et al. [16] proposed the adaptive control of feature points determined by the quantity of extremum points, mean contrast, and mean entropy within each scale to achieve uniform distribution of image feature points. However, this approach is only suitable for optical images. Wang et al. [17] replaced Gaussian filtering with bilateral filtering and enhanced matching accuracy through a bidirectional matching strategy, but reduced the operational efficiency. In order to preserve more image details and reduce the loss of details, Alcantarilla et al. [18] employed a non-linear filter to construct the scale space. However, this approach reduces the scale invariance. Dellinger et al. [19] put forward the SAR–SIFT algorithm, which calculates the gradient of the SAR image using the Ratio of Exponentially Weighted Averages (ROEWA) operator and takes the logarithm of the gradient to get rid of the impact of speckle noise. Hong et al. [20] proposed the ROEWA–Blocks approach by introducing the ROEWA operator in the SAR–SIFT algorithm. The ROEWA–Blocks algorithm has been used to address the matching problem of the region that may be suddenly darkened in SAR images. However, in these algorithms, speckle noise greatly affects SAR images, making it difficult to directly identify topography. Single-scale feature descriptors are not sufficient to solve the topographic similarity problem caused by speckle noise. The matching accuracy will be low when the number of feature descriptors and feature directions is small. Pallotta et al. [21] proposed a registration algorithm to compensate for the possible inaccuracy of the trajectory sensor during the synthetic aperture radar (SAR) image acquisition process. Pallotta et al. [22] extended the constrained least-squares (CLS) optimization method developed to register multitemporal SAR images affected by a joint rotation effect and range/azimuth shifts enforcing the absence of zooming effects.
In recent years, many deep learning methods have been employed for tie-point extraction in multisource remote sensing imagery. SuperGlue [23] utilizes self-attention and cross-attention mechanisms within graph neural networks to learn features and descriptors. Building on SuperGlue, LightGlue [24] adaptively adjusts the image matching model based on the difficulty of the matches, enhancing efficiency. SODescNet [25] facilitates matching between optical and SAR images using local descriptors. RedFeat [26] employs a mutual weighting strategy to achieve excellent performance in feature matching and image registration tasks.
When processing large SAR images, direct feature matching of satellite images leads to a significant number of redundant calculations due to the small overlapping regions of satellite images, resulting in low efficiency in matching image homologous points. To address this challenge, with the rapid development of computers, parallel computing methods have been widely used in image processing, including three main approaches, namely, (1) methods based on the graphics processing unit (GPU) [27], (2) methods based on open multi-processing (OpenMP), and (3) single-instruction multiple data (SIMD) methods. In terms of architecture, GPUs are designed with more logic operations and smaller caches, making them more suitable for handling data-intensive computational tasks, while CPUs are better suited for processing logic control-intensive tasks, with fewer logic operations and larger caches. Currently, many scholars have improved the SIFT algorithm using GPUs and multi-core CPUs. Feng et al. [28] put forward a parallel SIFT approach to symmetric multiprocessor (SMP) systems, which mainly uses multi-core CPUs to accelerate the construction of feature point detection, descriptor construction, and Gaussian scale space parts of the SIFT algorithm. Wang et al. [29] put forward an approach that relied on Open Computing Language (OpenCL) to enhance the performance of the SIFT approach. Al-Saadi et al. [30] improved CUDA–SIFT to enable it to handle larger image blocks and better allocate video memory space. The algorithms above mainly use memory storage techniques to enhance the computational efficiency of the SIFT approach and only use a single method to accelerate the SIFT algorithm, without considering the different advantages of GPUs, OpenMP, and CPUs and how to combine them for further acceleration.
In summary, although matching approaches for SAR images have achieved significant advancements, further research is needed to solve such problems as a multitude of incorrect feature points resulting from speckle noise, the robustness of feature descriptors, and image matching efficiency.
The proposed methodology in this article offers a robust way to match features, STSU–SAR–SIFT, which is suitable for multi-scene SAR image data, significantly improving both matching accuracy and efficiency.
The noteworthy contributions of this study are:
(1)
A method is put forward to obtain high-precision feature points that are not affected by threshold values by combining current scale information.
(2)
A more robust feature descriptor is constructed using the Gradient Location and Orientation Histogram (GLOH) method with multiple scales and directions.
(3)
An acceleration algorithm based on both CPU and GPU is proposed to develop the matching efficiency of large-area images.
The remaining sections of this paper are organized as follows: Section 2 begins with a brief introduction to the improved method of SAR–SIFT, followed by a description of the modifications proposed in this study. Section 3 reports the experimental results of different methods on various datasets. Section 4 presents the conclusions drawn from the study.

2. Materials and Methods

This manuscript proposes an improved SAR–SIFT method to address the issue of low efficiency and high false feature points when processing large-scale SAR images. Firstly, the redundant calculation is reduced via the block processing of the overlapping region of the master and slave images. Secondly, in feature extraction, by replacing the SAR–Harris response function with SAR–Shi–Tomasi, the quantity of feature points is no longer affected by manually set thresholds, and the SUSAN operator is utilized to suppress multiplicative noise, while the Harris–Laplace operator and a method to determine multi-scale extrema are used to obtain accurate feature point locations. Additionally, a multi-scale and multi-orientation feature descriptor is constructed using GLOH. Thirdly, efficiency is enhanced by utilizing both CPU and GPU for the improved SAR–SIFT algorithm, and the nearest neighbor distance ratio (NNDR) matching approach based on Euclidean distance is employed, followed by the use of the Random Sample Consensus (RANSAC) algorithm to eliminate mismatches. Figure 1 displays the method’s flowchart. Algorithm 1 shows the pseudo-code for the algorithm of this paper.
Algorithm 1: High precision SAR image matching
Input:
k: Scale number of spatial layers
i: Current cycle number
s: SUSAN
st: Shi–Tomasi
Output:
Matchpoints: Matching points of SAR images
Begin
         Constructing scale pyramid
         For k <= i
         Use s to reduce noise effects
           Detect corner points using st
         End for
         Build feature descriptors
         Feature point matching according to descriptor
Return Matchpoints
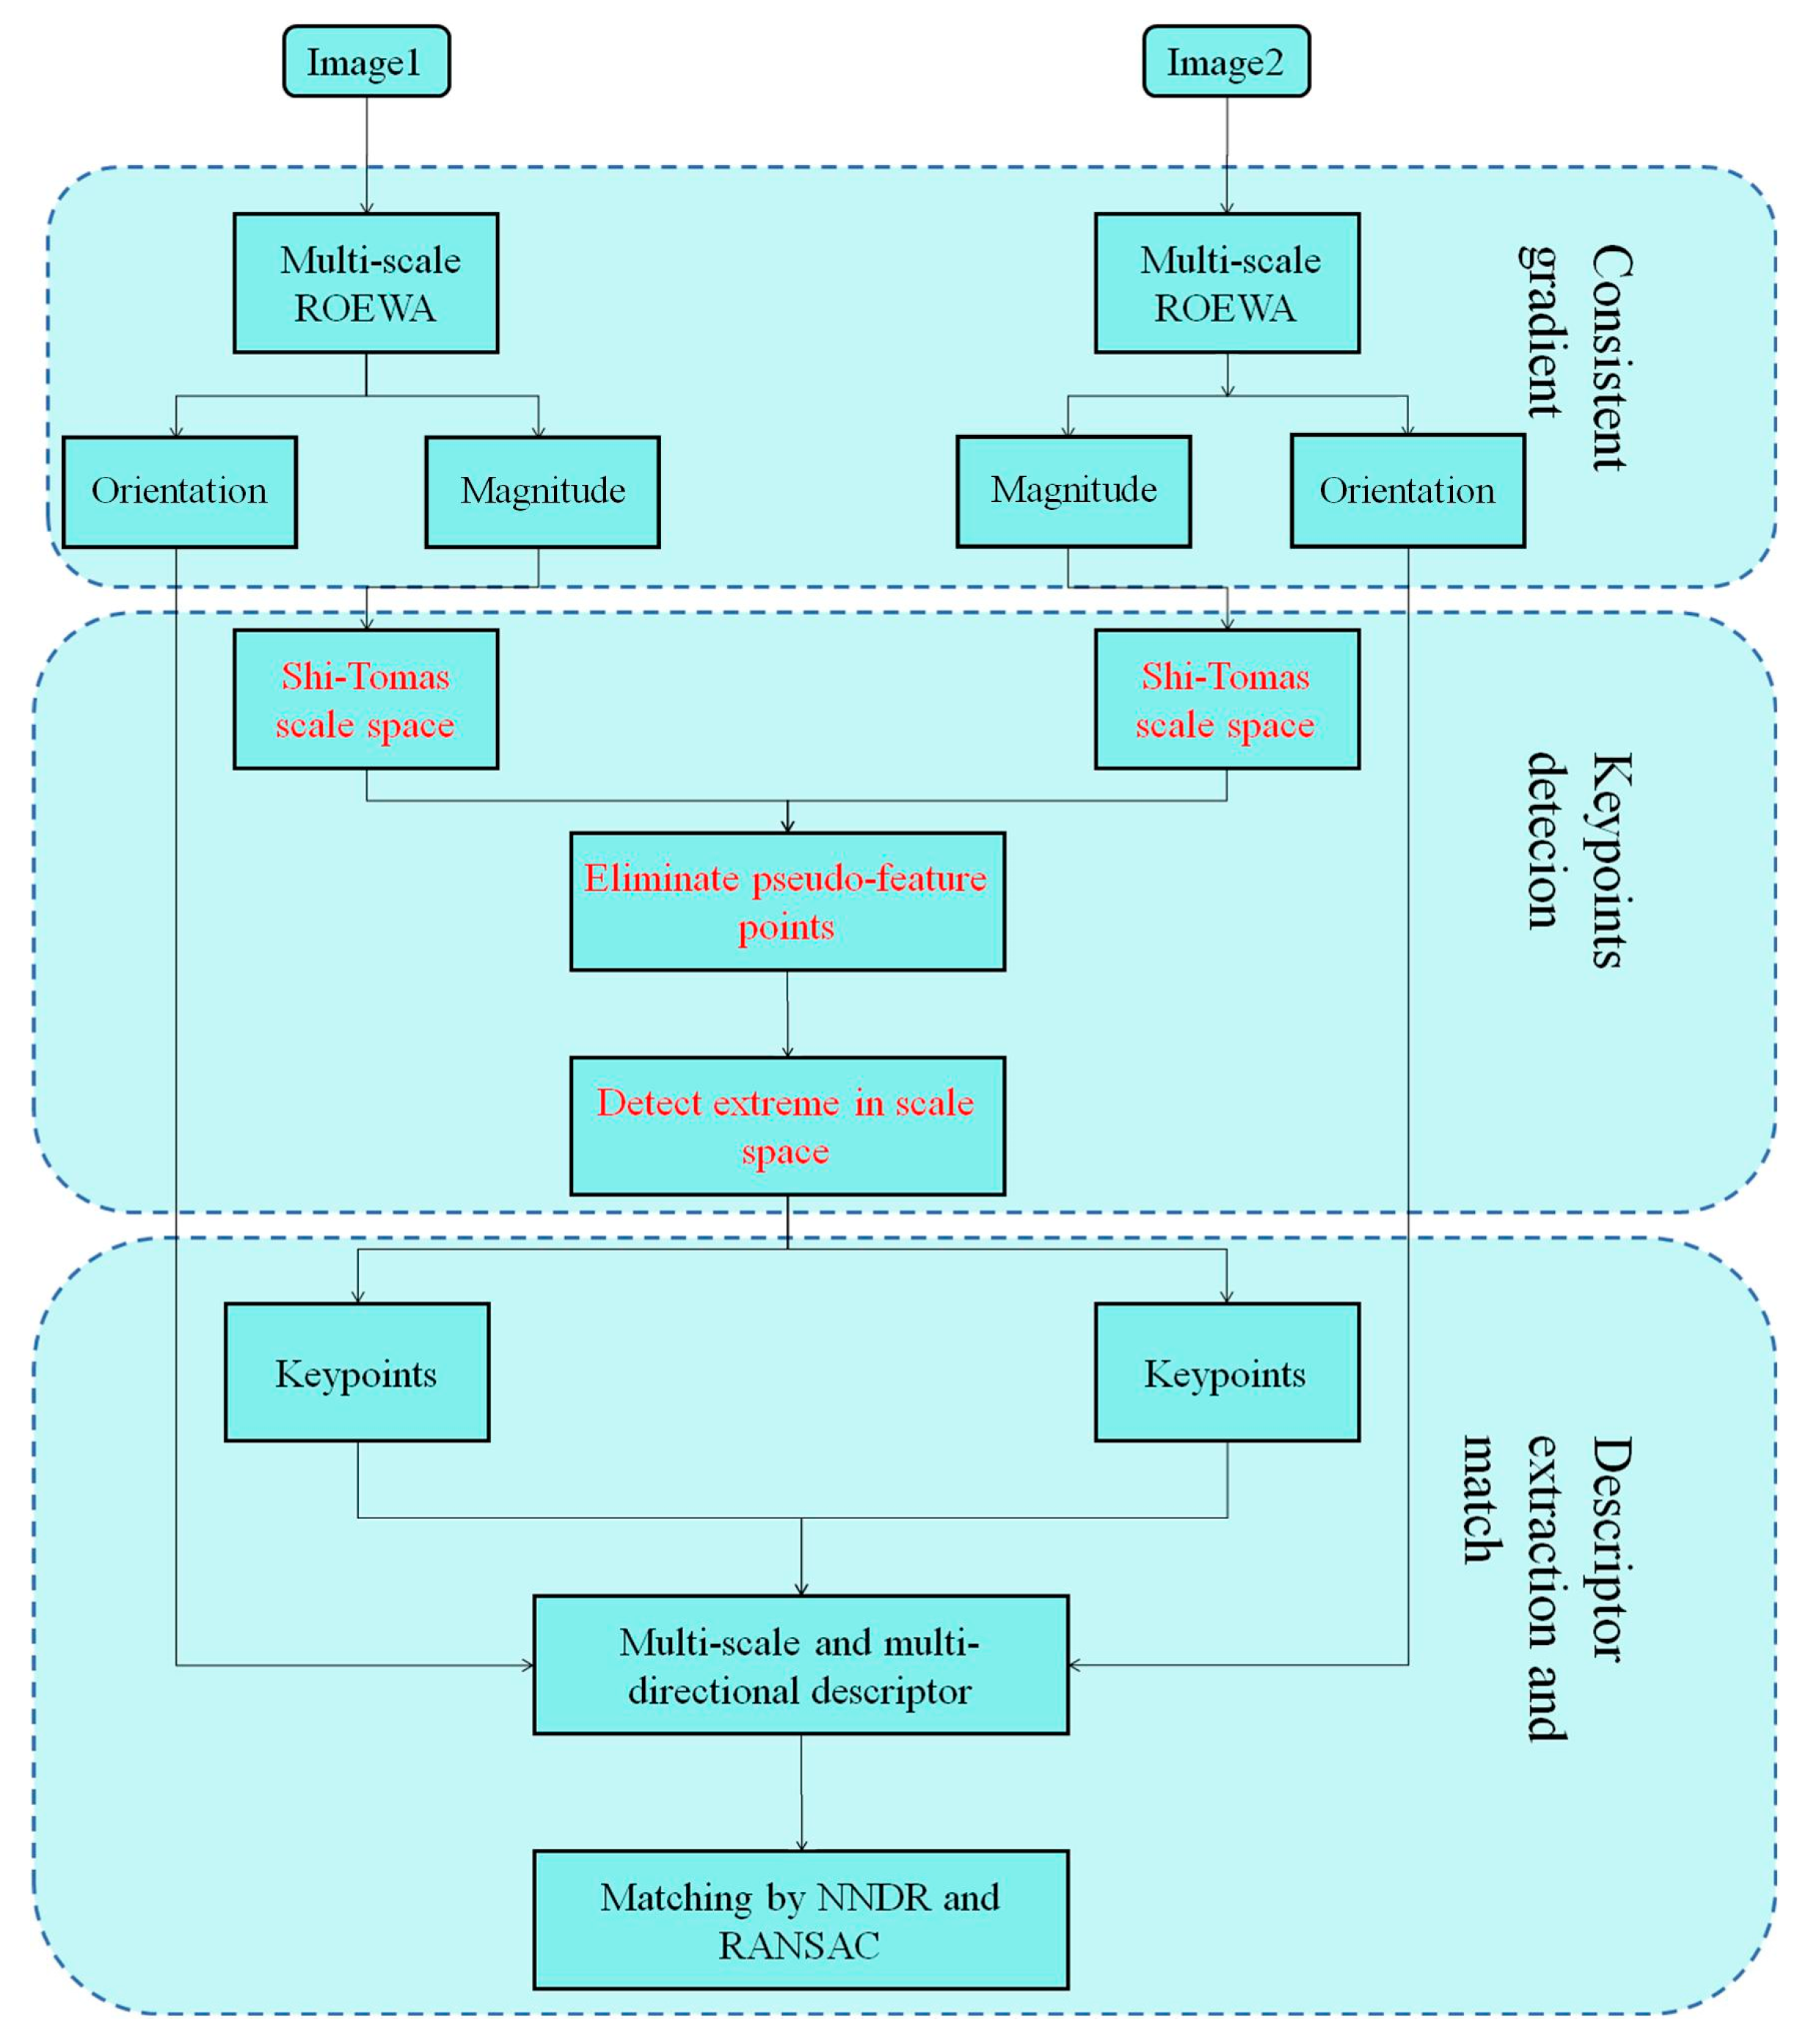
2.1. SAR–SIFT

SAR–SIFT proposes an improved SIFT method that enhances the matching accuracy of SAR images by refining SIFT in terms of feature scale space and feature description. SAR–SIFT computes the image gradient using ROEWA and generates scale space via Gaussian blurring. The response function of scale space is as follows [13]:
σ i = σ 0 k i t i = 1 2 σ i 2 , k = 2 1 3 , i 0 S 1
where the first layer’s scale parameter is represented by σ 0 , S represents the quantity of scale layers, k represents the constant scale ratio. In SAR–SIFT and this paper, the parameter σ 0 = 2, S = 8, k = 2 3 .
The SAR–HARRIS response function and its corresponding response value at each scale level are computed as follows [19]:
C SH = g 2 σ ( G x , σ ) 2 ( G x , σ ) ( G y , σ ) ( G x , σ ) ( G y , σ ) ( G y , σ ) 2
R = det C SH x , y , σ t × t r C SH x , y , σ
where C SH denotes the SAR–HARRIS response matrix, g 2 σ is the Gaussian kernel with standard deviation 2 σ , * represents the convolution operation, G x , σ and G y , σ are the responses of the ROWEA filter in the horizontal and vertical directions, respectively; det denotes the determinant of the matrix, tr denotes the trace of the matrix, t is an empirical value usually between 0.04 and 0.06, and R is for the SAR–HARRIS corner point detector.
After constructing the scale space, feature points are determined using a response function. First, a threshold is set, and corner points with response values greater than this threshold are selected as candidate feature points. Then, local extrema are identified within a 3 × 3 neighborhood around each candidate point at the same scale to verify whether the response value is the maximum in the neighborhood. Finally, bilinear interpolation is applied to precisely determine the position of the extremum, yielding subpixel-accurate corner points.
Based on the positions and scale information of the feature points identified in the previous step, a corresponding descriptor is constructed using the GLOH method. The final matching points are obtained using the NNDR matching method and RANSAC outlier rejection.

2.2. Improved Feature Extraction Algorithm

This article proposes an improved feature extraction method for SAR images to resolve the question of pseudo-feature points in SAR–SIFT. The method consists of three main steps: Firstly, the Shi–Tomasi [31] response function is used to replace the SAR–Harris response function to overcome the problem of feature point extraction accuracy and quantity caused by the artificially set empirical threshold. Secondly, the Harris–Laplace algorithm and a multi-scale feature point screening method are employed to eliminate points that do not possess spatial scale invariance. At the same time, the SUSAN operator with strong noise resistance is applied to remove points affected by image noise. The STSU–SAR–SIFT strategy is illustrated in Figure 2.

2.2.1. Threshold-Free Multiscale Response Function

As shown in Equation (3), the SAR–SIFT response function depends on the value of t, a user-defined parameter. The sensitivity of corner detection is influenced by t: the smaller the t value, the more feature points are extracted. Typically, t is set between 0.04 and 0.06. When t = 0.04, the number of feature points increases, but so does the number of erroneous corner detections; conversely, when t = 0.06, the number of feature points decreases, but accuracy improves. Shi–Tomasi demonstrated that the stability of the Harris method is related to the smaller eigenvalue of the C SH matrix in Equation (2). In the STSU–SAR–SIFT method, the Shi–Tomasi method replaces the Sar–Harris method across different scale spaces, directly using the smaller eigenvalue of the matrix as the criterion for corner detection. When the smaller eigenvalue of the C SH matrix at a given pixel exceeds the set threshold, that point is considered a feature point. This method produces a similar number of feature points as the original SAR–SIFT method but offers higher accuracy and lower false detection rates. Consequently, the corner detector is modified as follows:
R = min λ 1 , λ 2
where, λ 1 and λ 2 represent the eigenvalues of the C SH matrix in Equation (3), with min indicating the operation of taking the minimum value. A point is considered a corner when its R value (corner response value) exceeds a specified threshold.

2.2.2. Removing Non-Scale Key Points and Key Points Detected

Although the SAR–SIFT algorithm mentions the concept of multiple scales, it does not take the positional information of the extracted feature points into account. It only extracts feature points at each layer in the multi-scale space, and such feature points do not have high-scale invariance. To advance the scale invariance of feature points, this paper uses the spatial maximum value to obtain key points with scale invariance. As shown in Equation (5), in this algorithm process, the feature points that do not have scale invariance are eliminated by comparing whether the R value of the current layer feature point is greater than that of the adjacent layer feature point. When the feature point is at the topmost layer, it is compared with the second topmost layer value, and when the feature point is at the bottommost layer, it is compared with the second bottommost layer.
  l x , y , k > l x , y , k + 1 , l x , y , k > 0   , k = 1 l x , y , k > l x , y , k + 1 , l x , y , k > l x , y , k 1 , l x , y , k > 0   , 1 < k < n l x , y , k > l x , y , k 1 , l x , y , k > 0   , k = n
In this equation, k represents the current feature scale level, and n represents the entirety of feature scales; x, y represents the position of the pixel.
Some of the key points detected by the aforementioned method cannot be accurately located; therefore, the Laplacian of Gaussian (LoG)operator is used to refine their feature scale and position. The LoG function is defined as follows:
L o G x , y , σ = σ 2 G xx x , y , σ + G yy x , y , σ
where represents the current scale layer, G xx is obtained by taking the second-order derivative of the signal in the horizontal direction using the Laplacian operator, and G yy is obtained by taking the second-order derivative of the signal in the vertical direction using the Laplacian operator.
The improved response function derived from Equation (4) can strengthen the robustness of feature point extraction. Although the Gaussian blur applied in creating the scale space reduces the impact of multiplicative noise, the SAR–SIFT algorithm still suffers from the presence of false feature points caused by gradient calculation. To address this issue, we apply the SUSAN operator to suppress noise in feature points, as it is more robust to multiplicative noise due to its independence from differential operations. The noise reduction process is conducted after the detection of feature point candidates based on maximum response. By doing so, we obtain a set of feature points that are more accurate and less affected by noise. The detailed algorithm is described in Equation (7).
c x , y , x 0 , y 0 = 1 I x , y I x 0 , y 0 j 0 I x , y I x 0 , y 0 > j n x 0 , y 0 = Σ r c x , y , x 0 , y 0 R x 0 , y 0 = 1 g > n x 0 , y 0 0 g n x 0 , y 0
Here, x 0 , y 0 denotes the position of the current feature point, and I x , y represents the pixel intensity at I x , y . When the difference between the pixel values around the feature point and that of the feature point itself is below a threshold j , they are considered homogeneous. n x 0 , y 0 represents the number of homogeneous pixels in a given region; r refers to the circular region centered at the feature point x 0 , y 0 ; and R x 0 , y 0 determines whether the current feature point should be retained. If the number of homogeneous pixels is below the threshold g, the point is retained; otherwise, it is suppressed.

2.2.3. Improved Eight-Direction Multi-Scale Feature Descriptor

Figure 3 shows the descriptor construction under different algorithms, where different colors represent different scale information. SAR–SIFT and PSO–SIFT do not use a multi-scale construction method, so they are not represented by color. In Figure 3, lines represent the divided bin, and circles represent the divided concentric circle support area, which is used to store information around feature points. As shown in Figure 3a, in the SAR–SIFT method, descriptors are formed using GLOH, as depicted in Figure 3b, PSO–SIFT further divides descriptors into 17 location bins following the 45° rule, enhancing their uniqueness. Considering that single-scale support regions may occasionally result in similar appearances for mismatched points, as illustrated in Figure 3c, I–SAR–SIFT proposes using multiple concentric circular support regions sampled from different scales to address this issue. However, this method still divides location bins at 90°, leading to erroneous matches in terrain-similar areas. As shown in Figure 3d, combining the above two improvement methods, in constructing feature descriptors, we first compute feature vectors for the current scale feature point neighborhood via the Gaussian blurring of gradient magnitude and direction, extracting the feature vectors for the inner circle from the current layer, for the middle circle from the first Gaussian blur, and for the outer circle from the second Gaussian blur. The final descriptor comprises 3 × 8 × 8 = 192-dimensional feature vectors, incorporating multiscale spatial information and finer internal division to enhance descriptor uniqueness. Although the constructed feature descriptors in this paper have a relatively high dimensionality, the computational speed in practical experiments does not differ significantly from the methods mentioned above. Following the commonly used NNDR method and SIFT algorithm, distances less than 0.8 are considered correct matches, and the RANSAC algorithm is employed to eliminate mismatched points after NNDR matching.

2.3. Algorithm Efficiency Improvement

This study proposes two strategies to improve the matching efficiency: (1) extracting the overlapping area in the auxiliary image based on the partitioning of the main image during the pre-processing stage; (2) employing a CPU–GPU collaborative processing strategy to enhance the matching efficiency of the proposed algorithm.

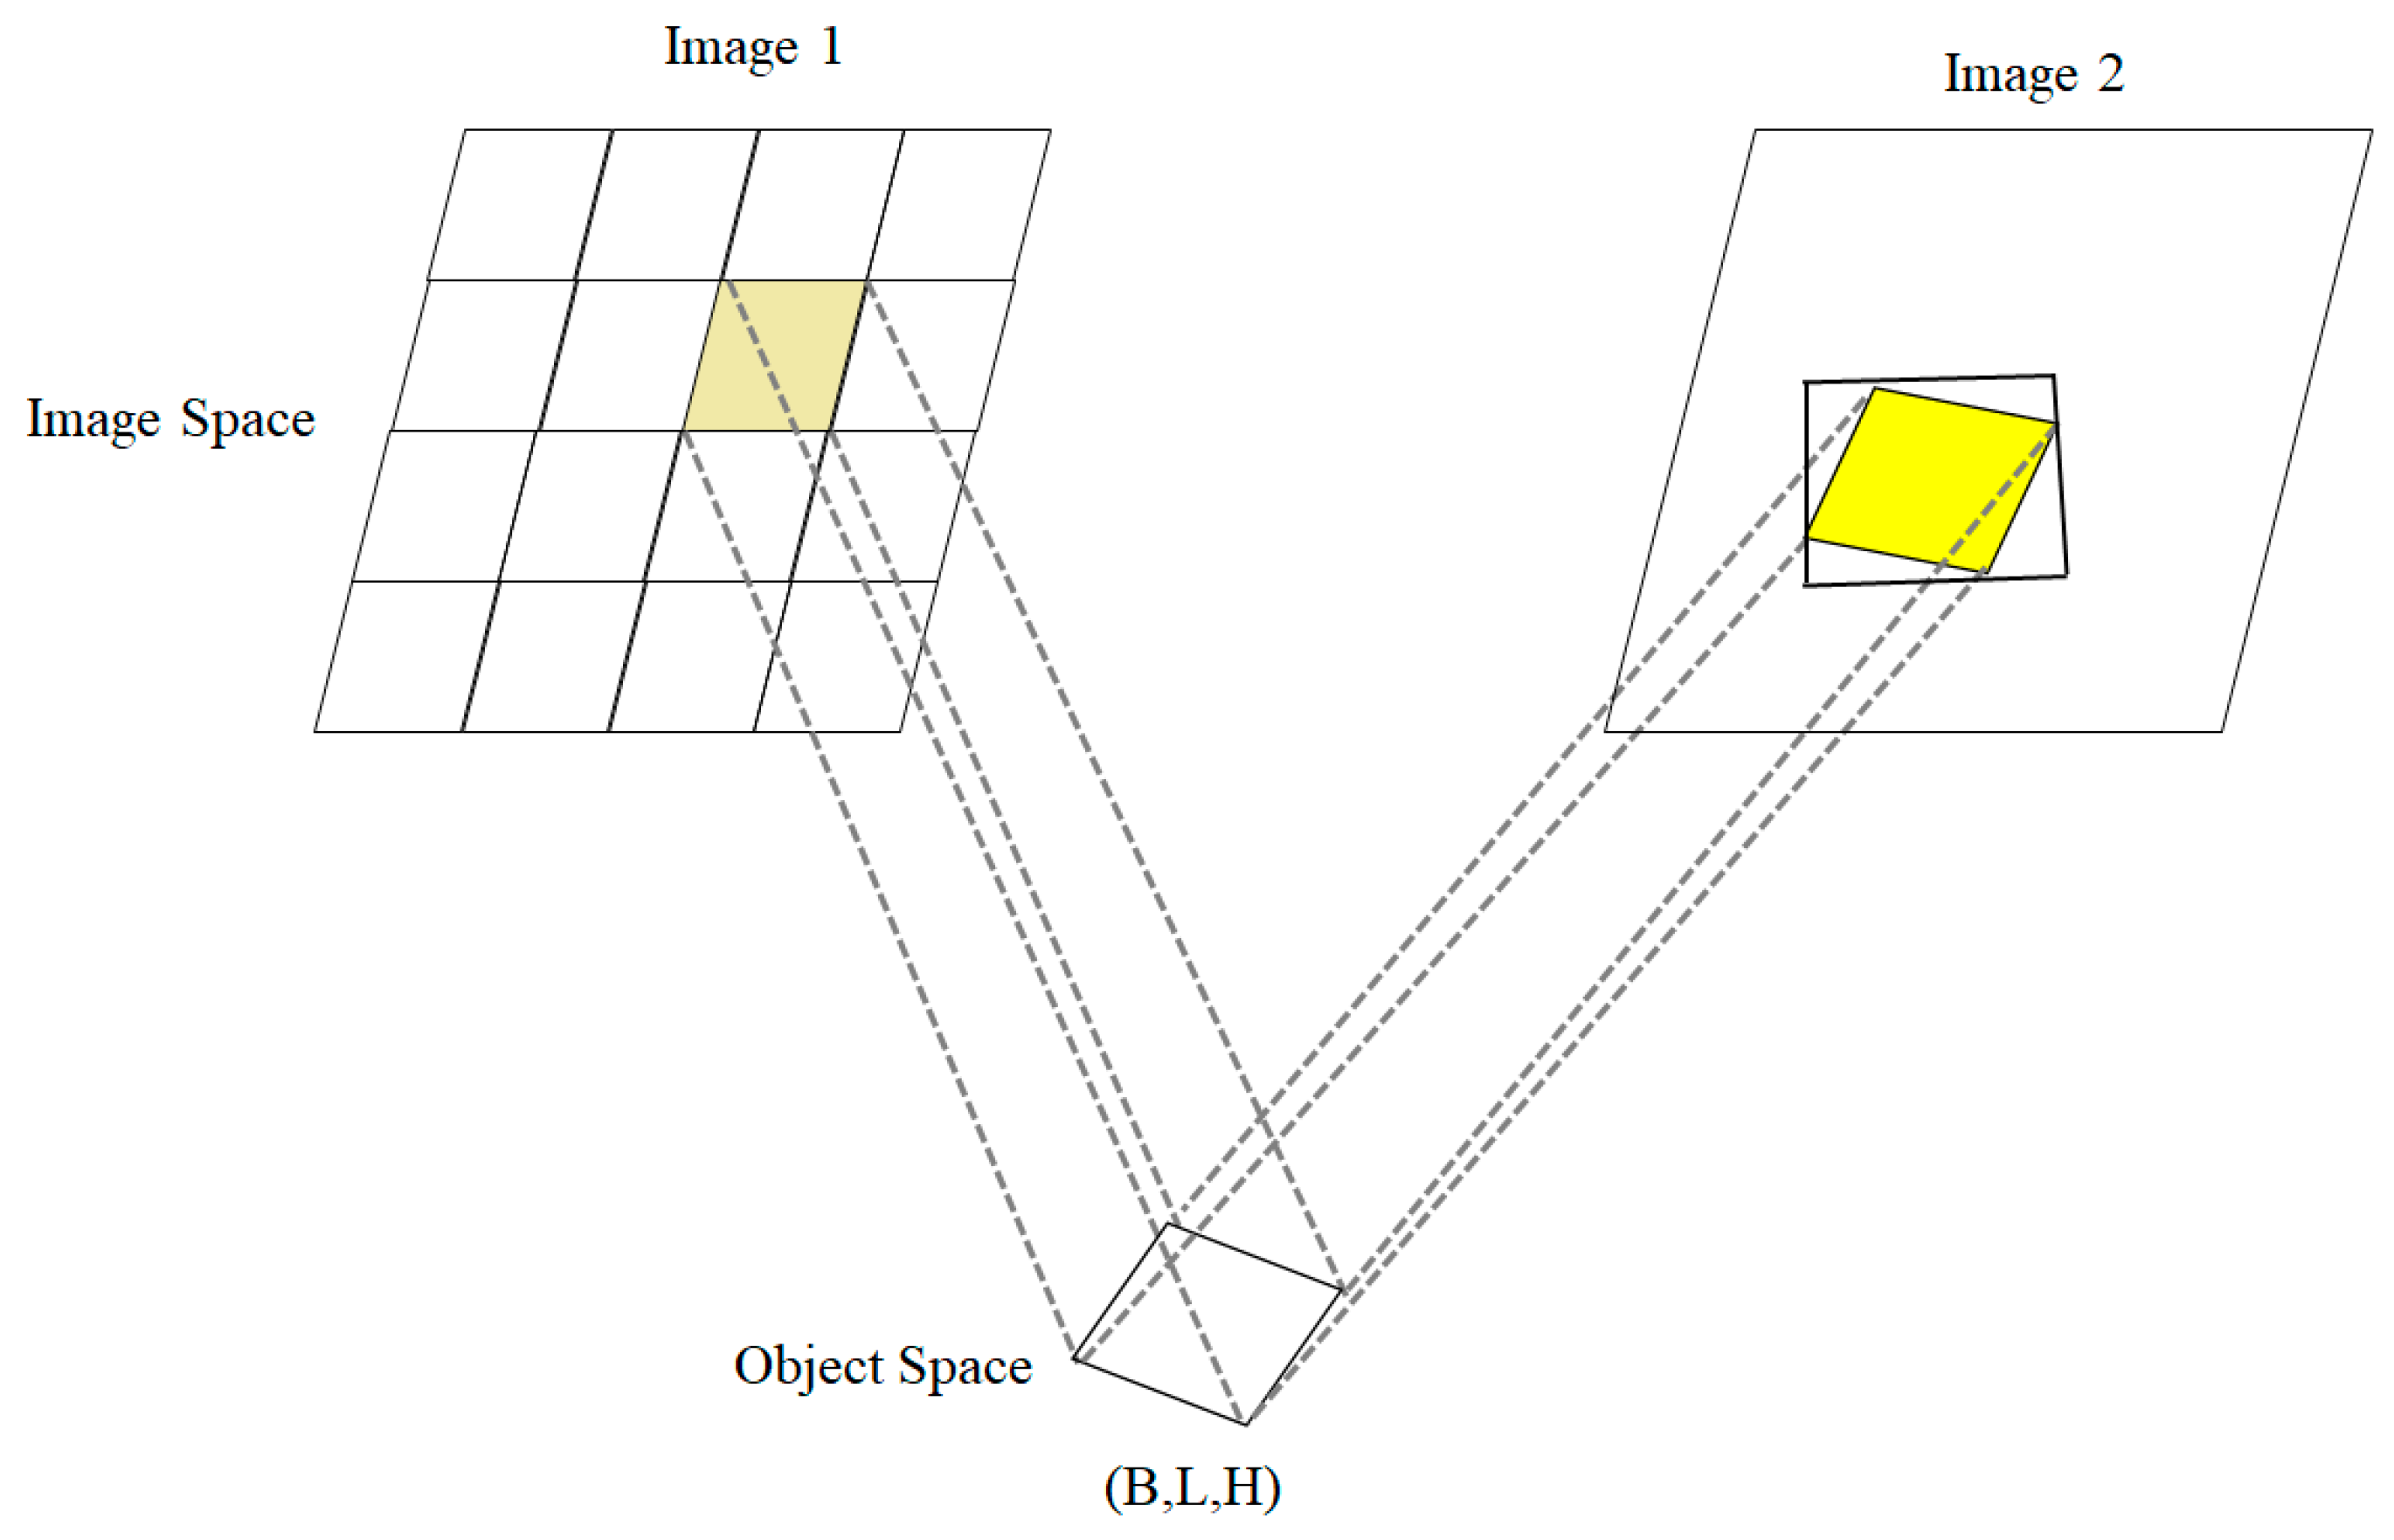
2.3.1. Extracting Overlapping Regions of Primary and Secondary Images Based on Block Matching Strategy

To address the issue of redundant computations caused by direct feature matching between the main and auxiliary images, this paper employs a feature matching algorithm based on segmenting the main image into blocks. By applying a rational function model, intersections between the main and auxiliary images are computed to extract their overlapping areas. The steps of the algorithm are summarized as follows:
(1)
First, the corner points of the images are mapped to the world coordinate system to determine if there is an intersection between the two images. If no intersection exists, subsequent steps are not executed to avoid unnecessary computations.
(2)
After identifying the overlapping region between the images, one image is selected as the main image, which is then divided into blocks. The image coordinates of the corner points of each block are computed using the Rational Polynomial Coefficients (RPC) model. Next, the corner points of each block in the main image are substituted into the auxiliary image, and the row and column coordinates of the overlapping region in the auxiliary image are calculated using the RPC model, as shown in Figure 4.
(3)
The STSU–SAR–SIFT matching algorithm is applied to obtain the connecting points in the overlapping area.
(4)
The connecting points in the overlapping area are mapped back to the original images. By multiplying the size of each image block by the row and column number and adding the connecting point coordinates, the coordinates are obtained on the corresponding image.

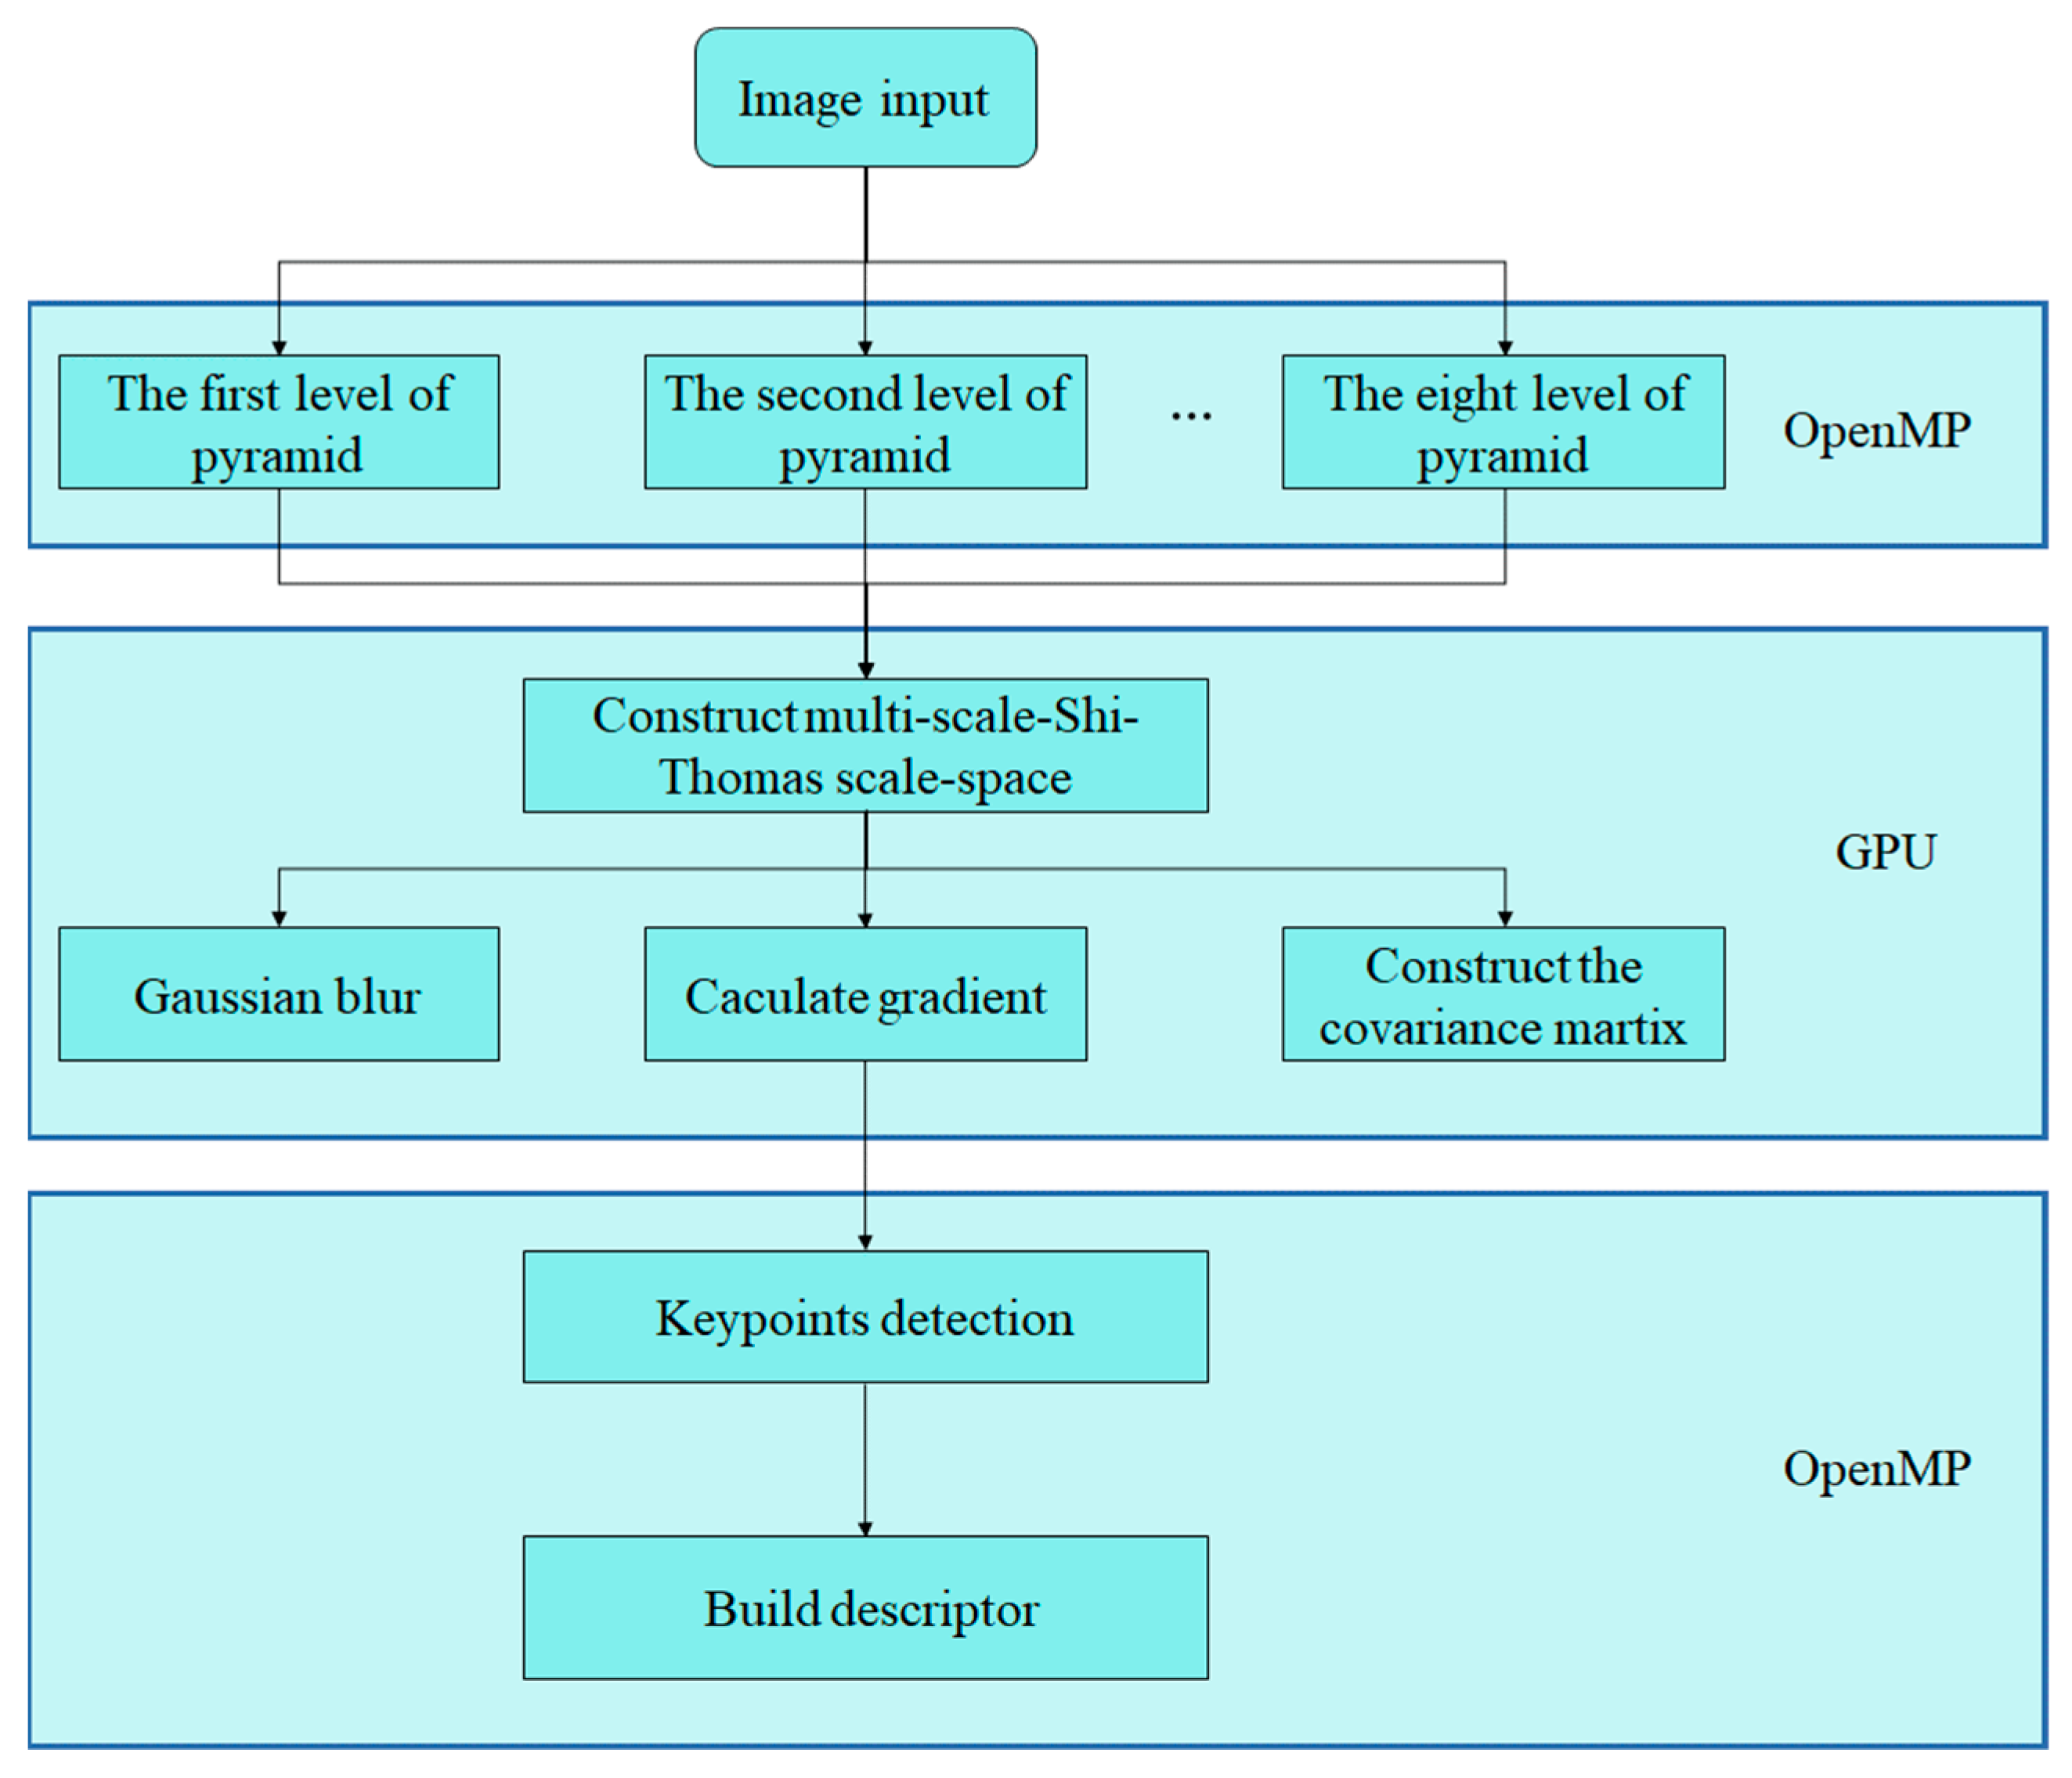
2.3.2. OpenMP and GPU Collaborative Acceleration Strategy

To address the issue of CPU and GPU collaborative parallel computation, this paper proposes using a fork/join model to implement the collaborative parallel computation of STSU–SAR–SIFT. First, during the construction of the feature pyramid, the CPU uses OpenMP to allocate tasks for each pyramid layer to sub-threads, while the GPU performs parallel computation of feature scales using CUDA, as shown in Figure 5. Once the feature pyramid is built, OpenMP assigns the tasks of feature point search and the calculation of the principal orientation of each layer’s features to sub-threads. Subsequently, the parallel task of constructing feature descriptors is allocated to sub-threads.
The main concurrency model of OpenMP is the fork/join model, which includes a master thread and worker threads. In the master thread, parallel regions can be specified, and the number of worker threads can be allocated. Each thread is mapped to a scalar processing core via multiple processors, and multiple scalar threads can execute tasks in parallel. The pyramid constructed by SAR–SIFT differs from the SIFT pyramid. In the SAR–SIFT algorithm, the original image is used as the base image, and an eight-layer pyramid is constructed by gradually increasing the Gaussian blur at a certain ratio. During thread compilation, tasks are divided into eight independent subtasks within parallel regions. Each subtask involves the following operations: as shown in the OpenMP section of Figure 5, performing Gaussian blurring; computing gradient magnitude and direction; computing pixel correlation matrices; and calculating the SAR–Harris response function for the current layer. Since the GPU is better suited for image processing, using the GPU to compute the response functions for each pyramid layer accelerates the computation process. As shown in the GPU section of Figure 5, the feature scales are computed using CUDA. All eight layers of the pyramid are first loaded into GPU memory, and the results of the response functions are finally returned to memory, thus, avoiding the complexity of frequent data transfers between memory and GPU memory during image processing.

3. Results

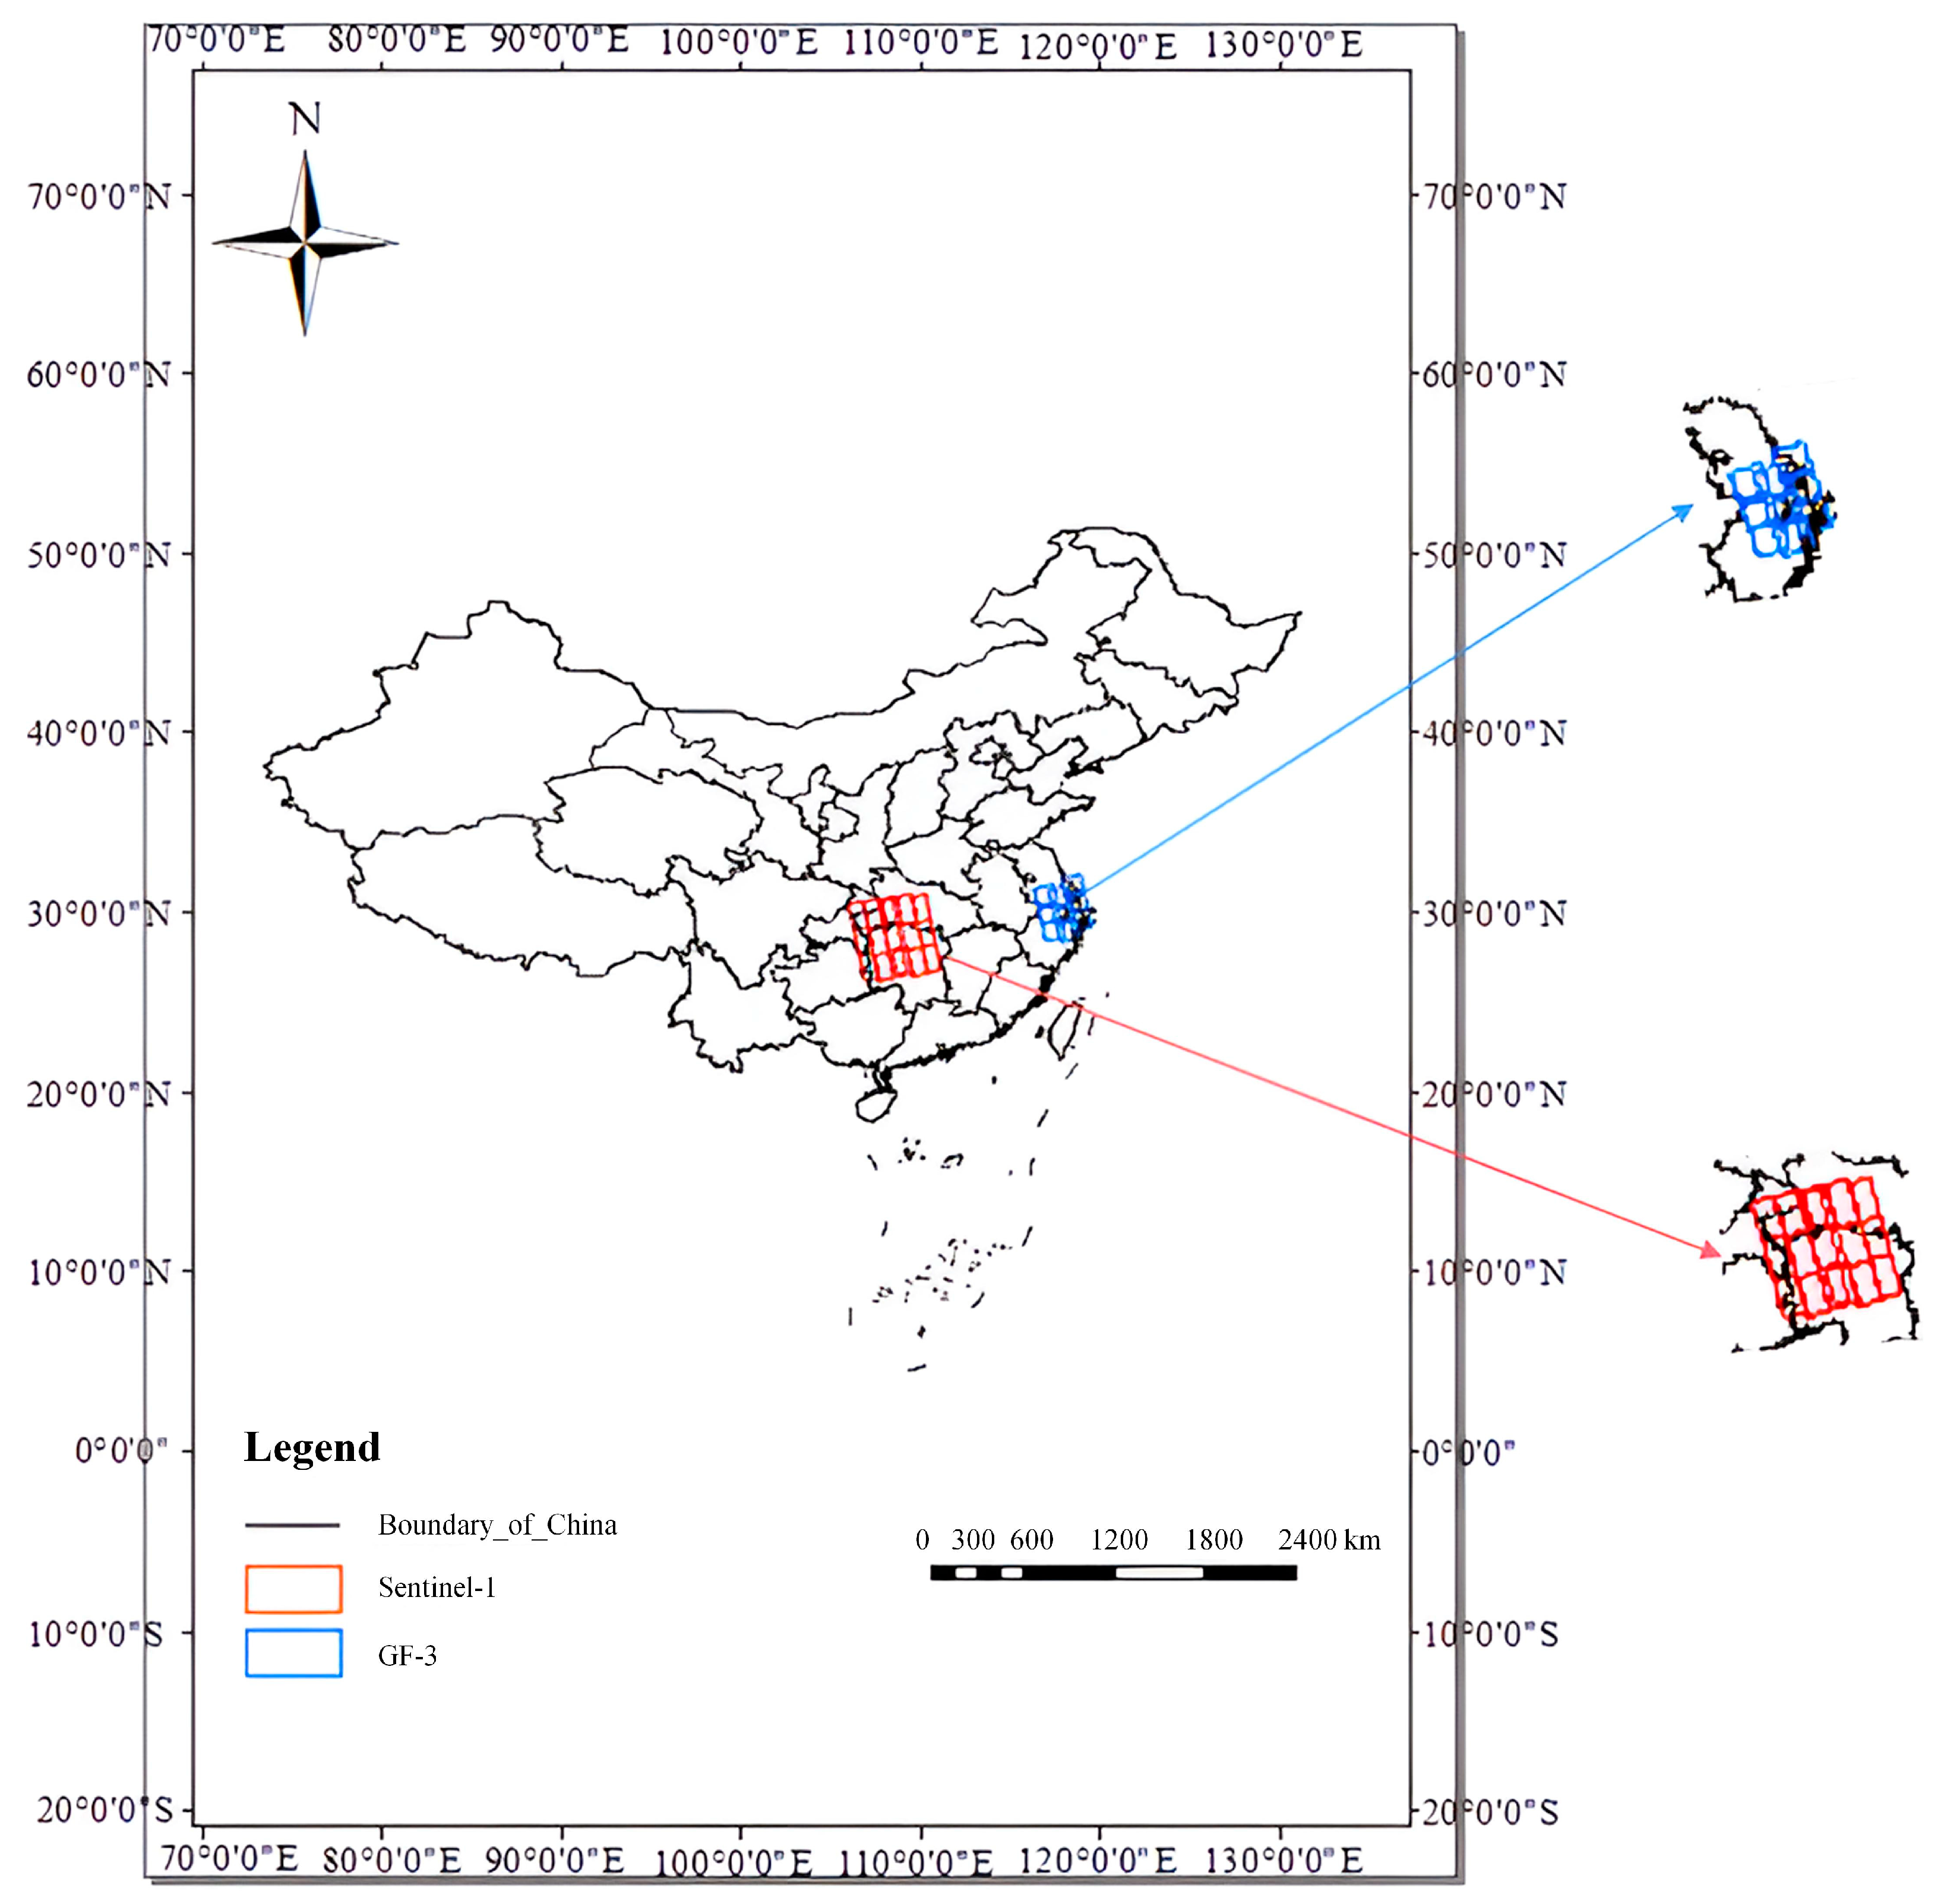
3.1. Parameter Introduction and Experimental Data

The datasets used in this study consist of GF-3 and Sentinel-1 data. GF-3 datasets used in this study covered the Taihu region and Shanghai city. It was acquired using the Fine Strip II (FSII) imaging mode, with a nominal resolution of 10 m. The Taihu region is a plain urban area with an average elevation of about 4 m, and the data parameters are shown in Table 1. Sentinel-1 data used in this study were acquired in IW mode and were obtained from https://dataspace.copernicus.eu/data-collections/sentinel-data/sentinel-1 (accessed on 1 July 2025). Due to the large differences in the x and y directions of the raw data, which were 2.7 × 22 m, multi-view processing was performed using ENVI 5.6 to obtain 20 × 20 m data with roughly the same resolution. The Sentinel-1 datasets cover Hunan Province, China, which has an average elevation of 1000 m and features predominantly mountainous and hilly terrain. The image distribution is shown in Figure 6.
In the experiments, the response function threshold in SUSAN is nmax/2. The ratio of Gaussian blurs from inner to outer layers in the construction of multiscale feature descriptors is the ratio = 2 3 , and the quantity of layers in the scale space is eight.

3.2. Comparative Analysis

3.2.1. Feature Extraction Results Under Different Descriptors

This study employed a controlled experimental design to systematically compare the proposed feature descriptor with state-of-the-art methods including SAR–SIFT, I–SAR–SIFT, and PSO–SIFT. While the feature detection phase consistently utilized the proposed detector, distinct algorithms were implemented for descriptor construction during the feature description phase. The experimental dataset comprised two representative scenes extracted from GF-3 and Sentinel-1 satellite imagery. Quantitative evaluation was conducted using the Correct Match Rate (CMR) metric, defined as the ratio of the Number of Correct Matches (NCM) to the Total Corresponding Matches (TCM), where initial matches were obtained through the NNDR strategy and subsequently validated using the RANSAC algorithm. Detailed quantitative comparisons are provided in Table 2. For GF-3 data processing, the proposed method achieved both the highest CMR value and a significantly greater number of final matches compared to benchmark methods. When processing Sentinel-1 data under comparable feature point quantities, the proposed method maintained superior CMR performance among STSU–SAR–SIFT, SAR–SIFT, I–SAR–SIFT, and PSO–SIFT approaches. This superiority originates from the enhanced feature discriminability of descriptors constructed through the multi-scale analysis framework and adaptive neighborhood partitioning strategy, which significantly improves matching uniqueness.

3.2.2. Descriptor Dimensionality Analysis

Table 3 presents the matching performance under different descriptor dimensionalities. Five pairs of 1000 × 1000-sized image patches were selected for evaluation. Although the 3 × 6 × 6 configuration achieved the highest number of correct matches (NCM), it also resulted in a significantly higher RMSE. In terms of efficiency, the descriptors with different dimensionalities exhibited no substantial differences. Therefore, the 3 × 8 × 8 configuration, which yielded the lowest RMSE, was selected as the final descriptor dimensionality.

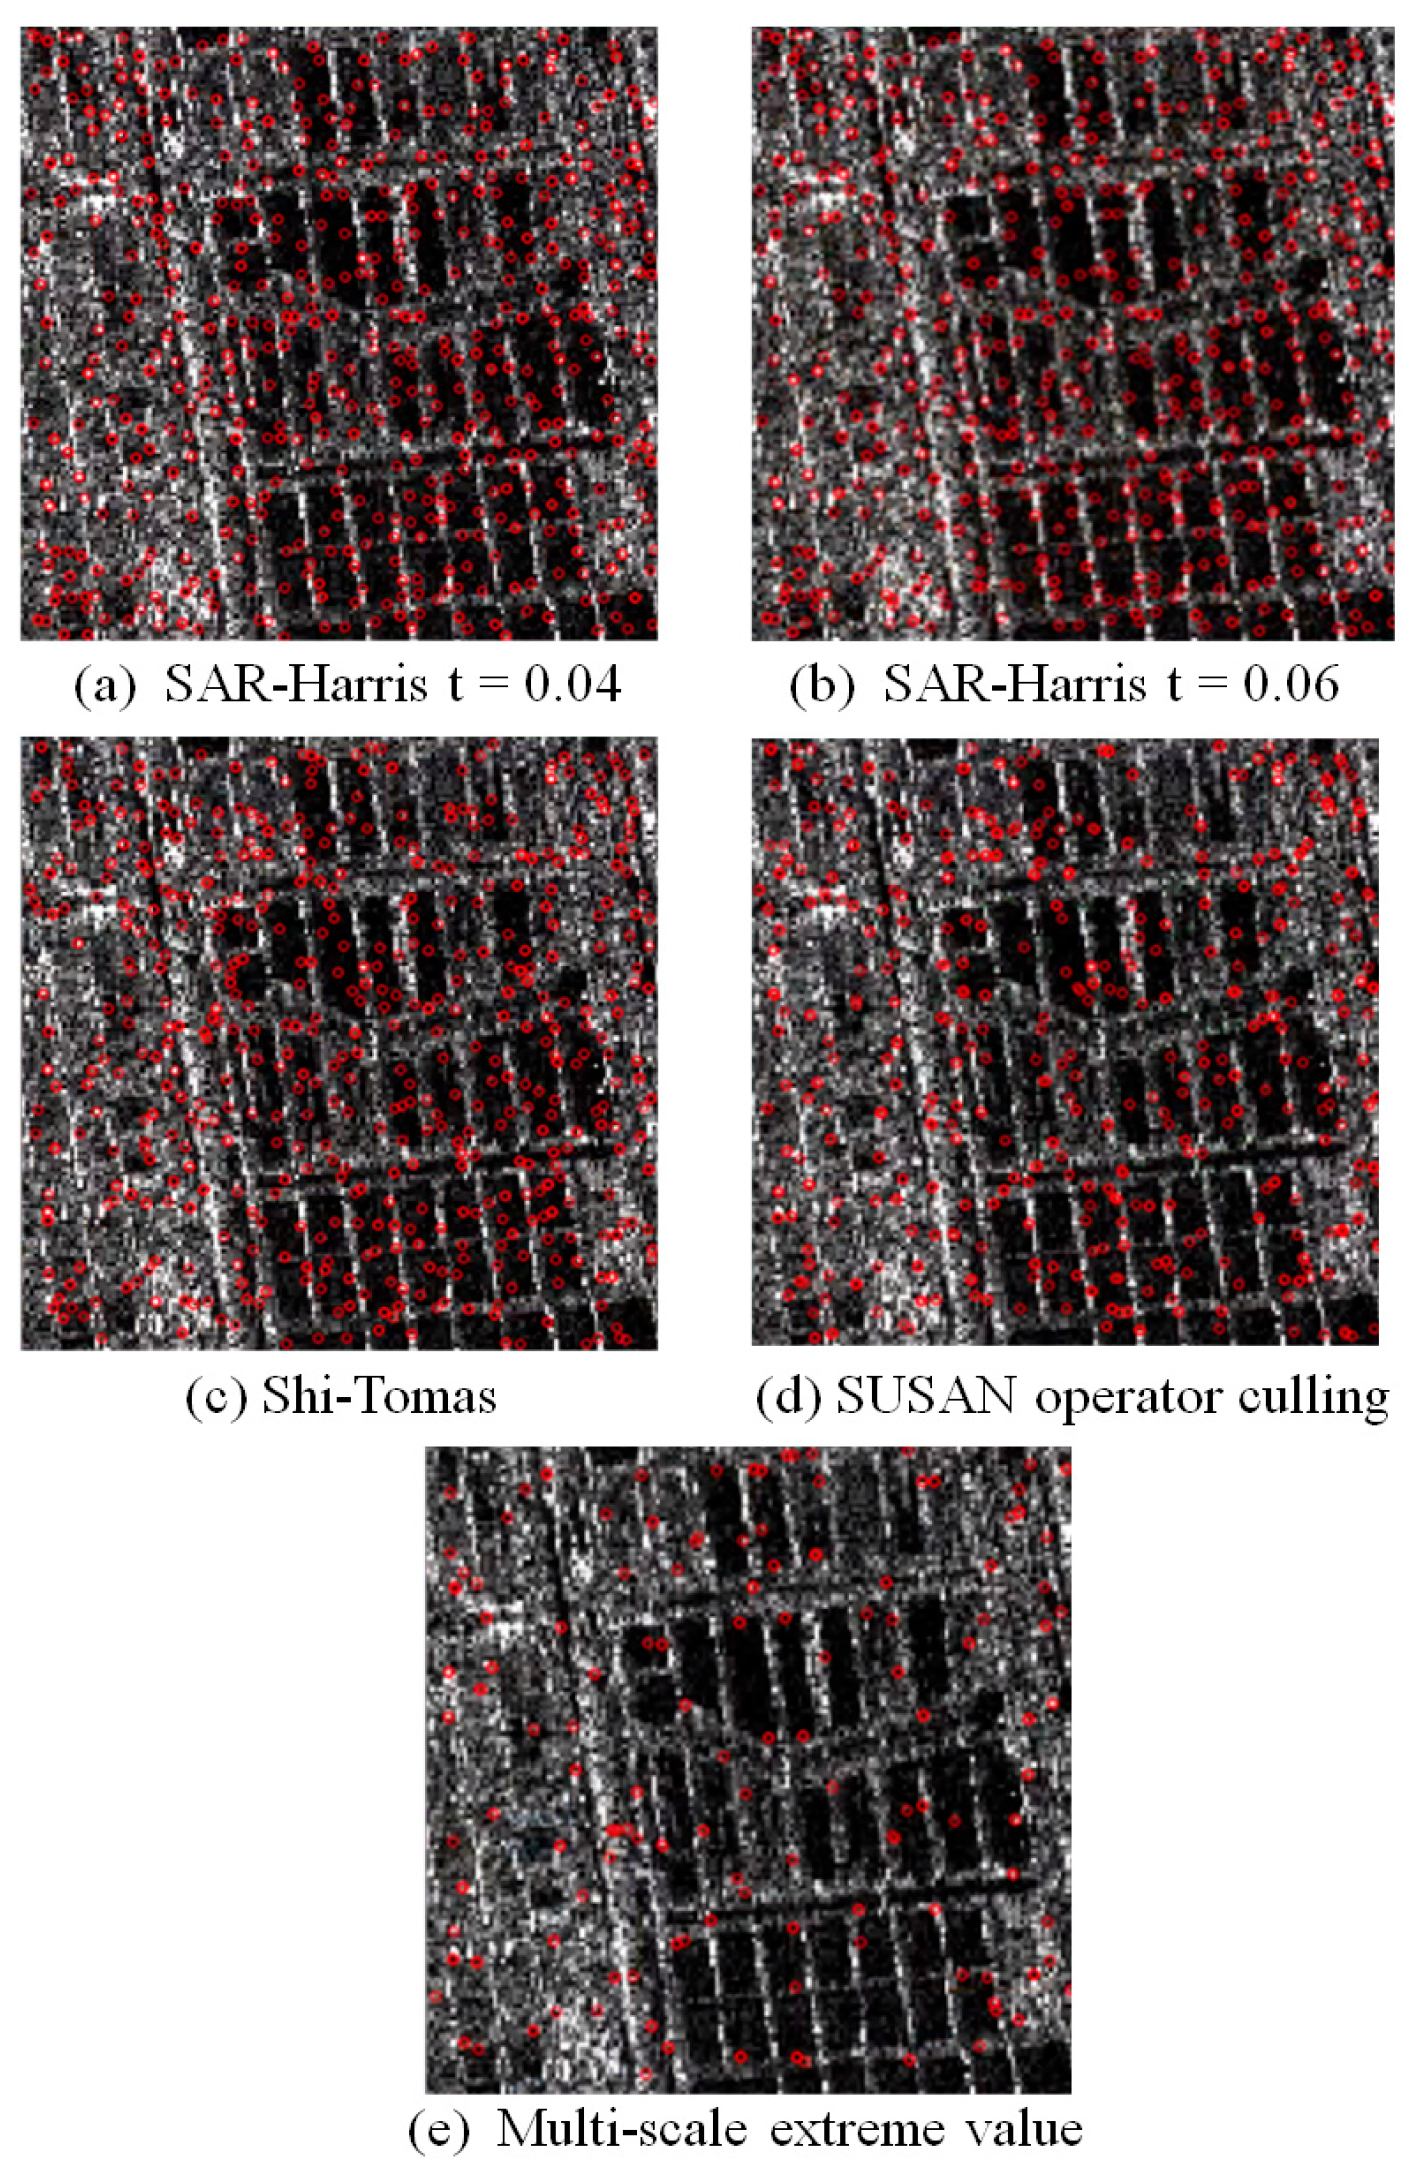
3.2.3. Distribution of Feature Points Under Different Parameters

The present study compares feature extraction methods using GF-3 and Sentinel-1 data, as shown in Figure 7 and Figure 8. Panels a and b demonstrate the feature point maps obtained by the SAR–SIFT algorithm with manually set threshold t, panel c shows the feature point map obtained without threshold response function, panel e shows feature points obtained by adding the SUSAN algorithm, and panel d show feature points obtained by applying Laplacian operator on multi-scale extrema. This section shows the extraction results of feature points under different parameters and those obtained by the algorithm in this paper. In Figure 7a–d, feature points are distributed not only in edges and corners, but also in the center of the road or the black area of the rice field. These feature points in the center of the road and the black area of the rice field are pseudo-feature points. For subsequent matching, matching accuracy will be reduced. Figure 7e shows the feature points extracted in this paper. The feature points are mainly distributed in the corners of the image, and the pseudo-feature points are not obtained in the black areas in the center of the road or the center of the rice field. In the experiment of Sentinel-1 data, the result is similar to that of Gaofen-3. The other algorithms have a large number of pseudo-feature points, which greatly affect the accuracy of subsequent matching.

3.2.4. Match Point Precision Analysis

To precisely evaluate the quality of tie points in multi-satellite imagery, by employing this method, the study assessed the performance of STSU–SAR–SIFT, SAR–SIFT, SIFT, SURF, SuperGlue, and RedFeat algorithms for dual and triple tie points on both the same and vertical orbits, using GF-3 and Sentinel-1 data. As the SIFT and SURF algorithms do not generate tie points on vertical orbits, Table 4 exclusively presents the RMSE measurements for the same orbits.
Figure 9 and Figure 10, respectively, display partial matching results of GF-3 and Sentinel-1 images. The analysis results from Table 4 are as follows:
(1)
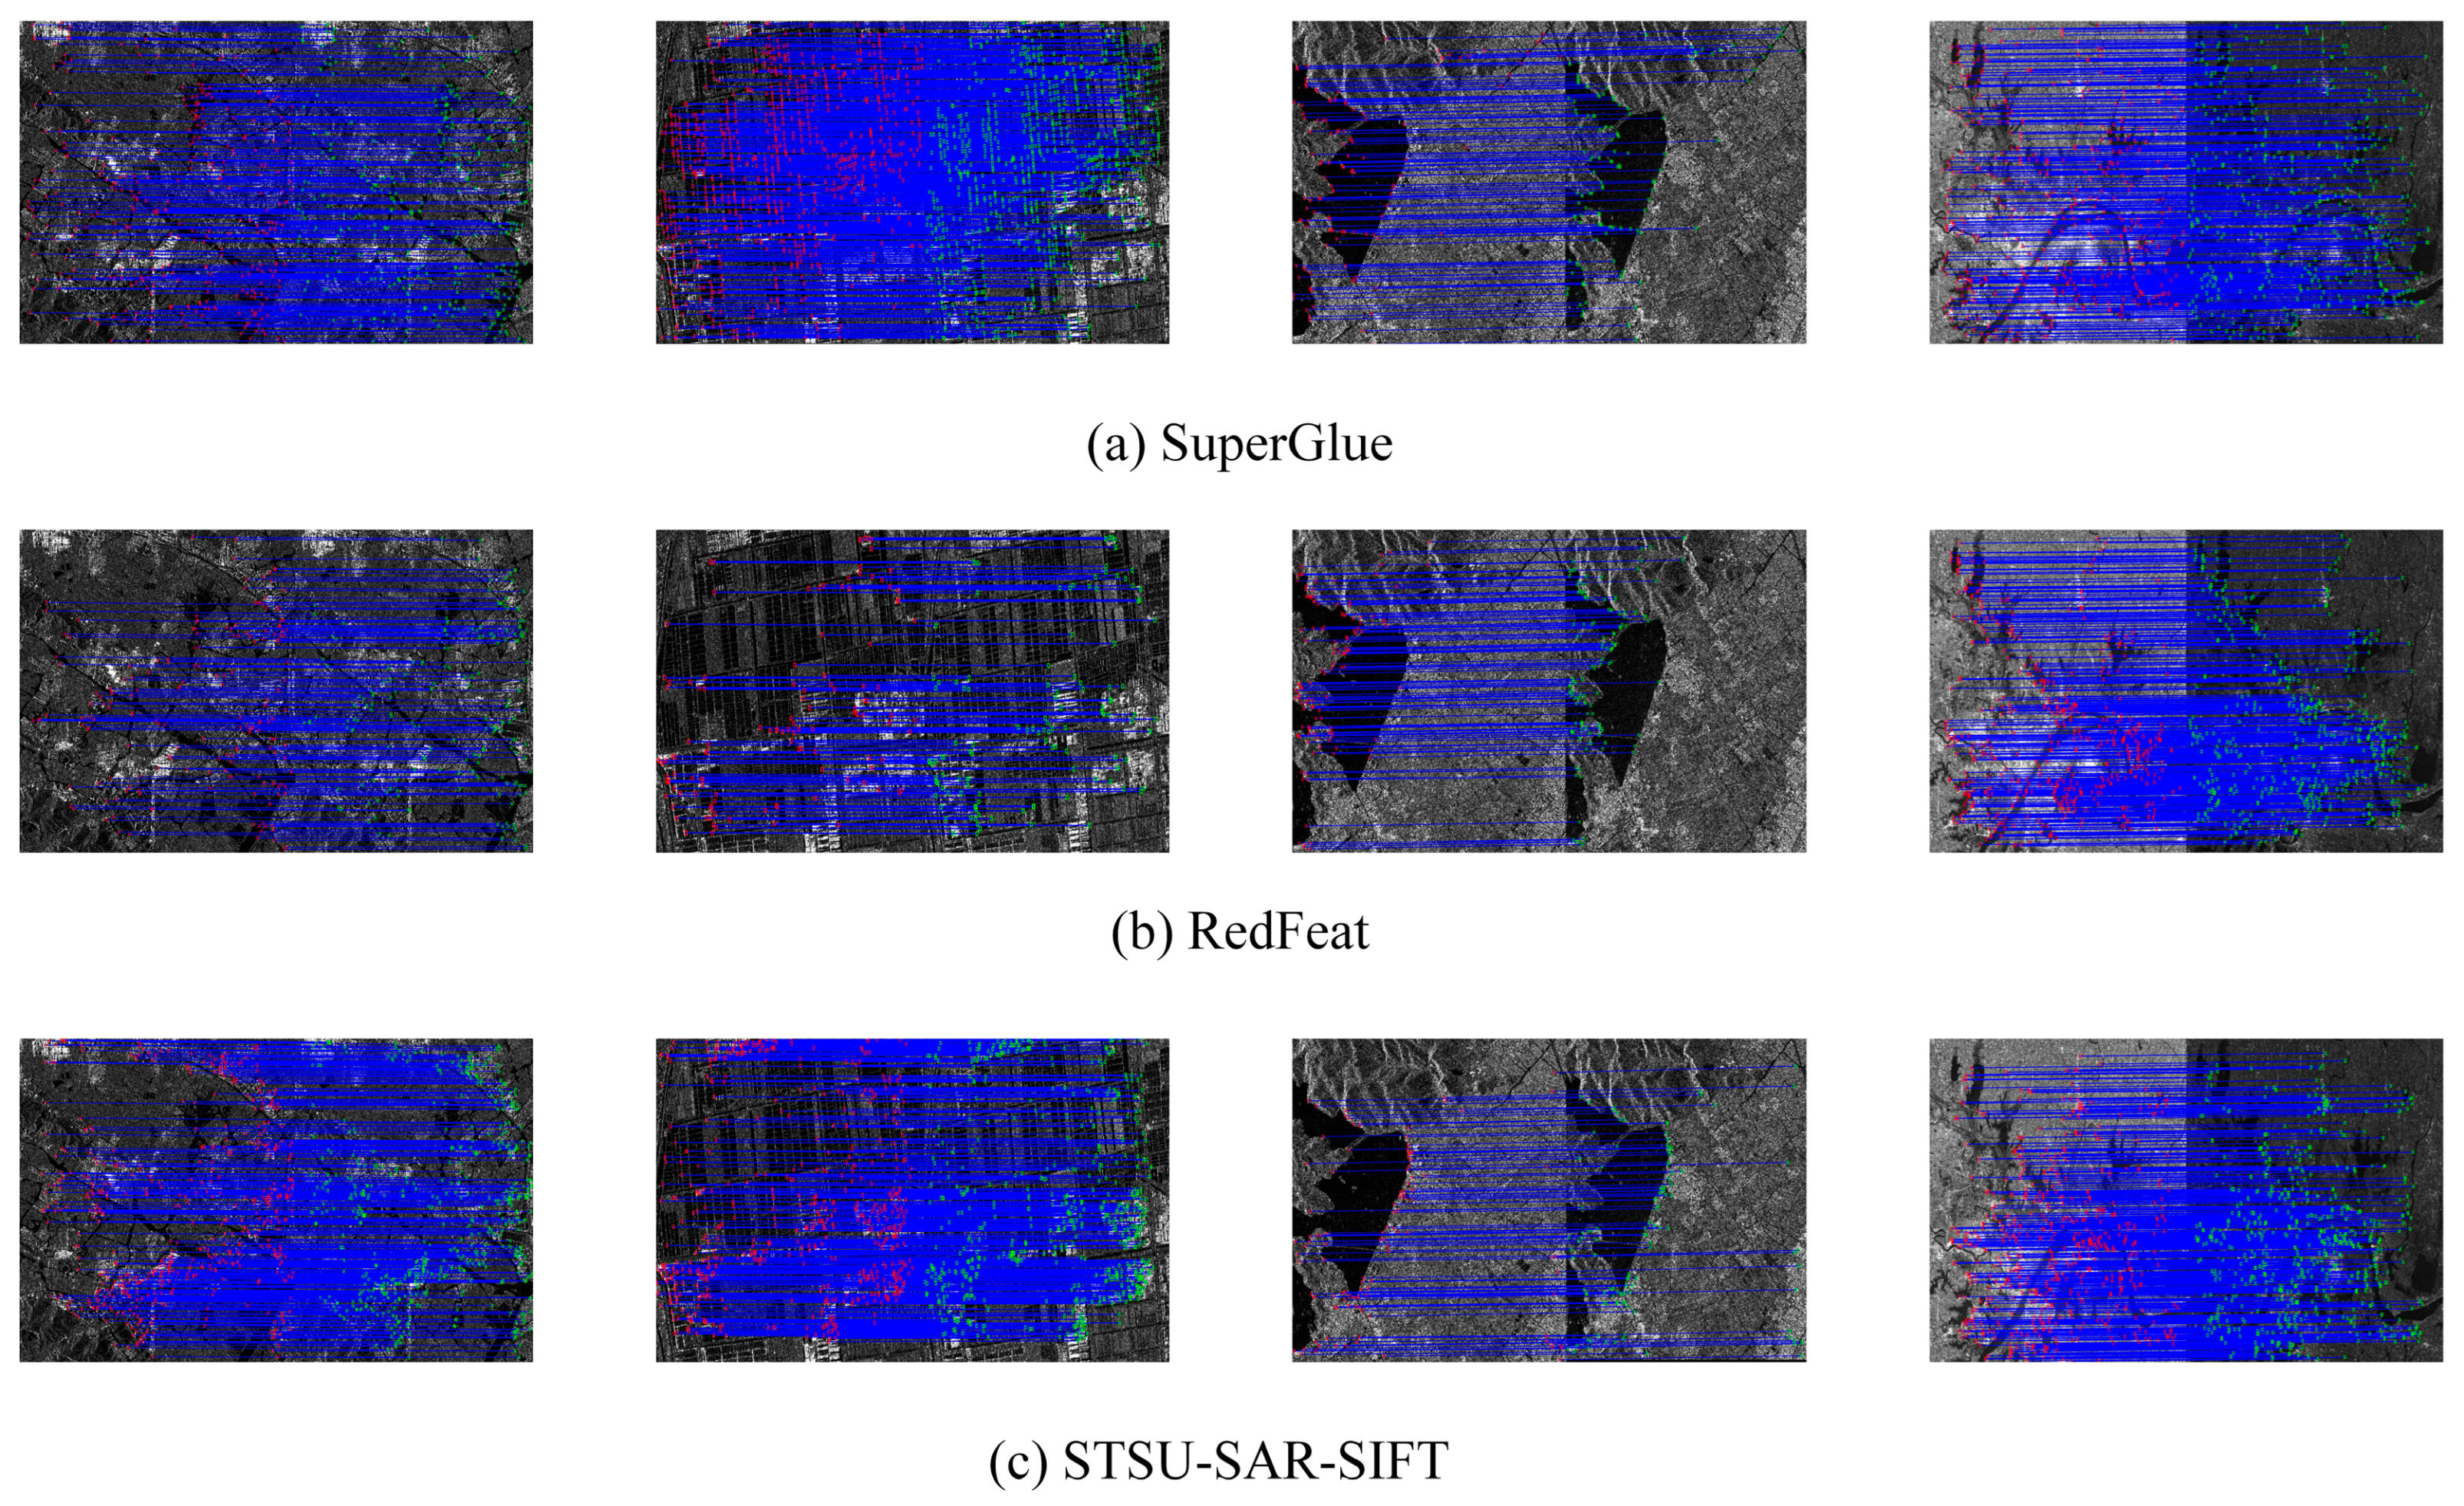
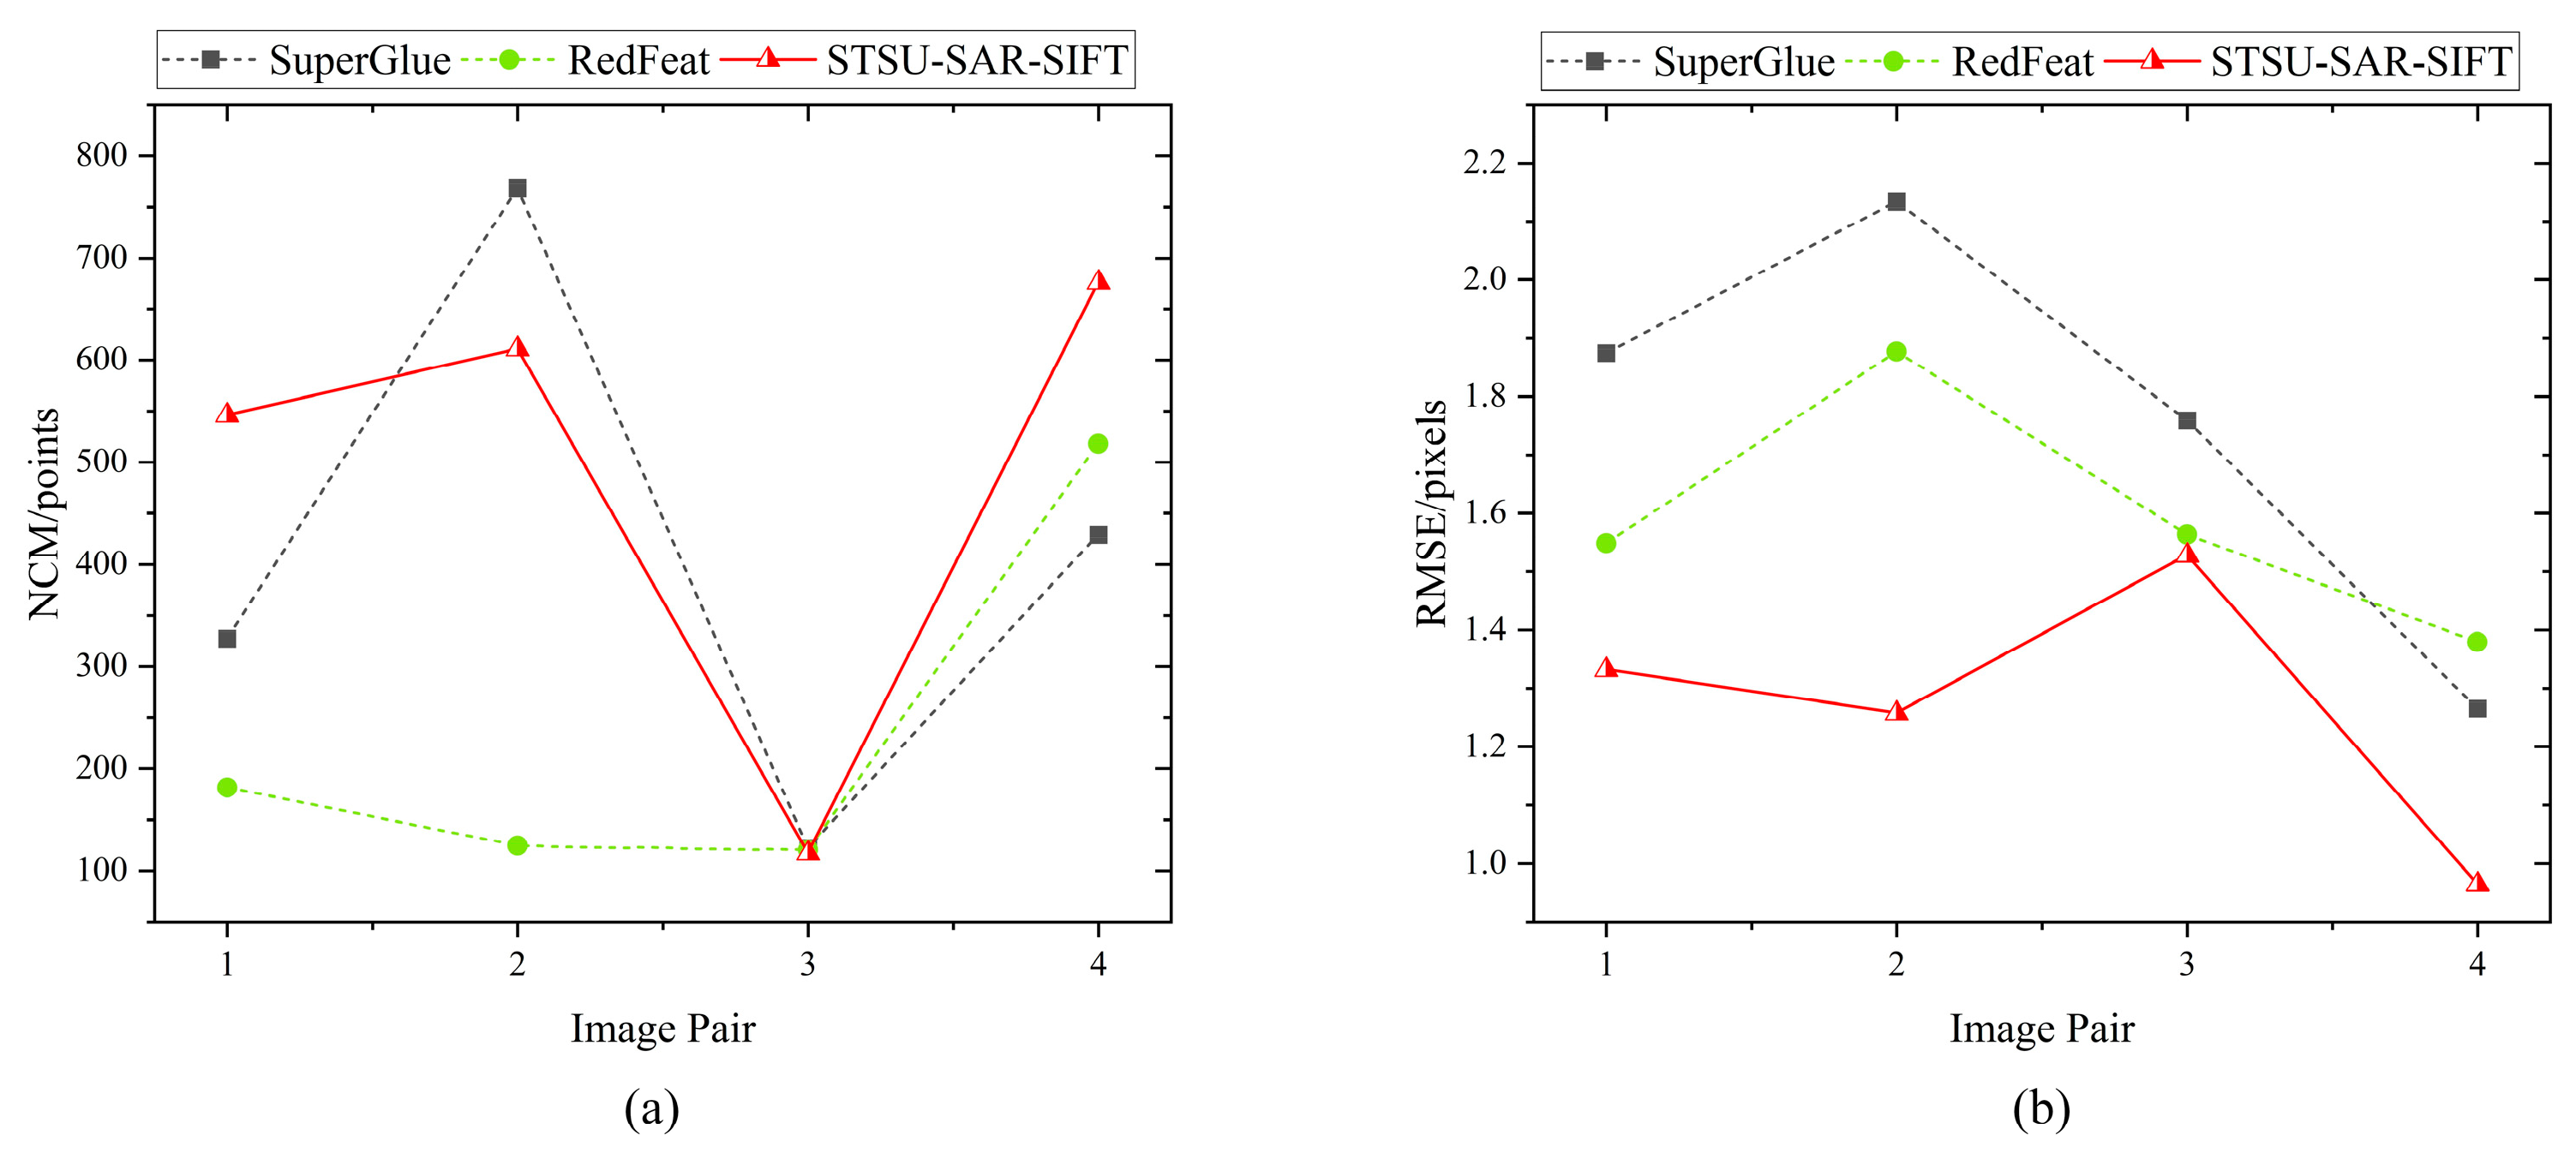
For both GF-3 and Sentinel-1 images, our proposed STSU–SAR–SIFT algorithm consistently achieved the lowest RMSE values. Even when compared with the state-of-the-art deep learning-based matching algorithms such as SuperGlue and RedFeat, our algorithm demonstrated distinct advantages and was significantly superior to SAR–SIFT.
(2)
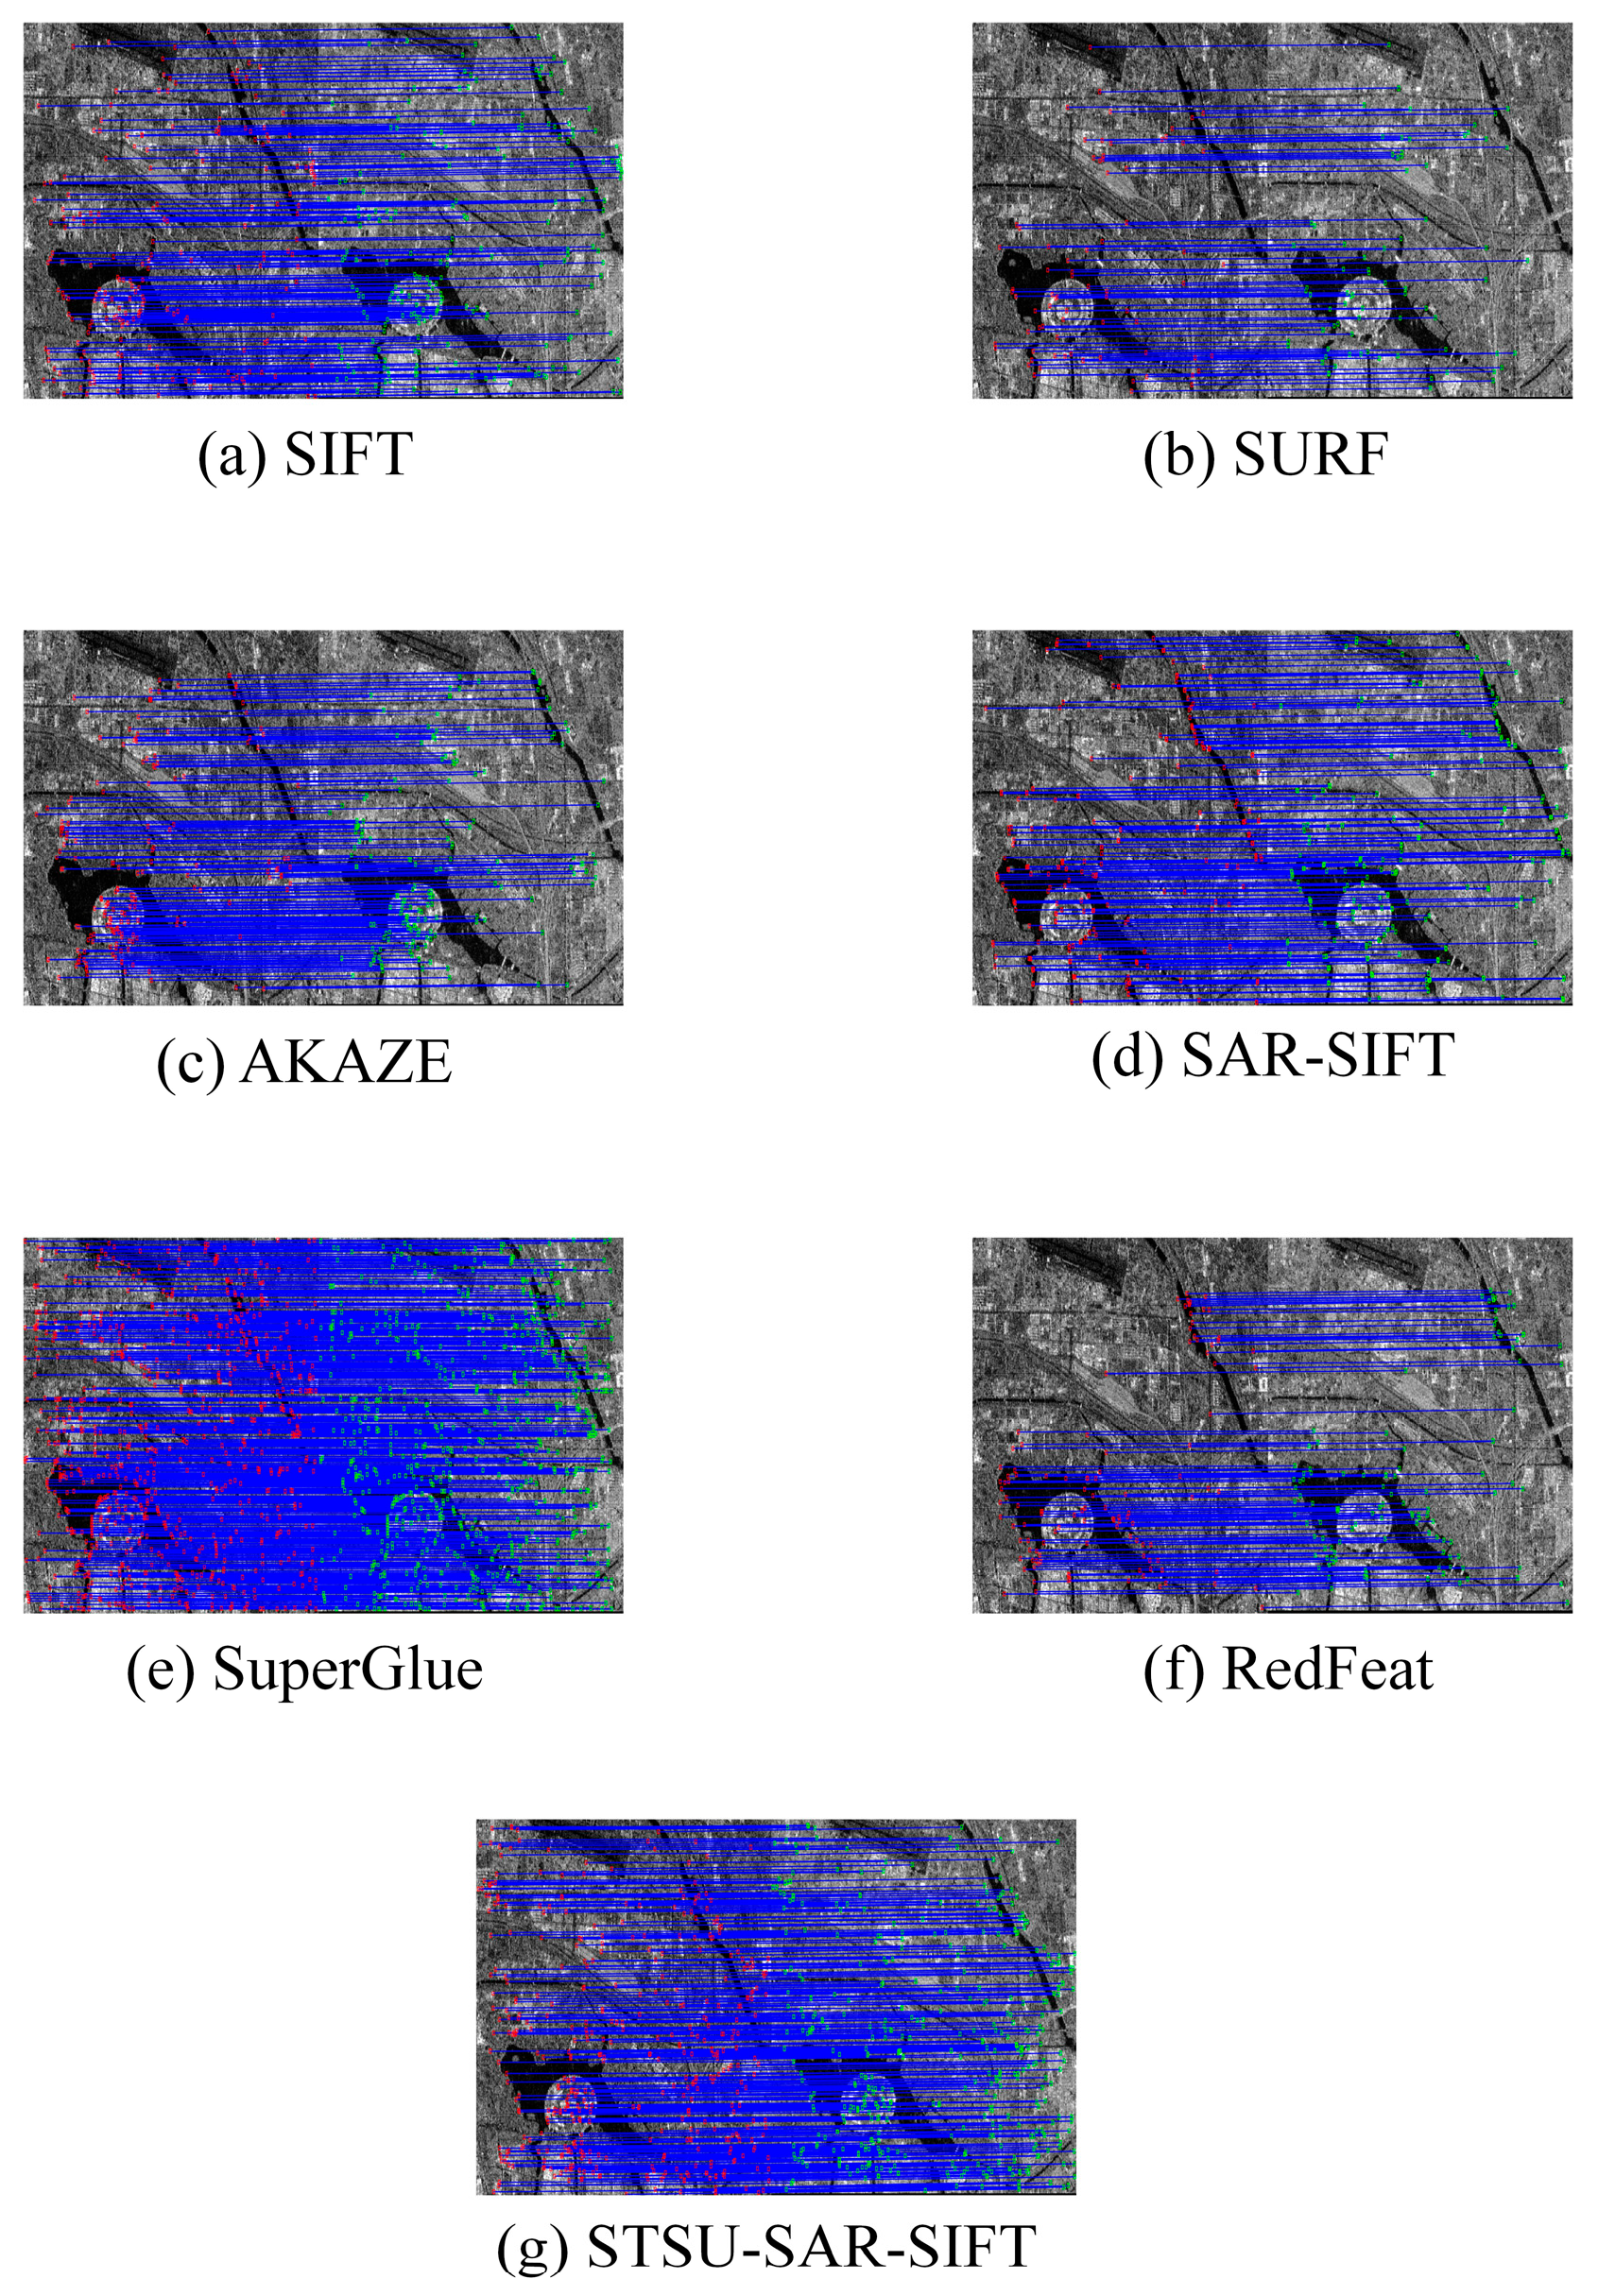
Given the minimal variability in SAR images captured during the same orbital imaging period, all algorithms perform adequately in extracting tie points from the same orbit. However, SIFT, SURF, and AKAZE are more sensitive to noise, resulting in comparatively higher root mean square errors. Meanwhile, the two deep learning-based methods have shown excellent results across both datasets. Nevertheless, according to the data in the table, STSU–SAR–SIFT exhibits the best performance, indicating its superior suitability for extracting tie points from SAR images.
(3)
When extracting tie points from vertical orbits, the SAR–SIFT algorithm generates a large number of false corners, and its feature descriptors fail to adequately represent terrain features, resulting in higher RMSE values. In contrast, the proposed STSU–SAR–SIFT algorithm eliminates many false corners and provides robust feature descriptions, significantly outperforming the SAR–SIFT algorithm. Due to the different imaging times on vertical orbits, severe image distortions occur, preventing the SIFT, SURF, and AKAZE algorithms from accurately extracting tie points.
(4)
While extracting dual-matching tie points, although the similarity in same orbit images is high, significant variations in vertical orbit images result in much lower accuracy of tie points on vertical orbits compared to same orbit images. Hence, the accuracy of dual-matching tie points lies between those of the same and vertical orbits. Given that STSU–SAR–SIFT exhibits superior accuracy on both same and vertical orbits compared to SAR–SIFT, it also surpasses SAR–SIFT in accuracy for dual-matching tie points.
(5)
When extracting triple-matching tie points, STSU–SAR–SIFT continues to perform better than SAR–SIFT, although the difference is not particularly significant. One reason is that in the experimental data, triple-matching points typically occur only in configurations of “two-left-one-right” or “two-right-one-left,” resulting in a relatively small number of such tie points.
Table 4 demonstrates that Sentinel-1 data does not perform well in SIFT, SURF, and AKAZE algorithms, especially in the case of the SIFT algorithm, which fails to obtain accurate matching points. From Table 4, it can be observed that the STSU–SAR–SIFT algorithm produces more matching points, and the accuracy of these points is slightly higher than that of the SAR–SIFT algorithm. Within the same orbit, the accuracy of the STSU–SAR–SIFT algorithm is slightly lower than that of the SAR–SIFT algorithm. This is because Sentinel-1 data has less overlap, and the STSU–SAR–SIFT algorithm requires more detailed descriptors. Additionally, there are more black edges in the images, resulting in more repeated regions in the descriptors. On the other hand, SAR–SIFT relies less on descriptors for peripheral regions, resulting in higher accuracy of connection points in the same orbit for SAR–SIFT compared to STSU–SAR–SIFT. However, as the feature descriptions of the SAR–SIFT algorithm are less detailed than those of the STSU–SAR–SIFT algorithm, the latter achieves higher accuracy in extracting tie points on vertical orbits.

3.2.5. Comparison with Deep Learning-Based Methods

Table 4 incorporates two deep learning-based matching methods (SuperGlue and RedFeat) for comparative analysis. However, these methods exhibited lower post-adjustment accuracy compared to the proposed approach. To investigate the underlying causes, additional SAR image datasets were selected and an independent matching accuracy evaluation framework was established. More than 20 spatially distributed corresponding feature points were manually selected in each pair of images. Using these reference points to compute affine transformation matrices as ground truth, the matching quantity and positional accuracy of each algorithm were systematically evaluated. Compared with the accuracy assessment in Table 4, the RMSE metric derived from this independent evaluation framework more accurately reflects the inherent matching accuracy of the algorithms. Figure 11 shows the matching results of different algorithms.
Figure 12 displays the matching results, including NCM and RMSE, of the SuperGlue, RedFeat, and STSU–SAR–SIFT algorithms on an additional dataset. While STSU–SAR–SIFT does not always surpass the other algorithms in terms of the number of matched points, its RMSE consistently remains lower than that of the two deep learning-based methods. This is primarily due to the multiplicative noise in SAR images, which causes biases in corner detection. Our proposed feature detection method more accurately extracts reliable corners. Furthermore, since we match co-origin images, the STSU–SAR–SIFT algorithm achieves better results than the others. When the images are from different sources, the performance of the deep learning-based methods becomes more pronounced.

3.2.6. Efficiency Analysis of Parallel Computing

Optimization of algorithmic efficiency becomes critical when processing large-scale image datasets. This section systematically evaluates the temporal performance of the STSU–SAR–SIFT method under three computational architectures: single-thread CPU, multi-thread CPU, and CPU–GPU heterogeneous computing. The feature point extraction and descriptor construction processes involve complex logical decisions and full-image traversal operations, which exhibit fundamentally different computational characteristics compared to conventional image processing tasks. Experimental results demonstrate that while GPUs show limited efficiency in logical operations, they provide substantial advantages in scale-space acceleration computations, whereas CPU architectures are better suited for logic-intensive processing. Benchmark tests using Sentinel-1 data covering Hunan Province (Table 5) indicate a baseline processing time of 2.7 h without acceleration. With multi-thread CPU optimization, the processing time was reduced to 1.3 h. The implementation of CPU–GPU co-acceleration further decreased the processing time to 0.75 h, achieving a 3.6-fold efficiency improvement. For large-scale GF-3 satellite data processing, the CPU–GPU heterogeneous architecture achieved a 2.6-fold speedup ratio compared to CPU serial processing. The data in Table 5 conclusively demonstrate the significant acceleration benefits of heterogeneous computing.

4. Conclusions

This study employs the Shi–Tomasi corner detector for feature point detection, thereby circumventing the issue of inconsistent quantity and quality of initially screened feature points due to manually set empirical thresholds. Subsequently, the SUSAN operator is utilized to eliminate erroneous feature points affected by multiplicative noise, reducing the impact of noise on the selected feature points in SAR imagery. Finally, a feature descriptor is constructed using the Laplacian operator and multi-scale feature point detection methods, which retains multi-scale information and enhances the distinctiveness of the descriptor. Experimental results on GF-3 and Sentinel-1 data demonstrate that the STSU–SAR–SIFT algorithm has removed a majority of erroneous feature points, improving the robustness and registration accuracy of the feature points. The matching point accuracy of this algorithm has been enhanced by approximately 0.5–2 pixels compared to other algorithms. The Sentinel-1 imagery selected for this study includes portions of coastal areas, where the marine representation in the SAR images appears as a large dark region. The features within this area are highly similar and are significantly affected by noise. Consequently, without proper processing, these areas typically degrade the accuracy of feature matching. In this paper, we employed the SUSAN operator to eliminate noise and construct a multi-scale, eight-directional feature descriptor, thereby mitigating the impact of the aforementioned dark marine areas. As a result, the matching accuracy of coastal areas that include oceans approaches that of inland regions. Additionally, the algorithm’s efficiency has been increased by about three times through the use of GPU acceleration. Although the algorithm in this paper improves the matching accuracy and efficiency to a certain extent, there is still room for further improvement in the extraction of triple feature points, and it can be further split in the running efficiency to make full use of threads.

Author Contributions

Conceptualization, Z.H. and W.W.; methodology, W.W., J.C. and Z.H.; software, J.C.; validation, W.W. and J.C.; formal analysis, W.W., J.C. and Z.H.; investigation, W.W. and J.C.; resources, Z.H.; data curation, W.W. and J.C.; writing—original draft preparation, W.W., J.C. and Z.H.; writing—review and editing, W.W., J.C. and Z.H.; visualization, W.W. and J.C.; supervision, Z.H.; project administration, Z.H.; funding acquisition, W.W. and Z.H. All authors have read and agreed to the published version of the manuscript.

Funding

This research was supported in part by the Yangtze River Delta Science and Technology Innovation Community Joint Research (Basic Research) Project (2024CSJZN01303 and 2024CSJZN01304).

Data Availability Statement

The data that support the findings of this study are available in the Copernicus Data Space Ecosystem at https://dataspace.copernicus.eu/data-collections/sentinel-data/sentinel-1 (accessed on 1 July 2025).

Acknowledgments

The authors sincerely appreciate the anonymous reviewers for their insightful comments and suggestions, which have significantly contributed to enhancing the quality of this paper.

Conflicts of Interest

The authors declare no conflicts of interest.

References

  1. Brunner, D.; Lemoine, G.; Bruzzone, L. Earthquake Damage Assessment of Buildings Using VHR Optical and SAR Imagery. IEEE Trans. Geosci. Remote Sens. 2010, 48, 2403–2420. [Google Scholar] [CrossRef]
  2. Bruzzone, L.; Bovolo, F. A Novel Framework for the Design of Change-Detection Systems for Very-High-Resolution Remote Sensing Images. Proc. IEEE 2013, 101, 609–630. [Google Scholar] [CrossRef]
  3. Chen, H.; Zhang, H.; Du, J.; Luo, B. Unified Framework for the Joint Super-Resolution and Registration of Multiangle Multi/Hyperspectral Remote Sensing Images. IEEE J. Sel. Top. Appl. Earth Obs. Remote Sens. 2020, 13, 2369–2384. [Google Scholar] [CrossRef]
  4. Wu, P.; Wang, Z.; Zheng, B.; Li, H.; Alsaadi, F.E.; Zeng, N. AGGN: Attention-based glioma grading network with multi-scale feature extraction and multi-modal information fusion. Comput. Biol. Med. 2023, 152, 106457. [Google Scholar] [CrossRef]
  5. Paul, S.; Pati, U.C. Remote Sensing Optical Image Registration Using Modified Uniform Robust SIFT. IEEE Geosci. Remote Sens. Lett. 2016, 13, 1300–1304. [Google Scholar] [CrossRef]
  6. Li, J.; Hu, Q.; Ai, M. RIFT: Multi-Modal Image Matching Based on Radiation-Variation Insensitive Feature 698 Transform. IEEE Trans. Image Process. 2020, 29, 3296–3310. [Google Scholar] [CrossRef]
  7. Ahakonye, L.A.C.; Nwakanma, C.I.; Lee, J.M.; Kim, D.S. SCADA intrusion detection scheme exploiting the fusion of modified decision tree and Chi-square feature selection. Internet Things 2023, 21, 100676. [Google Scholar] [CrossRef]
  8. Li, D.; Zhang, Y. A Fast Offset Estimation Approach for InSAR Image Subpixel Registration. IEEE Geosci. Remote Sens. Lett. 2012, 9, 267–271. [Google Scholar] [CrossRef]
  9. Cole-Rhodes, A.A.; Johnson, K.L.; LeMoigne, J.; Zavorin, I. Multiresolution registration of remote sensing imagery by optimization of mutual information using a stochastic gradient. IEEE Trans. Image Process 2003, 12, 1495–1511. [Google Scholar] [CrossRef]
  10. Chen, S.; Li, X.; Zhao, L.; Yang, H. Medium-low resolution multisource remote sensing image registration based on SIFT and robust regional mutual information. Int. J. Remote Sens. 2018, 39, 3215–3242. [Google Scholar] [CrossRef]
  11. Beier, T.; Neely, S. Feature-based image metamorphosis. In Proceedings of the 19th Annual Conference on Computer Graphics and Interactive Techniques, Chicago, IL, USA, 27–31 July 1992; ACM: Singapore, 1992; pp. 35–42. [Google Scholar] [CrossRef]
  12. Zitová, B.; Flusser, J. Image registration methods: A survey. Image Vis. Comput. 2003, 21, 977–1000. [Google Scholar] [CrossRef]
  13. Lowe, D.G. Distinctive Image Features from Scale-Invariant Keypoints. Int. J. Comput. Vis. 2004, 60, 91–110. [Google Scholar] [CrossRef]
  14. Bay, H.; Ess, A.; Tuytelaars, T.; Van Gool, L. Speeded-Up Robust Features (SURF). Comput. Vis. Image Underst. 2008, 110, 346–359. [Google Scholar] [CrossRef]
  15. Chen, S.; Zhong, S.; Xue, B.; Li, X.; Zhao, L.; Chang, C.I. Iterative Scale-Invariant Feature Transform for Remote Sensing Image Registration. IEEE Trans. Geosci. Remote Sens. 2021, 59, 3244–3265. [Google Scholar] [CrossRef]
  16. Sedaghat, A.; Mokhtarzade, M.; Ebadi, H. Uniform Robust Scale-Invariant Feature Matching for Optical Remote Sensing Images. IEEE Trans. Geosci. Remote Sens. 2011, 49, 4516–4527. [Google Scholar] [CrossRef]
  17. Wang, S.; You, H.; Fu, K. BFSIFT: A Novel Method to Find Feature Matches for SAR Image Registration. IEEE Geosci. Remote Sens. Lett. 2012, 9, 649–653. [Google Scholar] [CrossRef]
  18. Alcantarilla, P.F.; Bartoli, A.; Davison, A.J. KAZE Features. In Computer Vision—ECCV; Fitzgibbon, A., Lazebnik, S., Perona, P., Sato, Y., Schmid, C., Eds.; Lecture Notes in Computer Science; Springer: Berlin/Heidelberg, Germany, 2012; Volume 7577, pp. 214–227. [Google Scholar] [CrossRef]
  19. Dellinger, F.; Delon, J.; Gousseau, Y.; Michel, J.; Tupin, F. SAR-SIFT: A SIFT-Like Algorithm for SAR Images. IEEE Trans. Geosci. Remote Sens. 2015, 53, 453–466. [Google Scholar] [CrossRef]
  20. Hong, Y.; Leng, C.; Zhang, X.; Yan, H.; Peng, J.; Jiao, L.; Cheng, I.; Basu, A. SAR Image Registration Based on ROEWA-Blocks and Multiscale Circle Descriptor. IEEE J. Sel. Top. Appl. Earth Obs. Remote Sens. 2021, 14, 10614–10627. [Google Scholar] [CrossRef]
  21. Pallotta, L.; Giunta, G.; Clemente, C. SAR Image Registration in the Presence of Rotation and Translation: A Constrained Least Squares Approach. IEEE Geosci. Remote Sens. Lett. 2021, 18, 1595–1599. [Google Scholar] [CrossRef]
  22. Pallotta, L.; Giunta, G.; Clemente, C.; Soraghan, J.J. SAR Coregistration by Robust Selection of Extended Targets and Iterative Outlier Cancellation. IEEE Geosci. Remote Sens. Lett. 2022, 19, 1–5. [Google Scholar] [CrossRef]
  23. Sarlin, P.E.; DeTone, D.; Malisiewicz, T.; Rabinovich, A. SuperGlue: Learning Feature Matching With Graph Neural Networks. In Proceedings of the 2020 IEEE/CVF Conference on Computer Vision and Pattern Recognition (CVPR), Seattle, WA, USA, 13–19 June 2020; pp. 4937–4946. [Google Scholar] [CrossRef]
  24. Lindenberger, P.; Sarlin, P.E.; Pollefeys, M. LightGlue: Local Feature Matching at Light Speed. In Proceedings of the 2023 IEEE/CVF International Conference on Computer Vision (ICCV), Paris, France, 1–6 October 2023; pp. 17581–17592. [Google Scholar] [CrossRef]
  25. Xu, W.; Yuan, X.; Hu, Q.; Li, J. SAR-optical feature matching: A large-scale patch dataset and a deep local descriptor. Int. J. Appl. Earth Obs. Geoinf. 2023, 122, 103433. [Google Scholar] [CrossRef]
  26. Deng, Y.; Ma, J. ReDFeat: Recoupling Detection and Description for Multimodal Feature Learning. IEEE Trans. Image Process 2023, 32, 591–602. [Google Scholar] [CrossRef] [PubMed]
  27. Zhi, X.; Yan, J.; Hang, Y.; Wang, S. Realization of CUDA-based real-time registration and target localization for high-resolution video images. J. Real-Time Image Proc. 2019, 16, 1025–1036. [Google Scholar] [CrossRef]
  28. Feng, H.; Li, E.; Chen, Y.; Zhang, Y. Parallelization and characterization of SIFT on multi-core systems. In Proceedings of the 2008 IEEE International Symposium on Workload Characterization, Seattle, WA, USA, 14–16 September 2008; pp. 14–23. [Google Scholar] [CrossRef]
  29. Wang, W.; Zhang, Y.; Guoping, L.; Yan, S.; Jia, H. CLSIFT: An Optimization Study of the Scale Invariance Feature Transform on GPUs. In Proceedings of the 2013 IEEE 10th International Conference on High Performance Computing and Communications & 2013 IEEE International Conference on Embedded and Ubiquitous Computing, Zhangjiajie, China, 13–15 November 2013; pp. 93–100. [Google Scholar] [CrossRef]
  30. Al-Saadi, A.; Paraskevakos, I.; Gonçalves, B.C.; Lynch, H.J.; Jha, S.; Turilli, M. Comparing workflow application designs for high resolution satellite image analysis. Future Gener. Comput. Syst. 2021, 124, 315–329. [Google Scholar] [CrossRef]
  31. Shi, J.; Tomasi, C. Good features to track. In Proceedings of the IEEE Conference on Computer Vision and Pattern Recognition CVPR-94, Seattle, WA, USA, 21–23 June 1994; IEEE Computer Society Press: Los Alamitos, CA, USA, 1994; pp. 593–600. [Google Scholar] [CrossRef]
Figure 1. Algorithm flowchart.
Applsci 15 07721 g001
Figure 2. STSU–SAR–SIFT flowchart.
Applsci 15 07721 g002
Figure 3. Descriptors constructed using different GLOH methods.
Applsci 15 07721 g003
Figure 4. Schematic diagram of overlapping regions among different images.
Applsci 15 07721 g004
Figure 5. A parallel computing model for accelerated algorithms.
Applsci 15 07721 g005
Figure 6. Image distribution map.
Applsci 15 07721 g006
Figure 7. Feature point extraction results of GF-3 data.
Applsci 15 07721 g007
Figure 8. Feature point extraction results of Sentinel-1 data.
Applsci 15 07721 g008
Figure 9. Matching results of GF-3.
Applsci 15 07721 g009
Figure 10. Matching results of Sentinel-1.
Applsci 15 07721 g010
Figure 11. Matching results of different algorithms.
Applsci 15 07721 g011
Figure 12. Test results of the three methods (a) NCM of the three methods on each pair of images; (b) RMSE of the three methods on each pair of images.
Applsci 15 07721 g012
Table 1. Image parameter.
SatelliteImage DateImage ScenesImage Size
(Pixels)
Resolution
(m)
Region
GF-321 April 2018928,744 × 26,5502.25 and 4.77Taihu
Sentinel-120 March 20201517,144 × 13,11220 and 20Hunan
Table 2. CMR under different descriptors.
MethodsGF-3Sentiel-1
NCMTCMCMRNCMTCMCMR
This paper28845962.75%224944.33%
SAR–SIFT25044954.62%102540.72%
I–SAR–SIFT25944255.68%123041.19%
PSO–SIFT25246555.89%194442.95%
Table 3. Performance Comparison of Descriptors with Different Dimensionalities.
Dimensionality3 × 8 × 83 × 8 × 63 × 6 × 83 × 6 × 6
NCM428387424437
RMSE1.311.441.461.53
TIME (seconds)21.9321.6621.5721.43
Table 4. RMSE comparison of GF-3 and Sentinel-1 data.
DataDifferent AlgorithmsRMSE
(All)
RMSE (Same Orbit) RMSE (Vertical Orbit) RMSE (Two-Overlapping)RMSE (Three-Overlapping)
GF-3STSU–SAR–SIFT0.430.270.580.400.41
SAR–SIFT0.680.281.140.660.67
SIFT0.711.72None0.31None
SURF0.751.79None0.35None
AKAZE0.771.04None0.37None
SuperGlue0.650.330.750.690.71
RedFeat0.580.310.670.580.64
Sentinel-1STSU–SAR–SIFT1.270.592.361.37None
SAR–SIFT1.870.372.771.87None
SIFTNoneNoneNoneNoneNone
SURFNoneNoneNoneNoneNone
AKAZENone0.79None3.64None
SuperGlue1.610.742.561.65None
RedFeat1.540.622.541.63None
Table 5. Time-consuming comparison of different data sets.
DatasateCPU (Hours)Multi-Thread CPU (Hours)CPU and GPU (Hours)
Sentinel-12.71.30.75
GF-38.353.2
Disclaimer/Publisher’s Note: The statements, opinions and data contained in all publications are solely those of the individual author(s) and contributor(s) and not of MDPI and/or the editor(s). MDPI and/or the editor(s) disclaim responsibility for any injury to people or property resulting from any ideas, methods, instructions or products referred to in the content.

