
Layered Perovskite La2Ti2O7 Obtained by Sol–Gel Method with Photocatalytic Activity
.jpg)
 ,
,  , ,
, ,  , , ,
, , , 
Abstract
1. Introduction
- Superior thermal stability: possesses good electron mobility due to ions on A sites and high conductivity [16].
- Good resistance to ionizing radiation [19].
- Layered structure: favorable for the separation and transfer of photogenerated electron–hole pairs, as well as separating oxidation from reduction reaction sites [18].
- Host matrix: can host other lanthanides to create new phosphors with conventional luminescence under UV excitation [15].
2. Materials and Methods
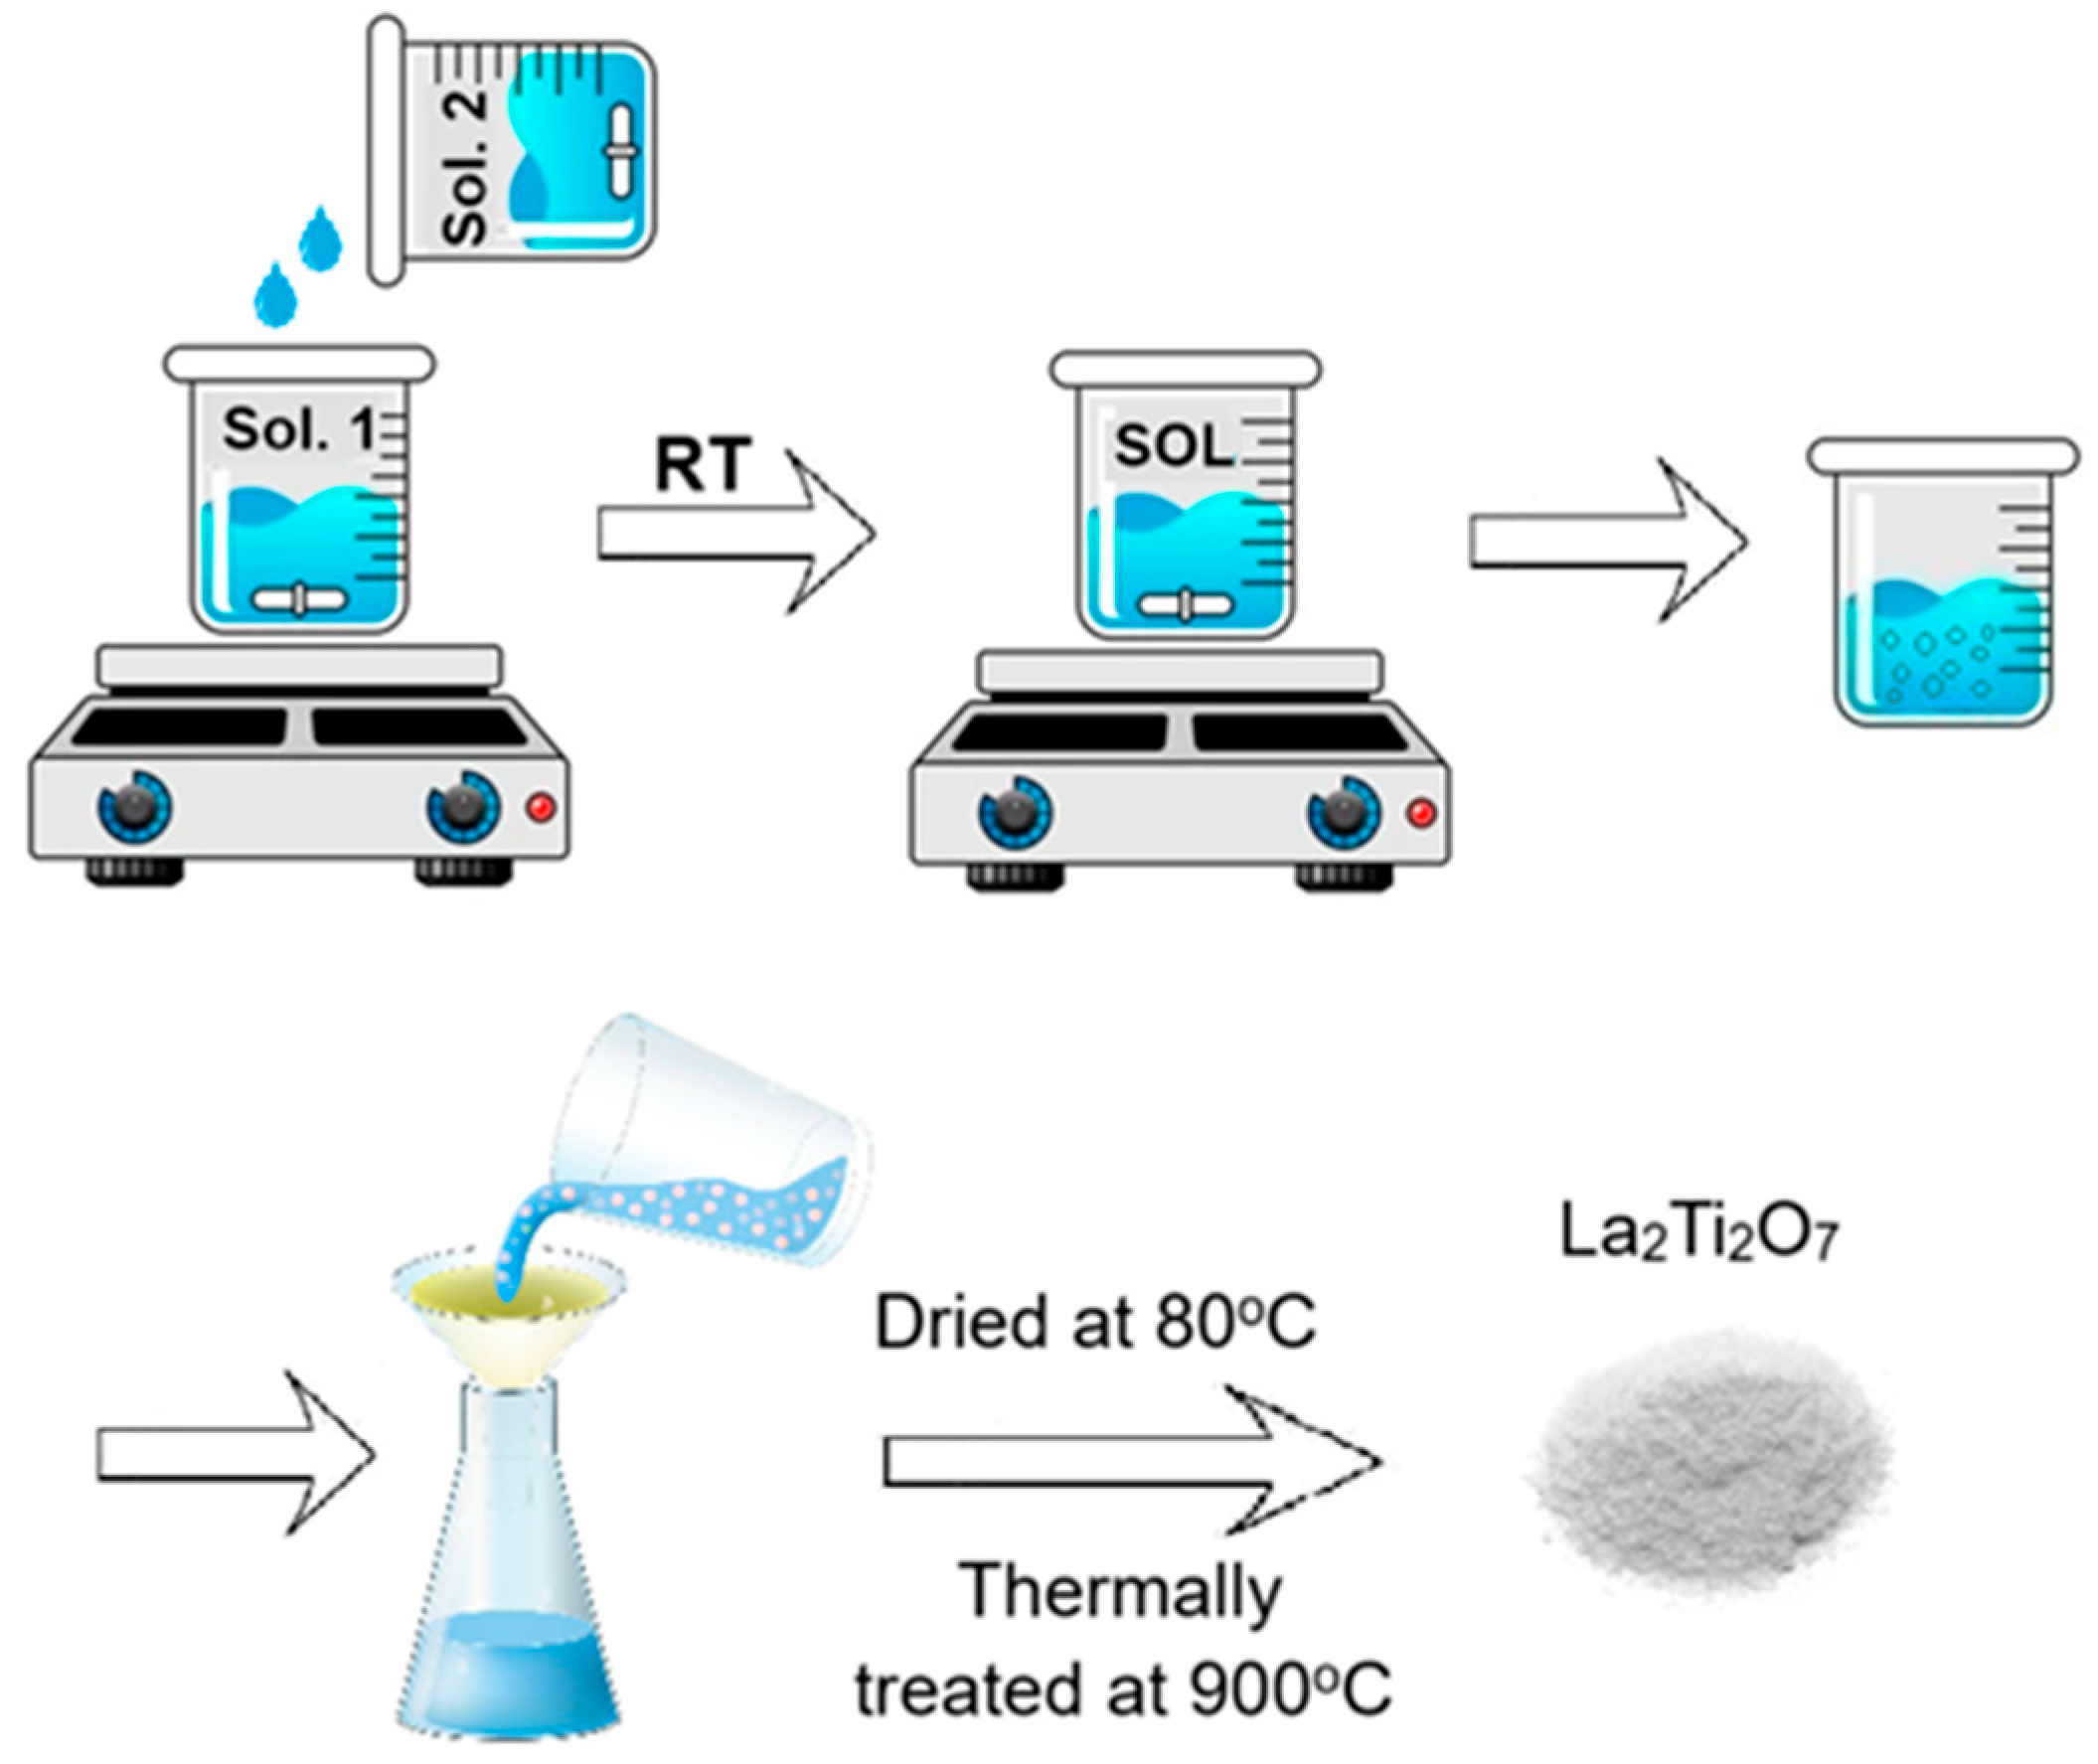
2.1. Gel and Powder Preparation
2.2. Methods
- -
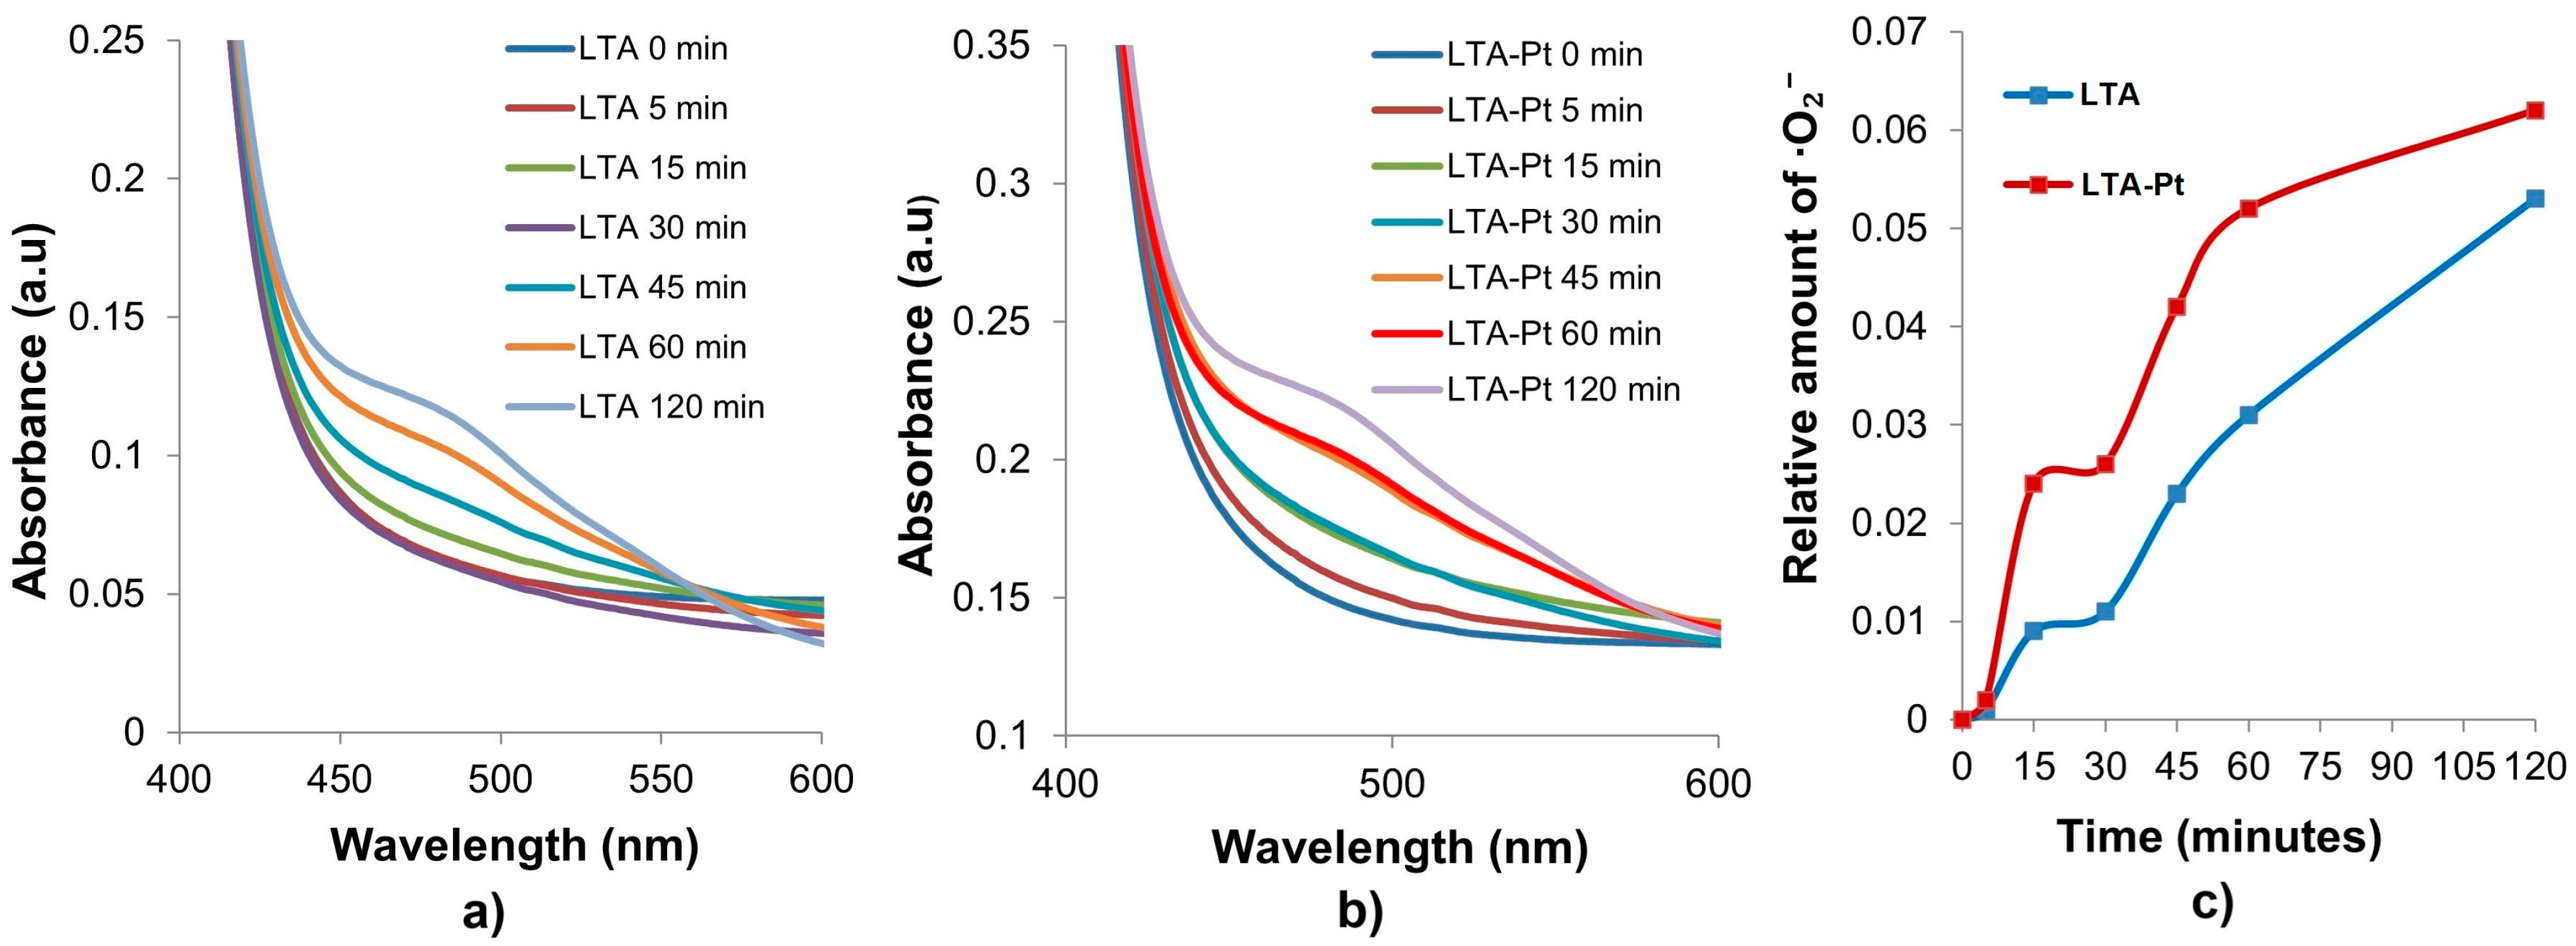
- ·O2− photogeneration. UV–Vis spectra of aqueous mixtures containing 50 μM XTT sodium salt 9([2, 3-bis(2-methoxi-4-nitro-5sulfophenyl)-2H-tetrazolium-5-carboxanilide]) (AlfaAesar, Karlsruhe, Germany) and LTA, LTA-Pt powders (2 mg) were measured with an Specord 200 Plus Spectrophotometer (Analytik Jena, Jena, Germany). The reaction was carried out under simulated solar light of AM1.5 (1000 W m2, Peccel-L 01) (Peccell, Kawasaki, Japan).
- -
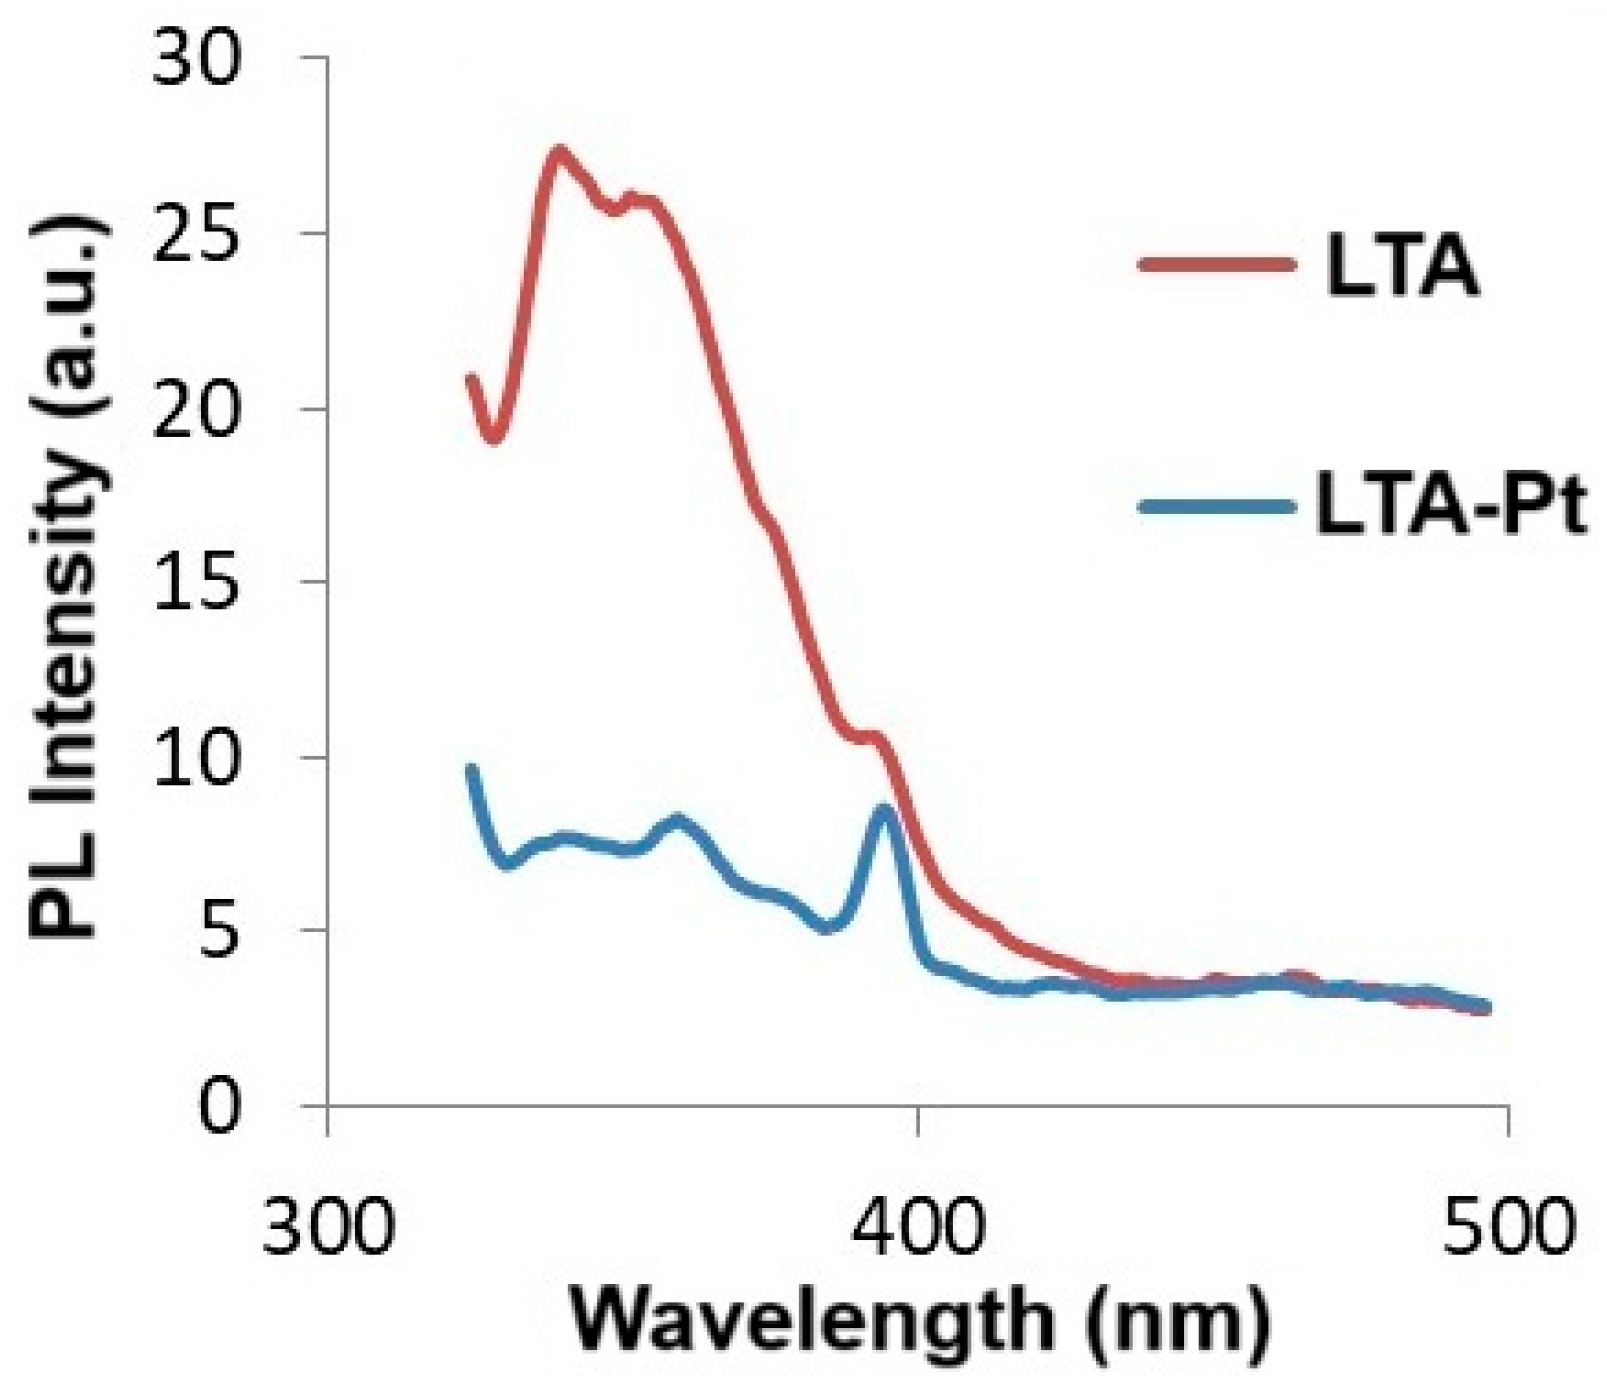
- ·OH radical trapping experiments have also been performed by PL spectroscopy using the Cary Eclipse G9800A fluorescence spectrometer (Agilent Technologies, Penang, Malaysia) with coumarin (Merck, Darmstadt, Germany), checking for the presence of umbelliferone (a fluorescent product which peaked at 470 nm) and proving that hydroxyl radicals were missing.
3. Results and Discussion
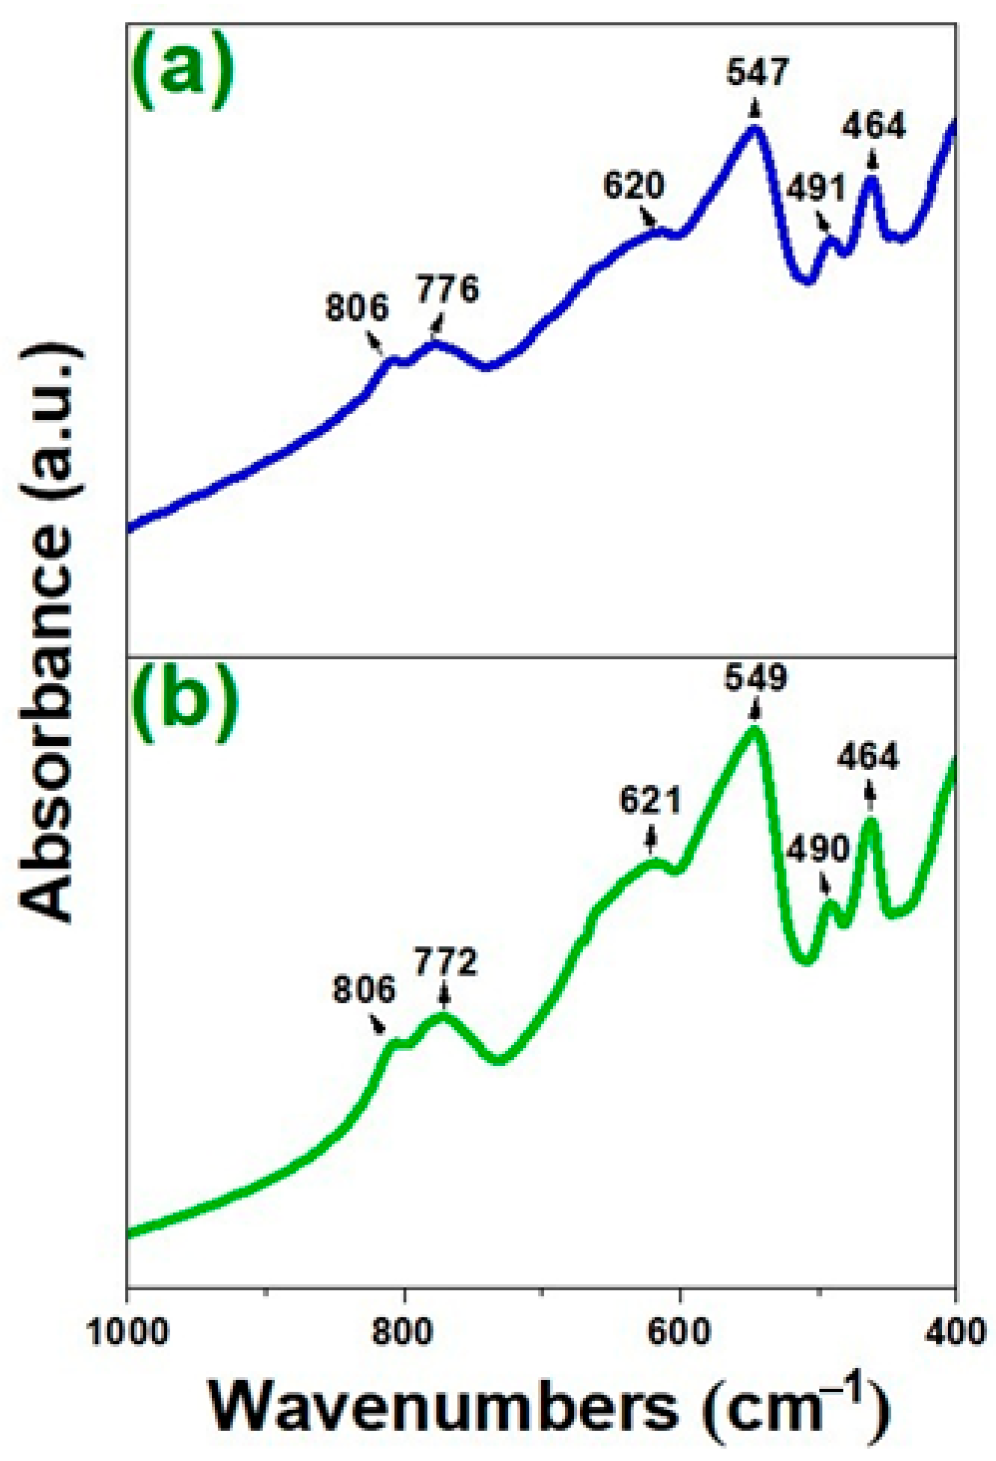
3.1. Fourier Transform Infrared Spectroscopy (FT-IR)
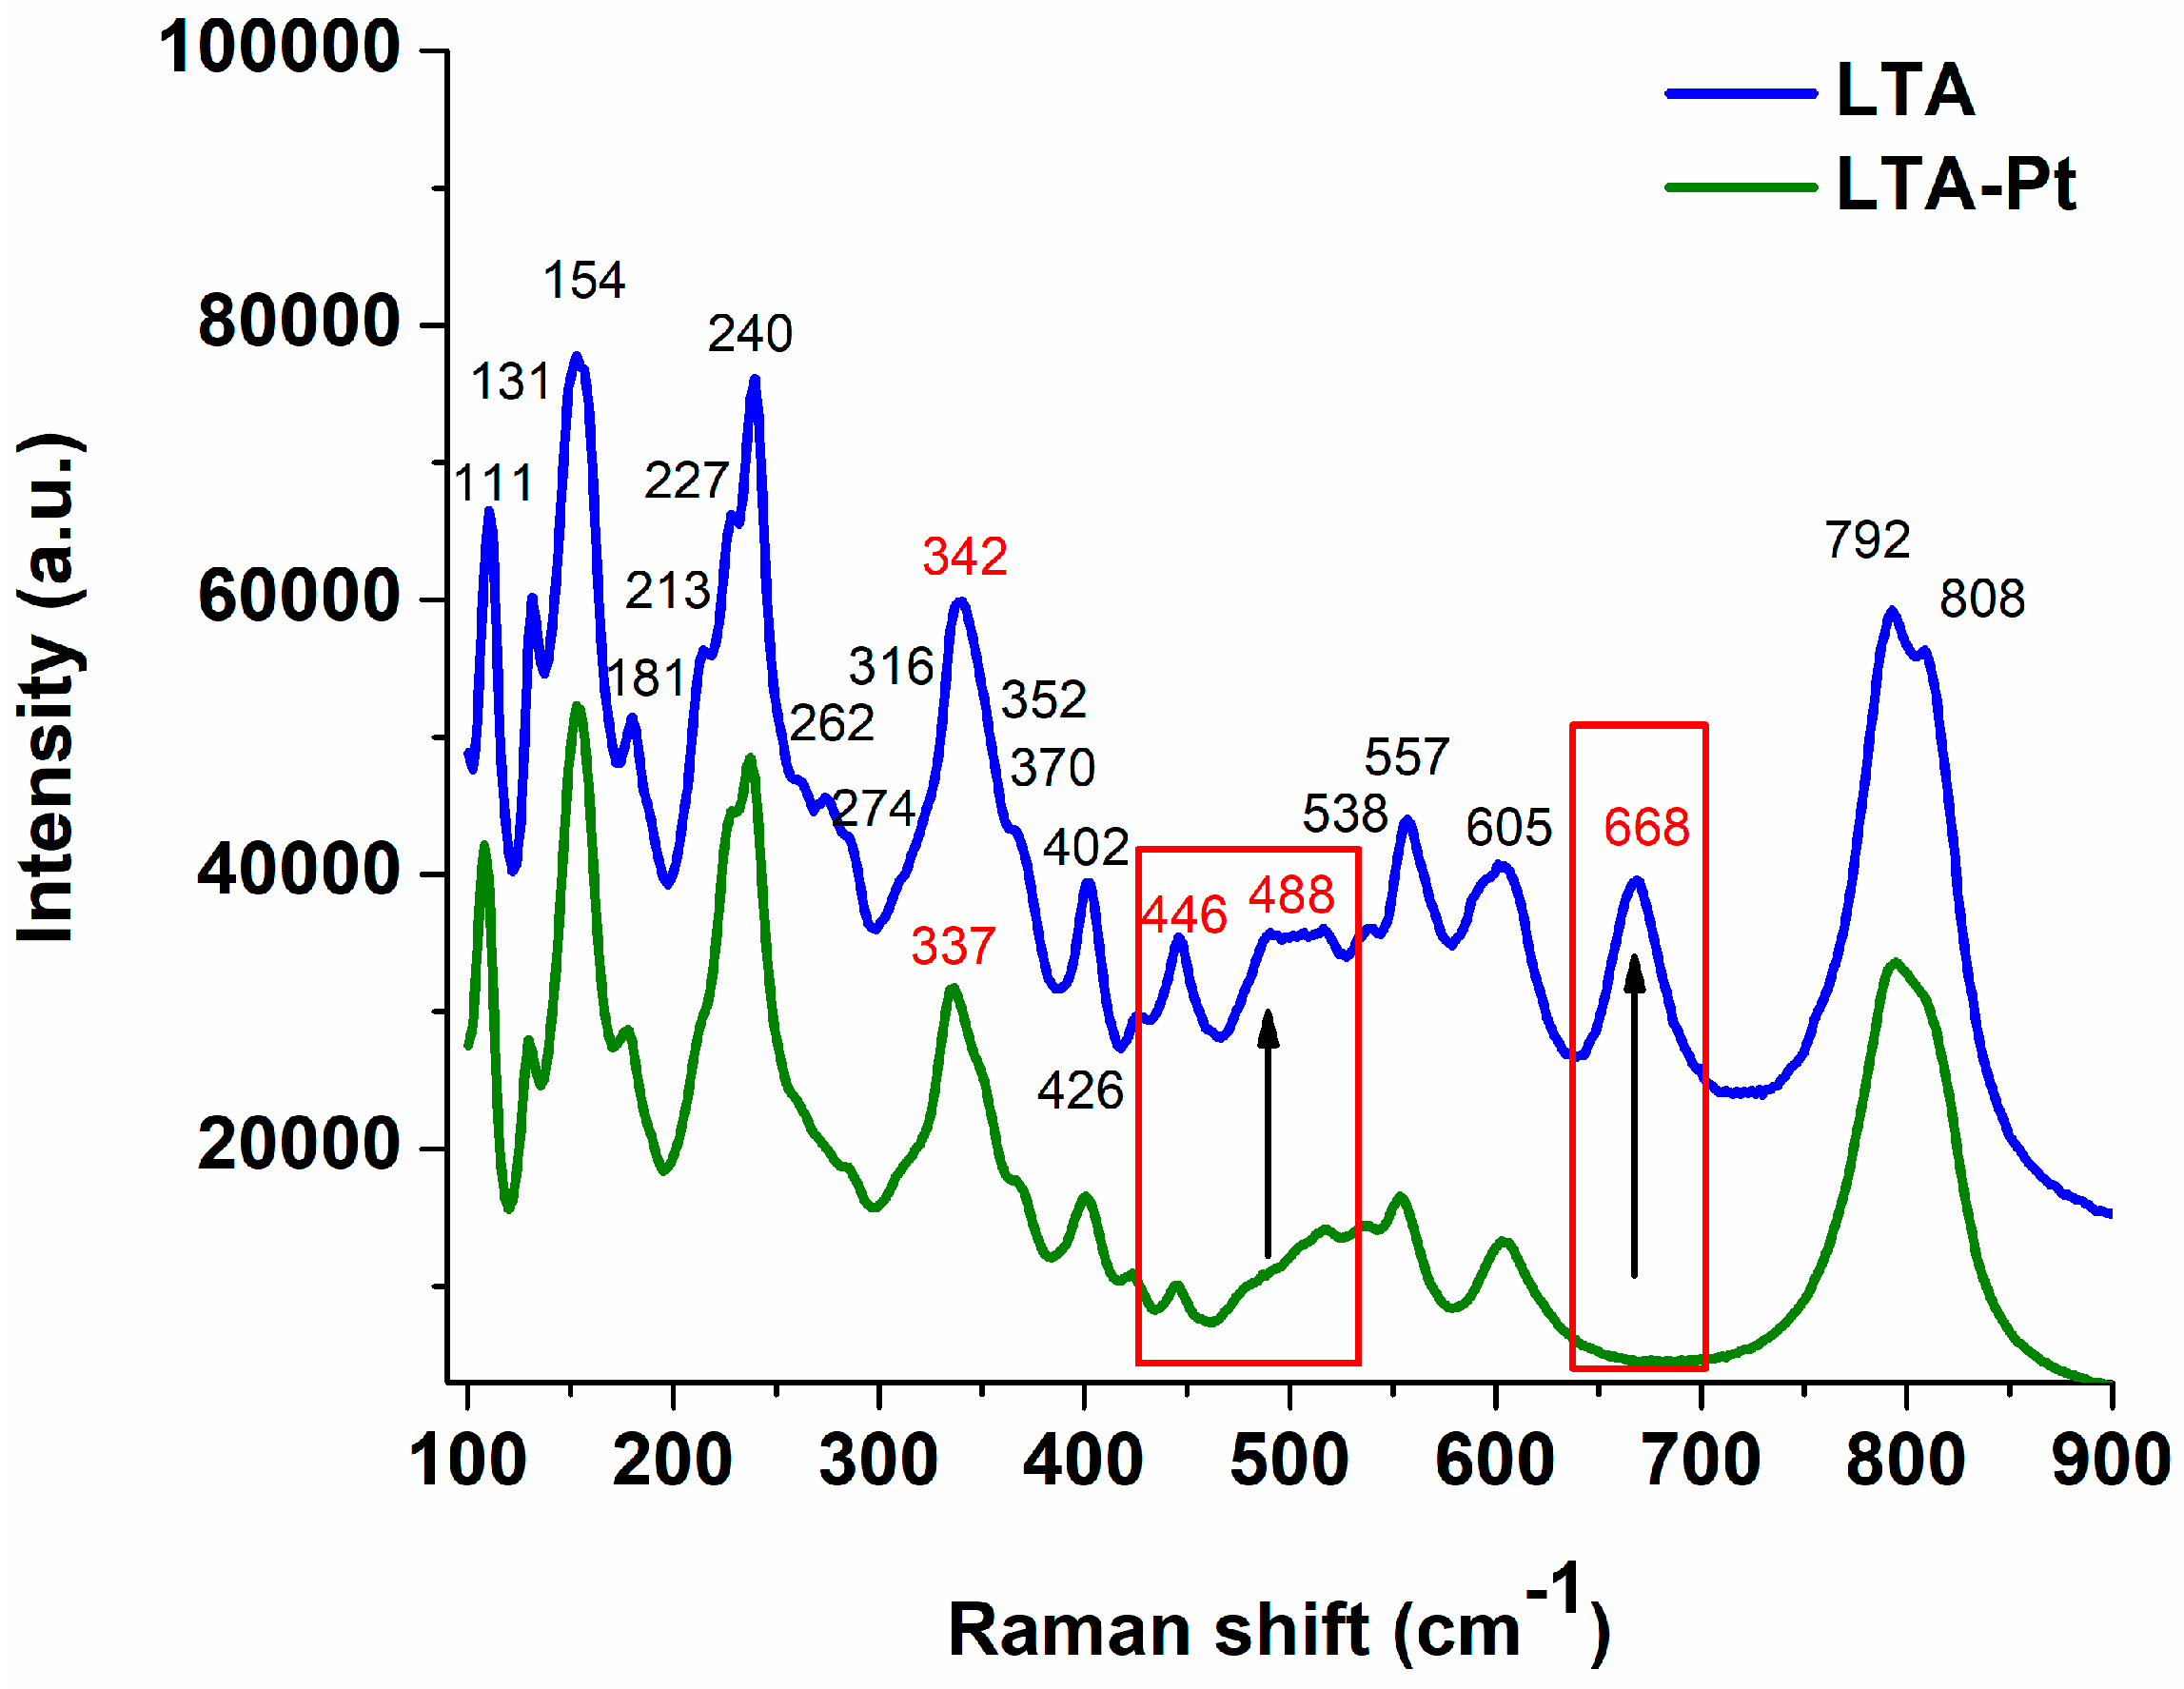
3.2. Raman Spectroscopy
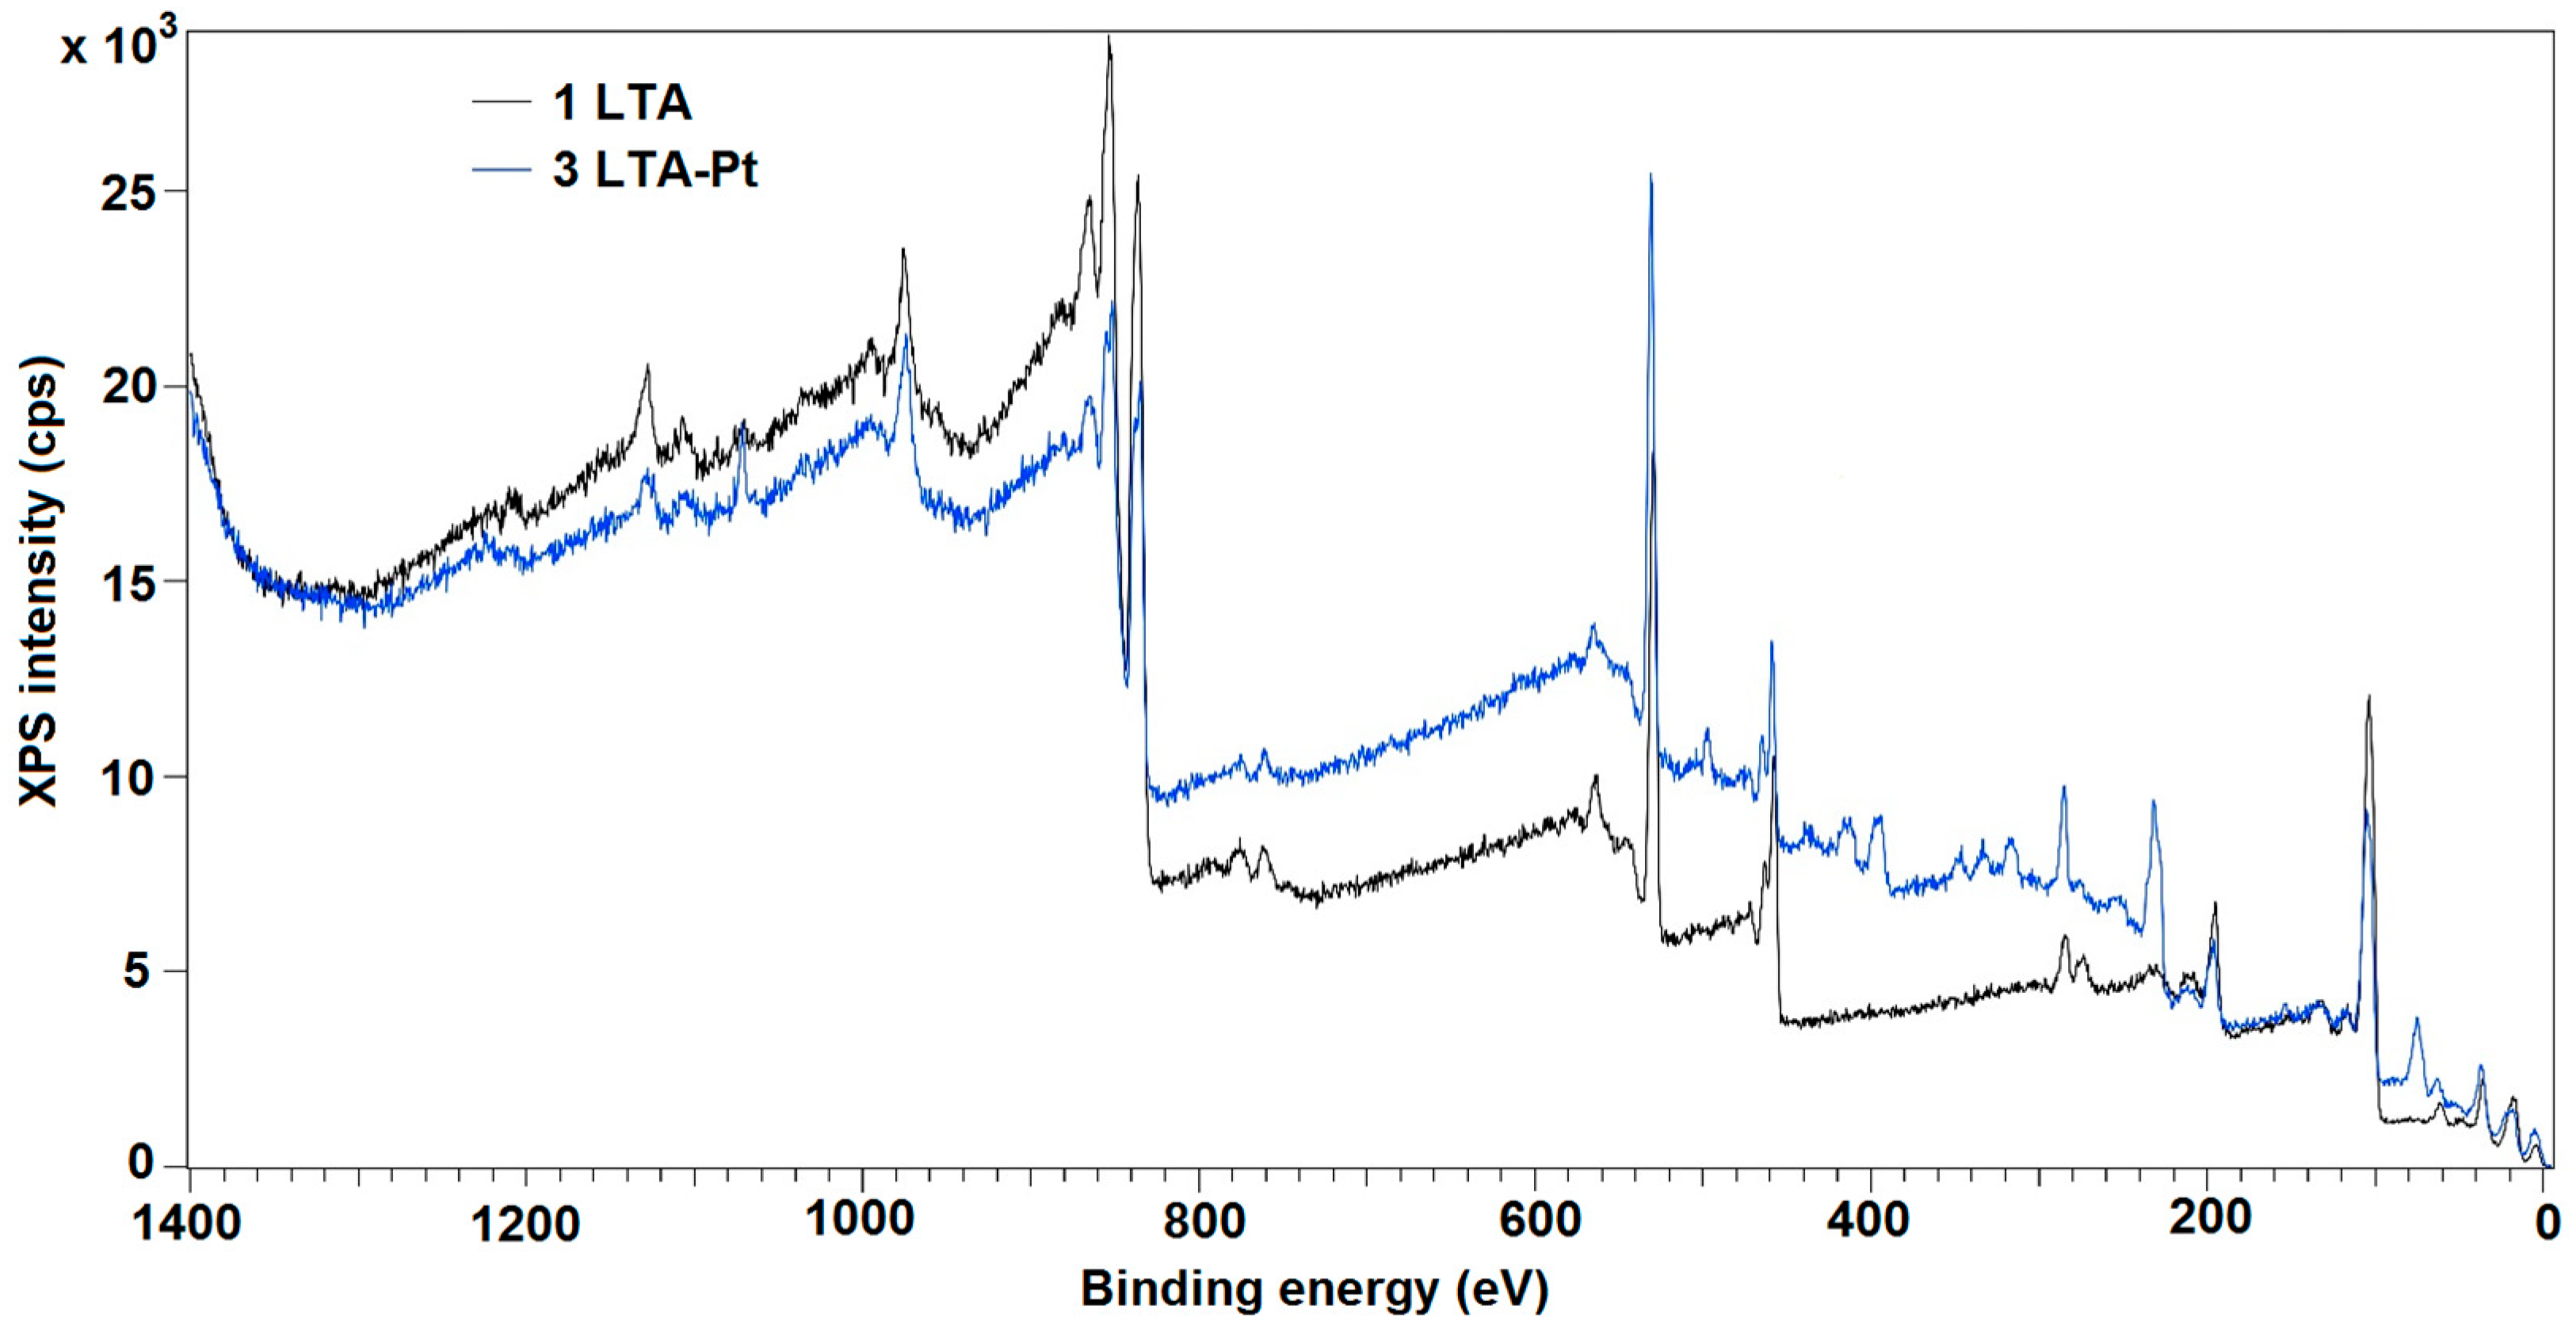
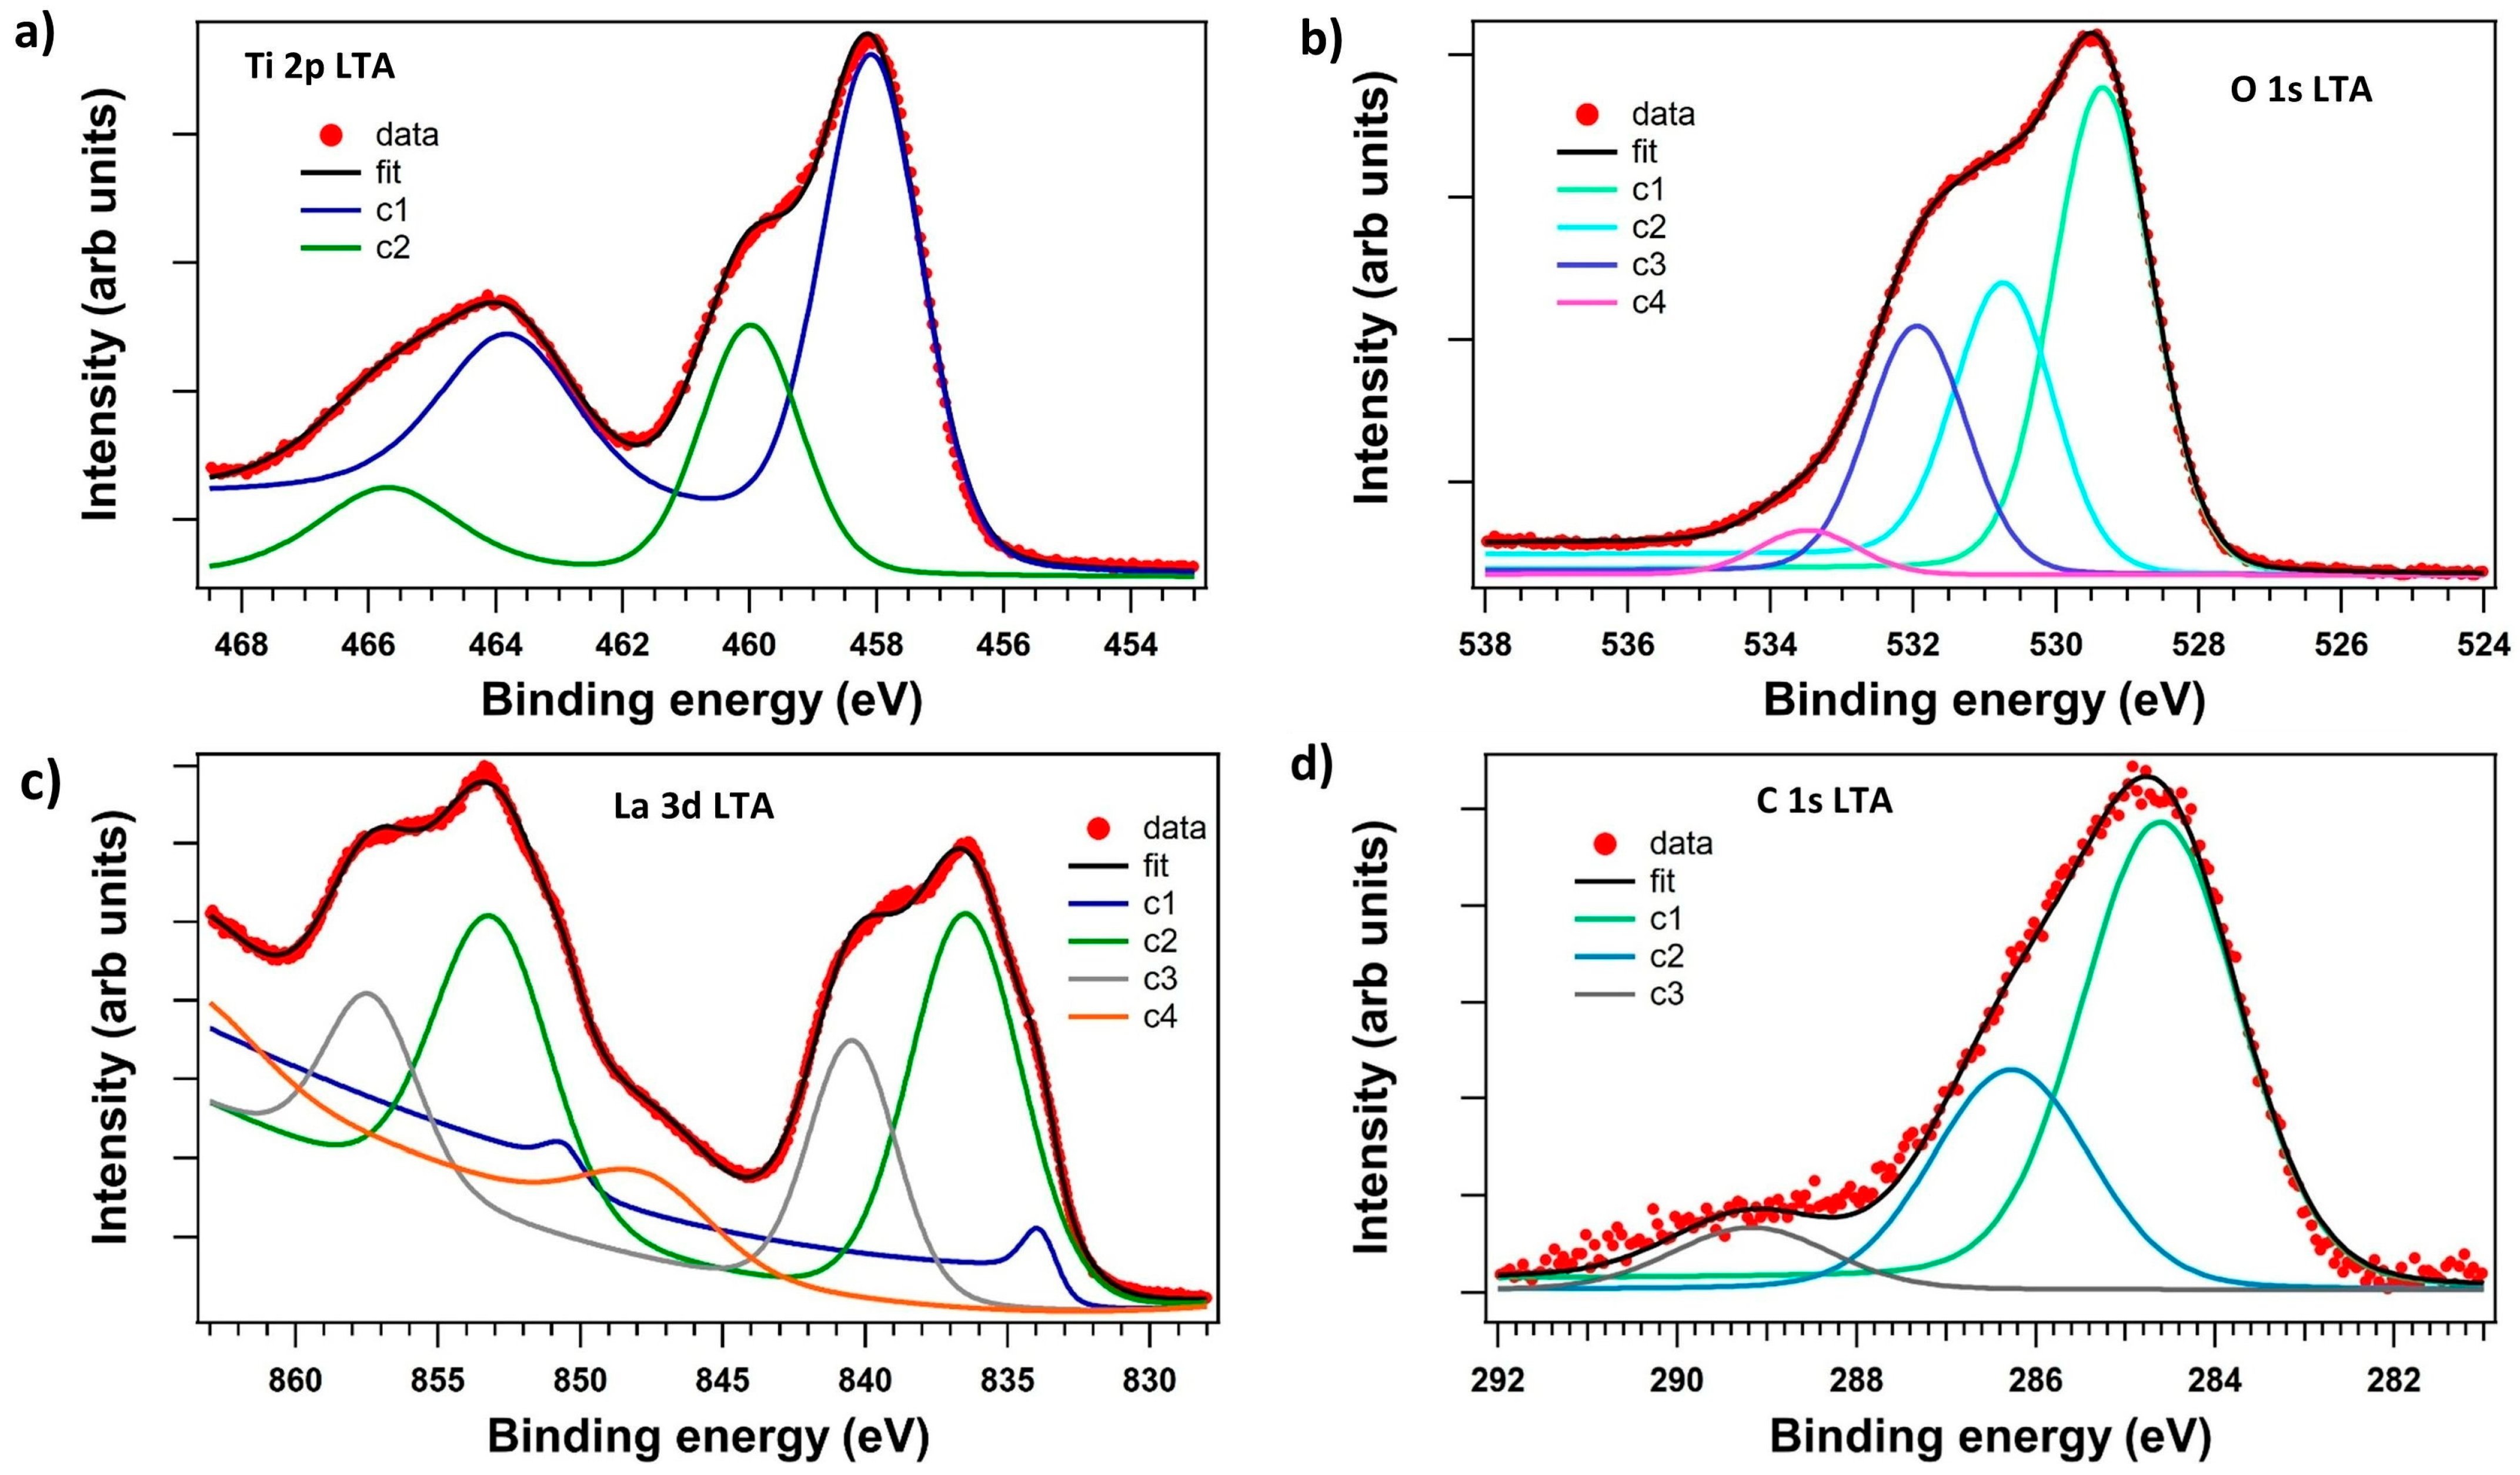
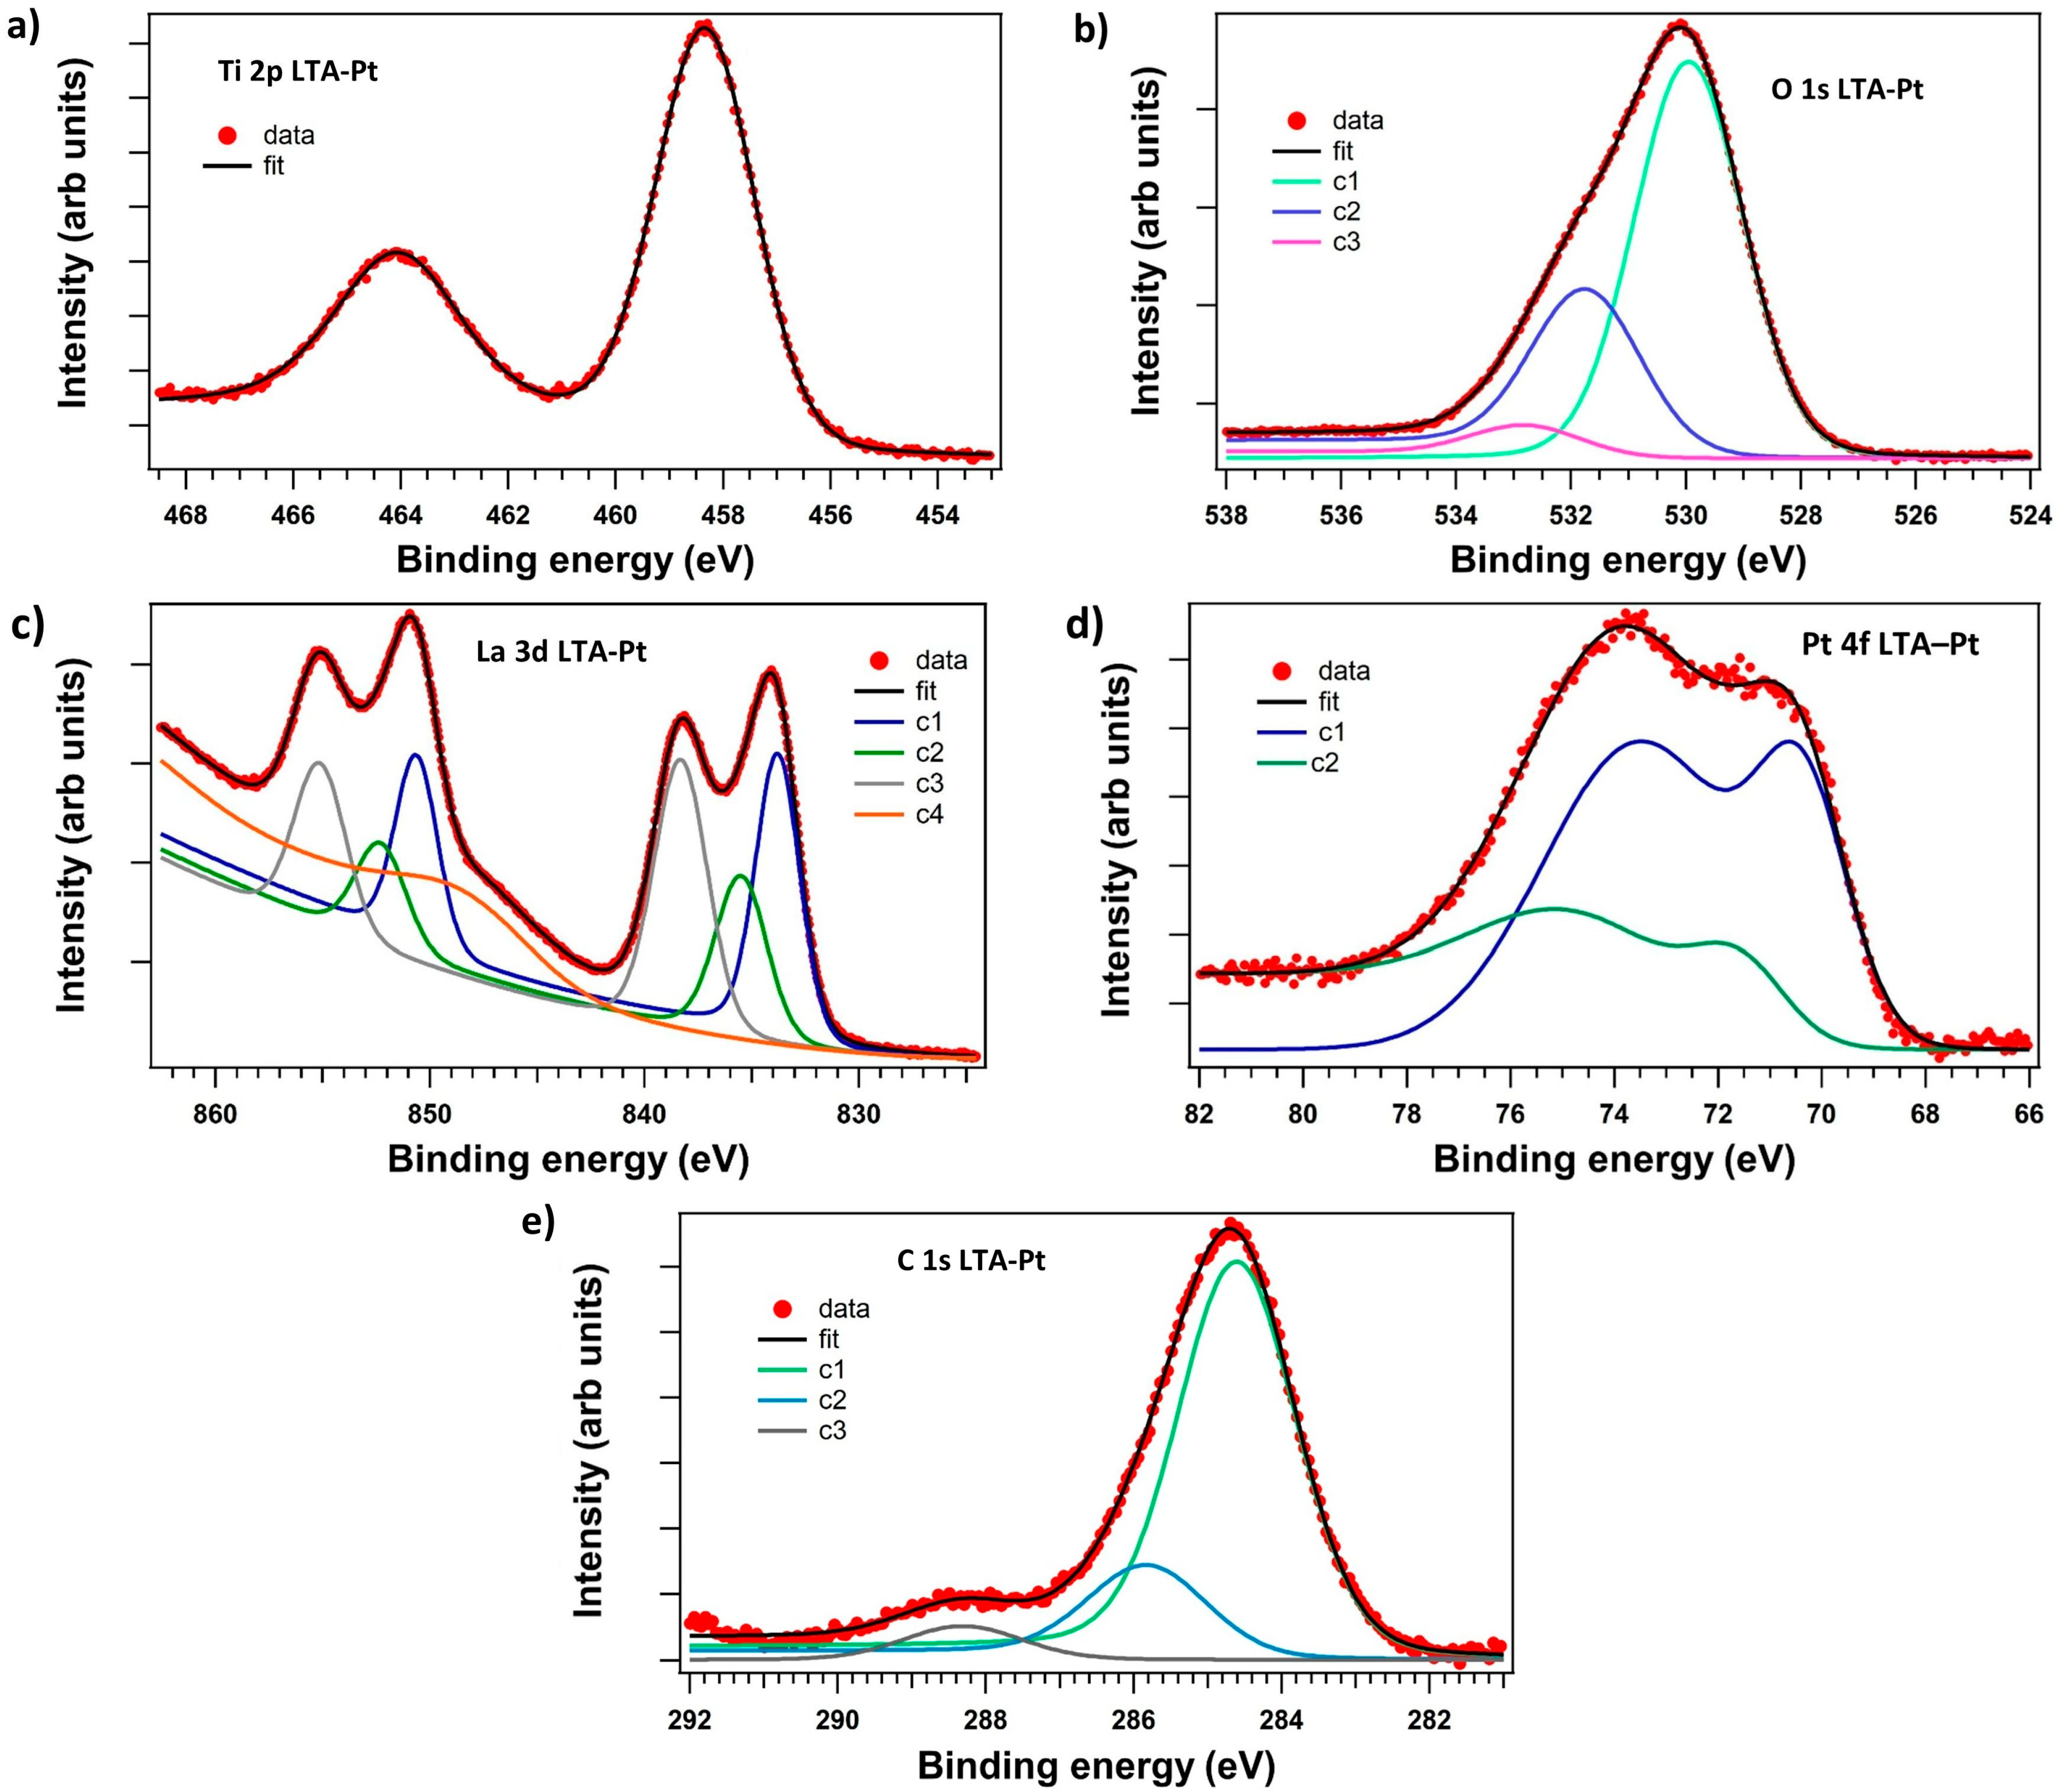
3.3. X-Ray Photoelectron Spectroscopy (XPS)
3.4. Scanning Electron Microscopy and Energy Dispersive X-Ray Spectroscopy (SEM and EDX)
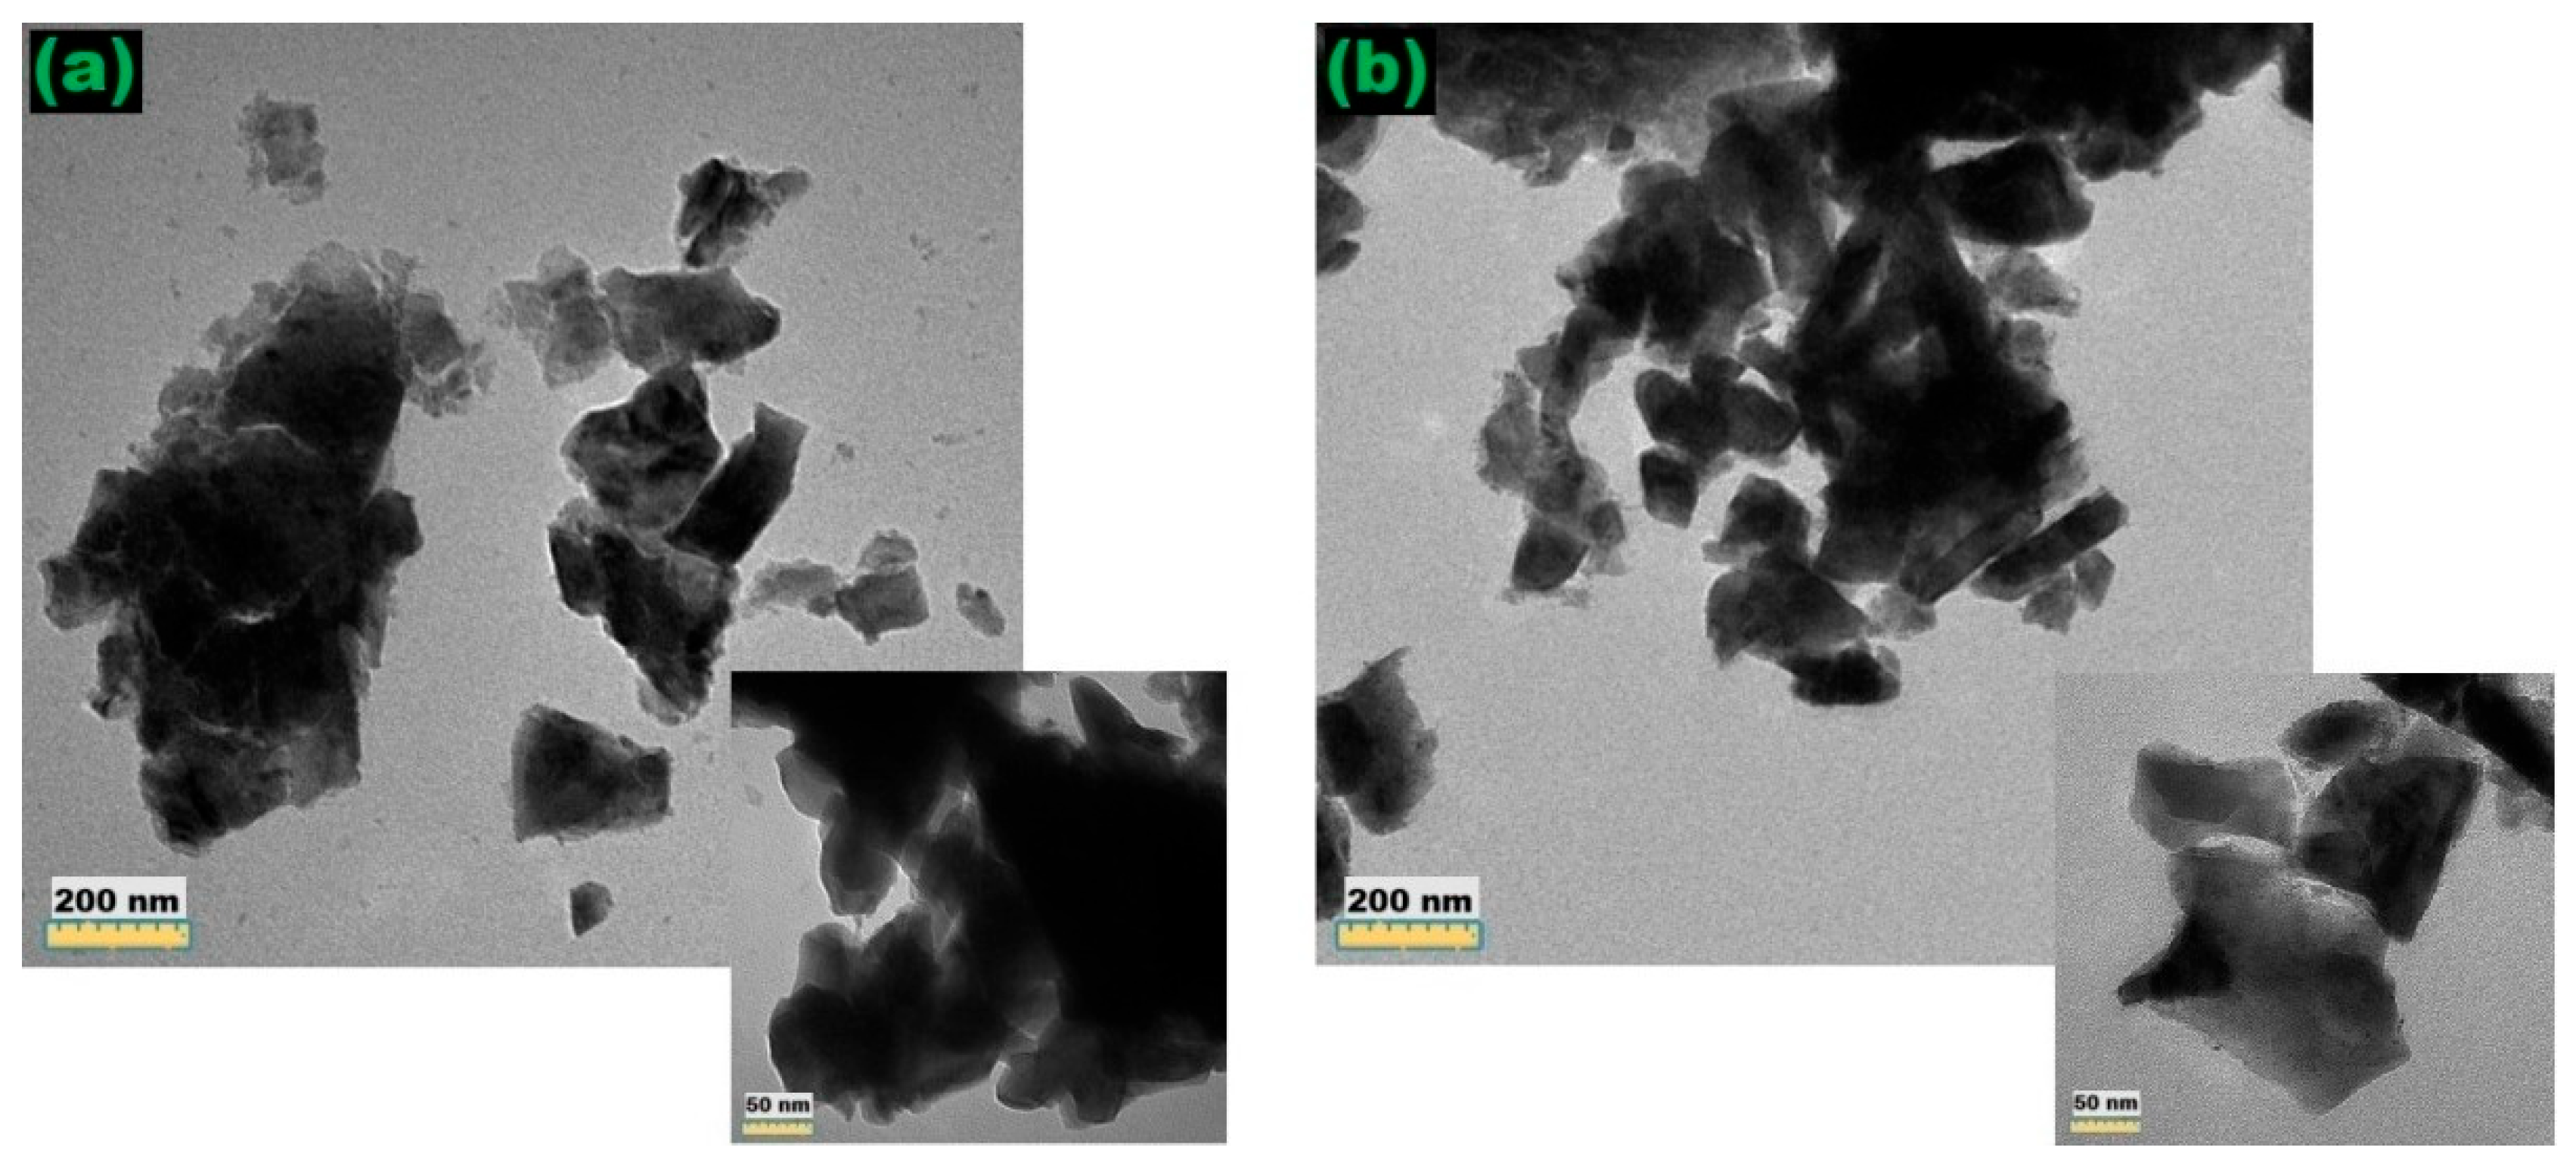
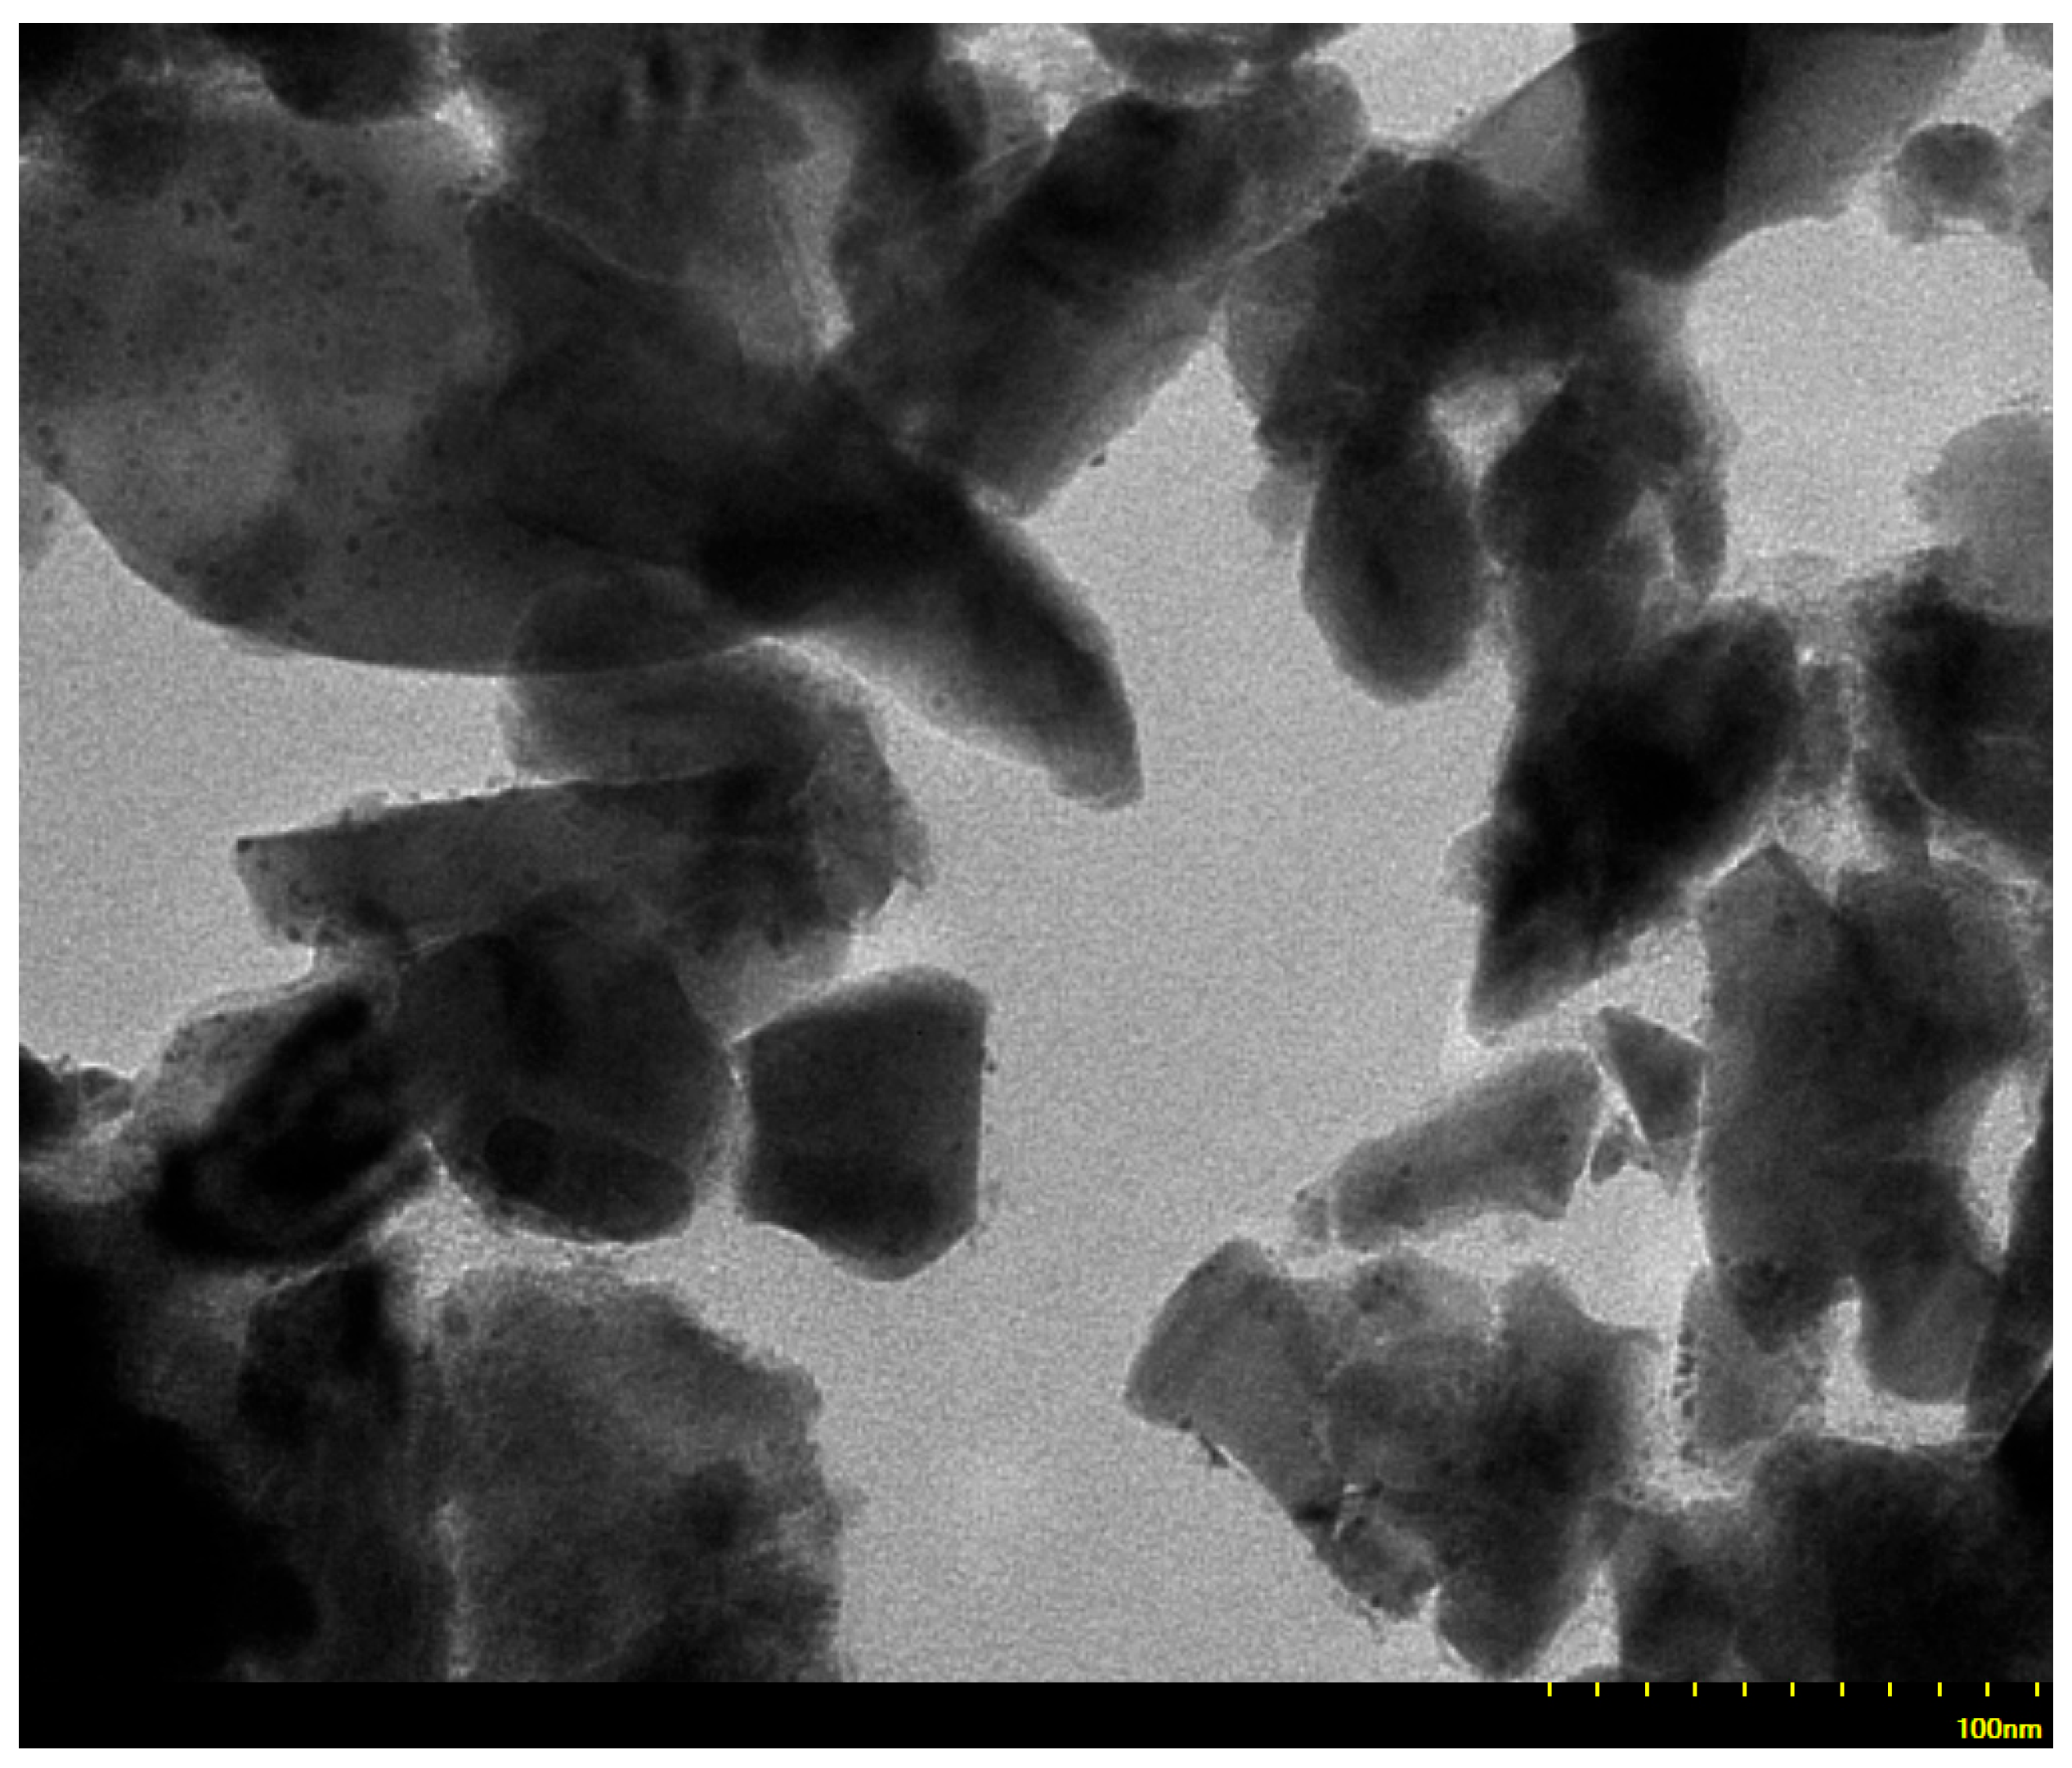
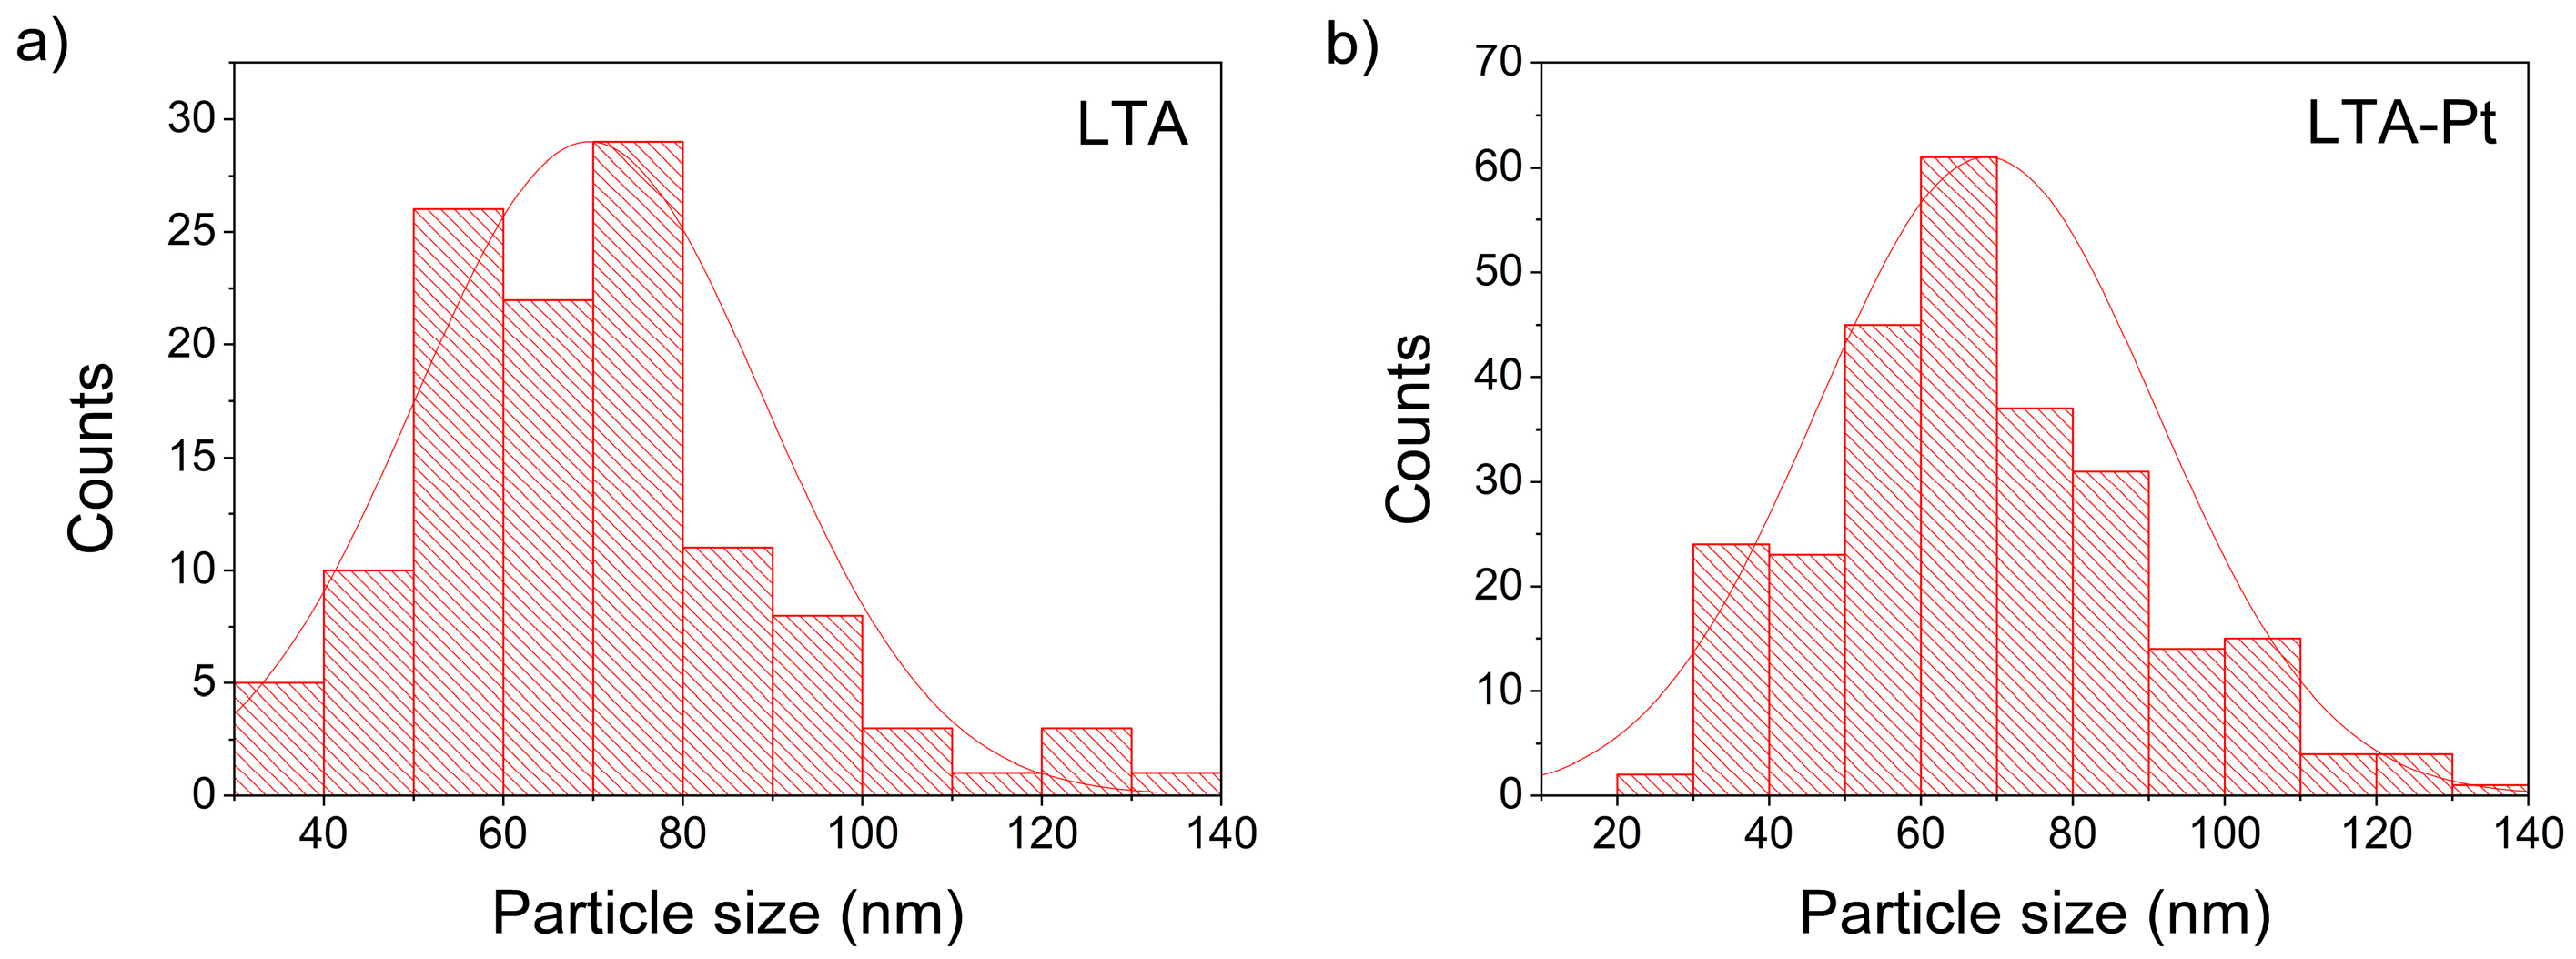
3.5. Transmission Electron Microscopy (TEM)
3.6. X-Ray Diffraction (XRD)
3.7. X-Ray Fluorescence (XRF)
3.8. Textural Characterization (BET)
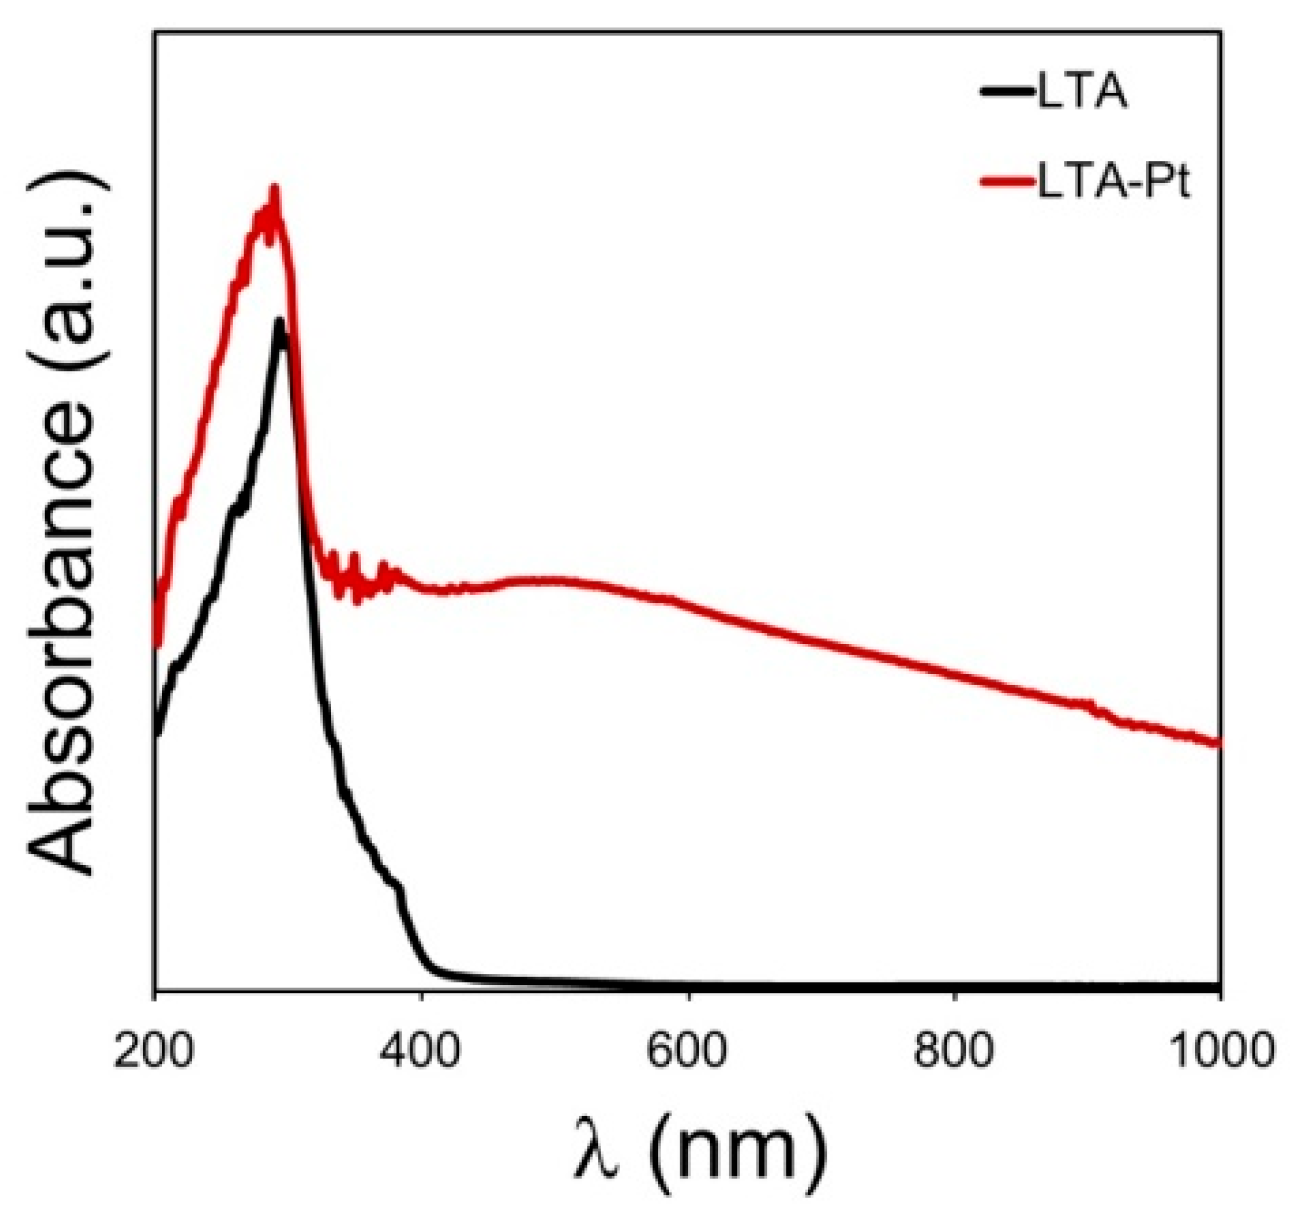
3.9. Ultraviolet-Visible Spectroscopy (UV-Vis)
3.10. ROS Monitoring
3.11. Photoluminescence Measurements
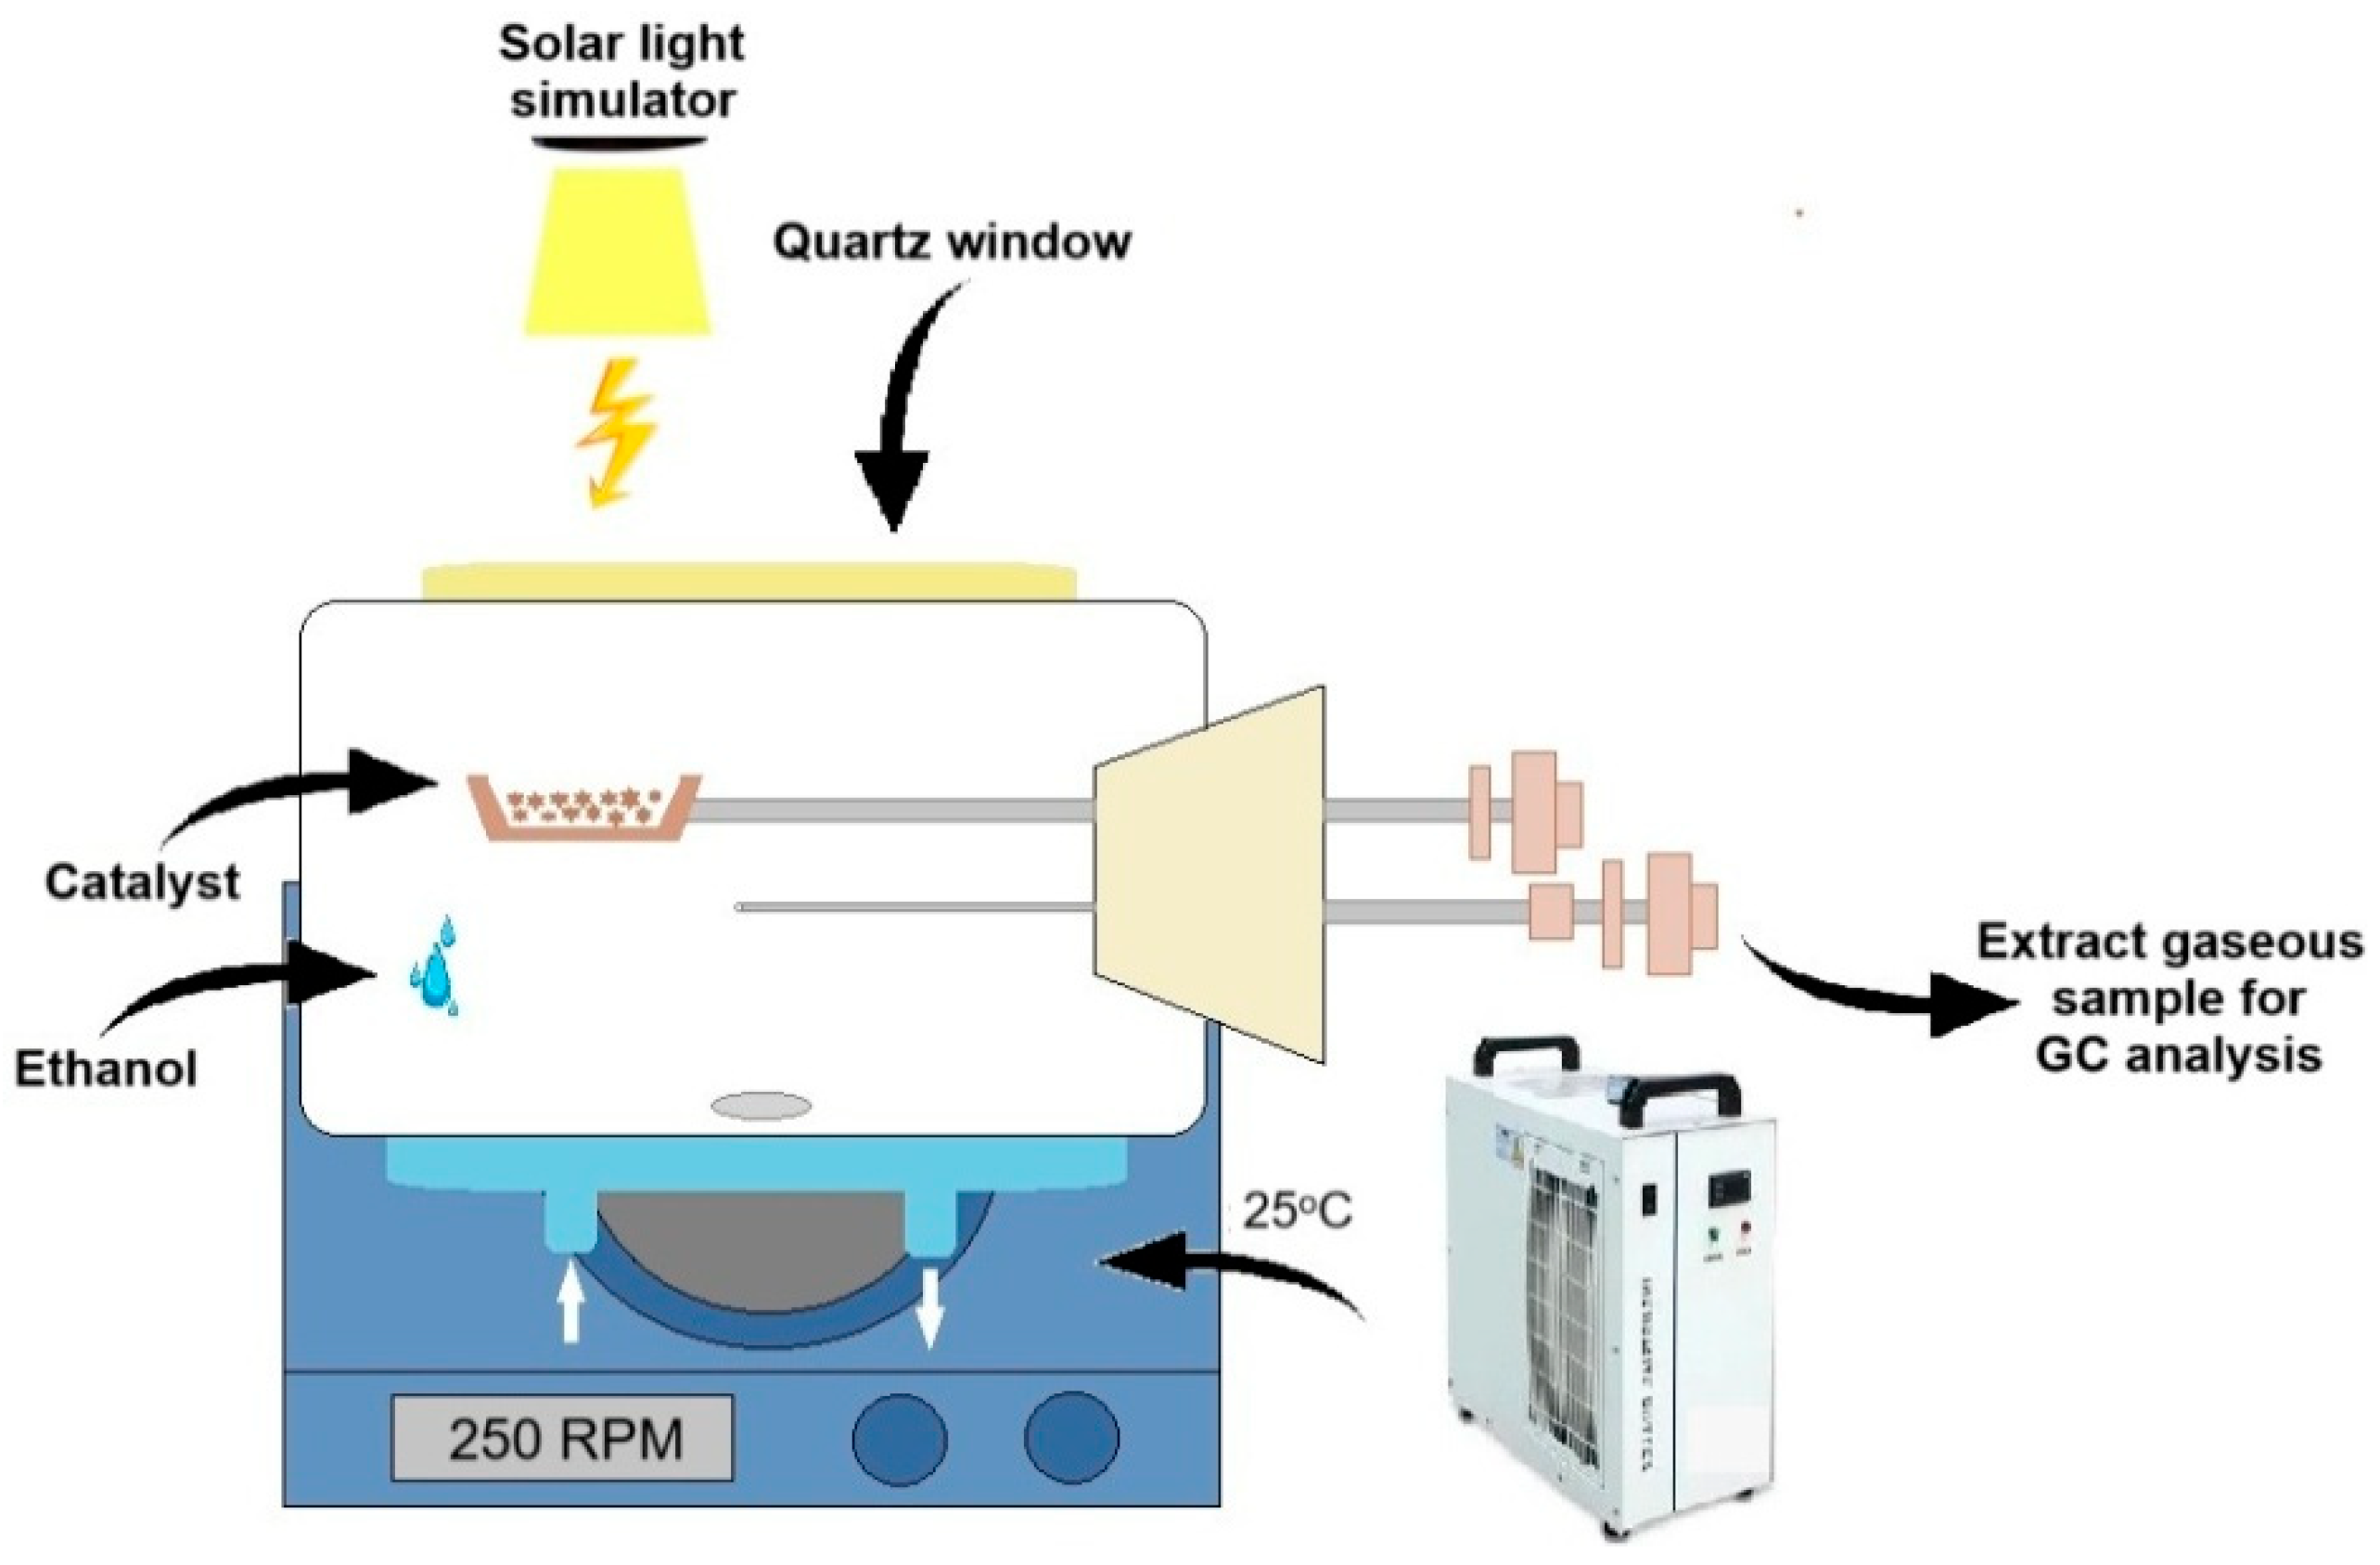
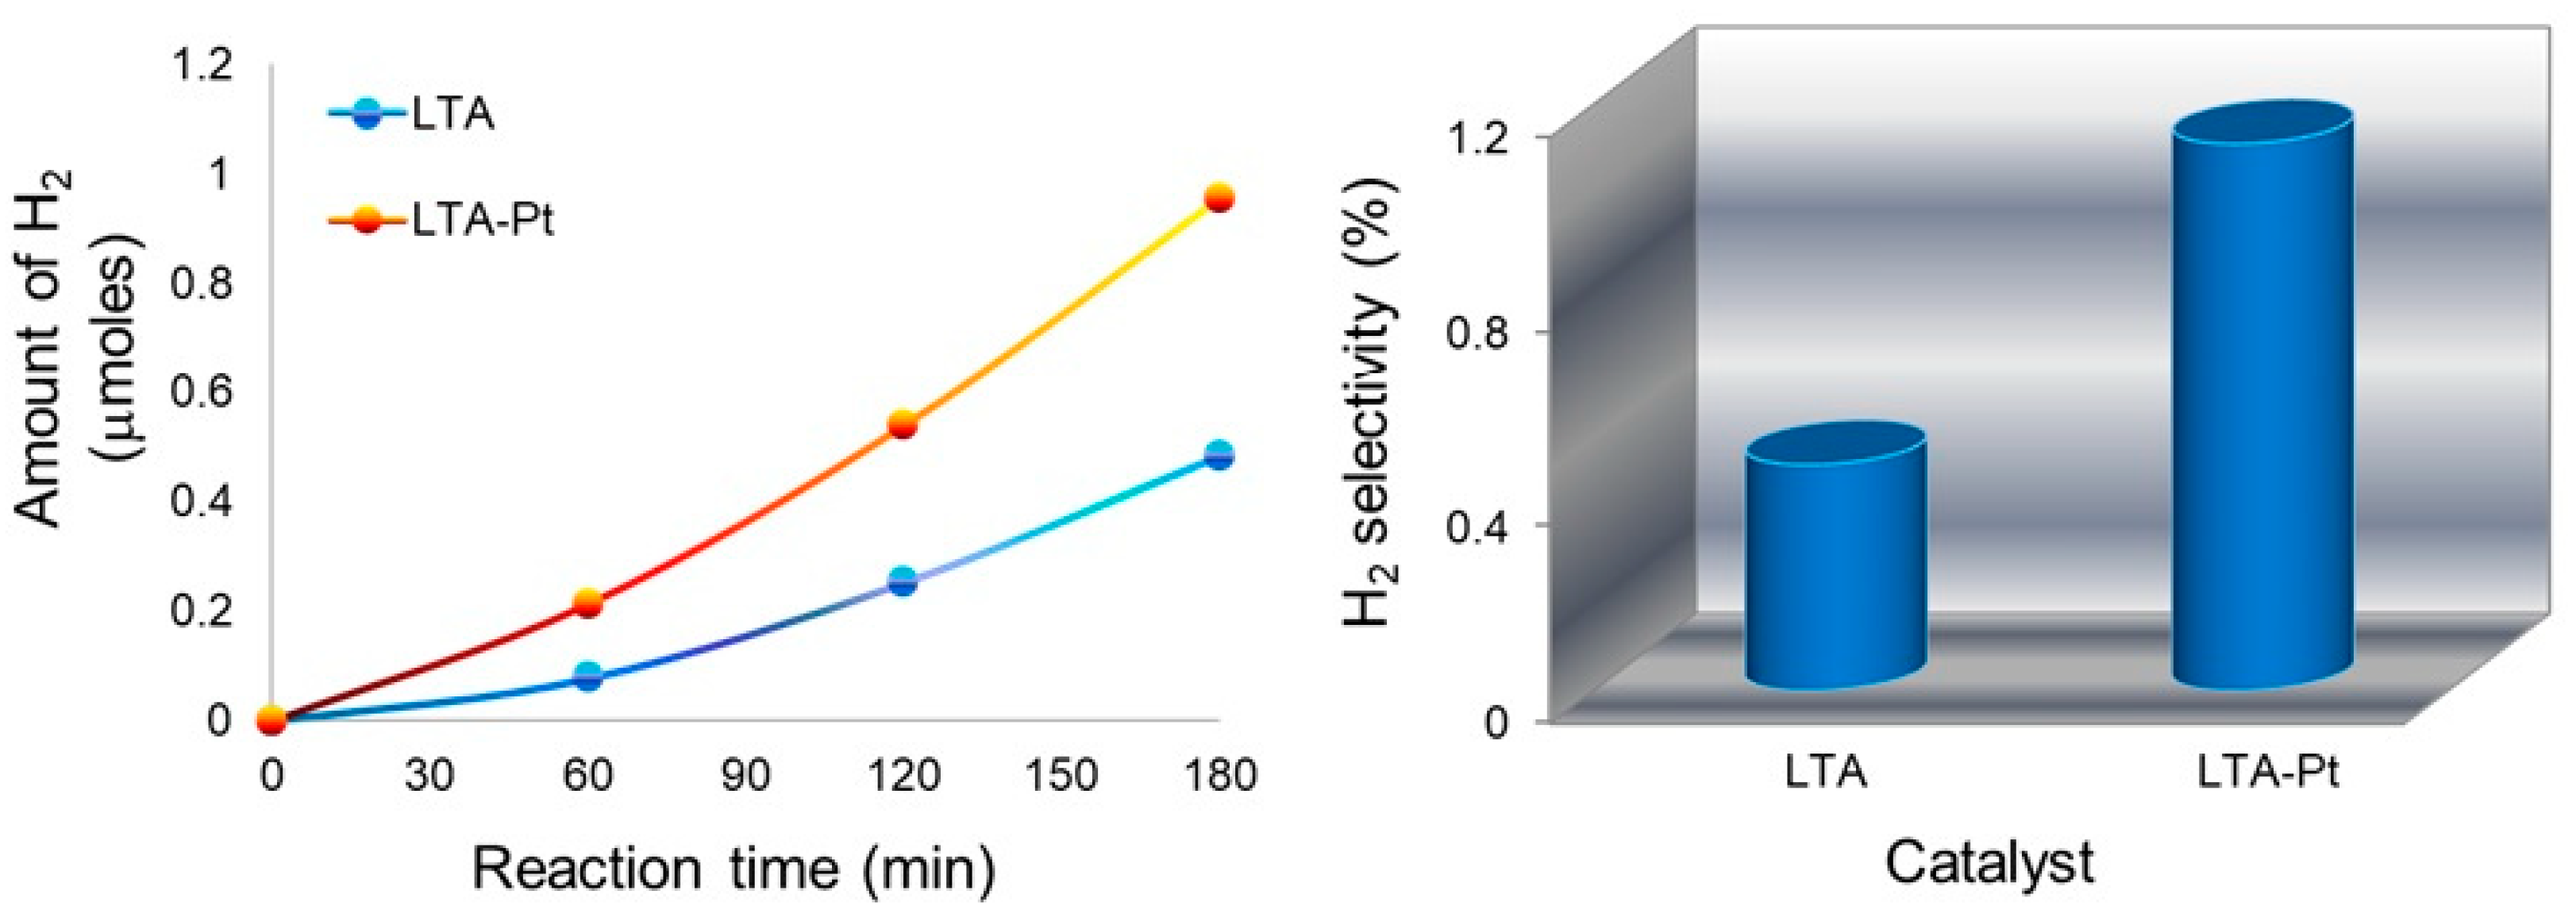
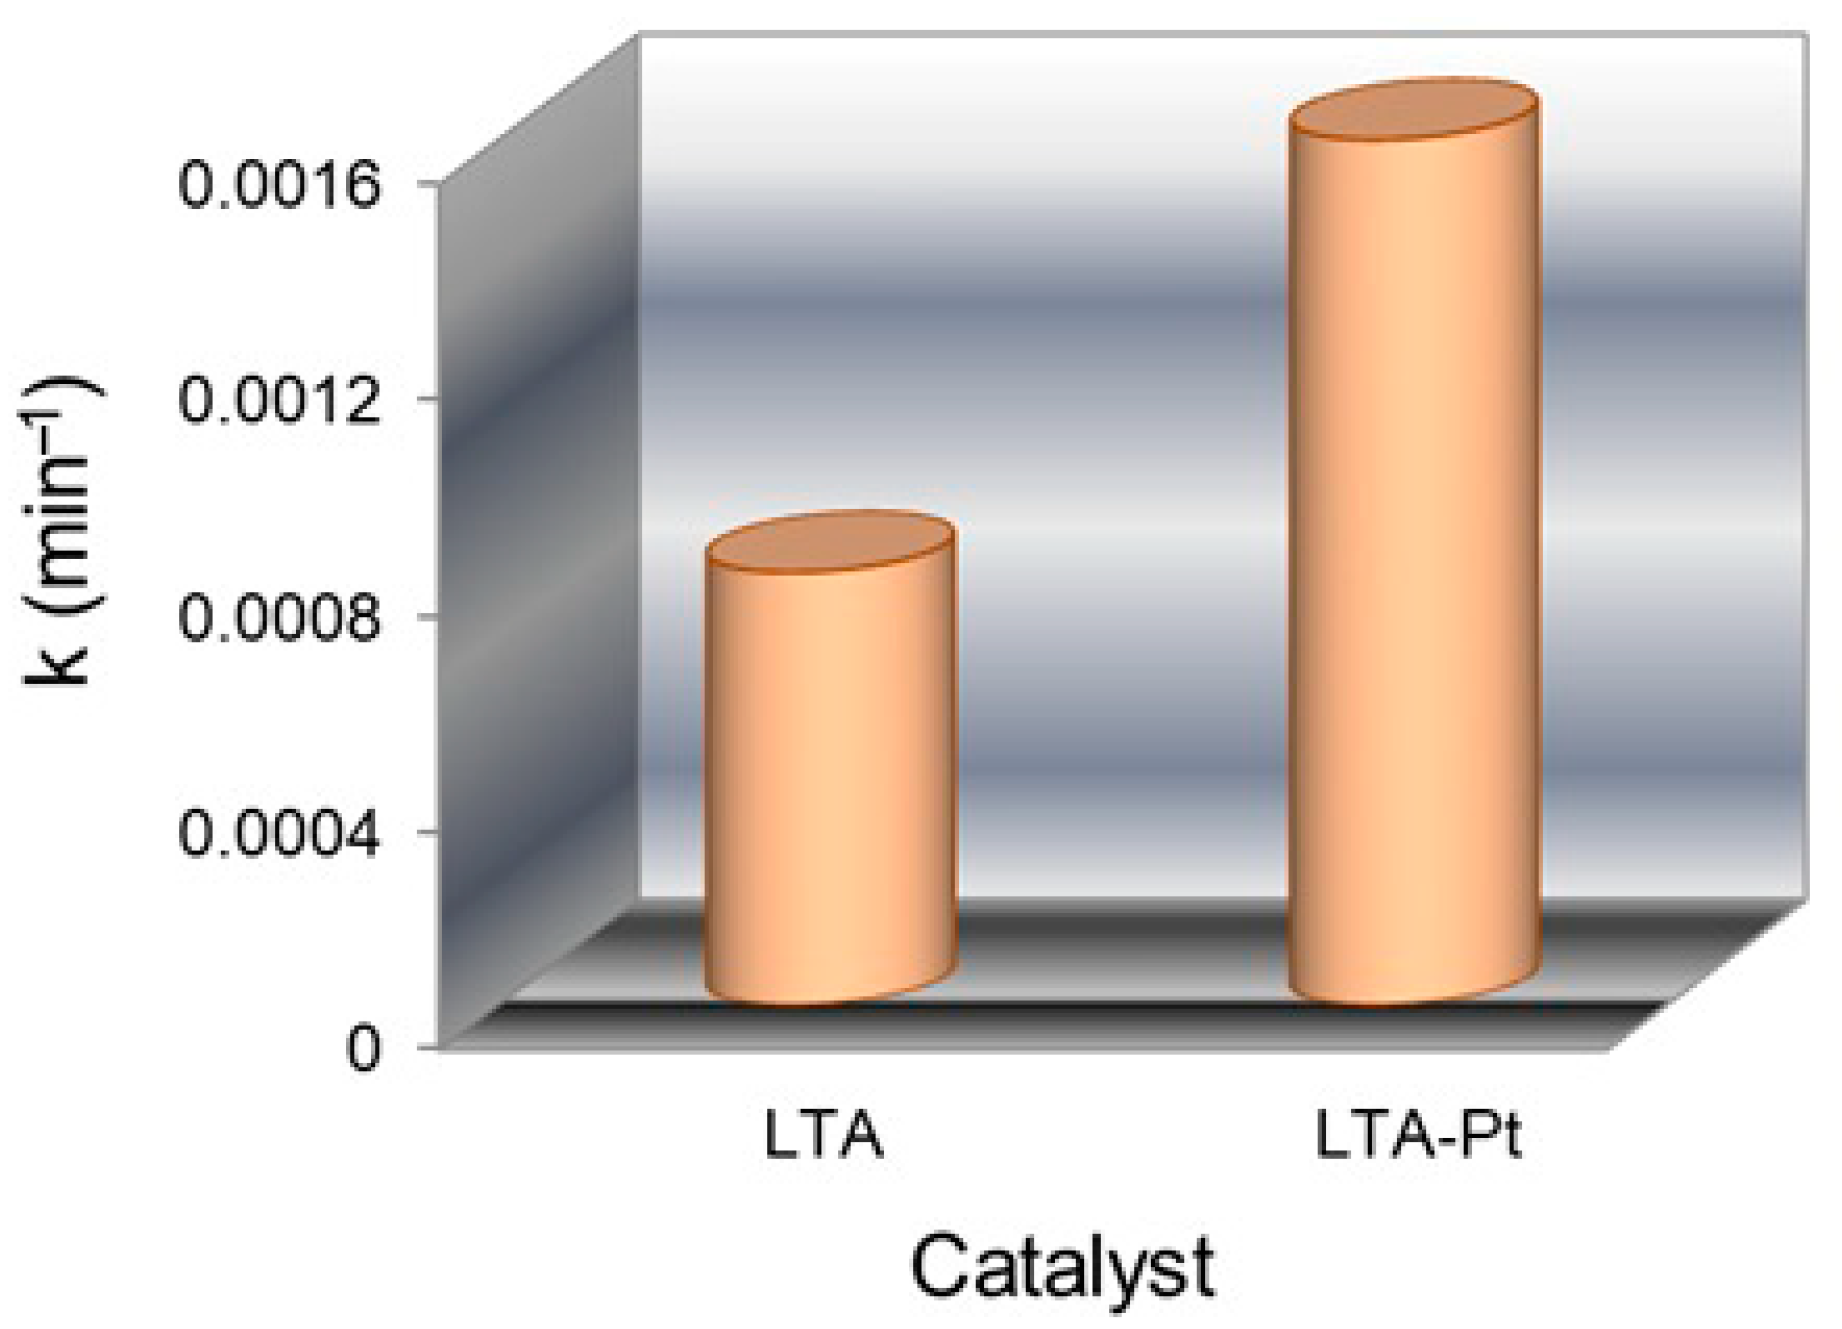
3.12. Photocatalytic Tests
3.13. Proposed Mechanism of Oxidative Degradation of Ethanol Under Simulated Solar Light
- (a)
- (b)
- (c)
- Oxidative degradation of ethanol by photogenerated holes—ethanol is oxidized by holes (h+) to form the ethoxy radical (CH3CH2O·) (Equation (4)) and this undergoes further oxidation, yielding acetaldehyde (CH3CHO) (Equations (4)–(6)). Acetaldehyde is also oxidized by holes to generate formic acid (HCOOH) in trace amounts, finally leading to CO2 (Equations (7) and (8)) [37,87,88,89,90,91].
- (d)
- Photogenerated electrons (e−) can reduce protons (H+) to form molecular hydrogen (H2) (Equation (9)) [92].
4. Conclusions
Author Contributions
Funding
Institutional Review Board Statement
Informed Consent Statement
Data Availability Statement
Acknowledgments
Conflicts of Interest
References
- Chen, D.; Cheng, Y.; Zhou, N.; Chen, P.; Wang, Y.; Li, K.; Huo, S.; Cheng, P.; Peng, P.; Zhang, R.; et al. Photocatalytic Degradation of Organic Pollutants Using TiO2-Based Photocatalysts: A Review. J. Clean. Prod. 2020, 268, 121725. [Google Scholar] [CrossRef]
- Li, X.; Wei, H.; Song, T.; Lu, H.; Wang, X. A Review of the Photocatalytic Degradation of Organic Pollutants in Water by Modified TiO2. Water Sci. Technol. 2023, 88, 1495–1507. [Google Scholar] [CrossRef] [PubMed]
- Bhagwat, U.O.; Maridevaru, M.C.; Al Souwaileh, A.; Wu, J.J.; Anandan, S. Layered Perovskite La2Ti2O7 Nanostructures for Photocatalytic Degradation of Congo Red Dye Pollutant. ChemistrySelect 2024, 9, e202403511. [Google Scholar] [CrossRef]
- Wang, Q.; Zhang, G.; Zhang, C.; Xu, F.; Zhang, Y.; Fu, W.; Liu, J.; Li, J. Enhanced Mineralization of Organic Pollutants through Atomic Hydrogen-Mediated Alternative Transformation Pathways. Environ. Sci. Technol. 2024, 58, 11185–11192. [Google Scholar] [CrossRef] [PubMed]
- Zhou, H.; Wang, H.; Yue, C.; He, L.; Li, H.; Zhang, H.; Yang, S.; Ma, T. Photocatalytic Degradation by TiO2-Conjugated/Coordination Polymer Heterojunction: Preparation, Mechanisms, and Prospects. Appl. Catal. B 2024, 344, 123605. [Google Scholar] [CrossRef]
- Ruziwa, D.T.; Oluwalana, A.E.; Mupa, M.; Meili, L.; Selvasembian, R.; Nindi, M.M.; Sillanpaa, M.; Gwenzi, W.; Chaukura, N. Pharmaceuticals in Wastewater and Their Photocatalytic Degradation Using Nano-Enabled Photocatalysts. J. Water Process Eng. 2023, 54, 103880. [Google Scholar] [CrossRef]
- Ashouri, F.; Khoobi, M.; Ganjali, M.R.; Karimi, M.S. Construction, Characterization, and Photocatalytic Study of La2Ti2O7/C3N4+xHy and La2Ti2O7/GO Nanocomposites as Efficient Catalysts toward Photodegradation of Harmful Organic Dyes. J. Photochem. Photobiol. A Chem. 2023, 435, 114279. [Google Scholar] [CrossRef]
- Tsoukleris, D.S.; Gatou, M.-A.; Lagopati, N.; Sygellou, L.; Christodouleas, D.C.; Falaras, P.; Pavlatou, E.A. Chemically Modified TiO2 Photocatalysts as an Alternative Disinfection Approach for Municipal Wastewater Treatment Plant Effluents. Water 2023, 15, 2052. [Google Scholar] [CrossRef]
- Zhong, L.; Li, X.; Zhan, Y.; Liu, Y.; Yang, K.; Liu, J.; Liu, S.; Jiang, J.; Li, L.; Sakata, Y. Sodium-Doped La2Ti2O7 Synthesized by Molten Salt Synthesis Method for Photocatalytic Overall Water Splitting. Appl. Catal. A Gen. 2025, 692, 120079. [Google Scholar] [CrossRef]
- Maitlo, H.A.; Anand, B.; Kim, K.-H. TiO2-Based Photocatalytic Generation of Hydrogen from Water and Wastewater. Appl. Energy 2024, 361, 122932. [Google Scholar] [CrossRef]
- Núñez Valdez, M.; Spaldin, N.A. Origin and Evolution of Ferroelectricity in the Layered Rare-Earth-Titanate, R2Ti2O7, Carpy-Galy Phases. Polyhedron 2019, 171, 181–192. [Google Scholar] [CrossRef]
- Herrera, G.; Jiménez-Mier, J.; Chavira, E. Layered-Structural Monoclinic–Orthorhombic Perovskite La2Ti2O7 to Orthorhombic LaTiO3 Phase Transition and Their Microstructure Characterization. Mater. Charact. 2014, 89, 13–22. [Google Scholar] [CrossRef]
- Xu, J.; Zhang, Y.; Xu, X.; Fang, X.; Xi, R.; Liu, Y.; Zheng, R.; Wang, X. Constructing La2B2O7 (B = Ti, Zr, Ce) Compounds with Three Typical Crystalline Phases for the Oxidative Coupling of Methane: The Effect of Phase Structures, Superoxide Anions, and Alkalinity on the Reactivity. ACS Catal. 2019, 9, 4030–4045. [Google Scholar] [CrossRef]
- Leroy, S.; Blach, J.-F.; Kopia, A.; Lech, S.; Cieniek, Ł.; Kania, N.; Saitzek, S. Enhancement of Photocatalytic Properties of Nanosized La2Ti2O7 Synthesized by Glycine-Assisted Sol-Gel Route. J. Photochem. Photobiol. A Chem. 2022, 426, 113739. [Google Scholar] [CrossRef]
- Leroy, S.; Blach, J.-F.; Huvé, M.; Léger, B.; Kania, N.; Henninot, J.-F.; Ponchel, A.; Saitzek, S. Photocatalytic and Sonophotocatalytic Degradation of Rhodamine B by Nano-Sized La2Ti2O7 Oxides Synthesized with Sol-Gel Method. J. Photochem. Photobiol. A Chem. 2020, 401, 112767. [Google Scholar] [CrossRef]
- Lv, L.; Lei, L.; Chen, Q.-W.; Yin, C.-L.; Fan, H.; Zhou, J.-P. Oxygen Vacancies-Modified S-Scheme Heterojunction of Bi-Doped La2Ti2O7 and La-Doped Bi4Ti3O12 to Improve the NO Gas Removal Avoiding NO2 Product. Appl. Catal. B 2024, 343, 123464. [Google Scholar] [CrossRef]
- Wang, Z.; Teramura, K.; Hosokawa, S.; Tanaka, T. Photocatalytic Conversion of CO2 in Water over Ag-Modified La2Ti2O7. Appl. Catal. B 2015, 163, 241–247. [Google Scholar] [CrossRef]
- Tan, Y.; Li, Z.; Tian, Y.; Hu, S.; Jia, L.; Chi, B.; Pu, J.; Li, J. Charge-Compensated (Nb, Fe)-Codoped La2Ti2O7 Photocatalyst for Photocatalytic H2 Production and Optical Absorption. J. Alloys Compd. 2017, 709, 277–284. [Google Scholar] [CrossRef]
- Szczepanski, F.; Bayart, A.; Katelnikovas, A.; Blach, J.-F.; Rousseau, J.; Saitzek, S. Luminescence and Up-Conversion Properties in La2Ti2O7:Eu3+,Er3+ Oxides under UV and NIR Radiations towards a Two-Color Sensor. J. Alloys Compd. 2020, 826, 154157. [Google Scholar] [CrossRef]
- Onozuka, K.; Kawakami, Y.; Imai, H.; Yokoi, T.; Tatsumi, T.; Kondo, J.N. Perovskite-Type La2Ti2O7 Mesoporous Photocatalyst. J. Solid State Chem. 2012, 192, 87–92. [Google Scholar] [CrossRef]
- Lv, L.; Yang, H.-D.; Fan, H.; Yang, L.; Chen, Q.-W.; Zhou, J.-P. La2Ti2O7 Nanosheets Synthesized under Magnetic Field for Ofloxacin Ferrophotocatalytic Degradation. J. Environ. Chem. Eng. 2022, 10, 108088. [Google Scholar] [CrossRef]
- Hou, W.-M.; Ku, Y. Synthesis and Characterization of La2Ti2O7 Employed for Photocatalytic Degradation of Reactive Red 22 Dyestuff in Aqueous Solution. J. Alloys Compd. 2011, 509, 5913–5918. [Google Scholar] [CrossRef]
- Raciulete, M.; Anastasescu, C.; Papa, F.; Atkinson, I.; Bradu, C.; Negrila, C.; Eftemie, D.-I.; Culita, D.C.; Miyazaki, A.; Bratan, V.; et al. Band-Gap Engineering of Layered Perovskites by Cu Spacer Insertion as Photocatalysts for Depollution Reaction. Catalysts 2022, 12, 1529. [Google Scholar] [CrossRef]
- Temerov, F.; Baghdadi, Y.; Rattner, E.; Eslava, S. A Review on Halide Perovskite-Based Photocatalysts: Key Factors and Challenges. ACS Appl. Energy Mater. 2022, 5, 14605–14637. [Google Scholar] [CrossRef]
- Huang, H.; Pradhan, B.; Hofkens, J.; Roeffaers, M.B.J.; Steele, J.A. Solar-Driven Metal Halide Perovskite Photocatalysis: Design, Stability, and Performance. ACS Energy Lett. 2020, 5, 1107–1123. [Google Scholar] [CrossRef]
- Li, M.-J.; Hsu, T.-H.; Huang, C.-L. Electrical Characterization of Sol-Gel La2Ti2O7 Films for Resistive Random Access Memory Applications. Mater. Sci. Semicond. Process 2023, 158, 107370. [Google Scholar] [CrossRef]
- Qiao, B.; Jiang, Y.; Yao, T.; Tao, A.; Yan, X.; Gao, C.; Li, X.; Ohta, H.; Chen, C.; Ma, X.-L.; et al. Microstructure and Electrical Properties of La2Ti2O7 Thin Films on SrTiO3 Substrates. Appl. Surf. Sci. 2022, 587, 151599. [Google Scholar] [CrossRef]
- Li, J.; Zhao, Y.; Xia, M.; An, H.; Bai, H.; Wei, J.; Yang, B.; Yang, G. Highly Efficient Charge Transfer at 2D/2D Layered P-La2Ti2O7/Bi2WO6 Contact Heterojunctions for Upgraded Visible-Light-Driven Photocatalysis. Appl. Catal. B 2020, 261, 118244. [Google Scholar] [CrossRef]
- Cai, X.; Mao, L.; Fujitsuka, M.; Majima, T.; Kasani, S.; Wu, N.; Zhang, J. Effects of Bi-Dopant and Co-Catalysts upon Hole Surface Trapping on La2Ti2O7 Nanosheet Photocatalysts in Overall Solar Water Splitting. Nano Res. 2022, 15, 438–445. [Google Scholar] [CrossRef]
- Gomez-Romero, P.; Pokhriyal, A.; Rueda-García, D.; Bengoa, L.N.; González-Gil, R.M. Hybrid Materials: A Metareview. Chem. Mater. 2024, 36, 8–27. [Google Scholar] [CrossRef]
- Yang, S.; Qu, H.; Zhou, X. Designing Visible-Light-Responsive La2Ti2O7 Photocatalysts by Surface Co-Doping of Nonmetal and Metal Combinations. New J. Chem. 2023, 47, 22469–22480. [Google Scholar] [CrossRef]
- Marcela Prieto-Zuleta, L.; Giovanny Villabona-Leal, E.; Joazet Ojeda-Galván, H.; Bao, Y.; Ocampo-Pérez, R.; Oros Ruíz, S.; Song, S.; Gabriel Rodríguez, Á.; Ricardo Navarro-Contreras, H.; Quintana, M. Enhanced Photocatalytic Activity of 0D/2D/2D MNPs@La2Ti2O7@BiOBr (M = Ag, Au) Heterojunction in the Degradation of Organic Contaminants and the Production of Hydrogen by Simulated Solar Irradiation. Appl. Surf. Sci. 2025, 684, 161894. [Google Scholar] [CrossRef]
- Bai, L.; Cai, Z.; Xu, Q. A Plasmonic Photocatalyst of Ag@AgBr/La2Ti2O7 with Enhanced Photocatalytic Activity under Visible Light Irradiation. Appl. Phys. A 2021, 127, 595. [Google Scholar] [CrossRef]
- Wang, Y.; Hu, J.; Zhai, C.; Gao, H.; Liu, Z.-Q.; Du, Y.; Zhu, M. CdS Quantum Dots Sensitized 2D La2Ti2O7 Nanosheets as Support for Visible Light-Assisted Electrocatalytic Methanol Oxidation in Alkaline Medium. Energy Technol. 2019, 7, 1800539. [Google Scholar] [CrossRef]
- Goncearenco, E.; Morjan, I.P.; Dutu, E.; Scarisoreanu, M.; Fleaca, C.; Gavrila-Florescu, L.; Dumitrache, F.; Banici, A.M.; Teodorescu, V.S.; Anastasescu, C.; et al. The Effect of Noble Metal Addition on the Properties of Oxide Semiconductors Nanoparticles. J. Solid. State Chem. 2022, 307, 122817. [Google Scholar] [CrossRef]
- Hsieh, H.-C.; Chen, R.-C.; Huang, Y.-K.; Sheu, H.-S.; Chuang, Y.-C.; Wang, C.-W.; Lee, C.-S. Enhancing Catalytic Performance in Oxidative Steam Reforming of Ethanol: The Role of Ruthenium Ion Substitution in Layered Perovskite La2Ti2–xRuxO7±δ Catalysts. J. Phys. Chem. C 2024, 128, 19570–19585. [Google Scholar] [CrossRef]
- Goncearenco, E.; Morjan, I.P.; Fleaca, C.T.; Dumitrache, F.; Dutu, E.; Scarisoreanu, M.; Teodorescu, V.S.; Sandulescu, A.; Anastasescu, C.; Balint, I. Titania Nanoparticles for Photocatalytic Degradation of Ethanol under Simulated Solar Light. Beilstein J. Nanotechnol. 2023, 14, 616–630. [Google Scholar] [CrossRef]
- Sandulescu, A.; Anastasescu, C.; Papa, F.; Raciulete, M.; Vasile, A.; Spataru, T.; Scarisoreanu, M.; Fleaca, C.; Mihailescu, C.N.; Teodorescu, V.S.; et al. Advancements on Basic Working Principles of Photo-Driven Oxidative Degradation of Organic Substrates over Pristine and Noble Metal-Modified TiO2. Model Case of Phenol Photo Oxidation. Catalysts 2021, 11, 487. [Google Scholar] [CrossRef]
- Dong, Y.; Li, G.; Xu, D.; Wang, Q.; Yang, T.; Pang, S.; Zhang, G.; Lv, L.; Xia, Y.; Ren, Z.; et al. A Novel Hierarchical Heterostructure of Hollow La2Ti2O7/In2O3 with Strong Interface Interaction for Photocatalytic Antibiotic Degradation. Chem. Eng. J. 2022, 446, 136705. [Google Scholar] [CrossRef]
- Wang, H.; Zhang, Y.; Ma, Z.; Zhang, W. Role of PEG2000 on Sol-Gel Preparation of Porous La2Ti2O7 for Enhanced Photocatalytic Activity on Ofloxacin Degradation. Mater. Sci. Semicond. Process 2019, 91, 151–158. [Google Scholar] [CrossRef]
- Chaillot, D.; Miehé-Brendlé, J.; Bennici, S. Insights on the Influence of the Precursors on the Sol–Gel Synthesis of Hybrid Organic–Inorganic Saponite-like Materials. Comptes Rendus Chim. 2019, 22, 258–268. [Google Scholar] [CrossRef]
- Chang, C.; Rad, S.; Gan, L.; Li, Z.; Dai, J.; Shahab, A. Review of the Sol–Gel Method in Preparing Nano TiO2 for Advanced Oxidation Process. Nanotechnol. Rev. 2023, 12, 20230150. [Google Scholar] [CrossRef]
- Fuierer, P.A.; Newnham, R.E. La2Ti2O7 Ceramics. J. Am. Ceram. Soc. 1991, 74, 2876–2881. [Google Scholar] [CrossRef]
- Takahashi, J.; Ohtsuka, T. Vibrational Spectroscopic Study of Structural Evolution in the Coprecipitated Precursors to La2Sn2O7 and La2Ti2O7. J. Am. Ceram. Soc. 1989, 72, 426–431. [Google Scholar] [CrossRef]
- Suresh, M.; Prasadarao, A.V.; Komarneni, S. Mixed Hydroxide Precursors for La2Ti2O7 and Nd2Ti2O7 by Homogeneous Precipitation. J. Electroceram. 2001, 6, 147–151. [Google Scholar] [CrossRef]
- Li, K.; Wang, Y.; Wang, H.; Zhu, M.; Yan, H. Hydrothermal Synthesis and Photocatalytic Properties of Layered La2Ti2O7 Nanosheets. Nanotechnology 2006, 17, 4863–4867. [Google Scholar] [CrossRef]
- Kim, H.G.; Hwang, D.W.; Bae, S.W.; Jung, J.H.; Lee, J.S. Photocatalytic Water Splitting over La2Ti2O7 Synthesized by the Polymerizable Complex Method. Catal. Lett. 2003, 91, 193–198. [Google Scholar] [CrossRef]
- Shcherbakova, L.G.; Mamsurova, L.G.; Sukhanova, G.E. Lanthanide Titanates. Russ. Chem. Rev. 1979, 48, 228–242. [Google Scholar] [CrossRef]
- Balachandran, U.; Eror, N.G. X-Ray Diffraction and Vibrational-Spectroscopy Study of the Structure of La2Ti2O7. J. Mater. Res. 1989, 4, 1525–1528. [Google Scholar] [CrossRef]
- Favacho, V.S.S.; Melo, D.M.A.; Costa, J.E.L.; Silva, Y.K.R.O.; Braga, R.M.; Medeiros, R.L.B.A. Perovskites Synthesized by Soft Template-Assisted Hydrothermal Method: A Bibliometric Analysis and New Insights. Int. J. Hydrogen Energy 2024, 78, 1391–1428. [Google Scholar] [CrossRef]
- Walton, R.I. Perovskite Oxides Prepared by Hydrothermal and Solvothermal Synthesis: A Review of Crystallisation, Chemistry, and Compositions. Chem. Eur. J. 2020, 26, 9041–9069. [Google Scholar] [CrossRef] [PubMed]
- Hu, L.; Wang, J.; Li, W.; Long, Y. Microwave-Assisted Homogeneous Precipitation Route for the Synthesis of La2Ti2O7:Tb3+ Nanophosphors. Mater. Lett. 2023, 350, 134984. [Google Scholar] [CrossRef]
- Lu, X.; Tang, P.; Zhang, J.; Xu, H.; Wen, S.; Lou, Y.; Liu, Y.; Chen, H. Preparation of La2Ti2O7 by Sol-Gel Method and Its Photocatalytic Activity. Integr. Ferroelectr. 2023, 234, 108–114. [Google Scholar] [CrossRef]
- Navas, D.; Fuentes, S.; Castro-Alvarez, A.; Chavez-Angel, E. Review on Sol-Gel Synthesis of Perovskite and Oxide Nanomaterials. Gels 2021, 7, 275. [Google Scholar] [CrossRef] [PubMed]
- Choukchou Braham, Z.; Kermad, A.; El Korso, S.; Ramdani, M.R.; Boudjemaa, A.; Bachari, K.; Choukchou Braham, A. Enhancing Structural Properties of Simple Perovskite Materials Based on Zirconate and Titanate Prepared by Sol-Gel Method. Mater. Chem. Phys. 2023, 310, 128460. [Google Scholar] [CrossRef]
- Bokov, D.; Turki Jalil, A.; Chupradit, S.; Suksatan, W.; Javed Ansari, M.; Shewael, I.H.; Valiev, G.H.; Kianfar, E. Nanomaterial by Sol-Gel Method: Synthesis and Application. Adv. Mater. Sci. Eng. 2021, 2021, 102014. [Google Scholar] [CrossRef]
- Parashar, M.; Shukla, V.K.; Singh, R. Metal Oxides Nanoparticles via Sol–Gel Method: A Review on Synthesis, Characterization and Applications. J. Mater. Sci. Mater. Electron. 2020, 31, 3729–3749. [Google Scholar] [CrossRef]
- Esposito, S. “Traditional” Sol-Gel Chemistry as a Powerful Tool for the Preparation of Supported Metal and Metal Oxide Catalysts. Materials 2019, 12, 668. [Google Scholar] [CrossRef]
- Brinker, J.C.; Scherer, G.W. Sol-Gel Science; Academic Press: Cambridge, MA, USA, 1990; ISBN 9780080571034. [Google Scholar]
- Dantelle, G.; Beauquis, S.; Le Dantec, R.; Monnier, V.; Galez, C.; Mugnier, Y. Solution-Based Synthesis Routes for the Preparation of Noncentrosymmetric 0-D Oxide Nanocrystals with Perovskite and Nonperovskite Structures. Small 2022, 18, 2200992. [Google Scholar] [CrossRef]
- Danks, A.E.; Hall, S.R.; Schnepp, Z. The Evolution of ‘Sol–Gel’ Chemistry as a Technique for Materials Synthesis. Mater. Horiz. 2016, 3, 91–112. [Google Scholar] [CrossRef]
- Anastasescu, C.; Negrila, C.; Angelescu, D.G.; Atkinson, I.; Anastasescu, M.; Spataru, N.; Zaharescu, M.; Balint, I. Particularities of Photocatalysis and Formation of Reactive Oxygen Species on Insulators and Semiconductors: Cases of SiO2, TiO2 and Their Composite SiO2–TiO2. Catal. Sci. Technol. 2018, 8, 5657–5668. [Google Scholar] [CrossRef]
- Preda, S.; Anastasescu, C.; Balint, I.; Umek, P.; Sluban, M.; Negrila, C.C.; Angelescu, D.G.; Bratan, V.; Rusu, A.; Zaharescu, M. Charge Separation and ROS Generation on Tubular Sodium Titanates Exposed to Simulated Solar Light. Appl. Surf. Sci. 2019, 470, 1053–1063. [Google Scholar] [CrossRef]
- Swami, R.; Bokolia, R.; Sreenivas, K. Effects of Sintering Temperature on Structural, Electrical and Ferroelectric Properties of La2Ti2O7 Ceramics. Ceram. Int. 2020, 46, 26790–26799. [Google Scholar] [CrossRef]
- Abe, Y.; Laine, R.M. Photocatalytic Plate-like La2Ti2O7 Nanoparticles Synthesized via Liquid-feed Flame Spray Pyrolysis (LF-FSP) of Metallo-organic Precursors. J. Am. Ceram. Soc. 2020, 103, 4832–4839. [Google Scholar] [CrossRef]
- Zhang, S.; Xu, J.; Lu, C.; Ouyang, R.; Ma, J.; Zhong, X.; Fang, X.; Xu, X.; Wang, X. Preparation Method Investigation and Structure Identification by XRD and Raman Techniques for A2B2O7 Composite Oxides. J. Am. Ceram. Soc. 2024, 107, 3475–3496. [Google Scholar] [CrossRef]
- Chen, C.; Gao, Z.; Yan, H.; Reece, M.J. Crystallographic Structure and Ferroelectricity of (AxLa1−x)2Ti2O7(A = Sm and Eu) Solid Solutions with High TC. J. Am. Ceram. Soc. 2016, 99, 523–530. [Google Scholar] [CrossRef]
- Ocal, C.; Ferrer, S. Low Temperature Diffusion of Pt and Au Atoms through Thin TiO2 Films on a Ti Substrate. Surf. Sci. 1987, 191, 147–156. [Google Scholar] [CrossRef]
- Sunding, M.F.; Hadidi, K.; Diplas, S.; Løvvik, O.M.; Norby, T.E.; Gunnæs, A.E. XPS Characterisation of in Situ Treated Lanthanum Oxide and Hydroxide Using Tailored Charge Referencing and Peak Fitting Procedures. J. Electron. Spectros Relat. Phenom. 2011, 184, 399–409. [Google Scholar] [CrossRef]
- Teodorescu, C.M.; Esteva, J.M.; Karnatak, R.C.; El Afif, A. An Approximation of the Voigt I Profile for the Fitting of Experimental X-Ray Absorption Data. Nucl. Instrum. Methods Phys. Res. A 1994, 345, 141–147. [Google Scholar] [CrossRef]
- Thommes, M.; Kaneko, K.; Neimark, A.V.; Olivier, J.P.; Rodriguez-Reinoso, F.; Rouquerol, J.; Sing, K.S.W. Physisorption of Gases, with Special Reference to the Evaluation of Surface Area and Pore Size Distribution (IUPAC Technical Report). Pure Appl. Chem. 2015, 87, 1051–1069. [Google Scholar] [CrossRef]
- Alshehri, A.; Narasimharao, K. PtOx-TiO2 Anatase Nanomaterials for Photocatalytic Reformation of Methanol to Hydrogen: Effect of TiO2 Morphology. J. Mater. Res. Technol. 2020, 9, 14907–14921. [Google Scholar] [CrossRef]
- Vasile, A.; Papa, F.; Bratan, V.; Munteanu, C.; Teodorescu, M.; Atkinson, I.; Anastasescu, M.; Kawamoto, D.; Negrila, C.; Ene, C.D.; et al. Water Denitration over Titania-Supported Pt and Cu by Combined Photocatalytic and Catalytic Processes: Implications for Hydrogen Generation Properties in a Photocatalytic System. J. Environ. Chem. Eng. 2022, 10, 107129. [Google Scholar] [CrossRef]
- Ma, Z.; Li, Y.; Lv, Y.; Sa, R.; Li, Q.; Wu, K. Synergistic Effect of Doping and Compositing on Photocatalytic Efficiency: A Case Study of La2Ti2O7. ACS Appl. Mater. Interfaces 2018, 10, 39327–39335. [Google Scholar] [CrossRef]
- Li, X.; Xie, J.; Jiang, C.; Yu, J.; Zhang, P. Review on Design and Evaluation of Environmental Photocatalysts. Front. Environ. Sci. Eng. 2018, 12, 14. [Google Scholar] [CrossRef]
- Chen, L.; Tang, J.; Song, L.-N.; Chen, P.; He, J.; Au, C.-T.; Yin, S.-F. Heterogeneous Photocatalysis for Selective Oxidation of Alcohols and Hydrocarbons. Appl. Catal. B 2019, 242, 379–388. [Google Scholar] [CrossRef]
- Bellardita, M.; Loddo, V.; Augugliaro, V.; Palmisano, L.; Yurdakal, S. Selective Photocatalytic and Photoelectrocatalytic Synthesis of Valuable Compounds in Aqueous Medium. Catal. Today 2024, 432, 114587. [Google Scholar] [CrossRef]
- Pavel, M.; Anastasescu, C.; State, R.-N.; Vasile, A.; Papa, F.; Balint, I. Photocatalytic Degradation of Organic and Inorganic Pollutants to Harmless End Products: Assessment of Practical Application Potential for Water and Air Cleaning. Catalysts 2023, 13, 380. [Google Scholar] [CrossRef]
- Xiong, L.; Tang, J. Strategies and Challenges on Selectivity of Photocatalytic Oxidation of Organic Substances. Adv. Energy Mater. 2021, 11, 2003216. [Google Scholar] [CrossRef]
- Lai, Y.; Zeng, Y.; Chen, X.; Wang, T.; Yang, X.; Guo, Q. Photochemistry of Ethanol on Rutile TiO2 (110): Breaking Two Bonds with One Hole. J. Phys. Chem. C 2023, 127, 1863–1869. [Google Scholar] [CrossRef]
- Li, X.; Chen, Y.; Tao, Y.; Shen, L.; Xu, Z.; Bian, Z.; Li, H. Challenges of Photocatalysis and Their Coping Strategies. Chem. Catal. 2022, 2, 1315–1345. [Google Scholar] [CrossRef]
- Guo, Q.; Zhou, C.; Ma, Z.; Yang, X. Fundamentals of TiO2 Photocatalysis: Concepts, Mechanisms, and Challenges. Adv. Mater. 2019, 31, 1901997. [Google Scholar] [CrossRef]
- Mandal, A.; Kargupta, K. Cu-Doped 2D-Bi2MoO6 Nanoribbon/RGO Photocatalysts for Selective Ethanol Production by Photocatalytic CO2 Reduction. ACS Appl. Nano Mater. 2025, 8, 3471–3486. [Google Scholar] [CrossRef]
- Cai, X.; Zhu, M.; Elbanna, O.A.; Fujitsuka, M.; Kim, S.; Mao, L.; Zhang, J.; Majima, T. Au Nanorod Photosensitized La2Ti2O7 Nanosteps: Successive Surface Heterojunctions Boosting Visible to Near-Infrared Photocatalytic H2 Evolution. ACS Catal. 2018, 8, 122–131. [Google Scholar] [CrossRef]
- Al-Madanat, O.; Curti, M.; Günnemann, C.; AlSalka, Y.; Dillert, R.; Bahnemann, D.W. TiO2 Photocatalysis: Impact of the Platinum Loading Method on Reductive and Oxidative Half-Reactions. Catal. Today 2021, 380, 3–15. [Google Scholar] [CrossRef]
- Lee, S.-K.; Mills, A. Platinum and Palladium in Semiconductor Photocatalytic Systems. Platin. Met. Rev. 2003, 47, 61–72. [Google Scholar] [CrossRef]
- Mamaghani, A.H.; Haghighat, F.; Lee, C.-S. Photocatalytic Oxidation Technology for Indoor Environment Air Purification: The State-of-the-Art. Appl. Catal. B 2017, 203, 247–269. [Google Scholar] [CrossRef]
- Shiraishi, Y.; Shiota, S.; Hirakawa, H.; Tanaka, S.; Ichikawa, S.; Hirai, T. Titanium Dioxide/Reduced Graphene Oxide Hybrid Photocatalysts for Efficient and Selective Partial Oxidation of Cyclohexane. ACS Catal. 2017, 7, 293–300. [Google Scholar] [CrossRef]
- Katsiev, K.; Harrison, G.; Alghamdi, H.; Alsalik, Y.; Wilson, A.; Thornton, G.; Idriss, H. Mechanism of Ethanol Photooxidation on Single-Crystal Anatase TiO2 (101). J. Phys. Chem. C 2017, 121, 2940–2950. [Google Scholar] [CrossRef]
- Kumar, A.; Mondal, K.; Rajakumar, B. A Combined Experimental and Theoretical Study to Determine the Kinetics of 2-Ethoxy Ethanol with OH Radical in the Gas Phase. J. Phys. Chem. A 2021, 125, 8869–8881. [Google Scholar] [CrossRef]
- Vorontsov, A.; Dubovitskaya, V.P. Selectivity of Photocatalytic Oxidation of Gaseous Ethanol over Pure and Modified TiO2. J. Catal. 2004, 221, 102–109. [Google Scholar] [CrossRef]
- Trogadas, P.; Coppens, M.-O. Nature-Inspired Electrocatalysts and Devices for Energy Conversion. Chem. Soc. Rev. 2020, 49, 3107–3141. [Google Scholar] [CrossRef] [PubMed]
- Wang, Z.; Yu, H.; Liu, Z. Oxygen Vacancies Defective La2Ti2O7 Nanosheets Enhanced Photocatalytic Activity of Hydrogen Evolution under Visible Light Irradiation. Molecules 2023, 28, 5792. [Google Scholar] [CrossRef]
- Fernández, L.; Bustos, F.; Correa, D.; Seguel, M.; Suarez, C.; Caro, C.; Leyton, P.; Cabello-Guzmán, G. A Photochemical Route in the Synthesis and Characterization of La2Ti2O7 and La2Ti2O7/AgO Films and Its Evaluation in Congo Red Degradation and as Antibacterial Control to Staphylococcus Aureus. Environ. Sci. Pollut. Res. 2023, 30, 107580–107597. [Google Scholar] [CrossRef]


| Wavenumbers (cm−1) | Assignments and Vibration Mode | |
|---|---|---|
| LTA | LTA-Pt | |
| 806 | 806 | Ti–O–Ti bridges in TiO6 octahedra from titanate |
| 776 | 772 | Ti–O stretching in TiO6 octahedra from titanate |
| 620 | 621 | La–O stretching and Ti–O vibrations |
| 547 | 549 | La–O stretching and Ti–O vibrations |
| 491 | 490 | La–O stretching vibrations and Ti–O–Ti bridges in TiO6 octahedra |
| 464 | 464 | La–O stretching vibrations and Ti–O bending modes |
| No. | Synthesized Samples | Literature for La–O and Ti–O Bonds [64,66] | Assignment to Raman Vibrations | |
|---|---|---|---|---|
| LTA-Pt | LTA | |||
| 1 | 109 | 111 | 112 | La–O stretching vibration |
| 2 | 129 | 131 | 131 | Ti–O bond stretching vibration for the six-fold coordinated Ti in rutile TiO2 (B1g mode) |
| 3 | 153 | 154 | 151 | La–O stretching vibration |
| 4 | 179 | 181 | 180 | La–O stretching vibration |
| 5 | 213 | 213 | 214 | La–O stretching vibration |
| 6 | 228 | 227 | 227 | La–O stretching vibration |
| 7 | 237 | 240 | 238 | La–O stretching vibration |
| 8 | 260 | 262 | 261 | La–O stretching vibration |
| 9 | 275 | 274 | 275 | La–O stretching vibration |
| 10 | 284 | 285 | 284 | La–O stretching vibration |
| 11 | 317 | 316 | 317 | La–O stretching vibration |
| 12 | 337 | 342 | 336 | La–O stretching vibration |
| 13 | 348 | 352 | 350 | La–O stretching vibration |
| 14 | 367 | 367 | 367 | La–O stretching vibration |
| 15 | 401 | 402 | 400 | La–O stretching vibration |
| 16 | 424 | 426 | 425 | La–O stretching vibration |
| 17 | 445 | 446 | 446 | Stretching vibrations of Ti–O–Ti octahedra (Eg mode) |
| 18 | - | 488 | - | - |
| 19 | 517 | 517 | 517 | - |
| 20 | 536 | 538 | 533 | - |
| 21 | 555 | 557 | 556 | La–O stretching vibration |
| 22 | 605 | 605 | 606 | Stretching vibrations of Ti–O–Ti octahedra (A1g mode) |
| 23 | - | 668 | - | - |
| 24 | 794 | 792 | 790 | Stretching vibrations of Ti–O–Ti octahedra |
| 25 | 809 | 808 | 808 | Ti–O bond stretching vibration for the six-fold coordinated Ti in rutile TiO2 (B2g mode) |
| Sample | Element Type | Element Component | Relative Intensity | Binding Energy | Attribution | Atomic Percentage |
|---|---|---|---|---|---|---|
| (%) | (eV) | (%) | ||||
| LTA | C 1s | 1 | 62.2 | 284.6 | C–C | 7.2 |
| 2 | 29.5 | 286.27 | C=O | |||
| 3 | 8.3 | 289.07 | O–C=O, La carbonates | |||
| O 1s | 1 | 45.8 | 529.34 | TiO2 (surf.)/La–O–Ti | 53.8 | |
| 2 | 26.7 | 530.72 | TiOx,TiO2 bulk/TiO2 | |||
| 3 | 23.3 | 531.94 | C=O, OH | |||
| 4 | 4.2 | 533.48 | C-O | |||
| La 3d | 1 | 2.4 | 833.82 | La3+ multiplet peak 1 | 25.0 | |
| 2 | 49.9 | 836.46 | antibonding | |||
| 3 | 25.2 | 840.44 | La3+ multiplet peak 2 | |||
| 4 | 22.5 | 847.5 | satellite | |||
| Ti 2p | 1 | 66.3 | 458.06 | TiO2 (surf.)/La–O–Ti | 14.0 | |
| 2 | 33.7 | 459.99 | TiOx, TiO2-bulk/TiO2 | |||
| LTA-Pt | C 1s | 1 | 76.2 | 284.6 | C–C | 9.6 |
| 2 | 17.4 | 285.84 | C–O | |||
| 3 | 6.4 | 288.34 | O–C=O, La carbonates | |||
| O 1s | 1 | 67.6 | 529.95 | TiO2/La–O–Ti | 67 | |
| 2 | 27.3 | 531.73 | C=O, OH | |||
| 3 | 5.1 | 532.8 | C–O, Pt oxide | |||
| La 3d | 1 | 31.1 | 833.78 | La3+ multiplet peak 1 | 12.4 | |
| 2 | 20.2 | 835.48 | antibonding | |||
| 3 | 34.8 | 838.31 | La3+ multiplet peak 1 | |||
| 4 | 13.9 | 847.90 | satellite | |||
| Ti 2p | 1 | 458.32 | TiO2/La–O–Ti | 9.8 | ||
| Pt 4f | 1 | 77.4 | 70.36 | Pt | 1.2 | |
| 2 | 22.6 | 71.55 | PtO |
| LTA | LTA-Pt | ||||
|---|---|---|---|---|---|
| Element | Weight (%) | Atomic (%) | Element | Weight (%) | Atomic (%) |
| OK | 13.24 | 46.65 | OK | 14.29 | 50.24 |
| TiK | 23.51 | 27.68 | TiK | 19.80 | 23.27 |
| LaL | 63.24 | 25.67 | LaL | 64.07 | 25.96 |
| PtL | 1.84 | 0.53 | |||
| Sample | Crystalline Phase | Lattice Parameters (Å) | Crystallite Size (nm) | ||
|---|---|---|---|---|---|
| a | b | c | |||
| LTA | La2Ti2O7 | 7.816 | 13.022 | 5.539 | 14 |
| LTA-Pt | La2Ti2O7 | 7.829 | 13.034 | 5.553 | 15 |
| Sample | Composition | Values (Mass %) | Line |
|---|---|---|---|
| LTA-Pt | Ti | 26.46 | Ti-Kα |
| La | 72.50 | La-Lα | |
| Pt | 1.03 | Pt-Lα |
| Sample | SBET (m2/g) | Vtotal (cm3/g) | dBJH (nm) |
|---|---|---|---|
| LTA | 10.1 | 0.106 | 29.6 |
| LTA-Pt | 8.8 | 0.087 | 30.2 |
| Catalyst | CIN (μmoles) | COUT (μmoles) | Conversion of CH3CH2OH (%) | |||
|---|---|---|---|---|---|---|
| Ethanol (CH3CH2OH) | Ethanol (CH3CH2OH) | Acetaldehyde (CH3CHO) | Formic Acid (HCOOH) | Carbon Dioxide (CO2) | ||
| LTA | 243.15 | 208.39 | 11.18 | 0.29 | 5.13 | 14.29 |
| LTA-Pt | 243.45 | 171.02 | 36.47 | 1.06 | 13.67 | 29.75 |
Disclaimer/Publisher’s Note: The statements, opinions and data contained in all publications are solely those of the individual author(s) and contributor(s) and not of MDPI and/or the editor(s). MDPI and/or the editor(s) disclaim responsibility for any injury to people or property resulting from any ideas, methods, instructions or products referred to in the content. |
© 2025 by the authors. Licensee MDPI, Basel, Switzerland. This article is an open access article distributed under the terms and conditions of the Creative Commons Attribution (CC BY) license (https://creativecommons.org/licenses/by/4.0/).
Share and Cite
Ilie, A.; Predoană, L.; Anastasescu, C.; Preda, S.; Hosu, I.S.; Costescu, R.M.; Culiță, D.C.; Brătan, V.; Balint, I.; Zaharescu, M. Layered Perovskite La2Ti2O7 Obtained by Sol–Gel Method with Photocatalytic Activity. Appl. Sci. 2025, 15, 7665. https://doi.org/10.3390/app15147665
Ilie A, Predoană L, Anastasescu C, Preda S, Hosu IS, Costescu RM, Culiță DC, Brătan V, Balint I, Zaharescu M. Layered Perovskite La2Ti2O7 Obtained by Sol–Gel Method with Photocatalytic Activity. Applied Sciences. 2025; 15(14):7665. https://doi.org/10.3390/app15147665
Chicago/Turabian StyleIlie, Alexandra, Luminița Predoană, Crina Anastasescu, Silviu Preda, Ioana Silvia Hosu, Ruxandra M. Costescu, Daniela C. Culiță, Veronica Brătan, Ioan Balint, and Maria Zaharescu. 2025. "Layered Perovskite La2Ti2O7 Obtained by Sol–Gel Method with Photocatalytic Activity" Applied Sciences 15, no. 14: 7665. https://doi.org/10.3390/app15147665
APA StyleIlie, A., Predoană, L., Anastasescu, C., Preda, S., Hosu, I. S., Costescu, R. M., Culiță, D. C., Brătan, V., Balint, I., & Zaharescu, M. (2025). Layered Perovskite La2Ti2O7 Obtained by Sol–Gel Method with Photocatalytic Activity. Applied Sciences, 15(14), 7665. https://doi.org/10.3390/app15147665