Abstract
In recent years, C-ITS services have been extensively specified, tested, and deployed, leading to their first commercial applications. While technical advancements are progressing, the human factor remains crucial for widespread system implementation. The paper presents results of two field studies on user acceptance evaluations focusing on six use cases. Eighteen drivers participated in highway tests, while over 70 individuals responded to an online survey. The empirical results are discussed considering related literature. A structured literature review was conducted, starting with 426 papers, of which 32 were deeply analysed. The key findings of the activities are that the compliance rate is extremely high for safety-related services like hazard warning. However, compliance rates differ depending on the use case. People trust information coming from road operators compared to other sources of traffic information. In-vehicle information does not distract drivers from driving and must be clear and easy to understand. While user acceptance is high, particularly for safety-related services, there remains a need for clearer communication about C-ITS benefits to enhance transparency and trust.
1. Introduction
Over the past 15 years, C-ITS (Cooperative Intelligent Transport Systems) services have undergone extensive specification, deployment, and testing, leading to their first commercial applications and rollouts in Europe. C-ITS implies the cooperation of all connected traffic participants through data exchange. The most common cooperation types are Vehicle-to-Vehicle (V2V) and Vehicle-to-Infrastructure (V2I), and vice versa, I2V.
1.1. C-ITS Initiatives
The start of the journey in Europe for I2V and V2I communication began with the EU-funded project COOPERS [] in 2006, where the focus was on information exchange of safety-related traffic and infrastructure status between infrastructure and vehicles. The project with 38 participants from all over Europe delivered valuable specifications and tests of the system design and possible communication technologies.
Based on the results of COOPERS, but also SAFESPOT [] and CIVIS [], the need for further European-wide cooperation was obvious because the C-ITS services shall work across borders and among all traffic participants. Therefore, in 2012, the representatives of the Dutch, German, and Austrian governments signed a memorandum of understanding to work on a European C-ITS corridor from Rotterdam to Vienna. In addition, the different stakeholders recognized that a sustainable solution needs cooperation across industry sectors and public authorities, leading to the non-formal strategic alliance called the Amsterdam Group. The process of cooperation evolved, resulting in the C-Roads platform, which is a cooperation of member states and road operators [].
In parallel, the technical aspects have been considered in different projects, stakeholder groups, and standardization bodies. ECo-AT was the Austrian project of the European C-ITS corridor []. The joint project of the road operator, industry, and academia laid the foundation for solid specifications and technical tests between the members of the vehicle and traffic infrastructure sector. Scoop@F was a project in France dealing with the deployment of cooperative intelligent transport systems []. The project simTD [] was the largest test field for C-ITS in Germany, where realistic traffic scenarios were addressed. The outcome and lessons learnt from these projects and many others, like the EU-funded project InterCor [], were used as a starting point for a European harmonization of C-ITS Services in the C-Roads platform.
In the end, the technical framework and the specification of messages are mainly covered in ETSI (European Telecommunications Standards Institute) [,,]. The Car-2-Car Communication Consortium (C2C-CC) [] brings together the vehicle industry and focuses on V2X (Vehicle-to-everything) use cases. Moreover, technology-related interest groups like 5GAA [] focus on use case deployment seen from a 5G perspective. The European platform C-Roads is now responsible for harmonising the traffic infrastructure-related Use Cases and the message profiles to guarantee a cross-border and cross-vendor interoperability.
1.2. C-ITS Services and Use Cases
Numerous services and use cases have been specified across various stakeholder groups and projects in Europe. These specifications differ significantly in aspects such as application areas, naming schemes, and document structures. In the context of C-ITS, key sources of information include 5GAA, C2C-CC, C-Roads, and ETSI. Based on an analysis of these sources, services and use cases can be clustered into two broad categories:
- Cooperation mode: Sender and receiver of the messages (V2V, V2I, I2V)
- Day of deployment: Roadmap with services and use cases that are going to be deployed in subsequent phases, called Day 1, Day 2, and Day 3 [,,].
As there are no exact definitions of what service and use case are part of which deployment phase, the C2C-CC roadmap presents a useful example of a description of the phases.
- Day 1 summarizes services relating to “awareness driving,” including basic in-vehicle warning applications or traffic information (e.g., road works).
- Day 2 comprises services referring to “sensing driving,” including vulnerable road user protection or semi-automated driving functions (e.g., emergency brake assistant).
- Day 3 concentrates on “cooperative driving,” including cooperative automated driving functions (e.g., cooperative lane merging).
The services and use cases presented in Table 1 are always realized by a communication link among ITS stations as specified in the ITS-Station architecture of ETSI []. The messages used for information exchange in the Day 1 services are listed in the C-Roads document [].

Table 1.
Examples of C-ITS services and use cases.
1.3. C-ITS Roll-Out
Extensive research, testing, and harmonizing of specifications led to the conviction that the time has come to deploy and commercialize C-ITS services both on the vehicle and on the traffic infrastructure side on a European level. The starting point is the Day 1 services and use cases mentioned in Table 1. The focus is on raising the awareness of the drivers by connected in-vehicle driver warnings.
The roll-out of C-ITS equipment started on stretches of motorways with high traffic volumes and at intersections in urban areas. Kotsi et. al. [] listed numerous projects on the European level, funded by different European initiatives such as Connecting Europe Facility (CEF), Horizon 2020, or ICT Policy Support Programme. The projects not only focused on pure large-scale hardware deployment, but also on designing and harmonising the policy framework across Europe. Degrande et al. covered another important aspect of the roll-out: cost efficiency []. They provided guidelines for road authorities on how to determine the investment and operational cost of the C-ITS infrastructure or how to use the legacy ITS infrastructure efficiently. C-Roads as a funded project in the CEF program supports national authorities in financing the roll-out of C-ITS.
C-Roads provides a well-structured overview of the last 8 years of the main achievements in the deployment of C-ITS infrastructure in Europe []. More than 2700 Road-Side-Units (RSU) are installed and operational in 18 core and 8 associated member states. More than 2200 On-Board units (OBU) are installed in public transport vehicles in 54 cities across Europe.
The Austrian motorway operator ASFINAG deploys a C-ITS system consisting of Road-Side-Units (RSU) as well as a C-ITS central system that receives and generates C-ITS messages from and to the vehicles. In Germany, the motorway operator Die Autobahn GmbH des Bundes deploys a C-ITS system including RSUs on warning trailers and a C-ITS central system. In addition, the Czech Republic deployed RSUs along 360km of its motorways.
As a next step, cities have started to deploy C-ITS infrastructure. The Scandinavian countries Denmark, Norway, Sweden, and Finland have joined forces in the NordicWay3 project. In Tampere, Finland, traffic light controllers are connected to the C-ITS backbone and send traffic light status messages to vehicles. The same approach is being taken in Trento in Italy, where 13 intersections have been equipped with C-ITS infrastructure. In Bordeaux, France, the focus is on the protection and guidance of vulnerable road users (VRU).
Finally, Table 2 provides an overview of the services and use cases rolled out first in Europe and supported by private or public transport vehicles.
Table 2.
First candidates of services and use cases for the roll-out.
1.4. C-ITS Impact Areas
C-ITS development and deployment projects require a methodology to assess the impact of technology use and related benefits. Consequently, the FESTA handbook [] was written, where impact assessment is an integral part. The methodology is used in C-ROADS [] to evaluate the impact of C-ITS seen from a traffic infrastructure perspective. It specifies the following impact areas.
- Functional evaluation: Validation of the real-world performance of the services and use cases in the vehicle (examples can be found in Table 1)
- Safety: Validation of the safety improvements (e.g., reduced number of near-collision events)
- Traffic efficiency: Validation of the traffic efficiency (e.g., reduction of lost time on a stretch of a road)
- Environment: Validation of the environmental situation (e.g., reduction of fuel consumption)
- Socio-economic: Validation of the cost-benefit ratio of the deployed services and use cases.
- Use acceptance: According to the FESTA handbook, user acceptance is defined as the degree of approval of a technology by the users.
To get as much positive impact as possible, the C-ITS services must be accepted by the users. The drivers of the vehicles on the road must trust and comply with the in-vehicle information provided by the road operator.
1.5. C-ITS Field Studies
The paper includes results of two field-level studies evaluating driver acceptance of in-vehicle information provided by C-ITS services.
The EU H2020 project ESRIUM was a joint multinational effort to improve the safety and resource efficiency of road transport. The goal of the project was an accurate digital map of road surface damage and road wear, which enables stakeholders to proactively take resource-saving measures. Thus, routing recommendations in terms of lane changes or lane offsets can both reduce road wear and increase traffic safety. At the same time, preventive measures of this kind can avoid or delay any road maintenance measures, and artificial intelligence can be used to identify potential road damage at an early stage. In ESRIUM, the user acceptance of C-ITS services regarding lane change and lane offset recommendations was investigated in a field study with ten truck drivers.
The impact assessment study, funded by the Austrian motorway operator ASFINAG, aimed to evaluate the effects of Day 1 C-ITS services deployed on the Austrian motorway network. Specifically, the study examined their impact on traffic safety, efficiency, and environmental performance, as well as the level of driver acceptance.
1.6. Scope and Research Questions
This paper presents the results of a user acceptance evaluation of C-ITS services, conducted with a heterogeneous group of 18 drivers in Austria as part of a broader impact assessment. It also includes findings from an online questionnaire completed by 95 participants. The focus lies on I2V services (see Section 1.2), which provide drivers with information about traffic-related situations and offer driving recommendations in interurban scenarios. The evaluation was carried out using real-world test drives with interviews and an online survey. Results of the evaluation were discussed using 26 relevant papers from the literature. Psychological and cognitive science aspects, however, were beyond the scope of this paper.
The paper aims to answer the following research questions:
- What is the perceived level of usefulness of the specific C-ITS services (1) Road Works Warning, (2) Hazardous Location Notification, (3) In-Vehicle Signage, and (4) Routing recommendation?
- How do users rate the perceived ease of use of the specific C-ITS services (1) Road Works Warning, (2) Hazardous Location Notification, (3) In-Vehicle Signage, and (4) Routing recommendation?
- How do users rate the behavioural intention to use the C-ITS services (1) Road Works Warning, (2) Hazardous Location Notification, (3) In-Vehicle Signage, and (4) Routing recommendation?
- To what extent do the findings of the current field studies align with and are supported by existing C-ITS literature?
The paper is organized as follows: Section 2 provides an overview of the methodology used for both the user acceptance and the literature review. Section 3 presents the results of the two field studies, while Section 4 discusses the results and compares them with the results of the literature review. Section 5 concludes the paper and gives an outlook.
2. Methodology
The aim is to evaluate the acceptance of C-ITS services by drivers. Therefore, two field studies were conducted (see Section 1.5), including an online questionnaire and test drives (see Section 2.1). Moreover, relevant literature was reviewed (see Section 2.2), being the foundation of a later discussion of the field study results. The focus of the user acceptance was on Infrastructure-to-Vehicle (I2V) C-ITS services. In other words, information is sent from a traffic management centre to vehicles on a motorway and displayed to the driver in the vehicle.
The following C-ITS services are covered in the paper (ref. Figure 1):
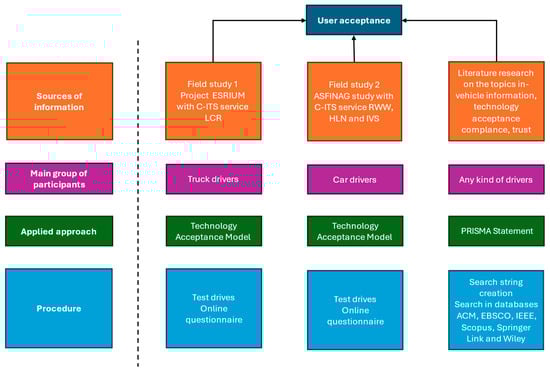
Figure 1.
Overview of the evaluation design of user acceptance.
- Road Works Warning (RWW), Lane Closure: warning information is given to the driver due to construction work. The right-most lane of a motorway is temporarily closed.
- Hazardous Location Notification (HLN), warning for hazardous situations like Emergency of Rescue/Recovery Vehicle in Intervention, and Traffic Jam Ahead warning: warning information is given to the driver due to an accident or a broken-down vehicle. The left-most lane of a motorway is closed, and there is a traffic jam.
- In-Vehicle Signage (IVS), Traffic Signage: information is given to the driver with the current speed limit on the motorway.
- Routing recommendations within and between lanes based on the road wear map (LCR): information is given to the driver to change lane or lane offset due to a pothole on the lane of the motorway.
While the C-ITS services 1–3 are specified at European level in C-Roads [] and considered as Day 1 service, the fourth service is still under development in the EU-funded project ESERCOM-D to reach a higher Technical Readiness Level (TRL) [].
Figure 1 provides a summary of the user acceptance evaluation design. The participants are car and truck drivers. Two field studies apply the Technology Acceptance Model, while the literature review follows the PRISMA statement approach. User acceptance is evaluated through test drives and an online questionnaire. For the literature review, three categories with related keywords were used to identify relevant studies in different databases. Finally, the results from the field studies and the literature review are combined to form an overall picture of user acceptance of C-ITS services.
2.1. Driver Acceptance
Both field-level studies followed the same approach and applied the ‘Technology Acceptance Model’ (TAM) [] as a theoretical basis for the driver acceptance evaluation design (see Figure 2). In the meantime, several extensions of this TAM were developed []. For the paper, the focus is on the original one because the paper wants to evaluate “perceived usefulness”, “perceived ease of use”, and “behavioural intention to use”(see Section 1.6).
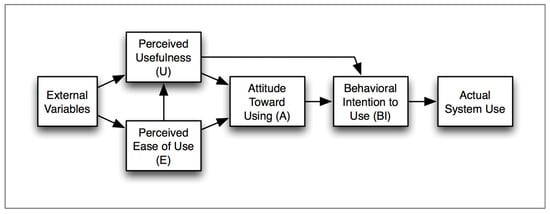
Figure 2.
Technology acceptance model.
The starting point of the model is “External Variables (EV)”, which provide some descriptive information and influence the “Perceived Usefulness (U)” and the “Perceived Ease of Use (E)”. “Perceived Usefulness” and “Perceived Ease of Use” both are the basis for “Attitude Toward Using (A)”, and “Perceived Ease of Use” additionally has some influence on “Perceived Usefulness”. The “Attitude Toward Using” influences the “Behavioural Intention to Use (BI)”, which also has a direct link to the “Perceived Usefulness”. Finally, the “Behavioural Intention to Use” is the core variable for the “Actual System Use” as the main target of all innovation ideas. This mirrors the acceptance of the user.
The driver acceptance evaluation design includes two parts:
- Online questionnaire: Evaluation of the driver acceptance with a questionnaire.
- Test drives: Evaluation of the driver acceptance with selected test drivers who experience the services and give feedback. Interviews with detailed questions for each use case in the different question categories were conducted before and after the test drives.
2.1.1. Online Questionnaire
Online questionnaires are utilized to assess driver acceptance of the C-ITS services. A total of 95 provided their feedback. The questions were primarily derived from the expertise of the C-Roads evaluation working group []. Each category of questions corresponds to a component of the TAM as illustrated in Table 3.
Table 3.
Overview of question categories and components of TAM.
2.1.2. Test Drives
The test preparation started with selecting test drivers who agreed to be monitored and interviewed. The group of test drivers included four female and fourteen male drivers, where ten people (male) were driving a truck and eight people (four male professionals and four female non-professional drivers) were driving a car (see Figure 3). The test drives with the trucks took place in July 2023, and the ones with the cars in November 2024.
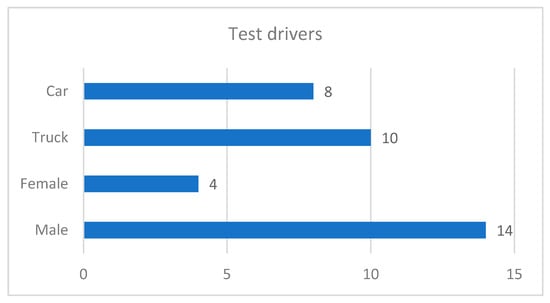
Figure 3.
Test drivers.
The test area was located on the A1 motorway next to Linz, Austria, for the test drives with the trucks, and on the S1 in the South of Vienna, Austria, with the cars. The motorway A1 has three lanes and a hard shoulder in each direction, while the motorway S1 has two lanes and a hard shoulder in each direction. The maximum speed limit is 130 km/h and 100 km/h, respectively.
The test vehicles were standard trucks and cars. They were equipped, in addition to the built-in equipment, with a tablet or smartphone mounted next to the driver. The displayed information to realize the desired C-ITS service was manually triggered by the co-pilot, who knew the position of the events. The trigger points were specified before and remained the same for every test drive. The information was presented to the driver through pictograms displayed on a tablet or smartphone, and additionally, an acoustic alarm was provided.
To analyse the driving behaviour, eye tracking was chosen as an additional source of information. Within the tests, the mobile eye tracking glasses Pupil Invisible from Pupil Labs [] were used to record the eye movements, video of the point of view of the test drivers, and the audio during the test drive.
The test drives included six test scenarios.
- C-ITS service LCR (with trucks)
- Lane-Offset-Recommendation: Change to the left or the right within the same lane
- Lane-Change-Recommendation: Change the lane
- C-ITS service RWW (with cars)
- 3.
- Road Works Warning, right-most lane is closed: Reduce speed and change to the left lane
- C-ITS service HLN (with cars)
- 4.
- Hazardous Location Notification, Emergency vehicle closes left-most lane: Reduce speed and change to the right lane
- 5.
- Hazardous Location Notification, Traffic jam ahead: Reduce speed, leave the motorway at the next exit
- C-ITS service IVS (with cars)
- 6.
- In-vehicle signage, speed limit: Change speed to the displayed speed limit
All the test drivers were interviewed before and after the test drives (see Table 4). The interview guidelines were primarily derived from the expertise of the C-Roads evaluation working group []. Each question category refers to a component of the TAM.
Table 4.
Interview, key aspects evaluated before and after test drive.
2.2. Literature Research
The results of the test drives and the online questionnaire in the presented field studies are combined with results from the literature to form an overall picture of user acceptance of C-ITS services, as illustrated in Figure 1. The literature review is an important component as it provides a comprehensive overview of existing studies and findings relevant to the research topic of the paper. This section forms the basis for further analysis and discussion of the results of the field-level studies in Section 4.
The structured literature analysis was conducted to find out about users’ trust in traffic information through various information channels, user acceptance of in-vehicle traffic information, and compliance with traffic regulations and instructions.
For this purpose, the four-phase model from the “PRISMA Statement” by Liberati et al. was chosen. The model suggests structuring the information flow within an identification, screening, selection, and inclusion phase to improve the reporting of systematic reviews []. For the literature, the following databases were used: ACM, EBSCO, IEEE, Scopus, Springer Link, and Wiley. The titles of the search were downloaded on 21 August 2024, and the review was conducted between September 2024 and March 2025.
To structure the search for appropriate literature, three main categories were defined: In-Vehicle Information, Technology Acceptance, Compliance, Trust, and Transportation Context. These categories were selected to capture different aspects of in-vehicle information systems, their acceptance by drivers, and their impact on behaviour and road safety (see Table 5). In Table 6, the corresponding keywords are presented that were used to create various search strings.
Table 5.
Categories for the literature review.
Table 6.
Keywords used for structured literature review.
The key challenge in creating the search strings was the limited number of papers specifically addressing driver acceptance of in-vehicle information provided by C-ITS services. In contrast, broader topics such as user acceptance or in-vehicle information alone yielded an overwhelming volume of literature. Consequently, to systematically analyse the literature, Boolean operators were used to combine these categories, specifically the AND operator and within the category to link the keywords, the OR operator. This ensures that the review focuses on studies that examine the relationships between these aspects rather than considering them in isolation.
In Table 6, the keywords corresponding to the categories can be found.
After defining the search string, a total of 426 studies were retrieved. Following the removal of duplicates (27 papers), a stepwise screening process, starting with titles, followed by abstracts, was conducted. During this process, 273 studies were excluded due to irrelevance, and 2 due to unavailability. As a result, 32 papers remained and underwent a full-text analysis. Six of these studies were excluded because they lacked contextual connections to the research topic. Ultimately, 26 studies were identified as relevant for further thematic analysis. The process is illustrated in Figure 4.
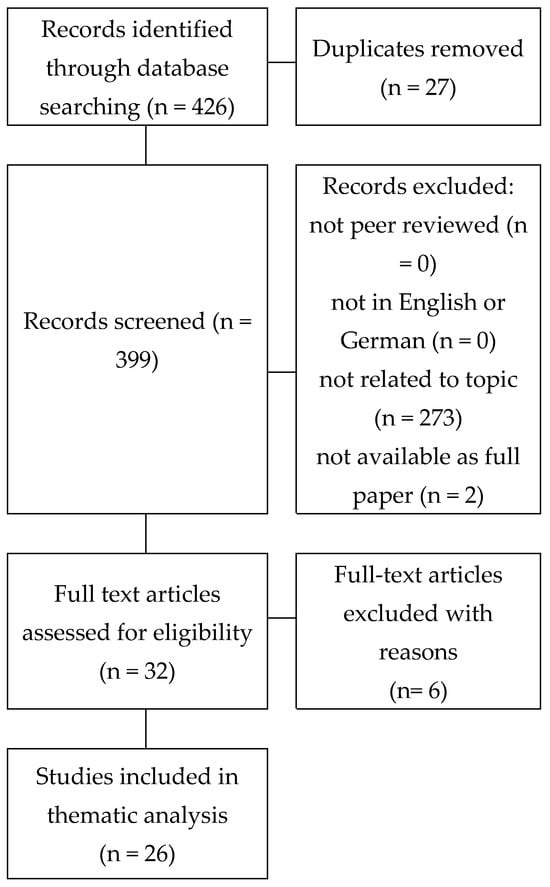
Figure 4.
Screening process for the literature review.
The papers selected for full-text analysis were published between 2004 and 2024, aligning with the evolution of C-ITS. These papers were categorized into five groups: five papers focused on literature reviews or theoretical analyses, which means current literature, white papers, policies, prior studies, and plans were analyzed. Fifteen papers were about experiments, of which nine involved driving in a real-world setting. Eleven papers conducted simulation studies, and eight of these were set within an experimental framework, aiming to manipulate variables and analyse the outcomes. Five papers obtained results through survey studies or focus groups. For an overview, see Table 7. For the literature list, see Table A1 in Appendix A, where the matching of the paper ID and the paper itself is given.
Table 7.
Literature list according to type of study.
3. Results
The two field-level studies used the same methodology but differed in the target group of drivers in the test drives and interviews. In the ESRIUM project, the focus was on truck drivers; in the ASFINAG study, the participants were car drivers. In the following, the results of both target groups are presented, starting with the results of the questionnaires, followed by the results of the test drives.
3.1. Questionnaire Results
The results comprise feedback from participants of an online survey and interviews with test drivers. While the first group includes any type of driver (truck or car, or motorcycle), interviews are separated into truck and car drivers. In the ESRIUM project, the focus was on the C-ITS service LCR (ref. Section 2.1.2) where drivers in the vehicle shall change lane. The C-ITS services RWW, HLN, and IVS (ref. Section 2.1.2) were in the scope of the ASFINAG study, where drivers in the vehicle shall primarily reduce speed.
3.1.1. Demographic Data of Users
In the ESRIUM project, the questionnaire results comprise answers from 27 male respondents. The 27 respondents include interviews of the 10 test drivers of the field test and 17 respondents of an online questionnaire (see Figure 5). The online survey was open from 21 August 2023 to 30 October 2023. The total sample was 157, net participation was 34, and the survey was completed by 27 people. The respondents were mainly aged above 35 years. Only 3 respondents were between 25 and 34 years old. 9 respondents were aged between 35 and 44 years old. 8 respondents were aged between 45 and 54 years old, and 9 respondents were aged 55 years and over (see Figure 6). Respondents also differed in terms of nationality. 16 Austrian, 6 Italian, 2 Hungarian, 1 Turkish, 1 Rumanian, and 1 Bulgarian truck drivers participated in the questionnaire. 14 respondents stated that to work as professional truck drivers and drive daily, whereas the remaining 13 respondents occasionally drive trucks. 19 respondents drove more than 300,000 km since they obtained their driving license (see Figure 7). Only 4 out of 27 respondents indicated that they have not been involved in a traffic accident so far. 15 were involved as a driver, 1 as a passenger, and 7 as a driver as well as a passenger. Regarding the severity of the road accidents, 18 respondents stated that the accidents caused only limited material damage. 1 respondent stated that serious material damage, but no physical injuries, occurred. 2 respondents stated that serious material damage and limited physical injuries occurred. Another 2 respondents indicated serious injuries as a result of the accident.
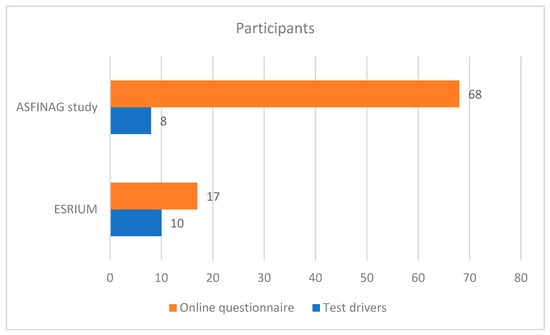
Figure 5.
Number of participants in the test drives and the online questionnaire.
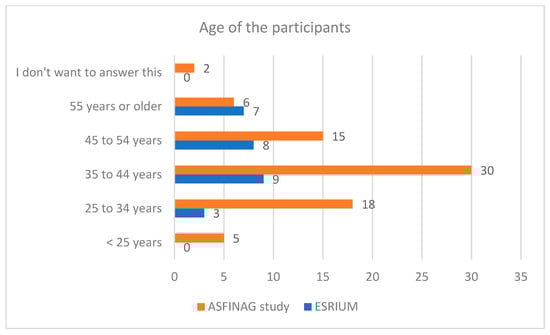
Figure 6.
Age of the participants in the test drives and online questionnaire.
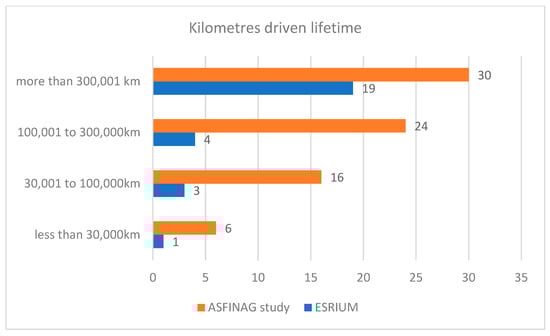
Figure 7.
Estimated kilometers driven in the lifetime of the participants in the test drives and online questionnaire.
The ASFINAG study included eight participants in interviews conducted between 5 November 2024 and 7 November 2024 (see Figure 5). The participants were evenly split between males and females, all of whom were Austrian nationals. The age distribution was intentionally diverse, with 25% under 25 years, 12.5% between 25 to 34 years, 37.5% between 35 to 44 years, and 25% between 45 to 54 years (see Figure 6). Educational backgrounds were equally divided between secondary education and university level. All participants held a car driving license, with 50% also licensed to drive trucks and motorbikes. Driving habits varied, with half driving less than 10,000 km annually and the other half between 22,001 to 60,000 km. Most participants drove a car, with 37.5% driving almost daily and 50% a few times a week, primarily for various reasons, including leisure. Lifetime driving experience showed that 50% had driven more than 300,000 km (see Figure 7). Regarding accident involvement, 62.5% had experienced accidents as drivers, with consequences ranging from limited material damage to serious material damage and limited physical injuries.
In addition, the ASFINAG study included an online survey that was open from 13 November 2024 until 6 December 2024. The total sample was 78, net participation was 73, and the survey was completed by 68 people (see Figure 5). The survey data reveals a diverse group of participants, predominantly male (69%) and aged between 35 to 44 years (40%) (see Figure 6). The majority are Austrian nationals (82%) (in total participants of 6 nations) with a high level of education, as 87% have obtained a university degree. All participants hold a car driving license, with a significant portion also licensed to drive motorbikes (26%). Most participants drive between 10,001 to 22,000 kilometres annually (53%) and are frequently on the road, with 50% driving almost daily. The primary vehicle used is a car (94%), and driving is mainly for various reasons, including leisure (59%). A substantial number of participants have driven over 300,001 kilometres since obtaining their license (38%) (see Figure 7). Traffic accident involvement is relatively high, with 41% having experienced accidents as drivers, though serious consequences are rare, with only 16% reporting serious material damage and limited physical injuries.
3.1.2. Desired Information and Compliance Rate
In the ESRIUM project, truck drivers were consulted regarding their current use of information systems whilst driving. 22 respondents indicated that they are using an app (e.g., Waze, Google Maps) on their smartphone, 20 stated that they use the built-in navigation system of their vehicle, and 12 indicated that they are using a separate navigation device (e.g., TomTom). The overlapping numbers of system usage suggest the parallel use of information systems while driving. In addition, 18 respondents stated that they used the traffic information provided via radio. Two respondents stated that they used the warnings of speed cameras.
With respect to the desired free of charge information, the following ranking could be observed in the answers of the truck drivers:
- Warnings for actual traffic jams (24/27)
- The regulatory speed limit (20/27)
- Warnings for specific situations—e.g., bad weather, road works, emergency vehicles (20/27)
- Information about sorting lanes and exit/entry of motorways (16/27)
- Speed advice in specific situations, e.g., traffic jams, bad weather, road works (14/27)
- Speed advice at traffic signals (14/27)
- Information in case of base surface quality (14/27)
- Information about the availability of shoulder lanes or peak hour/high occupancy lanes (11/27)
Regarding the compliance with the provided information, “change lane,” the following insights were observed in the ESRIUM project. In terms of safety-related information provided by road operators, 25 out of 27 respondents indicated that they would comply with a given lane change recommendation. Only 2 respondents indicated that they “do not know” how they would comply. The results with respect to a safety-related lane offset recommendation are slightly different. 19 instead of 25 (in the lane change case) out of 27 respondents stated yes, 4 “no”, and 4 “I don’t know”. Respondents commented that in terms of safety, they are willing to comply with the lane offset. However, they also stated that other traffic participants need to understand why they drive a given lane offset. Additionally, qualitative statements of truck drivers with respect to lane change manoeuvres during the test drives have been:
- “I would not perform a lane offset manoeuvre at road bridges, since I fear a safety risk.” [Context: truck driver driving a land offset > 30 cm and crossing the barrier line]
- “I would not perform a lane offset manoeuvre at a highway entrance or exit, because I fear a collision with vehicles entering/leaving the highway.” [Context: truck driver driving a land offset > 30 cm and crossing the barrier line]
- “I struggled a bit to estimate if I am driving an offset of 30 cm.”
- “My typical driving behaviour includes an offset to the right. I do not drive in the middle of a lane, [but] rather on the right side. If I [were to] adhere to an additional offset, it could be that I would cross the barrier line.”
The answers regarding the compliance with non-safety-related information differ from those given to safety-related information. A lower number of respondents (10 instead of 25 out of 27) stated that they would comply with non-safety-related lane change recommendations. This represents less than half of the respondents. 11 respondents explicitly stated that they would not comply with non-safety-related lane changes, and 4 indicated that they do not know. In case of a non-safety-related lane offset recommendation, the number of respondents that would comply further decreases to 7 out of 25. The answers of the truck drivers highlight the influence of “safety-relevance” on “compliance with information provided”.
In addition to the aspect of safety relevance, reasons to comply with “Bad Surface Information” have been investigated. A ranking of the compliance reasons provided by truck drivers is presented in Figure 8 and Figure 9. For lane change recommendations, 24 out of 27 truck drivers state that in case of a “lane closure” or “vehicle breakdown,” they will comply with it. 22 truck drivers stated that they would perform a lane change in case of “existing potholes,” whereas 18 truck drivers indicated to do so in case of “expected traffic jam”. 15 respondents stated to perform a requested lane change in case of “existing ruts”, and 13 respondents indicated to do so in case of “bad weather conditions” and “paying less toll”. The ranking with respect to lane offset recommendations is similar to the lane change recommendation ranking. However, the number of items to be ranked is less in the lane offset case.
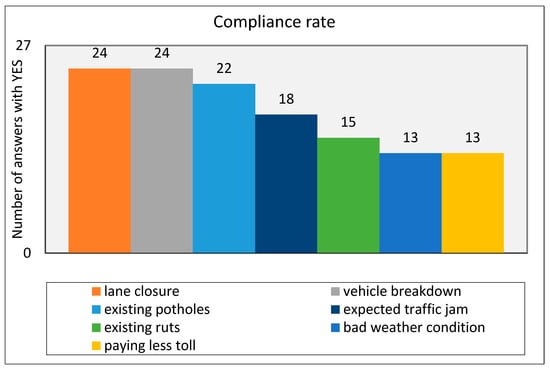
Figure 8.
Compliance with lane change recommendation in case of …
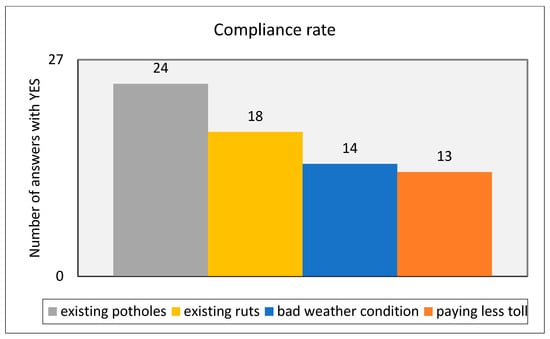
Figure 9.
Compliance with the lane offset recommendation in case of …
In the ASFINAG study, car drivers in interviews and further people in the online questionnaire, in total 76 people, were consulted regarding their current use of information systems whilst driving. The results indicate that smartphone apps for traffic information are the most popular among users, with 74.5% of respondents using them. This is followed by built-in navigation systems (42.0%) and traffic information via the radio (57.5%). The use of separate navigation devices (20.0%) and warnings of speed cameras (6.5%) is relatively lower. A small percentage of users reported using other systems not listed in the survey (9.75%) or not using any system at all (1.5%). These findings suggest a strong preference for smartphone-based solutions for navigation and traffic information. The data also highlights the continued relevance of traditional methods such as radio traffic updates and built-in vehicle systems.
With respect to the desired free of charge information, the following ranking could be observed in the answers of 76 participants:
- Warnings for actual traffic jams received high recognition, with 71 respondents emphasizing the necessity of real-time traffic jam alerts.
- Warnings for specific situations such as bad weather, road works, and emergency vehicles were deemed crucial by 66 respondents. This highlights the critical need for situational awareness on the road.
- The regulatory speed limit was acknowledged by 63 respondents. This indicates a strong consensus on the importance of adhering to speed limits.
- Speed advice in specific situations like traffic jams, bad weather, and road works was supported by 44 respondents. This suggests a moderate level of importance placed on adaptive speed recommendations.
- Other advisories were mentioned by 4 respondents, indicating a minimal but notable interest in additional types of traffic information.
- None of the respondents selected the option indicating no need for advisories, underscoring the overall perceived importance of traffic-related information.
Regarding the compliance with the provided information “reduce speed,” the following insights were observed in the ASFINAG study. Looking at the C-ITS service RWW and HLN providing safety-related warnings, on average 89% of the respondents would comply with the warning message and reduce their speed. The approval rate is similar to 84% in the case of IVS providing speed limit information. The compliance rate drops to 66% when speed advice information is provided to the drivers (see Figure 10). Additionally, qualitative statements of the respondents of the online questionnaire with respect to speed reduction were:
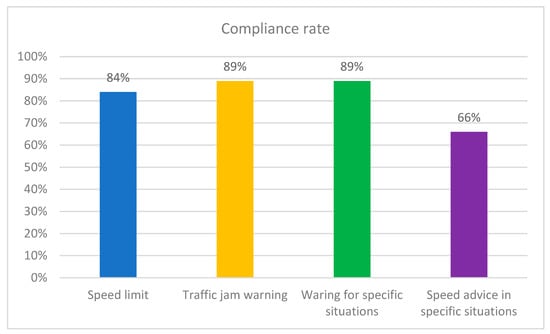
Figure 10.
Compliance with speed reduction in case of …
- “I would like to avoid an accident caused by inappropriate speed.” [Context: The driver receives a warning of a traffic jam ahead]
- “Trust in the road operator is higher than in the navigation device.” [Context: The driver receives speed limit information through different channels]
- “I would adhere if the warnings proved to be accurate over time.” [Context: The driver receives a warning of a hazardous situation and shall reduce speed]
- “Drive with more foresight and be more aware of potential dangers” [Context: The driver receives a speed advice because of the current traffic situation]
3.1.3. Safety Improvement and Intended Usage
In the ESRIUM questionnaire, the usefulness of bad surface information and its estimated impact on road safety were investigated. 25 out of 27 respondents indicated that they consider “bad surface information” as useful. Furthermore, 23 respondents indicated that they would like to receive bad surface information, and 21 of them do not fear being distracted from the driving task. Regarding the potential improvement of road safety through bad surface information provision, 25 out of 27 agree that such information would improve safety. This is in line with the concerns about unexpected situations caused by a bad surface. More than half of the respondents (17 out of 27) indicated that they have concerns about a bad surface.
In the ASFINAG, the online questionnaire and the interviews also covered the question of whether the participants want to have such in-vehicle information permanently in their vehicle. Whereas in the interviews, the question was referring to every use case separately, the online questionnaire included the question once for all use cases. The analysis of the online questionnaire responses indicates that a substantial proportion of participants (60–72%) express concerns related to potential driving hazards. These concerns primarily focus on exceeding the speed limit and encountering unexpected events such as traffic congestion or road construction. Moreover, a majority of respondents believe that C-ITS information provision can effectively mitigate driving-related concerns and enhance both road (78% approval rate) and personal safety (56% approval rate). This finding is further supported by interviews conducted with test drivers, which revealed a similar sentiment, although with minor variations observed across different use cases.
Therefore, it is not surprising that results reveal a strong overall preference for the integration of C-ITS-based in-vehicle information systems. 50% of the respondents of the online questionnaire and 75–87.5% of the respondents of the interviews agree on having such an in-vehicle information system. Notably, a clear positive correlation emerges between the concreteness of the presented use case, the level of user experience with the use case, and the corresponding approval rate. The substantial proportion of “I don’t know” responses (35% of the respondents of the online questionnaire) suggests the existence of untapped potential for further increasing approval rates, likely through enhanced user education and more tangible demonstrations of the technology’s benefits.
3.1.4. Willingness to Pay
The ESRIUM project and the ASFINAG study also included questions relating to the willingness to pay for in-vehicle information. In ESRIUM, the questions asked for their individual willingness to pay and a recommendation to their employer to pay for it. The individual’s willingness to pay was ranked low. Only 1 respondent agreed to be willing to pay, and 3 respondents somewhat agreed. The remaining participants (23 out of 27) did not indicate an individual willingness to pay. The results regarding the recommendation to the employer to pay for such information differ: 7 agree, 10 neither agree nor disagree, and 10 disagree.
In the ASFINAG study, the individual willingness to pay for C-ITS-based in-vehicle information is significantly influenced by a multitude of factors. These factors include the specific use cases supported by the service, the opportunity for users to experience the service, the perceived quality of service, and the proposed pricing structure. 18% of the respondents of the online questionnaire agreed that they are willing to pay for the service. They want to pay a monthly fee or even want to pay per use in the range of 5–10 € per month. Individuals who had the opportunity to experience the use cases firsthand, as demonstrated through participation in the test drives, exhibited a higher willingness to pay for such services, between 50% and 75%.
3.2. Test Drive Results
The test drives in the ESRIUM project and the ASFINAG study analysed eye movement indicators. Fixation and gaze points are key metrics in eye-tracking research. A gaze point represents the basic unit of measurement—each one corresponds to a raw sample captured by the eye tracker. For instance, if an eye tracker records at 60 Hz (60 times per second), each gaze point represents 16.67 milliseconds. When multiple gaze points occur close together in time and space, they form a fixation—a period during which the eyes remain focused on a specific object. Fixation durations typically range from 100 to 300 milliseconds []. The field studies primarily examined attention to and distraction from C-ITS in-vehicle information.
In both field studies, a so-called “area of interest” (AOI) was specified. The AOI includes the smartphone or tablet where the information is displayed to the driver (see Figure 11 from the ESRIUM project). This AOI signals the manoeuvre request.
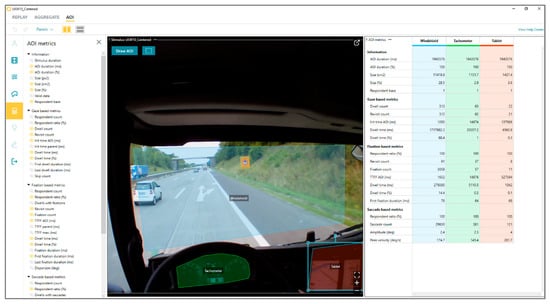
Figure 11.
Definition of Areas of Interest.
Table 8 lists dwell times, assumed distances driven while dwell time, and counts related to fixations and revisits as a result of the truck’s drives. Fixations last on average 0.468 s, i.e., 10.4 m driven at a speed of 80 km/h. The minimum of fixations is 66 milliseconds, whereas the maximum is 1.56 s, and the average is 468 milliseconds. This translates to distances driven, while Dwell time ranges from 1.47 m to 23.47 m.
Table 8.
Fixation- and Gaze-based analysis for AOI “Tablet”.
While driving, altogether 6 manoeuvres (2 × Lane Change Left, 2 × Lane Change Right, 2 × Lane Offset) were requested of the truck driver on the motorway. The fixation metrics for 9 truck drivers indicate that, on average, a truck driver performs a fixation five times, ranging from a minimum of 1 fixation to a maximum of 12 fixations. Revisits to the AOI range from 0 to 10 times (average 3).
Additionally, heat maps for truck drivers’ gaze points and fixations were generated within the analysis. The heat maps confirm that the main attention of the truck driver is given to the vehicles in front of the truck. Minor attention is given to the tachometer. The number of fixations and gazes in the area of the tablet does not indicate a cluster. In other words, minor attention was given to this area by the drivers on the motorway. However, the truck drivers noticed the information provided and complied with it in case the surrounding environment allowed them to do so.
In the ASFINAG study, the reaction time to a change on the display was evaluated for eight car drivers, every use case focusing on the first and second sign of every use case (i.e., pre-warning “in 500 m” and first warning sign) to assess the information awareness.
The average reaction time (duration between activating the sign on the display and first gaze on the display, considering all use cases and test drivers) is shown in Table 9.
Table 9.
Overview of reaction time values.
Looking at both car driver groups, i.e., professional and non-professional drivers, there is no significant difference in the reaction times. On average, the car drivers looked at the display for the first time 50 m after activating the sign, considering the speed limit of 100 km/h. There are high and low values in every group. Additionally, the is no dependency of the reaction time on the use case and signs displayed.
The fixation-based parameters in Table 10 show that, on average, car drivers fixated (i.e., looking more than 100 ms on the display of the smartphone) the display 7.5 s and did that 71 times in the 700 s of the test lap. These values are a strong indication that the signs attract the attention of the car drivers.
Table 10.
Fixation- and gaze-based metrics.
The gaze-based parameters in Table 10 show that, on average, test drivers looked at the display 109 times and in total 49 s on the display during the test lap lasting 700 s. The skip count values show that especially the professional drivers looked more often (max. 129), but very short at the display. Whereas the non-professional drivers had a rather low skip count (min. of 10). The conclusion of the values of the gaze-based parameters is that the test drivers were not distracted from the pictograms of the display.
Finally, referring to Figure 12, the heatmap aggregated from all gazes during a single test lap shows that the car drivers focused on the traffic (red and yellow areas) and, when necessary, looked at the display of the smartphone (green dots in the vicinity of the smartphone). Hence, the heatmap confirms that the signs on the smartphone do not distract from driving.
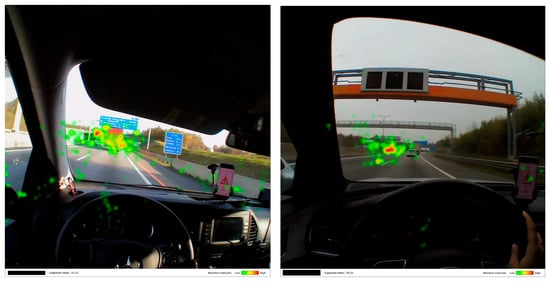
Figure 12.
Heat map of test drivers.
4. Discussion
The key findings in the two field studies, as outlined in Section 3, are manifold and are presented in the following. The results are discussed in the context of the literature research results as presented in Section 2.2.
4.1. Current Use of Information
The users in both C-ITS field studies are familiar with digital information devices in their current use of information systems while driving. The overlap in the subsequent numbers indicates that many drivers even use multiple navigation systems at once. In ESRIUM, roughly 80% of the respondents reported using a navigation app (e.g., Waze, Google Maps) on their smartphone. Meanwhile, ca. 75% used their vehicle’s built-in navigation system, and ca. 45% relied on a separate navigation device (e.g., TomTom). In the ASFINAG study, the results indicate that navigation apps for traffic information are the most popular, with 74.5% of respondents using them. Built-in navigation systems are used by 42.0% of respondents. In contrast, separate navigation devices (20.0%) and speed camera warnings (6.5%) are far less common (see Figure 13).
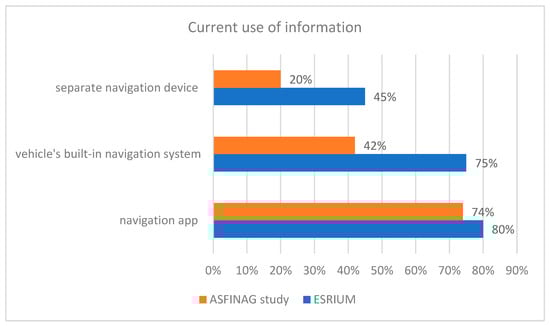
Figure 13.
Current use of information in both field studies.
Also, the literature shows that digital information is consumed whilst driving, evidence has shown that drivers see the mobile phone as their primary system for navigation and In-Vehicle Information Systems (IVIS) as secondary [,,]. Even though IVIS is designed to reduce unsafe mobile phone use while driving, some drivers experience mobile phones as more intuitive for navigation and communication []. Also Oviedo-Trespalacios, Nandavar, Haworth found that mobile phones are often preferred over IVIS while driving because IVIS are perceived as having lower usability and lower ease of use [].
In summary, the results of the field studies and literature research confirm that smartphone navigation apps are the preferred source of information. The studies indicate that smartphone apps are perceived as more intuitive for both navigation and communication, whereas IVIS are associated with lower usability. This may be because IVIS with C-ITS features are relatively new to the commercial market, while smartphones are already widely used. Additionally, IVIS user interfaces vary between vehicles, whereas smartphone apps maintain a consistent look and feel across different platforms.
4.2. Desired Free of Charge Information
The ranking of desired free-of-charge information begins with “Warnings for actual traffic jams,” which ranked first in both field studies. Nearly 90% to 93% of respondents want access to this type of information in their vehicle. The second most important type of information, with an approval rate of 75% to 86%, is “Warnings for specific situations such as bad weather, roadworks, and emergency vehicles.” In third place is “The regulatory speed limit,” with 75% to 82% of respondents finding it important. The newly introduced ESRIUM use case, “Information about poor surface quality (e.g., potholes, ruts),” is relevant for roughly 50% of respondents.
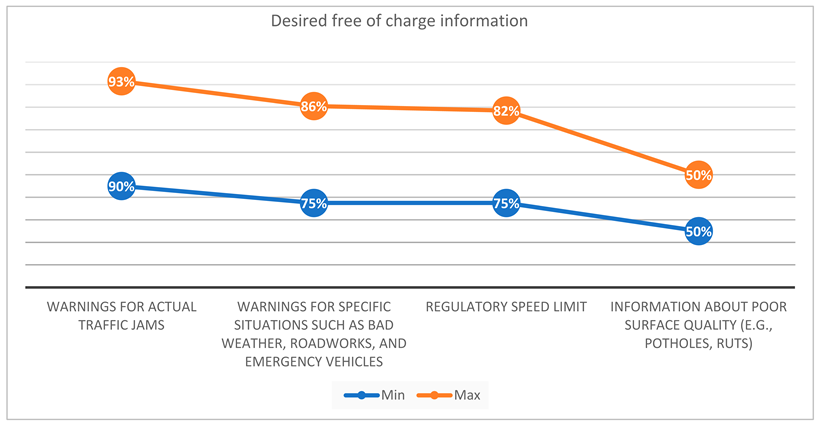
These findings suggest that drivers prioritize real-time traffic jam alerts to adjust their driving strategy. There is also strong consensus on the importance of situational awareness and adhering to speed limits. The top three types of information have been widely used for years, traditionally delivered through technologies like dynamic road signs or radio. In contrast, the ESRIUM use case is a newer concept, which may explain its lower approval rate.
Furthermore, research indicates that dynamic road signs, such as overhead gantries, when combined with in-vehicle systems, enhance compliance with speed regulations and improve driver situational awareness []. Studies also indicate that while IVIS can complement traditional traffic management systems, they should not replace them entirely, as drivers currently trust traditional signage more []. This indicates that in-vehicle information systems alone are less effective than an integrated approach that combines external and in-vehicle guidance []. However, road signs remain an effective means of warning drivers about non-critical or non-urgent events in terms of safety [].
Additionally, drivers recognize the benefits of IVIS and V2X communication in providing real-time updates that improve driving efficiency []. The actual effectiveness of connected vehicle safety features depends on their adoption rate and the quality of the infrastructure. Therefore, further studies are needed to better understand their long-term impact on safety and driver behaviour []. C-ITS is anticipated to improve vehicle safety, mitigate congestion causes, and foster efficient, eco-friendly driving []. Additionally, drivers recognize the benefits of IVIS and V2X communication in providing real-time updates that improve driving efficiency [].
In summary, both field studies and literature agree that a key benefit of IVIS is the provision of real-time updates to the drivers. This is a clear advantage compared to traditional infrastructure, such as dynamic road signs. However, drivers are used to signage on the road and see IVIS as an add-on for traffic information. Looking at the user groups in both field studies, other reasons for preferring signage information may be that most of the participants are experienced drivers with an age of 35+.
4.3. Compliance
Both studies investigated compliance with the provided information. The key finding is that compliance rates for “reduce speed” or “change lane/lane offset” instructions are highest when the information is safety-related (see Figure 14). In ESRIUM, truck drivers showed a 92% compliance rate for safety-related lane change recommendations, compared to only 37% for non-safety-related ones. A similar trend is observed for lane-offset manoeuvres: 70% of truck drivers comply with safety-related recommendations, whereas only 26% follow non-safety-related ones. In the ASFINAG study, compliance with safety-related warnings was also high. On average, 89% of respondents said they would reduce their speed in response to road works warnings (RWW) and hazardous location notifications (HLN). Research has shown that new features such as EVW (Emergency Vehicle Warning) and EEBL (Emergency Electronic Brake Light) have the highest urgency for implementation and could enhance safety. IVIS has the potential to improve drivers’ situational awareness and help them anticipate hazardous situations of varying urgency and criticality at an early stage []. A study also demonstrated that drivers were more likely to comply with in-vehicle information when it was synchronized with external visual cues, such as overhead gantries. For instance, the earlier the in-vehicle information was displayed, the slower the drivers’ speeds were when speed limits were reduced [].
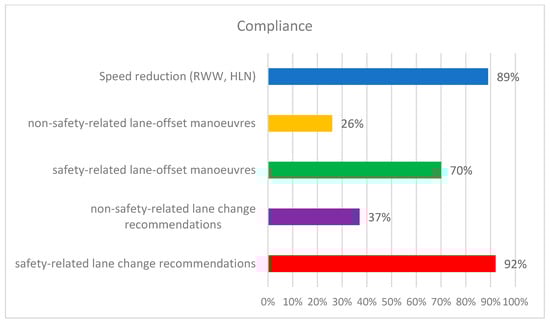
Figure 14.
Compliance rate of “reduce speed” or “change lane/lane offset” instructions.
Additionally, compliance rates increase with trust in the information provider. In ESRIUM, truck drivers were asked about their trust in road operators regarding bad surface information and whether they would use it. The results are clear: roughly 90% rated road operators as highly or very highly trustworthy, and 92% would use the information. Similarly, in the ASFINAG study, all car drivers agreed that safety-related information (RWW and HLN) from a road operator is trustworthy. This trust is reflected in statements from the online questionnaire, such as: “Trust in the road operator is higher than in the navigation device,” and “The road operator has more information about road conditions than I do, especially for unfamiliar routes.”
Finally, the accuracy of the provided information plays a crucial role in compliance. Some respondents emphasized this in the online questionnaire, stating: “It depends on the accuracy and implementation of the supplier,” and “Sometimes I don’t find the suggestions from operators reliable.”
These findings align with the driving simulator study by Payre and Diels, which suggests that in-vehicle speed limit warnings can enhance drivers’ situational awareness and promote more stable speed control []. However, while participants accepted the use of digital speed limit warnings via a mobile app, they remained hesitant to fully replace traditional road signs, highlighting the continued trust in established traffic control measures []. User acceptance of in-vehicle technology is crucial, as it ensures that the systems are utilized, thereby meeting fundamental design goals such as safety and driving efficiency [].
Furthermore, it was found that to instill, build, and maintain trust in the user of in-vehicle information, the information must be accurate [], delivered precisely [] and clearly [], and relevant, meaning both accurate and context-aware []. Otherwise, the credibility and trust in, for example, an in-vehicle information system, are negatively affected [].
Results of a study investigating the level of accuracy necessary in IVIS to elicit positive behavioural and attitudinal responses from drivers indicate that a decrease in system accuracy leads to a decline in both driving performance and trust and liking of the IVIS. Females appear to be slightly more tolerant of inaccuracies compared to males [].
Another interesting finding was that high levels of trust in new systems can lead to a mismatch between perceived and actual reliability, potentially causing complacency, such as following incorrect navigation instructions. Surveys and anecdotal evidence highlight issues with unreliable guidance from vehicle navigation systems. As drivers tend to develop over-reliance on guidance information, sometimes ignoring real-world cues, they engage in dangerous/illegal driving [].
In summary, the literature confirms key findings from the field-level studies. Safety-related use cases show the highest compliance rates, regardless of drivers’ age, experience, or gender. For non-safety-related use cases, interview results revealed that younger and less experienced drivers found the information helpful, whereas professional truck drivers tended to be less receptive. Additionally, trust in information provided through IVIS increases when the content is accurate and clearly presented.
4.4. Usefulness
The usefulness of C-ITS-based information correlates with drivers’ concerns, which are primarily related to safety-critical and unexpected road situations. In ESRIUM, 62% of respondents reported concerns about poor road surface conditions. Similar findings were observed in the ASFINAG study, where a minimum of 60% and a maximum of 72% of participants expressed concerns about potential driving hazards (see Figure 15). These concerns mainly revolve around exceeding the speed limit and encountering unexpected events such as traffic congestion or road construction.
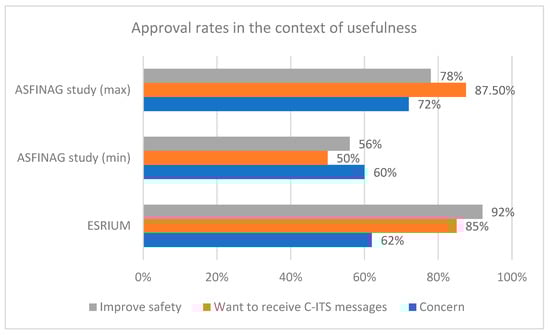
Figure 15.
Approval rates for topics relating to the usefulness.
A majority of respondents believe that C-ITS information can help mitigate these concerns. The ESRIUM questionnaire examined the use of C-ITS services for bad surface information, with 85% of respondents indicating that they would like to receive such updates. In the ASFINAG study, 50% of online questionnaire respondents and a minimum of 75% and a maximum of 87.5% of interview participants agreed that having in-vehicle C-ITS information is beneficial.
The approval rate primarily depends on the perceived safety benefits. In ESRIUM, 92% of respondents agreed that bad surface information would improve safety. Similarly, in the ASFINAG study, respondents believed that in-vehicle information enhances both road safety (78% approval) and personal safety (56% approval). Second, the likelihood of adoption increases if the C-ITS service is easy to use and understand. In the ESRIUM project, 10 truck drivers were asked to rate the following statement after their test drive: “The bad surface information provided is clear and easy to understand.” All drivers responded with “I fully agree.” Similarly, in the ASFINAG study, all eight car drivers unanimously agreed that the provided C-ITS services were clear and easy to understand, highlighting the high expected ease of use of these services.
Testing of IVIS revealed a significant difference in the effectiveness of information delivery to users. Experimental results indicated that fewer errors occurred in response to hazard warnings when the system provided both aural and visual feedback. Notably, the accuracy of correct turns improved under complex driving conditions, with this effect being particularly pronounced among older drivers, who benefited to a greater extent. The findings suggest that adopting a multimodal approach that integrates visual and aural feedback may enhance response times and overall driving performance []. Also, trust in IVIS depends on the intuitive design of alerts; auditory signs that match real-world driving contexts are more effective in gaining user trust []. The exclusive use of visual information presentation may not be optimal, as research indicates that an increased visual load can negatively impact both hazard detection and lane-keeping performance. Therefore, interfaces that enable drivers to maintain their focus on the road, such as those integrating visual and auditory feedback, are considered more suitable from a safety perspective []. A study also showed that in order to increase the drivers’ perceived urgency, faster auditory signals are needed and high fundamental frequencies [].
A study with a similar design, featuring warning signals composed of symbols on a mobile phone accompanied by an acoustic signal, found that urgent IVIS warnings such as EEBL (Emergency Electronic Brake Light) and EVW (Emergency Vehicle Warning) had a positive impact on driving behaviour. Additionally, drivers’ reaction times decreased by an average of 2.8 s when a leading vehicle was visible and by 3.5 s in low-visibility conditions. Furthermore, the average driving speed decreased after the EEBL warning was issued. These improvements suggest that IVIS warnings significantly enhance drivers’ situational awareness []. Less urgent warnings, such as RWW (Road Work Warning) and TCW (Traffic Congestion Warning), did not significantly influence driving speed, as road signs already provided sufficient information about these situations.
An extensive study with 3000 test drivers over 12 months found significant changes in drivers’ behaviour towards safer trends, including reductions in average speed, hard braking rate, severe deceleration rate, speeding rate, and excessive speeding rate, after receiving C-ITS warning services. These findings underscore the importance of C-ITS in fostering public acceptance of cooperative autonomous driving strategies [].
The usefulness is rated high in the field studies and literature if users perceive safety benefits. Additionally, information must be easy to understand. Another aspect covered in the literature is the way of warning drivers in their vehicles. It seems that the right combination of acoustic and visual warning further increases the perceived usefulness. Interesting to mention that the approval rates were equal among the different users regardless of age, gender, or driving experience.
4.5. Willingness to Pay
Both field studies also investigated participants’ willingness to pay for C-ITS services. This willingness is influenced by several factors, including the specific use cases supported by the service, the opportunity to test the service in real-life settings, the degree of customization, perceived service quality, and the proposed pricing structure. In the ESRIUM project, 14 truck drivers strongly disagreed, and five more or less disagreed with paying for bad surface information. Three drivers indicated a willingness to pay, ranging from somewhat agree to agree. When asked whether their employers should cover the cost, 37% neither agreed nor disagreed. Similarly, in the ASFINAG study, 18% of online questionnaire respondents expressed willingness to pay for the service. Participants who experienced the use cases firsthand during the test drives exhibited a higher willingness to pay, with approval rates between 50% and 75%, depending on the C-ITS service. Respondents preferred either a monthly fee or a pay-per-use model, typically ranging between 5–10 € per month.
Overall, willingness to pay remains low as presented in Figure 16, but is highly dependent on expected benefits. Certain user concerns must be alleviated through the information provided by C-ITS services. In the ASFINAG study, two-thirds of test drivers were willing to pay for traffic jam alerts, as they anticipated a higher level of personal safety. A similar trend is observed in the latest 2025 Global Automotive Consumer Study issued by Deloitte [], where 48% of 1306 respondents in Germany expressed willingness to pay for safety-related services such as emergency assistance (e.g., collision detection).
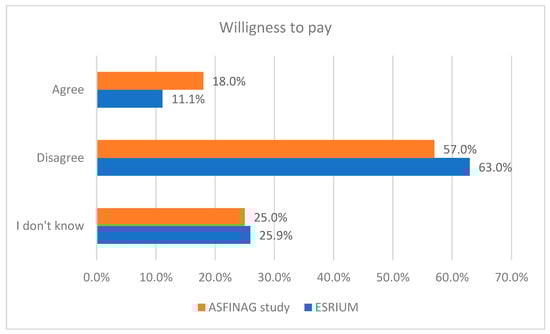
Figure 16.
Results of the willingness to pay feedback.
Lastly, personalization and seamless integration into daily driving habits influence IVIS acceptance. Research shows that users are more likely to accept IVIS when they can tailor settings to their needs []. Users may be more willing to pay for IVIS if these systems can be tailored to their individual driving behaviour.
Data sharing is a sensitive topic for the users that should be kept in mind. Data exchange was accepted if the information was shared exclusively within the community of app users []. There appears to be a trade-off between privacy and the perceived benefits of the app—the higher the perceived value, the lower the privacy concerns []. This also suggests that if the perceived benefit for the individual is higher, the likelihood rises that the system is used, which may affect the willingness to pay.
In summary, the results of both studies indicate that willingness to pay remains low unless users experience the benefits firsthand, for example, during test drives. In the ASFINAG study, male and female, professional and non-professional drivers showed similar reactions. This tendency is confirmed by the Deloitte study. However, willingness may increase if the in-vehicle information design is personalized and seamlessly integrated into users’ daily routines.
4.6. Attention and Distraction
The field studies also examined attention to and distraction from C-ITS in-vehicle information. Eye movement assessments were conducted on 10 truck drivers and 8 car drivers during their test drives. For truck drivers, fixation durations ranged from a minimum of 66 milliseconds to a maximum of 1.56 s, with an average of 468 milliseconds. In contrast, car drivers exhibited significantly longer fixation durations, with a minimum of 2.2 s, an average of 7.45 s, and a maximum of 19.95 s. These findings indicate that car drivers spend more time looking at their smartphones than truck drivers. A possible explanation is that truck drivers only needed to focus on two types of information, while car drivers had to process four types. Additionally, in the ASFINAG study also 25% of the drivers were young and inexperienced drivers.
Fixation-based parameters indicate that both truck and car drivers fixated (i.e., looked for more than 100 milliseconds) on the tablet or smartphone. These values strongly suggest that the signs attract the attention of both groups. This finding was further supported by post-test drive interviews, where 7 out of 8 car drivers agreed that the in-vehicle information did not distract them from driving. Finally, as shown in Figure 17, only around 20% of the participants of the online questionnaires agreed that C-ITS services would distract them from driving.
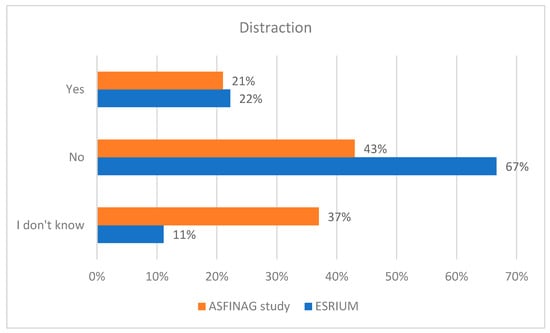
Figure 17.
Results of online questionnaires in terms of distraction.
Additionally, heat maps of truck and car drivers’ gaze points and fixations were generated as part of the analysis. The heat maps confirm that drivers primarily focus on the vehicles in front of them. This further supports the conclusion that in-vehicle information does not distract drivers from the road.
IVIS aims to serve as helpful advisors for navigation-specific information; however, they risk distracting the driver with excessive information. One approach to mitigating this issue is to share information during low-workload situations, such as at traffic lights or when the driver’s workload can be directly estimated using user context information (through additional sensors). Another strategy would be to generally reduce the amount of information provided. Recommender systems, for instance, could achieve this through personalization and context adaptivity []. To limit distraction, it has been found that voice-based interactions with IVIS may reduce driver distraction compared to visual interfaces. Screen-based interaction requires the driver to divert their eyes and attention from the road to the screen [].
Navigation system designers must consider not only the challenges of distraction and excessive cognitive workload [] but also additional factors such as routing efficiency and its impact on safety and comfort. Findings suggest that these aspects may be of greater concern to drivers than distraction alone []. IVIS has the potential to elevate cognitive workload, which may consequently result in riskier driving behaviour []. While IVIS can improve driver awareness, poorly designed auditory alerts may increase cognitive workload and cause attentional narrowing, impacting driving performance [].
Research has shown that in tests where IVI was displayed within the central line of sight, participants only needed to briefly glance at the mobile phone display. This task was easy for participants, as they did not have to spend extended periods looking at the display to perceive symbols or information. Visual attention does not necessarily require individuals to directly fixate on a target—this ability, known as covert attention, allows individuals to focus on an object within their visual field without making eye movements. Both field studies confirmed this effect, particularly among experts. Similarly, Payre, Diels suggests that this ability can improve with experience, such as through familiarity with GPS or traffic navigation apps []. Additionally, previous research has demonstrated that acoustic signals, when combined with visual signs, enhance drivers’ readiness to respond to hazards and critical events []. However, it should be noted that drivers perceive an excessive number of warnings as potentially distracting [].
Connected vehicle features, such as in-vehicle warnings transmitted via vehicle-to-vehicle (V2V) and vehicle-to-infrastructure (V2I) technologies, enhance drivers’ situation awareness and support safer driving decisions [].
Modern IVIS systems contain a wealth of information. However, not all information can be directly conveyed to the user, as this could lead to information overload for the user. The effectiveness of the data shared with the user depends on intuitive user interfaces [].
In summary, both field studies indicate that attention to in-vehicle information is high, while distraction remains low regardless of gender, age, and driving experience. This is supported by eye-tracking assessments, driver interviews, and results from online questionnaires. The literature confirms this observation but also highlights additional constraints to minimize distraction, such as limiting the amount of information, ensuring clarity, and incorporating acoustic or voice-based information where possible.
5. Conclusions
During the last 15 years, C-ITS services have been extensively specified, deployed, and tested, culminating in their initial commercial applications and rollouts. Starting from research projects and in the late 2000s, finally, commercial deployments are available in interurban and urban areas. With the increasing maturity, it became more and more important to understand the specific impacts of C-ITS and how users accept the provided services.
In two field studies, ESRIUM and ASFINAG studied the user acceptance of four different C-ITS services were evaluated following the approach of the Technology Acceptance Model. Evaluation included a mixed-method approach to gain both insights during real-life driving situations and further insights from an online questionnaire. In total, 10 truck drivers and 8 car drivers experienced the C-ITS service in real life in the vehicle. 27 and 68 people, respectively, took part in the ESRIUM and ASFINAG study online questionnaire.
In the following, the main results are summarized based on the research questions (ref. Section 1.6).
- Perceived level of usefulness: In both field studies, around 60% of respondents reported concerns about poor road surface conditions or potential driving hazards. In the ESRIUM study, 85% of participants expressed interest in receiving such information through in-vehicle systems. Similarly, in the ASFINAG study, 50% of online respondents and between 75% and 87.5% of interview participants agreed that in-vehicle C-ITS information is helpful. Trust in these systems increases when the information comes from road operators; roughly 90% of ESRIUM participants and all ASFINAG test drivers reported trusting operator-provided data. Furthermore, most participants (92% in ESRIUM and 78% in ASFINAG) believed that road safety is significantly improved by this information. Both studies also found that drivers paid close attention to in-vehicle alerts, with minimal distraction, regardless of age, gender, or driving experience.
- Perceived ease of use: In the ESRIUM project, all 10 truck drivers strongly agreed that the bad surface information provided during their test drive was clear and easy to understand. Likewise, in the ASFINAG study, every car driver reported that the C-ITS services were straightforward and intuitive, underscoring the system’s strong ease of use.
- Behavioral intention to use: Between 90% and 93% of respondents in both field studies expressed a desire to receive in-vehicle warnings about current traffic jams. The second most valued information type, with approval rates between 75% and 86%, was warnings about specific situations such as bad weather, roadworks, or approaching emergency vehicles. Regulatory speed limit information ranked third, considered important by 75% to 82% of participants. The newly introduced ESRIUM use case—notifications about poor road surface quality like potholes or ruts—was relevant for about 50% of respondents. Participants were most likely to follow “reduce speed” or “change lane” instructions when the alerts were clearly linked to safety. However, willingness to pay remained low among online respondents—only 18% in the ASFINAG study and just three drivers in the ESRIUM project. In contrast, those who experienced the services firsthand during test drives were more receptive, with 50% to 75% indicating a willingness to pay, depending on the specific service. Among these, preferred payment models included either a monthly fee or a pay-per-use system, typically ranging from 5 to 10 euros per month.
- Alignment and support by existing C-ITS literature: In general, IVIS and C-ITS play a vital role in improving road safety and ensuring compliance with traffic regulations by delivering real-time updates and enhancing situational awareness [,]. IVIS warnings, in particular, have been shown to significantly improve drivers’ awareness of road conditions []. A large-scale study involving 3000 test drivers over 12 months found that such systems led to measurable behavioural shifts, including reduced average speeds—an indicator of safer driving patterns []. However, in-vehicle systems alone are less effective than when combined with external guidance, underscoring the value of an integrated approach []. User acceptance also increases when drivers can customize the system to their preferences []. While studies confirm that in-vehicle information causes minimal distraction, researchers emphasize the need to limit information volume to further reduce potential cognitive overload.
To sum up, from a user acceptance perspective, the C-ITS services tested in the two field studies demonstrate high perceived usefulness, ease of use, and compliance rates, along with low distraction levels. These factors strongly suggest that C-ITS services will achieve even higher driver acceptance in the near future. The literature research conducted largely confirmed the key findings. It also highlighted additional aspects in this area, such as the impact of traditional road signage on the degree of acceptance or the design of the user interface.
The two field studies focused on interurban C-ITS-based use cases, some already harmonized in C-Roads with a high Technical Readiness Level (TRL), while others were newly specified and tested in the ESRIUM project with a lower TRL. The new EU-funded project ESERCOM-D aims to investigate use cases with high TRL, particularly in rural areas. While a higher TRL enhances the user experience for drivers, rural areas introduce new constraints on driving strategies, such as two-way roads, intersections, and vulnerable road users. Additionally, the ESERCOM-D project will collect further data on user acceptance, supporting the scalability and transferability of results to broader contexts.
Finally, C-ITS-based services are crucial for automated driving. In the domain of CCAM (Connected Cooperative Automated Driving), user acceptance is also highly significant. The EU-funded project FAME developed a European Common Evaluation Methodology Handbook for Connected, Cooperative, and Automated Mobility []. It includes sections on user acceptance and possible methodologies, such as the Technology Acceptance Model.
Author Contributions
Conceptualization, T.N., M.N., A.R. and W.S.; methodology, T.N., M.N., A.R. and W.S.; data curation, T.N., M.N., A.R. and W.S.; writing—original draft preparation, T.N., M.N. and A.R.; writing—review and editing, T.N., M.N., A.R. and W.S.; project administration, T.N., M.N. and W.S.; funding acquisition, T.N., M.N. and W.S. All authors have read and agreed to the published version of the manuscript.
Funding
The project ESRIUM was funded by the European GNSS Agency under the European Union’s Horizon 2020 research and innovation programme under Grant Agreement No. 101004181; the ASFINAG study was funded by the Austrian Highway Operator; the ESERCOM-D project was funded by the European Union Agency for the Space Programme under Grant Agreement No. 10118017. The literature research was part of the project ESTRAL, funded by the Austrian funding agency (FFG) with the project number F0999902574.
Institutional Review Board Statement
Not applicable.
Informed Consent Statement
Not applicable.
Data Availability Statement
The original data of the ESRIUM project presented study are openly available at https://esrium.eu/index.php/deliverables/ accessed on 7 March 2025. The data from the ASFINAG study presented in this study are available on request from the corresponding author due to legal reasons.
Conflicts of Interest
The authors declare no conflicts of interest.
Abbreviations
The following abbreviations are used in this manuscript:
| AOI | Area Of Interest |
| C2C-CC | Car-2-Car Communication Consortium |
| CCAM | Connected Cooperative Automated Mobility |
| C-ITS | Cooperative Intelligent Transport Systems |
| EEBL | Emergency Electronic Brake Light |
| EVW | Emergency Vehicle Warning |
| HLN | Hazardous Location Notification |
| LCR | Lane Change Recommendation |
| I2V | Infrastructure to Vehicle |
| IVIS | In-Vehicle Information Systems |
| IVS | In-vehicle Signage |
| OBU | On-board Unit |
| RSU | Road Side Unit |
| RWW | Road Works Warning |
| TCW | Traffic Congestion Warning |
| UTAT | Unified Theory of Acceptance and Use of Technology |
| V2I | Vehicle to Infrastructure |
| V2V | Vehicle to Vehicle |
| VRU | Vulnerable Road User |
| TAM | Technology Acceptance Model |
| TRL | Technical Readiness Level |
Appendix A
Literature Review List of Papers for Full Text Analysis
Table A1.
Complete Literature List with connection to paper ID.
Table A1.
Complete Literature List with connection to paper ID.
| ID | Database | Title | Author | Year | Affiliation Country |
|---|---|---|---|---|---|
| P01 | Scopus | How Do Humanlike Behaviors of Connected Autonomous Vehicles Affect Traffic Conditions in Mixed Traffic? | Dinar, Yousuf and Qurashi, Moeid and Papantoniou, Panagiotis and Antoniou, Constantinos | 2024 | Greece, USA |
| P02 | Scopus | Evaluating the Impact of V2V Warning Information on Driving Behavior Modification Using Empirical Connected Vehicle Data | Kim, Hoseon and Ko, Jieun and Jung, Aram and Kim, Seoungbum | 2024 | South Korea |
| P03 | EBSCO | In their own words: A qualitative study of users’ acceptance of connected vehicle technology after nine months of experience with the technology. | Rodwell, David and Ho, Bonnie and Pascale, Michael T. and Elrose, Francine and Neary, Alexandra and Lewis, Ioni | 2023 | Australia |
| P04 | Scopus | Analyzing the Impact of C-ITS Services on Driving Behavior: A Case Study of the Daejeon–Sejong C-ITS Pilot Project in South Korea | Kang, Junhee and Tak, Sehyun and Park, Sungjin | 2023 | South Korea |
| P05 | Scopus | Driving Behaviour and Usability: Should In-Vehicle Speed Limit Warnings Be Paired with Overhead Gantry? | Payre, William and Diels, Cyriel | 2023 | France, UK |
| P06 | EBSCO | Exploring the acceptance of connected and automated vehicles: Focus group discussions with experts and non-experts in transport. | Duboz, Amandine and Mourtzouchou, Andromachi and Grosso, Monica and Kolarova, Viktoriya and Cordera, Rubén and Nägele, Sophie and Alonso Raposo, Maria and Krause, Jette and Garus, Ada and Eisenmann, Christine and dell’Olio, Luigi and Alonso, Borja and Ciuffo, Biagio | 2022 | EU (Germany Spain, Italy, Netherlands, France) |
| P07 | SpringerLink | Intelligent Solutions for Cities and Mobility of the Future | Prof. Grzegorz Sierpiński | 2022 | Poland |
| P08 | Scopus | Towards Requirements Related to Future CCAM Services for Road Usage Optimization | Hofbauer, Florian and Walch, Manuel and Schildorfer, Wolfgang and Neubauer, Matthias | 2022 | Austria, Germany |
| P09 | Scopus | An exploration of the role of driving experience on self-reported and real-world aberrant driving behaviors | Sheykhfard, Abbas and Qin, Xiao and Shaaban, Khaled and Koppel, Sjaan | 2022 | Qatar, Australia |
| P10 | Scopus | Effects of Autonomous Driving Behavior on Intersection Performance and Safety in the Presence of White Phase for Mixed-Autonomy Traffic Stream | Niroumand, Ramin and Hajibabai, Leila and Hajbabaie, Ali and Tajalli, Mehrdad | 2022 | USA |
| P11 | EBSCO | 5G Connected Autonomous Vehicle Acceptance: The Mediating Effect of Trust in the Technology Acceptance Model. | Wai Mun, Chan and Wai Chow Lee, Jason | 2021 | Malaysa |
| P12 | Scopus | The impact of a dedicated lane for connected and automated vehicles on the behaviour of drivers of manual vehicles | Razmi Rad, Solmaz and Farah, Haneen and Taale, Henk and van Arem, Bart and Hoogendoorn, Serge P. | 2021 | Netherlands |
| P13 | Scopus | I want to brake free: The effect of connected vehicle features on driver behaviour, usability and acceptance | Payre, William and Diels, Cyriel | 2020 | France, UK |
| P14 | Scopus | How do perceptions of risk and other psychological factors influence the use of in-vehicle information systems (IVIS)? | Oviedo-Trespalacios, Oscar and Nandavar, Sonali and Haworth, Narelle | 2019 | Australia |
| P15 | IEEE | Encouraging Eco-Driving With Visual, Auditory, and Vibrotactile Stimuli | McIlroy, Rich C. and Stanton, Neville A. and Godwin, Louise and Wood, Antony P. | 2017 | UK |
| P16 | IEEE | Driver lane keeping behavior in normal driving using 100-car naturalistic driving study data | Johnson, Taylor and Sherony, Rini and Gabler, Hampton C. | 2016 | USA |
| P17 | IEEE | Dimensions of cooperative driving, its and automation | Aramrattana, Maytheewat and Larsson, Tony and Jansson, Jonas and Englund, Cristofer | 2015 | Sweden |
| P18 | Scopus | Driver acceptance of in-vehicle information, assistance and automated systems: An overview | Burnett, Gary and Diels, Cyriel | 2014 | UK |
| P19 | IEEE | Moving from analog to digital driving | Broggi, Alberto and Debattisti, Stefano and Panciroli, Matteo and Porta, Pier Paolo | 2013 | Italy |
| P20 | Scopus | Mixed factorial analysis of in-vehicle information systems: Age, driving behavior, and task performance | Liu, Yung-Ching and Ho, Chin-Heng | 2013 | Taiwan |
| P21 | ACM | Predicting information technology usage in the car: towards a car technology acceptance model | Osswald, Sebastian and Wurhofer, Daniela and Trosterer, Sandra and Beck, Elke and Tscheligi, Manfred | 2012 | Germany, Austria |
| P22 | IEEE | Modular approach to energy efficient driver assistance incorporating driver acceptance | Themann, Philipp and Eckstein, Lutz | 2012 | Germnay |
| P23 | ACM | A study on user acceptance of proactive in-vehicle recommender systems | Bader, Roland and Siegmund, Oliver and Woerndl, Wolfgang | 2011 | Germany, Austria |
| P24 | Scopus | Auditory signs to support traffic awareness | Fagerlönn, J. and Alm, H. | 2010 | Sweden |
| P25 | ACM | How accurate must an in-car information system be? consequences of accurate and inaccurate information in cars | Jonsson, Ing-Marie and Harris, Helen and Nass, Clifford | 2008 | Sweden, USA |
| P26 | Scopus | Impact of traveler advisory systems on driving speed: Some new evidence | Boyle, Linda Ng and Mannering, Fred | 2004 | USA |
References
- European Commission. Co-Operative Networks for Intelligent Road Safety. 2024. Available online: http://trimis.ec.europa.eu/project/co-operative-networks-intelligent-road-safety (accessed on 28 April 2025).
- SAFESPOT Cooperative Systems for Road Safety “Smart Vehicles on Smart Roads”. Available online: https://cordis.europa.eu/project/id/026963 (accessed on 28 April 2025).
- CIVIS Co-Operative Vehicle-Infrastructure Systems. Available online: https://cordis.europa.eu/project/id/027293 (accessed on 28 April 2025).
- C-Roads C-Roads—The Platform of Harmonised C-its Deployment in Europe. Available online: https://www.c-roads.eu/platform.html (accessed on 13 February 2025).
- ECo-AT European Corridor—Austrian Testbed for Cooperative Systems. Available online: https://c-its-deployment-group.eu/knowledge-base/publications/eco-at/ (accessed on 13 February 2025).
- Project Scoop. 2020. Available online: https://www.scoop.developpement-durable.gouv.fr/en/ (accessed on 28 April 2025).
- simTD Sichere Intelligente Mobilität Testfeld Deutschland. Available online: https://www.forschungsinformationssystem.de/servlet/is/471737/ (accessed on 13 February 2025).
- InterCor. 2019. Available online: https://trimis.ec.europa.eu/project/intercor (accessed on 28 April 2025).
- EN 302 665; Intelligent Transport Systems (ITS); Communications Architecture. ETSI: Sophia Antipolis, France, 2010.
- TS 103 301; Intelligent Transport Systems (ITS); Vehicular Communications; Basic Set of Applications; Facilities Layer Protocols and Communication Requirements for Infrastructure Services. ETSI: Sophia Antipolis, France, 2020.
- TR 102 638; Intelligent Transport Systems (ITS); Vehicular Communications; Basic Set of Applications. ETSI: Sophia Antipolis, France, 2024.
- Car 2 Car Communication Consortium Our Mission and Objectives. Available online: www.car-2-car.org (accessed on 28 April 2025).
- 5GAA 5G Automotive Association. Available online: https://5gaa.org/ (accessed on 28 April 2025).
- C-Roads. C-ITS Roadmap. 2024. Available online: https://www.c-roads.eu/fileadmin/user_upload/media/Dokumente/C-ROADS_C-ITS_Roadmap_v1.0.pdf (accessed on 28 April 2025).
- Car 2 Car Communication Consortium. Guidance for Day 2 and Beyond Roadmap. 2021. Available online: https://www.its-platform.eu/wp-content/uploads/ITS-Platform/AchievementsDocuments/IntegratingC-ITS/EU%20EIP-44-D7-C-ITS%20Roadmap-v1.0%20211223.pdf (accessed on 28 April 2025).
- 5GAA Automotive Association. A Visionary Roadmap for Advanced Driving Use Cases, Connectivity Technologies, and Radio Spectrum Needs. 2022. Available online: https://5gaa.org/content/uploads/2023/01/5gaa-white-paper-roadmap.pdf (accessed on 28 April 2025).
- C-Roads. C-ITS Service and Use Case Definitions. 2024. Available online: https://releases.c-roads.eu (accessed on 28 April 2025).
- Kotsi, A.; Mitsakis, E.; Tzanis, D. Overview of C-ITS Deployment Projects in Europe and USA. In Proceedings of the 2020 IEEE 23rd International Conference on Intelligent Transportation Systems (ITSC), Rhodes, Greece, 20–23 September 2020; pp. 1–6. [Google Scholar]
- Degrande, T.; van den Eynde, S.; Vannieuwenborg, F.; Colle, D.; Verbrugge, S. C-ITS road-side unit deployment on highways with ITS road-side systems: A techno-economic approach. IET Intell. Trans. Sys. 2021, 15, 863–874. [Google Scholar] [CrossRef]
- C-Roads. Annual Deployment Overview Report. 2024. Available online: www.c-roads.eu/fileadmin/user_upload/media/Dokumente/M43_Annual_deployment_overview_report_2023_v1.pdf (accessed on 28 April 2025).
- FOT-Net; CARTRE; ARCADE. FESTA Handbook. 2021. Available online: https://www.connectedautomateddriving.eu/wp-content/uploads/2024/07/FESTA-Handbook-Version-8-FINAL-Version-20-09.pdf (accessed on 28 April 2025).
- C-Roads. Evaluation and Assessment Plan. 2023. Available online: https://www.c-roads.eu/fileadmin/user_upload/media/Dokumente/C-Roads_WG3_Evaluation_and_Assessment_Plan_version_1.3_Final.pdf (accessed on 28 April 2025).
- ESERCOM-D EGNSS ENABLED STANDARDIZED EUROPEAN ROAD CONDITION MONITORING AND DISTRIBUTION. Available online: https://esercomd.eu/ (accessed on 28 April 2025).
- Venkatesh, V.; Davis, F.D. A model of the antecedents of perceived ease of use: Development and test. Decis. Sci. 1996, 27, 451–481. [Google Scholar] [CrossRef]
- Osswald, S.; Wurhofer, D.; Trösterer, S.; Beck, E.; Tscheligi, M. Predicting information technology usage in the car: Towards a car technology acceptance model. In Proceedings of the AutomotiveUI 2012, 4th International Conference on Automotive User Interfaces and Interactive Vehicular Applications, Portsmouth, NH, USA, 17–19 October 2012; ACM: New York, NY, USA, 2012. [Google Scholar]
- Pupil Labs. Pioneering Deep Learning Powered Eye Tracking; Pupil Labs: Berlin, Germany, 2025. [Google Scholar]
- Liberati, A.; Altman, D.G.; Tetzlaff, J.; Mulrow, C.; Gøtzsche, P.C.; Ioannidis, J.P.A.; Clarke, M.; Devereaux, P.J.; Kleijnen, J.; Moher, D. The PRISMA statement for reporting systematic reviews and meta-analyses of studies that evaluate health care interventions: Explanation and elaboration. Ann. Intern. Med. 2009, 151, W65–W94. [Google Scholar] [CrossRef] [PubMed]
- iMotions Eye Tracking Data. Available online: https://imotions.com/blog/learning/best-practice/eye-tracking/#eye-tracking-data. (accessed on 28 April 2025).
- Oviedo-Trespalacios, O.; Nandavar, S.; Haworth, N. How do perceptions of risk and other psychological factors influence the use of in-vehicle information systems (IVIS)? Transp. Res. Part F Traffic Psychol. Behav. 2019, 67, 113–122. [Google Scholar] [CrossRef]
- Wang, L.; Ju, D.Y. Concurrent Use of an In-vehicle Navigation System and a Smartphone Navigation Application. Soc. Behav. Pers. 2015, 43, 1629–1640. [Google Scholar] [CrossRef]
- Payre, W.; Diels, C. I want to brake free: The effect of connected vehicle features on driver behaviour, usability and acceptance. Appl. Ergon. 2020, 82, 102932. [Google Scholar] [CrossRef] [PubMed]
- Payre, W.; Diels, C. Driving Behaviour and Usability: Should In-Vehicle Speed Limit Warnings Be Paired with Overhead Gantry? Future Transp. 2023, 3, 1–22. [Google Scholar] [CrossRef]
- Aramrattana, M.; Larsson, T.; Jansson, J.; Englund, C. Dimensions of cooperative driving, its and automation. In Proceedings of the 2015 IEEE Intelligent Vehicles Symposium (IV), Seoul, Republic of Korea, 28 June–1 July 2015; pp. 144–149. [Google Scholar]
- Kang, J.; Tak, S.; Park, S. Analyzing the Impact of C-ITS Services on Driving Behavior: A Case Study of the Daejeon–Sejong C-ITS Pilot Project in South Korea. Sustainability 2023, 15, 12655. [Google Scholar] [CrossRef]
- Regan, M.A.; Horberry, T.; Stevens, A. Driver Acceptance of New Technology: Theory, Measurement and Optimisation. In Human Factors in Road and Rail Transport; Ashgate Publishing Company: Farnham, UK; Burlington, VT, USA, 2014. [Google Scholar]
- Jonsson, I.-M.; Harris, H.; Nass, C. How accurate must an in-car information system be? In Proceedings of the SIGCHI Conference on Human Factors in Computing Systems, Florence, Italy, 5–10 April 2008; Czerwinski, M., Lund, A., Tan, D., Eds.; ACM: New York, NY, USA, 2008; pp. 1665–1674. [Google Scholar]
- Bader, R.; Siegmund, O.; Woerndl, W. A study on user acceptance of proactive in-vehicle recommender systems. In Proceedings of the 3rd International Conference on Automotive User Interfaces and Interactive Vehicular Applications, Salzburg, Austria, 30 November–2 December 2011; Tscheligi, M., Kranz, M., Weinberg, G., Meschtscherjakov, A., Murer, M., Wilfinger, D., Eds.; ACM: New York, NY, USA, 2011; pp. 47–54. [Google Scholar]
- Liu, Y.-C.; Ho, C.-H. Mixed Factorial Analysis of In-Vehicle Information Systems: Age, Driving Behavior, and Task Performance. In Proceedings of the 15th International Conference on Human-Computer Interaction, Las Vegas, NV, USA, 21–26 July 2013. [Google Scholar]
- Fagerlönn, J.; Alm, H. Auditory signs to support traffic awareness. IET Intell. Transp. Syst. 2010, 4, 262–269. [Google Scholar] [CrossRef]
- Deloitte. 2025 Global Automotive Consumer Study: Key Findings: Global Focus Markets; Deloitte: London, UK, 2025. [Google Scholar]
- Rodwell, D.; Ho, B.; Pascale, M.T.; Elrose, F.; Neary, A.; Lewis, I. In their own words: A qualitative study of users’ acceptance of connected vehicle technology after nine months of experience with the technology. Transp. Res. Part F Traffic Psychol. Behav. 2023, 97, 73–93. [Google Scholar] [CrossRef]
- Duboz, A.; Mourtzouchou, A.; Grosso, M.; Kolarova, V.; Cordera, R.; Nägele, S.; Raposo, M.A.; Krause, J.; Garus, A.; Eisenmann, C.; et al. Exploring the acceptance of connected and automated vehicles: Focus group discussions with experts and non-experts in transport. Transp. Res. Part F Traffic Psychol. Behav. 2022, 89, 200–221. [Google Scholar] [CrossRef]
- FAME. European Common Evaluation Methodology Handbook for Connected, Cooperative and Automated Mobility (EU-CEM Handbook for CCAM). Version 1.0. 2025. Available online: https://www.connectedautomateddriving.eu/methodology/common-evaluation-methodology/ (accessed on 2 June 2025).
Disclaimer/Publisher’s Note: The statements, opinions and data contained in all publications are solely those of the individual author(s) and contributor(s) and not of MDPI and/or the editor(s). MDPI and/or the editor(s) disclaim responsibility for any injury to people or property resulting from any ideas, methods, instructions or products referred to in the content. |
© 2025 by the authors. Licensee MDPI, Basel, Switzerland. This article is an open access article distributed under the terms and conditions of the Creative Commons Attribution (CC BY) license (https://creativecommons.org/licenses/by/4.0/).