
Spatiotemporal Stability Responses of Tunnel Excavation Under Cyclical Footage Impact: A FLAC3D-Based Numerical Study


Abstract
1. Introduction
2. Materials and Methods
2.1. Model Build and Parameters Select
2.2. Model Displacement and Stress Boundary Conditions
2.3. Simulation Test Scheme
3. Results
3.1. Process Analysis of Result
3.2. Displacement Analysis of Result
3.3. Stress Analysis of Result
3.4. Plastic Zone Analysis of Result
3.5. Comprehensive Comparison Analysis of Result
4. Discussion
5. Conclusions
- (1)
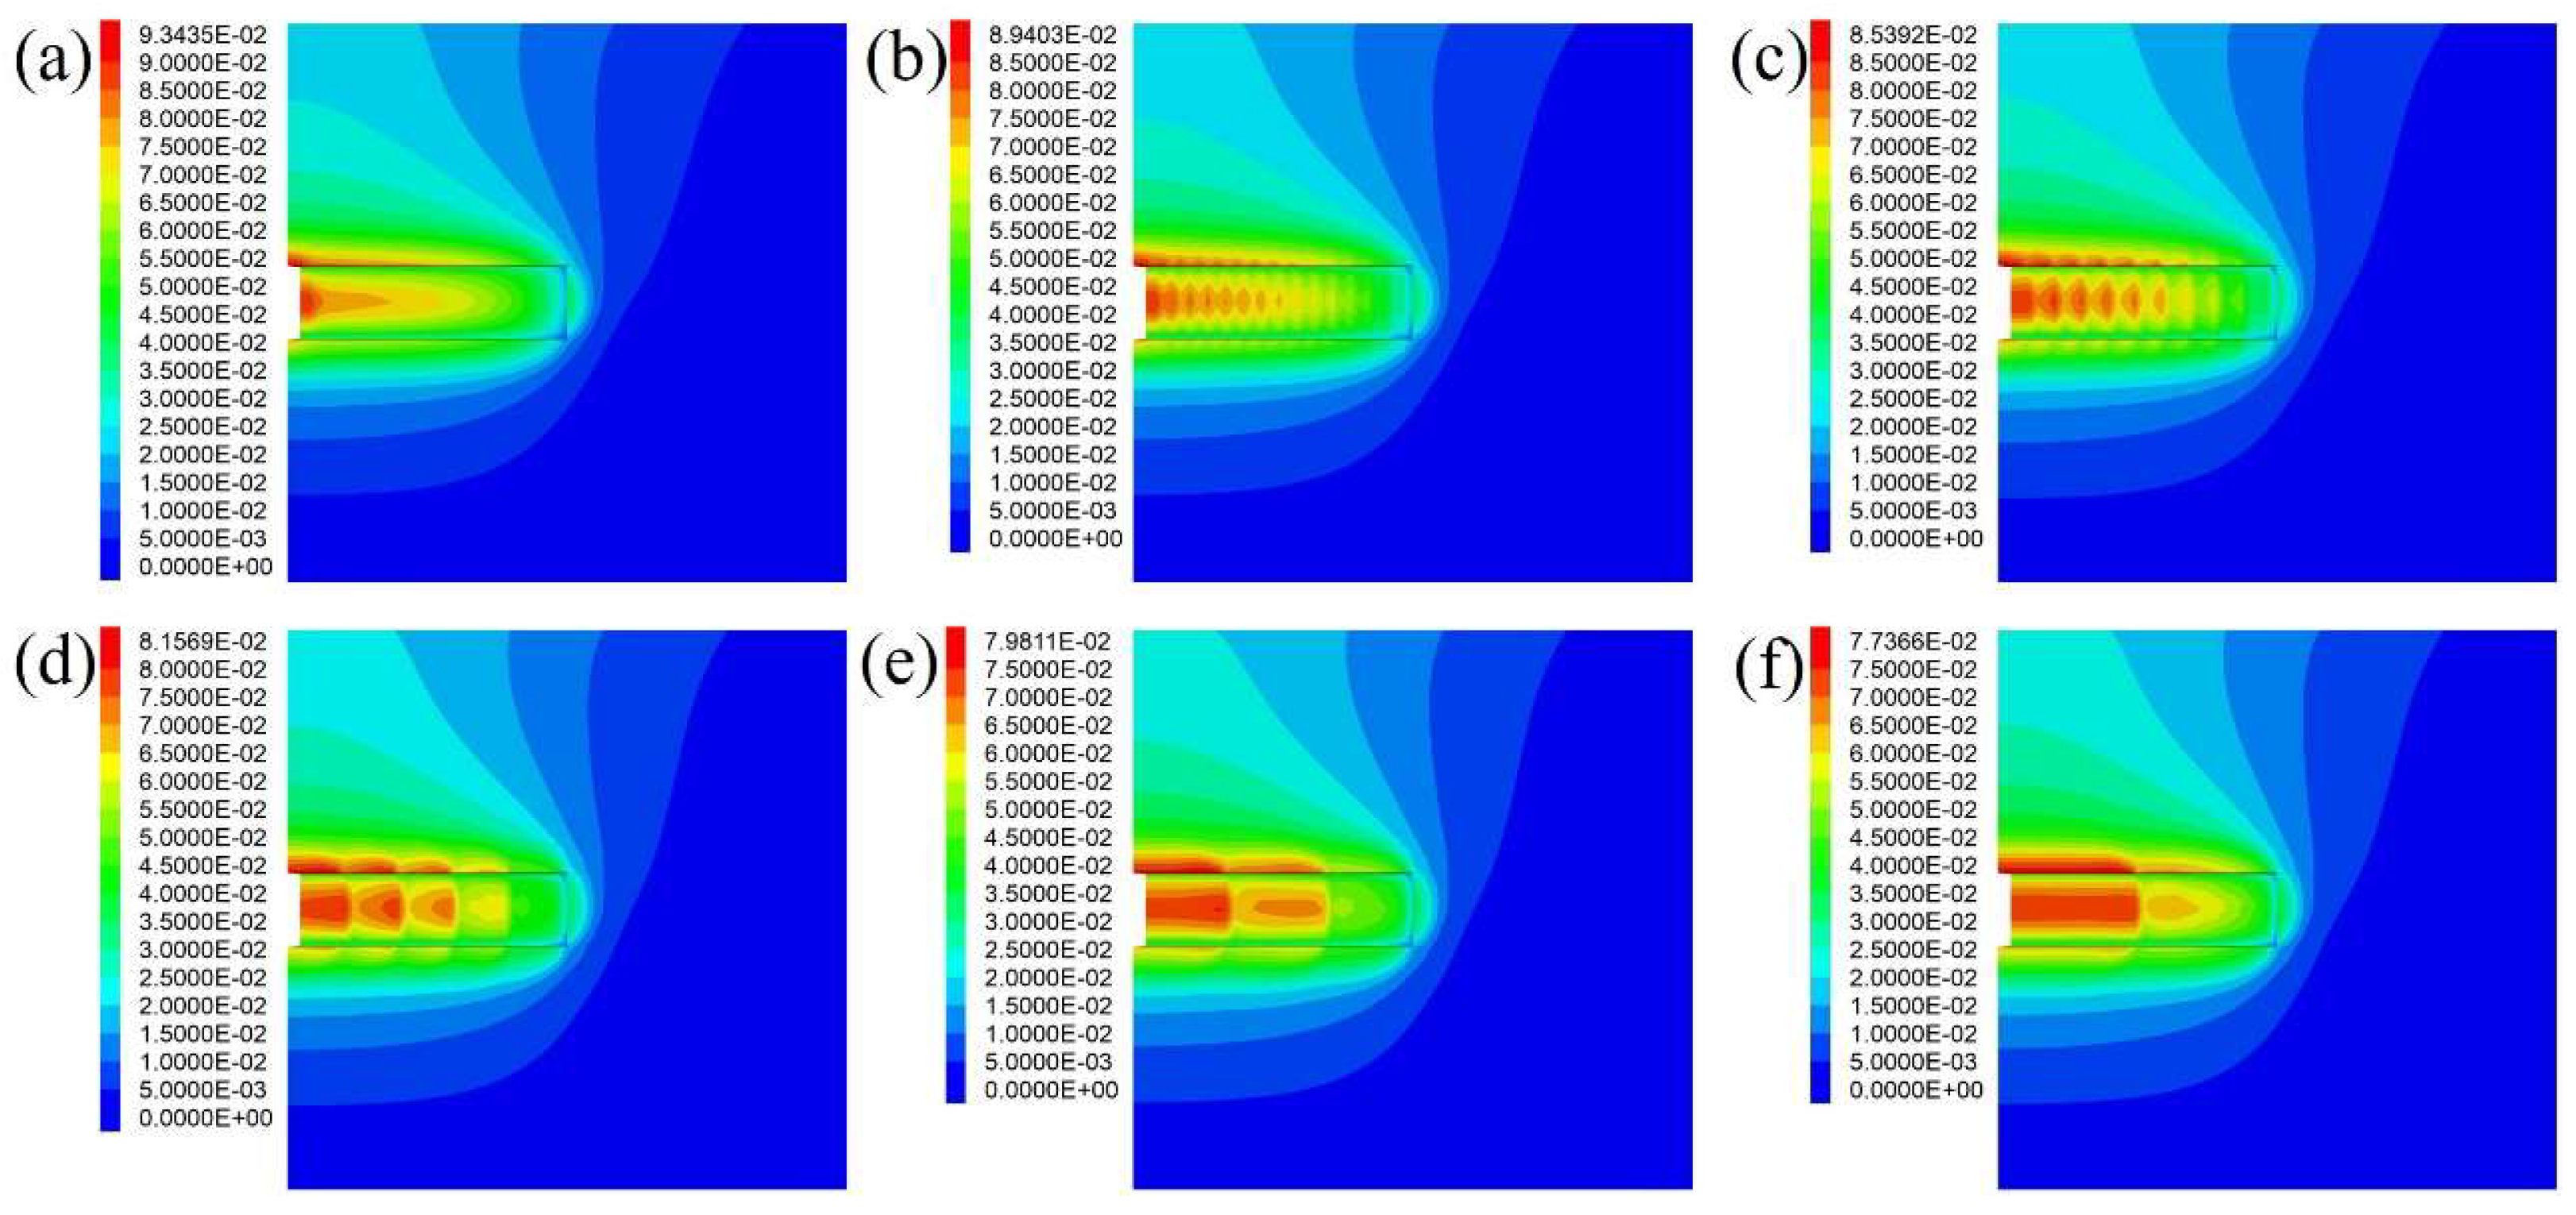
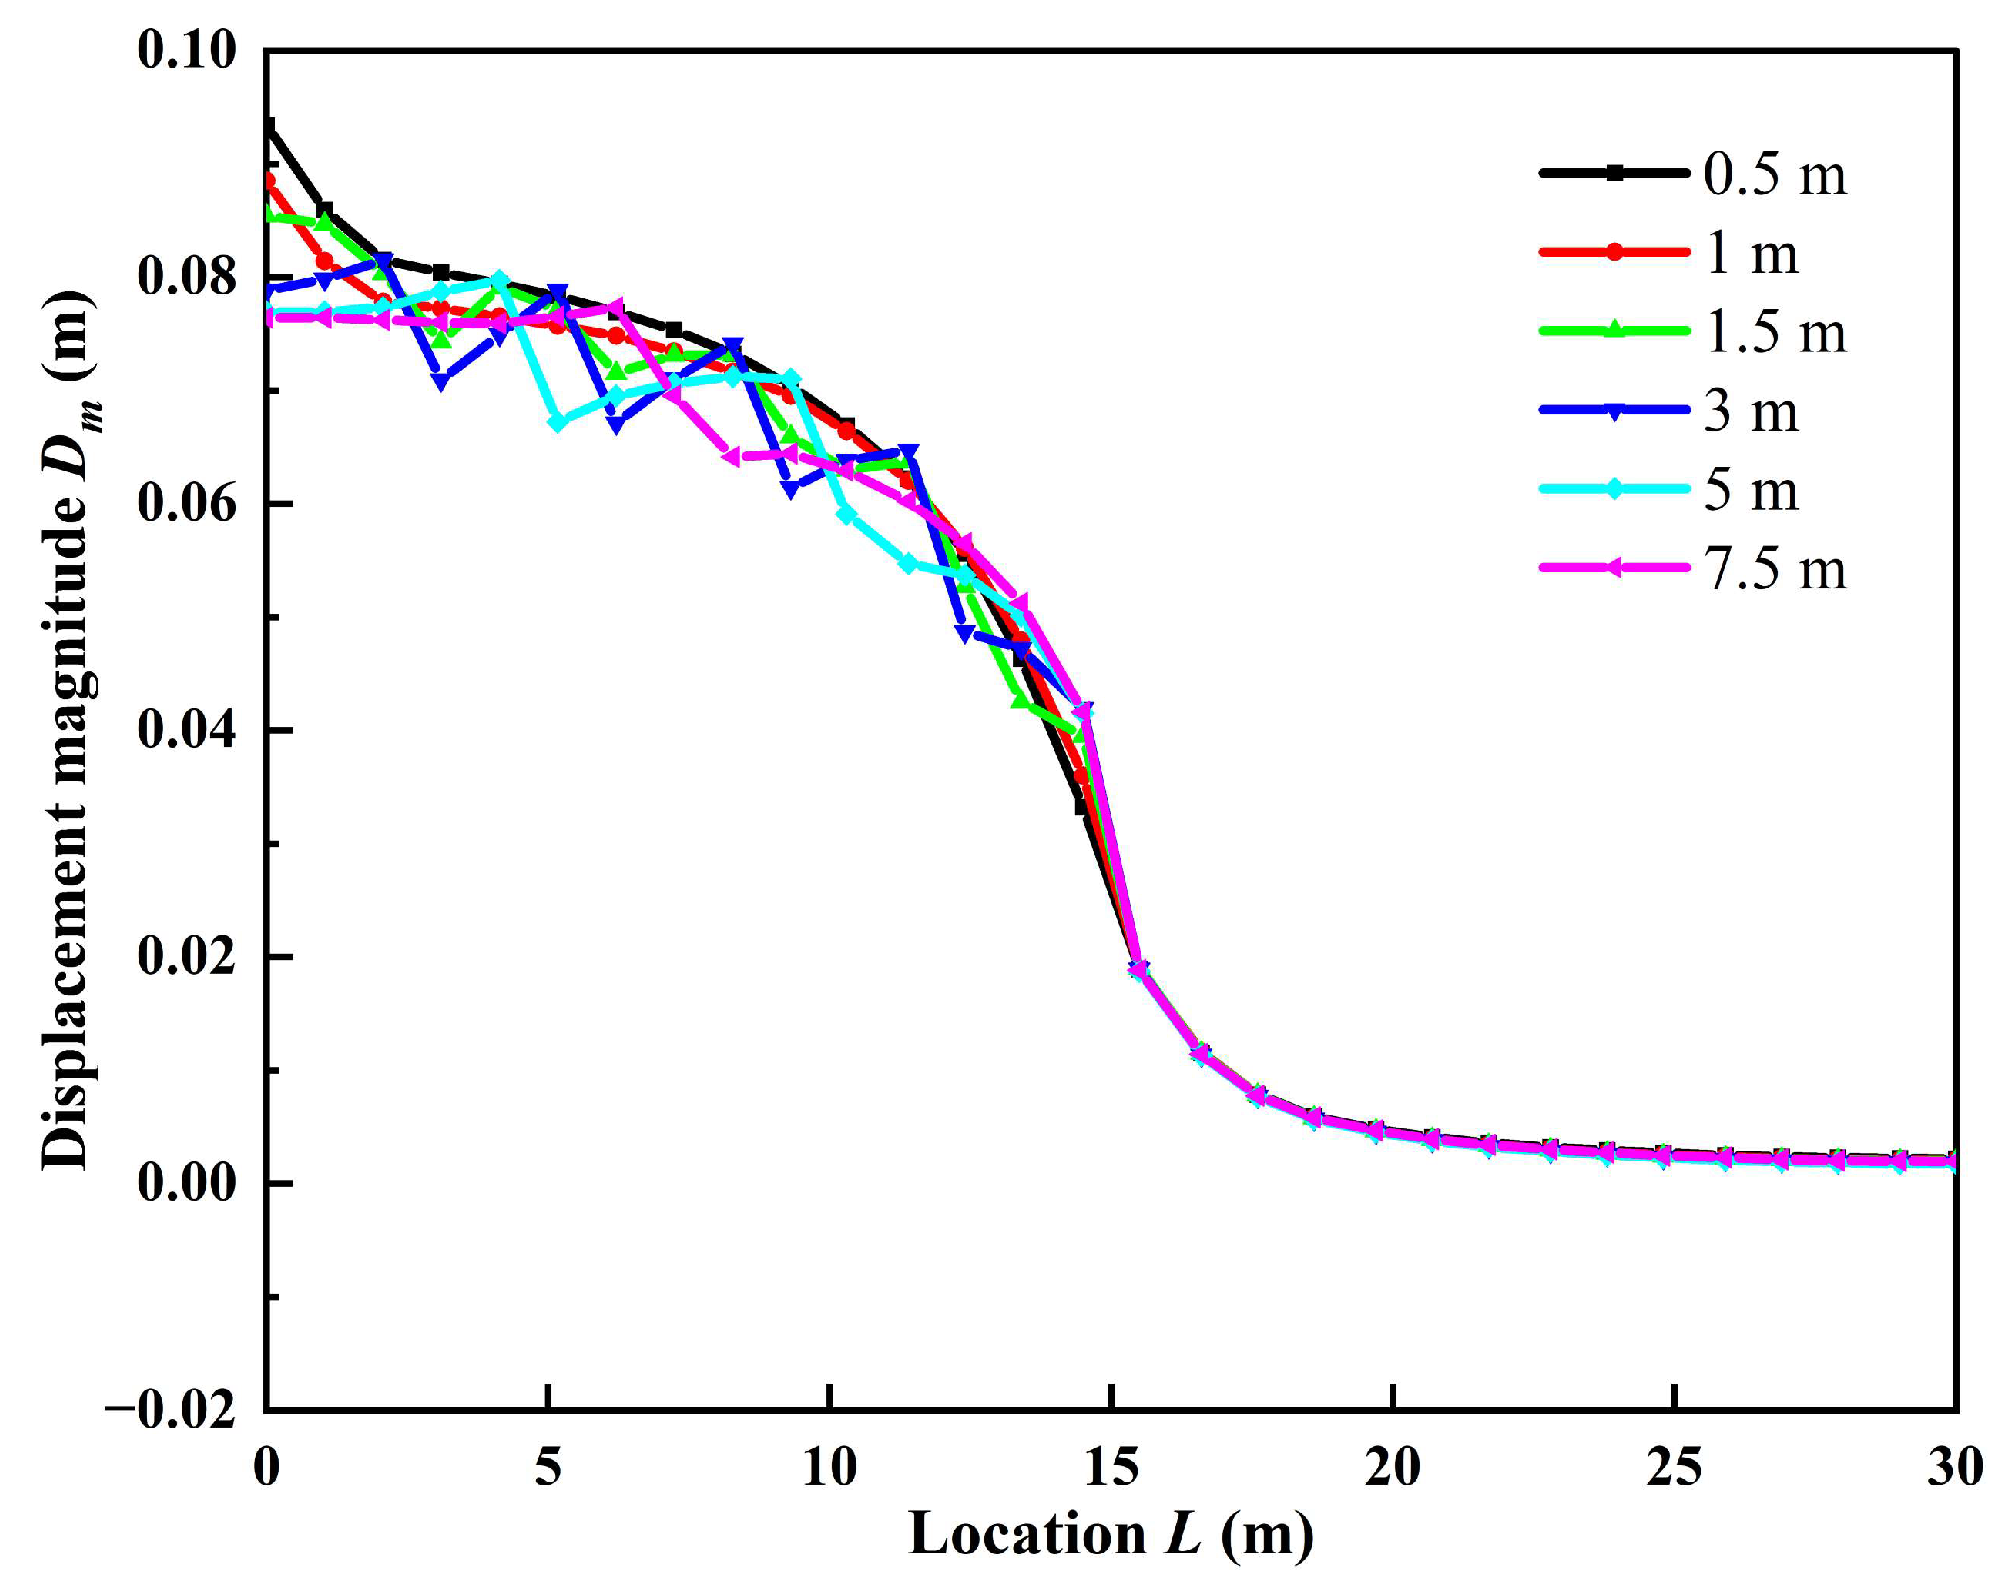
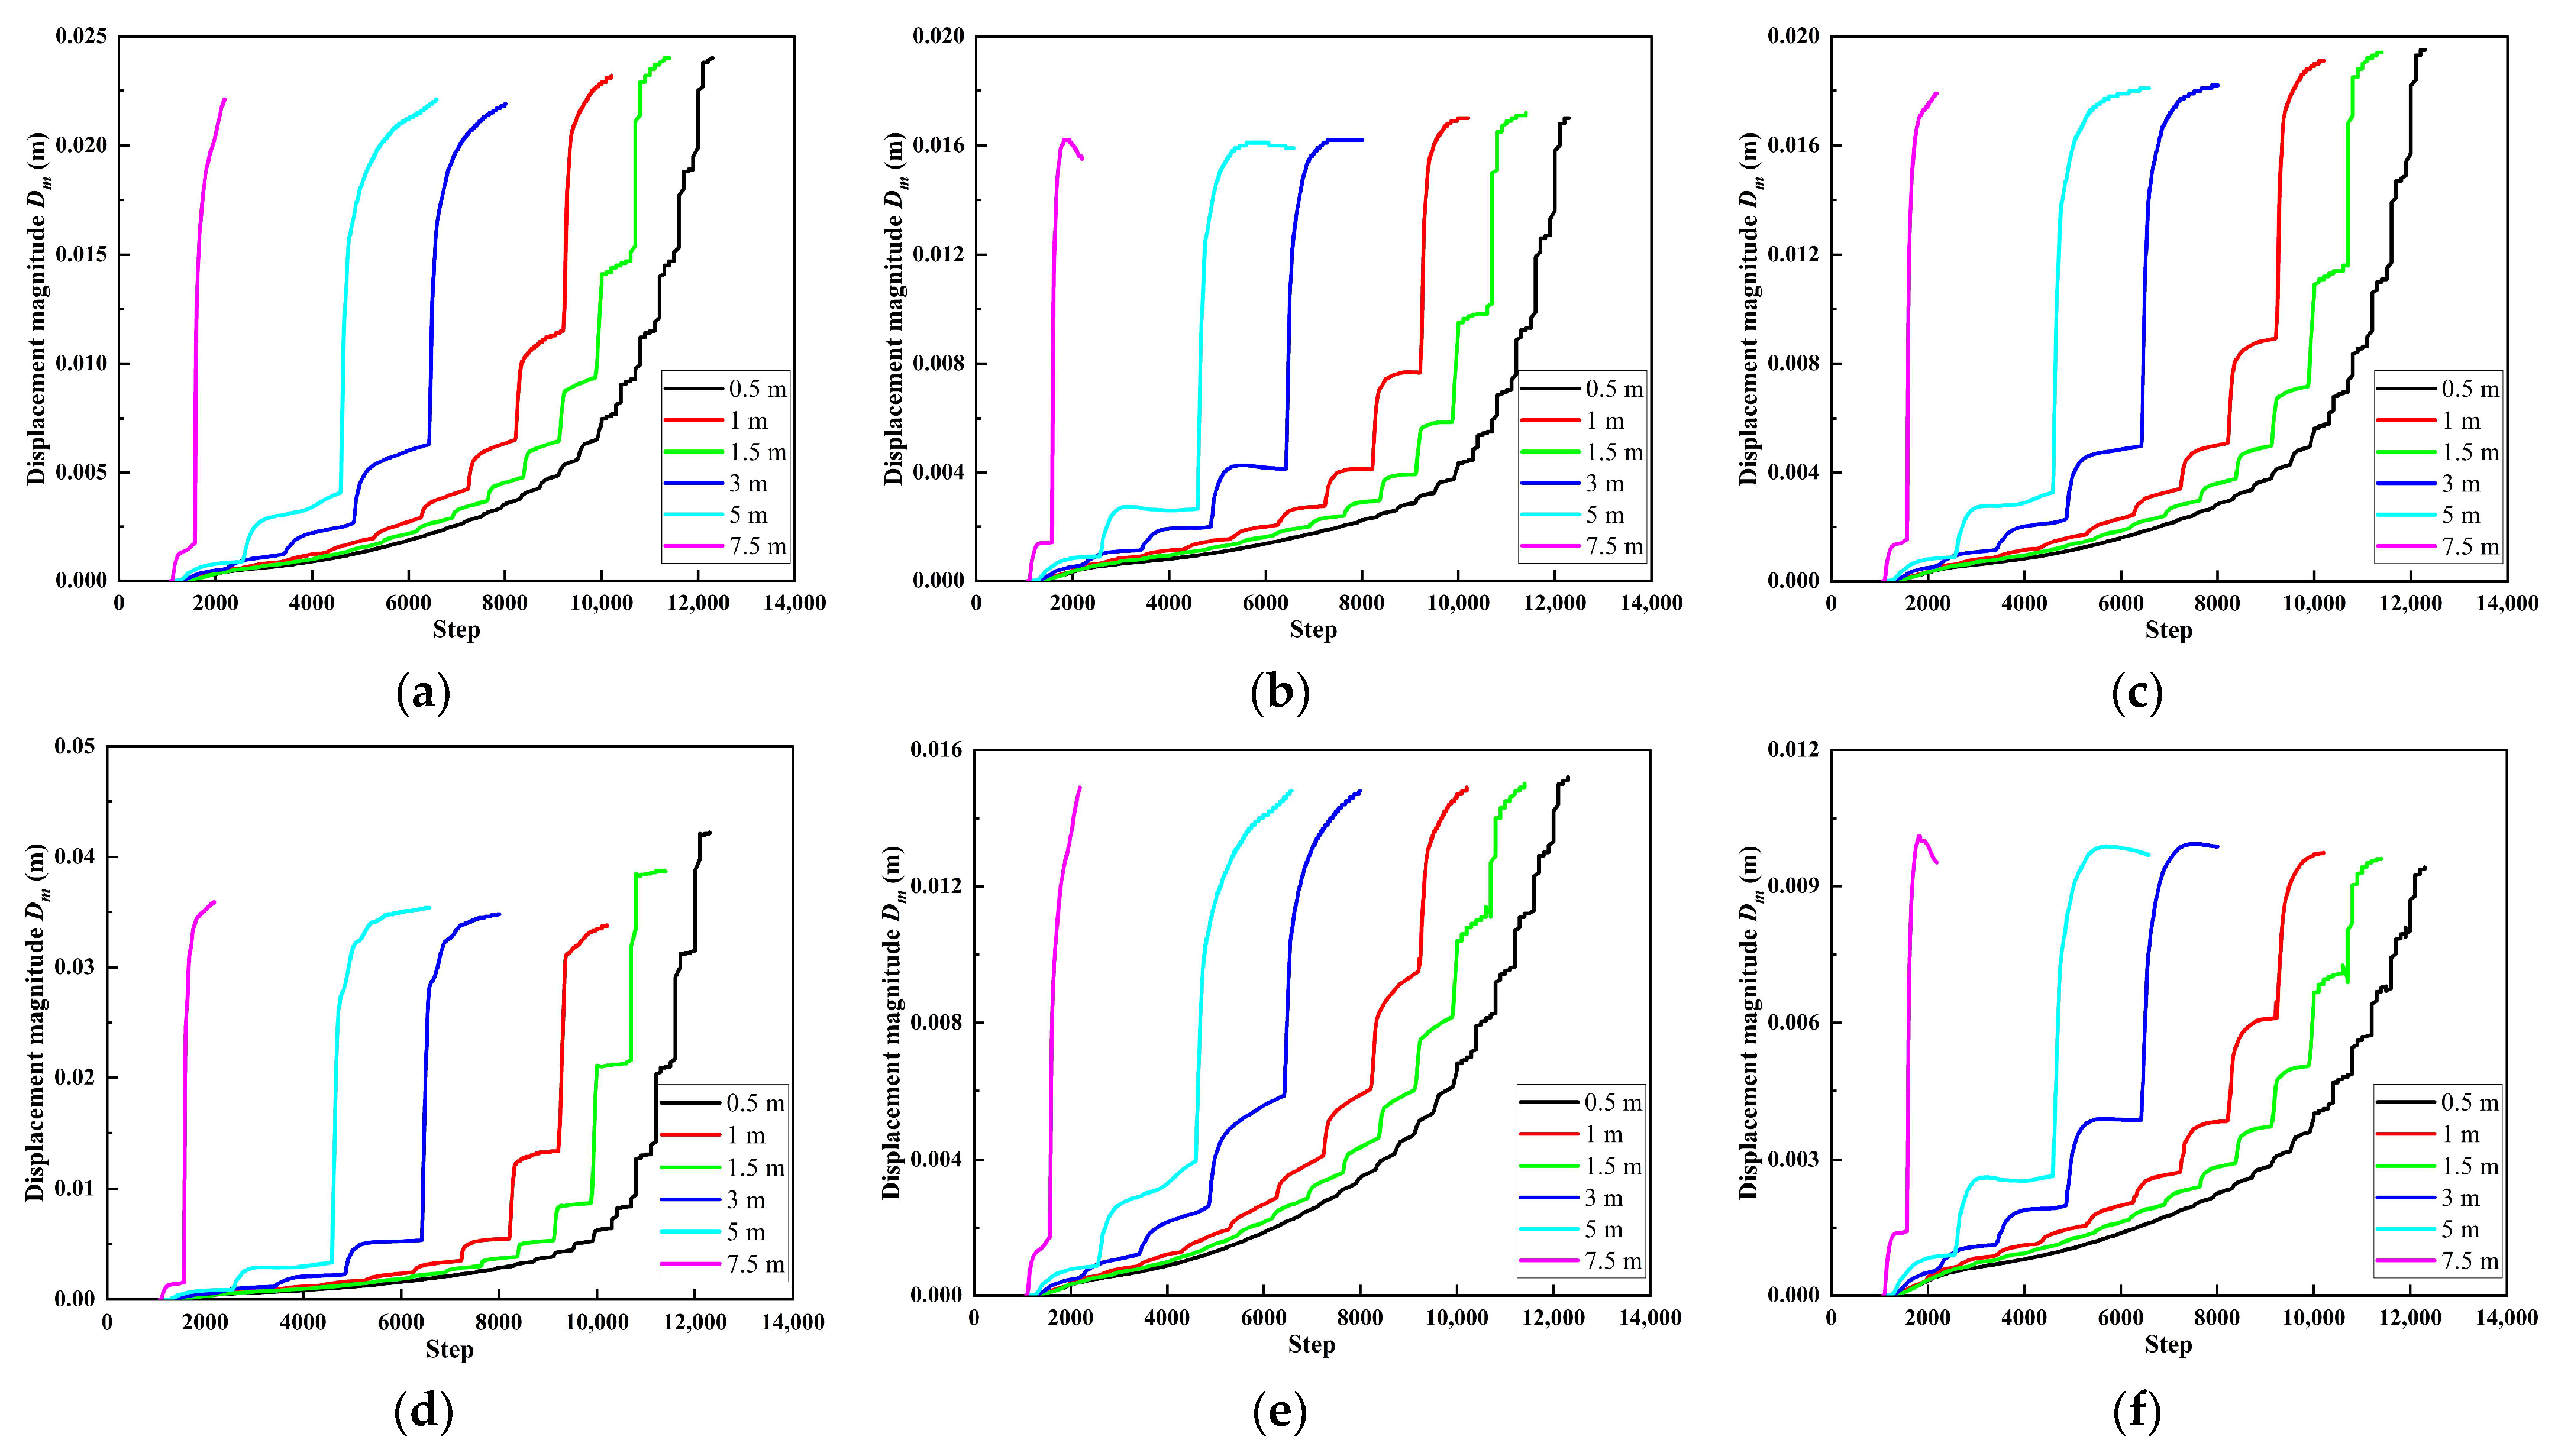
- The maximum displacement is positively correlated with the calculated steps, and is distributed in the center of the roof and the center of the sidewall at the initial excavation position of the tunnel. The displacement is closely related to the length of CF and shows a significant “segmental decline” characteristic. Therefore, “timely support” is necessary to ensure the stability of the tunnel.
- (2)
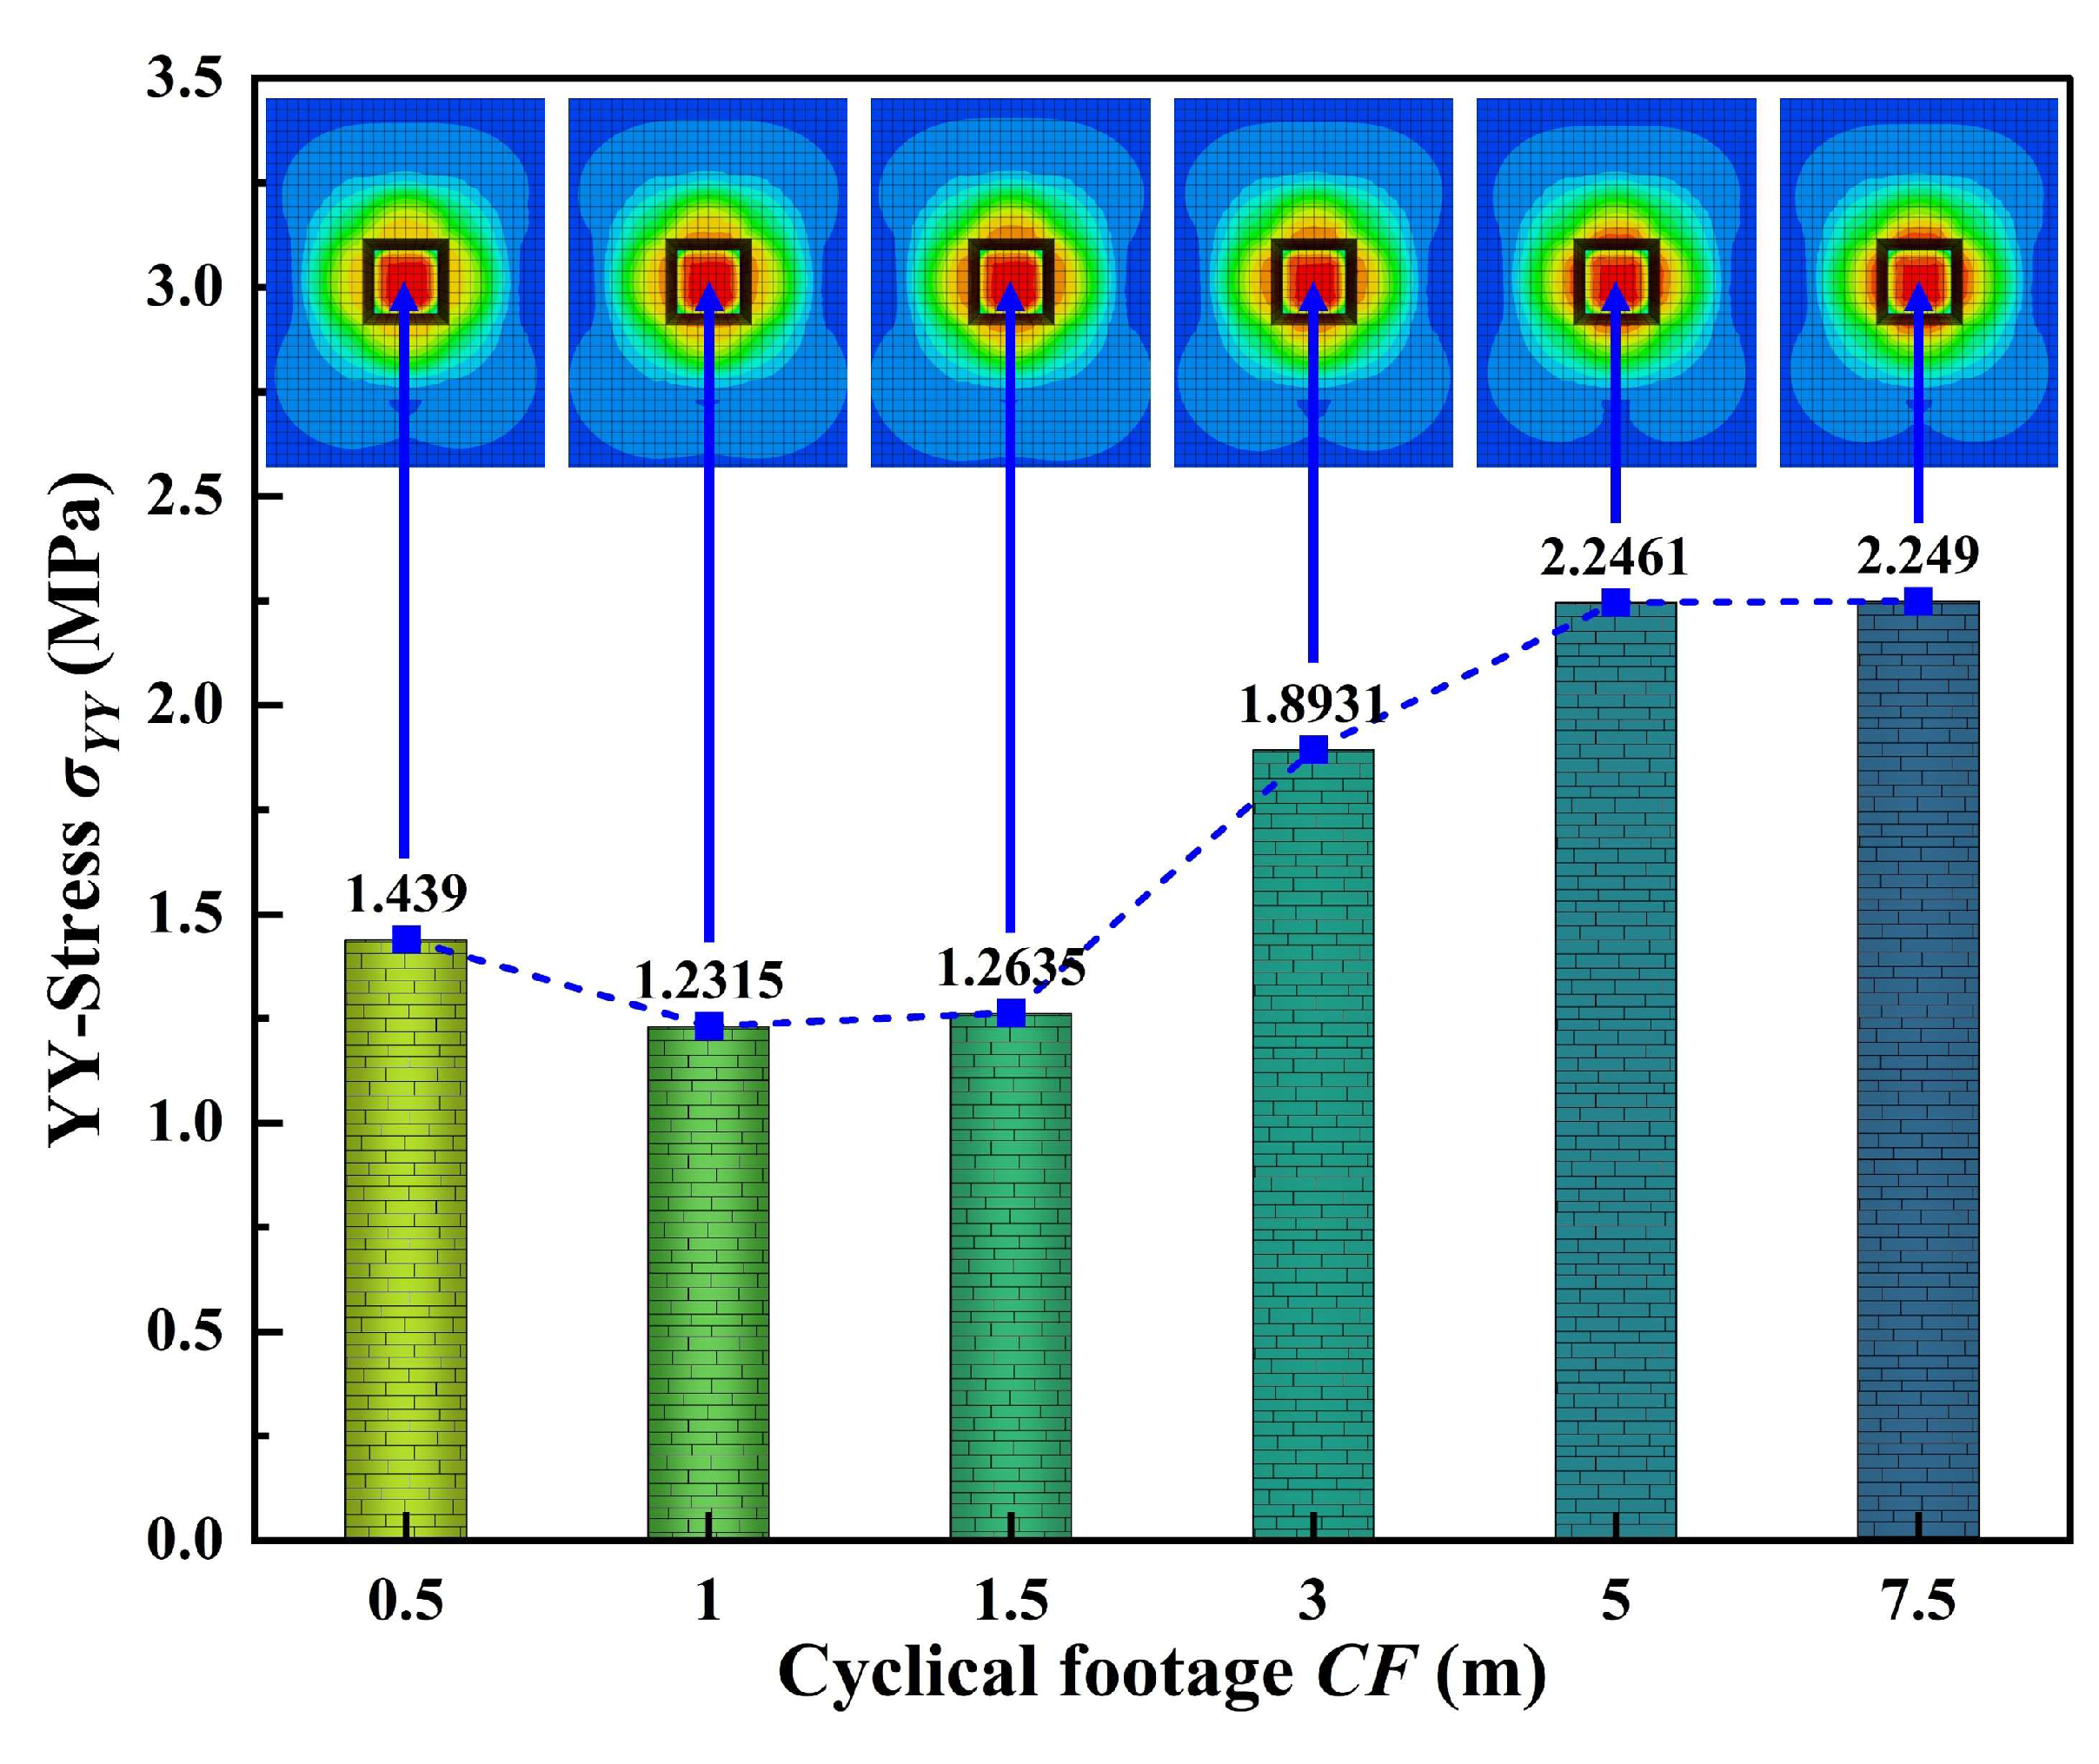
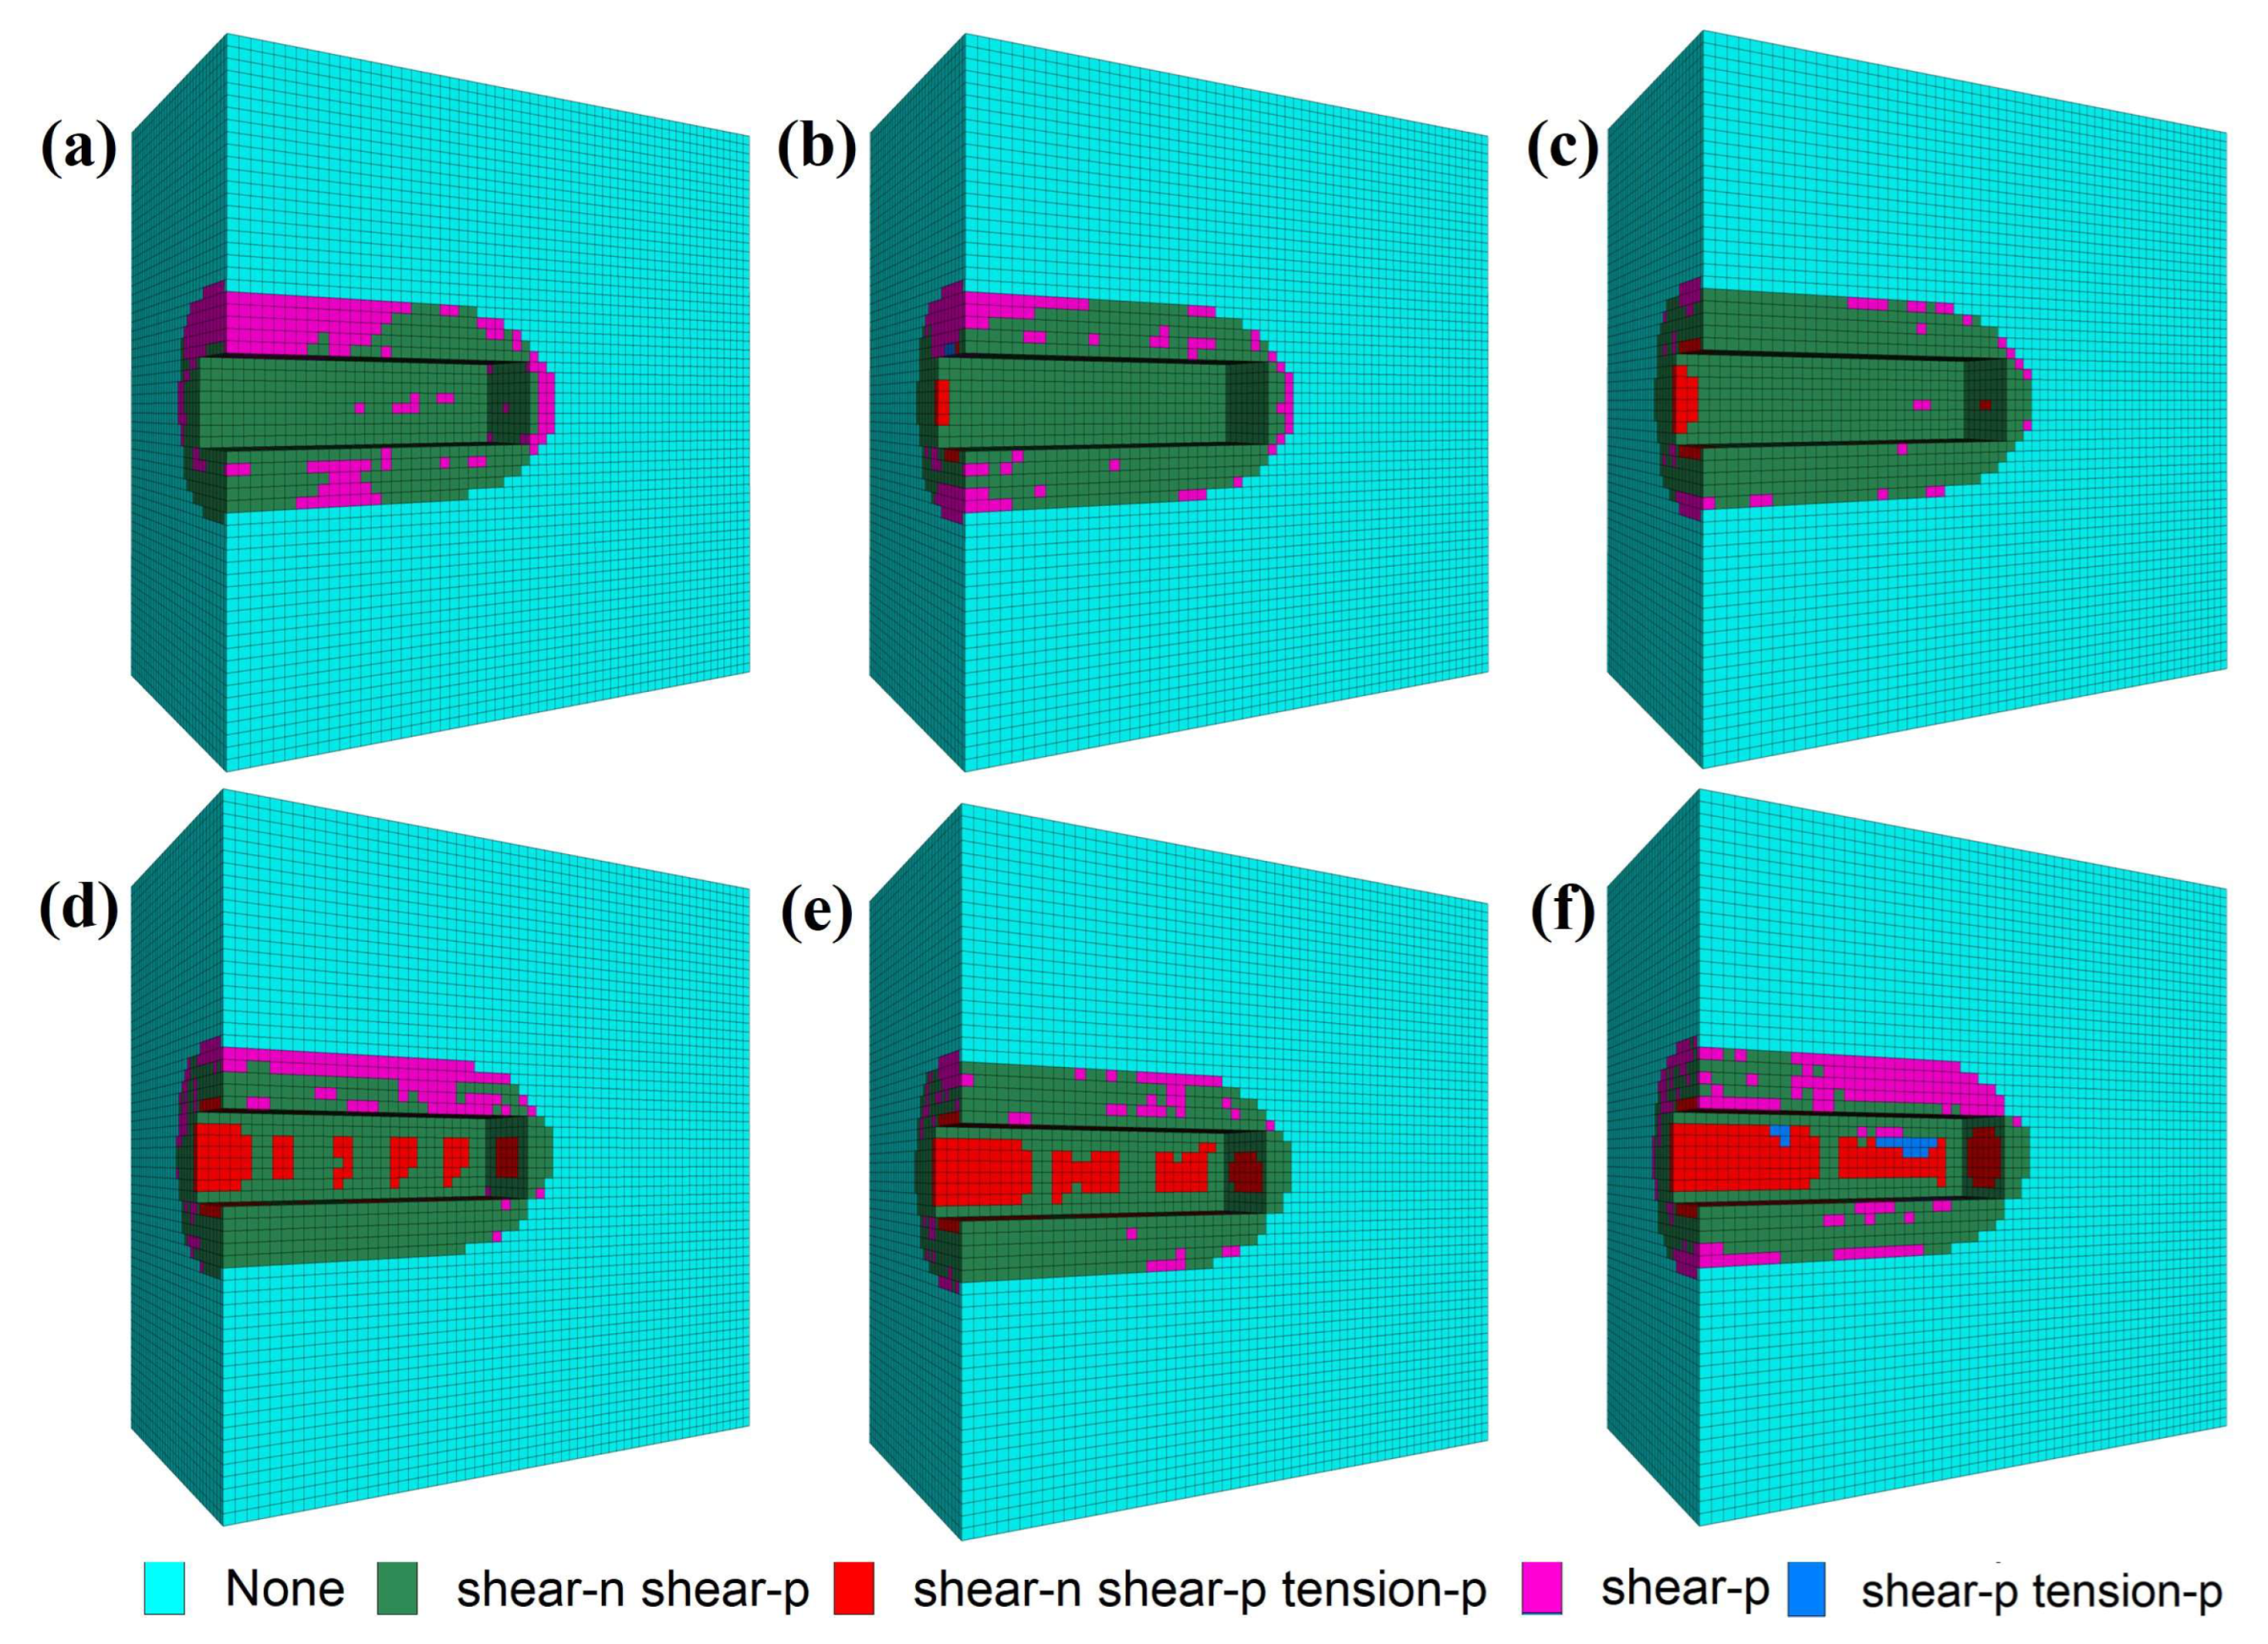
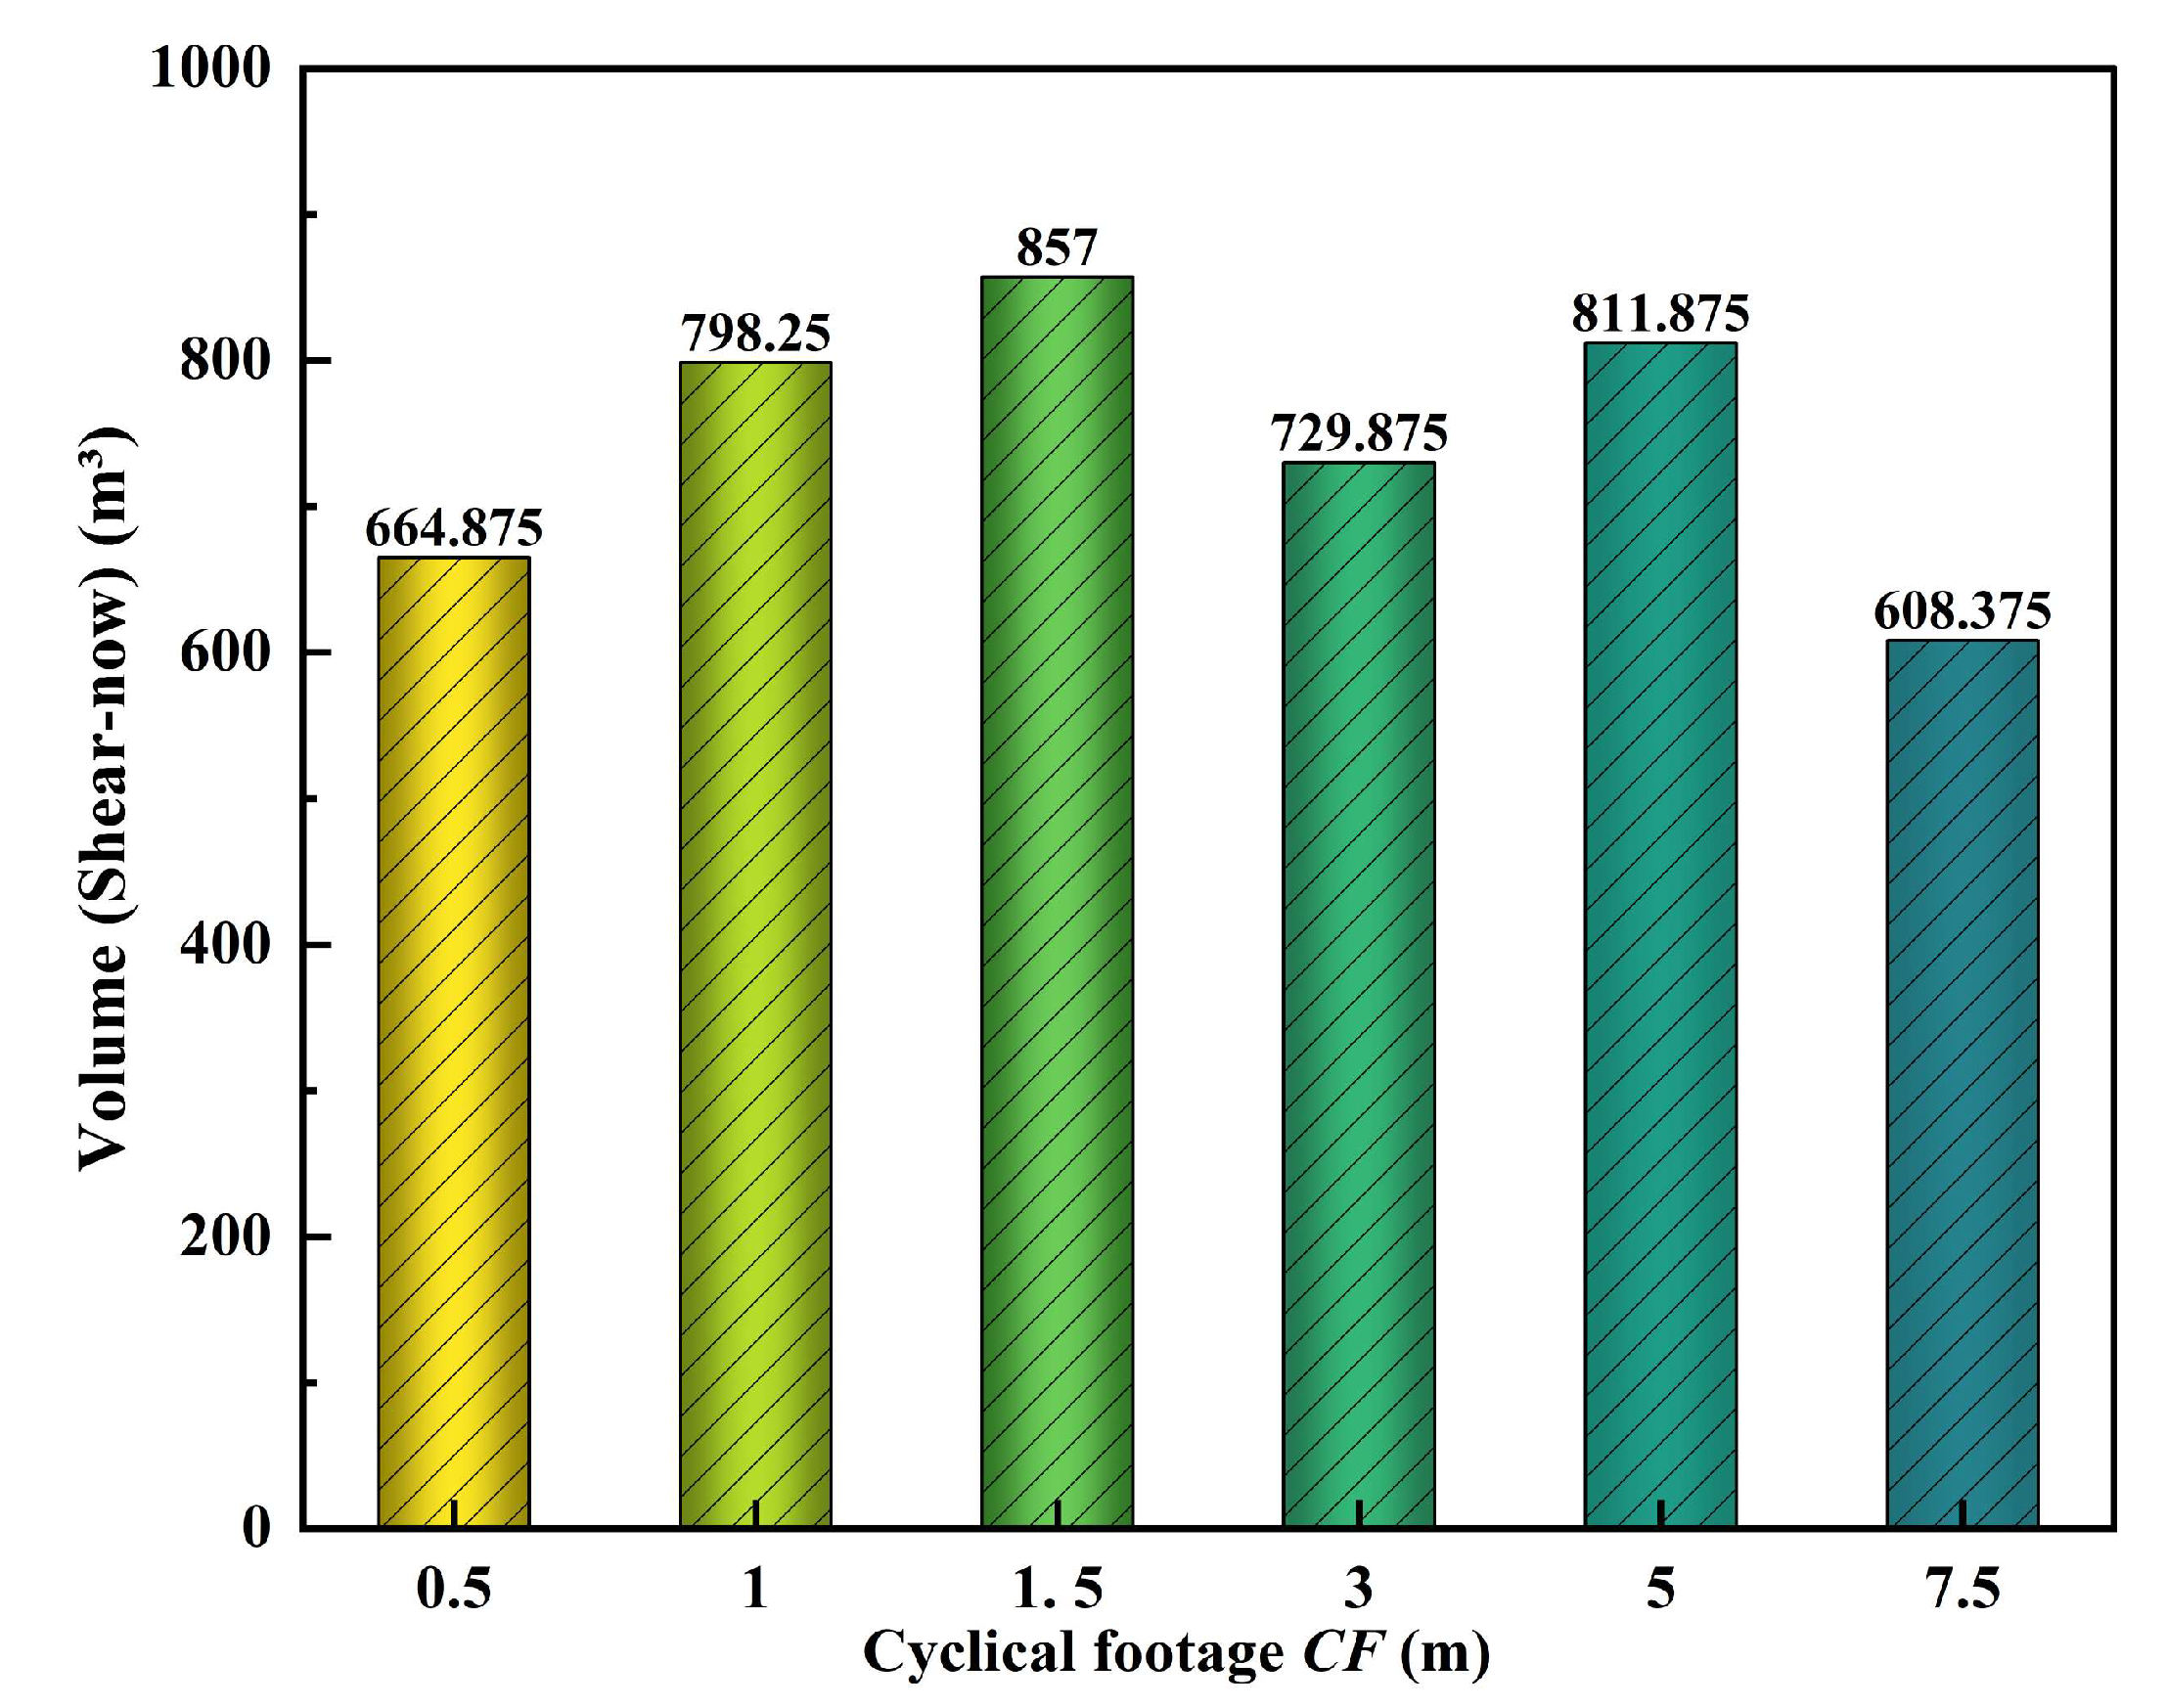
- The maximum displacement in the tunnel face direction exists at the center of the tunnel face, and its displacement shows a trend of first decreasing and then increasing with the increase of CF. Under the conditions of this simulation, the plastic zone with CF length of 1.5 m is the most homogeneous, which is basically “shear-now” and has a volume of 857 m3.
- (3)
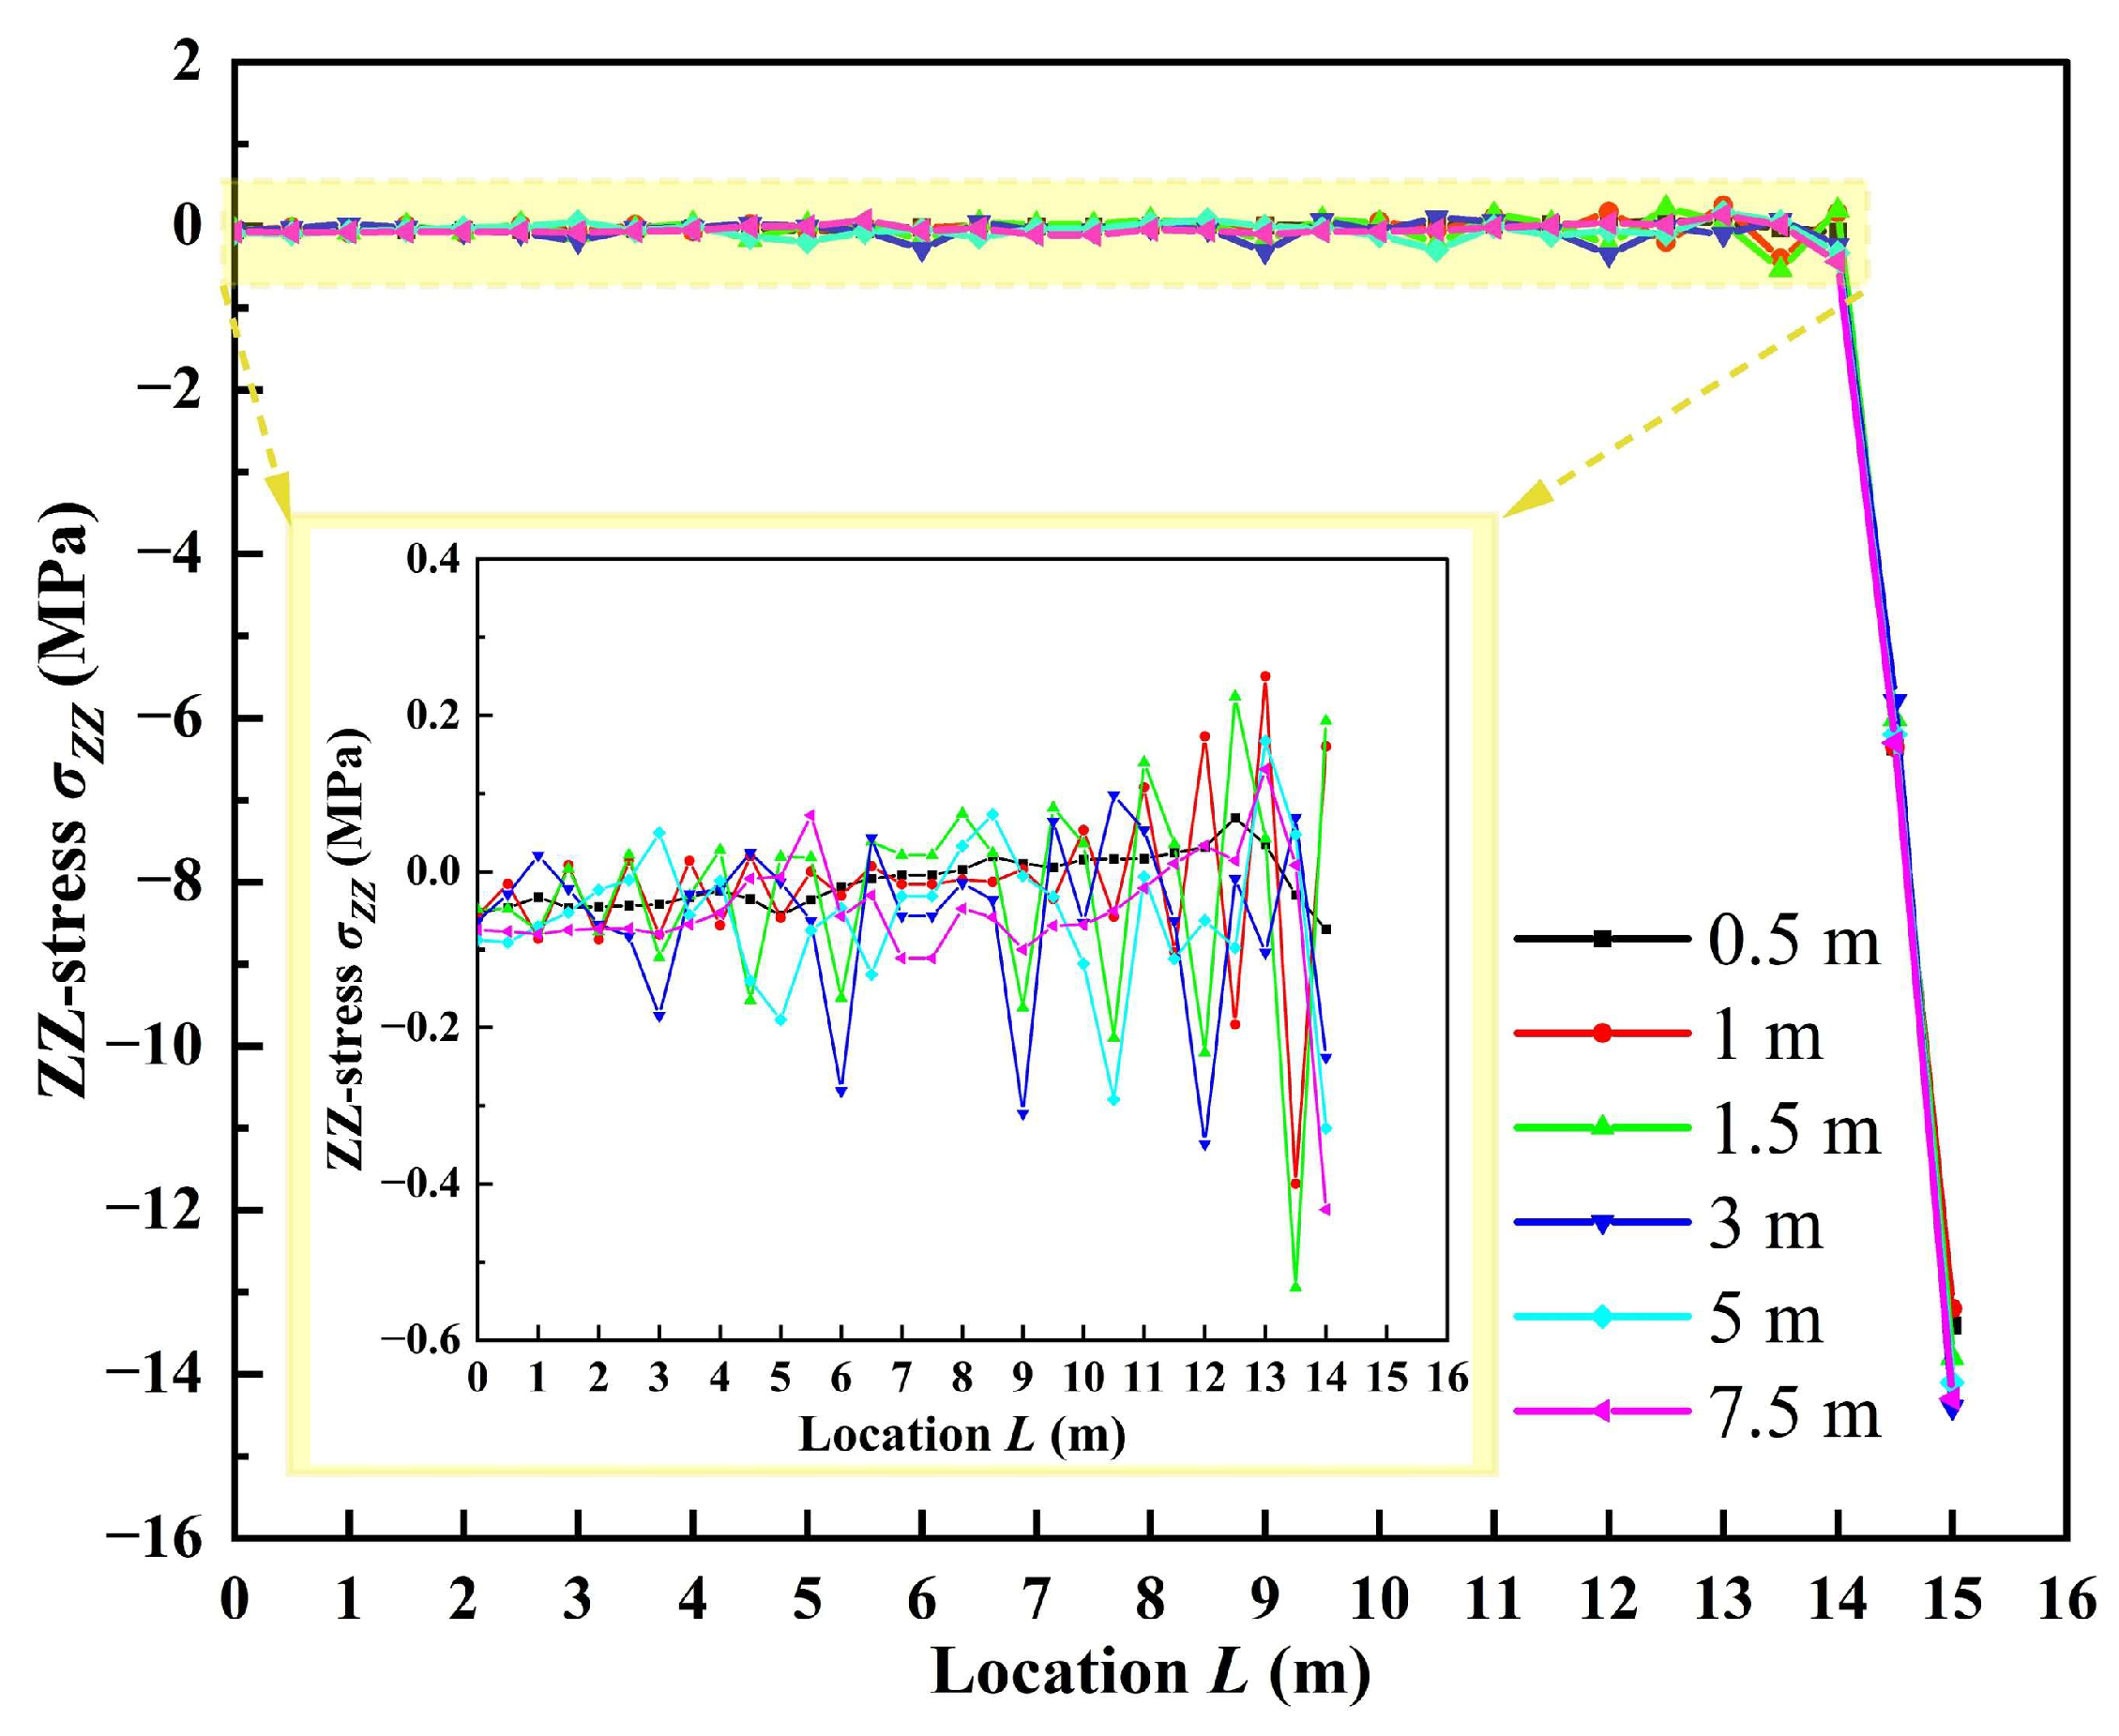
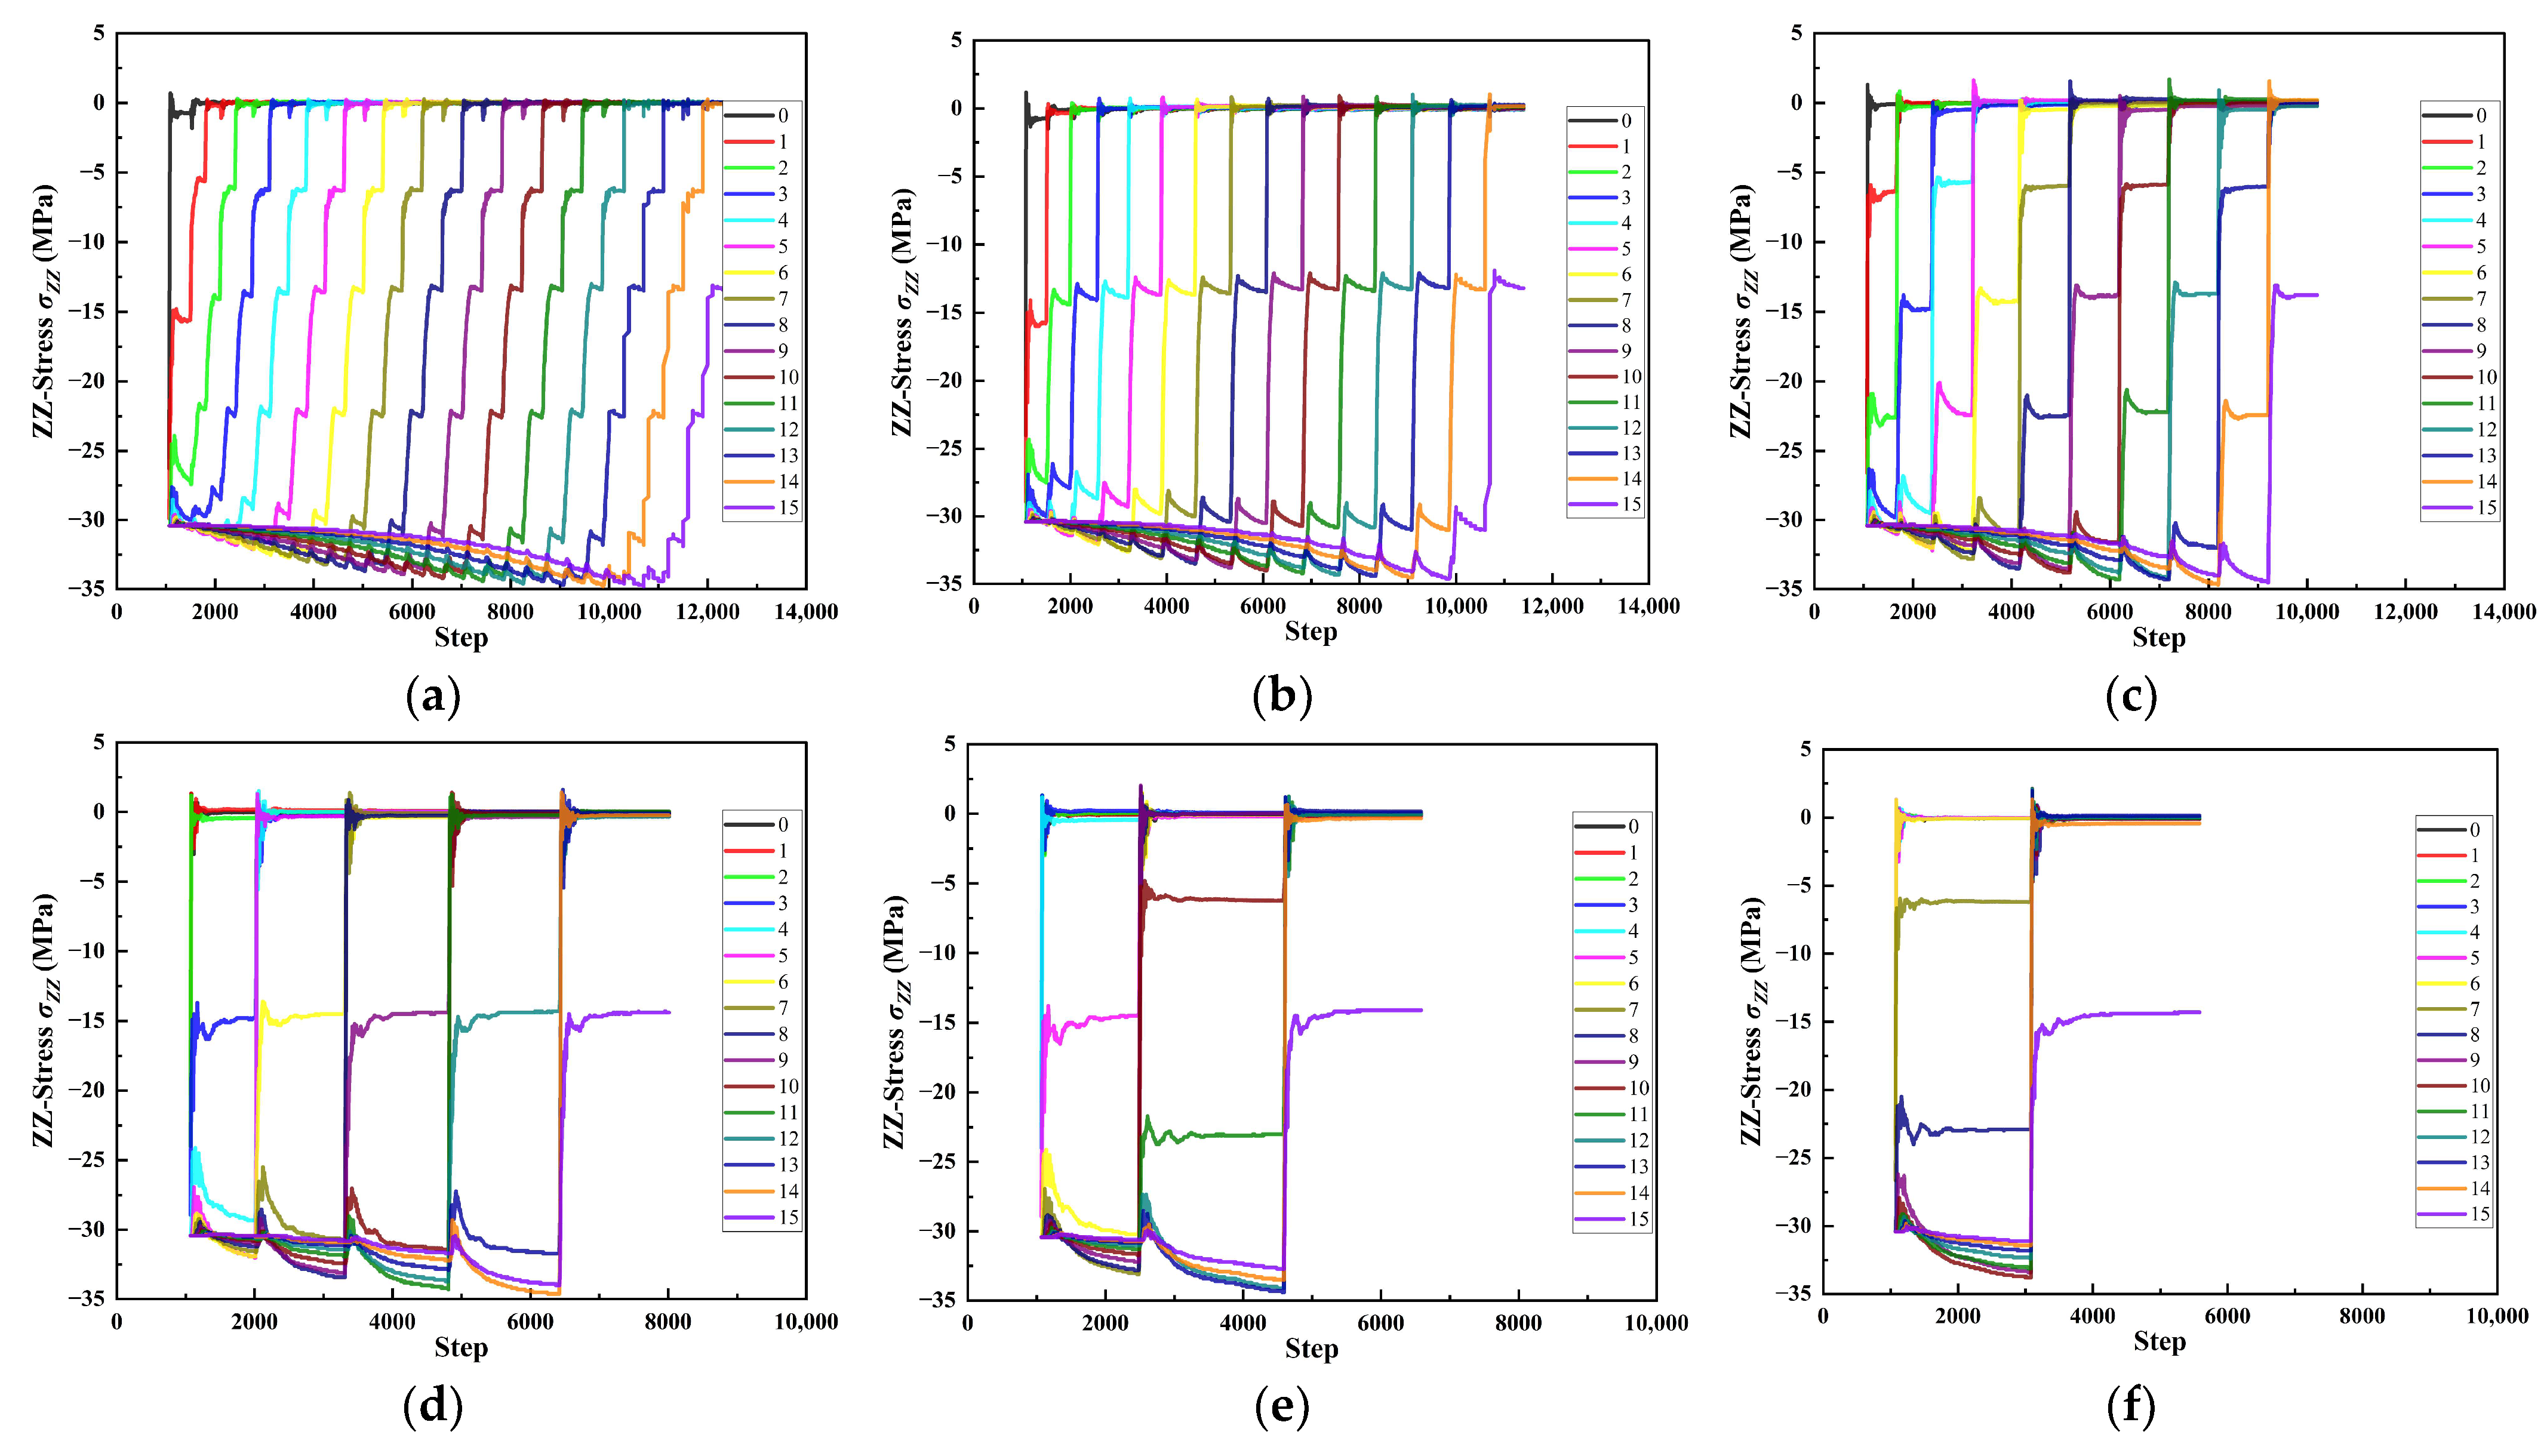
- The CF length has less influence on the vertical stress release process (spatial effect of excavation) of the tunnel roof, and the stress release is basically completed at a distance of about 1 m from the working face (Under the conditions of this simulation), so it is recommended that the tunnel support should lag behind the working face by more than 1 m.
- (4)
- According to the stability analysis results (displacement, stress, plastic zone, etc.) under different cyclical footage lengths, combined with engineering practice and economic, time efficiency, it is considered that 1.5 m is the best cyclical footage length under the model established in this study. The optimal CF under other engineering conditions can be determined by referring to the ideas in this article.
Author Contributions
Funding
Institutional Review Board Statement
Informed Consent Statement
Data Availability Statement
Acknowledgments
Conflicts of Interest
References
- Zoo, Y.; Lee, W.S.; Kim, C.-Y. The Influence of the Round Length on the Stability of Tunnel Face and Unsupported Span. In Underground Space Use. Analysis of the Past and Lessons for the Future, Two Volume Set; CRC Press: Boca Raton, FL, USA, 2005; pp. 231–236. ISBN 0-429-10748-X. [Google Scholar]
- Baudendistel, M. Significance of the Usupported Span in Tunnelling. Signif. Usupported Span Tunn. 1985, 85, 103–108. [Google Scholar]
- Liang, Q.; Sun, Z.B.; Pan, Q.J. Analysis of Round Length Based on Upper Bound Method and Limit Equilibrium in Tunnel Excavation. China J. Highw. Transp. 2016, 29, 96. [Google Scholar]
- He, M.; Xie, H.; Peng, S.; Jiang, Y.-D. Study on Rock Mechanics in Deep Mining Engineering. Yanshilixue Yu Gongcheng XuebaoChin. J. Rock Mech. Eng. 2005, 24, 2803–2813. [Google Scholar]
- Fairhurst, C. Some Challenges of Deep Mining. Engineering 2017, 3, 527–537. [Google Scholar] [CrossRef]
- Zhi-da, W.; Xiao-nan, G. Calculation method of digging length in underpass with underground excavation under shallow cover. Rock Soil Mech. 2010, 31, 2637–2642. [Google Scholar]
- Hoek, E. Estimating Mohr-Coulomb Friction and Cohesion Values from the Hoek-Brown Failure Criterion. Int. J. Rock Mech. Min. Sci. Géoméch. Abstr. 1990, 27, 227–229. [Google Scholar] [CrossRef]
- Hoek, E.; Brown, E.T. Practical Estimates of Rock Mass Strength. Int. J. Rock Mech. Min. Sci. 1997, 34, 1165–1186. [Google Scholar] [CrossRef]
- Carranza-Torres, C.; Fairhurst, C. The Elasto-Plastic Response of Underground Excavations in Rock Masses That Satisfy the Hoek–Brown Failure Criterion. Int. J. Rock Mech. Min. Sci. 1999, 36, 777–809. [Google Scholar] [CrossRef]
- Da, L.I.; Yong-sheng, L.I.; Zhan-fu, L.U.O. Study of Footage Optimization Method of Tunneling Cycle under Complicated Conditions. Rock Soil Mech. 2013, 34, 498–502. [Google Scholar]
- Meguid, M.A.; Saada, O.; Nunes, M.A.; Mattar, J. Physical Modeling of Tunnels in Soft Ground: A Review. Tunn. Undergr. Space Technol. 2008, 23, 185–198. [Google Scholar] [CrossRef]
- Zhao, X.; Jiang, J.; Lan, B. An Integrated Method to Calculate the Spatial Distribution of Overburden Strata Failure in Longwall Mines by Coupling GIS and FLAC3D. Int. J. Min. Sci. Technol. 2015, 25, 369–373. [Google Scholar] [CrossRef]
- Lee, Y.-Z.; Schubert, W. Determination of the Round Length for Tunnel Excavation in Weak Rock. Tunn. Undergr. Space Technol. 2008, 23, 221–231. [Google Scholar] [CrossRef]
- Yan, S.; Wang, R.; Bai, J.; Wu, W.; Elmo, D. An Alternative Approach to Determine Cycle Length of Tunnel Excavation in Coal Mines. J. Ambient Intell. Humaniz. Comput. 2020, 11, 553–560. [Google Scholar] [CrossRef]
- Skrzypkowski, K.; Zagórski, K.; Zagórska, A.; Apel, D.B.; Wang, J.; Xu, H.; Guo, L. Choice of the Arch Yielding Support for the Preparatory Tunnel Located near the Fault. Energies 2022, 15, 3774. [Google Scholar] [CrossRef]
- Liang, Q.; Liu, J.; Wang, J.; Zeng, X.-T.; Wu, S.-G. Three-Dimensional Stability of Cyclical Footage Area in Tunnel Face. KSCE J. Civ. Eng. 2022, 26, 955–965. [Google Scholar] [CrossRef]
- Chen, W.; Ma, H.; Shen, Z.; Wang, D. Experiment Research on the Rock Blasting Effect with Radial Jet Cracker. Tunn. Undergr. Space Technol. 2015, 49, 249–252. [Google Scholar] [CrossRef]
- Goh, A.T.C.; Fan, Z.; Wengang, Z.; Yanmei, Z.; Hanlong, L. A Simple Estimation Model for 3D Braced Excavation Wall Deflection. Comput. Geotech. 2017, 83, 106–113. [Google Scholar] [CrossRef]
- Shin, S.-J.; Shin; Cho, K.H.; Seo, D.-H. A study on the increasing advance length by pre-supported tunnelling method in heavily fractured rock condition. J. Korean Urban Railw. Soc. 2018, 6, 111–123. [Google Scholar] [CrossRef]
- Jin, C.J. Park Analysis of Monthly Excavation Length Depending on Ground Condition and TBM Diameter. J. Korean Soc. Disaster Inf. 2014, 10, 141–150. [Google Scholar]
- Si, J.; Li, L.; Cheng, J.; Wang, Y.; Hu, W.; Li, T.; Li, Z. Characteristics of Airflow Reversal of Excavation Tunnel after a Coal and Gas Outburst Accident. Energies 2021, 14, 3645. [Google Scholar] [CrossRef]
- Tian, X.; Song, Z.; Zhou, G.; Zhang, X. A Theoretical Calculation Method of the Unsupported Span for the Shallow Tunnel in the Soft Stratum. Adv. Civ. Eng. 2020, 2020, 7989036. [Google Scholar] [CrossRef]
- Mahdevari, S.; Khodabakhshi, M.B. A Hybrid PSO-ANFIS Model for Predicting Unstable Zones in Underground Tunnels. Tunn. Undergr. Space Technol. 2021, 117, 104167. [Google Scholar] [CrossRef]
- Mo, S.; Sheffield, P.; Corbett, P.; Ramandi, H.L.; Oh, J.; Canbulat, I.; Saydam, S. A Numerical Investigation into Floor Buckling Mechanisms in Underground Coal Mine Tunnels. Tunn. Undergr. Space Technol. 2020, 103, 103497. [Google Scholar] [CrossRef]
- Mandal, P.K.; Das, A.J.; Kumar, N.; Bhattacharjee, R.; Tewari, S.; Kushwaha, A. Assessment of Roof Convergence during Driving Tunnels in Underground Coal Mines by Continuous Miner. Int. J. Rock Mech. Min. Sci. 2018, 108, 169–178. [Google Scholar] [CrossRef]
- Darvishi, A.; Ataei, M.; Rafiee, R. Investigating the Effect of Simultaneous Extraction of Two Longwall Panels on a Maingate Gateroad Stability Using Numerical Modeling. Int. J. Rock Mech. Min. Sci. 2020, 126, 104172. [Google Scholar] [CrossRef]
- Zhai, Y. An Update of the 3D Analytical Solution for the Design of Barricades Made of Waste Rocks. Int. J. Rock Mech. Min. Sci. 2022, 158, 105176. [Google Scholar] [CrossRef]
- Itasca Consulting Group. FLAC3D: Fast Lagrangian Analysis of Continua in 3 Dimensions; Itasca Consulting Group: Minneapolis, MN, USA, 2013; pp. 175–180. Available online: https://search.worldcat.org/title/flac3d-fast-lagrangian-analysis-of-continua-in-3-dimensions/oclc/50411345 (accessed on 6 July 2025).
- Cameron-Clarke, I.S.; Budavari, S. Correlation of Rock Mass Classification Parameters Obtained from Borecore and In-Situ Observations. Eng. Geol. 1981, 17, 19–53. [Google Scholar] [CrossRef]
- Hou, M.Z.; Li, M.; Gou, Y.; Feng, W. Numerical Simulation and Evaluation of the Fracturing and Tight Gas Production with a New Dimensionless Fracture Conductivity (FCD) Model. Acta Geotech. 2021, 16, 985–1000. [Google Scholar] [CrossRef]
- Labuz, J.F.; Zang, A. Mohr–Coulomb Failure Criterion. Rock Mech. Rock Eng. 2012, 45, 975–979. [Google Scholar] [CrossRef]
- Toupin, R.A. Saint-Venant’s Principle. Arch. Ration. Mech. Anal. 1965, 18, 83–96. [Google Scholar] [CrossRef]
- Horgan, C.O.; Knowles, J.K. Recent Developments Concerning Saint-Venant’s Principle. In Advances in Applied Mechanics; Hutchinson, J.W., Wu, T.Y., Eds.; Elsevier: Amsterdam, The Netherlands, 1983; Volume 23, pp. 179–269. [Google Scholar]
- Cai, W.; Zhu, H.; Liang, W. Three-Dimensional Stress Rotation and Control Mechanism of Deep Tunneling Incorporating Generalized Zhang–Zhu Strength-Based Forward Analysis. Eng. Geol. 2022, 308, 106806. [Google Scholar] [CrossRef]
- Jie, L.I.U.; EN-yuan, W.; EN-lai, Z.; Wen-quan, X.U.; Shao-bin, H.U. Distribution and Variation of Mining-Induced Stress Field in Deep Workface. J. Min. Saf. Eng. 2014, 31, 60. [Google Scholar]
- Jiang, Z.; Guo, W.; Xie, S. Coal Pillar Size Determination and Surrounding Rock Control for Gob-Side Entry Driving in Deep Soft Coal Seams. Processes 2023, 11, 2331. [Google Scholar] [CrossRef]
- Shan, R.; Li, T.; Liu, W.; Chen, Y.; Shi, S.; Li, G. Study on Asymmetric Support of Anchor Cable with C-Shaped Tube in Inclined Coal Seam Tunnel. Appl. Sci. 2023, 13, 8088. [Google Scholar] [CrossRef]
- Xie, J.; Ning, S.; Zhu, W.; Wang, X.; Hou, T. Influence of Key Strata on the Evolution Law of Mining-Induced Stress in the Working Face under Deep and Large-Scale Mining. Minerals 2023, 13, 983. [Google Scholar] [CrossRef]
- Chen, Z.H. Stress Distribution Characteristics in Rock Surrounding Heading Face and Its Relationship with Temporary Supporting. Appl. Mech. Mater. 2014, 568–570, 1684–1689. [Google Scholar] [CrossRef]
- Stone, R. Design of Primary Ground Support during Tunnel Development Using Empirical Databases. Int. J. Min. Sci. Technol. 2016, 26, 131–137. [Google Scholar] [CrossRef]


| Parameter. | Density (kg/m3) | Young’s Modulus E (GPa) | Poisson Ratio v | Friction ( ) | Cohesion c (MPa) | Tensile Strength (MPa) |
|---|---|---|---|---|---|---|
| Value | 2700 | 5 | 0.3 | 2 | 2 |
| Direction | Part | Maximum (MPa) | Minimum | Feature |
|---|---|---|---|---|
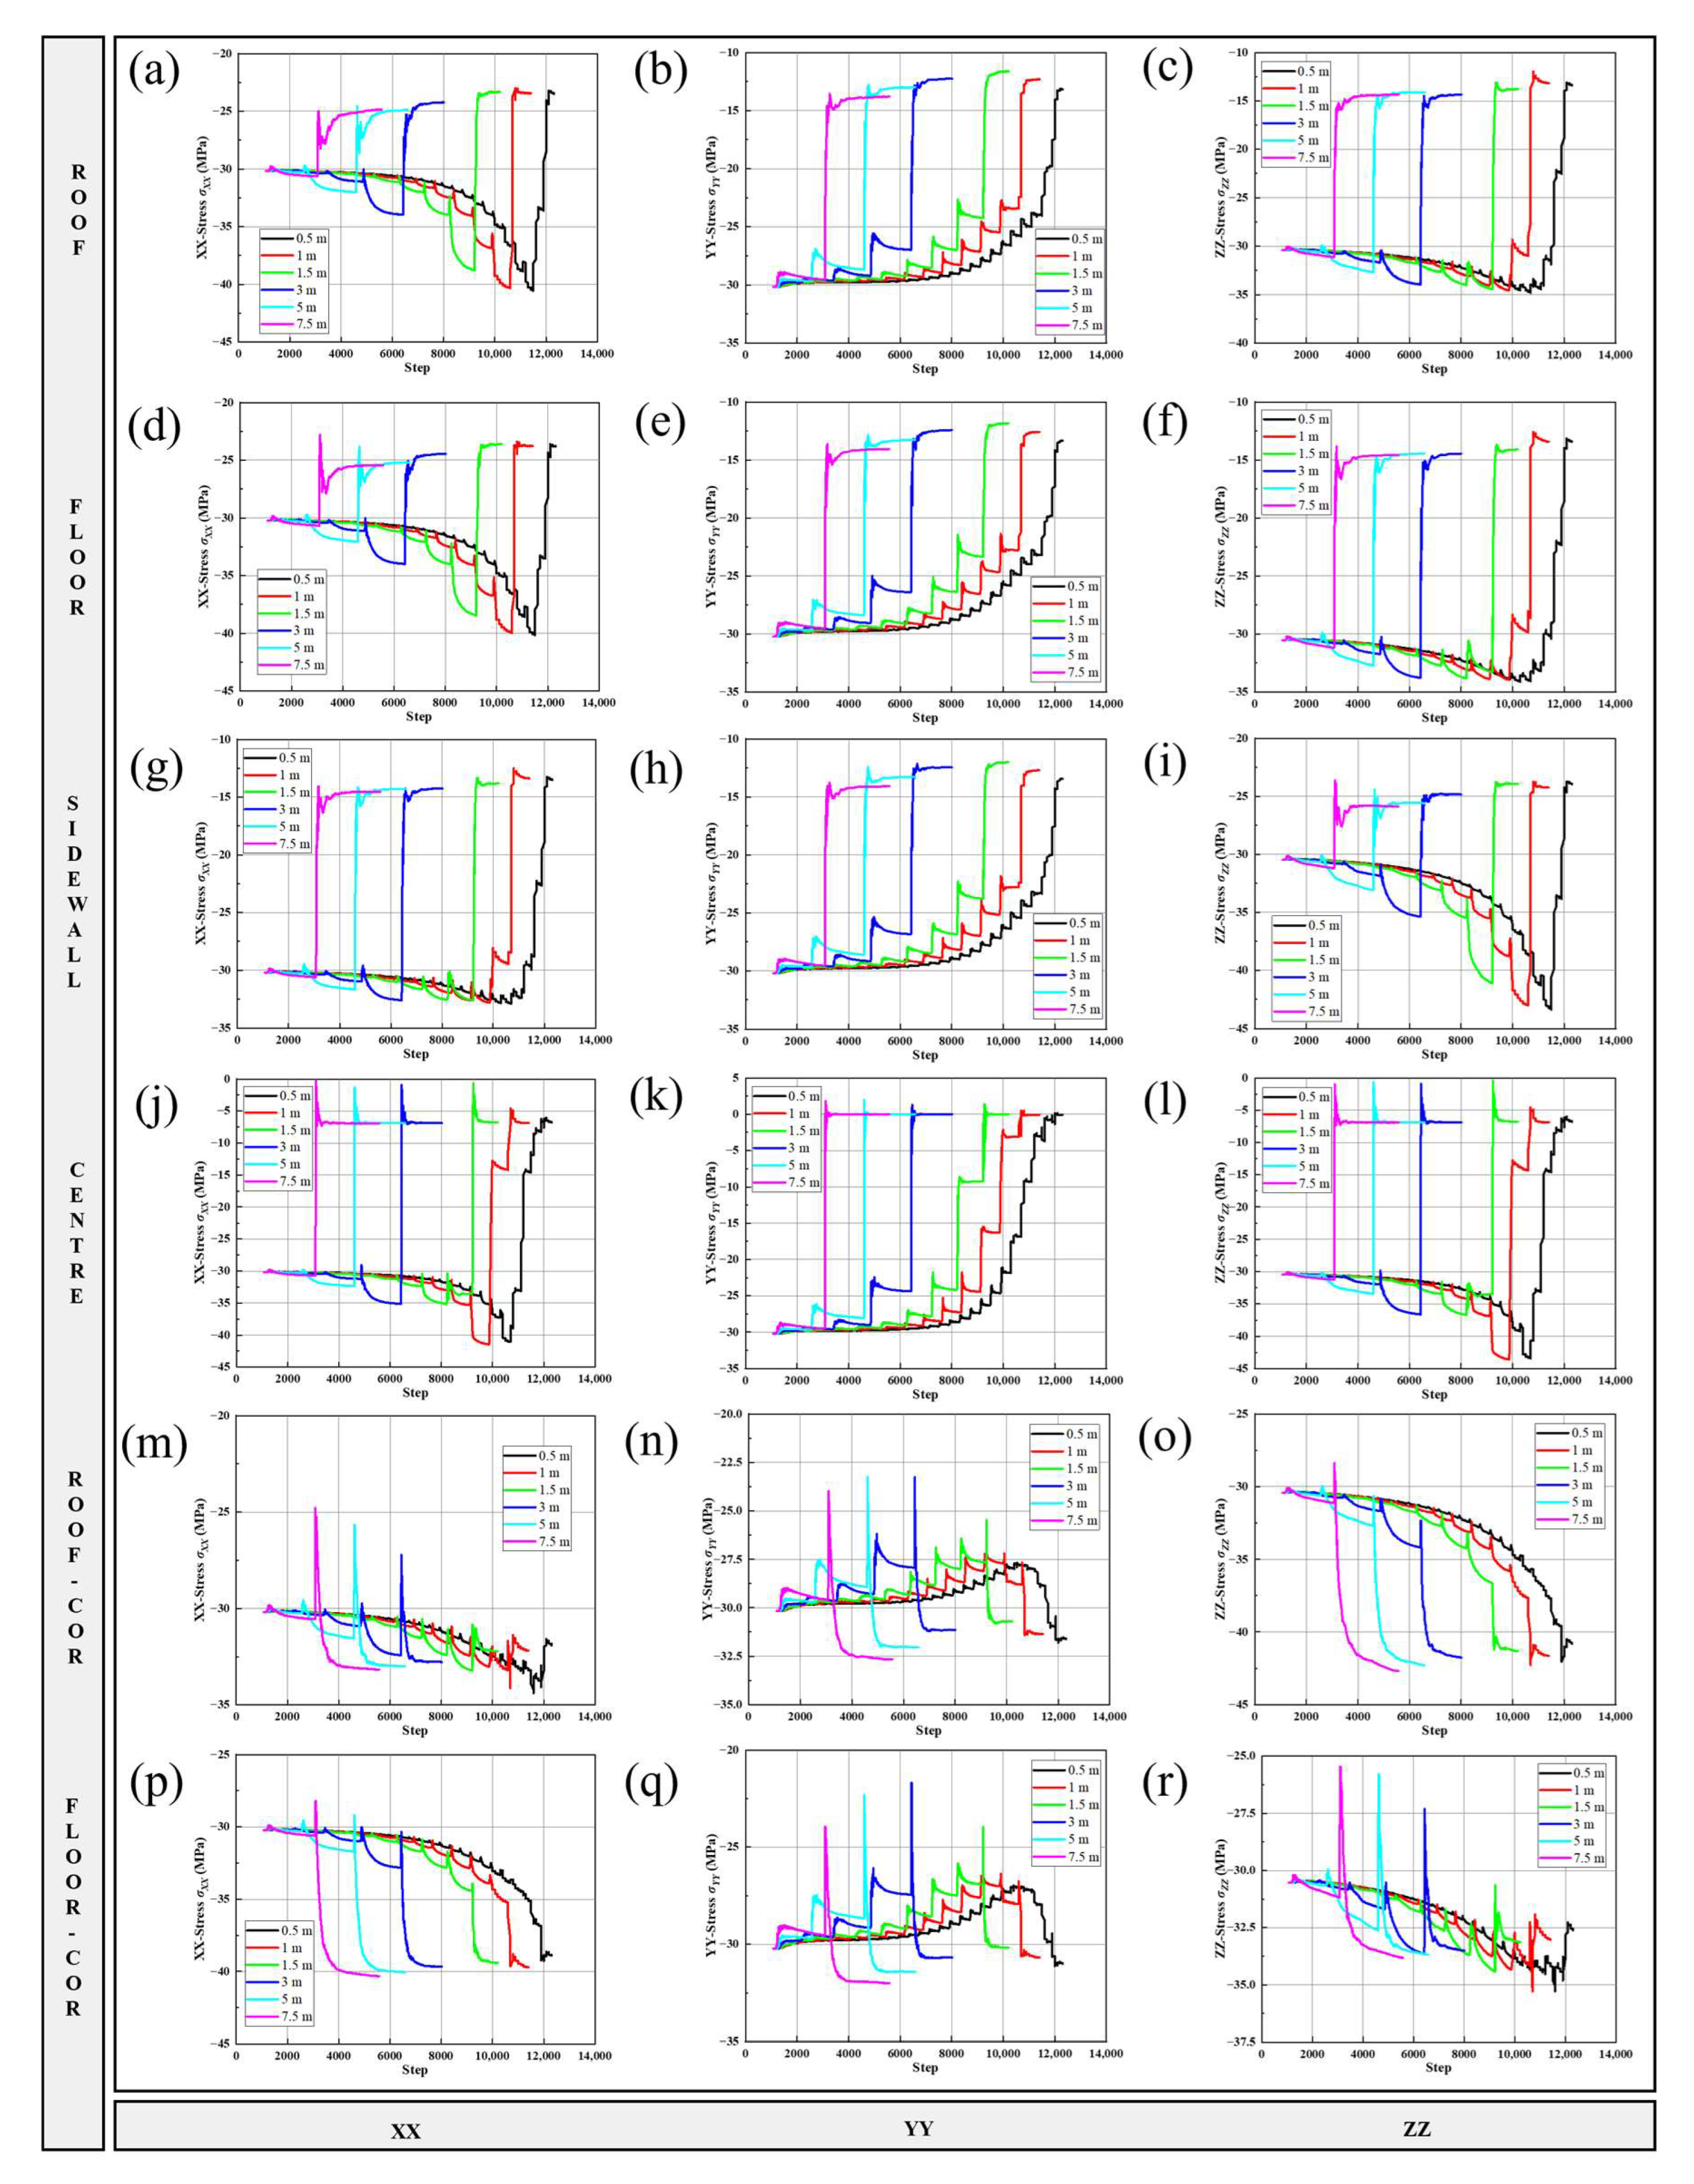
| XX | Roof | 41 | 23 | Increase and then decrease |
| Floor | 30 | 12 | Increase and then decrease | |
| Sidewall | 32.5 | 12.5 | Increase and then decrease | |
| Center | 41 | 7 | Increase and then decrease | |
| Roof-Corner | 34 | 30 | Increase | |
| Floor-Corner | 40 | 30 | Increase | |
| YY | Roof | 30 | 12 | Decrease |
| Floor | 30 | 12 | Decrease | |
| Sidewall | 30 | 12 | Decrease | |
| Center | 30 | 0 | Decrease | |
| Roof-Corner | 33 | 27.5 | Decrease and then increase | |
| Floor-Corner | 32 | 27 | Decrease and then increase | |
| ZZ | Roof | 35 | 13 | Increase and then decrease |
| Floor | 34 | 13 | Increase and then decrease | |
| Sidewall | 43 | 24 | Increase and then decrease | |
| Center | 44 | 7 | Increase and then decrease | |
| Roof-Corner | 42.5 | 30 | Increase | |
| Floor-Corner | 34 | 31 | Increase |
Disclaimer/Publisher’s Note: The statements, opinions and data contained in all publications are solely those of the individual author(s) and contributor(s) and not of MDPI and/or the editor(s). MDPI and/or the editor(s) disclaim responsibility for any injury to people or property resulting from any ideas, methods, instructions or products referred to in the content. |
© 2025 by the authors. Licensee MDPI, Basel, Switzerland. This article is an open access article distributed under the terms and conditions of the Creative Commons Attribution (CC BY) license (https://creativecommons.org/licenses/by/4.0/).
Share and Cite
Li, S.; Dai, B.; Hou, Y.; Li, D. Spatiotemporal Stability Responses of Tunnel Excavation Under Cyclical Footage Impact: A FLAC3D-Based Numerical Study. Appl. Sci. 2025, 15, 7661. https://doi.org/10.3390/app15147661
Li S, Dai B, Hou Y, Li D. Spatiotemporal Stability Responses of Tunnel Excavation Under Cyclical Footage Impact: A FLAC3D-Based Numerical Study. Applied Sciences. 2025; 15(14):7661. https://doi.org/10.3390/app15147661
Chicago/Turabian StyleLi, Shang, Bing Dai, Yuzhou Hou, and Danli Li. 2025. "Spatiotemporal Stability Responses of Tunnel Excavation Under Cyclical Footage Impact: A FLAC3D-Based Numerical Study" Applied Sciences 15, no. 14: 7661. https://doi.org/10.3390/app15147661
APA StyleLi, S., Dai, B., Hou, Y., & Li, D. (2025). Spatiotemporal Stability Responses of Tunnel Excavation Under Cyclical Footage Impact: A FLAC3D-Based Numerical Study. Applied Sciences, 15(14), 7661. https://doi.org/10.3390/app15147661