Article

Study on Reinforcement Technology of Shield Tunnel End and Ground Deformation Law in Shallow Buried Silt Stratum

1
China Railway 20th Bureau Group Southern Engineering Co., Ltd., Guangzhou 511300, China
2
School of Civil Engineering, Inner Mongolia University of Science and Technology, Baotou 014010, China
*
Authors to whom correspondence should be addressed.
Appl. Sci. 2025, 15(14), 7657; https://doi.org/10.3390/app15147657
Submission received: 29 April 2025 / Revised: 29 June 2025 / Accepted: 4 July 2025 / Published: 8 July 2025

Abstract

Featured Application

To investigate the reinforcement technology and soil disturbance evolution at the shield launching section in a shallow-buried muddy soil layer, this study takes the launching section of the Guanggang New City depot access tunnel on Guangzhou Metro Line 10 as the engineering background. By applying MIDAS/GTS numerical simulation, settlement monitoring, and theoretical analysis, the reinforcement technology at the tunnel face, the spatiotemporal evolution of ground settlement, and the mechanism of soil disturbance transmission during the launching process in silty strata are revealed.

Abstract

With the rapid advancement of urban underground space development, shield tunnel construction has seen a significant increase. However, at the initial launching stage of shield tunnels in shallow-buried weak strata, engineering risks such as face instability and sudden surface settlement frequently occur. At present, there are relatively few studies on the reinforcement technology of the initial section of shield tunnel in shallow soft ground and the evolution law of ground disturbance. This study takes the launching section of the Guanggang New City depot access tunnel on Guangzhou Metro Line 10 as the engineering background. By applying MIDAS/GTS numerical simulation, settlement monitoring, and theoretical analysis, the reinforcement technology at the tunnel face, the spatiotemporal evolution of ground settlement, and the mechanism of soil disturbance transmission during the launching process in muddy soil layer are revealed. The results show that: (1) the reinforcement scheme combining replacement filling, high-pressure jet grouting piles, and soil overburden counterpressure significantly improves surface settlement control. The primary influence zone is concentrated directly above the shield machine and in the forward excavation area. (2) When the shield machine reaches the junction between the reinforced and unreinforced zones, a large settlement area forms, with the maximum ground settlement reaching −26.94 mm. During excavation in the unreinforced zone, ground deformation mainly occurs beneath the rear reinforced section, with subsidence at the crown and uplift at the invert. (3) The transverse settlement trough exhibits a typical Gaussian distribution and the discrepancy between the measured maximum settlement and the numerical and theoretical values is only 3.33% and 1.76%, respectively. (4) The longitudinal settlement follows a trend of initial increase, subsequent decrease, and gradual stabilization, reaching a maximum when the excavation passes directly beneath the monitoring point. The findings can provide theoretical reference and engineering guidance for similar projects.

1. Introduction

With increasing pressure on surface transportation, urban rail transit has developed rapidly in recent years. As a core tunneling method, shield construction involves complex cross-process operations and poses high risks, particularly during the launching and reception stages. These stages are prone to accidents due to intensive ground disturbances and challenging working conditions. Statistics show that approximately 70% of accidents during shield construction occur at tunnel faces [1,2], especially in soft ground where excessive surface settlement and surrounding rock instability are more likely. Therefore, studying reinforcement technologies and deformation mechanisms for shield launching in muddy soil layer is of significant theoretical and practical value.
Regarding reinforcement techniques for shield launching sections, Wang Tianming et al. [3] summarized commonly used methods and their suitability for various ground conditions, based on soil equilibrium theory. Shi Weiyun [4], using the second phase of the Zhengzhou Metro suburban railway project as an example, explored the application of high-pressure jet grouting in clayey ground, analyzing the reinforcement mechanism and the construction process. Ding Wantao et al. [5] determined the lateral reinforcement range using Terzaghi’s rock pressure theory and FLAC3D, identifying the optimal range by balancing economic and stability factors. Yang Chen et al. [6] studied the impact of shield tunneling in thick soft ground via numerical simulation and discussed optimal reinforcement dimensions. Liu Fang [7] and Xiao Gang [8] simulated ground conditions post-reinforcement to analyze settlement and stress distribution, offering guidance for practical applications. While reinforcement technologies for tunnel faces have matured, most studies target clay or soft ground. Ma Q. [9], Hong Z. [10], and Mooney M.A. [11] obtained the influence of different reinforcement methods on surface settlement through different numerical simulation software. This indicates that shield tunnel face reinforcement technology is becoming increasingly mature. However, existing research has mainly focused on clay and deep soft soil conditions. Therefore, studying face reinforcement techniques for shield tunnels in shallow silt layers is of significant engineering and practical value.
Weak ground construction is highly susceptible to significant surface settlement, collapse, and subsidence. Peck [12], aiming to analyze settlement behavior, proposed the Peck surface settlement curve based on field measurements and theoretical models. Lu Sheng’an et al. [13], using PLAXIS 3D to simulate tunneling in soft soil, found significant post-construction settlement, suggesting pre-reinforcement measures. Sun Minjun [14], addressing deformation in shallow-buried silty strata through simulation and field data in the Pearl River Delta, found greater uplift near the tunnel face, with segment uplift initially increasing and then decreasing. Wang T. et al. [15] evaluated construction schemes for minimizing side slope disturbance, concluding that the hidden-arch method suits shallow silty ground entry zones. Jin H. [16], Gao F. [17], and Imteyaz W. [18] studied the influence of shallow buried and soft soil tunnel construction on ground settlement by using test and numerical simulation software.
Despite many studies on shield tunneling in soft, shallow grounds, few focus on controlling post-reinforcement settlement in muddy soil layer. This study, based on the launching section of the Guanggang New City depot access tunnel on Guangzhou Metro Line 10, uses numerical simulations to compare two reinforcement schemes. Combined with field monitoring and theoretical analysis, the study explores the effectiveness of these methods and examines the deformation behavior during tunneling. The findings aim to provide theoretical guidance and practical references for shallow-buried soft ground shield tunnel face reinforcement and construction.

2. Project Overview

The launching section of the depot access tunnel on the Guangzhou Metro Line 10 in Guanggang New City is located in Liwan District, Guangzhou. The tunnel extends northwest from the launching shaft at the Guanggang New City depot. According to existing research [19,20], when the cover-to-span ratio (i.e., the ratio of overburden depth to tunnel span) is less than 0.6, tunnel excavation has a significant impact on surface settlement and is thus defined as a shallow-buried tunnel. In this case, the average overburden depth of the launching section is 3.5 m, and the tunnel span is 6.4 m, giving a cover-to-span ratio of 0.55, classifying it as a shallow-buried tunnel. Based on analysis of geological investigation data and the characteristics of the shallow-buried muddy soil layer in the launching section, a slurry balance shield method is proposed for construction. The specific project location is illustrated in Figure 1.
The stratigraphy at the tunnel face of the launching section, from top to bottom, consists of: <1> miscellaneous fill (1.7 m), <2-1A> muddy soil layer (1.5 m), <4N-2> silty clay (3.5 m), <5N-2> silty clay (5.19 m), <6> completely weathered coarse sandstone (4.6 m), <7-1> strongly weathered coarse sandstone (2.2 m), and <8-1> moderately weathered coarse sandstone (14.6 m). The tunnel face of the launching section is primarily located in silty clay strata. Field investigation determined that the groundwater level is approximately 3.5 m. In the project area, groundwater recharge is mainly from surface precipitation. The shield launching section is located in a silty clay layer and the upper muddy soil layer has been reinforced by replacement filling. Most of the nearby ground surface is covered with concrete pavement, so infiltration recharge from upper strata is negligible. Drainage is carried out via an internal drainage channel at the tunnel invert and grouting reinforcement was applied around the surrounding strata during construction. Therefore, groundwater influence on settlement can be ignored. According to the site investigation report, the physical and mechanical parameters of each soil layer are listed in Table 1.

3. Numerical Simulation of Tunnel Face Reinforcement Scheme

3.1. Model Setup

As the launching section of the tunnel passes through muddy soil layer, reinforcement of the tunnel face is necessary prior to shield construction. To determine a suitable reinforcement plan, MIDAS/GTS NX 2022R1 software was used to conduct 3D numerical simulations of different reinforcement schemes and the optimal plan was selected for implementation. Given that the tunnel face is primarily located in muddy and clayey soils, two reinforcement schemes were modeled: Scheme 1: 4 m long Φ850@600 triple-axis mixing piles +2 m thick backfill layer of cohesive soil as counter-pressure. Scheme 2: Replacement with cohesive soil down to the base of the muddy soil layer +4 m long Φ600@450 high-pressure jet grouting piles +2 m thick cohesive soil backfill for counter-pressure.
The reinforcement zone (with overburden fill, covering segments 1–8) is 9.6 m long; the transition zone between the reinforced and unreinforced areas (segment 9) is 1.2 m; and the unreinforced zone (without overburden fill, segments 10–30) is 25.2 m long. According to the Technical Code for Monitoring in Urban Rail Transit Projects (GB 50911-2013) [21], the early warning threshold for ground deformation in this project is 30 mm.
MIDAS/GTS is a general finite element analysis software widely used in geotechnical engineering, particularly for shield tunnel simulations. The geometry model in GTS/NX supports a variety of element types, including scalar, 1D, 2D, solid, interface, and rigid link or interpolation elements. These can be applied in linear and nonlinear stress analysis, seepage analysis, and stress–seepage coupled analysis.
In MIDAS/GTS, the virtual work principle is expressed using stress–deformation equations, commonly constrained by stress-strain relationships. The Hu–Washizu variational principle is applied.
δ G ext = Ω ( δ u ) T σ + δ ε T ( σ ( ε ) σ ) + δ σ T ( u ε ) d Ω
Assuming that the constitutive equation can always satisfy the strain-stress relationship and the coordination relationship between ε and ∇u, it can be deduced as a general expression of the virtual work principle:
δ G e x t = Ω ( δ u ) T σ ( u ) d Ω
In the finite element method, the displacement u represented by the shape function difference is:
u h = N d e
Using εk = ∇uh = Bde, the principle equation of virtual work in the unit can be obtained:
δ G ext = δ d T F = δ d T e Ω e B T D B d Ω d = δ d T K d
The stiffness matrix Ke of the element is:
k e = Ω e B T D B d Ω
Considering that the reinforced tunnel section is 9.6 m long and the tunnel diameter is 6.2 m, the calculation model length is typically 3–5 times the tunnel diameter. Thus, a model 36 m long, 30 m wide, and 33.29 m high (sum of all strata thicknesses) was selected. Displacement constraints were applied using the software’s automatic constraint function: the model ends were constrained in the x-direction, the other three side faces in both x and y directions, and the base in x, y, and z directions. The excavation step per cycle was set to 1.2 m, equivalent to one analysis step. The mesh size for general soil layers was 1 m and refinement was applied to the excavation soil, segmental lining, grouting layer, and jet grouting piles, with a refined mesh size of 0.5 m. After meshing, the mesh quality and topology were checked using the built-in mesh checker tool. The model consisted of 38,516 elements. The Mohr–Coulomb yield criterion was used for soil layers, with mechanical properties shown in Table 1. The segmental lining, shield shell, and jet grouting piles were modeled as elastic materials, with mechanical parameters listed in Table 2. Treat the soil layer as isotropic. The shield segment ring width was 1.2 m. Groundwater depth was set at 3.5 m. The model is illustrated in Figure 2, where the Figure 2b 1-1 section shows the longitudinal profile of the tunnel.
The detailed scheme of scheme 1 and scheme 2 is shown above.

3.2. Analysis of Simulation Results for Tunnel Face Reinforcement Schemes

During shield excavation, the surrounding rock stress field undergoes three-dimensional redistribution, resulting in the spatiotemporal evolution of soil displacements. To analyze construction safety under different reinforcement schemes, the transverse and longitudinal deformation patterns of the soil were studied by selecting representative positions: within the reinforcement zone (1.2 m, segment 1), at the interface between the reinforced and unreinforced zones (10.8 m, segment 9), and in the unreinforced zone (30 m, segment 25).

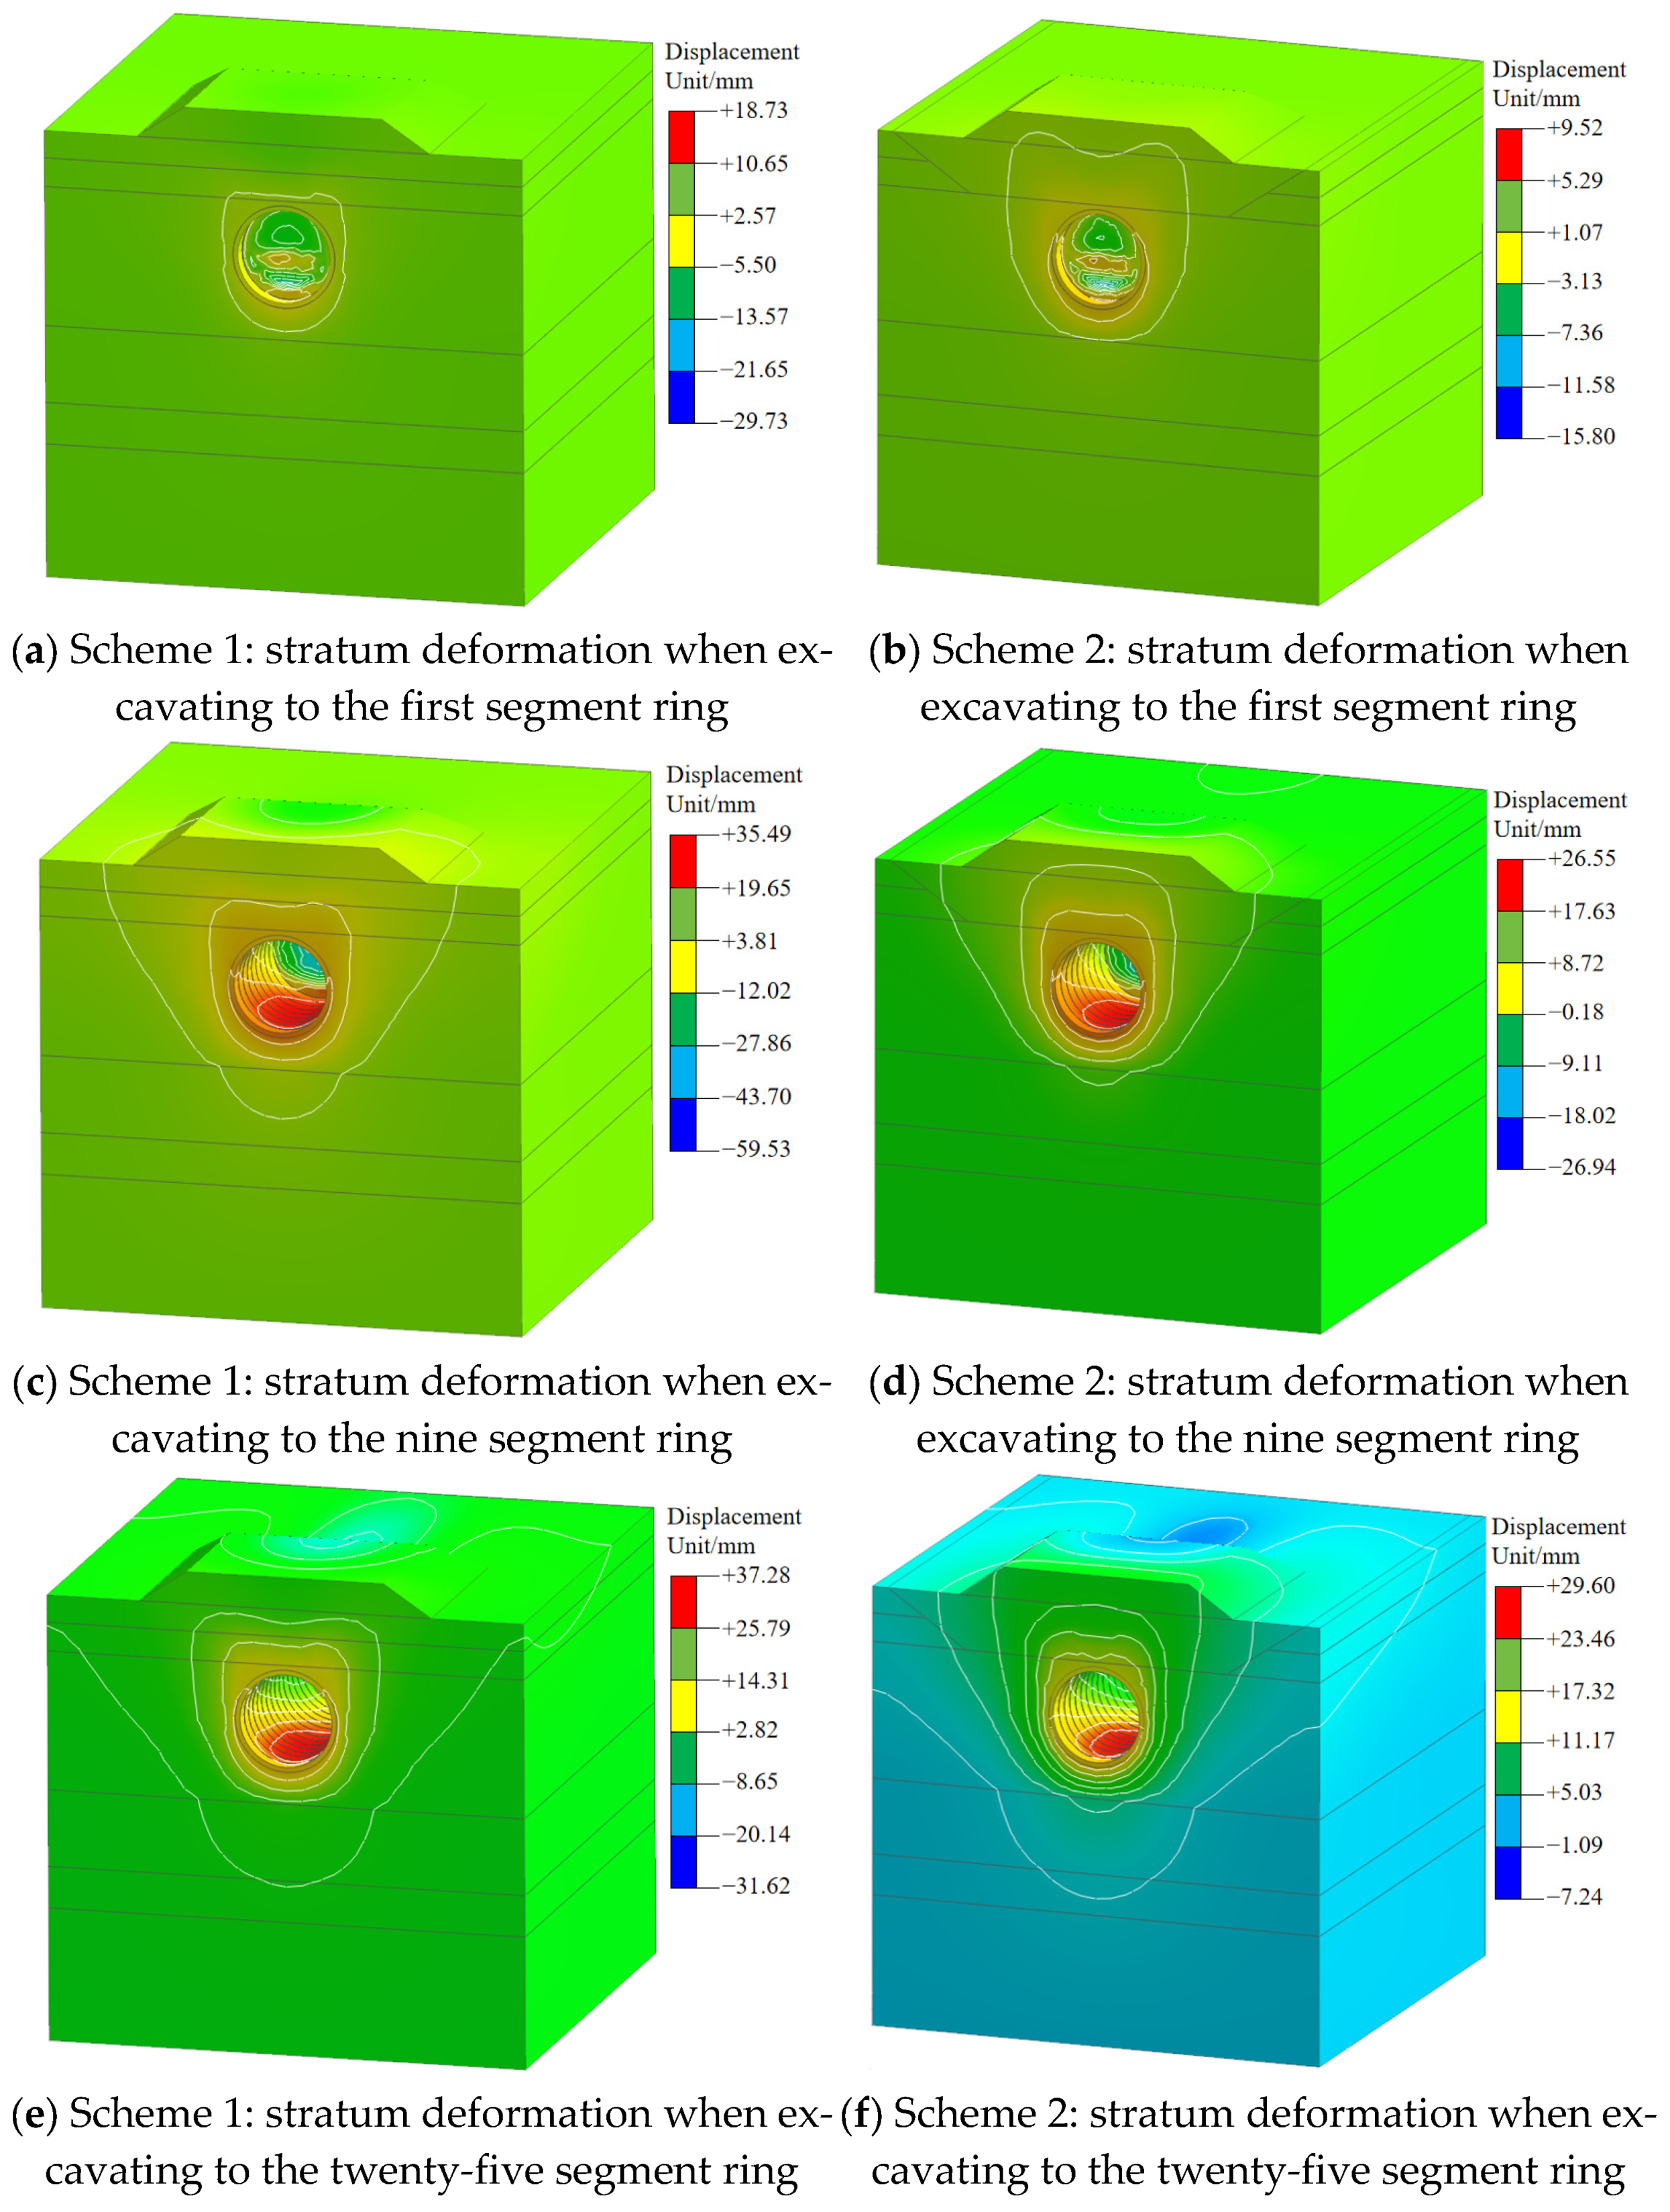
3.2.1. Transverse Soil Deformation at the Tunnel Face

The transverse deformation patterns of the soil for Schemes 1 and 2 at the three positions are shown in Figure 3.
Figure 3a,b indicate that when the shield is excavating within the reinforcement zone, Scheme 1 results in minor settlement concentrated around the tunnel, with a “cat head” shaped deformation pattern. Scheme 2 produces a similarly shaped but wider deformation area, with settlement mainly occurring at the tunnel crown. The maximum settlements for Schemes 1 and 2 are −29.73 mm and −15.80 mm, respectively, and the maximum uplifts at the tunnel invert are 18.73 mm and 9.52 mm, respectively.
Figure 3c,d illustrate that at the interface between the reinforced and unreinforced zones, the deformation area in Scheme 1 expands into a “V” shape. Scheme 2 exhibits a similar shape but with a slightly smaller affected area. Maximum settlements for Schemes 1 and 2 are −59.53 mm and −26.94 mm, respectively, and the maximum uplift is 35.49 mm and 26.55 mm, respectively.
Figure 3e,f illustrate that in the unreinforced zone, Scheme 1 shows a “funnel”-shaped settlement area, while Scheme 2 presents the same shape but with a wider range. Maximum settlements for Schemes 1 and 2 are −31.62 mm and −7.24 mm, respectively, and maximum uplift is 37.28 mm and 29.60 mm, respectively.
In summary, as shield tunneling progresses, the transverse deformation of the ground primarily manifests as settlement at the crown and uplift at the invert. The deformation pattern evolves from “cat head” to “V” to “funnel” shape, with increasingly sharp contours and broader impact zones. Although Scheme 2 results in a wider affected zone during excavation in both reinforced and unreinforced areas compared to Scheme 1, it consistently shows lower maximum settlement and uplift values. At the reinforcement interface, Scheme 2 also exhibits a smaller disturbed area and lower deformation values than Scheme 1. Therefore, Scheme 2 yields more uniform and reduced ground deformation.

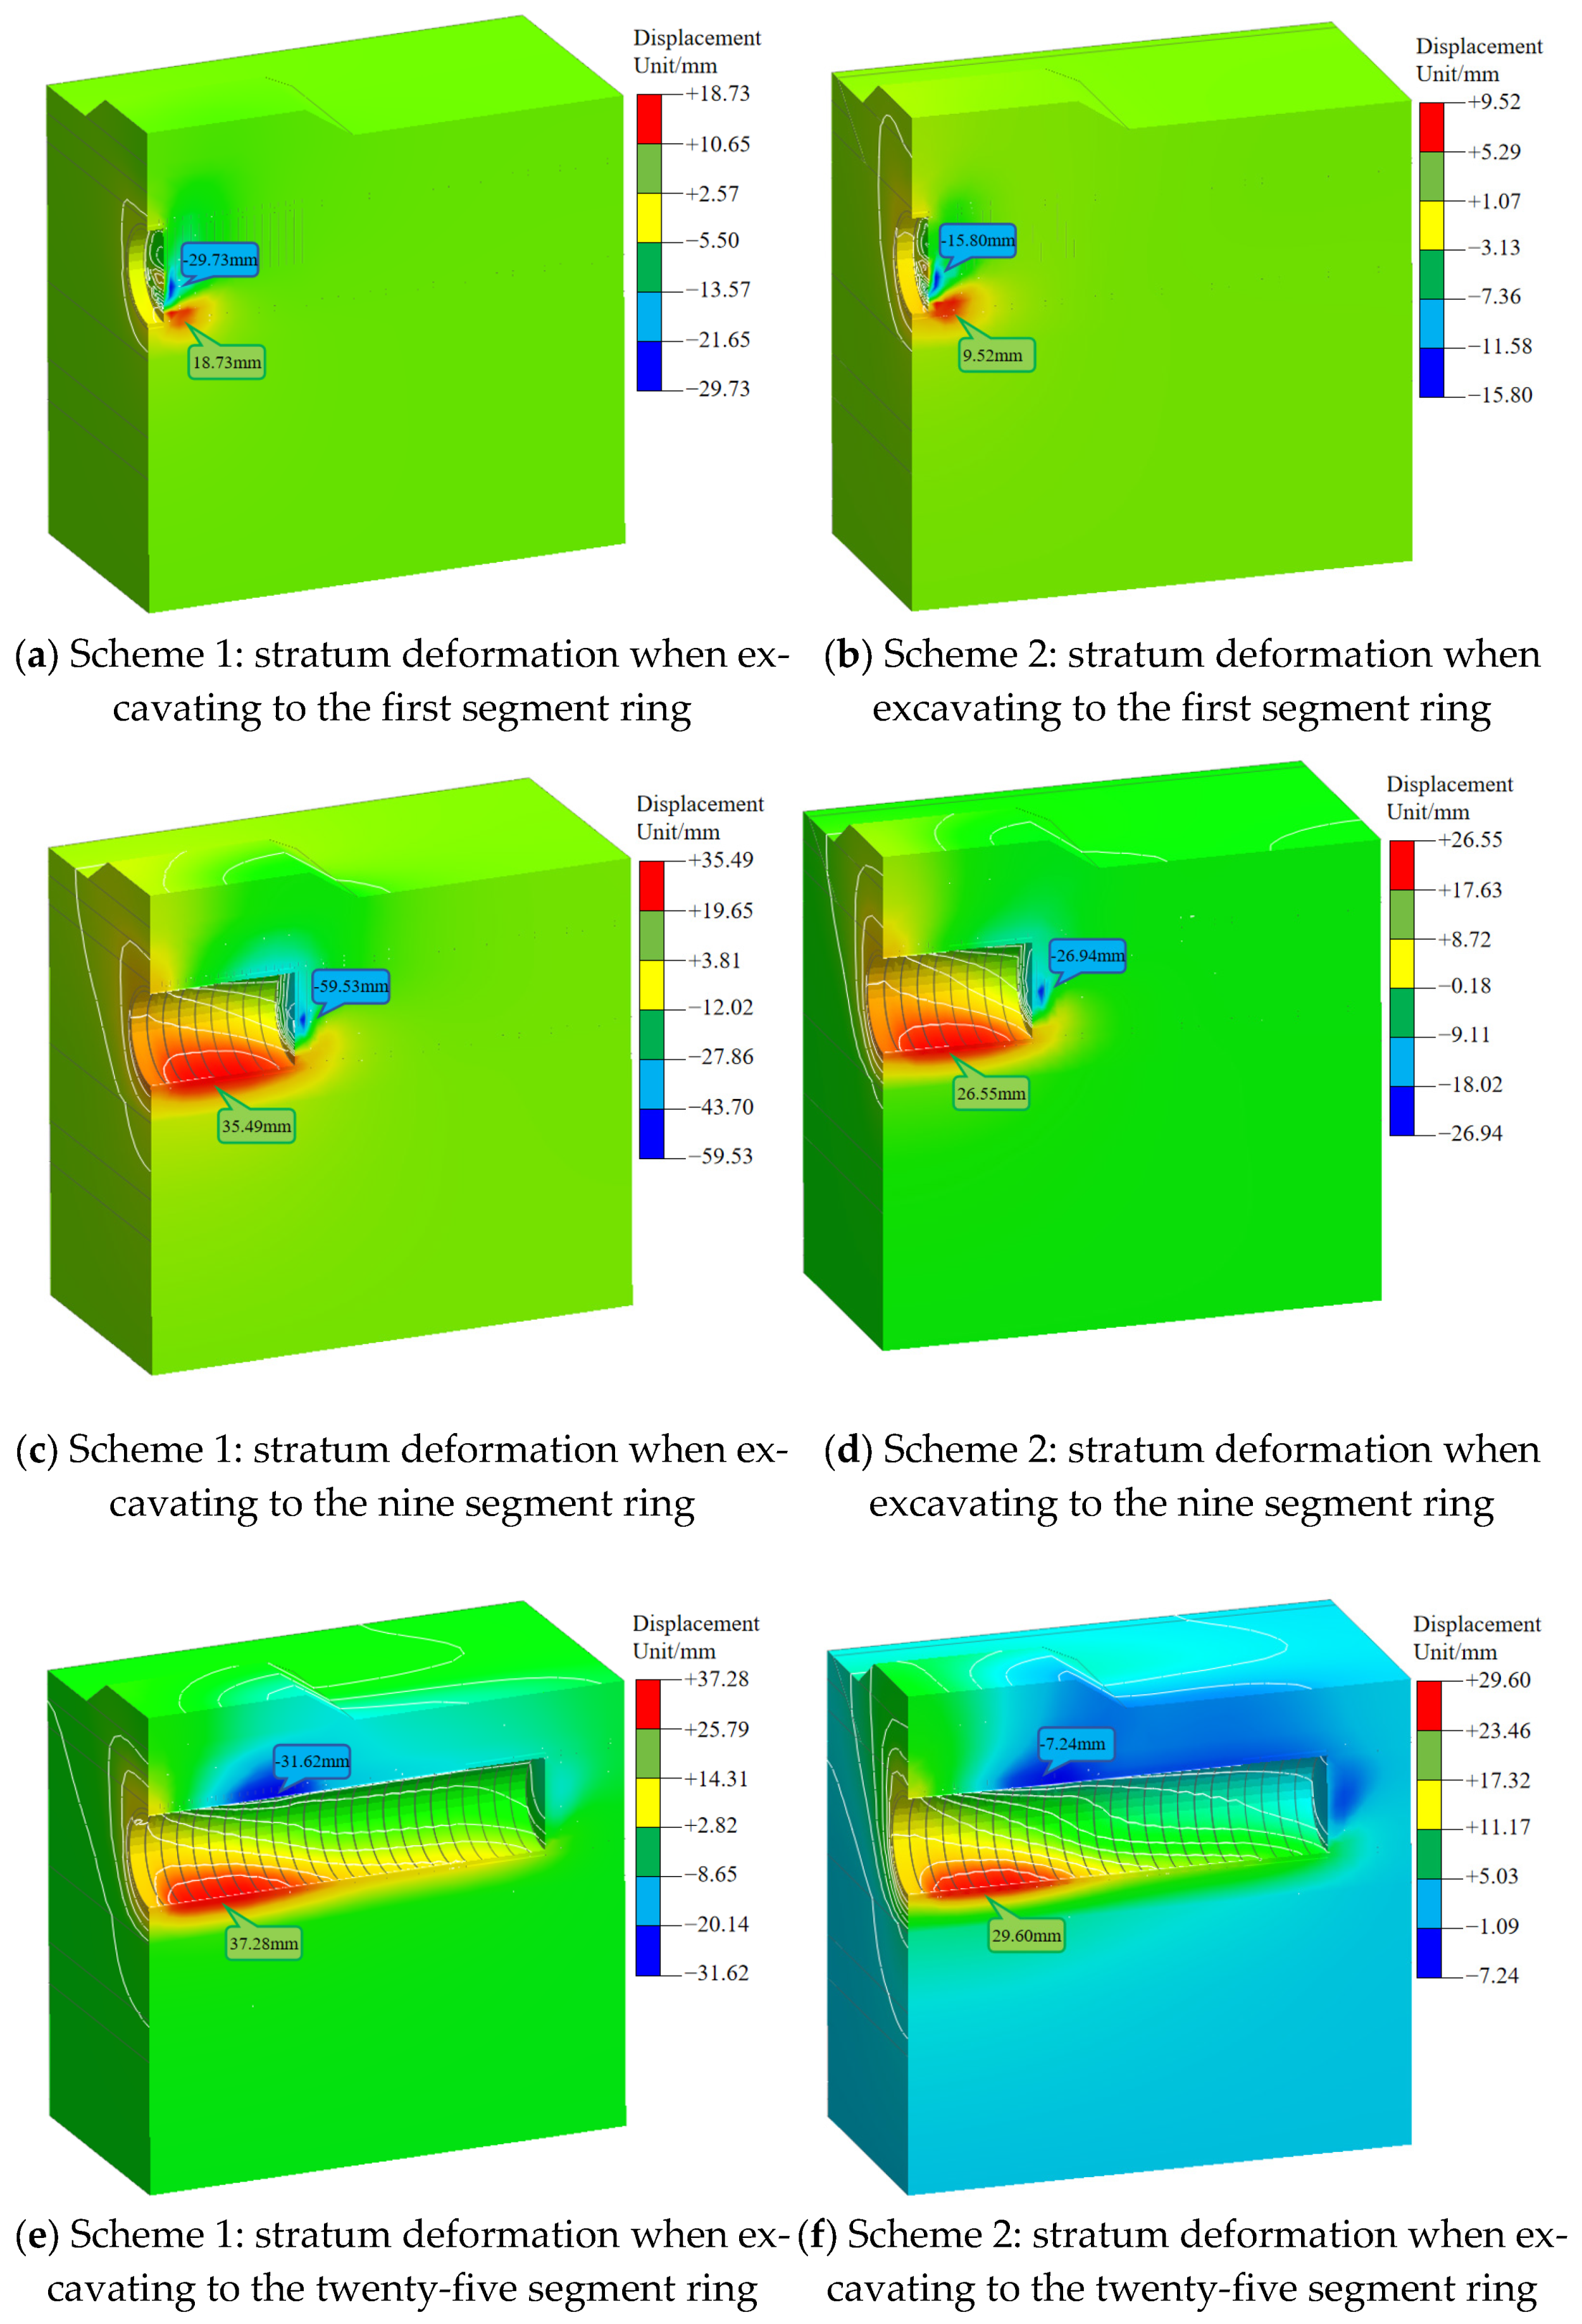
3.2.2. Longitudinal Ground Deformation Characteristics at the Shield Tunnel Launching Section

To investigate the longitudinal ground deformation pattern during shield tunnel excavation at the launching section and assess potential construction risks, preventive measures against surface collapse were formulated in advance to reduce economic loss and the risk of casualties. Based on section 1-1 shown in Figure 2b, the longitudinal ground deformation patterns at different excavation stages were obtained, as illustrated in Figure 4.
From Figure 4a,b, it is evident that when tunneling reaches the reinforced zone, ground settlement around the tunnel is relatively small. For both Scheme 1 and Scheme 2, the maximum ground settlement occurs at the crown of the tunnel in front of the shield machine, with maximum settlements of −29.73 mm and −15.80 mm, respectively. The maximum ground heave is observed at the tunnel invert, with peak values of 18.73 mm and 9.52 mm, respectively.
Figure 4c,d illustrate that when excavation reaches the interface between the reinforced and unreinforced zones, the maximum settlement still occurs at the crown of the tunnel in front of the shield, measuring −59.53 mm and −26.94 mm for Scheme 1 and Scheme 2, respectively. The maximum heave in both cases is observed at the invert near segment ring 4, with values of 35.49 mm and 26.55 mm, respectively.
From Figure 4e,f, when the excavation advances into the unreinforced zone, a settlement zone appears near the crown of segment ring 9 in Scheme 1, with a maximum settlement of −31.62 mm, exceeding the warning threshold. A heave zone is also seen at the invert of segment ring 4, with a maximum heave of 37.28 mm, also exceeding the warning value. In Scheme 2, while the settlement area is broader than in Scheme 1, the maximum settlement is smaller at −8.24 mm. The maximum heave location remains the same as in Scheme 1, with a value of 29.60 mm.
During excavation in the reinforced zone and the interface with the unreinforced zone, the soil reinforced by jet grouting remains relatively dense and the settlement zones appear mainly ahead of the shield machine. Once tunneling progresses into the unreinforced zone, the shield no longer cuts through the grouted soil, and the maximum settlement remains near the crown of segment ring 9, while the maximum heave remains near the invert of segment ring 4. The results indicate that Scheme 1 exceeds the 30 mm deformation control threshold for both settlement and heave, while Scheme 2 remains within acceptable limits.

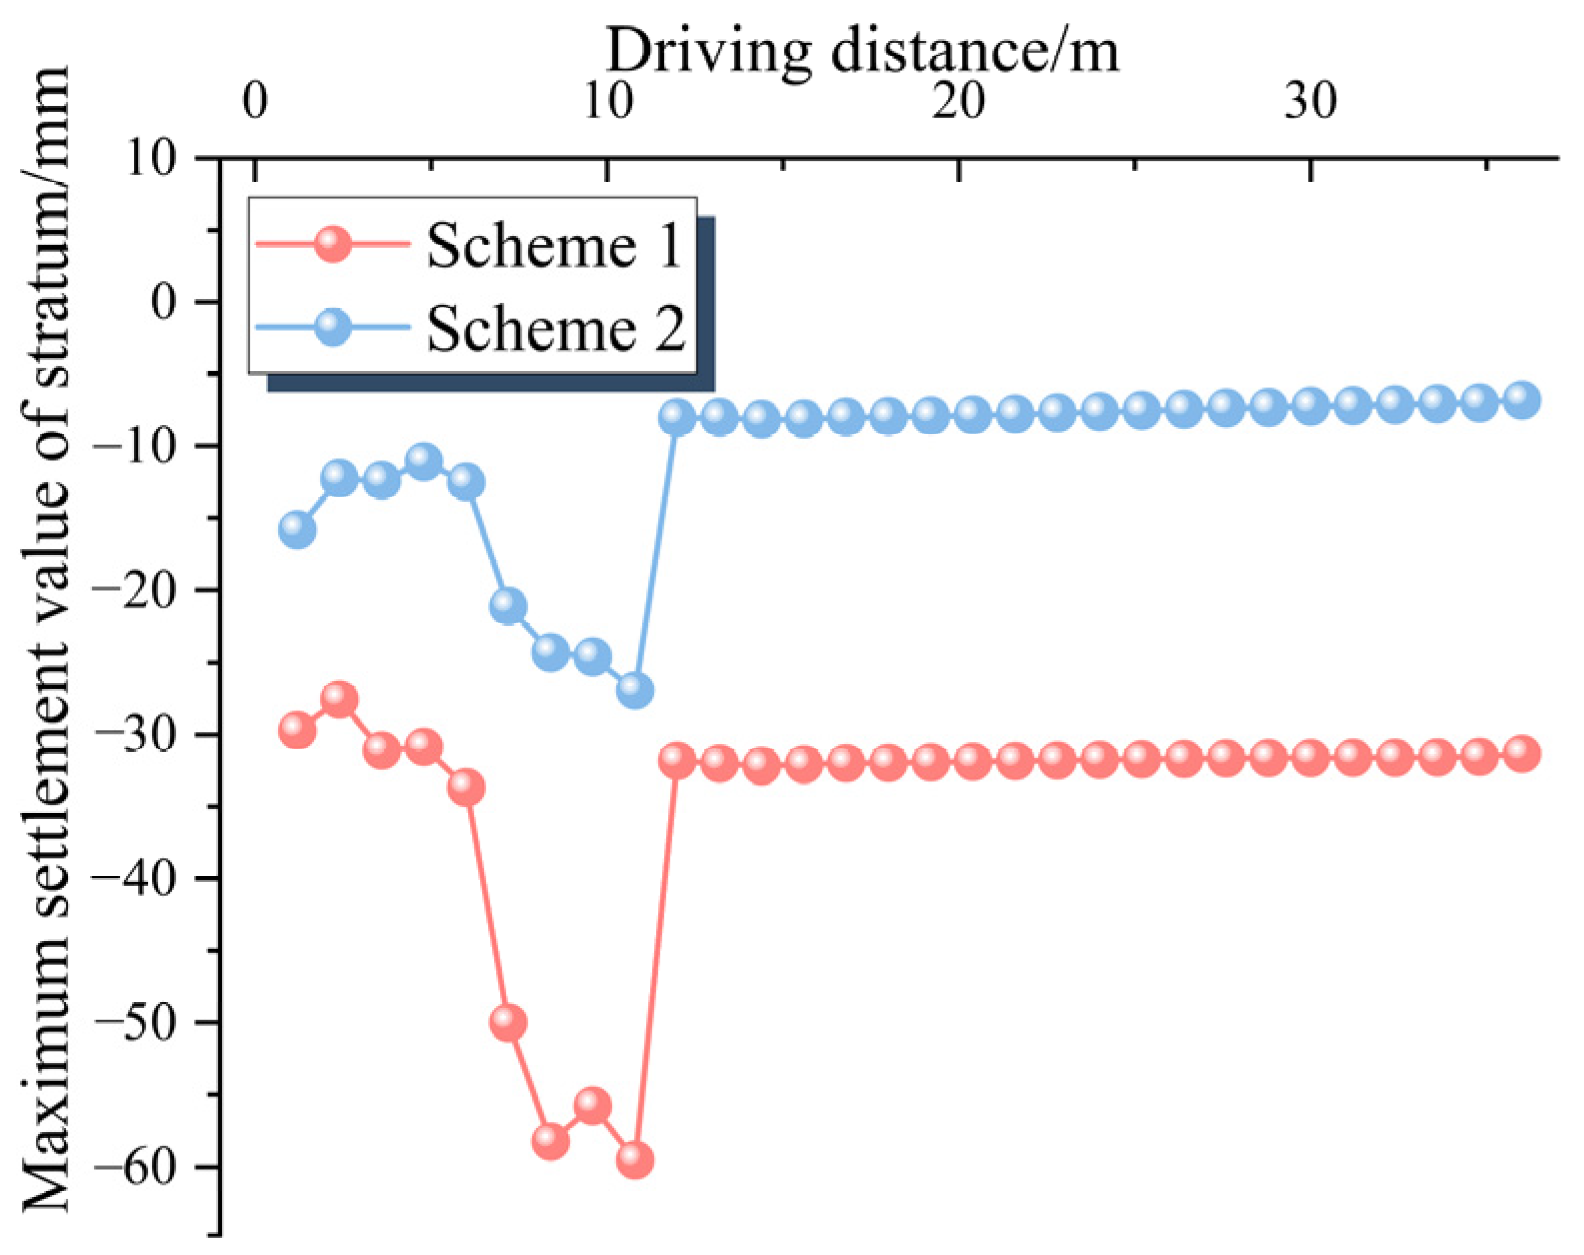
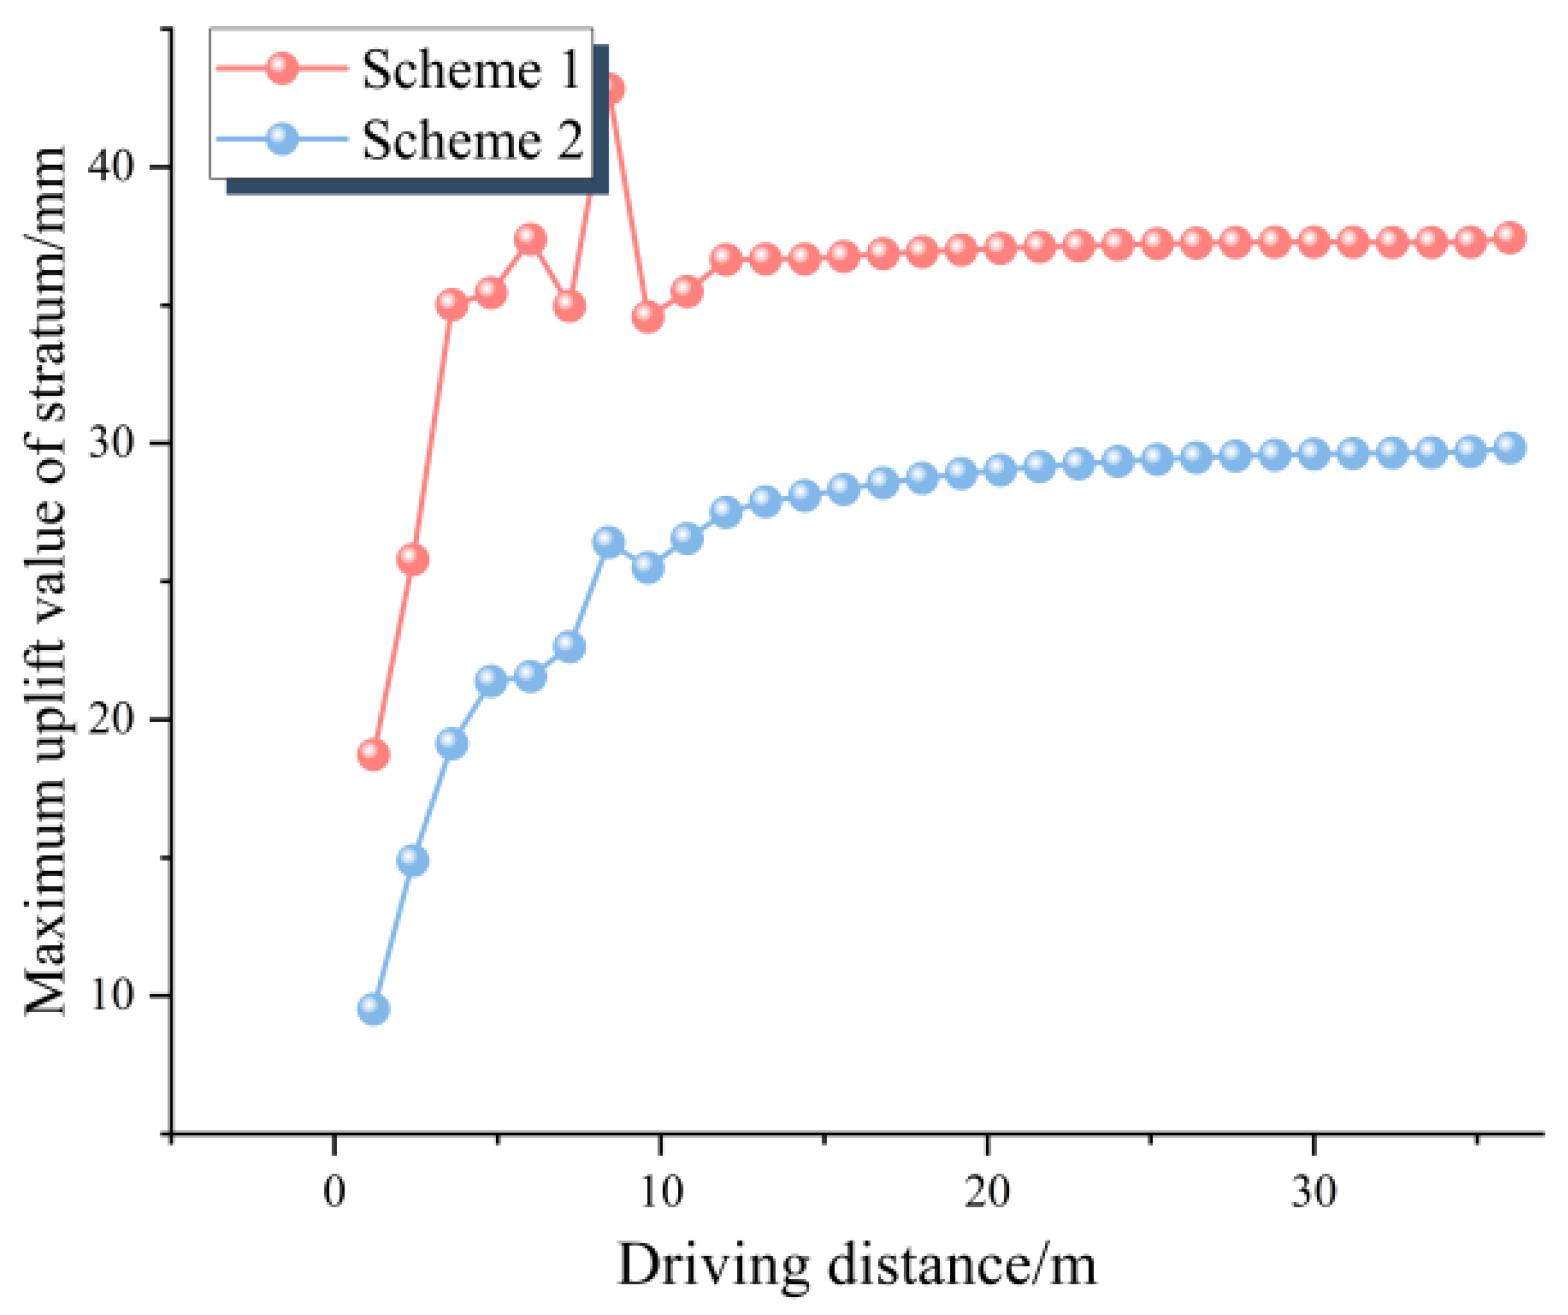
3.2.3. Analysis of Maximum Ground Deformation

The previous section qualitatively analyzed the cross-sectional and longitudinal deformation patterns in the reinforced zone of the tunnel. To quantitatively assess the maximum ground deformation at various tunnel positions, the maximum settlement and heave values during excavation for both Scheme 1 and Scheme 2 were extracted. The results are illustrated in Figure 5 and Figure 6.
As illustrated in Figure 5, with the advance of tunnel excavation, the maximum ground settlement under both schemes initially increases, then decreases, increases again, and eventually stabilizes. The maximum settlement occurs at the interface between the reinforced and unreinforced zones, reaching −59.53 mm in Scheme 1, which exceeds the deformation warning threshold. Scheme 2 exhibits a maximum settlement of −26.94 mm. Specifically, settlement in Scheme 1 ranges from −59.53 mm to −31.35 mm, far beyond the warning threshold, with a settlement range of 28.18 mm. In Scheme 2, settlement ranges from −26.94 mm to −6.80 mm, remaining within the warning threshold, with a range of 20.14 mm. The settlements under Scheme 2 are consistently smaller, and the distribution is narrower, indicating lower deformation variability due to excavation.
As illustrated in Figure 6, with the advancement of tunnel excavation, the maximum ground heave under both schemes exhibits a pattern of increase, decrease, and stabilization. Scheme 1 reaches the peak heave of 42.83 mm at segment ring 7, exceeding the warning threshold, while Scheme 2 reaches a maximum of 29.83 mm at segment ring 30, close to the threshold. Specifically, Scheme 1 shows heave values from 18.73 mm to 42.83 mm, with a range of 24.10 mm, partially exceeding the warning threshold. Scheme 2 shows heave values from 9.52 mm to 29.83 mm, all within the threshold, with a range of 20.31 mm. The heave observed under Scheme 2 is consistently lower and the fluctuations caused by excavation are less pronounced.
At the 8–10 m range, the shield machine had already exited the reinforced area and was no longer cutting through the jet grouting piles. Meanwhile, the unreinforced stratum is comparatively weaker than the reinforced zone. As the thrust force remained constant during excavation, both the maximum settlement and maximum uplift exhibited abrupt changes. As the shield machine gradually moved away from the reinforced zone and the soil properties around the machine became more uniform, the maximum settlement and uplift values gradually decreased and stabilized. These results are consistent with the findings of Ding [22] and Wu [23].

4. Implementation of Shield Tunnel End Reinforcement Scheme

Numerical simulation results indicate that compared to Scheme 1, Scheme 2 more effectively controls ground deformation and offers better performance. Accordingly, Scheme 2 was selected for implementation in practice. The adopted scheme includes clay replacement down to the bottom of the silt layer +4 m long Φ600@450 high-pressure jet grouting piles +2 m thick clay overburden. The double-tube jet grouting piles use 42.5 (R) ordinary Portland cement, applied at 360 kg/m. Jet pressure should exceed 20 MPa. Grouting should use 42.5-grade or higher ordinary Portland cement, with additives or admixtures as necessary. Trial piles must be conducted before formal construction to ensure that the cement content, water-cement ratio, and lifting speed meet design specifications. A total of 1188 jet grouting piles, each 4 m long, were constructed. The reinforcement area is illustrated in Figure 7a. The clay replacement uses compacted clay backfill to a depth of 3.5 m, reaching the bottom of layer <2-1B>. After replacement, a 2 m thick clay overburden was placed above the reinforcement zone, as illustrated in Figure 7b.

5. On-Site Monitoring and Analysis of Surface Deformation Law

5.1. On-Site Monitoring Data

During construction, surface settlement monitoring points were installed to study the ground settlement behavior. Ground settlement values at corresponding positions from numerical simulation were extracted and compared with on-site monitoring data to verify the validity of the simulation and the reliability of the construction.

5.1.1. Monitoring Point Layout

According to the numerical simulation results in Section 3.2, larger settlement occurs at the edge of the jet grouting zone due to soil compression. Therefore, transverse ground settlement monitoring points were placed at the beginning of the reinforcement zone (near the launching shaft edge) (CDBC719-1, 2, 3) and at the end of the reinforced zone (CDBC709-1, 2, 3, 4), with a total of seven monitoring points. The monitoring layout is shown in Figure 8.
The schematic diagram and field picture of settlement monitoring instrument are shown in Figure 9.

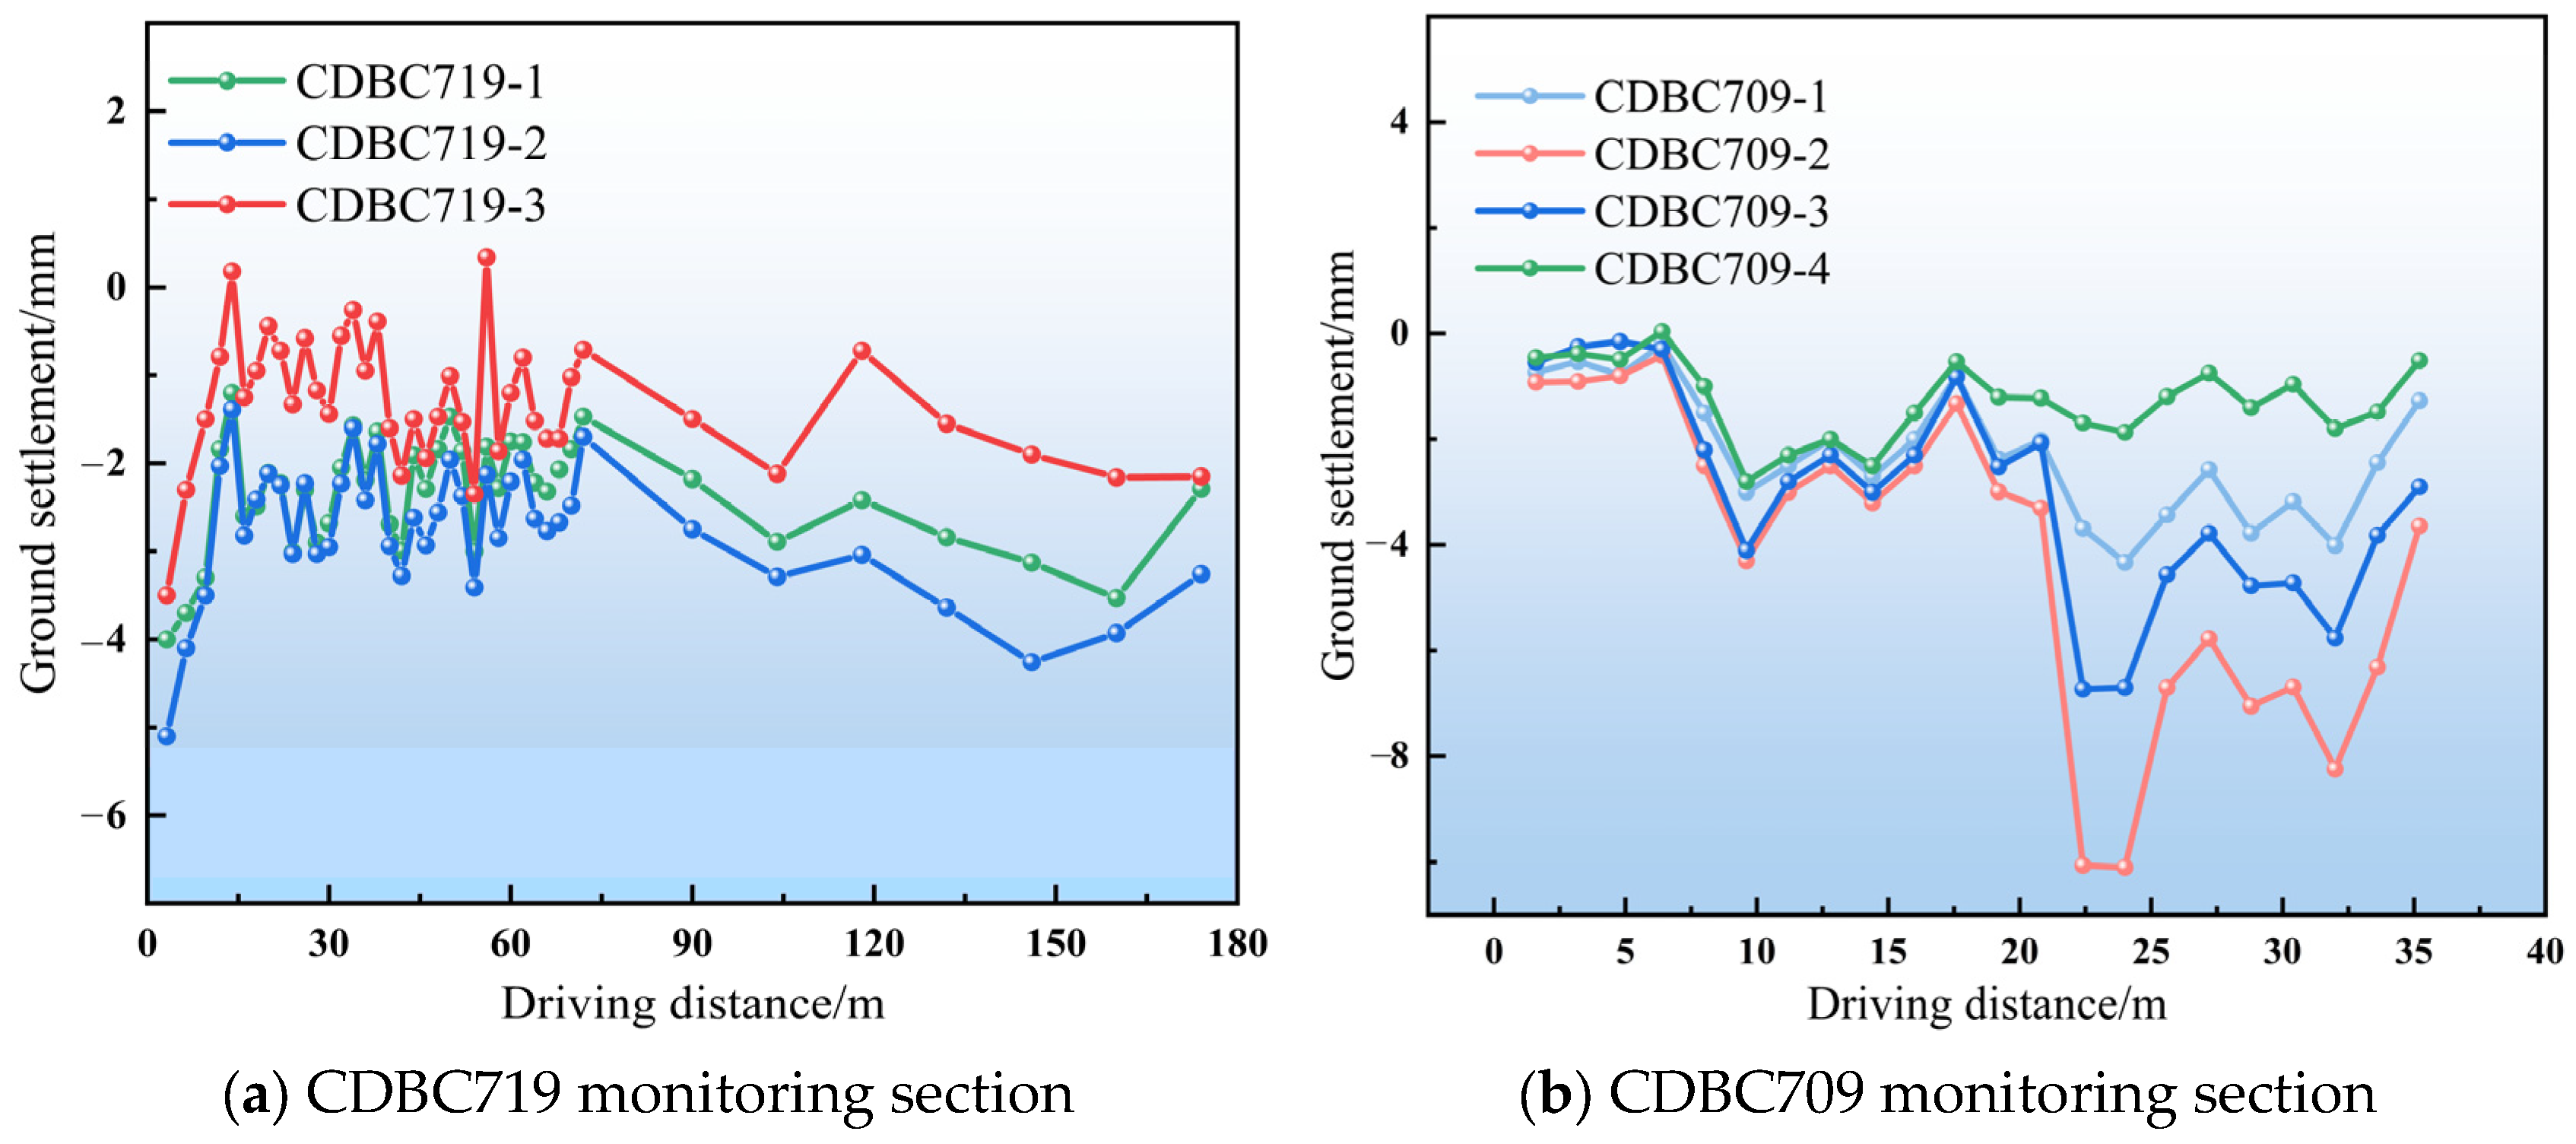
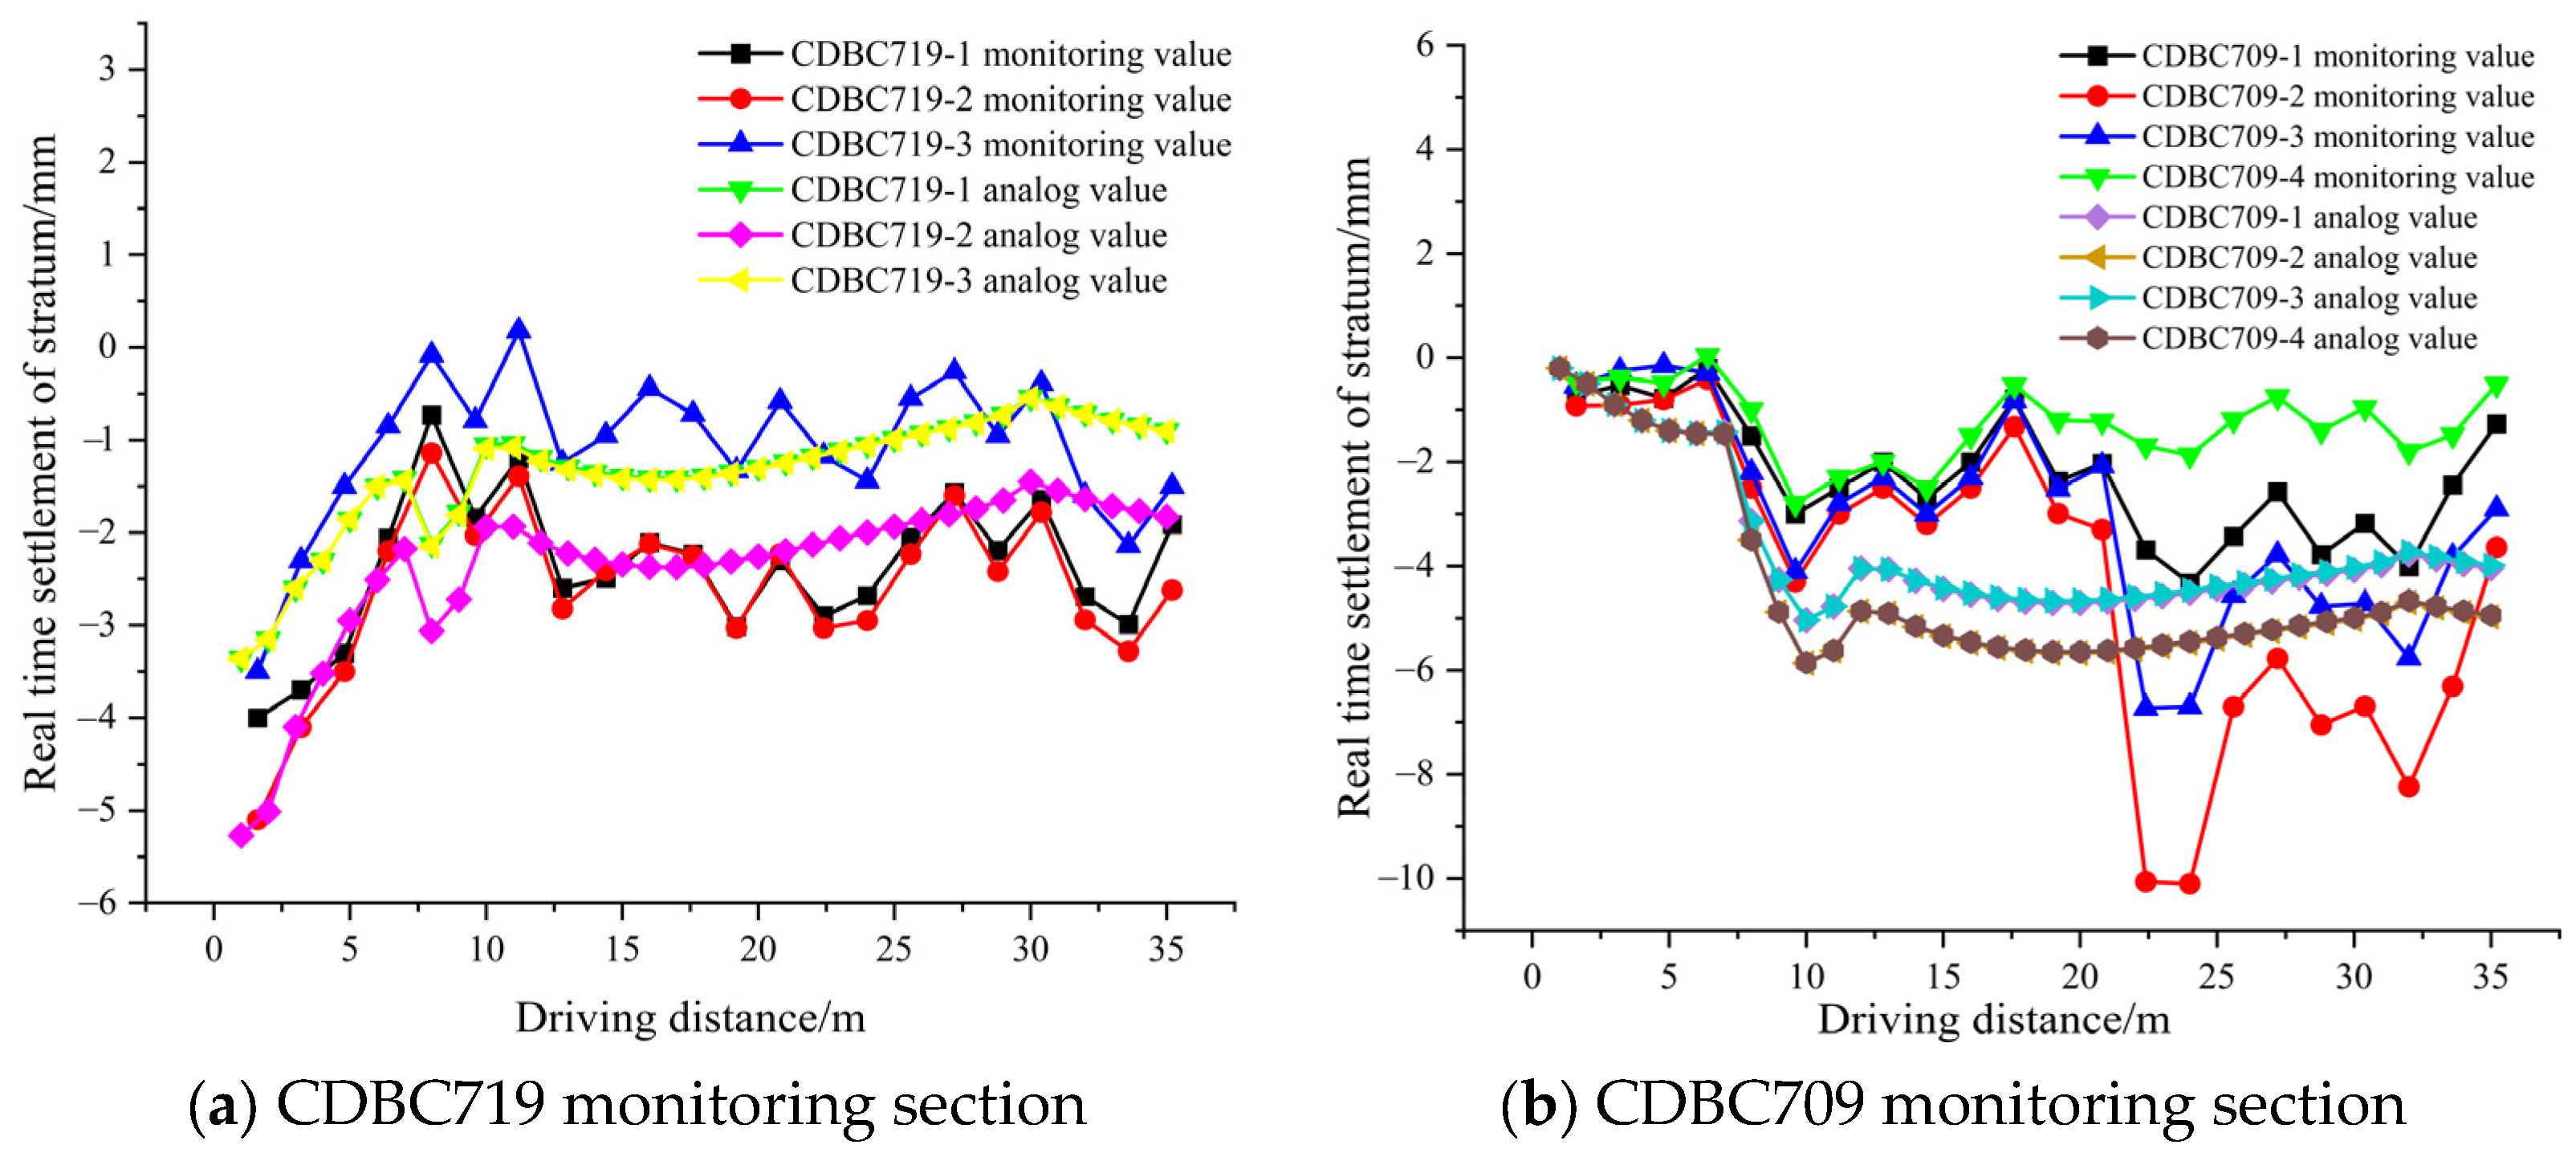
5.1.2. Monitoring Data Analysis

Monitoring commenced simultaneously with the start of shield tunneling. At the CDBC719 monitoring section (comprising three monitoring points), data were recorded twice daily. When the shield machine was at a greater distance (approximately 40 m) from this section, the monitoring frequency was reduced to once per week. The CDBC709 monitoring section (comprising four monitoring points) is located at the end of the jet grouting reinforcement zone. As noted in Section 3.2, this section experiences relatively large settlements during construction and is more prone to accidents. Therefore, the monitoring frequency at the CDBC709 section was maintained at twice daily until the end of construction. Monitoring data from each point are illustrated in Figure 10.
As illustrated in Figure 10a, with increasing excavation distance, the three monitoring points at the CDBC719 section generally exhibit ground settlement. The trend is characterized by alternating increases and decreases, forming a fluctuating pattern. The values primarily fluctuate around −2 mm, with settlement at the tunnel centerline greater than at the sides (SCDBC719-2 > SCDBC719-1 > SCDBC719-3). Settlement values at the three monitoring points generally range from −4 mm to 0.5 mm, well below the settlement control threshold, indicating that the reinforcement scheme has effectively stabilized the ground at the tunnel launching section.
Figure 10b shows that at the CDBC709 section, settlement trends across the four monitoring points initially decrease, then increase, and finally decrease again toward stabilization. The settlement values are ranked as follows: SCDBC709-2 > SCDBC709-3 > SCDBC709-1 > SCDBC709-4. On the 20th day of construction, settlement reached −10.1 mm. Field investigations revealed two main reasons: first, the tunnel portal had not been sealed, and the slurry chamber pressure was set too low at 0.6 bar; second, the replacement layer at the crown had poor self-supporting capacity. After grouting treatment, the settlement values were brought under control.

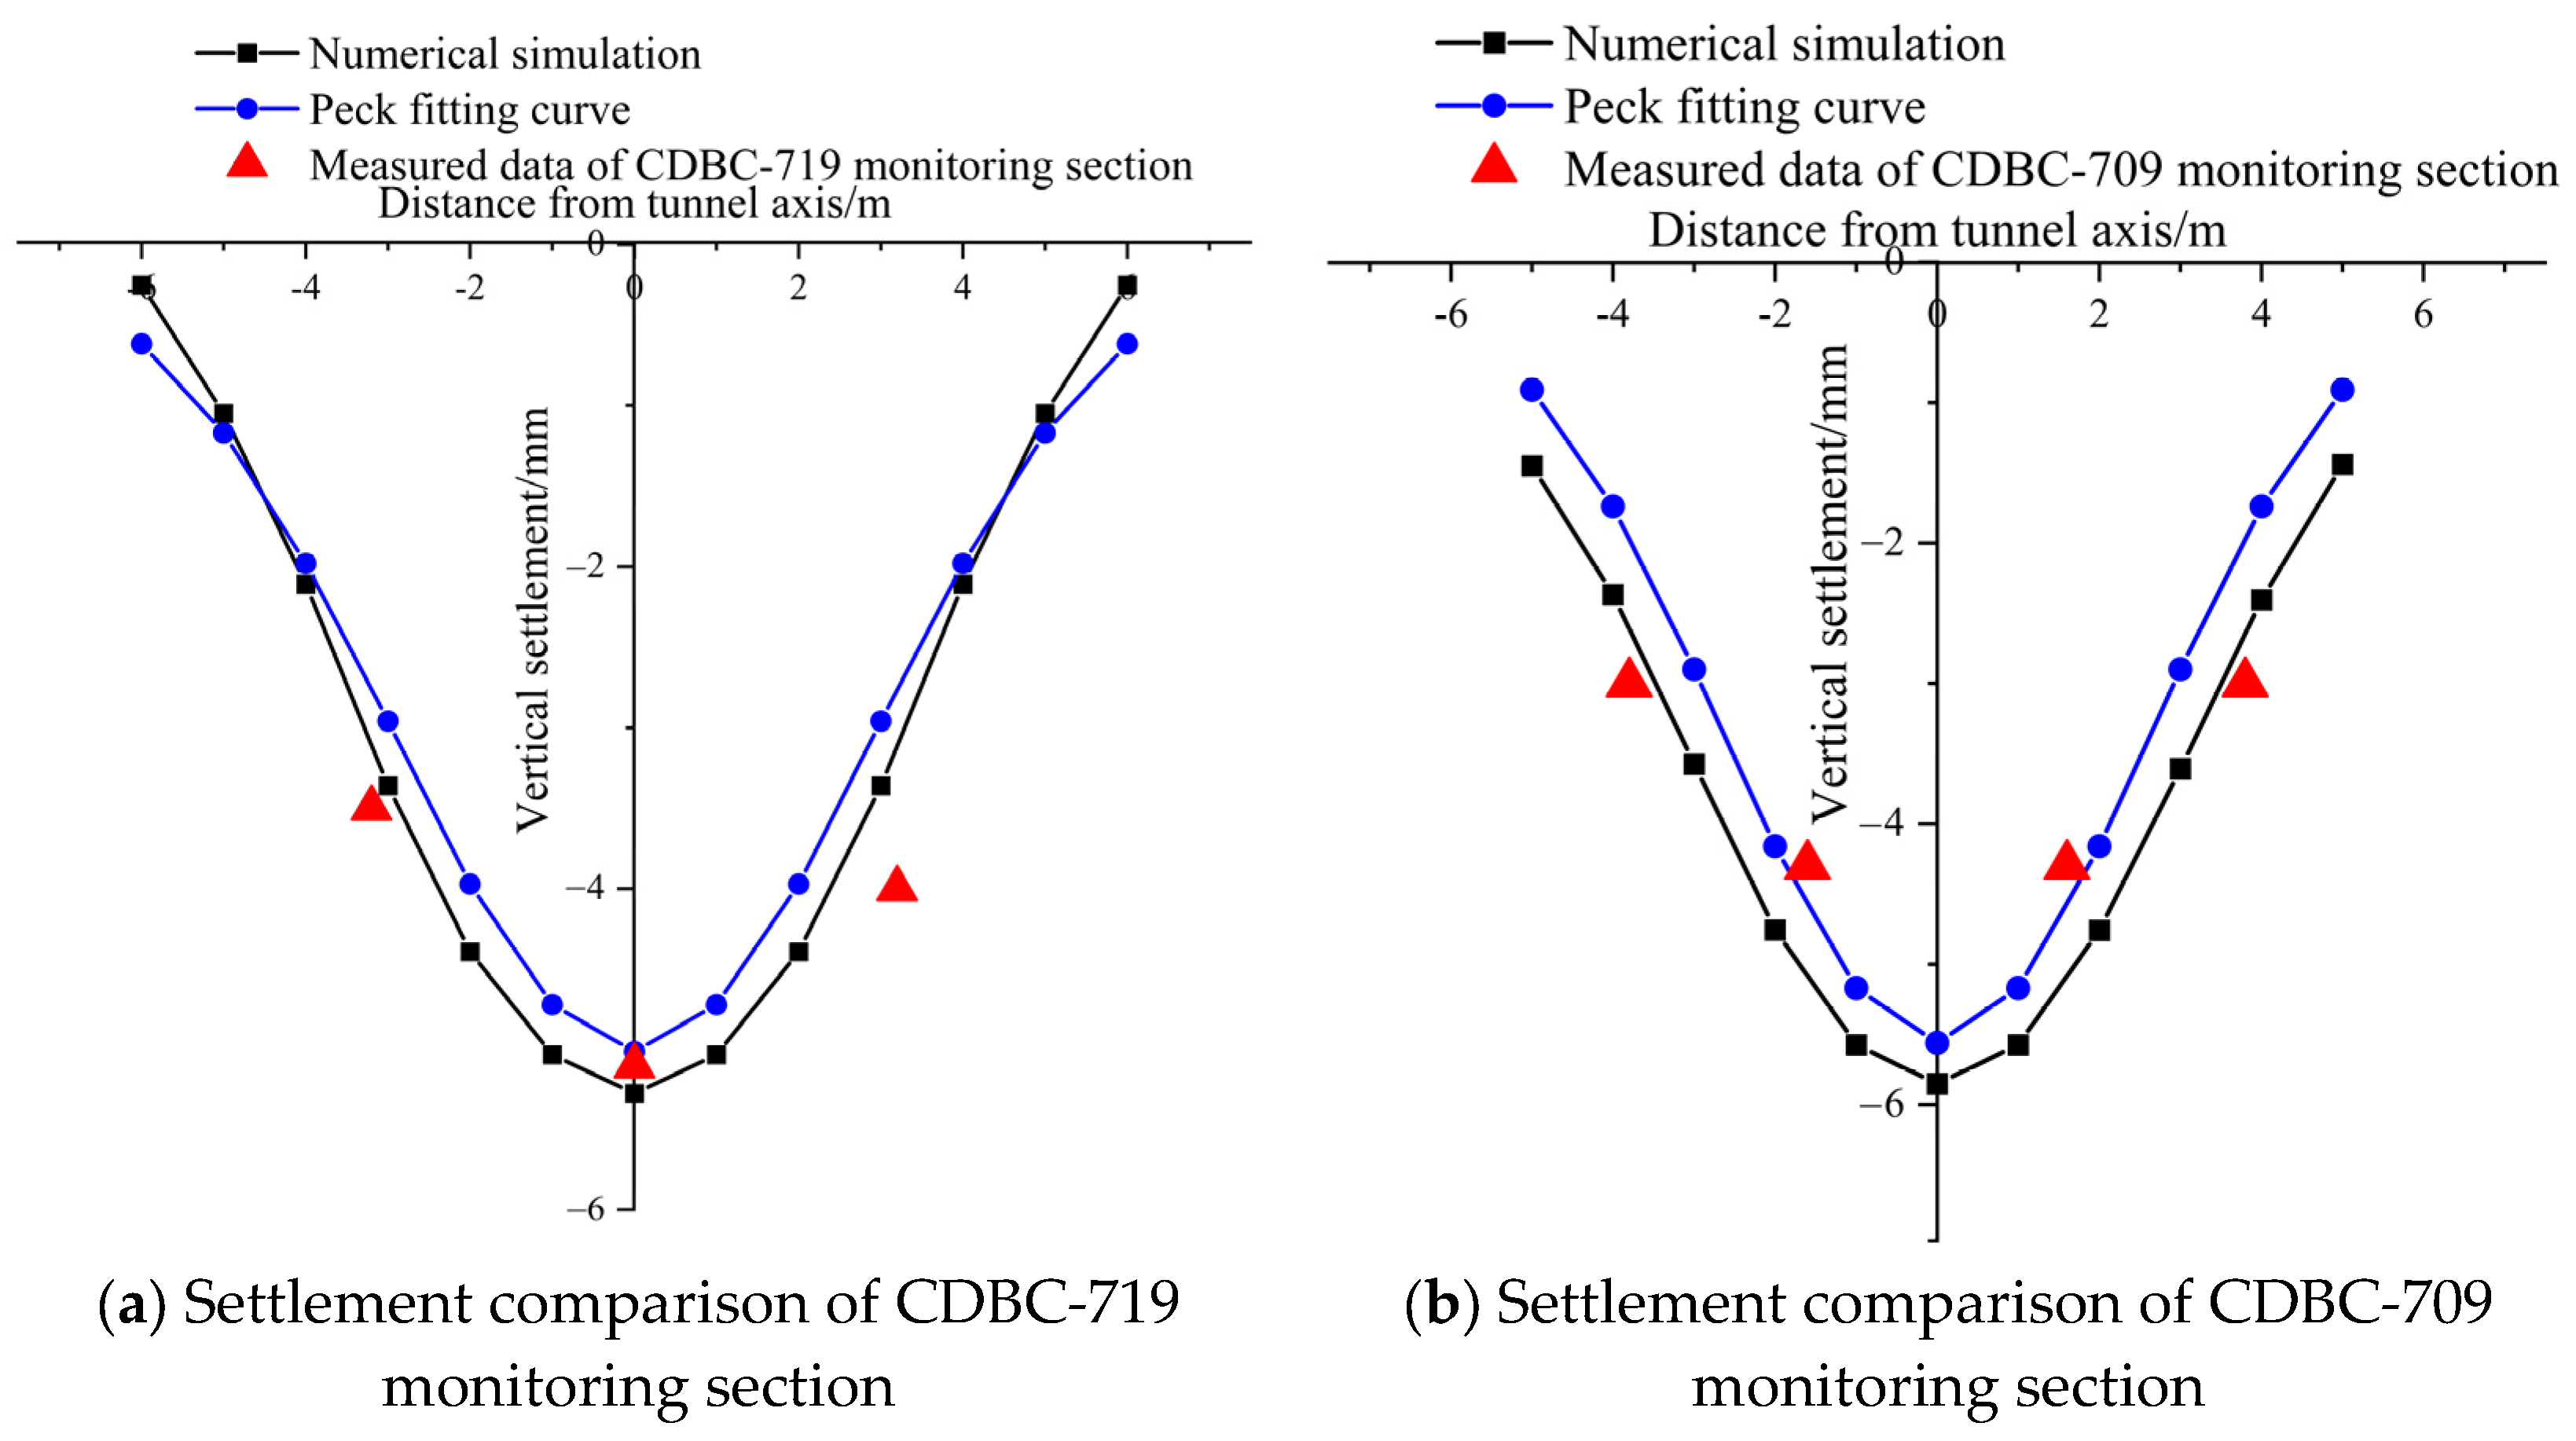
5.2. Analysis and Comparison of Transverse Ground Settlement

In 1969, Peck [12] proposed a method for predicting surface settlement based on the relationship between ground loss and surface deformation derived from extensive tunnel and underground construction data. This model was later refined by incorporating correction coefficients α and β, resulting in the modified empirical Peck formula. The formula for calculating the settlement value S at any point along the ground surface transverse to the tunnel axis is given as [24]:
S x = α S max · exp x 2 2 β i 2
i R = k H 2 R n
S max = 0.313 v d 2 i
where: Smax is the maximum ground surface settlement (mm); α is the correction coefficient for maximum surface settlement; x is the horizontal distance from the calculation point to the tunnel centerline (m); i is the settlement trough width (m); β is the correction coefficient for the width of the settlement trough; k is the coefficient related to soil properties (typically 0.63–1.0); H is the burial depth to tunnel centerline (m); R is the tunnel radius (m); n is an empirical coefficient (generally 0.8–1.0); V is the formation loss rate, which is taken as 0.5% in this paper; and D is the tunnel diameter, m.
In this project, both the replacement and overlying soils are cohesive. Therefore, the coefficient values are selected based on the ranges recommended by Chen [25] and Huang [26]: α = 0.9, β = 0.87. Substituting these into the equation yields i = 3.37 m for section CDBC719 and i = 3.02 m for section CDBC709.
Using the above parameters, modified Peck fitting curves were generated and compared with both simulation and field monitoring results. The settlement comparisons for the two monitoring sections are shown in Figure 11.
Analysis of Figure 11 shows that the monitoring data, numerical simulation results, and Peck fitting curves align well for both sections, all exhibiting the typical Gaussian distribution. The settlement curves form a “V” shape, with symmetric settlement on either side of the tunnel centerline and maximum settlement occurring at the centerline itself. Because CDBC709 is located at the edge of the reinforcement zone (i.e., the interface between reinforced and unreinforced zones), the settlement there is slightly greater than that at CDBC719. Nevertheless, settlement at both sections remains within control limits, further confirming that the simulation and modified Peck formula accurately predict surface settlement. The error measurement RMSE between the CDBC-719 monitoring value and the theoretical value and the analog value were 0.81 and 0.39, respectively, and the error measurement RMSE between the CDBC-709 monitoring value and the theoretical value and the analog value were 0.78 and 0.55, respectively.

5.3. Analysis of Spatiotemporal Evolution Patterns of Ground Settlement

To analyze the trend of cumulative ground settlement during shield tunneling at the tunnel face and to assess the spatiotemporal distribution characteristics of settlement, numerical simulation data at the same locations as the two monitoring sections were extracted throughout the excavation process and compared with actual monitoring data. The results are illustrated in Figure 12, providing a basis for future settlement risk warning and assessment.
As illustrated in Figure 12a, both the monitoring and numerical simulation results at the CDBC719 section indicate a trend of initial increase, followed by a decrease, another increase, and then stabilization. Overall, the settlement is greater directly above the tunnel centerline than on either side. The maximum settlement occurred at the initial excavation stage, with a peak monitored value of −5.10 mm and a simulated value of −5.27 mm. As the shield advanced, settlement gradually decreased. Around 10 m of excavation (approximately the 9th segment ring), the shield exited the reinforced zone, resulting in increased surrounding soil settlement. Thereafter, settlement values stabilized and fluctuated around −2 mm in both monitored and simulated data.
Figure 12b illustrates that at the CDBC709 section, both monitored and simulated settlement initially decreased, then increased, and eventually stabilized. During excavation from 0 to 5 m, due to the shield being far from the monitoring points, settlement variations were minimal, with both monitored and simulated values around −0.5 mm. Between 6 and 10 m of excavation, as the shield approached the monitoring points, settlement increased, reaching its peak at 10 m, coinciding with the shield leaving the reinforcement zone. In this range, the maximum monitored settlement was −4.30 mm, while the simulated settlement was −5.85 mm. From 10 to 12 m, as the shield moved away from the monitoring points, settlement began to decrease, and simulation values stabilized. However, monitored settlement continued to increase, reaching a maximum of −10.1 mm. After remedial treatment (as detailed in Section 3.2), settlement gradually decreased and eventually stabilized.
In summary, the measured and simulated transverse ground settlement curves, as well as the values calculated using the Peck formula, correspond well. All exhibit a symmetric “V”-shaped distribution, with maximum settlement at the tunnel centerline and decreasing toward the sides. Cumulative settlement trends from both monitoring and simulation also align: the maximum settlement occurs when the shield is directly beneath the monitoring point, and although settlement fluctuates slightly after the shield exits the reinforcement zone, the overall variation is minimal. Both transverse and longitudinal settlement values remain within control limits, indicating that the reinforcement scheme effectively stabilized the ground in the launching area.

6. Discussion

Based on a real-world engineering project, this study employed MIDAS/GTS numerical simulation, settlement monitoring, and theoretical analysis to investigate the effects of shield launching in shallow-buried muddy soil layer. The research revealed the effectiveness of tunnel face reinforcement techniques, the spatiotemporal evolution of ground settlement, and the mechanism of ground disturbance propagation.
Given that this tunnel passes through shallow muddy soil layer with poor geotechnical properties, reinforcement measures suitable for other tunnel types—such as those with larger diameters or greater burial depths—can be developed by adjusting parameters such as the number and diameter of jet grouting piles, the thickness of replacement soil, and the extent of overburden back-pressure, followed by corresponding numerical analyses. Numerical simulation results indicate that the greatest settlement occurs near the edges of the jet grouting reinforcement zones. Therefore, for similar projects involving shield tunneling across different soil strata, special attention should be paid to construction safety, and the monitoring frequency should be increased accordingly.
This study did not consider the potential impact of nearby dynamic loads during construction. Moreover, variations in tunneling parameters can significantly affect ground settlement. Future work should involve more in-depth theoretical analyses to better understand ground deformation mechanisms during shield tunneling.

7. Conclusions

(1)
After applying a reinforcement scheme of replacement filling + high-pressure jet grouting piles + overburden counterpressure at the tunnel face, transverse ground deformation during shield tunneling manifested as crown settlement and invert uplift. Scheme II resulted in more uniform and smaller deformations, with a maximum settlement of −26.94 mm and a maximum uplift of 29.83 mm, both within acceptable deformation control limits.
(2)
During excavation in the reinforced area, longitudinal ground deformation was mainly concentrated ahead of the shield machine at the crown and invert. Upon reaching the junction between reinforced and unreinforced zones, the settlement zone remained in front of the shield, while uplift was primarily observed at the invert behind the machine within the reinforced area. During excavation in the unreinforced zone, the maximum settlement consistently occurred at the crown of the No. 9 segment ring segment in the rear reinforced area, and the maximum uplift consistently appeared at the invert of the No. 4 segment ring segment. Scheme II provided better control of longitudinal ground deformation.
(3)
Throughout the entire shield tunneling process, both maximum settlement and uplift values followed a trend of initial increase, subsequent decrease, and then increase again before stabilizing. Compared to Scheme I, Scheme II yielded lower maximum values for both settlement and uplift, at −26.94 mm and 29.83 mm, respectively. The settlement distribution range was narrower at 20.31 mm, all within the specified deformation control limits.
(4)
During the entire tunneling process, the tunnel settlement along the transverse cross-section displayed a typical “V”-shaped distribution, with the greatest ground settlement occurring along the tunnel centerline. Cumulative ground settlement peaked when the shield passed beneath the monitoring point. As the shield approached the boundary between the reinforced and unreinforced zones, settlement values increased slightly but remained within a controlled range and gradually stabilized thereafter.

Author Contributions

Writing—original draft preparation, J.Z.; writing—review and editing, X.B.; funding acquisition, J.Z. and X.B. All authors have read and agreed to the published version of the manuscript.

Funding

This research is supported by the Basic Scientific Research Business Fee Project of Universities Directly under the Inner Mongolia Autonomous Region (Grant No. 2024XKJX009); Natural Science Foundation of Inner Mongolia of China (Grant No. 2024LHMS05044). China Railway Twenty Bureau Group Limited Research Program Projects (Grant No. YF2105SD08B).

Institutional Review Board Statement

Not applicable.

Informed Consent Statement

Not applicable.

Data Availability Statement

The original contributions presented in this study are included in the article. Further inquiries can be directed to the corresponding authors.

Acknowledgments

The authors of the article sincerely appreciate and thank all the people who made it possible to implement this project.

Conflicts of Interest

Author Jia Zhang was employed by the company “China Railway No. 20 Engineering Group Co., Ltd.”. The remaining author declares that the research was conducted in the absence of any commercial or financial relationships that could be construed as a potential conflict of interest.

References

  1. Wang, Y. Study on Risk Management of Shield Tunnel Construction in Metro Engineering. Master’s Thesis, Beijing Jiaotong University, Beijing, China, 2021. [Google Scholar]
  2. Li, W.; Li, Z.; Ren, H.; Shi, X.; Zhang, Y. Soil Settlements and Surrounding Structure Failure Mechanism due to Shield Tunneling in Metro Construction. J. Disaster Prev. Mitig. Eng. 2018, 38, 472–479. [Google Scholar]
  3. Wang, T.; Dai, Z. Application on Ground Reinforcement Method of Launching Shaft for Shield Tunnel. J. Railw. Eng. Soc. 2014, 31, 90–95+100. [Google Scholar]
  4. Shi, W. Application of high pressure jet grouting pile technology in the reinforcement area of shield end shaft. J. Shijiazhuang Tiedao Univ. Nat. Sci. Ed. 2017, 30 (Suppl. S1), 64–67. [Google Scholar]
  5. Ding, W.; Liu, K.; Wang, X.; Zhu, J.; Li, S. Reinforcement Optimization of Starting Stratum of Earth-Pressure Balance Shield. J. South China Univ. Technol. Nat. Sci. Ed. 2017, 45, 105–112. [Google Scholar]
  6. Yang, C.; Gou, X.; Zhao, W.; He, S.; Li, W. Three-dimensional Numerical Analysis of the Impact of Shield Wall Breaking on the Surrounding Environment in Deep Soft Soil Area. Bull. Sci. Technol. 2023, 39, 91–96. [Google Scholar]
  7. Liu, F.; Cui, J.; Xu, W.; Gao, F. Ground Settlement Characteristics for Launching Section of Shallow Overburden Excavation of Large-diameter Slurry Shield Tunnel. J. Railw. Eng. Soc. 2018, 35, 36–40+69. [Google Scholar]
  8. Xiao, G.; Lei, B.; Zhan, Y. Numerical Simulation of End Shield Reinforcement Technology in Deep and High Water Pressure Stratum. J. Water Resour. Archit. Eng. 2022, 20, 75–82. [Google Scholar]
  9. Ma, Q.; Zhang, X.; Shu, H. Innovative Grouting Reinforcement Techniques for Shield Tunnels: A Case Study on Surface Settlement Mitigation. Appl. Sci. 2025, 15, 4623. [Google Scholar] [CrossRef]
  10. Hong, Z.; Fu, S.; Wu, Y.; Zhang, Y.; Lu, L. Numerical research on the impact of horizontal freezing on existing underground structures in shield reception. Front. Earth Sci. 2024, 12, 1511744. [Google Scholar] [CrossRef]
  11. Mooney, M.A.; Grasmick, J.; Kenneally, B.; Fang, Y. The role of slurry TBM parameters on ground deformation: Field results and computational modelling. Tunn. Undergr. Space Technol. 2016, 57, 257–264. [Google Scholar] [CrossRef]
  12. Peck, R.B. Deep excavations and tunneling in soft ground. In Proceedings of the Seventh International Conference on Soil Mechanics and Foundation Engineering, Mexico City, Mexico, 25–29 August 1969; pp. 225–281. [Google Scholar]
  13. Lu, S.; Wang, W.; Xiao, L. Evaluation of Soil Structure Characteristics of Wenzhou Soft Clay and Analysis of Tunnelling Disturbance with Tunnel Boring Machines. Ind. Constr. 2023, 53, 1–10+20. [Google Scholar]
  14. Sun, M. Study on the Combined Reinforcement of Silt Stratum in Large Longitudinal Slope Shield Tunnel. Railw. Constr. Technol. 2024, 12, 194–198. [Google Scholar]
  15. Wang, T.; Zhao, Q. Research on Tunnel Entrance Construction Technology under the Geological Condition of Silt in Shallow Buried Gully. Mod. Tunn. Technol. 2024, 61 (Suppl. S1), 1039–1046. [Google Scholar]
  16. Jin, H.; Yuan, D.; Wang, E. Experimental investigation on shield-soil interaction during shield posture adjustment in soft ground. Tunn. Undergr. Space Technol. 2025, 158, 106386. [Google Scholar] [CrossRef]
  17. Gao, F.; Li, Z.; Yang, K.; Chen, Y.; Bian, X. Shield tunneling-induced disturbance in soft soil. Transp. Geotech. 2023, 40, 100971. [Google Scholar] [CrossRef]
  18. Imteyaz, W.; Mishra, S. Stability Analysis of the Shallow Tunnel Under Soft Ground Regime. Mater. Today Proc. 2023, 87, 152–158. [Google Scholar] [CrossRef]
  19. Bao, X.; Wang, S.; Li, W.; Zhang, W.; Wu, N. Analysis of Excavation Stability of Backfill Soil Large Span Super Shallow Buried Metro Tunnel. Sci. Technol. Eng. 2022, 22, 3342–3348. [Google Scholar]
  20. Wang, X.; Zhou, S.; Chi, J.; Wu, X. Study on Shallow-buried Tunnel’s Thickness-span Ratio in Upper-soft Lower-hard Ground. Chin. J. Undergr. Space Eng. 2011, 7, 700–705. [Google Scholar]
  21. GB 50911-2013; Technical Code for Monitoring in Urban Rail Transit Projects. China Architecture & Building Press: Beijing, China, 2013.
  22. Ding, W.; Huang, X.; Dai, Z.; Wang, C.; Wang, Z.; Yu, W. Analysis of the Collapse Mechanism and Stabilization Optimization of the Composite Stratum at the Boundary between Prereinforced and Unreinforced Areas near a Shield Launching Area. Int. J. Geomech. 2023, 23, 05023002. [Google Scholar] [CrossRef]
  23. Wu, Q. Study on Construction Safety Risks Control Technology for Tunneling Adjacent to Existing Buildings (Structures) Within Shield Launching/Arriving Section. Ph.D. Thesis, Beijing Jiaotong University, Beijing, China, 2020. [Google Scholar]
  24. Wang, L.; Zhong, J.; Zhu, B. Numerical Analysis on Ground Settlement Induced by Shield Tunnelling with Adjacent End Shaft Works. Mod. Tunn. Technol. 2022, 59, 124–132. [Google Scholar]
  25. Chen, Y.; Li, X.; Chen, S. Prediction of Surface Settlement Caused by Shield Construction in Tunnel Based on Peck Formula. Saf. Environ. Eng. 2023, 30, 79–83+91. [Google Scholar]
  26. Huang, L. Correction and Application of Peck Formula in Shield Tunnel of Silty Clay Layer. J. Lanzhou Inst. Technol. 2019, 26, 23–28+68. [Google Scholar]
Figure 1. Shield tunnel route map.
Applsci 15 07657 g001
Figure 2. Tunnel model.
Applsci 15 07657 g002
Figure 3. Stratigraphic deformation of shield tunnel cross-section under different reinforcement schemes.
Applsci 15 07657 g003
Figure 4. Ground deformation in a longitudinal section of shield tunnel under different reinforcement schemes.
Applsci 15 07657 g004
Figure 5. Maximum settlement values of strata under different conditions of reinforcement schemes.
Applsci 15 07657 g005
Figure 6. Maximum uplift values of strata under different conditions of reinforcement schemes.
Applsci 15 07657 g006
Figure 7. End reinforcement diagram.
Applsci 15 07657 g007
Figure 8. Layout of monitoring points.
Applsci 15 07657 g008
Figure 9. Schematic diagram and site picture of automatic monitoring instrument.
Applsci 15 07657 g009
Figure 10. Monitoring point data.
Applsci 15 07657 g010
Figure 11. Comparison of settlement in monitoring sections.
Applsci 15 07657 g011
Figure 12. Comparison of monitoring data with simulated data.
Applsci 15 07657 g012
Table 1. Table of geotechnical physical and mechanical parameters.
Ground LevelSoil Layer NameIntensity/(g/cm3)Water Content/%Void Ratio/%Modulus of Compressibility/MPaDeformation Modulus/MPaPermeability Coefficient/(m/d)Cohesion/KPaInternal Friction Angle/°
<1>Miscellaneous fill2.0232.262.24.38100.1~215.012.0
<2-1A>Mucky soil1.5473.8199.41.8920.0016.04.0
<4N-2>Silty clay1.9925.572.25.17120.05019.212.6
<6>Completely weathered coarse sandstone2.0320.060.55.47600.40026.020.0
<7-1>Strongly weathered coarse sandstone2.0615.150.65.81900.60035.025.0
<8-1>Moderately weathered coarse sandstone2.5713.660.35.91920.900250.028.0
Table 2. Mechanical parameters of pipe sheet, shield shell, and rotary pile models.
MaterialElastic Modulus/MPaPoisson’s Ratio
Segment35,0000.2
Shield shell208,0000.31
Jet grouting pile30.90.3
Disclaimer/Publisher’s Note: The statements, opinions and data contained in all publications are solely those of the individual author(s) and contributor(s) and not of MDPI and/or the editor(s). MDPI and/or the editor(s) disclaim responsibility for any injury to people or property resulting from any ideas, methods, instructions or products referred to in the content.

