Article

Detection of Psychomotor Retardation in Youth Depression: A Machine Learning Approach to Kinematic Analysis of Handwriting

1
School of Electrical Engineering, University of Belgrade, Bulevar kralja Aleksandra 73, 11120 Belgrade, Serbia
2
Clinic of Neurology and Psychiatry for Children and Youth, Faculty of Medicine, University of Belgrade, Dr Subotića Starijeg 6a, 112112 Belgrade, Serbia
3
Department of Network and Data Science, Central European University, Quellenstraße 51, 1100 Vienna, Austria
*
Author to whom correspondence should be addressed.
Appl. Sci. 2025, 15(14), 7634; https://doi.org/10.3390/app15147634
Submission received: 5 June 2025 / Revised: 2 July 2025 / Accepted: 7 July 2025 / Published: 8 July 2025

Abstract

Depressive disorders significantly impact individuals worldwide, including children and adolescents. Despite their widespread occurrence, early and precise diagnosis of depressive disorders remains a complex and challenging task, particularly in younger populations. This study proposes a novel machine learning framework leveraging kinematic handwriting analysis to enhance the detection of psychomotor disturbances indicative of psychomotor retardation in youths with depression. The handwriting data were acquired from 20 youths with depression and 20 healthy controls. All participants completed a simple repetitive handwriting task: continuous writing of the small cursive Latin letter “l”. Segmentation of the handwriting data into individual “Letters” was conducted, and 177 kinematic features were extracted and analyzed. Statistical methods were used to identify significant features. After recursive feature elimination, classification was achieved through machine learning algorithms: logistic regression, support vector machine, and random forest. After the identification of 40 significant features, logistic regression, utilizing an optimal three-feature subset, achieved the highest accuracy in classifying individual letters of 76.7% and the highest accuracy in classifying subjects of 82.5%. The feature selection process revealed that velocity-related features were most effective in distinguishing patients with depression from controls, expectedly reflecting a slowdown in psychomotor functioning among the patients. The findings demonstrate that kinematic handwriting analysis, when combined with machine learning techniques, offers a promising tool to support objective recognition of psychomotor speed, providing insight into psychomotor retardation in youth with depression.

1. Introduction

Depression is a widespread mental health disorder that affects both adults and young people, including children and adolescents. The World Health Organization has reported that depression affects approximately 280 million people globally [1]. The number of depression cases was steadily increasing in parallel with the world population [2] until the onset of the COVID-19 pandemic, after which it rose dramatically [3]. Despite the significant scale of depression and the substantial personal and governmental social costs, the condition remains insufficiently recognized—even though it accounts for 30% of years lived with disability (YLDs) for mental disorders worldwide [4]. The pooled prevalence rate of depressive disorder (DD) among European children and adolescents is 1.7% (95% CI: 1.0–2.9%) [5], while the global prevalence is 2.6% (95% CI 1.7–3.9%) [6]. Prevalence rates are 4.2 times higher among secondary school children [5], with a median age of onset for the first symptoms of 15.5 years [7]. DD imposes a significant burden on young people, ranking among the leading causes of years lived with disability due to mental health conditions [8].
According to current classification systems for mental disorders [9,10], DD encompasses a broad group of mood disorders, including disruptive mood dysregulation disorder, major depressive disorder, persistent depressive disorder, and others. The core symptoms required for diagnosing specific forms of DD are grouped into three main domains [10]: affective (such as depressed mood or irritability in youth, and a marked loss of interest or pleasure), cognitive–behavioral (including impaired concentration or indecisiveness, feelings of low self-worth or guilt, hopelessness, and suicidal behaviors), and neurovegetative (such as disrupted sleep, changes in appetite or weight, psychomotor agitation or retardation, and reduced energy or fatigue). These symptoms collectively impair an individual’s ability to function in daily life [10].
In addition to classical affective and cognitive–behavioral symptoms, psychomotor symptoms are an integral component of depressive disorder (DD) symptomatology [11]. Studies focused specifically on DD consistently identify motor alterations in gross and fine motor activity, discrete body movements, speech, and motor reaction time. For instance, gross motor changes include slow gait, reduced step and stride length and width, slower turning and reaction times, and overall abnormal movements [12]. More subtle findings involve fine motor changes such as alterations in speech patterns [13] and slower handwriting performance [14]. Neuropsychological studies link psychomotor symptoms predominantly to impaired processing speed, manifested as slower movement onset, preparation, and execution [15].
Psychomotor retardation is regarded as one of the key aspects of DDs [9,10] involving both motor and cognitive impairments that affect speech, movement, and ideation [16]. It is currently defined as a visible, generalized slowing of movements and speech [10] and is recognized by features such as a fixed gaze, poor maintenance of eye contact, gross psychomotor slowing—including limited movement of the hands, legs, torso, and head—slumped posture, and related signs [17,18]. It is important to note that the term psychomotor retardation does not equate to cognitive and psychomotor developmental delay observed in neurodevelopmental disorders [19].
Assessments of psychomotor retardation are based on three primary approaches: clinical rating scales (typically including items related to psychomotor disturbances and cognitive or motor aspects of retardation), objective measures (assessing aspects of speech, eye movements, or motor activity), and cognitive measures (primarily evaluating reaction times) [16,20,21,22]. Drawing tasks are considered simple yet effective objective tools, relying on kinematic analysis of drawing and handwriting movements to enable precise, quantifiable evaluation of motor abnormalities in depression [14,16,21].
Several studies have relied on clinical observations of psychomotor signs of depression [17,23], including those involving handwriting analysis, which identified slower movements and reduced pressure during handwriting in both adults with depressive disorder (DD) [17] and youth with DD [24]. Handwriting analysis has also been successfully applied in clinical studies of neurodevelopmental disorders such as dysgraphia [25,26], attention-deficit/hyperactivity disorder (ADHD) [27,28], developmental coordination disorder [29], and autism spectrum disorders [30].
While some studies have used handwriting data to evaluate the diagnostic potential for detecting depressive disorder (DD), most have relied on statistical analyses to identify significant handwriting features [14,24,31,32,33]. A limited number of studies have employed machine learning approaches to differentiate individuals with DD from control groups [21,34,35,36]. However, to our knowledge, no published research has specifically applied machine learning techniques to handwriting analysis in youth populations with DD.
This study aimed to evaluate a machine learning approach for recognizing psychomotor retardation in youth depression. To achieve this, an extensive set of kinematic handwriting features was first extracted from recordings of a simple repetitive task—writing the lowercase cursive letter “l.” The feature set was then refined using statistical analysis, followed by a feature reduction algorithm to identify optimal subsets across different feature set sizes. Finally, several machine learning algorithms were applied to classify individuals with depressive disorder (DD) versus a control group:
The main contributions of this research are as follows:
  • A novel decision-support screening tool based on kinematic handwriting analysis of a simple repetitive handwriting task in youth DD is proposed for the first time.
  • DD versus control group classification results, using machine learning with reduced feature sets, are systematically compared.
  • Optimal feature subsets are identified, and the most frequently recurring features are analyzed.

2. Materials and Methods

2.1. Subjects

Our study included 40 participants divided into two groups: the DD group, consisting of youths diagnosed with depressive disorder (DD), and the control group of healthy peers. Table 1 provides a summary of the subject dataset. The dataset was obtained from previous research [24].
The DD group consisted of 20 subjects, of whom 16 (80%) were female, with a mean age of 14.65 years (SD = 1.63). In total, 90% of participants were right-handed. All individuals in the DD group were diagnosed according to DSM-5 diagnostic criteria for depressive disorder [9]. In total, 55% of the subjects received antidepressant therapy—either selective serotonin reuptake inhibitors (SSRIs) or tricyclic antidepressants (TCAs)—an average of 15.8 weeks (range: 1–48 weeks) prior to the experiment.
The control group consisted of 20 healthy subjects, of whom 10 (50%) were female, with a mean age of 15.9 years (SD = 0.45). In total, 85% of participants were right-handed. All subjects had no history of current or past neurological or psychiatric disorders.
The following self-report questionnaires were used: (1) handedness—Edinburgh Handedness Inventory (EHI) score [37,38]; (2) depression—Short Mood and Feelings Questionnaire [39]; and (3) anxiety—Screen for Child Anxiety-Related Emotional Disorders [40].

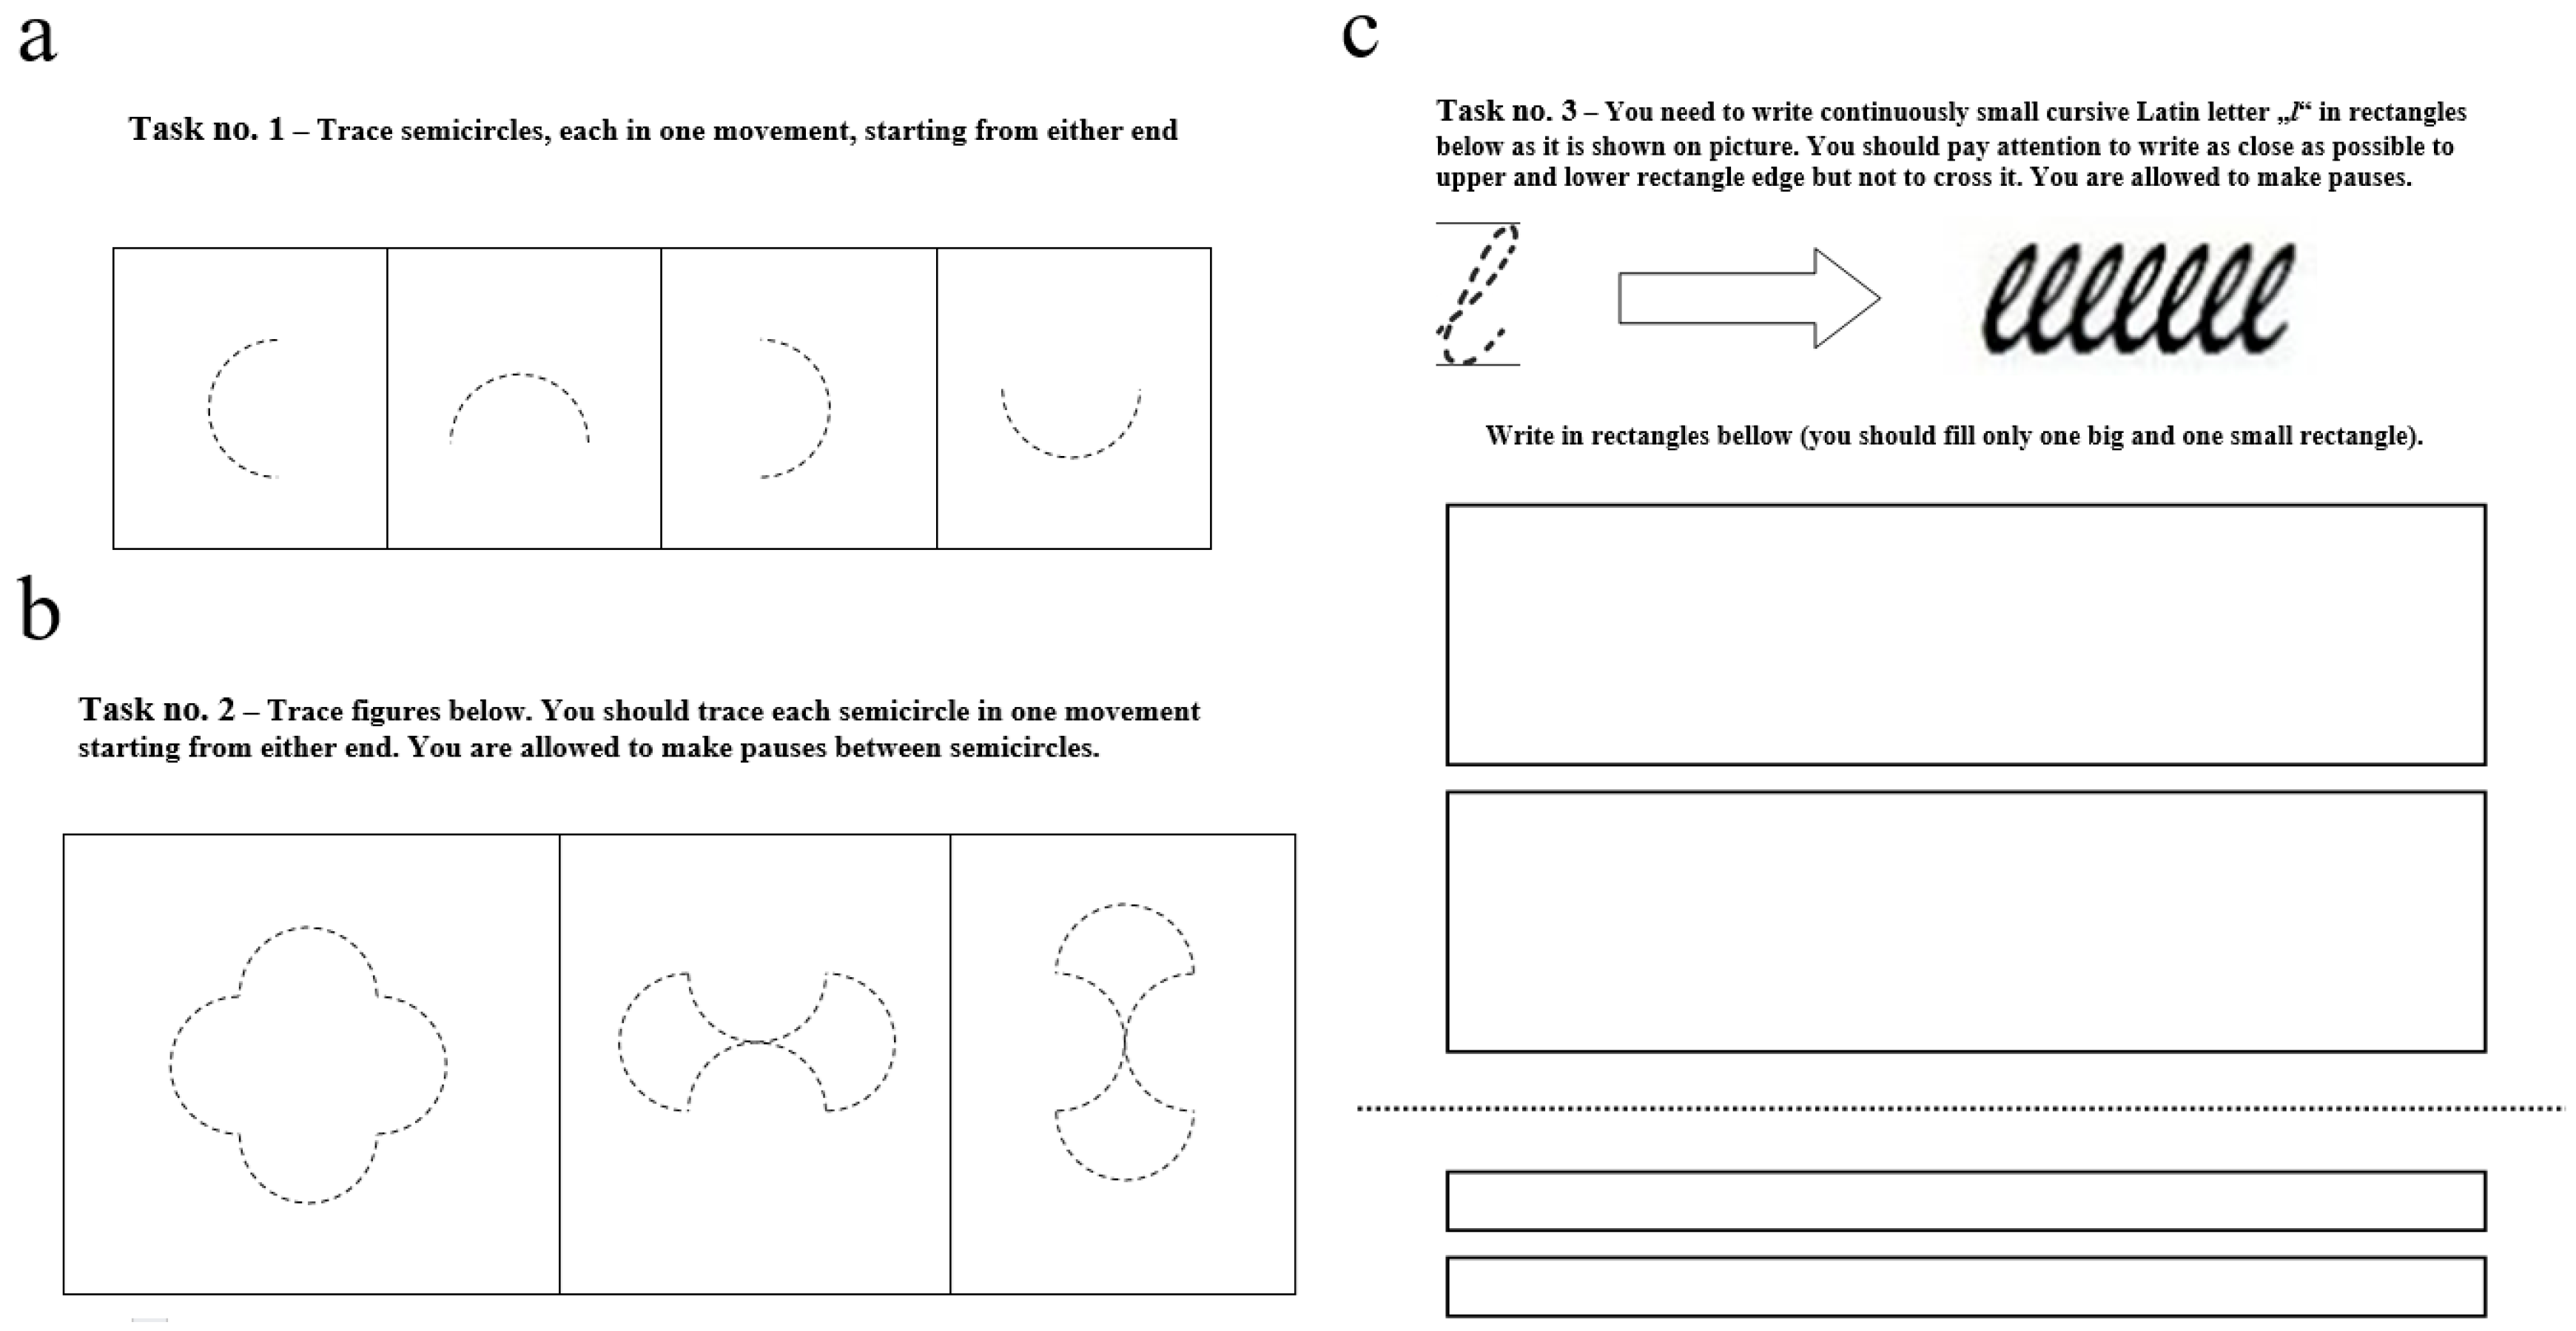
2.2. Experimental Protocol

The DD group participated in the experiment at the Clinic for Neurology and Psychiatry for Children and Youth in Belgrade, Serbia. The control group was recruited and tested at the high school “Gimnazija Smederevo” in Smederevo, Serbia. Prior to the experiment, all participants were informed about the experimental protocol. Written informed consent and permission were obtained from all participants and the parents or guardians of minors. The Ethical Committee of the Clinic for Neurology and Psychiatry for Children and Youth, Belgrade, approved the study (Approval No. 21-79/02, dated 16 July 2018).
The handwriting experimental protocol consisted of the following three tasks [24,41]:
  • First task—Tracing Single Semicircles: Participants were instructed to trace four semicircles, each completed in a single stroke. The semicircles were presented as dashed outlines within separate squares and rotated clockwise by 90° increments.
  • Second task—Tracing Composite Figures: Participants traced three composite figures, each consisting of four semicircles oriented differently. The dimensions and orientations matched those in Task 1, and the figures were also presented as dashed outlines within individual squares
  • Third task—Repetitive Handwriting of a Cursive Letter: Participants continuously wrote the lowercase cursive Latin letter “l” within two rectangles: a larger rectangle measuring 40 × 160 mm (LR subtask) and a smaller rectangle measuring 9 × 160 mm (SR subtask). The number of letters was not predefined; participants stopped writing at their own discretion.
A visual representation of the A4 templates used for the handwriting tasks is provided in Appendix A. Each task was performed on a separate A4 sheet affixed with adhesive tape to the writing surface of a digital graphic tablet, positioned consistently before each task. Prior to every task, participants received brief verbal instructions, and a short explanatory text was displayed above each task on the template. For the research presented in this paper, we focused specifically on analyzing handwriting generated during the SR subtask of the third task, which involved the continuous writing of the lowercase cursive letter “l.”.
The handwriting was acquired with the digital graphic tablet Wacom® Intuos 4 XL (Wacom Europe GmbH, Krefeld, Germany) with a cordless pen (which resembles a standard ballpoint pen in shape and weight) that enables on-surface and in-air handwriting (sampling frequency = 200 Hz, pen accuracy ± 0.25 mm, pressure levels = 2048). Custom-made acquisition software LabHand 0.7 [42] was used for the measurement recording. The recorded measurement files contain three signals: pen position (X(t) and Y(t) signals) and pen pressure (p(t) signal).

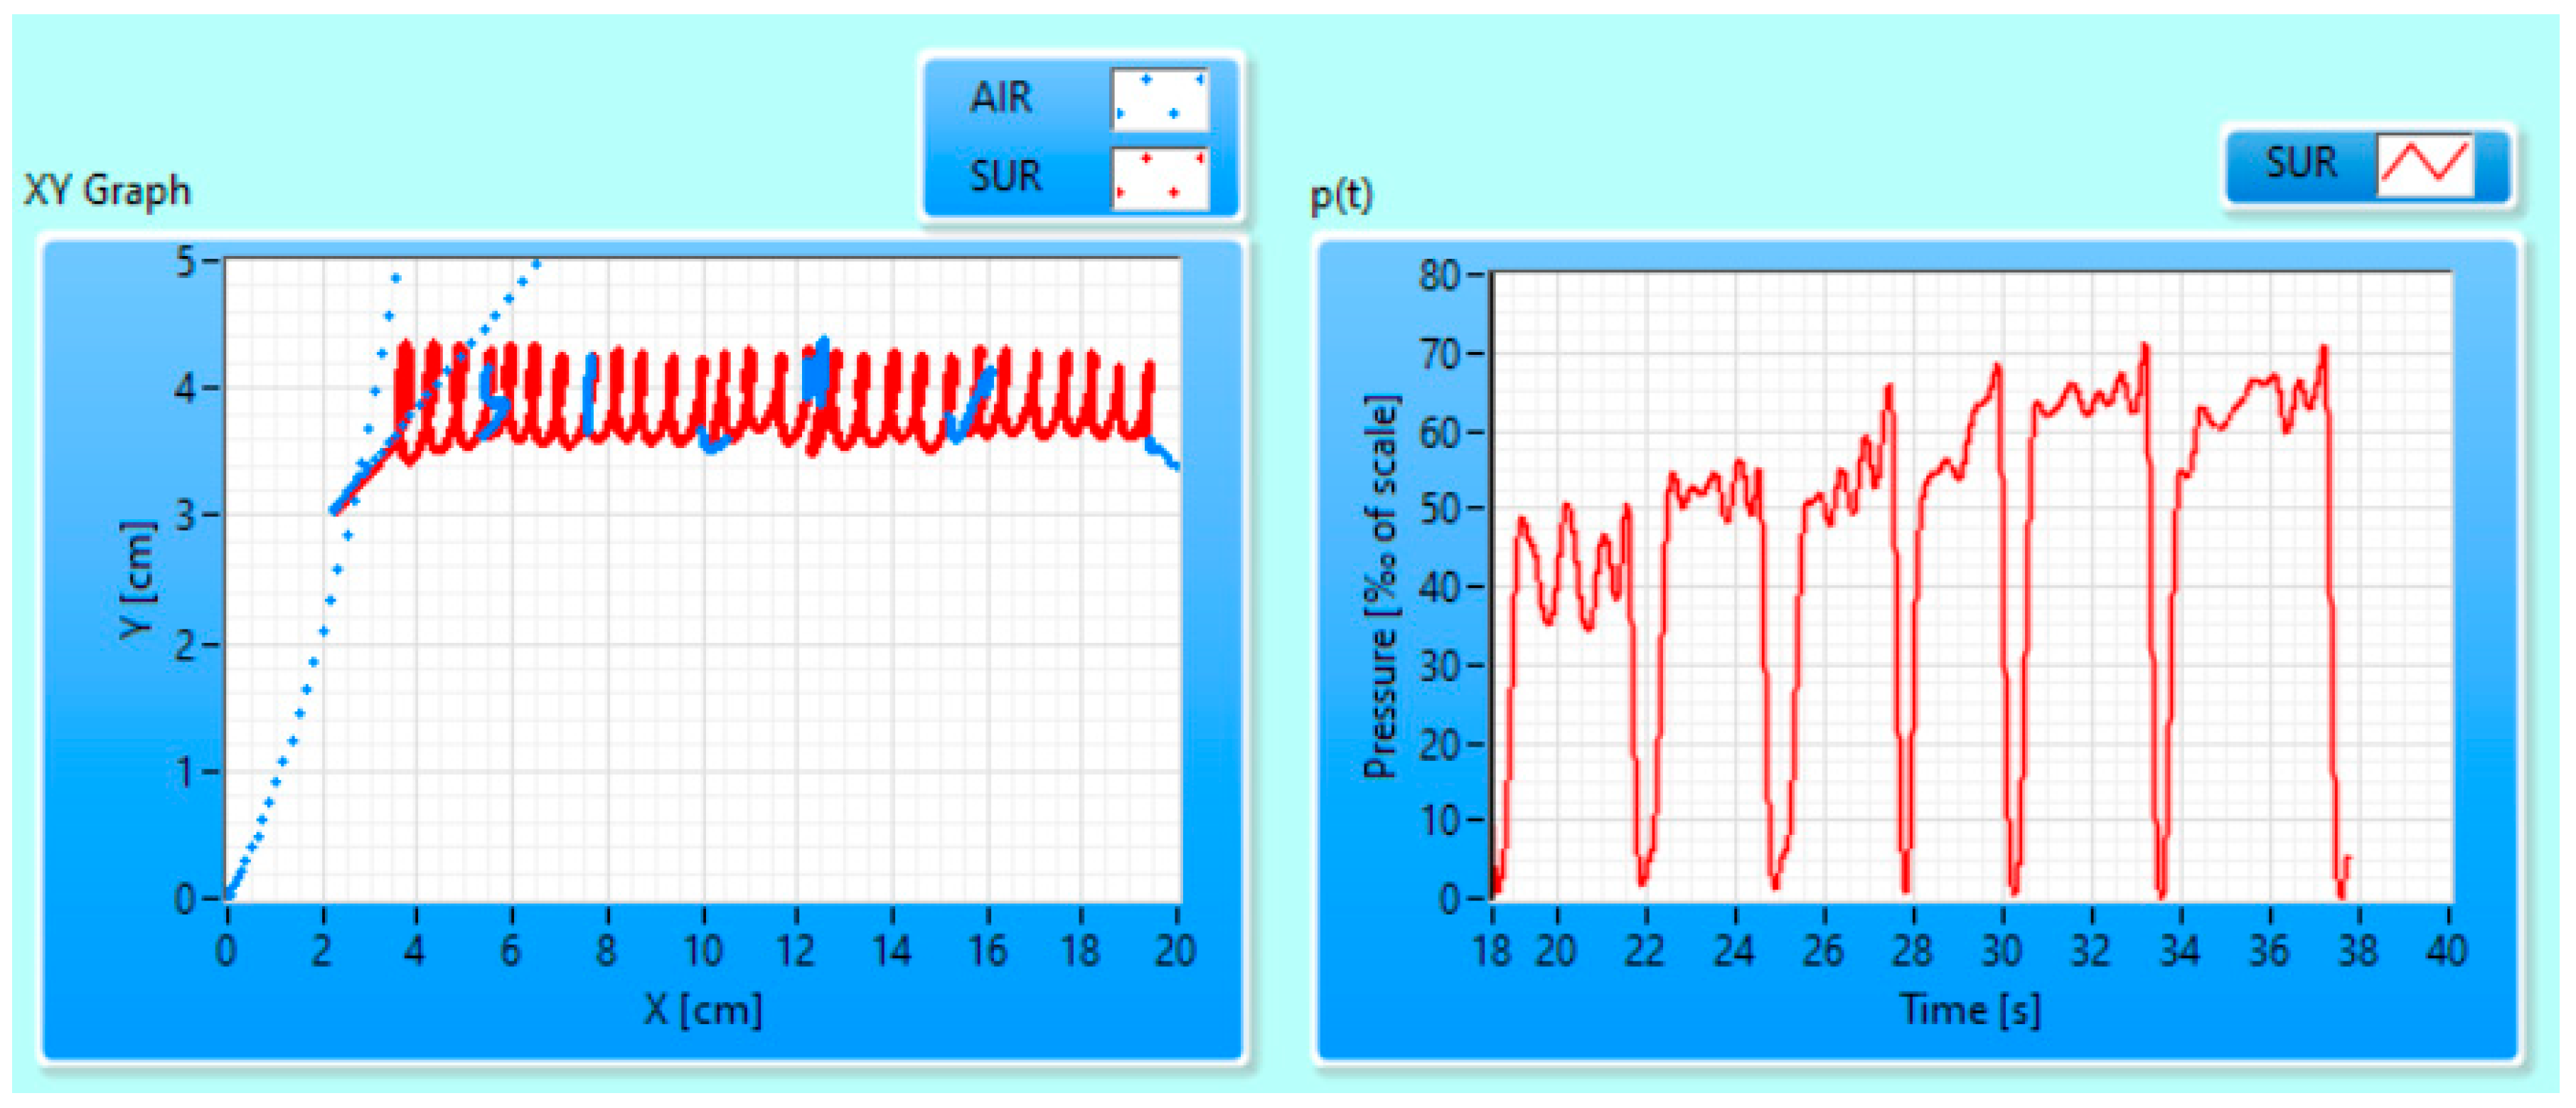
2.3. Letter Segmentation and Feature Extraction

The recorded measurement files of the SR subtask were given as input to GT Analyzer 1.0, a custom-made application [43] that enables (1) reading of recorded (X, Y, p) signals; (2) “letter” segmentation, extraction and export of 177 standard kinematic handwriting features from (X, Y, p) for each subject; and (3) visualization of extracted features as well as raw (X, Y, p) data. An example of the visualization of raw (X, Y, p) data is shown in Figure 1.
“Letter” segmentation in the SR subtask (a division of consecutive small cursive letters “l” to segments containing only one “l” letter) was performed in the following steps:
  • Calculation of velocity per y-axis Vy(t) = dY(t)/dt for the whole SR subtask;
  • Finding local maximums of Vy(t) and using these maximums as letter boundaries within the SR subtask.
After “letter” segmentation, features were calculated on each “letter” segment and used for further statistical analysis. The list of 177 implemented standard handwriting features consisted of statistical handwriting features and “letter” handwriting features. Eleven statistical handwriting features (median, mean, standard deviation, variance, coefficient of variation, maximum value, minimum value, 10th, 25th, 75th, and 90th percentiles) were calculated for 15 variables presented in Table 2 (X(t), Y(t), p(t) and their 1st, 2nd, and 3rd derivatives as well as three total variables: total velocity, total acceleration, and total jerk). In total, 165 statistical handwriting features were extracted (11 statistical features × 15 variables = 165 features) on each valid “letter” segment. Twelve “letter” handwriting features were calculated on valid “letter” segments, and the list of “letter” features is presented in Table 3. The feature named normalized jerk was determined using the approach presented in [44].
Following the feature extraction, validation for each “letter” was performed by checking two criteria:
  • The absolute difference between LL for the “letter” and the median LL in the entire subtask does not exceed 20% of the median LL;
  • Vy(t) during the “letter” drawing time contains local minima.
If both criteria were satisfied, the “letter” segment was considered as the valid one, and the corresponding extracted features were exported for further analysis.

2.4. Statistical Analysis

All statistical analyses were performed using a Jupyter notebook written in Python 3.11.4.
The Mann–Whitney U test [45] was used to assess whether the DD and control groups differed significantly (p < 0.05) in age, Edinburgh Handedness Inventory (EHI) score, Short Mood and Feelings Questionnaire (SMFQ) score, and Screen for Child Anxiety-Related Emotional Disorders (SCARED) score. The Chi-squared test [46] was applied to evaluate group differences (p < 0.05) in gender and right-handedness.
Before the handwriting analysis, the data between subjects was balanced by selecting the same number of letters for all subjects. The number of valid “letters” was defined as the minimum number NL of valid “letter” segments per subject across the entire dataset (NL = 19 in our dataset). The first NL valid “letter” segments for each subject were selected for further analysis.
Statistical analysis aimed to identify the most significant features for machine learning classification. First, Bartlett’s test [47] with a p-value threshold of 0.05 was performed to retain only those features with similar variances across the DD and control groups [48]. Next, these filtered features were subjected to the Mann–Whitney U test [45], a non-parametric method to determine statistically significant differences in group medians. A Bonferroni correction [49] was applied by dividing the p-value threshold (0.05) by the number of tested features. Features that rejected the null hypothesis under this corrected threshold were deemed significant and used for machine learning classification (resulting in a feature set of Ns significant features).

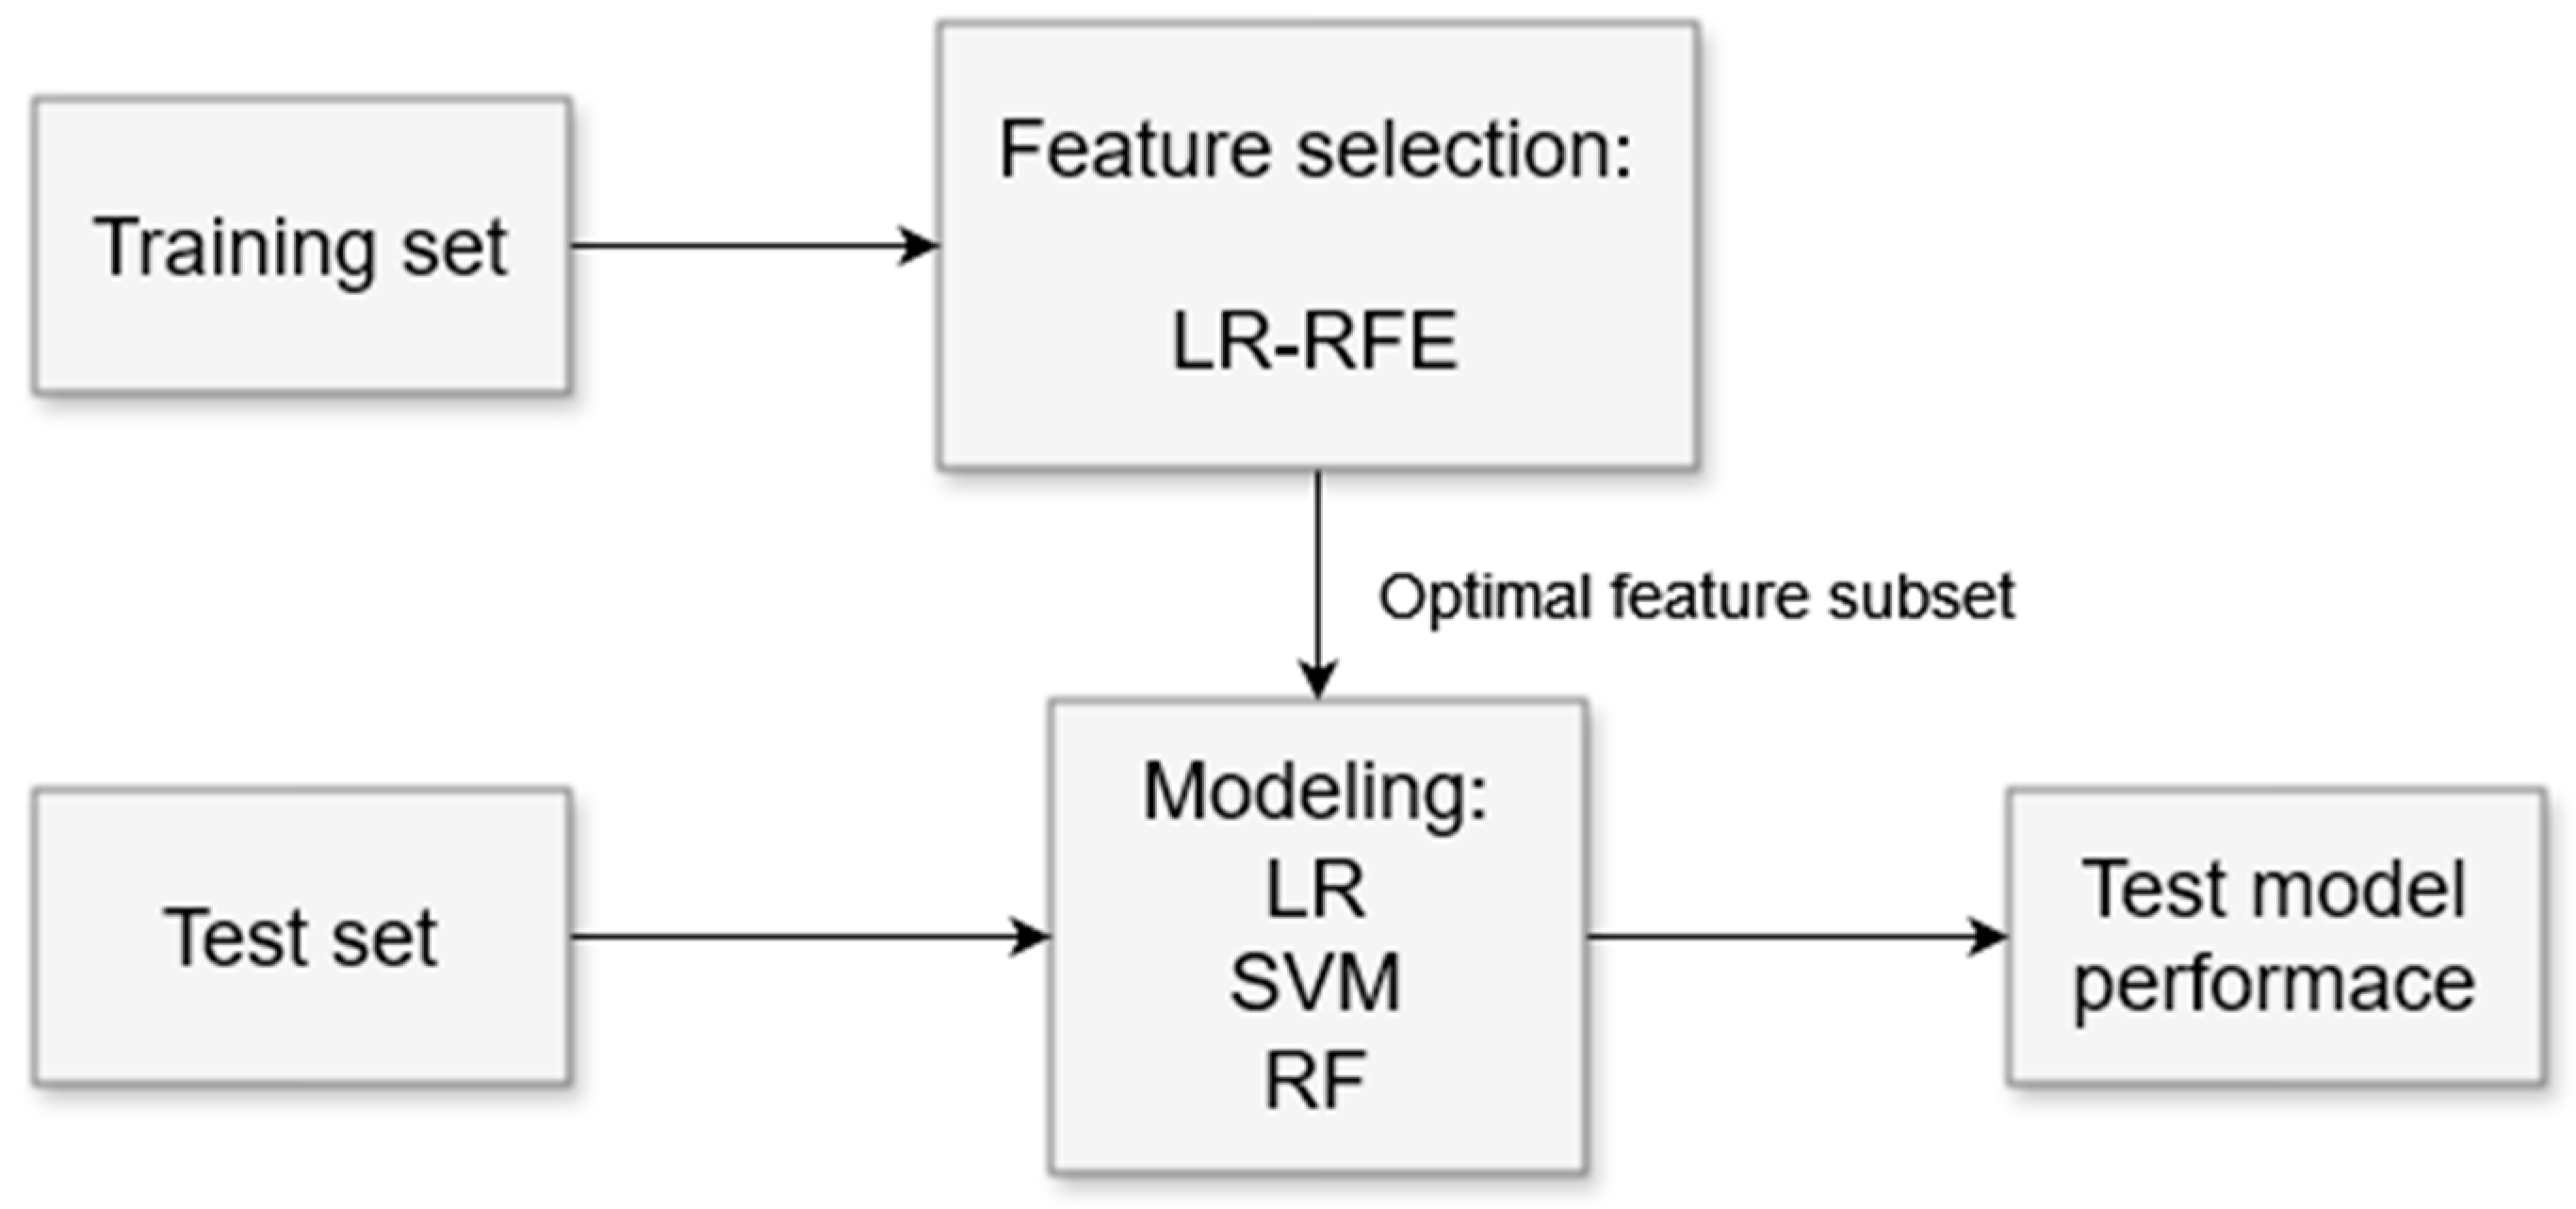
2.5. Machine Learning Analysis

The machine learning analysis was performed using a Jupyter notebook written in Python 3.11.4 programming language.
The block diagram illustrating the machine learning algorithm pipeline is presented in Figure 2. The input dataset comprises significant feature sets (Ns features; see Section 2.4), extracted from all valid “letter” segments across all subjects. Subject-wise leave-one-out cross-validation (LOOCV) was employed as the validation strategy, dividing the dataset into training and test sets.
The optimal feature subset was identified using the recursive feature elimination (RFE) algorithm [50], applied to the training set. Logistic regression (LR) served as the estimator for RFE (LR-RFE). To prevent overfitting, the regularization technique ElasticNet, which combines L1 and L2 penalty terms, was used. All hyperparameters configured for the LR model are detailed in Appendix B, Table A1.
All sizes N (N ∈ [1, Ns]) for the optimal feature subset were considered, resulting in Ns different lengths of the optimal feature subset.
The classification of valid “letters” in two classes (DD and control) using the obtained optimal feature subsets was performed on test sets by three classifiers (logistic regression—LR; support vector machine—SVM; random forest—RF) for each size of the optimal feature subset. All hyperparameters that were set for each classifier are shown in Appendix B.
Standard evaluation metrics—accuracy, recall, and precision—for individual “letter” classification were calculated across all test sets obtained through subject-wise leave-one-out cross-validation (LOOCV), resulting in Letter Accuracy, Letter Recall, and Letter Precision, respectively. These metrics were then used to estimate Subject Accuracy, defined as the percentage of subjects correctly classified as either belonging to the depressive disorder (DD) group or the control group. A subject was considered correctly classified if at least 50% of their letters were correctly labeled by the model.

3. Results

Between the groups, the statistical analysis of age, gender, EHI score, SMFQ, SCARED, and right-handed subjects revealed a significant difference in gender and EHI score (p > 0.05).
Bartlett’s test resulted in the extraction of 69 features (out of a total of 177) that met the criteria for variance similarity between the depressive disorder (DD) group and the control group. In the subsequent step, the Mann–Whitney U test with Bonferroni correction identified a subset of Ns = 40 features (from the initial 69) that showed statistically significant differences in group medians. A list of the five features with the lowest p-values is presented in Table 4. The complete set of significant features is provided in Appendix C, along with corresponding values for means, standard errors, p-values, and absolute correlation coefficients with class labels (|ρ|).
After the optimal feature subset extraction by the RFE on the significant feature set, we fitted the training data into three different models and checked the evaluation results on the test data. To explore the impact of feature set size, we tested a range from N = 1 up to the maximum size of N = 40. Figure 3 illustrates the letter classification accuracy (Letter Accuracy) for all three models across the full range of optimal feature subset sizes (N ∈ [1, Ns], where Ns = 40). Orange lines highlight three prominent optimal subset sizes that yielded notable optimal feature subset sizes.
Table 5 presents the classification results by three classification models (LR, SVM, and RF) for four feature set sizes N (N ∈ {3,9,11,40}); the averaged “letter” classification accuracy (Letter Accuracy) alongside the recall (Letter Recall), precision (Letter Precision), and subject classification accuracy (Subject Accuracy) is given.
The highest Subject Accuracy using the smallest optimal feature subset was achieved by LR: 82.5% (33 out of 40 subjects correctly classified), with a corresponding Letter Accuracy of 76.7% for the three-feature set. Notably, RF yielded the same Subject Accuracy (82.5%) with the full N = 40 feature set, though its Letter Accuracy was slightly lower at 75.3%.
Figure 4 shows the frequency of the optimal feature subset for subset sizes N (N ∈ {3,9,11}) after LR-RFE through LOOCV. The optimal feature subsets are abbreviated with the letter “C” accompanied by a number. Table 6 shows the dominant (most frequent) optimal feature subsets in the given subset size N (N ∈ {3,9,11}) after LR-RFE through LOOCV. The complete list of these subsets and their respective abbreviations is given in Appendix D.
Figure 5 shows the boxplots of three features (Vy_std, Vy_pct75, V_pct25) included in all dominant optimal feature subsets for subset size N ∈ {3,9,11}. Boxplots of other features that appeared in dominant optimal sets for subset size N ∈ {9,11} are presented in Appendix E. The red horizontal line corresponds to the median and whiskers illustrate the range between the lowest datum above Q1 − 1.5 * (Q3 − Q1) and the highest datum below Q3 + 1.5 * (Q3 − Q1), where Q1 and Q3 are the first and third quartiles. Data points beyond these whiskers are considered outliers and plotted as individual points.

4. Discussion

Despite the considerable implications of depression for an individual’s well-being and public health, limited attention has been paid to the implementation of objective methods to identify specific depressive symptoms, particularly those related to psychomotor activities. Existing assessments provide valuable information, but there is a growing need for innovative approaches that could improve their accuracy, comprehensiveness, and effectiveness in diagnosing and managing depressive conditions.
Our results showed that the primary kinematic difference between depressive and healthy subjects was the reduced velocity of handwriting movements observed in the DD group. This slowdown in writing strokes has previously been referred to as psychomotor retardation in related studies [17,18,23,34]. The focus of this study was the objective analysis of psychomotor retardation in youths, assessed through handwriting during a simple task—the continuous writing of small cursive letters “l”—which can be easily implemented across diverse cultures and languages. Prior handwriting studies in depressed patients have primarily relied on statistical analysis of handwriting features to identify DD [14,21,31,32,33], with a few incorporating machine learning methods to recognize depressive trends [34,35]. To the best of our knowledge, no published research has applied machine learning techniques to detect psychomotor retardation specifically in youths with DD.
The dataset described in this paper—including the three tasks performed (semicircle tracing, figure tracing, and cursive letter writing)—was previously used in an earlier research study [24], but only for overall statistical analysis of individual tasks, without implementing “letter” segmentation. In the present study, we focused specifically on the writing task based on the repeated execution of a single motor maneuver: writing the lowercase cursive letter “l.” This approach offers a statistical and machine learning advantage by increasing the number of data instances per subject, in contrast to single-occurrence tasks typically used in similar studies (e.g., drawing figures, writing words, or composing sentences) [14,21,31,32,33,34,35].
The total number of data instances in our study was 760 (NL × number of subjects = 19 × 40), which was appropriate for training and testing machine learning models. Additionally, we employed subject-wise leave-one-out cross-validation (LOOCV) as a validation strategy, which is considered effective and suitable for small sample sizes [51,52].

4.1. “Letter” Segmentation

The first step in the proposed analysis involved segmenting individual letters based on the y-component of velocity and selecting valid letter segments. In certain instances, participants deviated from consistent letter formations such as making errors, pausing, or lifting the pen—which resulted in atypical handwriting data. These segments were excluded from further analysis according to the segmentation algorithm, which assessed letter length (LL) against the median LL and verified the presence of a local minimum in Vy during potential letter segments.
To avoid analytical bias from unequal data contributions across participants, we ensured equal representation by selecting the minimum number of valid letter segments (NL) identified across all subjects. This consistent NL value was used for subsequent data analysis. Furthermore, selecting the first NL valid segments, rather than a random subset, provided more reliable input by helping to mitigate potential fatigue effects [53,54].

4.2. Feature Selection

Given the large number of extracted features (177 in total), an objective and standardized feature selection approach was necessary prior to applying machine learning models. To this end, statistical analyses—Bartlett’s test and the Mann–Whitney U test—were employed to assess feature effectiveness in differentiating the two groups (DD and control), resulting in a reduction from 177 to 40 features. A comparable statistical feature selection methodology has been used in studies analyzing handwriting patterns in Parkinson’s disease patients [55].
To further reduce dimensionality, we implemented recursive feature elimination (RFE), which has demonstrated efficacy in prior research [50] as a feature selection method. Combining statistical selection with RFE enables the removal of features based on simple group differences, while RFE further enhances refinement by iteratively eliminating less informative features according to model performance. This hybrid statistical/RFE approach balances computational efficiency with model-driven feature relevance [56].
Firstly, the datasets were split by LOOCV, and an optimal feature subset for a given set length was found. We used logistic regression as an RFE evaluator, accompanied by L1 and L2 penalty terms. L1—Lasso regularization is used to prevent overfitting and enables a more generalizable model. L2—Ridge regularization handles multicollinearity effectively and enables a more stable and robust model, especially when dealing with many correlated features.

4.3. Machine Learning

Figure 3 demonstrates the positive impact of recursive feature elimination (RFE) on the logistic regression (LR) model, particularly when using smaller optimal feature subset sizes. A notable increase in Letter Accuracy (>2%) was observed for N ≤ 17, attributable to RFE-driven feature reduction.
However, this effect was not replicated in the random forest (RF) model, where Letter Accuracy remained unchanged following RFE application. The influence of RFE on the support vector machine (SVM) model was minimal across the entire range of optimal feature subset sizes.
Evaluation results for each model are presented in Table 4 for four selected subset sizes:
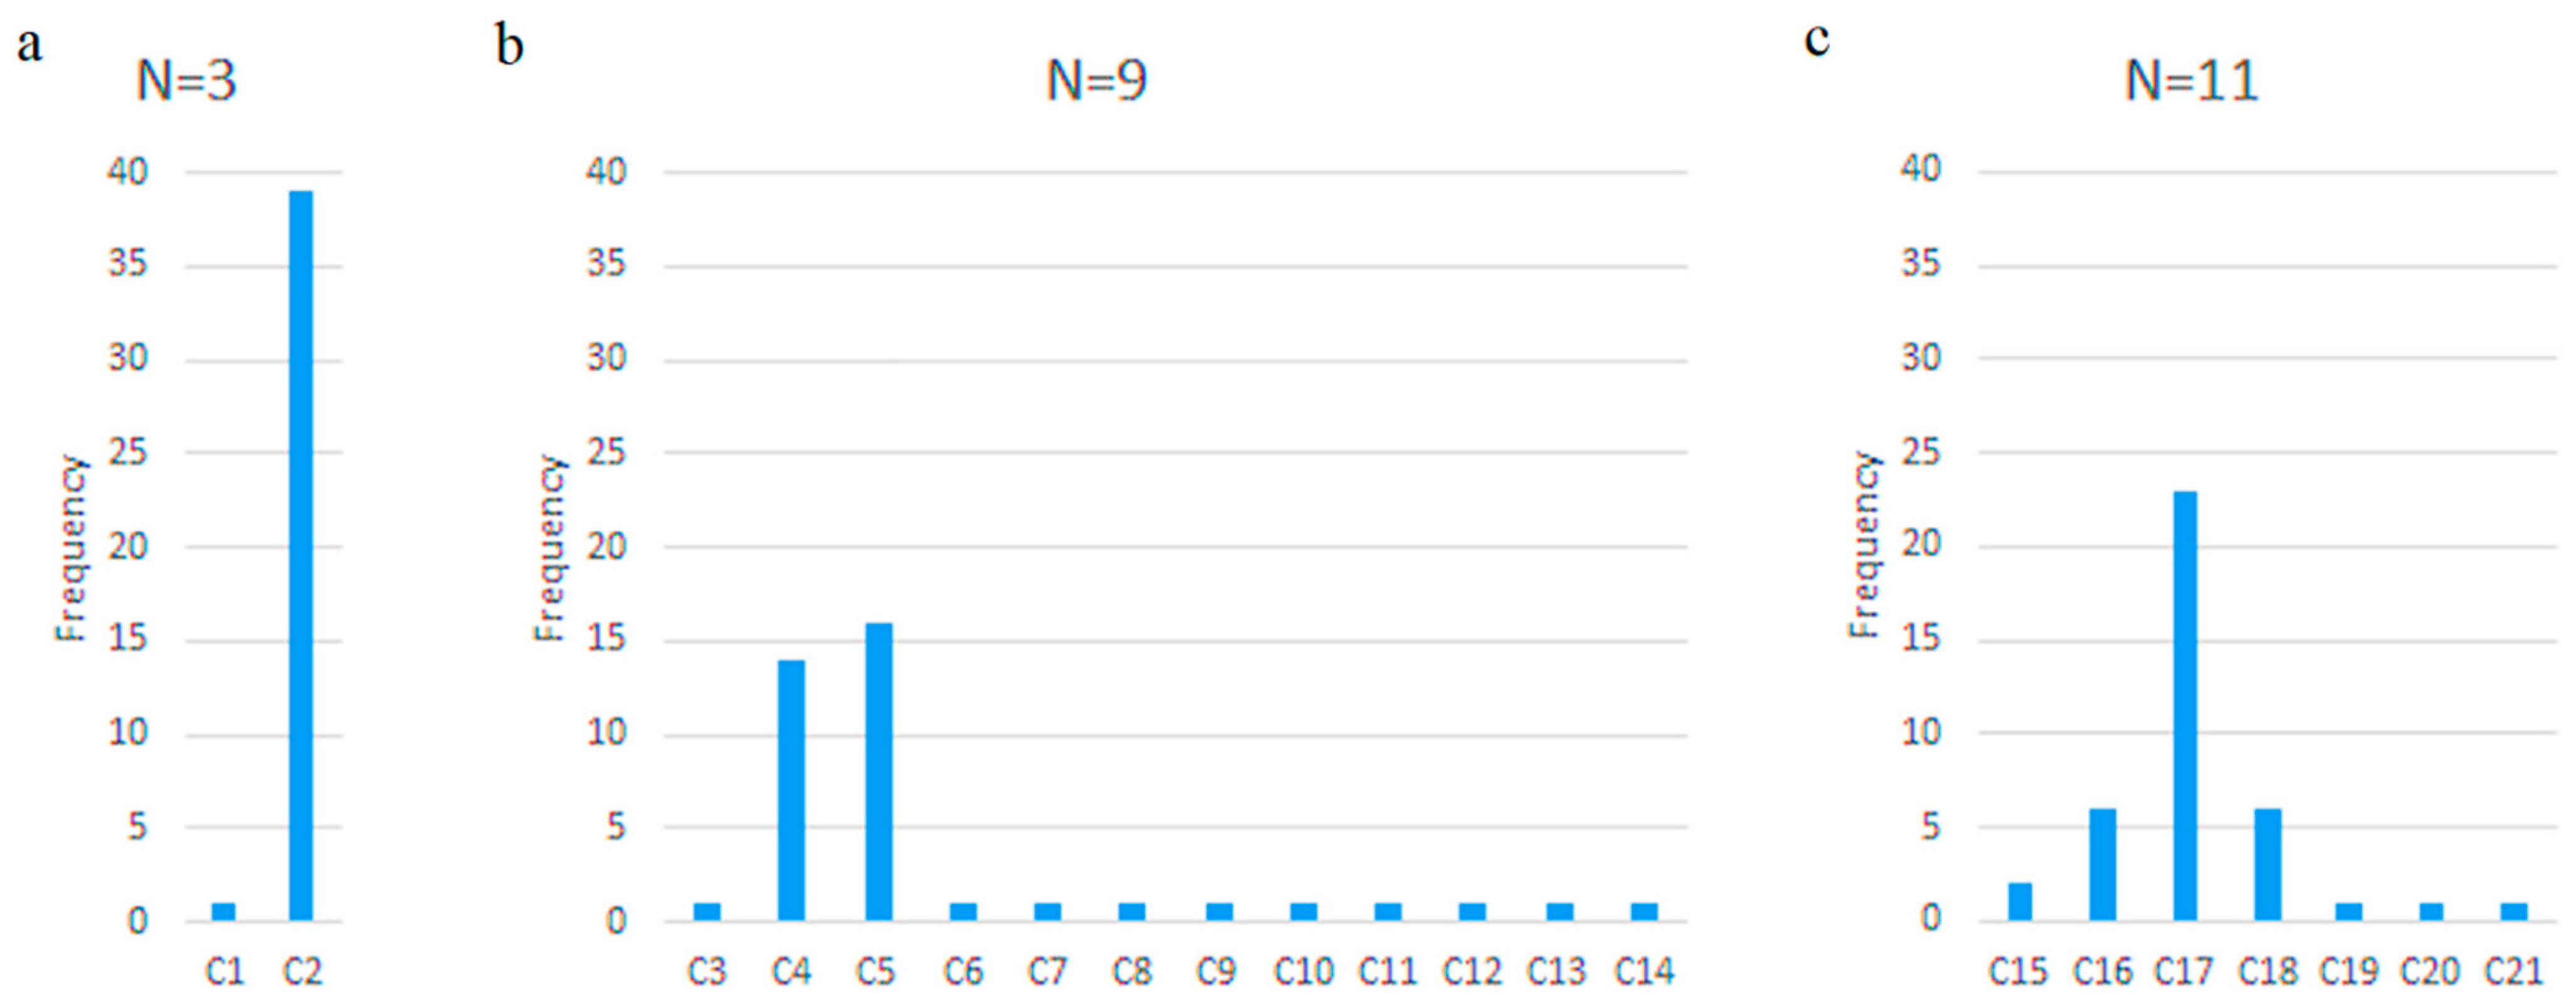
  • N = 3—when LR and SVM achieved their highest classification accuracy;
  • N = 9—the smallest N after which LR maintained “stable” accuracy (~74%);
  • N = 11—the smallest N after which SVM maintained “stable” accuracy (~74%);
  • N = 40—classification without RFE, where RF achieved the highest accuracy.
“Stable” accuracy was defined as classification performance that remained consistent over at least three consecutive values of N. The highest accuracies for letter classification (76.7%) and subject classification (82.5%) were achieved using logistic regression (LR) with only three features, as shown in Table 4. Across all optimal feature subset sizes, recall and precision closely aligned with accuracy, indicating well-balanced model performance and effectiveness.
To the best of our knowledge, the works cited in [34,35,36] represent the most recent and relevant contributions in this domain. Our subject accuracy of 82.5% is comparable to the result reported by a deep learning-based Bidirectional Long Short-Term Memory (BiLSTM) model [34], which detected depression trends with an accuracy of 89.2%. Unlike that approach, our method uses statistical analysis and conventional machine learning, which is less computationally demanding, employs subject-wise leave-one-out (LOO) cross-validation instead of a more fragile train–test split, and requires N times fewer test subjects for the same training set size (where N is the number of letters written per subject).
Likforman-Sulem et al. [35] investigated timing and ductus-based features, using random forest ensembles (50 trees) to rank their attributes, and achieved a classification accuracy of 72.8%. Their work, along with others, utilized the publicly available EMOTHAW dataset, which included three classes (depression, anxiety, stress) but lacked a control group. Furthermore, EMOTHAW data were collected from individuals aged 21–32, whereas our dataset focuses on subjects aged 11–17.
Greco et al. [36] examined depression detection using five handwriting and drawing feature categories (pen pressure, timing, ductus, character spacing, and pen inclination) across a set of similarly scaled digital tablet tasks. In contrast to our study, which incorporates both statistical analysis and machine learning for group differentiation in youths, their analysis was conducted on adult participants and relied solely on MANOVA to identify group differences.

4.4. Optimal Features

Figure 4 highlights the dominance of specific optimal feature subsets during subject-wise leave-one-out cross-validation (LOOCV). The most frequently selected optimal three-feature subset comprises velocity-related features: Vy_pct75, Vy_std, and V_pct25. This subset also appears within the dominant nine-feature and eleven-feature configurations. Notably, Table 4 shows that Vy_std and Vy_pct75 rank among the top three features with the lowest p-values and highest absolute correlation coefficients relative to class labels.
Figure 5 presents boxplots for the dominant three-feature subset, illustrating its effectiveness in distinguishing between the depressive disorder (DD) and control groups. Additional boxplots for the dominant nine- and eleven-feature subsets are provided in Appendix E. Across all selected features, handwriting velocity—whether measured along the x-axis, y-axis, or as total velocity—was consistently reduced in DD patients, reflecting a slower writing pattern. This finding aligns with previous studies that identified psychomotor retardation as a hallmark of depressive symptoms [17,18,23,34].
While our machine learning model demonstrated high classification accuracy—most notably 82.5% using three velocity-based handwriting features—it is critical to interpret these results in terms of clinical relevance. The velocity-based features identified in our study (e.g., reduced average stroke speed, longer inter-stroke intervals) are likely direct, quantifiable proxies for psychomotor slowing. These features are not merely algorithmic artifacts but reflect well-documented clinical observations of motor retardation in depression. By incorporating such features into a structured digital assessment—such as a brief handwriting task on a tablet—clinicians could objectively detect psychomotor changes that might otherwise go unnoticed in standard clinical interviews. This may be particularly valuable in cases where youth struggle to articulate internal states or when symptom reporting is inconsistent [57,58]. Thus, the handwriting-based features offer more than predictive accuracy: they reflect neurocognitive and motor–behavioral processes central to depressive pathology, paving the way for more precise, accessible, and developmentally appropriate diagnostic tools in youth mental health care. In this context, the machine learning model is not merely a technical classifier but a translational bridge between digital behavior signals and clinically actionable insights.
The present findings underscore the potential of handwriting velocity as a clinically relevant digital biomarker for identifying psychomotor disturbances (i.e., psychomotor retardation) in youth with depressive disorder (DD). The observed reduction in handwriting speed among depressed adolescents provides objective evidence of a core symptom traditionally evaluated via clinical observation or subjective rating scales, thereby complementing standardized assessments. Importantly, the high classification accuracy achieved using a logistic regression model and velocity-based features suggests that this method could augment existing diagnostic practices, offering a low-cost, accessible, and scalable assessment tool for depression in youth. Integrating such digital markers into routine diagnostic frameworks may enhance diagnostic precision, particularly in cases where verbal self-report is limited or inconclusive. While traditional tools provide generalized assessments, handwriting analysis and specific kinematic parameters may correlate with features characteristic of certain subtypes, as previously reported in adult populations [16]. Furthermore, this approach aligns with the principles of precision psychiatry and can contribute to digital phenotyping [59], forming a basis for remote monitoring and early detection of depressive symptoms in community and school settings [60]. With minimal infrastructure and high user acceptability, tablet-based handwriting tasks could support continuous, unobtrusive mental health surveillance in both clinical and non-clinical environments—thereby facilitating timely diagnosis and personalized intervention planning.

4.5. Limitations

The main limitations of the present study are related to the representativeness of the sample on which the analysis was performed. The subject sample size was limited to 40 subjects, and its expansion in future studies would verify the reliability of the results, although this number is comparable to that used in other clinical studies on handwriting analysis [21,32]. Notably, the approach of using repeated “letter” segments to increase the number of data instances provides a data density advantage relative to single-occurrence tasks commonly reported in the literature.
However, future studies could incorporate the repetitive writing of meaningful words containing the letter “l” [55], enabling the inclusion of “in-air” movement kinematics, which were excluded from the present analysis. Additional limitations pertain to the sample’s representativeness with respect to age, gender, and treatment history. The dataset covered a narrow age range (11–17 years), consistent with the study’s focus on early DD diagnosis [61]. The DD group was predominantly female, reflecting real-world prevalence, as depression is more frequent in females [62]. Rueckriegl et al. [63] found that gender influenced performance only in circle drawing tasks—not in writing—among children and adolescents aged 6–18.
Therapy effects also warrant consideration. Sabbe et al. [64] reported improvements in handwriting among patients undergoing treatment, although significant differences from control group handwriting remained after six weeks. In our dataset, treatment status was balanced, with 55% of subjects in the DD group receiving antidepressant therapy. Future studies should include participants across a broader range of therapeutic regimens to support more generalizable conclusions. Moreover, expanding the sample size would allow for direct comparison between medicated and drug-naïve DD subgroups, enhancing the interpretive power of classification outcomes.

5. Conclusions

This study demonstrates that kinematic handwriting analysis effectively captures psychomotor retardation in youth with depression, as reflected in significantly reduced writing velocity. By leveraging three velocity-based features, selected through statistical methods and recursive feature elimination (RFE), the proposed logistic regression model achieved a classification accuracy of up to 82.5%. These findings underscore the potential of a simple, accessible, and objective screening tool for detecting psychomotor slowing associated with depressive disorders. Future research should aim to validate specific handwriting metrics as reliable indicators of depressive symptoms. Longitudinal studies could help determine how handwriting dynamics evolve over time in response to treatment, offering critical insights into therapeutic efficacy and informing the development of personalized treatment plans.

Author Contributions

V.D.: writing—original draft, writing—review and editing, visualization, software, methodology, investigation, data curation. N.I.: writing—review and editing, conceptualization, investigation. S.R.: writing—review and editing, visualization, software, formal analysis. B.N.: investigation, resources, data curation. D.S.: writing—review and editing, conceptualization, data curation. J.J.: writing—review and editing, resources, conceptualization. M.M.J.: writing—review and editing, supervision, conceptualization, validation, funding acquisition, methodology. All authors have read and agreed to the published version of the manuscript.

Funding

This work was partly financially supported by the Ministry of Science, Technological Development and Innovation of the Republic of Serbia, under contract number 451-03-137/2025-03/200103. The research was partially conducted in the premises of the Palace of Science, Miodrag Kostić Endowment.

Institutional Review Board Statement

This study was approved by the Ethical Committee of the Clinic for Neurology and Psychiatry for Children and Youth, Belgrade (no. 21-79/02, approved on 16 July 2018).

Informed Consent Statement

Written informed consent and permission were obtained from all participants and the parents or guardians of minors.

Data Availability Statement

The authors will provide the raw data supporting the conclusions of this article, with no unnecessary restrictions or reservations. For further information about the data, please contact ivancevicsd@gmail.com.

Conflicts of Interest

The authors declare that there are no conflicts of interest.

Abbreviations

The following abbreviations are used in this manuscript:
YLDsYears Lived with Disability
DDDepressive Disorder
SSRISelective Serotonin Reuptake Inhibitors
TCATricyclic Antidepressants
EHIEdinburgh Handedness Inventory
SMFQShort Mood and Feelings Questionnaire
SCAREDScreen for Child Anxiety-Related Emotional Disorders
LOOCVLeave-One-Out Cross-Validation
RFERecursive Feature Elimination
LRLogistic Regression
SVMSupport Vector Machine
RFRandom Forest

Appendix A

The three tasks of the experiment protocol were as follows: 1—semicircle tracing task (radius of 1.9 cm); 2—figure tracing task; 3—cursive letter writing task (large rectangle dimensions are 40 × 160 mm; small rectangle dimensions are 9 × 160 mm). Instructions are given above each task. A4 templates are displayed in Figure A1.
Figure A1. A4 templates for the three tasks of the experiment protocol. (a)—semicircle tracing task; (b)—figure tracing task; (c)—cursive letter writing task.
Applsci 15 07634 g0a1

Appendix B

Hyperparameter settings used for each machine learning model. Table A1 shows the hyperparameters for LR, Table A2 shows hyperparameters for SVM, and Table A3 shows hyperparameters for RF.
Table A1. Hyperparameters used for the LR model.
ParameterValue
Penalty‘elasticnet’
DualFalse
Tolerance (tol)0.0001
Inverse regularization (C)1.0
Fit interceptTrue
Intercept scaling1
Class weightNone
Random stateNone
Solver‘saga’
Max iterations100
Multiclass‘deprecated’
Verbose0
Warm startFalse
Number of jobs (n_jobs)None
L1 ratio0.5
Table A2. Hyperparameters used for the SVM model.
ParameterValue
Inverse regularization (C)1.0
Kernel‘linear’
Polynomial degree3
Gamma‘scale’
Coefficient 0 (coef0)0.0
ShrinkingTrue
Probability estimationFalse
Tolerance (tol)0.001
Cache size200
Class weightNone
VerboseFalse
Max iterations-1
Decision function shape‘ovr’
Break tiesFalse
Random stateNone
Table A3. Hyperparameters used for the RF model.
ParameterValue
Number of trees (n_estimators)100
Criterion‘gini’
Maximum depthNone
Min samples to split2
Min samples per leaf1
Min weight fraction leaf0.0
Max features‘sqrt’
Max leaf nodesNone
Min impurity decrease0.0
BootstrapTrue
Out-of-bag score (oob_score)False
Number of jobs (n_jobs)None
Random stateNone
Verbose0
Warm startFalse
Class weightNone
Cost-complexity pruning (ccp_alpha)0.0
Max samplesNone
Monotonic constraintsNone

Appendix C

The list of significant features. The list of features deemed significant after statistical analysis and used for further machine learning analysis is shown in Table A4.
Table A4. The list of significant features.
No.FeatureCONTROL Mean ± SeDD Mean ± Sep-Value|ρ| 1
0Vx_cv 21.623 ± 0.1852.060 ± 0.1682.539 × 10−40.063
1Vx_max 32.456 ± 0.0302.306 ± 0.0331.150 × 10−40.122
2Vx_pct75 41.840 ± 0.0271.680 ± 0.0273.618 × 10−60.151
3Vx_pct90 52.340 ± 0.0302.176 ± 0.0311.810 × 10−50.137
4Vy_std 62.305 ± 0.0181.884 ± 0.0172.686 × 10−480.523
5Vy_max3.403 ± 0.0242.879 ± 0.0245.493 × 10−430.490
6Vy_min 7−3.359 ± 0.027−2.799 ± 0.0251.594 × 10−420.484
7Vy_pct10 8−3.111 ± 0.028−2.582 ± 0.0262.164 × 10−400.452
8Vy_pct752.282 ± 0.0201.785 ± 0.0211.056 × 10−510.530
9Vy_pct903.081 ± 0.0232.531 ± 0.0225.866 × 10−520.531
10V_med 92.651 ± 0.0252.235 ± 0.0251.424 × 10−280.395
11V_mean2.543 ± 0.0212.171 ± 0.0228.148 × 10−300.403
12V_std0.918 ± 0.0090.770 ± 0.0099.576 × 10−270.388
13V_max3.966 ± 0.0323.422 ± 0.0311.992 × 10−280.405
14V_pct25 101.905 ± 0.0251.623 ± 0.0252.567 × 10−150.278
15V_pct753.261 ± 0.0252.759 ± 0.0256.889 × 10−380.458
16V_pct903.696 ± 0.0293.173 ± 0.0309.517 × 10−310.416
17Ax_med0.006 ± 0.0010.003 ± 0.0015.372 × 10−50.125
18Ax_pct900.079 ± 0.0020.073 ± 0.0024.049 × 10−40.084
19Ay_min−0.174 ± 0.003−0.137 ± 0.0034.374 × 10−200.334
20Ay_pct10−0.162 ± 0.003−0.125 ± 0.0021.307 × 10−200.344
21A_std0.086 ± 0.0020.063 ± 0.0013.528 × 10−240.355
22A_pct25−0.067 ± 0.001−0.047 ± 0.0015.628 × 10−340.384
23A_pct750.074 ± 0.0010.052 ± 0.0012.063 × 10−270.357
24A_pct900.115 ± 0.0020.087 ± 0.0021.321 × 10−200.334
25Jx_med0.000 ± 0.000−0.000 ± 0.0006.664 × 10−80.158
26Jy_std0.006 ± 0.0000.005 ± 0.0008.880 × 10−110.219
27Jy_max0.009 ± 0.0000.008 ± 0.0006.201 × 10−90.179
28Jy_pct25−0.006 ± 0.000−0.004 ± 0.0003.829 × 10−130.246
29Jy_pct750.006 ± 0.0000.004 ± 0.0009.180 × 10−120.228
30Jy_pct900.008 ± 0.0000.007 ± 0.0003.136 × 10−100.195
31J_med−0.004 ± 0.000−0.002 ± 0.0001.975 × 10−200.282
32J_min−0.009 ± 0.000−0.008 ± 0.0003.825 × 10−100.203
33J_pct10−0.008 ± 0.000−0.006 ± 0.0002.671 × 10−130.230
34J_pct25−0.007 ± 0.000−0.005 ± 0.0007.068 × 10−150.251
35J_pct750.002 ± 0.0000.002 ± 0.0001.029 × 10−40.106
36J_pct900.011 ± 0.0000.008 ± 0.0009.278 × 10−230.271
37Jp_min−0.003 ± 0.000−0.003 ± 0.0006.233 × 1000.076
38Jp_pct10−0.002 ± 0.000−0.001 ± 0.0005.454 × 10−40.063
39LS 112.543 ± 0.0212.171 ± 0.0228.148 × 10−300.403
1 |ρ|—correlation to the class. 2 cv—coefficient of variation. 3 max—maximum value. 4 pct75—75th percentile. 5 pct90—90th percentile. 6 std—standard deviation. 7 min—minimum value. 8 pct10—10th percentile. 9 med—median. 10 pct25—25th percentile. 11 LS—letter of drawing speed.

Appendix D

The list of optimal feature subsets. The list of optimal feature subsets for N = 3, N = 9, and N = 11 that was selected by LR-RFE on training sets is shown in Table A5.
Table A5. The list of optimal feature subsets for N = 3, N = 9, and N = 11.
Optimal Feature SubsetAbbreviation
Vx_max, Vy_pct75, V_stdC1
Vy_std, Vy_pct75, V_pct25C2
Vx_max, Vy_std, Vy_max, Vy_pct75, V_std, V_max, V_pct25, V_pct90, LSC3
Vx_max, Vy_std, Vy_max, Vy_pct75, Vy_pct90, V_std, V_max, V_pct25, LSC4
Vx_max, Vy_std, Vy_pct1, Vy_pct75, V_mean, V_std, V_max, V_pct25, LSC5
Vx_max, Vy_std, Vy_pct75, Vy_pct90, V_mean, V_std, V_pct25, V_pct90, LSC6
Vx_max, Vy_std, Vy_max, Vy_pct75, V_mean, V_std, V_max, V_pct25, LSC7
Vx_max, Vy_std, Vy_pct75, Vy_pct90, V_med, V_mean, V_std, V_pct25, LSC8
Vx_max, Vy_std, Vy_max, Vy_pct1, Vy_pct75, V_std, V_max, V_pct25, LSC9
Vx_max, Vy_std, Vy_max, Vy_pct1, Vy_pct75, V_std, V_max, V_pct25, LSC10
Vx_max, Vy_std, Vy_max, Vy_pct1, Vy_pct75, V_std, V_max, V_pct25, LSC11
Vx_max, Vy_std, Vy_max, Vy_pct1, Vy_pct75, V_std, V_max, V_pct25, LSC12
Vx_max, Vy_std, Vy_max, Vy_pct1, Vy_pct75, V_std, V_max, V_pct25, LSC13
Vx_max, Vy_std, Vy_max, Vy_pct1, Vy_pct75, V_std, V_max, V_pct25, LSC14
Vx_max, Vx_pct90, Vy_std, Vy_max, Vy_pct75, V_mean, V_std, V_max, V_pct25, V_pct90, LSC15
Vx_max, Vy_std, Vy_max, Vy_pct75, Vy_pct90, V_med, V_mean, V_std, V_max, V_pct25, LSC16
Vx_max, Vy_std, Vy_max, Vy_pct1, Vy_pct75, Vy_pct90, V_mean, V_std, V_max, V_pct25, LSC17
Vx_max, Vy_std, Vy_max, Vy_pct75, Vy_pct90, V_mean, V_std, V_max, V_pct25, V_pct90, LSC18
Vx_max, Vy_std, Vy_max, Vy_min, Vy_pct75, Vy_pct90, V_mean, V_std, V_pct25, V_pct90, LSC19
Vx_max, Vy_std, Vy_max, Vy_pct75, V_med, V_mean, V_std, V_max, V_pct25, V_pct90, LSC20
Vx_max, Vy_std, Vy_pct1, Vy_pct75, Vy_pct90, V_mean, V_std, V_max, V_pct25, V_pct90, LSC21

Appendix E

Feature boxplots. Boxplots of the remaining features that appeared in the most frequent optimal feature subset size N (N ∈ {9,11}) are displayed in Figure A2.
Figure A2. Remaining feature boxplots that appeared in the most frequent optimal feature subset size N (N ∈ {9,11}).
Applsci 15 07634 g0a2

References

  1. WHO. Depressive Disorder (Depression). Available online: https://www.who.int/news-room/fact-sheets/detail/depression (accessed on 11 June 2024).
  2. Liu, Q.; He, H.; Yang, J.; Feng, X.; Zhao, F.; Lyu, J. Changes in the global burden of depression from 1990 to 2017: Findings from the Global Burden of Disease study. J. Psychiatr. Res. 2020, 126, 134–140. [Google Scholar] [CrossRef]
  3. Kupcova, I.; Danisovic, L.; Klein, M.; Harsanyi, S. Effects of the COVID-19 pandemic on mental health, anxiety, and depression. BMC Psychol. 2023, 11, 108. [Google Scholar] [CrossRef] [PubMed]
  4. Yan, G.; Zhang, Y.; Wang, S.; Yan, Y.; Liu, M.; Tian, M.; Tian, W. Global, regional, and national temporal trend in burden of major depressive disorder from 1990 to 2019: An analysis of the global burden of disease study. Psychiatry Res. 2024, 337, 115958. [Google Scholar] [CrossRef] [PubMed]
  5. Sacco, R.; Camilleri, N.; Eberhardt, J.; Umla-Runge, K.; Newbury-Birch, D. A systematic review and meta-analysis on the prevalence of mental disorders among children and adolescents in Europe. Eur. Child Adolesc. Psychiatry 2024, 33, 2877–2894. [Google Scholar] [CrossRef] [PubMed]
  6. Polanczyk, G.V.; Salum, G.A.; Sugaya, L.S.; Caye, A.; Rohde, L.A. Annual research review: A meta-analysis of the worldwide prevalence of mental disorders in children and adolescents. J. Child Psychol. Psychiatry 2015, 56, 345–365. [Google Scholar] [CrossRef]
  7. Solmi, M.; Radua, J.; Olivola, M.; Croce, E.; Soardo, L.; Salazar de Pablo, G.; Il Shin, J.; Kirkbride, J.B.; Jones, P.; Kim, J.H.; et al. Age at onset of mental disorders worldwide: Large-scale meta-analysis of 192 epidemiological studies. Mol. Psychiatry 2022, 27, 281–295. [Google Scholar] [CrossRef]
  8. Castelpietra, G.; Knudsen, A.K.S.; Agardh, E.E.; Armocida, B.; Beghi, M.; Iburg, K.M.; Logroscino, G.; Ma, R.; Starace, F.; Steel, N.; et al. The burden of mental disorders, substance use disorders and self-harm among young people in Europe, 1990-2019: Findings from the Global Burden of Disease Study 2019. Lancet Reg. Health Eur. 2022, 16, 100341. [Google Scholar] [CrossRef]
  9. American Psychiatric Association and American Psychiatric Association (Ed.) Diagnostic and Statistical Manual of Mental Disorders: DSM-5, 5th ed.; American Psychiatric Association: Washington, DC, USA, 2013; pp. 591–643. [Google Scholar]
  10. WHO. ICD-11 for Mortality and Morbidity Statistics. Available online: https://icd.who.int/browse/2024-01/mms/en#1563440232 (accessed on 19 October 2024).
  11. Paquet, A.; Lacroix, A.; Calvet, B.; Girard, M. Psychomotor semiology in depression: A standardized clinical psychomotor approach. BMC Psychiatry 2022, 22, 474. [Google Scholar] [CrossRef]
  12. Elkjær, E.; Mikkelsen, M.B.; Michalak, J.; Mennin, D.S.; O’Toole, M.S. Motor alterations in depression and anxiety disorders: A systematic review and meta-analysis. J. Affect. Disord. 2022, 317, 373–387. [Google Scholar] [CrossRef]
  13. König, A.; Tröger, J.; Mallick, E.; Mina, M.; Linz, N.; Wagnon, C.; Karbach, J.; Kuhn, C.; Peter, J. Detecting subtle signs of depression with automated speech analysis in a non-clinical sample. BMC Psychiatry 2022, 22, 830. [Google Scholar] [CrossRef]
  14. Mergl, R.; Juckel, G.; Rihl, J.; Henkel, V.; Karner, M.; Tigges, P.; Schröter, A.; Hegerl, U. Kinematical analysis of handwriting movements in depressed patients. Acta Psychiatr. Scand. 2004, 109, 383–391. [Google Scholar] [CrossRef] [PubMed]
  15. Baune, B.T.; Fuhr, M.; Air, T.; Hering, C. Neuropsychological functioning in adolescents and young adults with major depressive disorder—A review. Psychiatry Res. 2014, 218, 261–271. [Google Scholar] [CrossRef] [PubMed]
  16. Bennabi, D.; Vandel, P.; Papaxanthis, C.; Pozzo, T.; Haffen, E. Psychomotor retardation in depression: A systematic review of diagnostic, pathophysiologic, and therapeutic implications. BioMed Res. Int. 2013, 2013, 158746. [Google Scholar] [CrossRef]
  17. Buyukdura, J.S.; McClintock, S.M.; Croarkin, P.E. Psychomotor retardation in depression: Biological underpinnings, measurement, and treatment. Prog. Neuropsychopharmacol. Biol. Psychiatry 2011, 35, 395–409. [Google Scholar] [CrossRef]
  18. Wells, F.L. Motor retardation as a manic-depressive symptom. Am. J. Psychiatry 1909, 66, 1–52. [Google Scholar] [CrossRef]
  19. Shevell, M. Global developmental delay and mental retardation or intellectual disability: Conceptualization, evaluation, and etiology. Pediatr. Clin. N. Am. 2008, 55, 1071–1084. [Google Scholar] [CrossRef]
  20. Esposito, A.; Raimo, G.; Maldonato, M.; Vogel, C.; Conson, M.; Cordasco, G. Behavioral Sentiment Analysis of Depressive States. In Proceedings of the 2020 11th IEEE International Conference on Cognitive Infocommunications (CogInfoCom), Mariehamn, Finland, 23–25 September 2020; IEEE: Piscataway, NJ, USA, 2020; pp. 209–214. [Google Scholar]
  21. Raimo, G.; Buonanno, M.; Conson, M.; Cordasco, G.; Faundez-Zanuy, M.; McConvey, G.; Marrone, S.; Marulli, F.; Vinciarelli, A.; Esposito, A. Handwriting and Drawing for Depression Detection: A Preliminary Study. In Applied Intelligence and Informatics; Springer: Cham, Switzerland, 2022; pp. 320–332. [Google Scholar]
  22. Zhang, L.; Fan, Y.; Jiang, J.; Li, Y.; Zhang, W. Adolescent Depression Detection Model Based on Multimodal Data of Interview Audio and Text. Int. J. Neural Syst. 2022, 32, 2250045. [Google Scholar] [CrossRef] [PubMed]
  23. Sobin, C.; Sackeim, H. Psychomotor symptoms of depression. Am. J. Psychiatry 1997, 154, 4–17. [Google Scholar] [CrossRef]
  24. Ivančević, N. Kinematic Analysis of Handwriting in Neurological, Psychiatric and Neurodevelopmental Disorders of Childhood and Adolescence. Ph.D. Dissertation, Biomedical Engineering and Technologies, University of Belgrade, Belgrade, Serbia, 2021. [Google Scholar]
  25. Asselborn, T.; Gargot, T.; Kidziński, Ł.; Johal, W.; Cohen, D.; Jolly, C.; Dillenbourg, P. Automated human-level diagnosis of dysgraphia using a consumer tablet. Npj Digit. Med. 2018, 1, 42. [Google Scholar] [CrossRef]
  26. Gavenciak, M.; Mucha, J.; Mekyska, J.; Galaz, Z.; Zvoncakova, K.; Faundez-Zanuy, M. Computer-Aided Diagnosis of Graphomotor Difficulties Utilizing Direction-Based Fractional Order Derivatives. Cogn. Comput. 2024, 17, 13. [Google Scholar] [CrossRef]
  27. Brossard-Racine, M.; Majnemer, A.; Shevell, M.; Snider, L.; Bélanger, S.A. Handwriting capacity in children newly diagnosed with Attention Deficit Hyperactivity Disorder. Res. Dev. Disabil. 2011, 32, 2927–2934. [Google Scholar] [CrossRef] [PubMed]
  28. Rosenblum, S.; Epsztein, L.; Josman, N. Handwriting Performance of Children with Attention Deficit Hyperactive Disorders: A Pilot Study. Phys. Occup. Ther. Pediatr. 2008, 28, 219–234. [Google Scholar] [CrossRef]
  29. Soleimani, R.; Kousha, M.; Zarrabi, H.; Tavafzadeh-Haghi, S.M.; Jalali, M.M. The Impact of Methylphenidate on Motor Performance in Children with both Attention Deficit Hyperactivity Disorder and Developmental Coordination Disorder: A Randomized Double-Blind Crossover Clinical Trial. Iran. J. Med. Sci. 2017, 42, 354–361. [Google Scholar] [PubMed]
  30. Cook, J. From movement kinematics to social cognition: The case of autism. Philos. Trans. R. Soc. Lond. B Biol. Sci. 2016, 371, 20150372. [Google Scholar] [CrossRef] [PubMed]
  31. Cordasco, G.; Scibelli, F.; Faundez-Zanuy, M.; Likforman-Sulem, L.; Esposito, A. Handwriting and Drawing Features for Detecting Negative Moods. In Quantifying and Processing Biomedical and Behavioral Signals; Esposito, A., Faundez-Zanuy, M., Morabito, F.C., Pasero, E., Eds.; Springer International Publishing: Cham, Switzerland, 2019; pp. 73–86. ISBN 978-3-319-95095-2. [Google Scholar]
  32. Rosenblum, S.; Werner, P.; Dekel, T.; Gurevitz, I.; Heinik, J. Handwriting process variables among elderly people with mild Major Depressive Disorder: A preliminary study. Aging Clin. Exp. Res. 2010, 22, 141–147. [Google Scholar] [CrossRef] [PubMed]
  33. Schröter, A.; Mergl, R.; Bürger, K.; Hampel, H.; Möller, H.-J.; Hegerl, U. Kinematic analysis of handwriting movements in patients with Alzheimer’s disease, mild cognitive impairment, depression and healthy subjects. Dement. Geriatr. Cogn. Disord. 2003, 15, 132–142. [Google Scholar] [CrossRef]
  34. Rahman, A.U.; Halim, Z. Identifying dominant emotional state using handwriting and drawing samples by fusing features. Appl. Intell. 2023, 53, 2798–2814. [Google Scholar] [CrossRef]
  35. Likforman-Sulem, L.; Esposito, A.; Faundez-Zanuy, M.; Clémençon, S.; Cordasco, G. EMOTHAW: A Novel Database for Emotional State Recognition From Handwriting and Drawing. IEEE Trans. Hum.-Mach. Syst. 2017, 47, 273–284. [Google Scholar] [CrossRef]
  36. Greco, C.; Raimo, G.; Amorese, T.; Cuciniello, M.; Mcconvey, G.; Cordasco, G.; Faundez-Zanuy, M.; Vinciarelli, A.; Callejas-Carrion, Z.; Esposito, A. Discriminative Power of Handwriting and Drawing Features in Depression. Int. J. Neural Syst. 2024, 34, 2350069. [Google Scholar] [CrossRef]
  37. Dragovic, M. Towards an improved measure of the Edinburgh Handedness Inventory: A one-factor congeneric measurement model using confirmatory factor analysis. Laterality Asymmetries Body Brain Cogn. 2004, 9, 411–419. [Google Scholar] [CrossRef]
  38. Milenkovic, S.; Dragovic, M. Modification of the Edinburgh Handedness Inventory: A replication study. Laterality 2013, 18, 340–348. [Google Scholar] [CrossRef]
  39. Thabrew, H.; Stasiak, K.; Bavin, L.-M.; Frampton, C.; Merry, S. Validation of the Mood and Feelings Questionnaire (MFQ) and Short Mood and Feelings Questionnaire (SMFQ) in New Zealand help-seeking adolescents. Int. J. Methods Psychiatr. Res. 2018, 27, e1610. [Google Scholar] [CrossRef] [PubMed]
  40. Arab, A.; El Keshky, M.; Hadwin, J.A. Psychometric Properties of the Screen for Child Anxiety Related Emotional Disorders (SCARED) in a Non-Clinical Sample of Children and Adolescents in Saudi Arabia. Child Psychiatry Hum. Dev. 2016, 47, 554–562. [Google Scholar] [CrossRef]
  41. Ivančević, N.; Novičić, M.; Miler, V.; Janković, M.; Stevanovic, D.; Nikolić, B.; Popović, M.; Jancic, J. Does handedness matter? Writing and tracing kinematic analysis in healthy adults. Psihologija 2019, 52, 413–435. [Google Scholar] [CrossRef]
  42. Miler-Jerković, V.; Kojić, V.; Popović, M.B. An Information and Reliability Analysis of handwriting Kinematics. In Proceedings of the 2nd International Conference on Electrical, Electronic and Computing Engineering IcETRAN, Silver Lake, Serbia, 8–11 June 2015; pp. 1–4. [Google Scholar]
  43. Džepina, V.; Ivančević, N.; Miler-Jerković, V.; Nikolić, B.; Stevanović, D.; Janković, M.M. GT Analyzer—A Basic Tool for Handwriting Movement Data. In Proceedings of the 9th International Conference on Electrical, Electronic and Computing Engineering IcETRAN, Novi Pazar, Serbia, 6–9 June 2022; pp. 1–5. [Google Scholar]
  44. Yan, J.H.; Hinrichs, R.N.; Payne, V.G.; Thomas, J.R. Normalized Jerk: A Measure to Capture Developmental Characteristics of Young Girls’ Overarm Throwing. J. Appl. Biomech. 2000, 16, 196–203. [Google Scholar] [CrossRef]
  45. Mann, H.B.; Whitney, D.R. On a Test of Whether one of Two Random Variables is Stochastically Larger than the Other. Ann. Math. Stat. 1947, 18, 50–60. [Google Scholar] [CrossRef]
  46. Pearson, K. On the criterion that a given system of deviations from the probable in the case of a correlated system of variables is such that it can be reasonably supposed to have arisen from random sampling. Lond. Edinb. Dublin Philos. Mag. J. Sci. 1900, 50, 157–175. [Google Scholar] [CrossRef]
  47. Bartlett, M.S.; Fowler, R.H. Properties of sufficiency and statistical tests. Proc. R. Soc. Lond. Ser. Math. Phys. Sci. 1937, 160, 268–282. [Google Scholar] [CrossRef]
  48. Zimmerman, D.W. Invalidation of Parametric and Nonparametric Statistical Tests by Concurrent Violation of Two Assumptions. J. Exp. Educ. 1998, 67, 55–68. [Google Scholar] [CrossRef]
  49. Cross, C.L.; Daniel, W.W. Analysis of Variance. In Biostatistics: A Foundation for Analysis in the Health Sciences, 11th ed.; Wiley: Hoboken, NJ, USA, 2018; pp. 267–354. ISBN 978-1-119-49657-1. [Google Scholar]
  50. Granitto, P.M.; Furlanello, C.; Biasioli, F.; Gasperi, F. Recursive feature elimination with random forest for PTR-MS analysis of agroindustrial products. Chemom. Intell. Lab. Syst. 2006, 83, 83–90. [Google Scholar] [CrossRef]
  51. Wong, T.-T. Performance evaluation of classification algorithms by k-fold and leave-one-out cross validation. Pattern Recognit. 2015, 48, 2839–2846. [Google Scholar] [CrossRef]
  52. Fushiki, T. Estimation of prediction error by using K-fold cross-validation. Stat. Comput. 2011, 21, 137–146. [Google Scholar] [CrossRef]
  53. Parush, S.; Pindak, V.; Hahn-Markowitz, J.; Mazor-Karsenty, T. Does fatigue influence children’s handwriting performance? Work 1998, 11, 307–313. [Google Scholar] [CrossRef]
  54. Kushki, A.; Schwellnus, H.; Ilyas, F.; Chau, T. Changes in kinetics and kinematics of handwriting during a prolonged writing task in children with and without dysgraphia. Res. Dev. Disabil. 2011, 32, 1058–1064. [Google Scholar] [CrossRef] [PubMed]
  55. Drotár, P.; Mekyska, J.; Rektorová, I.; Masarová, L.; Smékal, Z.; Faundez-Zanuy, M. Evaluation of handwriting kinematics and pressure for differential diagnosis of Parkinson’s disease. Artif. Intell. Med. 2016, 67, 39–46. [Google Scholar] [CrossRef]
  56. Xia, S.; Yang, Y. A Model-Free Feature Selection Technique of Feature Screening and Random Forest-Based Recursive Feature Elimination. Int. J. Intell. Syst. 2023, 2023, 2400194. [Google Scholar] [CrossRef]
  57. Visted, E.; Sørensen, L.; Vøllestad, J.; Osnes, B.; Svendsen, J.L.; Jentschke, S.; Binder, P.-E.; Schanche, E. The Association Between Juvenile Onset of Depression and Emotion Regulation Difficulties. Front. Psychol. 2019, 10, 2262. [Google Scholar] [CrossRef] [PubMed]
  58. De Los Reyes, A.; Youngstrom, E.A.; Pabón, S.C.; Youngstrom, J.K.; Feeny, N.C.; Findling, R.L. Internal consistency and associated characteristics of informant discrepancies in clinic referred youths age 11 to 17 years. J. Clin. Child Adolesc. Psychol. 2011, 40, 36–53. [Google Scholar] [CrossRef]
  59. Nisenson, M.; Lin, V.; Gansner, M. Digital Phenotyping in Child and Adolescent Psychiatry: A Perspective. Harv. Rev. Psychiatry 2021, 29, 401–408. [Google Scholar] [CrossRef]
  60. Haley, F.; Andrews, J.; Moghaddam, N. Acceptability of Remote Monitoring Technologies for Early Warning of Major Depression. J. Technol. Behav. Sci. 2025. [Google Scholar] [CrossRef]
  61. Le, H.-N.; George, T.; University, W.; Boyd, R. Prevention of major depression: Early detection and early intervention in the general population. Clin. Neuropsychiatry 2006, 3, 6–22. [Google Scholar]
  62. Otte, C.; Gold, S.M.; Penninx, B.W.; Pariante, C.M.; Etkin, A.; Fava, M.; Mohr, D.C.; Schatzberg, A.F. Major depressive disorder. Nat. Rev. Dis. Primer 2016, 2, 16065. [Google Scholar] [CrossRef] [PubMed]
  63. Rueckriegel, S.M.; Blankenburg, F.; Burghardt, R.; Ehrlich, S.; Henze, G.; Mergl, R.; Hernáiz Driever, P. Influence of age and movement complexity on kinematic hand movement parameters in childhood and adolescence. Int. J. Dev. Neurosci. 2008, 26, 655–663. [Google Scholar] [CrossRef] [PubMed]
  64. Sabbe, B.; van Hoof, J.; Hulstijn, W.; Zitman, F. Depressive retardation and treatment with fluoxetine: Assessment of the motor component. J. Affect. Disord. 1997, 43, 53–61. [Google Scholar] [CrossRef]
Figure 1. GT Analyzer visualization of the position (X, Y) raw data (left) and pressure (p) raw data (right) for subject ID9 of the control group. Five minimums in p(t) with low or null values correspond to five in-air blue lines in the (X, Y) graph. AIR—in-air recordings; SUR—on-surface.
Applsci 15 07634 g001
Figure 2. The machine learning algorithm pipeline. Logistic regression—LR; support vector machine—SVM; random forest—RF; recursive feature elimination—RFE.
Applsci 15 07634 g002
Figure 3. Letter classification accuracy for three applied classification models (logistic regression—LR; support vector machine—SVM; random forest—RF; N—optimal feature subset size).
Applsci 15 07634 g003
Figure 4. The frequency of optimal feature subsets for (a) N = 3, (b) N = 9, (c) N = 11.
Applsci 15 07634 g004
Figure 5. The boxplots of three features included in dominant optimal feature subsets for subset size N (N ∈ {3,9,11}): (a) Vy_std, (b) Vy_pct75, (c) V_pct25.
Applsci 15 07634 g005
Table 1. Subject dataset description.
CharacteristicsDD 1 Controlp-Value
MeanSDMeanSD
Age (years)14.61.615.90.40.002
EHI score 253.856.051.855.20.989
SMFQ 313.06.86.45.10.002
SCARED 437.515.722.812.30.002
Duration of disturbances (months)17.710.6///
Antidepressant therapy duration (weeks)15.817.0///
n%n%p-value
Number of subjects 2010020100/
Antidepressant therapy1155///
Right-handed subjects 189017850.012
Male subjects42010500.140
1 DD—subjects with DD. 2 EHI score—Edinburgh Handedness Inventory score. 3 SMFQ—Short Mood and Feelings Questionnaire. 4 SCARED—Screen for Child Anxiety-Related Emotional Disorders.
Table 2. The list of variables for statistical feature extraction.
VariableDerivative VariableTotal Variable
X position, X(t)1st, 2nd, 3rd derivative of X(t):
Velocity per x-axis, Vx(t)
Acceleration per x-axis, Ax(t)
Jerk per x-axis, Jx(t)
Total velocity, V(t)
V ( t ) = V x 2 t + V y 2 t
Total acceleration, A(t)
A ( t ) = A x 2 t + A y 2 t
Total jerk, J(t)
J ( t ) = J x 2 t + J y 2 t
Y position, Y(t)1st, 2nd, 3rd derivative of Y(t):
Velocity per y-axis, Vy(t)
Acceleration per y-axis, Ay(t)
Jerk per y-axis, Jy(t)
Pressure, p(t)1st, 2nd, 3rd derivative of p(t):
d p d t ,   d 2 p d t 2 ,   d 3 p d t 3
Total variables = 15
Table 3. The list of “letter” features.
AbbreviationUnitLetter Feature
LL[cm]Letter length
LT[s]Letter drawing time
LS[cm/s]Letter drawing speed
NCV[n.u.]Number of changes in velocity
RNCV[n.u.]Number of changes in velocity relative to letter drawing time (NCV/LT)
NST[n.u.]Time spent during drawing on-surface normalized by the letter drawing time (ON-SURFACE TIME/LT)
NIP[n.u.]Number of changes in pressure direction
NCA[n.u.]Number of changes in acceleration
RNCA[s−1]Number of changes in acceleration relative to letter drawing time (NCA/LT)
NIV[n.u.]Number of changes in velocity direction
NJ[n.u.] Normalized   jerk   N J = 1 2 J 2 t × L T 5 L L d t
J(t)—total jerk; LT—letter drawing time; LL—letter length
NS[n.u.]Number of strokes in the “letter” segment
Table 4. The list of five extracted features with the lowest p-values.
No.FeatureCONTROL Mean ± SeDD Mean ± Sep-Value|ρ|
1Vy_pct903.081 ± 0.0232.531 ± 0.0225.866 × 10−520.531
2Vy_pct752.282 ± 0.0201.785 ± 0.0211.057 × 10−510.530
3Vy_std2.305 ± 0.0181.884 ± 0.0172.686 × 10−480.523
4Vy_max3.403 ± 0.0242.879 ± 0.0245.493 × 10−430.490
5Vy_min−3.359 ± 0.027−2.799 ± 0.0251.594 × 10−420.484
Table 5. The classification results from three classification models (LR, SVM, and RF).
ClassifierNLetter
Accuracy [%]
Letter
Recall [%]
Letter
Precision [%]
Subject
Accuracy [%]
LR376.777.477.182.5
974.174.574.377.5
1174.174.074.077.5
4071.465.368.570.0
SVM376.277.677.080.0
973.373.473.477.5
1174.074.074.077.5
4073.772.473.177.5
RF372.073.672.777.5
969.071.069.875.0
1169.071.670.075.0
4075.378.276.982.5
Table 6. The dominant optimal feature subsets for subset size N (N ∈ {3,9,11}).
Optimal Combination SubsetAbbreviation
Vy_std, Vy_pct75, V_pct25C2
Vy_std, Vy_pct75, V_pct25, Vx_max, Vy_pct1, V_mean, V_std, V_max, LSC5
Vy_std, Vy_pct75, V_pct25, Vx_max, Vy_pct1, V_mean, V_std, V_max, LS, Vy_max, Vy_pct90,C17
Disclaimer/Publisher’s Note: The statements, opinions and data contained in all publications are solely those of the individual author(s) and contributor(s) and not of MDPI and/or the editor(s). MDPI and/or the editor(s) disclaim responsibility for any injury to people or property resulting from any ideas, methods, instructions or products referred to in the content.

