1. Introduction
The South China Sea is vast and located south of the strong solar radiation zone of the Tropic of Cancer, with abundant temperature-difference energy reserves [
1,
2]. Advanced scientific instruments and monitoring devices are indispensable for exploring the ocean and obtaining on-site observation data and information [
3,
4,
5]. Therefore, the research and design of effective ocean monitoring devices are of great significance [
6,
7,
8]. Among them, the vertical-lifting underwater monitoring device is one of the important tools for studying and exploring the ocean. Currently, the energy forms required by vertical-lifting underwater monitoring devices mainly fall into two categories: one is that all the energy consumption is provided by battery packs; the other is that part of the energy is provided by battery packs and the other part comes from ocean temperature-difference energy [
9,
10,
11]. Usually, the energy consumption of the buoyancy drive system comes from ocean temperature-difference energy, but the power for the control system, communication, and observation equipment is still provided by the battery packs carried by the underwater monitoring device [
12,
13,
14]. Due to the limitation of battery pack capacity, the operation time of traditional vertical-lifting underwater monitoring devices is restricted, making it difficult to perform long-term remote operations [
15,
16].
This paper explores a new type of underwater monitoring device that is driven by ocean thermal energy and operates vertically. The key difference from traditional vertical underwater monitoring devices is that the energy required by this device comes entirely from ocean thermal energy. Ocean thermal energy is inexhaustible and unlimited, and it no longer depends on the capacity of batteries. Therefore, this device can significantly increase its operational cycle and working area [
17,
18]. The device absorbs ocean temperature-difference energy through a solid-liquid-phase-change heat exchanger and converts part of the absorbed energy into mechanical energy to meet the mechanical energy requirements of the buoyancy drive system [
19,
20]. Meanwhile, part of the pressure energy is converted into electrical energy by driving a small-displacement hydraulic motor to rotate a micro-generator, providing power for the observation, communication, and control instruments of the underwater monitoring device [
21]. References [
22,
23,
24] indicate that the marine autonomous monitoring device based on thermal energy utilization absorbs thermal energy from the surface warm water layer of the ocean through reciprocating motion between the thermal boundary layers of the ocean, and releases thermal energy to the deeper cold water layer. The vertical ascending and descending underwater monitoring device based on thermal energy-driven proposed in this paper operates by reciprocating motion at different depths. During this process of heat storage and release, the volume changes due to the solid liquid phase change of the phase change material in the phase change heater, thereby altering the buoyancy of the underwater monitoring device and enabling its upward and downward movement.
In this paper, the Fluent software is used to simulate the melting/solidification process of the phase change material by the enthalpy-porosity method [
25,
26,
27,
28,
29]. This method introduces a quantity called the liquid fraction to represent the proportion of liquid material in the entire control volume [
30,
31,
32,
33,
34]. Additionally, an effective thermal conductivity is introduced in this paper to represent the influence of natural convection in the liquid phase during the melting process on the phase change process [
35,
36,
37]. Under the premise of ensuring a certain accuracy, this greatly simplifies the calculation and analysis process. Through numerical analysis, the influence of different structures, dimensions, and seawater temperatures on the phase change process is obtained, providing a theoretical basis for exploring the optimal phase change device form and size for the power system of a vertical ascending and descending underwater monitoring device driven by ocean thermal energy, as well as the corresponding underwater motion design.
2. Establishment of the Model
2.1. Physical Model
The shape of the traditional vertical-lifting underwater monitoring device such as the self-sustaining profile detection drifting buoy is basically cylindrical, and the shell diameter is generally 0.17 m [
30]. In order to cooperate with the cylindrical shell and make full use of the heat transfer area of the phase change equipment, a cylindrical phase change heat exchanger is designed in this paper. The inner diameter is set to 0.22 m, and the outer diameter is designed in two different sizes, which are set to 0.3 m and 0.26 m, respectively. Because there is a certain space on the outer side of the shell of the platform and the inner side of the cylindrical phase change heat exchanger, the inner and outer sides of the phase change heat exchanger can be used as the heat-exchange surface. In addition, in order to compare the advantages of cylindrical equipment in the heat transfer process, this paper also analyzes the phase change process of cylindrical phase change equipment and compares it with the same volume of cylindrical phase change heat exchanger. Because n-hexadecane has the characteristics of suitable phase change temperature, high volume expansion rate, stable performance and wide source [
38,
39], this paper uses hexadecane as a phase change material, and in order to improve the thermal conductivity of n-hexadecane. Graphite with a volume ratio of 10% was added to n-hexadecane. The physical parameters of phase change materials are shown in
Table 1.
The research materials show, that under the pressure of 60 MPa, paraffin can still produce a volume expansion rate of 9% [
40,
41]. In this paper, the volume expansion rate of n-hexadecane is 8% for the sake of conservation. Therefore, in order to obtain a volume expansion of 1 L, the volume ratio of n-hexadecane and graphite composite phase change with a volume ratio of 9:1 is obtained. The volume is 13,889 mL, so the lengths of the two cylindrical phase change heat exchangers with an inner diameter of 0.22 m, and an outer diameter of 0.3 and 0.26 m are 0.425 and 0.924 m, respectively, and 0.45 and 0.95 m are taken in the simulation. The unit model of the cylindrical phase change heater is shown in
Figure 1, where PCM represents the phase change material.
2.2. Mathematical Model
2.2.1. The General Form of Control Equation
In the formula, H is the total enthalpy of the unit volume phase change material; t is the time; is the liquid-phase velocity vector; is the thermal conductivity; is the density; T is the temperature; is the solid-phase (or liquid-phase) phase volume heat source (sink); is the unit mass force; is the kinetic viscosity; and P is the pressure.
Hypothesis
In order to simplify the calculation model, the following assumptions are made:
(1) The axial and circumferential heat transfer of the cylindrical vessel is neglected, and only the radial heat transfer is considered;
(2) There is no supercooling and performance degradation of phase change materials;
(3) The solid-phase and liquid-phase thermophysical properties of phase change materials are different, but they have nothing to do with temperature and pressure.
(4) Isotropy of phase change materials;
(5) Ignoring the thermal resistance of the tube wall;
(6) In the melting process of phase change materials, the influence of natural convection caused by gravity is reflected by effective thermal conductivity, and the phase change process is regarded as a heat transfer process dominated by heat conduction.
The Unity of Enthalpy Field and Temperature Field
Although the differential equation of the enthalpy model unifies the solid phase, liquid phase, or two-phase region in the form of the equation, the form of the enthalpy field,
H, and the temperature field,
T, is not unified. When the specific heat capacity of the solid and liquid phases is constant, respectively, there is the following relationship between them:
In the formula,
is the density of the solid-phase-change material;
is the specific heat capacity of solid-phase-change materials;
is the phase transition temperature;
is the density of liquid-phase-change materials;
is the volume fraction of liquid phase;
is the latent heat of melting of phase-change materials; and
is the specific heat capacity of liquid-phase-change materials. For the isothermal phase-transition process, the liquid volume fraction,
, is determined by Equation (5).
The region for 0 <
< 1 is the mushy zone. Therefore, the change of liquid volume fraction,
, can describe the phase-change process: when
= 0, the phase-change material is a solid phase, and the temperature of the phase-change material is lower than the phase change temperature; when 0 <
< 1, the two phases coexist, and the temperature of the phase-change material is equal to the phase change temperature; and when
= 1, the phase change material is liquid phase, and the temperature of the phase-change material is higher than the phase change temperature. The expression of sensible heat
and
is unified as
, so the energy equation can be unified as the equation with the variable of sensible heat,
, as follows:
Treatment of Liquid-Phase Velocity
For the underwater monitoring device driven by temperature-difference energy studied in this paper, the volume change law of phase-change material and the total time required for phase change are the most important parameters, while the velocity field inside the liquid working medium is meaningless for the study of the whole system, and it is not necessary to spend a lot of time on solving the velocity field. Therefore, in order to simplify the calculation, this paper adopts a method of effective thermal conductivity [
36]. The influence of liquid velocity on the melting and solidification process of phase change refrigerant is compensated by modifying the thermal conductivity. In this way, the term of velocity contained in the energy equation can be discarded, and the effect of convection can be reflected on the effective thermal conductivity. At the same time, because there is no velocity term, the phase transition process can be described by only one equation of the energy equation; that is, Equations (1)–(3) can be simplified to a control equation of the energy equation. The simplified governing equation is as follows:
In the formula, is the phase-change material’s equivalent thermal conductivity, and is the unit mass solid (liquid)-phase volume heat source (sink). Because there is no internal heat source in the PCM system of the ocean temperature-difference drive device, so .
2.2.2. Initial and Boundary Conditions
The melting process of the phase-change material is basically completed when the monitoring device floats in the warm water layer on the surface. Therefore, its boundary conditions are of the first type of fixed-temperature boundary conditions. The initial temperature of the process is the melting point temperature of the phase-change material, . The solidification process mainly occurs during the stage when the monitoring device rises or descends at a certain speed in the lower cold water layer. Therefore, the boundary conditions of this process are of the third type, and the initial temperature in this study is taken as the temperature of the surface seawater.
Melting Process
In the formula, is the inner radius of the cylinder, is the outer radius of the cylinder, and is the seawater surface temperature.
Solidification Process
In the formula,
is the external seawater temperature; and
is the surface average heat transfer coefficient (convective heat transfer coefficient) can be calculated according to the Zhukauskas correlation,
, where
is the thermal conductivity of seawater,
is the characteristic size (the height of the cylindrical phase change heat exchanger is taken here), and
is the Nusselt number. The Nusselt number can be calculated according to the laminar flow type of the plate [
31]:
, where
is the Reynolds number, and
is the Prandtl number. In order to facilitate the effective underwater measurement of the platform, the underwater motion speed of the platform is
. The physical parameters of seawater used in the calculation are as follows [
40]:
,
,
,
, , , and
.
3. Grid Division and Model Selection
A three-dimensional model is used for the cylindrical phase change heat exchanger, and the hexahedral element is used in the grid form. The 3D separated unsteady-state solution method in Fluent software is combined with the Solidification/Melting model.
The number of grids in the cylindrical heat exchanger with an outer diameter of 26 cm and a height of 95 cm is 220,037, the number of grids in the cylindrical heat exchanger with an outer diameter of 30 cm and a height of 45 cm is 115,632, and the number of grids in the cylindrical heat exchanger with a diameter of 7 cm and a height of 95 cm is 560,700. The time step used in the simulation calculation is selected as 1 s, and the Boussinesq hypothesis is selected as the density term.
4. Simulation Results and Analysis
4.1. Solidification Process
In the solidification process, the most important information in this paper is that the time required for the phase change material to go from
to
under various working conditions and it must be shorter than the duration of the underwater monitoring device in cold water. The ocean surface-water temperature is taken as 26 °C [
1] for calculation and analysis.
4.1.1. Effect of Different Sizes of Cylindrical Phase-Change Heat Exchanger on Solidification Process
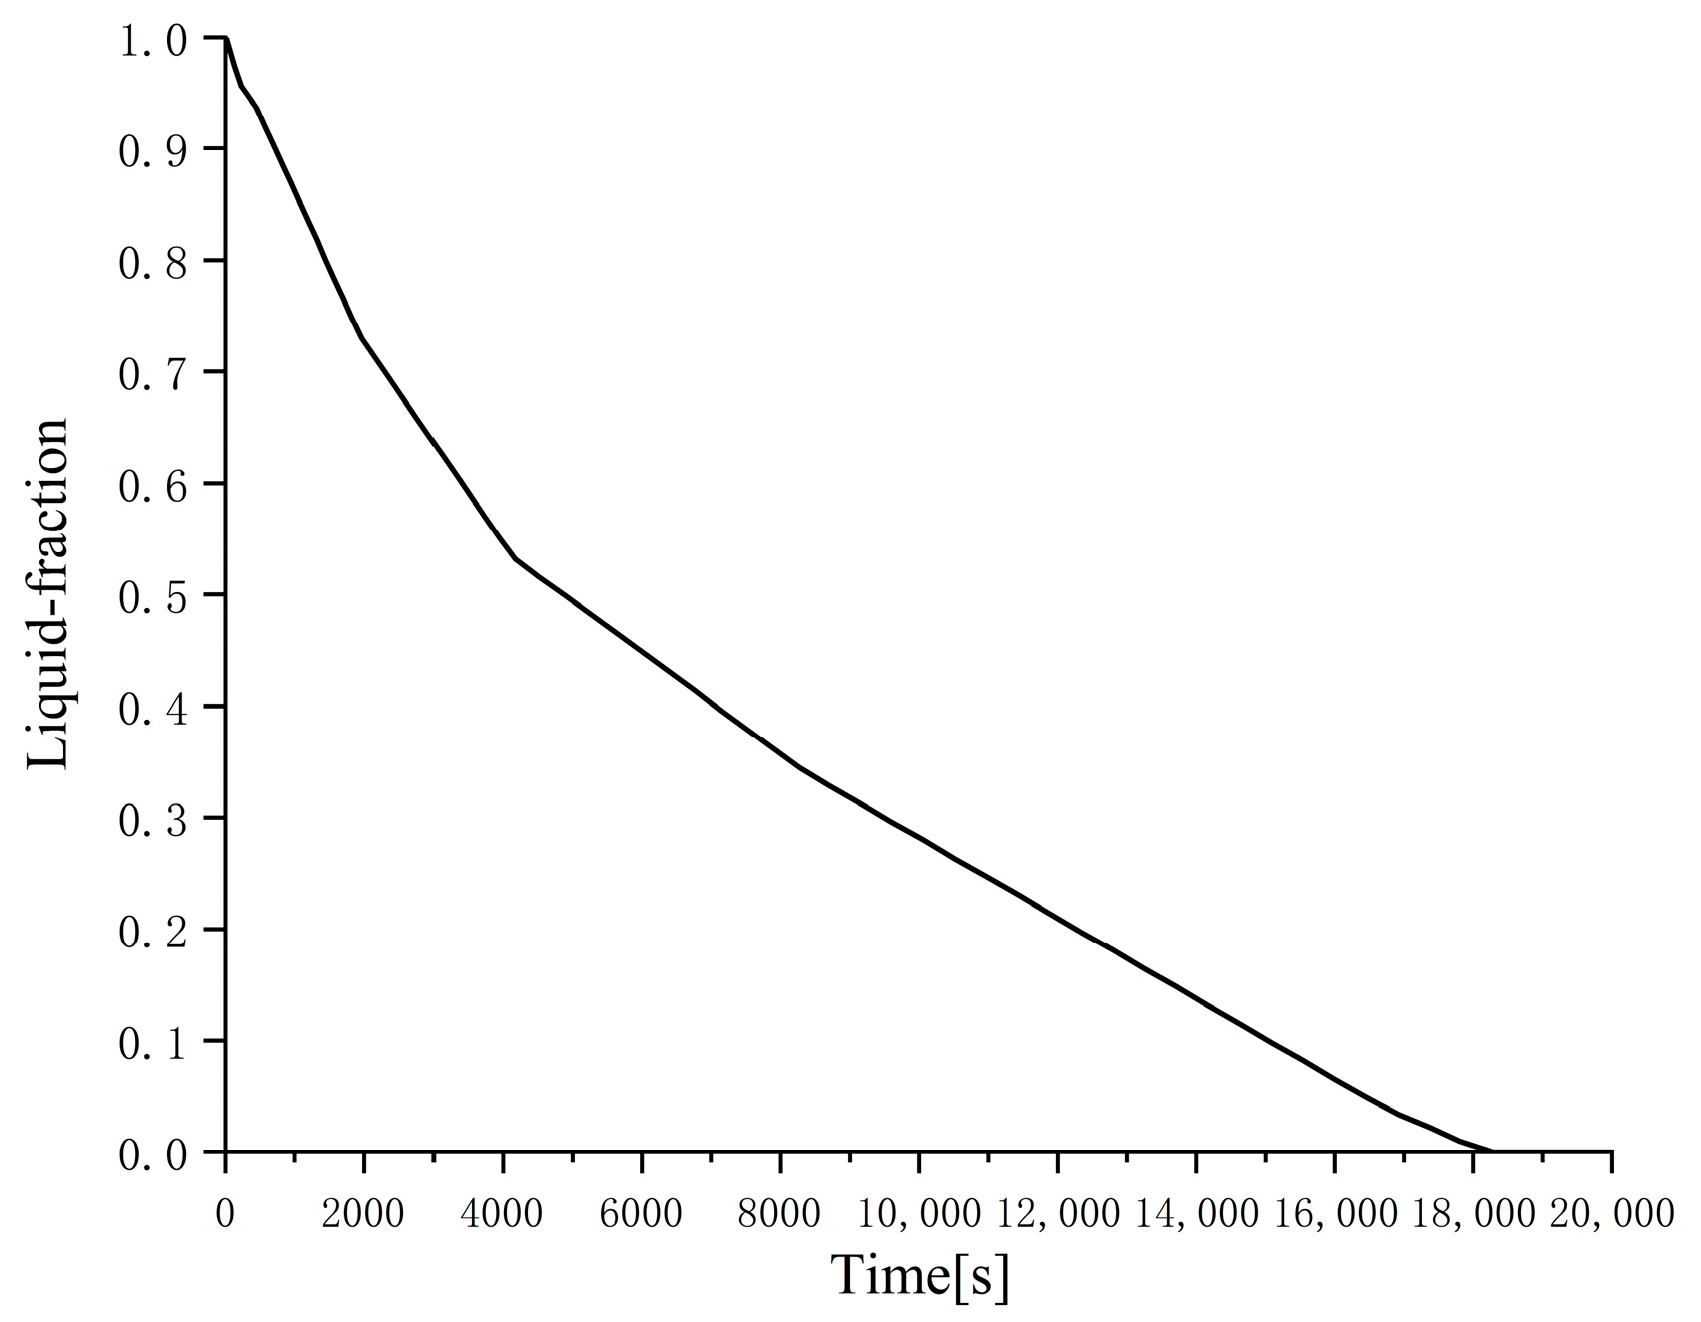
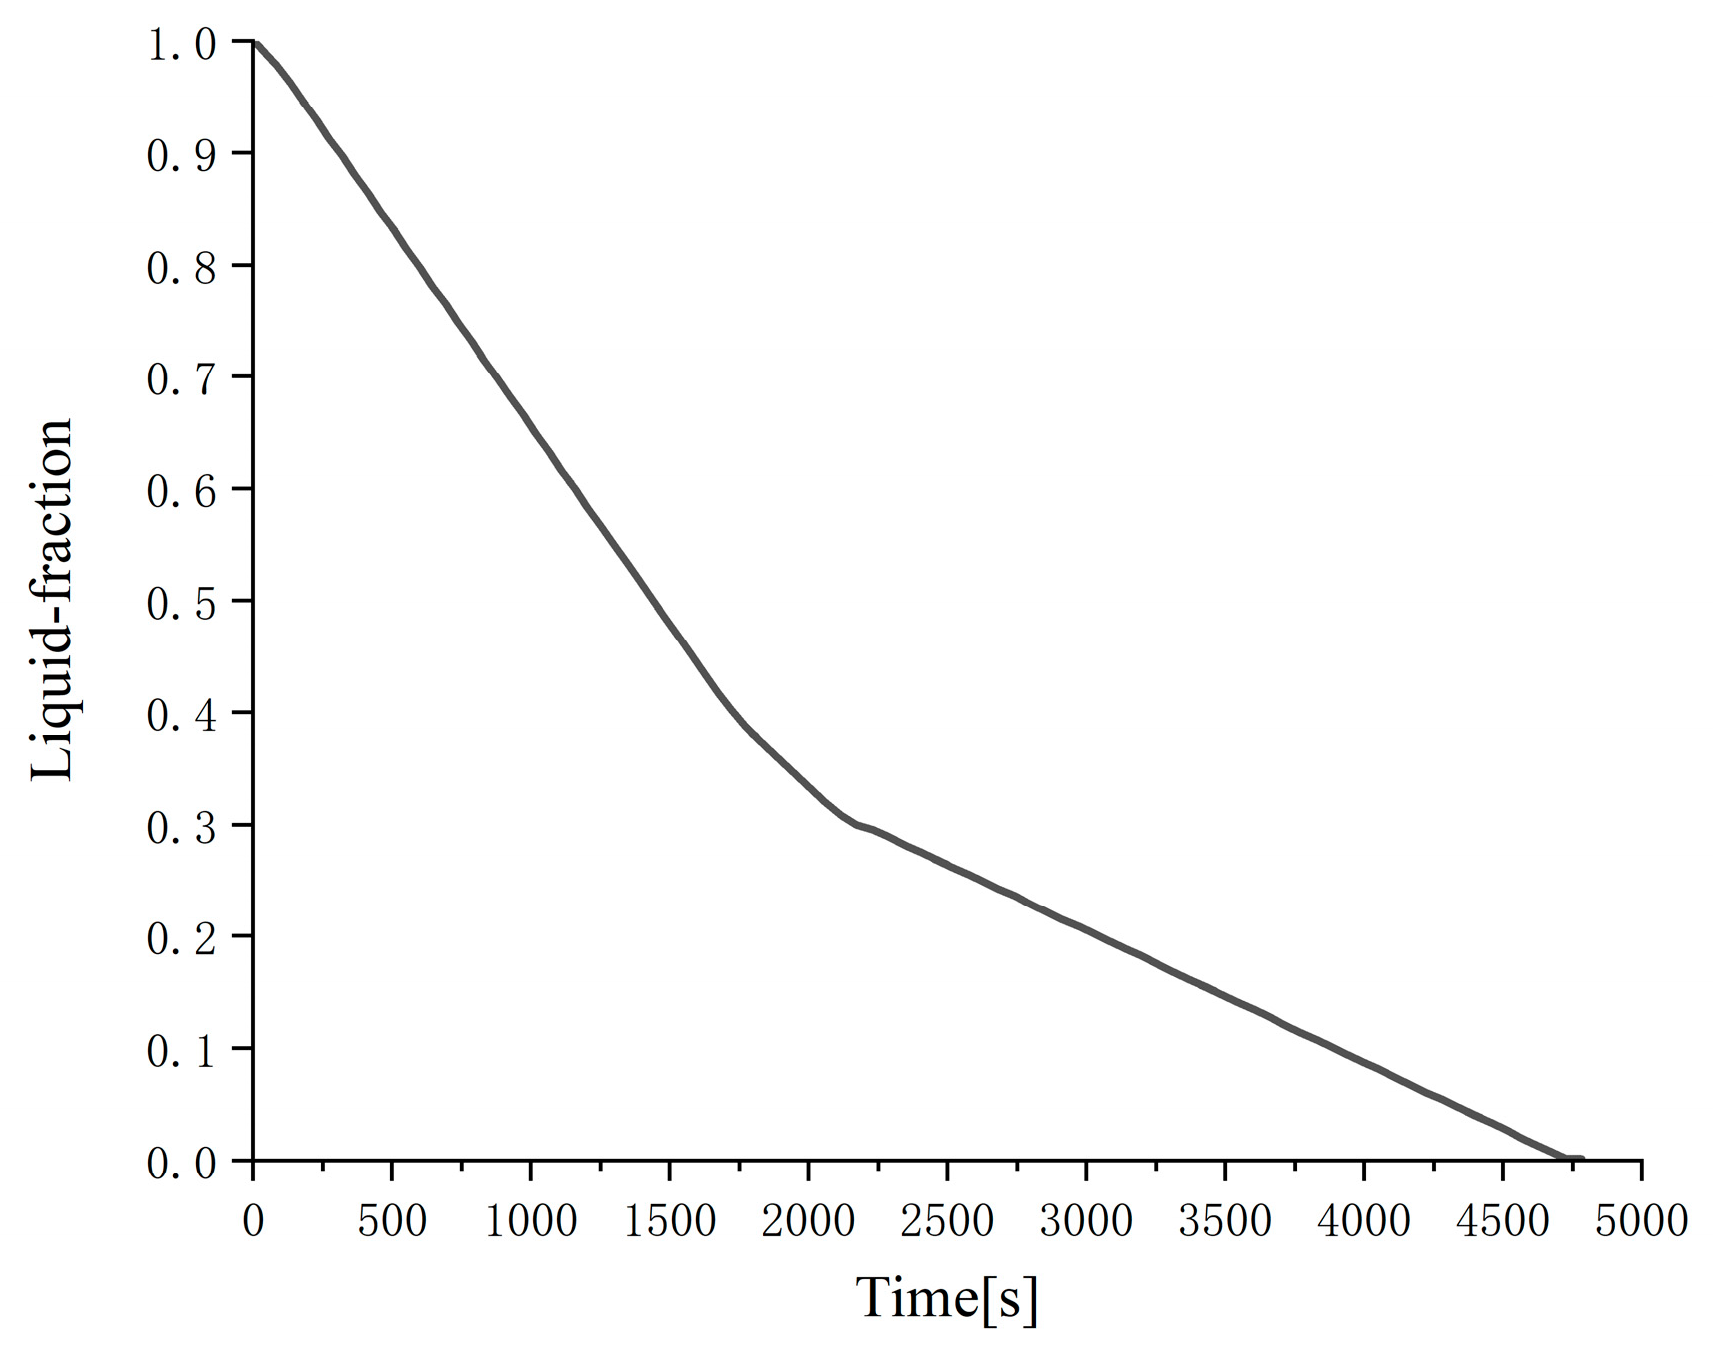
It can be clearly seen from
Figure 2 and
Figure 3 that as the outer diameter of the cylinder decreases (the thickness of the phase-change material decreases), the liquid-phase ratio decreases significantly at the same time, that is, the phase change condensation rate increases significantly. This is mainly because the thermal conductivity of the phase-change material n-hexadecane is very low even if 10% graphite is added. The smaller the thickness of the phase-change material, the smaller the thermal resistance and the stronger the heat transfer, so the condensation process is faster; in addition, under the premise that the total volume of the phase-change material and the inner diameter of the cylinder are the same, the smaller the outer diameter of the cylinder, the longer the cylinder, the larger the outer surface area, and the stronger the heat transfer, which is also the reason for the accelerated phase change rate. The numerical analysis results show that the time required for these two cylindrical phase change heat exchangers with different outer diameters to complete the solidification process is 18,290 and 4800 s, respectively.
4.1.2. The Influence of Cylindrical Heat Exchanger and Cylindrical Heat Exchanger on the Solidification Process
In order to compare the different effects of cylindrical phase change heat exchanger and cylindrical phase change heat exchanger on the solidification process, four cylindrical phase change heat exchangers with a diameter of 0.07 m were used to load phase-change materials, which were 0.95 m long and equivalent to the volume of cylindrical phase change heat exchanger. Because the working conditions of these four cylindrical phase change heat exchangers are exactly the same, only one is numerically analyzed.
Comparing
Figure 3 and
Figure 4, it can be clearly seen that under the same phase change time, the total liquid-phase ratio of the cylindrical phase change heat exchanger is significantly smaller than the total liquid-phase ratio of the cylindrical phase change heat exchanger. The reason is also that the cylindrical phase change heat exchanger has a larger thickness of the phase change material and a smaller total outer surface of the heat exchange, which is not conducive to the heat exchange between the phase change material and the outside world. The numerical analysis results show that the time required for the cylindrical phase change heat exchanger to complete the solidification process is as high as 27,800 s, which is much higher than any of the cylindrical phase change heat exchangers mentioned above. Of course, if we greatly increase the number of cylindrical phase change heat exchangers, the phase change rate will be greatly improved, but from the perspective of manufacturing and processing, this is obviously unfavorable.
4.1.3. Effect of Seawater Temperature on Solidification Process
The temperature of seawater gradually decreases with depth in the vertical direction. It is about 26~27 °C in the surface layer (sea surface to 60 m deep), 60~300 m is a variable temperature layer, and the temperature does not change much, but below 300 m. The temperature drops to about 4 °C [
1].
Figure 2,
Figure 3 and
Figure 4 are calculated according to the seawater temperature of 10 °C. In order to analyze the influence of seawater temperature on the solidification process, this paper also simulates and analyzes the seawater temperature of 7 °C. The cylindrical phase change heat exchanger with an outer diameter of 0.26 m and a height of 0.95 m was used in the analysis.
By comparing
Figure 3 and
Figure 5, it can be clearly seen that as the seawater temperature decreases, the total liquid-phase ratio of the phase change material decreases significantly, and the solidification rate increases significantly. The numerical results also show that the time required to complete the phase change process of the cylindrical phase change heat exchanger with a seawater temperature of 7 °C, an outer diameter of 0.26 m, and a height of 0.95 m is only 3470 s, which is 1330 s shorter than that of the seawater temperature of 10 °C.
4.2. Melting Process
The melting process of phase change materials mainly occurs on the sea level, and the whole process platform is basically in a static state. Therefore, it is a fixed wall-temperature boundary condition, and its boundary temperature is the ocean surface-water temperature. In this paper, 26 °C is taken. Since the temperature of the platform is gradually increasing during the floating process, the initial temperature of the phase change material during the melting process is set to the melting-point temperature, Tm.
4.2.1. The Influence of Different Sizes of Cylindrical Phase ChangePhase-Change Heat Exchangers on the Melting Process
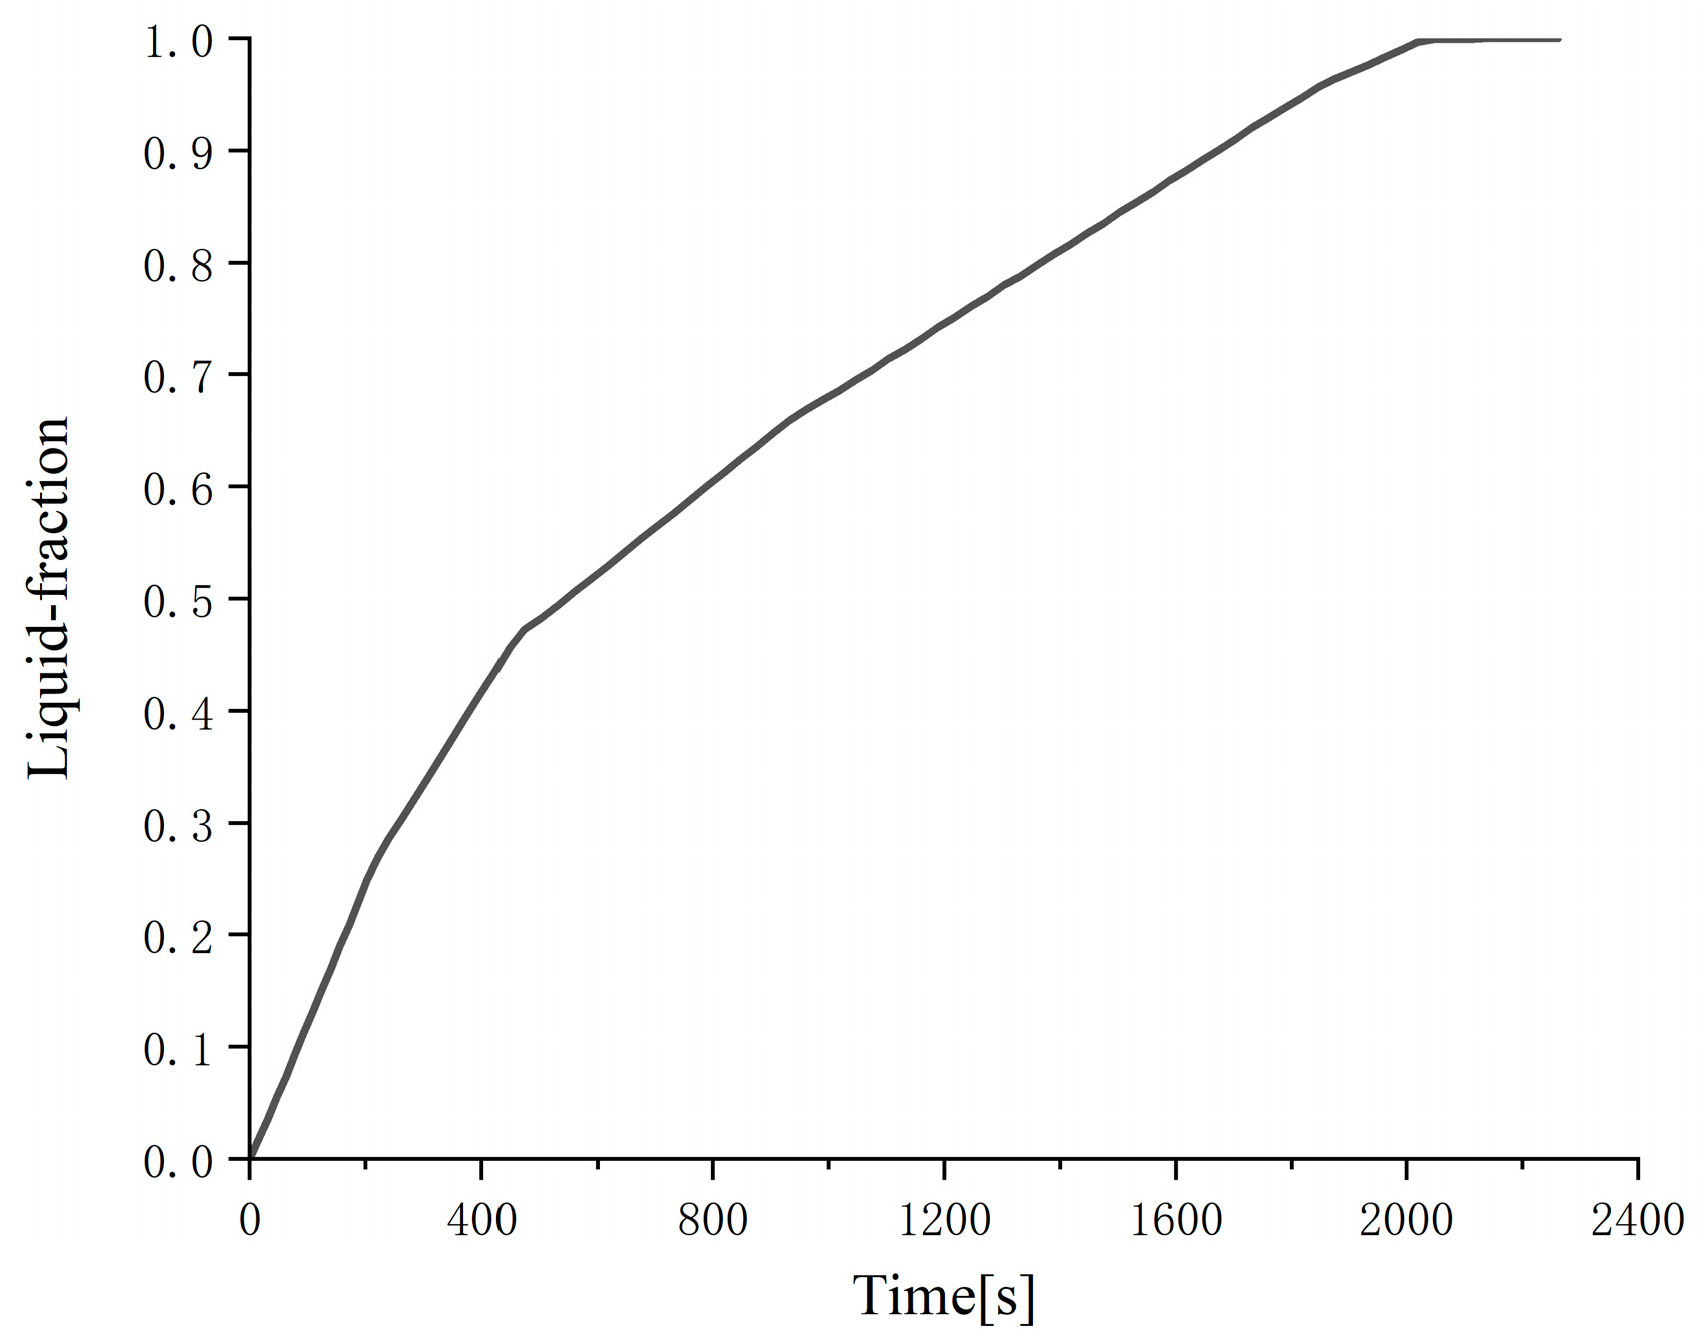
From
Figure 6 and
Figure 7, it can be clearly seen that with the decrease in the outer diameter of the cylinder (i.e., the decrease in the thickness of the phase change material), the phase change melting rate is significantly accelerated, and the total liquid-phase fraction is significantly increased. This is also because the smaller the thickness of the phase change material is, the smaller the thermal resistance is, the stronger the heat transfer is, and the faster the melting process is; in addition, the smaller the outer diameter of the cylinder and the longer the cylinder, the larger the heat transfer surface area and the stronger the heat transfer. The numerical analysis results show that the time required for the two cylindrical phase change heat exchangers with different outer diameters to complete the melting process is 2130 and 520 s, respectively.
4.2.2. The Influence of Cylindrical Phase ChangePhase-Change Heat Exchanger and Cylindrical Phase ChangePhase-Change Heat Exchanger on the Melting Process
In the analysis, four cylindrical phase change heat exchangers with a diameter of 0.07 m and a length of 0.95 m were used to install phase change materials, which were equivalent to the volume of the cylindrical phase change heat exchanger.
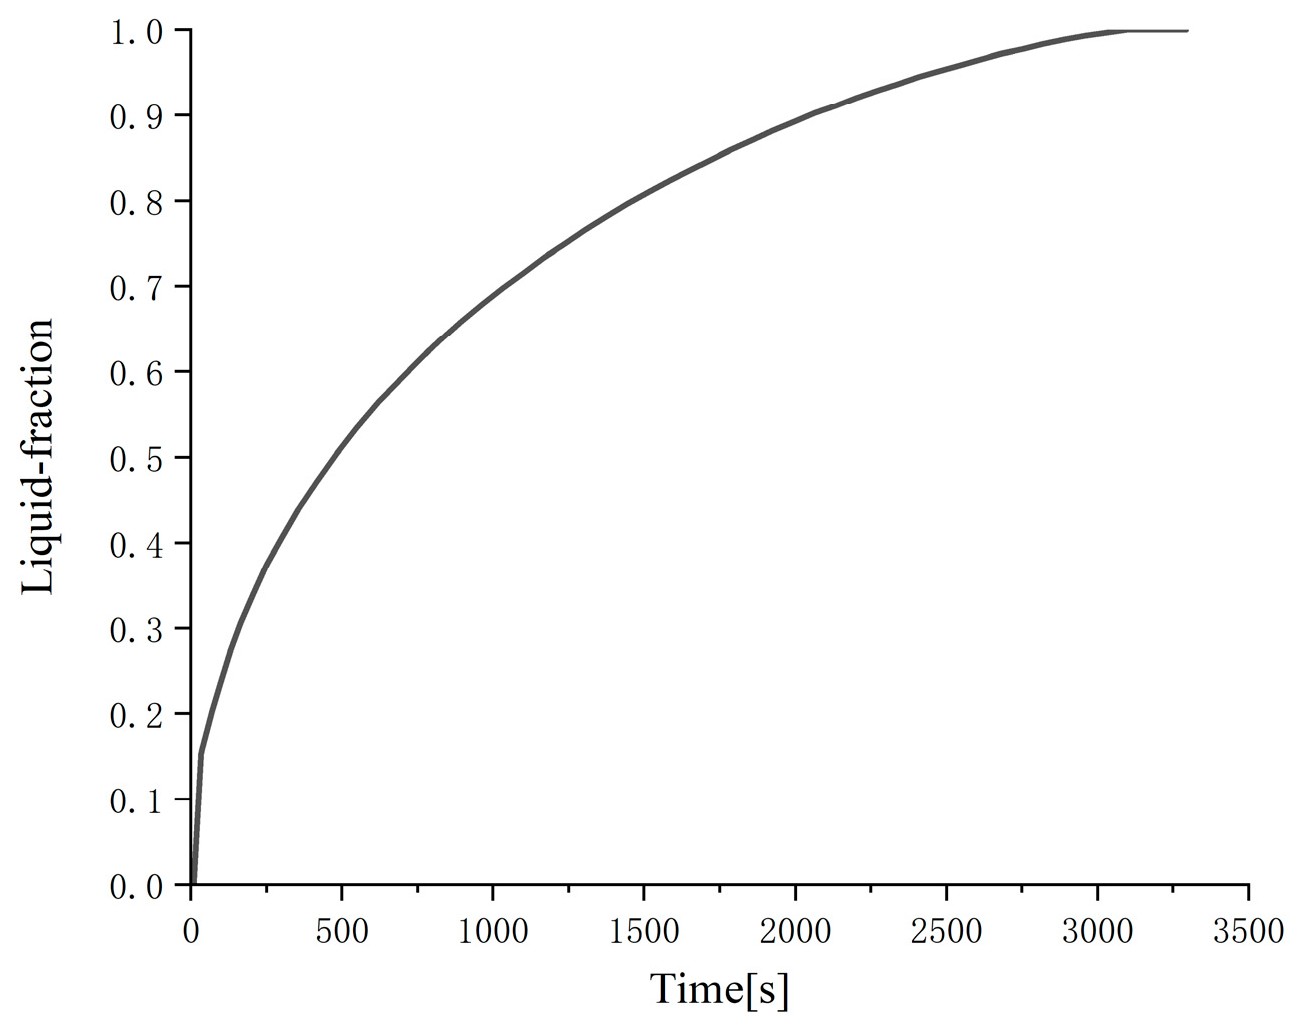
Comparing
Figure 7 and
Figure 8, it can be clearly seen that, under the same phase change time, the total liquid-phase ratio of the cylindrical phase change heat exchanger is significantly larger than the total liquid-phase ratio of the cylindrical phase change heat exchanger. The reason is also that the larger thickness of the phase change material in the cylindrical phase change heat exchanger and the smaller total outer surface of the heat exchange are not conducive to the heat exchange between the phase change material and the outside world. The numerical analysis results show that the time required for the cylindrical phase change heat exchanger to complete the melting process is 3100 s, which is much higher than the 520 s of the cylindrical phase change heat exchanger with the same height, and also higher than any of the cylindrical phase change heat exchangers mentioned above.
4.3. Comparison of Solidification Process and Melting Process
Through the above analysis, we found that, for the same type of phase change heat exchanger, the melting rate is much larger than the solidification rate. For example, for a cylindrical phase change heat exchanger with an inner diameter of 0.22 m, an outer diameter of 0.26 m, and a height of 0.95 m, it takes only 520 s to complete the melting process, but it takes 4800 s to complete the solidification process when the seawater temperature is 10 °C. The main reason is that the influence of natural convection in the liquid phase during the melting process makes the effective thermal conductivity much higher than the thermal conductivity of the phase change material during solidification. Therefore, the solidification process of the phase change material is the main process that affects and restricts the phase change process.
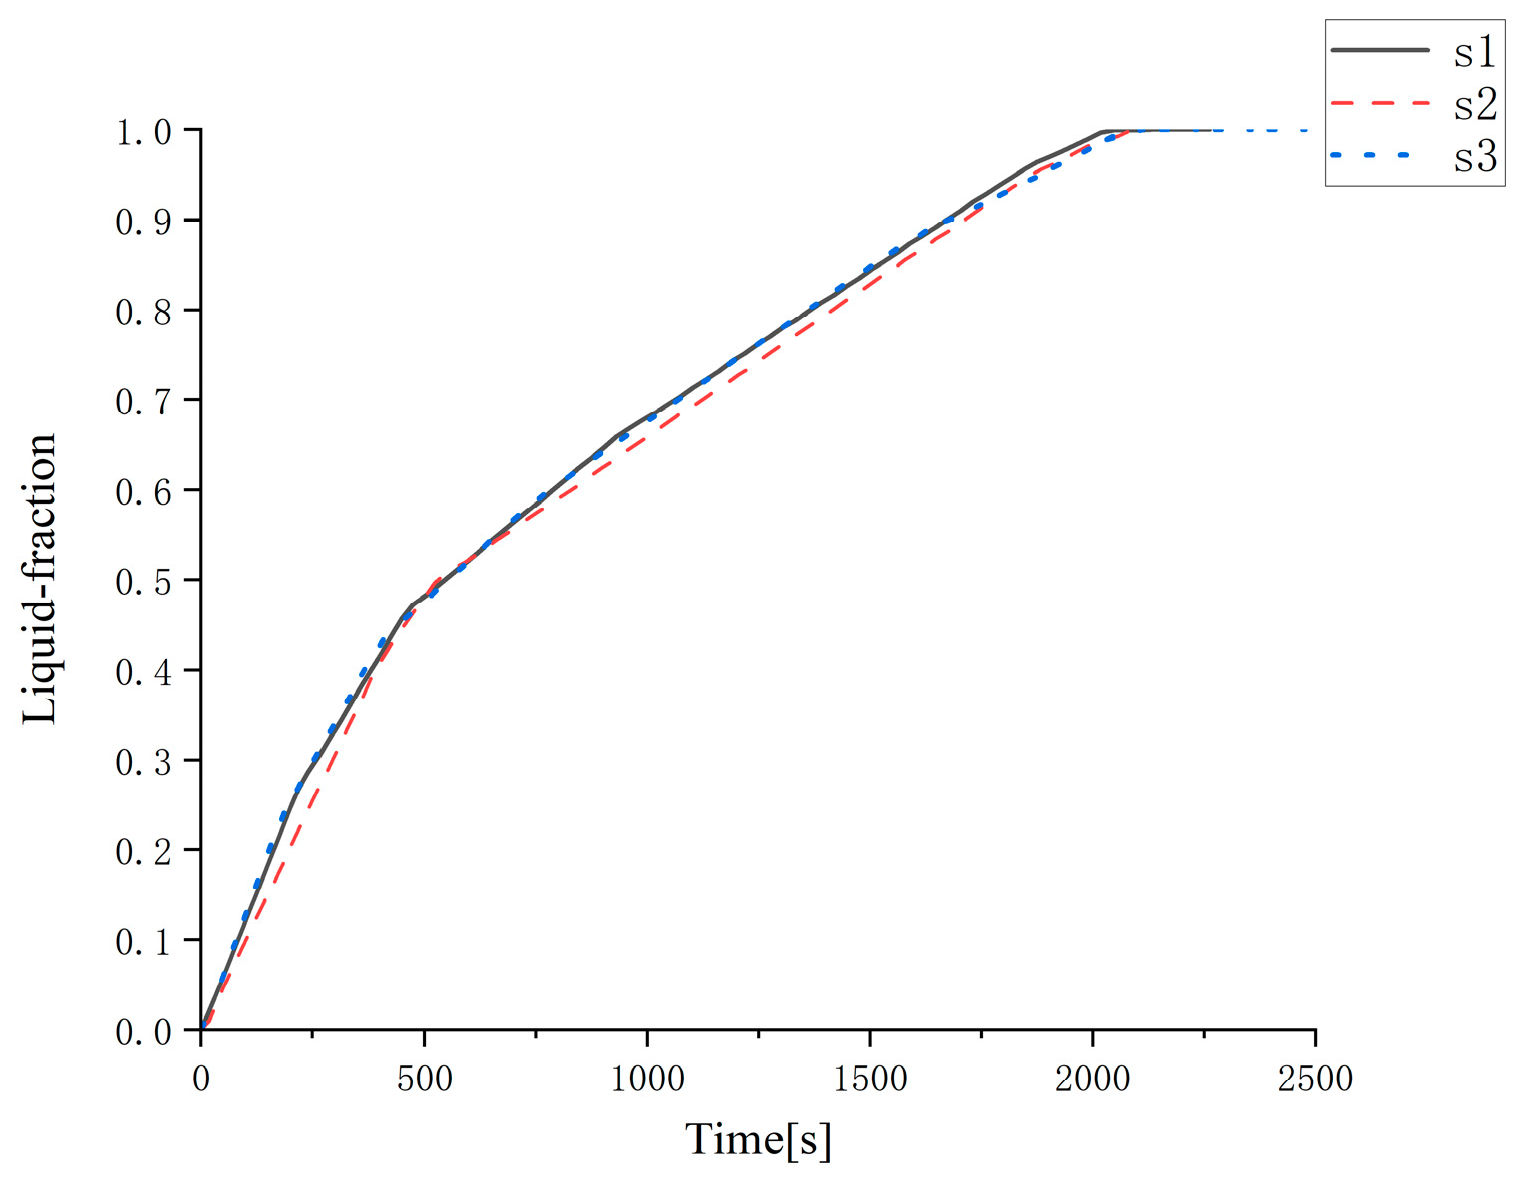
4.4. Grid Independence Test
The melting process of a cylindrical heat exchanger with an outer diameter of 0.3 m and a height of 0.45 m was tested for grid independence. The number of grids was 80,000, 110,000, and 130,000, respectively. The melting curve is shown in
Figure 9. In the figure, the number of grids corresponding to the curve s1 is 110,000, the number of grids corresponding to s2 is 80,000, and the number of grids corresponding to s3 is 130,000. It can be clearly seen from
Figure 9 that the three curves are very similar, and the time to complete the melting is 2130 s, 2090 s, and 2110 s, respectively, which is very close. The differences between each other are only 1.87%, 0.96%, and 0.95%, respectively.
Figure 7 shows the melting characteristics of the cylindrical heat exchanger with an outer diameter of 0.3 m and a height of 0.45 m when the number of grids is 110,000.
5. Conclusions
(1) Compared with the cylindrical phase change heat exchanger, the cylindrical phase change heat exchanger is more conducive to the phase change process faster. In addition, the cylindrical phase change heat exchanger is also more convenient to cooperate with the cylindrical underwater detection platform.
(2) For the cylindrical phase change heat exchanger, under the premise of the same total volume and inner diameter, the heat exchanger with a smaller outer diameter completes the phase change process faster. The main reason is that the thickness of the phase change material of the cylindrical phase change heat exchanger with a smaller outer diameter is smaller, and the total heat transfer area is larger.
(3) Seawater temperature has a great influence on the solidification process. When the seawater temperature decreases, the solidification rate increases significantly, and the time to complete the solidification process decreases significantly.
(4) In the same case, the melting rate of the phase change material is much higher than the solidification rate. The main reason is that the effective thermal conductivity of the phase change material is much higher than the thermal conductivity of the phase change material during solidification due to the influence of the natural convection of the liquid phase during the melting process. Therefore, the solidification process is the main process that affects and restricts the phase change process of the phase change material.
(5) Further studies will be conducted on more types of heat exchangers with different structures and sizes, as well as on the effects of different seawater temperatures. Experimental research will also be carried out to compare and verify the numerical calculation results, thereby providing a more scientific basis for the research on vertical motion underwater monitoring devices driven by temperature-difference energy.
Author Contributions
Z.L., conceptualization, methodology, and data curation; Q.L., validation, writing, and review; T.Z., methodology, software, and writing. All authors have read and agreed to the published version of the manuscript.
Funding
Shandong Provincial Natural Science Foundation (No. ZR2023ME168).
Institutional Review Board Statement
Not applicable.
Informed Consent Statement
Not applicable.
Data Availability Statement
The data presented in this study are available on request from the corresponding author. The data will not be publicly available due to privacy.
Conflicts of Interest
The authors declare no conflicts of interest.
Nomenclature
| PCM | phase change material |
| solid-phase-change material’s specific heat capacity () |
| liquid-phase change material’s specific heat capacity () |
| solid-phase-change material’s density () |
| liquid-phase-change material density () |
| thermal conductivity of solid-phase-change materials () |
| effective thermal conductivity of liquid-phase-change materials () |
| H | unit-volume phase change material (J·) |
| t | time (s) |
| liquid-phase velocity vector (m·) |
| thermal conductivity () |
| density () |
| T | temperature (°C) |
| solid (liquid) phase volume heat source (sink) (J·) |
| unit mass force (m·
) |
| kinetic viscosity
·
) |
| P | pressure (Pa) |
| the specific heat capacity of solid-phase-change materials (
) |
| phase transition temperature (°C) |
| volume fraction of liquid phase |
| the latent heat of melting of phase change materials (J·) |
| The specific heat capacity of liquid-phase-change materials ()
|
| phase change material’s equivalent thermal conductivity () |
| unit mass solid (liquid) phase volume heat source (sink) (J·
) |
| the inner radius of the cylinder (m) |
| outer radius of the cylinder (m) |
| seawater surface temperature (°C) |
| external seawater temperature (°C) |
| surface average heat transfer coefficient (W/(
)) |
References
- Wu, H.; Yang, X.; Li, Z.; Kuang, R. Benefit analysis of deep-sea temperature difference energy utilization based on south China sea. Acta Energiae Solaris Sin. 2024, 45, 536–544. [Google Scholar]
- Wang, X.; Ma, C. Utilization of marine renewable energy resources under the goal of carbon peaking and carbon neutrality. IIE 2021, 43, 91–96. [Google Scholar]
- Huo, E.R.; Chen, W.; Deng, Z.L.; Gao, W.; Chen, Y.P. Thermodynamic analysis and optimization of a combined cooling and power system using ocean thermal energy and solar energy. Energy 2023, 278, 127956. [Google Scholar] [CrossRef]
- Wang, L.; Niu, W.; Ding, L.; Zhao, Z. A Bibliometric Review on Marine Economy: Current Status, Development and Future Directions. Mar. Policy 2023, 155, 105705. [Google Scholar] [CrossRef]
- Xiao, C.; Gulfam, R. Opinion on ocean thermal energy conversion (OTEC). Front. Energy Res. 2023, 11, 1115695. [Google Scholar] [CrossRef]
- Su, H.; Chuang, Z.; Zhang, C. Application analysis of GDCSM-Argo in evaluating global ocean heat content. J. Mar. Sci. 2024, 42, 40–54. [Google Scholar]
- Zhuang, Z.; Zhang, Y.; Zhang, L.; Ruan, W.; Lyu, D.; Yu, J. Reconstructing the Three-Dimensional Thermohaline Structure of Mesoscale Eddies in the South China Sea Using In Situ Measurements and Multi-Sensor Satellites. Remote Sens. 2025, 17, 22. [Google Scholar] [CrossRef]
- Tsontos, V.M. COVERAGE: Next Generation Data Service Infrastructure for a Digitally Integrated Ocean Observing System in Support of Marine Science and Ecosystem-Based Management. Mar. Technol. Soc. J. 2021, 55, 70–71. [Google Scholar] [CrossRef]
- Quenel, J.; Atakan, B. Heat Flux in Latent Thermal Energy Storage Systems: The Influence of Fins, Thermal Conductivity and Driving Temperature Difference. Heat Mass Transf. 2022, 58, 2085–2096. [Google Scholar] [CrossRef]
- Aresti, L.; Onoufriou, T.; Michailides, C.; Christodoulides, P. OTEC Systems’ Heat Losses in Pipes. WSEAS Trans. Heat Mass Transf. 2025, 20, 14–19. [Google Scholar] [CrossRef]
- Rasgianti, R.A.; Nugraha, A.D.; Sitanggang, R.B.; Pandoe, W.W.; Aprijanto, T.Y.; Santosa, M.A. System Parameters Sensitivity Analysis of Ocean Thermal Energy Conversion. Emerg. Sci. J. 2024, 8, 428–448. [Google Scholar] [CrossRef]
- Alamu, O.; Olwal, T.O.; Djouani, K. Energy harvesting techniques for sustainable underwater wireless communication networks: A review. e-Prime Adv. Electr. Eng. Electron. Energy 2023, 5, 100265. [Google Scholar] [CrossRef]
- Simao, D.H.; Chang, B.S.; Brante, G.; Pellenz, M.E.; Souza, R.D. Energy Efficiency of Multi-Hop Underwater Acoustic Networks Using Fountain Codes. IEEE Access. 2020, 8, 23110–23119. [Google Scholar] [CrossRef]
- Jung, H.; Subban, C.V.; McTigue, J.D.; Martinez, J.J.; Copping, A.E.; Osorio, J.; Liu, J.; Deng, Z.D. Extracting energy from ocean thermal and salinity gradients to power unmanned underwater vehicles: State of the art, current limitations, and future outlook. Renew. Sustain. Energy Rev. 2022, 160, 112283. [Google Scholar] [CrossRef]
- Islam, K.Y.; Ahmad, I.; Habibi, D.; Waqar, A. A survey on energy efficiency in underwater wireless communications. J. Netw. Comput. Appl. 2022, 198, 103295. [Google Scholar] [CrossRef]
- Kesari Mary, D.R.; Ko, E.; Yoon, D.J.; Shin, S.-Y.; Park, S.-H. Energy Optimization Techniques in Underwater Internet of Things: Issues, State-of-the-Art, and Future Directions. Water 2022, 14, 3240. [Google Scholar] [CrossRef]
- Ghaedi, A.; Sedaghati, R.; Mahmoudian, M.; Rodrigues, E.M.G.; Godina, R. Reliability assessment of the ocean thermal energy conversion systems through Monte Carlo simulation considering outside temperature variation. J. Mar. Sci. Technol. 2024, 29, 36–52. [Google Scholar] [CrossRef]
- Hu, Z.; Wang, J.A.; Huo, E.R.; Zhang, C.B. Investigation of a distillation desalination system driven by solar and ocean thermal energy. Desalination 2023, 559, 116649. [Google Scholar] [CrossRef]
- Tuoi, T.T.K.; Toan, N.V.; Ono, T. Theoretical and experimental investigation of a thermoelectric generator (TEG) integrated with a phase change material (PCM) for harvesting energy from ambient temperature changes. Energy Rep. 2020, 6, 2022–2029. [Google Scholar] [CrossRef]
- Zhang, H.; Liu, C.; Yang, Y.; Wang, S. Ocean thermal energy utilization process in underwater vehicles: Modelling, temperature boundary analysis, and sea trail. Int. J. Energy Res. 2020, 44, 2966–2983. [Google Scholar] [CrossRef]
- Yang, J.; Liu, B.; Zhang, T.; Hong, J.; Zhang, H. Application of energy conversion and integration technologies based on electro-hydraulic hybrid power systems: A review. Energy Convers. Manag. 2022, 272, 116372. [Google Scholar] [CrossRef]
- Wang, X.; Sha, H.; Li, M.; Liu, T.; Sun, M.; Liu, T.; Huang, H.; Wang, J.; Jiang, D. Numerical and experimental investigations on thermal-to-work conversion process in thermal engine for thermal underwater gliders. J. Energy. Storage 2023, 73, 109113. [Google Scholar] [CrossRef]
- Liu, T.; Sha, H.; Li, M.; Sun, M.; Chen, G.; Jiang, D.; Song, Y. Theoretical analyses on a piston-based thermal engine for thermal underwater glider. Appl. Therm. Eng. 2022, 213, 118718. [Google Scholar] [CrossRef]
- Shi, B.; Zhang, S.; Shi, L.; Hu, Z. Computational Fluid Dynamics Analysis of a Centrifugal Pump Based on Solid-Liquid Two-Phase Turbulence. ACS Omega 2025, 10, 14031–14041. [Google Scholar] [CrossRef]
- Kang, Z.; Tan, R.; Zhou, W.; Qin, Z.; Liu, S. Numerical Simulation and Optimization of a Phase-Change Energy Storage Box in a Modular Mobile Thermal Energy Supply System. Sustainability 2023, 15, 13886. [Google Scholar] [CrossRef]
- Keshteli, A.N.; Sheikholeslami, M. Influence of Al2O3 Nanoparticle and Y-shaped Fins on Melting and Solidification of Paraffin. J. Mol. Liq. 2020, 314, 113798. [Google Scholar] [CrossRef]
- Kirincic, M.; Trp, A.; Lenic, K. Influence of Natural Convection During Melting and Solidification of Paraffin in a Longitudinally Finned Shell-and-tube Latent Thermal Energy Storage on the Applicability of Developed Numerical Models. Renew. Energy 2021, 179, 1329–1344. [Google Scholar] [CrossRef]
- Elawady, N.; Bekheit, M.; Sultan, A.A.; Radwan, A. Energy Assessment of a Roof-Integrated Phase Change Materials, Long-Term Numerical Analysis with Experimental Validation. Appl. Therm. Eng. 2021, 202, 117773. [Google Scholar] [CrossRef]
- Saeed, T.; Mahboobe, M. Computational Study of a Latent Heat Thermal Energy Storage System Enhanced by Highly Conductive Metal Foams and Heat Pipes. J. Therm. Anal. Calorim. 2020, 141, 1741–1751. [Google Scholar]
- Jiang, X.; Hao, N. Numerical Simulation of Heat Transfer Characteristics of Double-layer ShapedPhase Change Wall in Hefei. J. Anhui Jianzhu Univ. 2024, 32, 27–35. [Google Scholar]
- Barannyk, L.L.; Crepeau, J.C.; Paulus, P.; Sakhnov, A.Y.; Williams, S.D.V. The phase change problem in materials with internal heat generation in a cylinder. Int. Commun. Heat Mass Transf. 2024, 159, 108150. [Google Scholar] [CrossRef]
- Ye, W.B.; Arici, M. Exploring mushy zone constant in enthalpy-porosity methodology for accurate modeling convection-diffusion solid-liquid phase change of calcium chloride hexahydrate. Int. Commun. Heat Mass Transf. 2024, 152, 107294. [Google Scholar] [CrossRef]
- Fragnito, A.; Bianco, N.; Iasiello, M.; Mauro, G.M.; Mongibello, L. Experimental and Numerical Analysis of a Phase Change Material-Based Shell-and-tube Heat Exchanger for Cold Thermal Energy Storage. J. Energy Storage 2022, 56, 105975. [Google Scholar] [CrossRef]
- Yadav, A.; Samir, S. Melting Dynamics Analysis of a Multi-Tube Latent Heat Thermal Energy Storage System: Numerical Study. Appl. Therm. Eng. 2022, 214, 118803. [Google Scholar]
- Guo, J.; Du, Z.; Liu, G.; Yang, X.; Li, M.-J. Compression Effect of Metal Foam on Melting Phase Change in a Shell-and-tube Unit. Appl. Therm. Eng. 2022, 206, 118124. [Google Scholar] [CrossRef]
- Ouro-Koura, H.; Jung, H.Y.J.; Li, J.L.; Borca-Tasciuc, D.A.; Copping, A.E.; Deng, Z.D. Predictive model using artificial neural network to design phase change material-based ocean thermal energy harvesting systems for powering uncrewed underwater vehicles. Energy 2024, 301, 131660. [Google Scholar] [CrossRef]
- Rostami, S.; Afrand, M.; Shahsavar, A.; Sheikholeslami, M.; Kalbasi, R.; Aghakhani, S.; Shadloo, M.S.; Oztop, H.F. A review of melting and freezing processes of PCM/nano-PCM and their application in energy storage. Energy 2020, 211, 118698. [Google Scholar] [CrossRef]
- Kong, Q. Research on Phase Change Process and Dynamic Performances of an Underwater Thermal Glider. Ph.D. Thesis, Shanghai Jiaotong University, Shanghai, China, 2010. [Google Scholar]
- Mert, H.H.; Okkay, H.; Mert, M. S Form-stable N-Hexadecane/zinc Borate Composite Phase Change Material for Thermal Energy Storage Applications in Buildings. Sustain. Energy Technol. Assess. 2021, 50, 101836. [Google Scholar] [CrossRef]
- Feng, S. Introduction to Marine Science; Higher Education Press: Beijing, China, 2003. [Google Scholar]
- Liu, Z.; Zhang, X.; Wang, C.; Zhang, M. Experimental study on melting performance of paraffin and paraffin/expanded graphite. CIESC J. 2020, 71, 3362–3371. [Google Scholar]
| Disclaimer/Publisher’s Note: The statements, opinions and data contained in all publications are solely those of the individual author(s) and contributor(s) and not of MDPI and/or the editor(s). MDPI and/or the editor(s) disclaim responsibility for any injury to people or property resulting from any ideas, methods, instructions or products referred to in the content. |
© 2025 by the authors. Licensee MDPI, Basel, Switzerland. This article is an open access article distributed under the terms and conditions of the Creative Commons Attribution (CC BY) license (https://creativecommons.org/licenses/by/4.0/).


