Article

A Framework for User Traffic Prediction and Resource Allocation in 5G Networks

1
Department of Electrical and Computer Engineering, University of Patras, 26504 Rion, Greece
2
Department of Chemistry, University of Ioannina, 45110 Ioannina, Greece
3
Computer Engineering and Informatics Department, University of Patras, 26504 Rion, Greece
*
Author to whom correspondence should be addressed.
Appl. Sci. 2025, 15(13), 7603; https://doi.org/10.3390/app15137603
Submission received: 13 June 2025 / Revised: 3 July 2025 / Accepted: 4 July 2025 / Published: 7 July 2025
(This article belongs to the Section Computing and Artificial Intelligence)

Abstract

Fifth-Generation (5G) networks deal with dynamic fluctuations in user traffic and the demands of each connected user and application. This creates a need for optimized resource allocation to reduce network congestion in densely populated urban centers and further ensure Quality of Service (QoS) in (5G) environments. To address this issue, we present a framework for both predicting user traffic and allocating users to base stations in 5G networks using neural network architectures. This framework consists of a hybrid approach utilizing a Long Short-Term Memory (LSTM) network or a Transformer architecture for user traffic prediction in base stations, as well as a Convolutional Neural Network (CNN) to allocate users to base stations in a realistic scenario. The models show high accuracy in the tasks performed, especially in the user traffic prediction task, where the models show an accuracy of over 99 % . Overall, our framework is capable of capturing long-term temporal features and spatial features from 5G user data, taking a significant step towards a holistic approach in data-driven resource allocation and traffic prediction in 5G networks.

1. Introduction

Cellular Telecommunication Networks have been a huge part of public and private communications in the last few decades. The current standard for these networks is the Fifth-Generation (5G) networks, which deal with constantly changing patterns in user traffic as well as the different requirements of each user and application connected to the network. The huge amount of data in extremely dense networks causes congestion [1]. This creates a need to optimize resource allocation in such networks to ensure Quality of Service (QoS). Resource allocation in 5G networks is a field with a significant research interest, while the capability to predict user traffic in such networks can assist any system of the former.
Machine and deep learning (ML/DL) have been proven to be useful for optimizing resource allocation and user traffic in 5G networks, along with tasks such as energy efficiency, network accuracy and latency [2,3]. However, this requires the training of such algorithms through the use of large accurate datasets gathered from currently active 5G networks. The advantage of ML, when provided with quality large-scale data, is that it can provide fast and high-quality results with minimal loss of effectiveness.
This paper presents a novel approach for predicting user traffic and using these predictions to aid with the allocation of the users to base stations in a 5G environment. Thus, the resource allocation of the network can be performed in a proactive way that can be adapted in real-time to changing network conditions. The main strength of our framework lies in the ability to approximate long-term trends in time-series data, an open research question in the 5G communication field. Furthermore, the ML models comprising our framework offer a good balance between performance and usage of computational resources.

2. Related Work

Data-Driven User Resource Allocation and Traffic Prediction in 5G Networks

In recent years, data-driven methods for user resource allocation in 5G networks [4,5,6,7,8,9,10] have started to appear more often in research than mathematical approaches [11,12,13], with a variety of ML architectures being employed for this task.
Deep neural networks have been utilized in [7,9] for user allocation in Non-Orthogonal Multiple Access (NOMA) 5G networks and to minimize system delay in 5G networks, respectively. In contrast, traditional ML techniques based on decision trees and K-means clustering show promising results over 5G resource allocation in [14]. CNN-based architectures have also been employed to optimize user allocation [5,8]. In [5], the problem of resource allocation in small- and large-scale base stations comes down to an image segmentation task, whereas in [8], small-scale channel information, such as the status of the channel, is exploited to reduce time consumption. Furthermore, Recurrent Neural Networks (RNNs) demonstrate significant efficacy in facilitating 5G user allocation tasks. For example, in [6], a Long Short-Term Memory (LSTM) network, along with a Deep Reinforcement Learning (DRL) model combined with a convex optimization algorithm, was utilized for dynamically allocating user and power resources in 5G TV broadcasting services. Similarly, in [10], a DRL algorithm was introduced to perform energy-efficient user allocation in edge computing and the Industrial Internet of Things in 5G networks, while an RL-based method for dynamic resource allocation to improve QoS of end-users, was proposed in [4]. Other works that utilize DRL for 5G user resource allocation for network slicing are [15,16].
Akin to user resource allocation works, approaches to optimize 5G user traffic prediction use deep and ML methods to tackle the increasing demand for wireless access. Therefore, approaches span from traditional ML approaches [17] and DL approaches such as RNNs (e.g., LSTM [18,19,20]) to leverage the temporal dependencies in user traffic data to state-of-the-art Graph Neural Networks (GNNs) [21,22], which exploit spatiotemporal features (i.e., spatial data refer to base station topology) to achieve accurate predictions. More specifically, in [18], a smoothed LSTM model trained on 5G data pre-processed by the auto correlation function was compared against other deep learning models, such as a CNN and Gated Recurrent Unit (GRU), showing promising results for traffic prediction. Similar results are observed in [20], where a hybrid RNN-CNN model exploiting geolocation user data performed better over traditional ML and other RNN methods. In [19], a LSTM-based framework is used, where the resource optimization problem is tackled by either a short-term or a long-term approach.
Traffic prediction can also be utilized to facilitate user resource allocation [6,9]. For instance, in [6], an LSTM network performed traffic prediction on multicast services and was utilized for pre-resource allocation. In [23] a framework to jointly optimize base station activation and user association under traffic uncertainty conditions in ultra-dense networks is presented. Moreover, the authors of the work in [24] propose a DL methodology to enable user-centric end-to-end Radio Access Network slicing. Finally, in [25], an adaptive learning framework, i.e., a transfer learning method, to tackle user traffic prediction problems and enhance the distribution of network resources is developed.
In this study, we detail a framework for user traffic prediction that entails resource allocation by employing a fully data-driven approach based on sophisticated ML models. A problem underexplored in the aforementioned works, our framework explores the prediction of long-term trends in user data while employing computationally inexpensive ML models. Moreover, our framework can also be utilized for dynamic network slicing, considering the impact of environmental factors and user behavior during the learning process of our models.

3. Datasets and Data Preprocessing

In this paper, we present a framework that has two main tasks, user traffic prediction for 5G networks and user allocation in 5G networks, incorporating the predictions of the previous module. Our system consists of two modules: (i) an RNN or a Transformer-based model for user traffic prediction and (ii) a Convolutional Neural Network (CNN) model for user resource allocation. There is also an adaptive approach to handle the results of user traffic predictions to assist the user allocation module in its task based on future highs and lows of traffic at base stations.
The data used to train and evaluate the models were obtained from two distinct sources, one for each model. The user traffic prediction dataset consists of traffic collected from a 5G mobile terminal in a dense urban setting [26]. The user allocation dataset is a synthetic dataset called DeepMIMO [27] created with the express purpose of being used by large data models such as neural networks.

3.1. 5G Traffic Dataset

We utilized the 5G Traffic dataset presented in [26] for the training of our user traffic prediction module. User traffic was collected via a Samsung Galaxy A90 5G mobile terminal in South Korea (Samsung Electronics, Suwon, Republic of Korea) across various applications such as live streaming (e.g., Naver Now), stored streaming (e.g., YouTube, Netflix), video conferencing (e.g., Zoom), the metaverse (e.g., Roblox), online gaming (e.g., Battlegrounds), and game streaming (e.g., GeForce Now) platforms. Thus, the dataset contains video traffic that imposes significant strain on 5G networks. More specifically, the dataset includes the time when the user started the 5G connection, their Internet Protocol (IP), the IP of the destination (the server to which the user is connected), the protocol used for the connection, and the duration and information regarding the connection. The dataset contains video traffic data with a total length of 328 h collected over a period of 6 months (from May to October 2022).
To preprocess the 5G dataset, we first stored the provided CSV files in an SQL database. The initial step was optimized indexing and batch query execution, reducing memory requirements during the learning stages of the model. Due to the temporal indexing, the time series can be optimally segregated, which significantly improves performance in the training and testing stages. This use of databases significantly reduces the preprocessing time and assists with the batch processing of very large datasets. The data changed from the initial form of user connection length entries to network traffic in the form of user traffic per time step. The data from this table were used to train our 5G Traffic prediction module.
The preprocessing operations that we used on the dataset were typical preprocessing operations suitable for RNN models that we fine-tuned to obtain better results. The first operation was a min-max normalization to the range of 0 to 1. The next operation was a sliding window of size 10 to produce a rolling mean of the values with the aim of capturing the features of local mean network traffic. A rolling standard deviation was used to help with local value volatility. Moreover first- and a second-order differences were used to help with extracting the “momentum” of the values within the rolling window. Finally the raw values as recorded were also used without the previous preprocessing steps as the core dataset of the input in the network. The experiments were conducted with an input of 120 values, each representing the user traffic at the start of a given clock time step, and the prediction outputs the next 60 time steps as 60 values, one for each time step in the future.

3.2. DeepMIMO Dataset

To train our user resource allocation module, we leveraged a synthetic dataset generated via DeepMIMO [27], a versatile DL dataset specifically designed for millimeter wave and massive Multiple-Input Multiple-Output (MIMO) systems. DeepMIMO offers a diverse range of scenarios enriched with three-dimensional geometries, realistic user distributions, and detailed wireless network demands. DeepMIMO utilizes precise 3D ray-tracing simulations and accommodates a myriad of scenarios tailored to 5G wireless models, thus facilitating the creation of extensive MIMO datasets. For the evaluation of our systems, we employed an outdoor scenario (https://www.deepmimo.net/scenarios/o1-scenario/, accessed on 30 March 2025) set within a city block, populated with users as illustrated in Figure 1.
This scenario includes 18 base stations with a height of 6 m, with each station being an isotropic antenna array element. The main street contains 12 base stations evenly placed on either side of the road. Consecutive stations are separated by 52 m. The remaining base stations are allocated along the secondary street, which runs perpendicular to the main street (as illustrated in Figure 1). The users within the scenario are organized into three uniform grids, culminating in a total user count of 1,184,923. Overall, this dataset was used to perform user resource allocation in 18 stations.
However, our resource allocation module was trained over different versions of this scenario, meaning that not all users and base stations were selected for each training epoch.
The ground-truth dataset for our user allocation model based on the DeepMIMO scenarios contains the following information: (i) the spatial position of users, (ii) the spatial position of base stations, (iii) the specific scenario from which the data are derived (that implies a 3D geometry to be “learned” by the user allocation model), and (iv) the allocation of each user with a corresponding base station. As for the dataset preprocessing procedure, linear normalization was applied along with the implementation of an outlier detection and trimming algorithm in Python (v.3.11.9).

4. Methodology

Our framework consists of two modules, user allocation and traffic prediction. Each of our models can be either deployed separately or as an end-to-end framework, where user traffic prediction can facilitate resource allocation in 5G environments.

4.1. User Traffic Prediction Module

For the user traffic prediction module, we use two different architectures: an RNN, namely, an LSTM model, and a hybrid model consisting of a Transformer and a Temporal Convolutional Network (TCN) model. These two architectures produce results that are different in nature but similar in performance.
We conducted a feature importance analysis to justify the input features of the two user traffic prediction architectures. The results of the analysis are illustrated in Table 1. As discussed in Section 3.1, the first and second derivatives refer to the first- and second-order differences, while the original values refer to the raw values of the 5G Traffic dataset. The least impactful input features are the rolling mean and rolling standard deviation. The reason for this is that the dataset has low local volatility, so those two values stay similar to the original values.

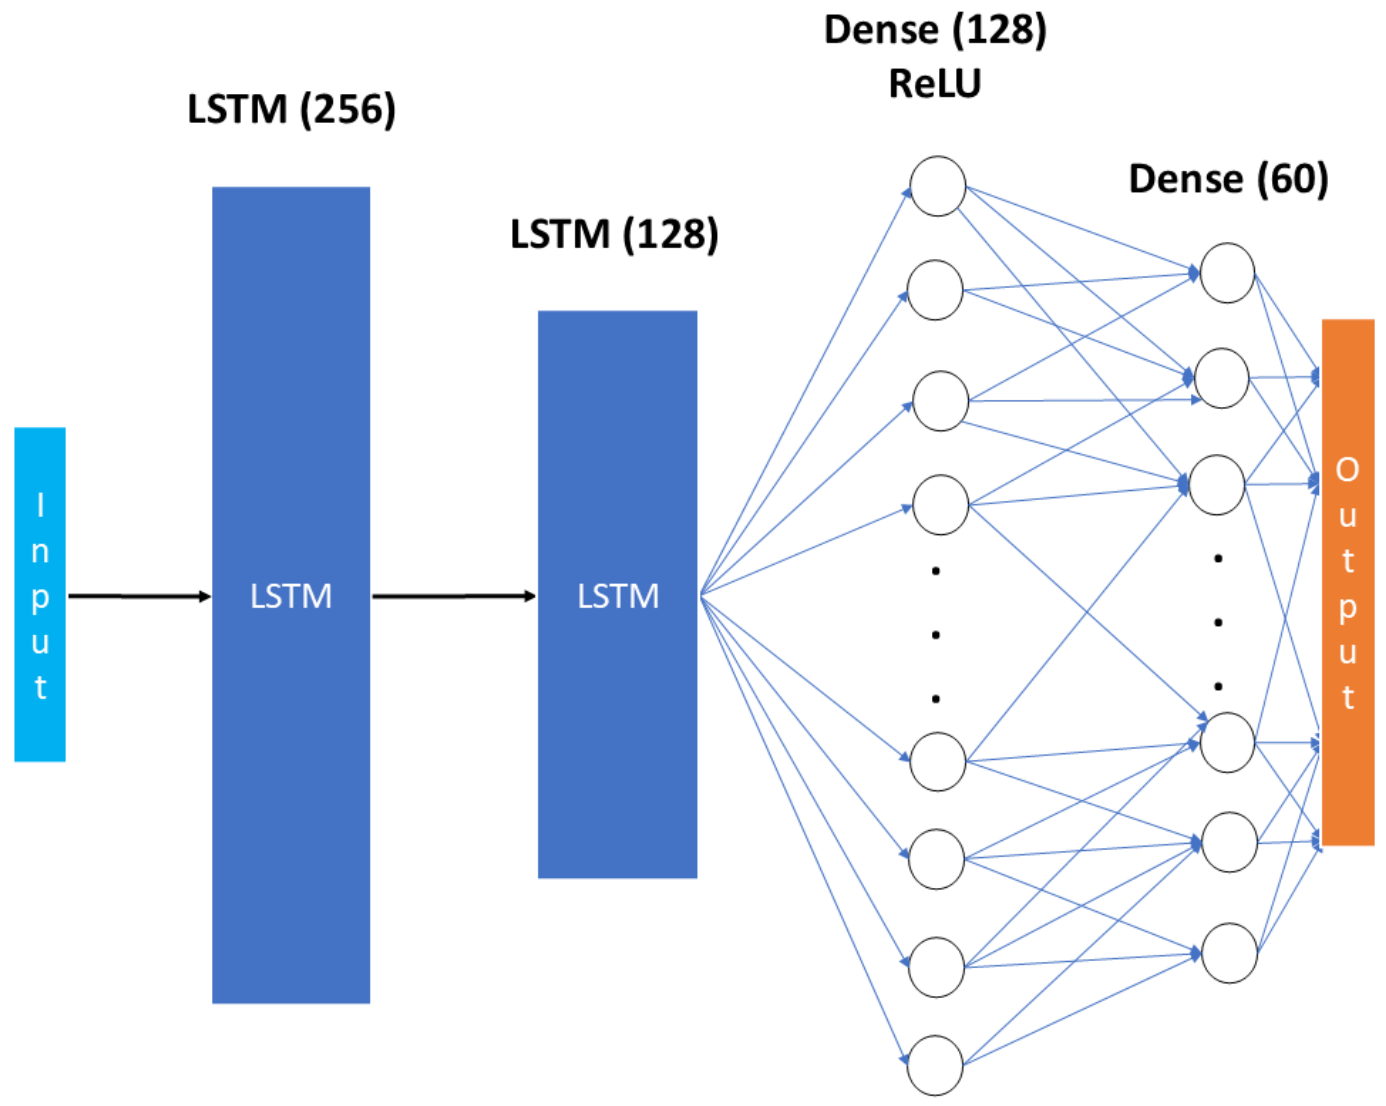
4.1.1. Long Short-Term Memory Variant

LSTM networks can effectively capture temporal relationships in time-series data, which is essential for prediction problems, such as the one explored in this work. As depicted in Figure 2, the LSTM neural network comprises two LSTM layers, one with 256 units that performs the initial hierarchical feature extraction and a second with 128 units that captures the higher-level temporal patterns. These layers are followed by a dense (fully-connected) layer of 128 units with an activation Rectified Linear Unit (ReLU) activation layer. The final layer is again a fully connected output layer of 60 units representing the next 60 predicted time steps. The first LSTM layer is used to identify immediate sequential relationships such as traffic fluctuations and seasonal variations. The second LSTM layer then operates on those relationships, identifying patterns and higher-order temporal relations [28]. This hierarchical process allows the architecture to capture more than one order of temporal patterns, which is particularly useful in traffic prediction where both immediate changes and long-term patterns can be found in the data. The input is a set of 120 time steps with 5 features each: (i) the actual value of user traffic of that time step, (ii) the rolling mean of the last 10 time steps, (iii) a rolling standard deviation of the last 10 time steps, (iv) a first-order difference that represents the momentum of the user traffic, and finally (v) the percentage change of the current time step compared to the first of the rolling window.
A custom solution that combines the loss from mean squared error, a trend direction loss calculation to assist the consistency of the directionality of the time series, and a volatility-based loss to reduce patterns of statistical dispersion was implemented as the loss function. This combined loss strategy improves consistency by taking into account the volatility of the data as well as the magnitude and penalizes model parameters that would just optimize for one or the other. This way we overcome the natural limitation of optimizing for magnitude prediction by just using mean squared error. Adam [29] with decay rate and early stopping was used as the optimizer to exploit the adaptive learning mechanism in the root mean squared error propagation method and the momentum mechanism employed in the gradient descent process.
The equation for the custom loss is shown below. With L t we symbolize total loss, L m is the loss component from the mean squared error calculation, L d is the loss component from trend direction loss, and L v is the loss component from volatility-based loss. With w x we symbolize the weighting of each loss component, from 0 to 1, and x is that component, e.g., w m is the weight of the mean squared error component. In the models demonstrated in this work, we used w m = 0.3 ,   w d = 0.3 ,   w v = 0.4 .
L t = w m L m + w d L d + w v L v
The mean squared error loss is calculated normally. The trend direction loss is calculated as shown in the equation below. With D a we symbolize the actual direction of the series and with D p the predicted direction. With M ( x , y ) we symbolize an operator that is 1 if x and y are equal and 0 if not. With t and T we symbolize the current and final time step and with n and N the sequence index of the sliding window sequence and the length of the sliding window sequence.
L d = n N t T 1 M ( D a ( n , t ) , D p ( n , t ) ) N ( T 1 )
The volatility-based loss is calculated as shown in the equation below. With D i f f a we symbolize the actual distance of one element of the series to the next and with D i f f p the predicted distance. With Δ ( S ) we symbolize an operator that calculates the standard deviation of a set of set of distances. With ϵ we symbolize a very small non-zero number that assists with avoiding division with 0.
L v = n N 1 Δ ( D i f f a ( n ) Δ ( D i f f p ( n ) + ϵ N

4.1.2. Transformer and Temporal Convolutional Network Variant

The Transformer Neural Network is a hybrid model consisting of a Transformer and a TCN model. The transformer component is effective at capturing long-term temporal dependencies and seasonal patterns [30] due to its self-attention mechanism, which enables focusing on crucial information regardless of its position in the time-series data. Hence, the transformer processes all time steps of a time-series sequence simultaneously, unlike traditional RNN-based models, which process time-series data sequentially. In contrast, the TCN is aimed at extracting local short-term patterns [31] since convolutions are performed on windows of data. The TCN model comprises 4 attention heads and a 64-dimensional key space. Furthermore, the model also incorporates a normalization layer and a 256-unit feed-forward layer with a ReLU activation function for stability during training. The encoding used is a Positional Encoding so that the sequence of temporal information is retained. Finally, 4 sequential transformer blocks for hierarchical feature extraction are included. The TCN model comprises Dilated Convolutions with Causal Padding and dilation rates that are exponentially increasing. This ensures that only past information is used for predictions. Moreover, it consists of Residual Connections for gradient flow and two 1D Convolutional Layers, each with its own ReLU activation function. The integration between the two models is achieved with 2 fully connected layers of 128 and 64 units each, followed by a ReLU activation layer and an output of 60 for the 60 predicted time steps. In the output layer, an average pooling is applied.
For this network, the same loss function and optimizer (Adam [29]) that were used to train our LSTM model were utilized.

4.2. User Allocation Module

The user allocation module is influenced by the model presented in [32]. As depicted in Figure 3, we created a CNN-based model consisting of three convolutional 128-unit layers with ReLU activations and three dense layers with widths of 256, 128, and 18, respectively. CNNs succeed in extracting spatial features from geospatial data such as base station positions, as well as processing multi-dimensional data. The input of this model is the geographical longitude and latitude of each user as derived from the DeepMIMO dataset, while the output is an 18 one-hot encoded output, corresponding to 18 stations where the users are allocated. This model was trained over a maximum of 1000 epochs with a batch size of 32. An early stopping mechanism with a patience of 25 was employed; thus, the 1000 epochs were never reached. Adam [29] was selected as the optimizer with a learning rate of 0.001 to improve the convergence of training and reduce the risk of gradient descent being stuck in local minima. The way this is achieved is through the adaptive learning mechanism in the root mean squared error propagation method and the momentum mechanism employed in the gradient descent process. Multi-class cross-entropy [33] was employed as the loss function for this multi-class task. The above architecture and hyperparameters are optimal as arises from the analysis carried out in [32].
In order to allocate users to base stations based on user traffic predictions, we rank the base stations based on their perceived future traffic. Base stations with very high traffic have a virtual increase in user distance to that base station relevant to the intensity of the predicted high traffic. That distance is analogous to the percentage of total base station allocated users compared to the user capacity of that base station. So if we would want the users of a base station to fall by some percentage point, we would virtually position them that much farther away from the high traffic station than they are. Hence, user traffic predictions are used in an adjusted virtual position mechanism in the user allocation module. With this approach the models for allocating users take into account the future traffic of base stations.
The virtual distance is calculated through the equation below. D a is the actual distance, D v is the resulting virtual distance, L p is the load predicted in total users for that base station and L m a x is the capacity of that base station. A parameter λ can be used to intensify this effect depending on the performance in a production environment. When λ = 1 is set for simplicity, the equation performs calculations that would put base stations at exact capacity, so setting λ to be a small percentage higher than 1 would be better. For example setting λ = 1.005 would allocate in a way that 0.5 % of the base station capacity is left available.
D v = λ D a ( L p / L m a x )

5. Results

The results presented in this section derive from two datasets that are detailed in Section 3. The machine used for training and running the models was an AMD Ryzen 5600X 6-Core (AMD, Santa Clara, CA, USA) 3.7 GHz CPU with a GeForce RTX 3060 GPU (NVIDIA Corporation, Santa Clara, CA, USA) with 12 GB memory. The models show an increase in accuracy and capacity to digest larger datasets as the hardware scales up but at a diminished rate with the increase in scale. As discussed in [34] artificial neural networks of increased size and complexity yield stronger results but seem to be governed by laws of scaling that mandate diminishing returns in the logarithmic scale relevant to the increase in computation.
The metrics utilized to assess the performance of our framework are the absolute error metric and its percentage. By performing evaluations of variations in our selected models, we account for ablation studies.

5.1. User Traffic Prediction Module Results

The user traffic prediction dataset is processed into a time series of user traffic on the network per 1 time step. In this way, features and trends in time can be extracted through ML and make future predictions.

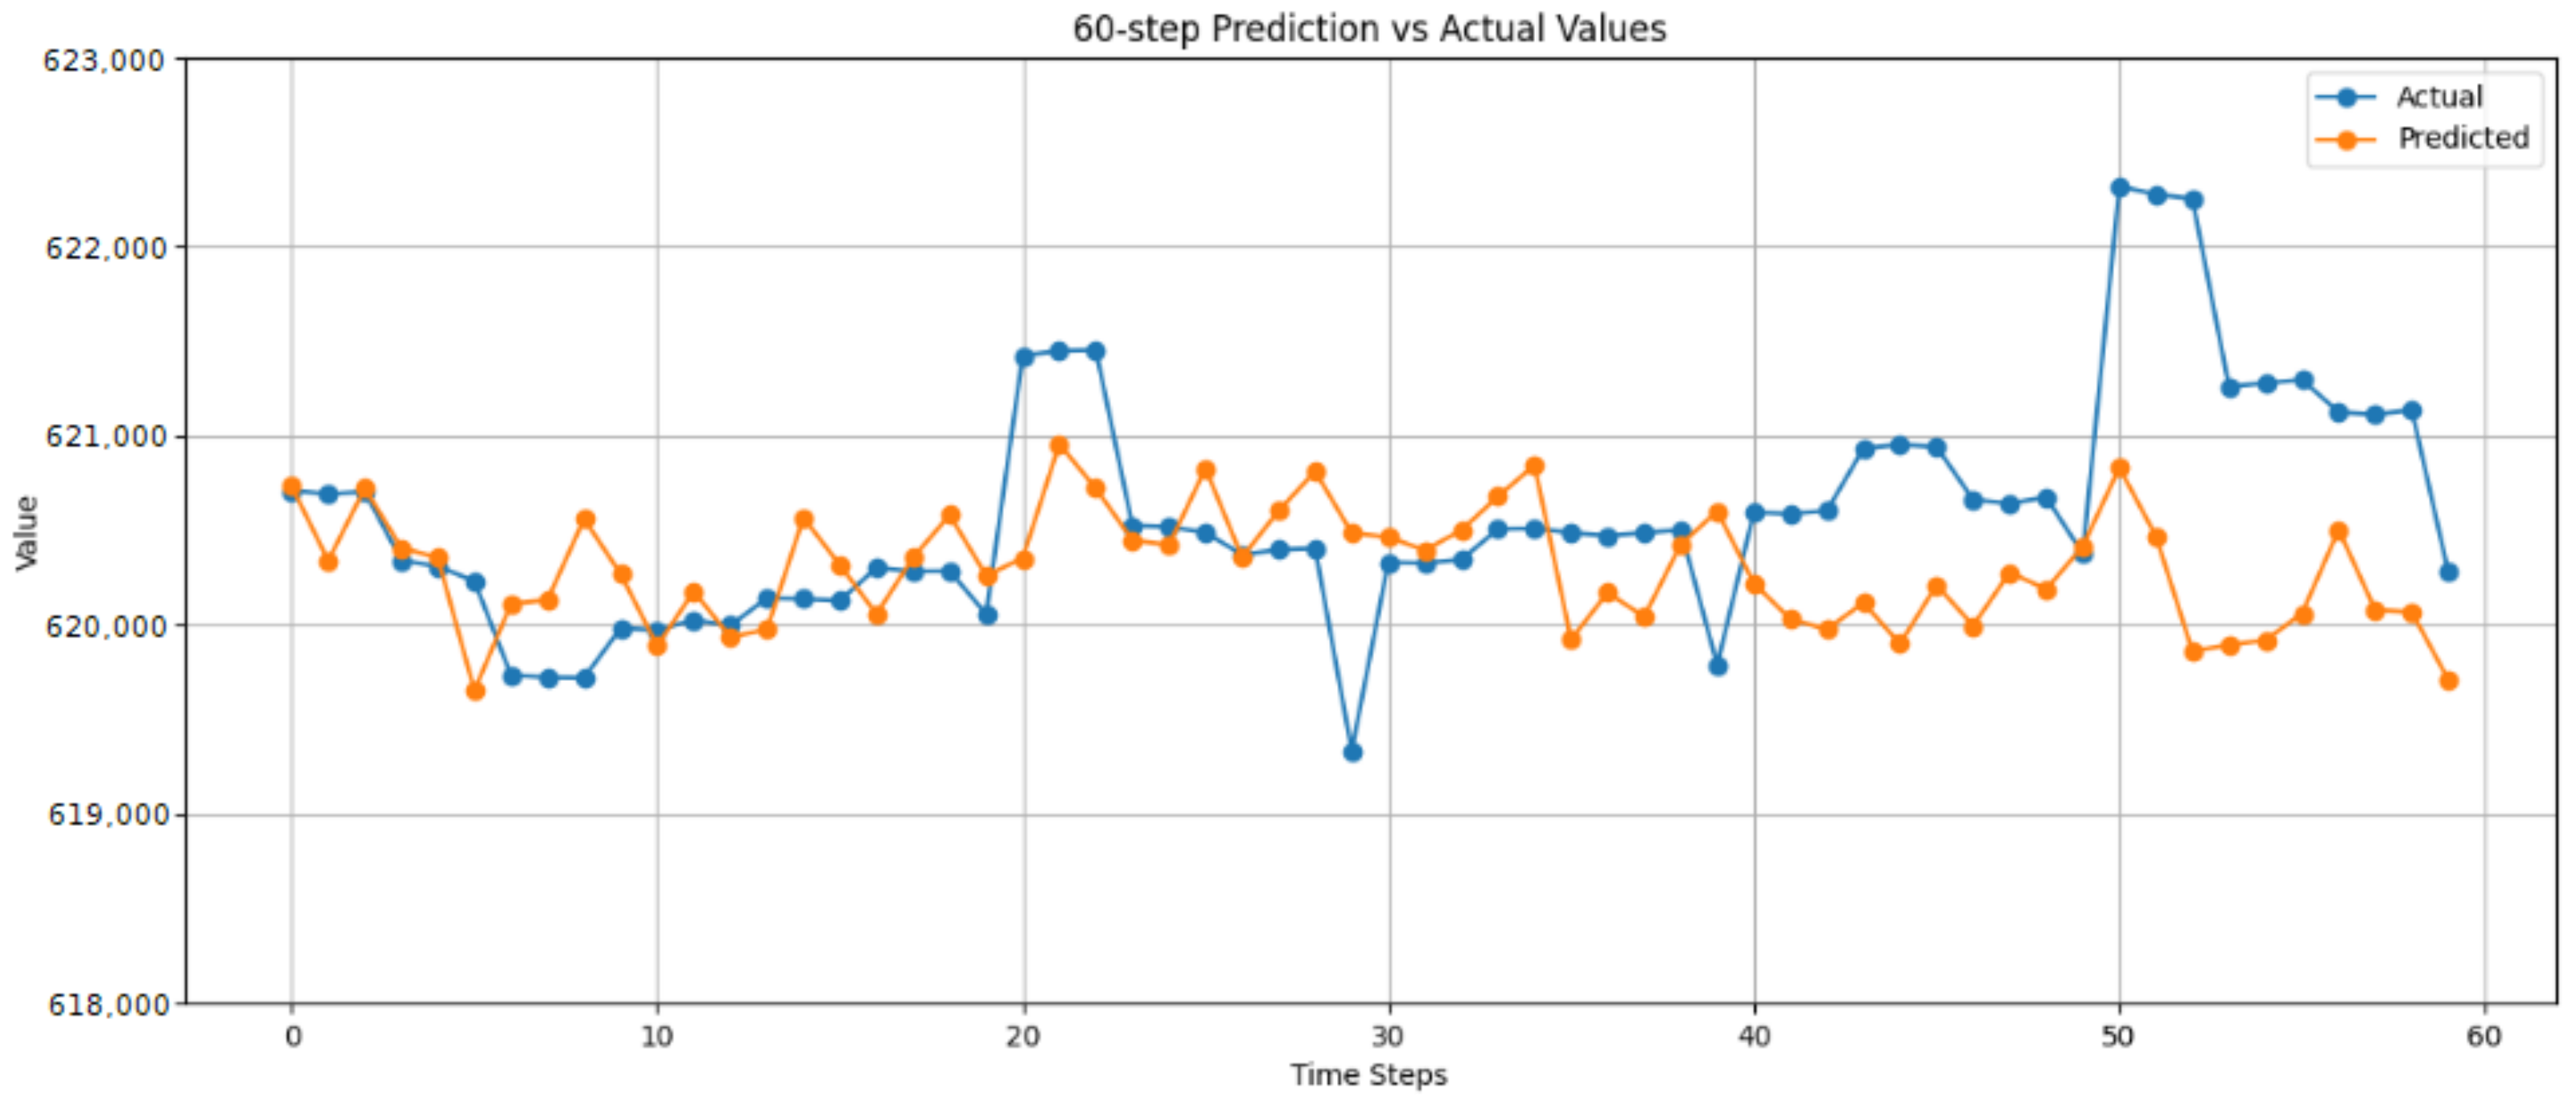
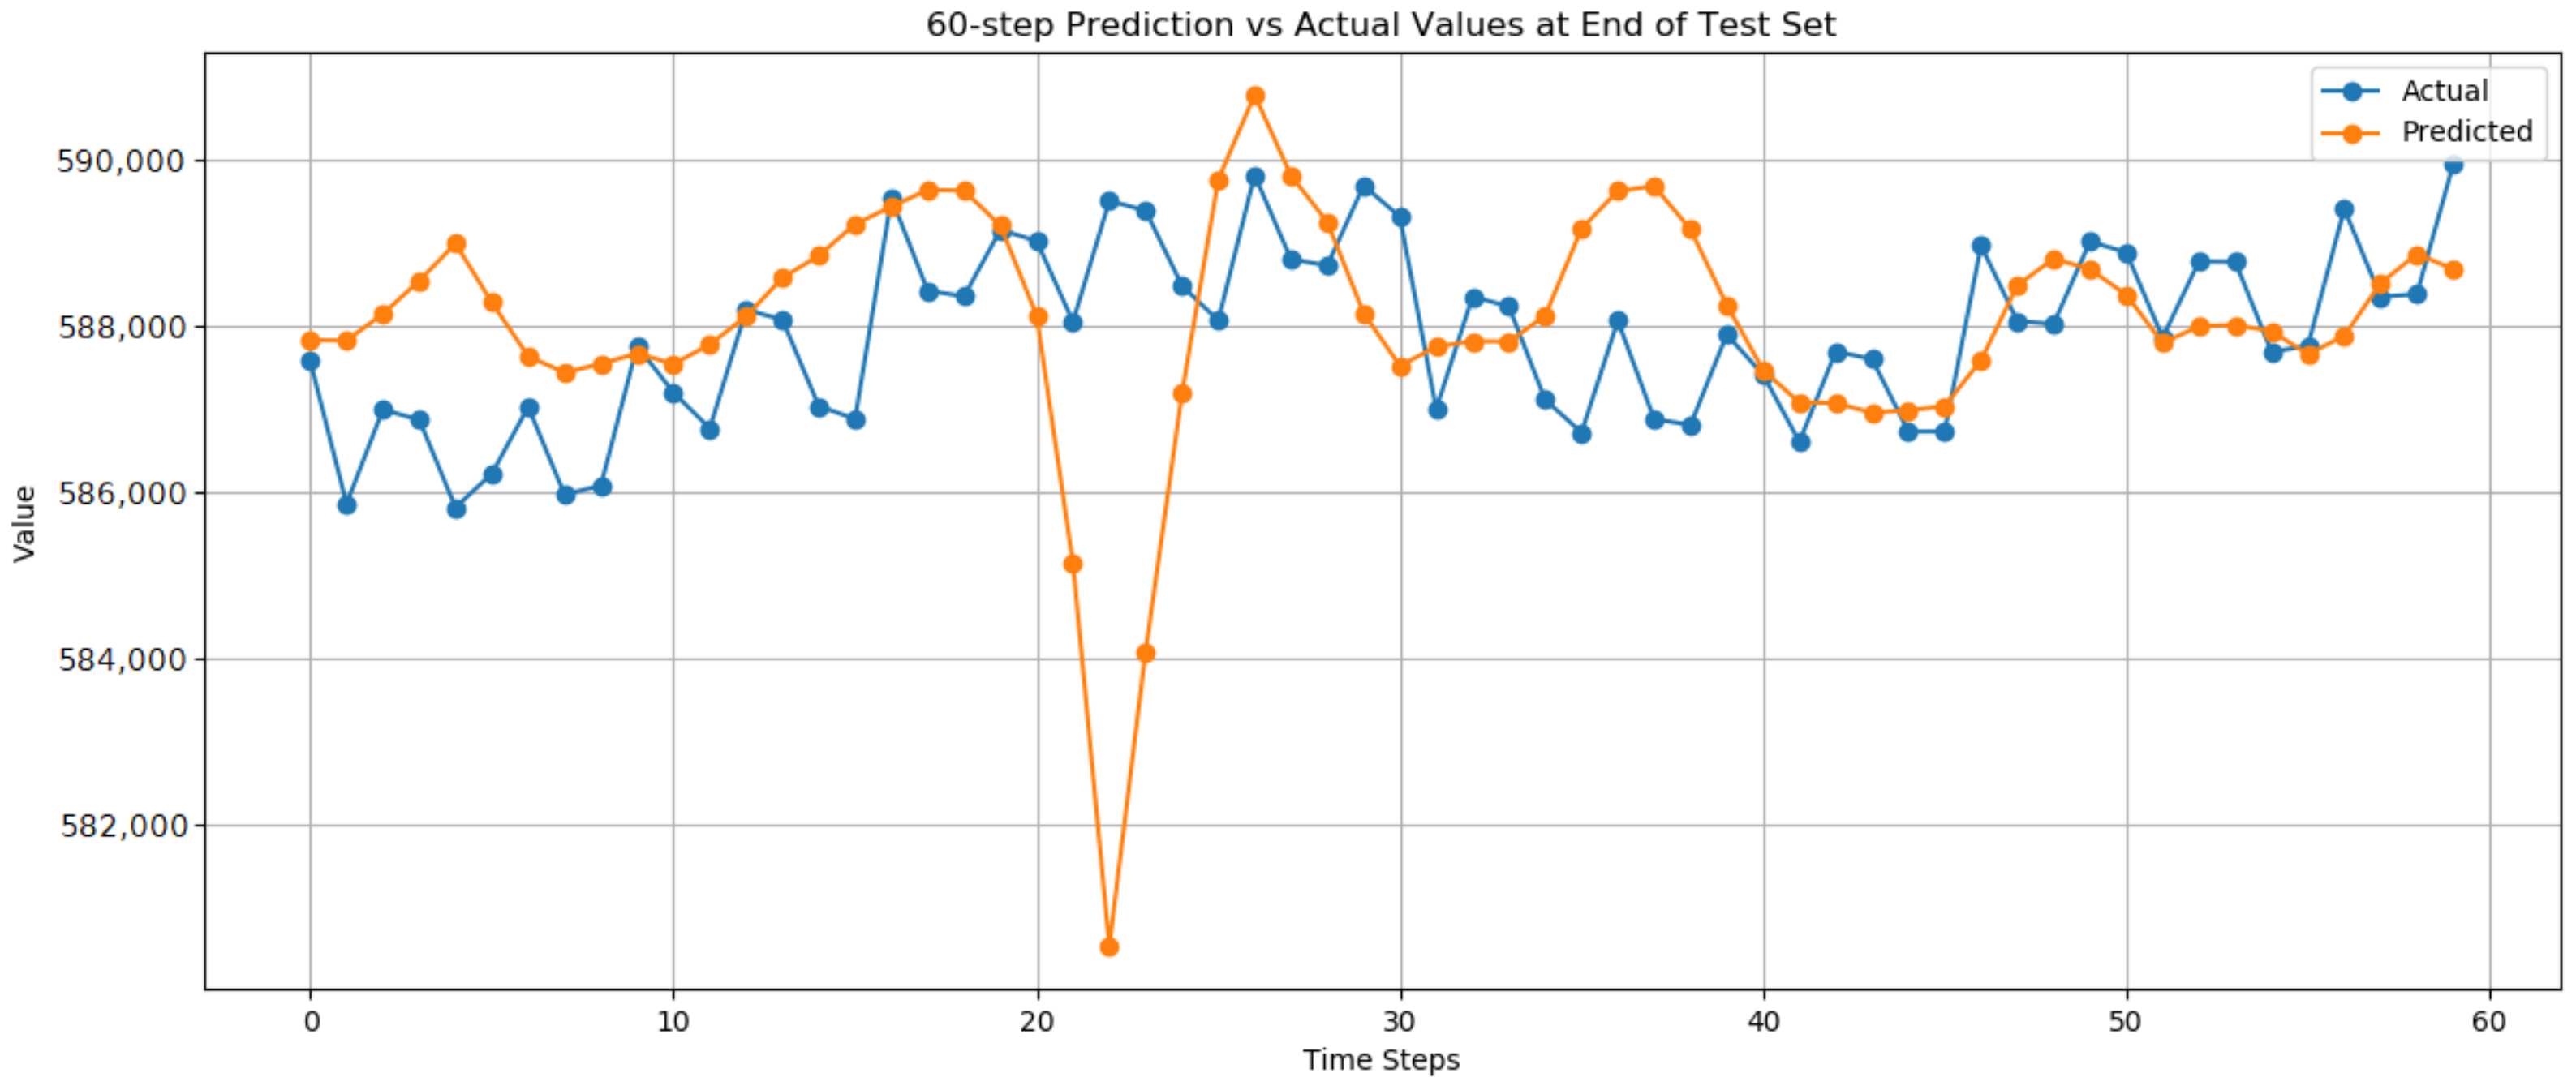
5.1.1. Long Short-Term Memory Results

The architecture described in Section 4.1.1 resulted from trials conducted with different configurations of LSTM-based architectures. The models were trained to a maximum of 100 epochs with a mechanism for early stopping (i.e., the 100 epochs were usually not reached due to early stopping).
In Table 2, the tests carried out to select the number of LSTM layers, which are the core part of any LSTM model, are recorded. The results show that a two-layer LSTM is better, and this seems to align with fundamental principles of DL regarding the complexity and bias-variance trade-off of models [35]. An observation from the results is that the one-layer LSTM slightly underfits and more than 2 layers slightly overfit the dataset with the current hardware.
In Figure 4, the predicted next 60 time steps of user traffic of an instance of the dataset are depicted. As shown in Figure 4, the first few time steps have very high accuracy, and the further the predictions move from these time steps, the greater the chance of inaccurate predictions, as can be seen in the time step 50 and thereafter. Though the general trend of the traffic seems to be predicted correctly, the actual value of the users is miscalculated. Another interesting detail is that some spikes of 1 time step in traffic are usually not predicted as they are not part of some trend and seem to be accidents in the general trend of the traffic caused by some external factor.
The results are satisfactory and show a very promising inclination to improve with just simple hardware upgrades as the dataset is large enough to support stronger and larger training trials. More specifically, the error in predictions is significantly lower than 1 % , and the absolute error being about 1000 users is an excellent result. The latter might suggest the ability for further prediction in time with insignificant inaccuracies.

5.1.2. Transformer and Temporal Convolutional Network Results

The architecture chosen for the Transformer and TCN hybrid approach resulted from trials conducted with both the Transformer model and TCNs and each one separately. Just as in the case of our LSTM model, these models were trained to a maximum of 100 epochs with a mechanism for early stopping, meaning that 100 epochs were not reached during the learning process.
Table 3 illustrates the calculated error of the Transformer and TCN hybrid approach. Even though the error seems to be larger than that of our LSTM model, there is a qualitative distinction that makes the hybrid approach more promising. That distinction is that the latter architecture captures better the directionality and trends of the time series of the user traffic.
In Figure 5 we can see the predicted next 60 time steps of user traffic of an instance of the dataset. This figure shows that the first time steps are not accurately predicted as they were with the LSTM model. The main advantage of this approach is the trends can be predicted as far as the 40th to 60th time step as seen in Figure 5. These trend captures can be seen across the figure, for instance, in time steps 7 to 18 and time steps 24 to 30. This is a very promising result due to the fact that if the erroneous artifacts are eliminated, the results can become by far superior to the Long Short-Term Memory model. An example of the erroneous artifacts is that in time steps 20 to 24 of the graph in the figure.

5.1.3. Ablations

Ablation studies were conducted for the loss function components of our proposed hybrid Transformer-TCN and LSTM models. We evaluated our models with four different loss configurations, as reported in Table 4, using (i) only an MSE loss, (ii) a trend direction MSE loss, (iii) a volatility MSE loss, and (iv) a MSE loss incorporating trend direction and volatility. These ablation studies were performed on a short and a long horizon of the test data. Error metrics are reported when the model processes data at the beginning of the test dataset, and similarly at the middle and at the end of the test set. Our findings in terms of RMSE are illustrated in Table 5.
From Table 5, we observe that training our model with an MSE loss with trend direction and volatility (MSE_Dir_Vol) produces slightly worse results, compared with the loss configuration without volatility (MSE_Direction). However, when evaluating the figures qualitatively, as in Figure 5 for example, we deduce that the graph better approximates the ground truth but features sparse deviations that impact the loss in a significant way. Overall, the results of the ablation study should be compared only in relation to themselves since the training of the Transformer-TCN was conducted in fewer epochs.

5.2. User Allocation Module Results

The architecture of the model used for user allocation is inspired by [32]. The CNN model was trained to a maximum of 1000 epochs with a mechanism for early stopping.
In Table 6 the performance of the CNN model with and without using the predictions of the user traffic prediction models is illustrated. Multi-class cross-entropy was utilized as the loss of this model as mentioned in Section 4.2. It is observed that by using the adjusted virtual position mechanism (i.e., user prediction preceding resource allocation), the results become more accurate in allocating users to base stations as discussed in [32].

6. Discussion

The approach shows very promising results in both predicting user traffic and allocating to base stations based on the predicted traffic. The combination of ML-based traffic prediction and our adaptive user allocation strategy shows the potential of the model to be applied to operational 5G networks, with the aim to improve the QoS and reduce network congestion in densely populated urban centers.
The capability to combine the capture of temporal features in user traffic and spatial features from our previous work in user allocation is a significant step towards a holistic approach in data-driven resource allocation for 5G networks. Moreover, the ability to anticipate network demands through the user traffic prediction module can also be used separately with all user allocation systems that can integrate future predictive resource demand into their strategy. The most significant advantage of the framework is the incorporation of historical trends in real-time data, which creates the ability to quickly adapt to changing conditions of the network.
Capturing long-term trends in user traffic data is underexplored in current literature, with most works focusing in short-range predictions [18] or predictions depending on the previous frame [19].
In [21], the authors present their GNN approach and other frameworks for user traffic prediction in the literature comparing the results of their datasets. They report a performance of at best 88 % accuracy, while previous methods go up to 76 % . The dataset is of cellular network traffic in the city of Milan and seems to be more sensitive to data volatility. This could be due to the difference in network requirements of the users and the fact that it is just cellular network traffic instead of complete internet traffic that the 5G Traffic dataset consists of. Moreover, the LSTM presented in [6] indicates a better performance up to 95 % accuracy for long-term user traffic prediction. This method shows a performance very similar to ours. Our method shows more than 99 % accuracy, but this is due to the dense nature of the data stemming from a very large dataset.
The hybrid Transformer-TCN architecture used for the traffic prediction module has been shown to be simple yet effective for both short- and long-term predictions. In this architecture, the Transformer module could be replaced by the Informer [36] one and perform just as well or even better. The Informer is an extension of the Transformer model, with many modifications focusing on efficiency. The whole hybrid architecture could also be compared to the Temporal Fusion Transformer (TFT) [37], which is capable of handling multi-horizon temporal dependencies. The incorporation of either models in the framework remains as future work.
The main limitation of the system is its dataset. As with most data-oriented approaches, the data is the most important part of any such system. The data used to train the models was gathered in dense urban environments, which creates strong statistical features through the very large number of users and common patterns between them. So, a question arises about the efficiency of the system in more sparse rural environments. Another limitation is the hardware used to run and train the models of the system as the main hardware used was an office machine which can be said to be a rather weak processing unit for calculating the kind of operations associated with neural networks. However, this limitation can be said to be a strength of the approach as it shows very strong results despite the weak processing power.
In terms of results, our traffic prediction model tends to approximate the long-term trends in data (e.g., in the span of 60 time steps) but lacks point-by-point prediction. To address this issue, more experiments in large datasets and employing larger Transformer-TCN models are to be conducted. The latter entails more computational resources. One more limitation is the training of the user allocation module on synthetic data, which may not capture the entirety of real-world complexities.

7. Conclusions

This work presented a pair of modules that together predict the traffic of users and allocate them at base stations within a realistic urban scenario. The proposed system was quantitatively tested through a secondary test dataset and performed satisfactorily in predicting traffic of users and improved on a previous method of allocating users to base stations by using the predictions of the traffic prediction module. In future work, we would like to address the main limitation, that being the data. We aim to train our system with more diverse and larger real-world datasets, hoping for both better performance and accurate predictions into further time windows. This, however, would also require stronger hardware and a more sophisticated approach to absorb the amount of data that we aim for. Another goal is the deployment of this system in an active 5G network to test its capabilities with real-time data so we can study and understand the challenges of user traffic prediction in a live 5G environment.

Author Contributions

Conceptualization, I.K., I.L., D.T., K.S., A.G., and C.B.; methodology, I.K., I.L., and D.T.; investigation, I.K., I.L., and D.T.; data curation, I.K., I.L., and D.T.; writing—original draft preparation, I.K., I.L., and D.T.; writing—review and editing, I.K., I.L., D.T., K.S., A.G., and C.B.; supervision, K.S., A.G., and C.B.; project administration, K.S., A.G., and C.B.; funding acquisition, K.S., A.G., and C.B. All authors have read and agreed to the published version of the manuscript.

Funding

The research project was supported by the Hellenic Foundation for Research and Innovation (H.F.R.I.) under the “2nd Call for H.F.R.I. Research Projects to support Faculty Members & Researchers” (Project Number: 02440).

Institutional Review Board Statement

Not applicable.

Informed Consent Statement

Not applicable.

Data Availability Statement

The original contributions presented in this study are included in the article. Further inquiries can be directed to the corresponding author.

Conflicts of Interest

The authors declare no conflicts of interest.

Abbreviations

The following abbreviations are used in this manuscript:
5GFifth-Generation
CNNConvolutional Neural Network
DLDeep Learning
DRLDeep Reinforcement Learning
GNNGraph Neural Network
IPInternet Protocol
LSTMLong Short-Term Memory Network
MAEMean Absolute Error
MIMOMultiple-Input Multiple-Output
MLMachine Learning
NOMANon-Orthogonal Multiple Access
QoSQuality of Service
ReLURectified Linear Unit
RNNRecurrent Neural Networks
TCNTemporal Convolutional Network

References

  1. Umar, A.; Khalid, Z.; Ali, M.; Abazeed, M.; Alqahtani, A.; Ullah, R.; Safdar, H. A Review on Congestion Mitigation Techniques in Ultra-Dense Wireless Sensor Networks: State-of-the-Art Future Emerging Artificial Intelligence-Based Solutions. Appl. Sci. 2023, 13, 12384. [Google Scholar] [CrossRef]
  2. Fowdur, T.P.; Doorgakant, B. A review of machine learning techniques for enhanced energy efficient 5G and 6G communications. Eng. Appl. Artif. Intell. 2023, 122, 106032. [Google Scholar] [CrossRef]
  3. López-Pérez, D.; Domenico, A.D.; Piovesan, N.; Bao, H.; Xinli, G.; Qitao, S.; Debbah, M. A Survey on 5G Radio Access Network Energy Efficiency: Massive MIMO, Lean Carrier Design, Sleep Modes, and Machine Learning. IEEE Commun. Surv. Tutor. 2021, 24, 653–697. [Google Scholar] [CrossRef]
  4. Kim, Y.; Kim, S.; Lim, H. Reinforcement Learning Based Resource Management for Network Slicing. Appl. Sci. 2019, 9, 2361. [Google Scholar] [CrossRef]
  5. Zhang, Y.; Xiong, L.; Yu, J. Deep learning based user association in heterogeneous wireless networks. IEEE Access 2020, 8, 197439–197447. [Google Scholar] [CrossRef]
  6. Yu, P.; Zhou, F.; Zhang, X.; Qiu, X.; Kadoch, M.; Cheriet, M. Deep learning-based resource allocation for 5G broadband TV service. IEEE Trans. Broadcast. 2020, 66, 800–813. [Google Scholar] [CrossRef]
  7. Kumaresan, S.P.; Tan, C.K.; Ng, Y.H. Deep neural network (DNN) for efficient user clustering and power allocation in downlink non-orthogonal multiple access (NOMA) 5G networks. Symmetry 2021, 13, 1507. [Google Scholar] [CrossRef]
  8. Huang, D.; Gao, Y.; Li, Y.; Hou, M.; Tang, W.; Cheng, S.; Li, X.; Sun, Y. Deep learning based cooperative resource allocation in 5G wireless networks. Mob. Netw. Appl. 2022, 27, 1131–1138. [Google Scholar] [CrossRef]
  9. Pamba, R.; Bhandari, R.; Asha, A.; Bist, A. An Optimal Resource Allocation in 5G Environment Using Novel Deep Learning Approach. J. Mob. Multimed. 2023, 19, 1331–1356. [Google Scholar] [CrossRef]
  10. Zhao, S. Energy efficient resource allocation method for 5G access network based on reinforcement learning algorithm. Sustain. Energy Technol. Assess. 2023, 56, 103020. [Google Scholar] [CrossRef]
  11. Bouras, C.; Caragiannis, I.; Gkamas, A.; Protopapas, N.; Sardelis, T.; Sgarbas, K. State of the Art Analysis of Resource Allocation Techniques in 5G MIMO Networks. In Proceedings of the 2023 International Conference on Information Networking (ICOIN), Bangkok, Thailand, 11–14 January 2023; pp. 632–637. [Google Scholar] [CrossRef]
  12. Bouras, C.; Diasakos, D.; Gkamas, A.; Kokkinos, V.; Pouyioutas, P.; Prodromos, N. Evaluation of User Allocation Techniques in Massive MIMO 5G Networks. In Proceedings of the 2023 10th International Conference on Wireless Networks and Mobile Communications (WINCOM), Istanbul, Turkiye, 26–28 October 2023; pp. 1–6. [Google Scholar]
  13. Liu, J.S.; Lin, C.H.R.; Hu, Y.C. Joint resource allocation, user association, and power control for 5G LTE-based heterogeneous networks. IEEE Access 2020, 8, 122654–122672. [Google Scholar] [CrossRef]
  14. Bouras, C.; Kalogeropoulos, R. User Allocation in 5G Networks Using Machine Learning Methods for Clustering. In Proceedings of the Advanced Information Networking and Applications, Barcelona, Spain, 9–11 April 2025; Barolli, L., Woungang, I., Enokido, T., Eds.; Springer: Cham, Switzerland, 2021; pp. 13–24. [Google Scholar]
  15. Yan, D.; Ng, B.K.; Ke, W.; Lam, C.T. Deep reinforcement learning based resource allocation for network slicing with massive MIMO. IEEE Access 2023, 11, 75899–75911. [Google Scholar] [CrossRef]
  16. Saleh, Z.Z.; Abbod, M.F.; Nilavalan, R. Intelligent Resource Allocation via Hybrid Reinforcement Learning in 5G Network Slicing. IEEE Access 2025, 13, 47440–47458. [Google Scholar] [CrossRef]
  17. Selvamanju, E.; Shalini, V.B. Machine learning based mobile data traffic prediction in 5G cellular networks. In Proceedings of the 2021 5th International Conference on Electronics, Communication and Aerospace Technology (ICECA), Coimbatore, India, 2–4 December 2021; pp. 1318–1324. [Google Scholar]
  18. Gao, Z. 5G traffic prediction based on deep learning. Comput. Intell. Neurosci. 2022, 2022, 3174530. [Google Scholar] [CrossRef]
  19. Kavehmadavani, F.; Nguyen, V.D.; Vu, T.X.; Chatzinotas, S. Intelligent traffic steering in beyond 5G open RAN based on LSTM traffic prediction. IEEE Trans. Wirel. Commun. 2023, 22, 7727–7742. [Google Scholar] [CrossRef]
  20. Shrestha, A.; Sharma, V.; Hussein, L.; Aishwarya, M.; Satyanarayana, A.; Saimanohar, T. User Mobility Prediction in 5G Networks Using Recurrent Neural Networks. In Proceedings of the 2024 IEEE International Conference on Communication, Computing and Signal Processing (IICCCS), Asansol, India, 19–20 September 2024; pp. 1–6. [Google Scholar]
  21. Wang, Z.; Hu, J.; Min, G.; Zhao, Z.; Chang, Z.; Wang, Z. Spatial-temporal cellular traffic prediction for 5G and beyond: A graph neural networks-based approach. IEEE Trans. Ind. Inform. 2022, 19, 5722–5731. [Google Scholar] [CrossRef]
  22. Jamshidiha, S.; Pourahmadi, V.; Mohammadi, A. A Traffic-Aware Graph Neural Network for User Association in Cellular Networks. IEEE Trans. Mob. Comput. 2025, 24, 6858–6869. [Google Scholar] [CrossRef]
  23. Teng, W.; Sheng, M.; Chu, X.; Guo, K.; Wen, J.; Qiu, Z. Joint Optimization of Base Station Activation and User Association in Ultra Dense Networks Under Traffic Uncertainty. IEEE Trans. Commun. 2021, 69, 6079–6092. [Google Scholar] [CrossRef]
  24. Matoussi, S.; Fajjari, I.; Aitsaadi, N.; Langar, R. Deep Learning based User Slice Allocation in 5G Radio Access Networks. In Proceedings of the 2020 IEEE 45th Conference on Local Computer Networks (LCN), Sydney, NSW, Australia, 16–19 November 2020; pp. 286–296. [Google Scholar] [CrossRef]
  25. Thantharate, A.; Beard, C. ADAPTIVE6G: Adaptive resource management for network slicing architectures in current 5G and future 6G systems. J. Netw. Syst. Manag. 2023, 31, 9. [Google Scholar] [CrossRef]
  26. Choi, Y.H.; Kim, D.; Ko, M.; Cheon, K.y.; Park, S.; Kim, Y.; Yoon, H. Ml-based 5g traffic generation for practical simulations using open datasets. IEEE Commun. Mag. 2023, 61, 130–136. [Google Scholar] [CrossRef]
  27. DeepMIMO. Available online: https://www.deepmimo.net/ (accessed on 30 March 2025).
  28. Pascanu, R.; Gulcehre, C.; Cho, K.; Bengio, Y. How to Construct Deep Recurrent Neural Networks. arXiv 2014. [Google Scholar] [CrossRef]
  29. Kingma, D.; Ba, J. Adam: A Method for Stochastic Optimization. In Proceedings of the International Conference on Learning Representations, San Diego, CA, USA, 7–9 May 2015. [Google Scholar]
  30. Vaswani, A.; Shazeer, N.; Parmar, N.; Uszkoreit, J.; Jones, L.; Gomez, A.N.; Kaiser, L.; Polosukhin, I. Attention Is All You Need. arXiv 2023. [Google Scholar] [CrossRef]
  31. Bai, S.; Kolter, J.Z.; Koltun, V. An Empirical Evaluation of Generic Convolutional and Recurrent Networks for Sequence Modeling. arXiv 2018. [Google Scholar] [CrossRef]
  32. Konstantoulas, I.; Loi, I.; Sgarbas, K.; Gkamas, A.; Bouras, C. A Deep Learning Approach to User Allocation in a 5th Generation Network. In Proceedings of the PCI ’24: 28th Pan-Hellenic Conference on Progress in Computing and Informatics, Athens, Greece, 13–15 December 2024; Association for Computing Machinery: New York, NY, USA, 2025; pp. 478–482. [Google Scholar] [CrossRef]
  33. Mao, A.; Mohri, M.; Zhong, Y. Cross-Entropy Loss Functions: Theoretical Analysis and Applications. arXiv 2023. [Google Scholar] [CrossRef]
  34. Kaplan, J.; McCandlish, S.; Henighan, T.; Brown, T.B.; Chess, B.; Child, R.; Gray, S.; Radford, A.; Wu, J.; Amodei, D. Scaling Laws for Neural Language Models. arXiv 2020. [Google Scholar] [CrossRef]
  35. Hastie, T.; Tibshirani, R.; Friedman, J.; Franklin, J. The Elements of Statistical Learning: Data Mining, Inference, and Prediction. Math. Intell. 2004, 27, 83–85. [Google Scholar] [CrossRef]
  36. Zhou, H.; Zhang, S.; Peng, J.; Zhang, S.; Li, J.; Xiong, H.; Zhang, W. Informer: Beyond efficient transformer for long sequence time-series forecasting. Proc. AAAI Conf. Artif. Intell. 2021, 35, 11106–11115. [Google Scholar] [CrossRef]
  37. Lim, B.; Arık, S.Ö.; Loeff, N.; Pfister, T. Temporal fusion transformers for interpretable multi-horizon time series forecasting. Int. J. Forecast. 2021, 37, 1748–1764. [Google Scholar] [CrossRef]
Figure 1. DeepMIMO Outdoor scenario 1. Figure obtained from [27].
Applsci 15 07603 g001
Figure 2. The architecture of our LSTM user traffic prediction module.
Applsci 15 07603 g002
Figure 3. A general overview of our CNN-based user allocation module.
Applsci 15 07603 g003
Figure 4. User traffic in active users predicted for the next 60 time steps of an instance in the dataset with the LSTM model.
Applsci 15 07603 g004
Figure 5. User traffic in active users predicted for the next 60 time steps of an instance in the dataset with the Transformer-TCN model.
Applsci 15 07603 g005
Table 1. Feature Importance Ranking.
Input FeatureValue
Second_Derivative−0.000301 ± 0.000045
First_Derivative−0.000205 ± 0.000027
Original_Values−0.000045 ± 0.000003
Rolling_Mean−0.000003 ± 0.000001
Rolling_Std−0.000002 ± 0.000001
The ranking of the input features of our user traffic prediction models based on their importance. The mean values for the two architectures, namely, LSTM and Transformer-TCN, are reported.
Table 2. Long short-term memory trials.
1 LSTM Layer2 LSTM Layers3 LSTM Layers
AbsErrorPercentAbsErrorPercentAbsErrorPercent
3225 ± 1530.52% ± 0.061059 ± 470.17% ± 0.021592 ± 700.25% ± 0.03
Comparison between different architectures for our LSTM user traffic model in terms of absolute error and its percentage.
Table 3. Transformer-TCN trials.
Transformer-TCN
AbsErrorPercent
1215 ± 550.19% ± 0.02
Table 4. Loss configurations.
Loss ConfigurationTrend DirectionVolatile
MSE_Only--
MSE_Direction-
MSE_Volatile-
MSE_Dir_Vol
Table 5. Loss configuration results.
RMSE
Loss ConfigurationBeginningMiddleEnd
MSE_Only3500.4262963.6181300.578
MSE_Direction2820.0532543.9051040.686
MSE_Volatile3274.9752359.2941344.490
MSE_Dir_Vol3311.5162395.4181298.337
The RMSE and Directional Accuracy metrics are reported during inference at test points at (i) the beginning, (ii) the middle, and (iii) the end of the test dataset.
Table 6. CNN’s accuracy metrics.
Without UserTrafficPredWith UserTrafficPred
LossAccuracyLossAccuracy
0.37 ± 0.020.80 ± 0.010.32 ± 0.020.84 ± 0.01
Disclaimer/Publisher’s Note: The statements, opinions and data contained in all publications are solely those of the individual author(s) and contributor(s) and not of MDPI and/or the editor(s). MDPI and/or the editor(s) disclaim responsibility for any injury to people or property resulting from any ideas, methods, instructions or products referred to in the content.

