Article

Pointer Meter Reading Recognition Based on YOLOv11-OBB Rotated Object Detection

1
School of Electrical Engineering, Naval University of Engineering, Wuhan 430030, China
2
School of Computer Science and Technology, Wuhan University of Science and Technology, Wuhan 430081, China
3
Shanghai Marine Equipment Research Institute, Shanghai 200030, China
*
Author to whom correspondence should be addressed.
Appl. Sci. 2025, 15(13), 7460; https://doi.org/10.3390/app15137460
Submission received: 6 June 2025 / Revised: 30 June 2025 / Accepted: 1 July 2025 / Published: 3 July 2025

Abstract

In the domain of intelligent inspection, the precise recognition of pointer meter readings is of paramount importance for monitoring equipment conditions. To address the challenges of insufficient robustness and diminished detection accuracy encountered in practical applications of existing methods for recognizing pointer meter readings based on object detection, we propose a novel approach that integrates YOLOv11-OBB rotating object detection with adaptive template matching techniques. Firstly, the YOLOv11 object detection algorithm is employed, incorporating a rotational bounding box (OBB) detection mechanism; This effectively enhances the feature extraction capabilities related to pointer rotation direction and dial center, thereby boosting detection robustness. Subsequently, an enhanced angle resolution algorithm is leveraged to develop a mapping model that establishes a relationship between pointer the deflection angle and the instrument range, facilitating precise reading calculation. Experimental findings demonstrate that the proposed method achieves a mean Average Precision (mAP) of 99.1% in a self-compiled pointer instrument dataset. The average relative error of readings is 0.41568%, with a maximum relative error of less than 1.1468%. Furthermore, the method exhibits robustness and reliability when handling low-quality meter images characterized by blur, darkness, overexposure, and tilt. The proposed approach provides a highly adaptable and reliable solution for pointer meter reading recognition in the intelligent industrial field, with significant practical value.

1. Introduction

The advancement of Industry 4.0 and intelligent manufacturing has heightened the significance of industrial instrumentation in intelligent transformation applications [1]. In modern industrial facilities, analog pointer instruments extensively monitor critical parameters such as pressure, temperature and flow rates, serving as the primary safeguard for operational safety. Pointer meters, owing to their uncomplicated structure, robust durability, and cost-effective maintenance, are widely utilized across industrial sectors including petroleum and electric power [2]. However, the conventional reading method predominantly depends on manual periodic collection due to the inability of the pointer meter to directly acquire readings via the communication interface. This approach is inefficient and lacks real-time performance assurance. Moreover, it is susceptible to subjective operator influence, leading to data inaccuracies. These limitations are particularly pronounced in extreme environments characterized by high temperatures, pressures, and radiation levels [3]. In extreme environments, such as those characterized by high temperatures, pressures, and radiation levels, the limitations of manual data collection methods become particularly evident [4]. In industrial settings with restricted human access, such as nuclear power plants and oil refineries, there is a growing demand for automated solutions to address safety concerns. The automation of meter reading has progressed through various technological advancements, from early electromechanical systems to the current vision-based approaches. In recent years, the adoption of inspection robots has represented a significant step forward in industrial automation [5]. Wheeled inspection robots are commonly employed in industrial settings due to flexibility, mobility, and cost-effectiveness. However, the effectiveness of these robots is often hindered by the inherent limitations of their camera systems, including fixed focal lengths and limited zoom capabilities. These constraints can lead to issues such as image blurring, distortion, and scale variations [6]. Consequently, there is a pressing need to develop more precise methods for accurate meter reading recognition to address these challenges effectively.
Currently, automatic recognition of pointer instruments can be broadly categorized into two approaches: traditional computer vision-based methods and deep learning-based methods. Traditional image processing methods have been commonly employed for meter reading recognition due to their straightforward implementation and computational efficiency. Alegria et al. pioneered the application of image processing and computer vision techniques for the automatic reading of pointer meters [7]. Similarly, Yue et al. introduced a distance discrimination method utilizing machine vision to precisely position graduation marks and pointers [8]. Furthermore, Sun et al. proposed the concentric ring search method, which demonstrates improved accuracy in reading pointer meters deflection angles [9]. However, traditional image processing methods exhibit limitations in adapting to changes in illumination, occlusion, and other interferences, and they often struggle with weak generalization capabilities and are susceptible to variations in instrument appearance, background noise, and other factors, leading to suboptimal detection outcomes in complex environments.
The emergence of deep learning has significantly transformed the field of meter reading, primarily due to its advanced feature learning capabilities in complex environments [10,11,12]. Presently, deep learning-based instrument recognition models are generally divided into two categories: two-stage detection models, such as Faster R-CNN, and single-stage detection models, like YOLO. Liu et al. [13] and Wang et al. [14] employed Faster R-CNN to identify pointer dial regions, while Wu et al. [15] enhanced Mask-RCNN for low-light conditions, improving recognition accuracy through image tilt correction. However, these models often suffer from complex parameters and slow inference speeds, which limit their effectiveness in real-time industrial monitoring. Conversely, single-stage detection models are better suited for industrial applications due to their enhanced real-time performance and ease of deployment. Advances in the YOLO series have improved the feature extraction capabilities of pointer meters through network optimization and attention mechanisms. Zhang et al. developed a simplified approach for instrument pointer recognition using an improved version of the YOLOv5-MRL algorithm [16]. Zhang et al.’s YOLOv5-MR model achieves reading recognition by simultaneously detecting eight target types, such as the dial center, pointers, and six scale points, while implementing ellipse fitting. However, its multi-target joint detection mechanism is susceptible to error accumulation in occluded or blurred scenarios [17]. Despite these advancements, existing methods still face challenges such as noise interference sensitivity, significant tilt shooting errors, and the diversity of instrument types. Furthermore, complexities such as diverse illumination backgrounds and shooting distortions in real-world settings further complicate meter reading recognition. In industrial settings, leveraging prior information from the fixed installation of instruments (e.g., category and range information obtained from configuration files by inspection robots) can enhance algorithm stability. This paper introduces a novel approach for pointer meter reading recognition using YOLOv11-OBB, which integrates deep learning and traditional image processing techniques. The primary objective is to enhance the accuracy of recognizing pointer meter readings and improve the method’s generalizability.
This paper can be summarized as follows.
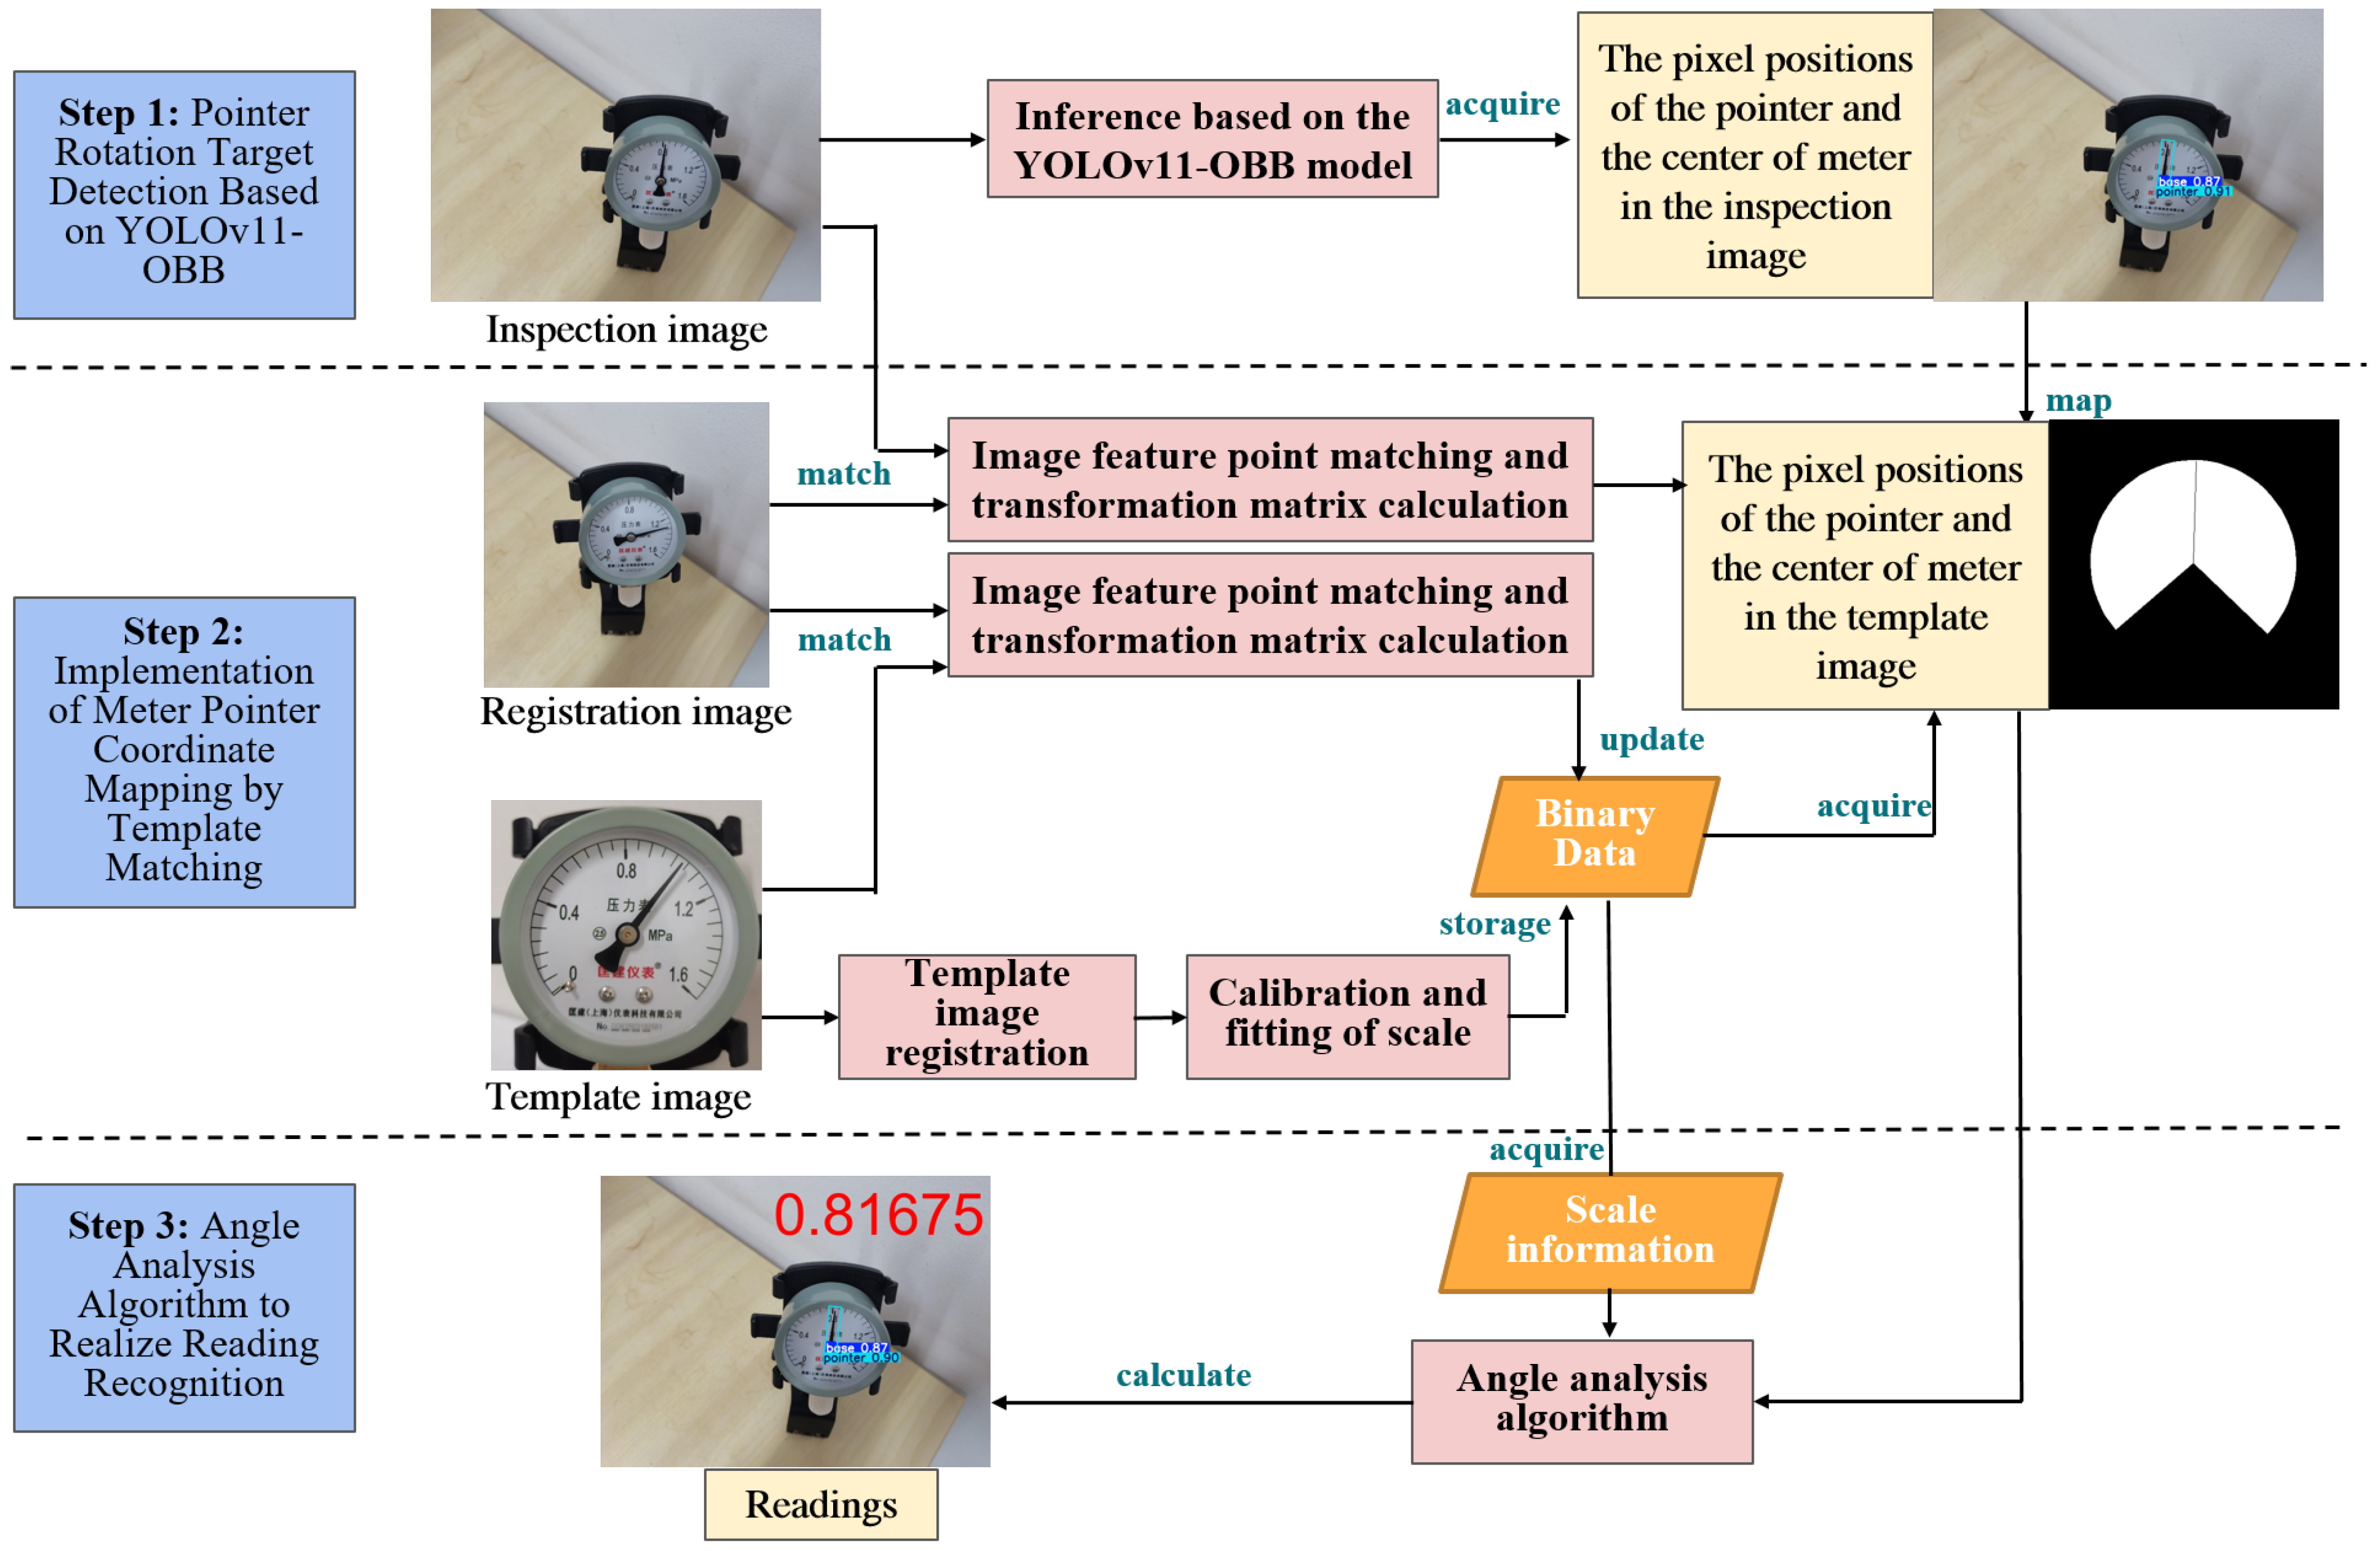
  • Rotated Object Detection Network Designing: This paper presents YOLOv11-OBB, a rotated object detection network built upon the YOLOv11 framework. By employing rotation matrix-based bounding boxes, the network achieves precise localization of pointer positions and orientations with high accuracy. A long-edge representation scheme combined with circular smooth labeling (CSL) is introduced to robustly discriminate pointer directions while enabling detection of dial centers in a unified learning framework.
  • Adaptive Model Library Construction and Matching: A transformation relationship between inspection and template images is established through a pointer table model library. Key variables are identified and stored following standard model registration and calibration fitting. The transformation matrix is computed using feature point matching algorithms, brute force matching, and the RANSAC algorithm to ensure precise alignment between inspection and template images. This method improves the system adaptability across different instruments and facilitates instrument detection in complex industrial environments.
  • Experimental Verification and Performance Analysis: The proposed method demonstrated exceptional performance in handling pointer instrument datasets, achieving a mean Average Precision (mAP) of 99.5%, an average relative error of 0.4157%, and a maximum relative error of 1.1464%. Furthermore, the method’s robustness was validated by its ability to accurately process low-quality images with various impairments, including blur, darkness, overexposure, and tilted images, while still meeting industrial standards. These findings establish the method as a highly adaptable and reliable automated reading solution for pointer instruments in the intelligent industrial field, underscoring its substantial practical engineering value.
This study presents a novel pointer reading recognition method that integrates the YOLOv11-OBB rotated object detection network with template matching technology. The method precisely determines the pointer’s position and angle using a rotated matrix bounding box, facilitated by an adaptively constructed pointer instrument template library. By leveraging feature point matching and the RANSAC algorithm, the approach achieves accurate transformation between detected and template images. Experimental results in complex industrial settings demonstrate the method’s robustness against image quality challenges such as blurring, dimness, overexposure, and inclination. This integration of deep learning and traditional computer vision techniques offers a high-precision, adaptable solution for automatic pointer instrument reading in industrial scenarios, underscoring its practical significance.
The paper is structured as follows. Section 2 reviews relevant literature on pointer meter reading. The principles and implementation of the proposed method are detailed in Section 3. Experimental results and comparative analyses are presented in Section 4. The paper concludes with a summary and future research directions in Section 5.

2. Previous Works

2.1. Pointer Detection

The precision of automated pointer meter reading relies significantly on the accurate identification of pointer and graduations [18]. Consequently, it is critical to precisely extract the meter hands, scales, and graduation values from the dial image. Conventional methods for pointer detection include threshold segmentation, edge detection, and straight-line detection [19]. Threshold segmentation is a technique that segments the image based on pixel gray or color values. This method directly distinguishes between the pointer and background by selecting an appropriate threshold (global, adaptive, or the Otsu algorithm). It is characterized by its low computational complexity and high real-time performance, particularly effective when there is high contrast between the pointer and background [20]. However, in cases of uneven illumination or complex backgrounds, a single threshold may be insufficient for accurate segmentation, leading to sensitivity to noise [21]. In contrast, the edge detection method aims to eliminate interference from uniform areas by emphasizing the outline edges of the pointer. Nonetheless, it is susceptible to disturbances from non-pointer edges, such as scales, text, or decorative textures. On the other hand, line detection involves identifying and parameterizing line endings in an image, commonly achieved through the Hough transform. A challenge with this method is the potential misjudgment of non-pointer lines, like dial scales and frames [22]. Moreover, variations in illumination or external occlusions can render preset parameters ineffective, thereby reducing the overall efficacy of these methods. Wan et al. utilized U-Net for the extraction of graduation marks and pointer from pointer instruments to achieve automated reading, leveraging U-Net segmentation outcomes and contour fitting of graduation marks [23]. However, the U-Net network is susceptible to losing boundary details of small-scale objects during image segmentation. Furthermore, the convolution kernel characteristics of convolutional neural networks limit the ability to capture global and long-dimensional features from pointer meter images, leading to incomplete segmentation of lengthy pointers. To solve this problem, Zhang et al. addressed this issue by utilizing the Swin Transformer to partition the network for producing mask images of scales and pointers, subsequently utilizing the minimum skeleton circle method to adjust the pointer line equation [24]. This approach, while enhancing feature extraction, is impractical for real-world applications due to its time-consuming nature. Zhang et al. used the YOLOv5-MRL multi-scale detection model to accurately identify components like the instrument pointer and dial center, improving enhancing small pointer detection precision [16]. To address the challenge of pointer direction discrimination, Zhang et al. introduced a novel rotating object detection network based on YOLOv5, inspired by remote sensing object detection algorithms [25]. Following the analysis presented above, the YOLOv11-OBB rotational object detection network has been incorporated into the YOLOv11 framework. This integration enables precise localization of the pointer’s position and angle through the utilization of rotating matrix boxes. The network also distinguishes the pointer’s direction by utilizing the long edge representation of circular smooth labels enabling accurate identification of both the pointer’s position and direction in complex intricate environments.

2.2. Reading Recognition

Current methodologies for pointer meter reading predominantly include the template method [26], distance method [15,16,17,18,19,20,21,22,23,24,25,26,27], and angle method [12]. Hassan et al. introduced a template matching technique using virtual templates with concentric rings to ascertain analog meter values [26]. This approach involves direct image comparison for the localization of pointers or scales, achieving high accuracy when the template closely aligns with the target instrument. However, it requires a pre-refined high-precision instrument template. Wu et al. proposed converting a curved dial into a rectangular one and transforming the curved scale into a linear one, thereby determining the reading by measuring the distance between the pointer and the scale [15]. Although the distance method is straightforward and effective, it is mainly suitable for instruments with linear scale distributions. Its application to nonlinear scales is challenging, and converting an arc dial into a straight line leads to information loss. Hou et al. developed an enhanced angular method that calculates readings by using the pointer’s rotation angle relative to the nearest two tick marks [12]. This method is well suited for circular or nonlinear scales, offering flexibility in accommodating various scale distributions through the mapping of angles to scale values. However, the angular method necessitates multiple angles, scale values, and precise center positions to compute the angle and ascertain the meter reading. Consequently, this approach not only escalates the computational load on the segmentation network and recognition algorithm but also leads to increased cumulative errors with a higher number of recognition algorithm parameters. This paper introduces an enhanced angle resolution method utilizing the inspection point template image to accurately calculate instrument readings. The proposed method simplifies the identification of readings by locating the two closest graduation marks in the template image and determining the rotation angle based on the pixel position of the meter pointer. This approach effectively minimizes computational complexity and algorithmic errors.

3. Materials and Methods

The main purpose of the inspection robot is to traverse a set inspection route, take images of devices at designated inspection locations, analyze these images utilizing a recognition algorithm, and subsequently generate readings of meter indicators. The methodology detailed in this paper consists of several essential stages: object detection employing YOLOv11-OBB for pointer rotation, mapping of meter pointer coordinates through template matching, and utilization of an angle resolution algorithm for calculating reading. The complete framework of the proposed method is illustrated in Figure 1.
Step 1: Pointer Rotation Target Detection Based on YOLOv11-OBB.
The YOLOv11-OBB detection model is an extension of the YOLOv11 object detection algorithm. It integrates an oriented bounding box (OBB) detection technique to precisely identify the vertex coordinates of meter pointer rotation boxes and dial center coordinates in inspection images. This approach enhances the ability to perceive orientation and improves the accuracy of detecting rotating pointer targets through angle-sensitive feature extraction and an adaptive rotating anchor frame mechanism.
Step 2: Implementation of Meter Pointer Coordinate Mapping by Template Matching.
This paper presents the creation of a template library comprising diverse pointer meters. The registration images of standard inspection points are gathered to facilitate the automated spatial alignment of inspection and template images through a feature point matching algorithm. An affine transformation matrix is computed with high accuracy to precisely align the coordinates of the pointer vertex and dial center from real-time images to a standardized template space. This method effectively reduces positioning errors caused by angular deviations and illumination variations.
Step 3: Angle Analysis Algorithm to Realize Reading Recognition.
Utilizing the angle analysis algorithm, a mathematical mapping model of the pointer deflection angle with the instrument range has been developed to enable precise calculation of the pointer reading.
The template image represents the standard model for the pointer meter, captured under optimal conditions with uniform lighting, free from distortion and clearly defined. It provides precise geometric characteristics and benchmark scale data essential for the system. Registration images, obtained under real-world conditions, corresponding to specific inspection points, often face challenges such as variable illumination, background noise, distortion, and blurring. Multiple registration images may relate to the same template image, merging inspection point data with the template. This integration establishes a foundation for accurate and efficient reading recognition of pointer meters in complex environments.

3.1. Pointer Rotation Object Detection Based on YOLOv11-OBB

3.1.1. YOLOv11-OBB Object Detection Model

The YOLOv11 algorithm, developed by Ultratics in 2024, is an object detection model designed to accurately locate and classify objects within complex environments [28]. This is achieved through the integration of efficient feature extraction networks, adaptable parameter settings, and robust detection mechanisms. Notably, YOLOv11 has demonstrated substantial enhancements in precision, speed, and computational efficiency, particularly in the realm of oriented bounding boxes (OBB). To cater to diverse application requirements, YOLOv11 offers model size options including n, s, m, l, and x. The framework of YOLOv11 comprises three primary components: the head, backbone, and neck, as illustrated in Figure 2.
YOLOv11 introduces novel features in various aspects.
Backbone network: The backbone network of YOLOv11 comprises a distinctive architecture composed of convolution layers (Conv) and specialized modules (C3K2, SPPF, C2PSA). The convolutional layer extracts local features and performs downsampling. The C3K2 module efficiently integrates multi-level features, reducing computational load. The SPPF module captures context information at various scales, while the C2PSA module refines the integrated features. These modules extract multi-scale feature information, providing a robust foundation for subsequent detection tasks.
Neck network: The YOLOv11 architecture introduces a novel neck network design that integrates upsampling and feature stitching to merge feature maps of varying scales. The incorporation of the C3K2 module further enhances the expressive capacity and discriminative power of the processed features. This design addresses the detection needs of targets across diverse scales while improving the precision of target localization.
Detection head: The YOLOv11 object detection model employs an Oriented Bounding Boxes (OBB) module to extract multi-scale feature maps. This module utilizes convolutional, classification, and regression layers to accurately predict the position, category, and orientation of rotated target objects. The model’s multi-scale detection strategy leverages the semantic information from small-scale feature maps to identify large targets, while utilizing the detailed features preserved in large-scale feature maps to detect small targets. This approach significantly enhances the model’s ability to detect objects of diverse sizes.
In summary, YOLOv11 demonstrates exceptional performance in object detection, especially for rotating object detection. This is achieved through innovative designs in the backbone network, neck network, and detection head, providing novel technical strategies for pointer meter reading recognition.

3.1.2. Pointer Rotation Object Detection

The object detection and analysis process starts with loading the YOLOv11-OBB model, optimized for high-accuracy detection of pointer instruments. The inspection image is then analyzed to identify the vertex coordinates of the pointer rotation frame and the dial’s center coordinates. Using geometric algorithms, the pointer’s starting and ending points are determined based on the aforementioned coordinates, allowing for the extraction of the pointer’s pixel position. To improve detection accuracy, the least squares method is applied to precisely fit the pointer’s starting and ending points along with the dial’s center. This method ensures precise detection and analysis of pointer meters, providing reliable support for automated reading processes.

3.2. Implementation of Meter Pointer Coordinate Mapping by Template Matching

3.2.1. Standard Model Construction of Pointer Meter

The construction of the standard model for the pointer table involves two primary steps: model registration and calibration.
(1) Model Registration
During the registration stage of the pointer meter model, the first step involves capturing clear frontal images of diverse pointer meters to serve as template images, as shown in Figure 3. These provide templates for variations in the inner diameter among different pointer meters. By optimizing the minRadius parameter, the model effectively accommodates these differences, ensuring precise pointer recognition. The outer diameter of the pointer is determined by the scale point, with detailed scale information acquired during subsequent calibration and fitting procedures. The standard model image is then loaded and uniformly resized to 500 × 500 pixels to ensure template consistency and eliminate potential interference arising from variations in image sizes. Figure 3 shows the processed standard model image for comparative analysis, further enhancing method stability across different scenarios and improving model recognition accuracy.
(2) Calibration and fitting of scale
Calibration and fitting of scale are crucial for instrument recognition and involve three key steps: recording the interactive rectangular frame coordinates, performing circular fitting and angle calculation, and determining the pointer area.
  • Interactive recording of rectangular frame coordinates: Real-time tracking of mouse interaction enables the automatic conversion of drawn rectangular frames into precise center mark points on a scale. This enhances the efficiency and accuracy of scale positioning, as illustrated in Figure 4a, and supplies crucial data for subsequent calculations and analyses.
  • Circle fitting and angle calculation: Circle fitting employs the least squares method using the coordinate data of all calibration points to determine the center coordinates and radius, as illustrated in Figure 4b. This process is crucial for accurately defining the pointer’s center of rotation. Following this, the center coordinates of the circle are established, and the offset and angle of each rectangular box’s center point relative to the circle’s center are computed to verify that the angle value conforms to the specified range.
  • Pointer area determination: The circle’s radius from the fitting process is utilized as the outer radius for the pointer area. By integrating this with the predetermined inner radius parameter, as illustrated in Figure 4c, the extent of the pointer area can be precisely established.
Upon completion of the calibration process, essential parameters, including the group of rectangle center points, center coordinates, array of angles, mask image, original image, initial angle offset, and calibration array, are stored in a binary file.

3.2.2. Template Images and Registration Images Matching

The primary goal of matching the template image with the registration image is to achieve precise correspondence between the template image (Figure 5a) and the registration image at the inspection point (Figure 5b) through an algorithm focused on feature point matching. Following the matching process, an affine transformation-based algorithm generates a transformation matrix, detailing the translation, rotation, and scaling relationships between the template and inspection images. During the detection phase, the real-time inspection image can be correlated with the template image based on the matching results. This correlation allows for the effective elimination of image discrepancies resulting from variables such as shooting angles and illumination conditions. Consequently, this process enhances the accuracy of pointer meter recognition and analysis.
(1) Image Feature Point Matching and Transformation Matrix Calculation
Firstly, the registration image is calibrated. An adjustable interactive rectangular marker frame is generated on the registration image based on the distribution of the center points of the rectangular frame in the template image. Spatial correspondence between the template and registration images is established by aligning the positions of corresponding scale markers (Figure 6). This process enables the calibration matching of scale feature points, thereby achieving alignment between the two images.
Secondly, the spatial correspondence between feature points in the template and registered images is established by utilizing the coordinate array of the center point of the rectangular frame in the template image and the corresponding point set obtained through interactive labeling in the registration image. The RANSAC algorithm is employed to compute the forward (M1) and the inverse (M2) transformation matrices, which facilitate the bidirectional projection transformation between the two images. By utilizing the selected matching point pairs and the RANSAC algorithm, the transformation matrices (M1 and M2) are determined, precisely depicting the spatial transformation relationship between the template and registration images and outlining the procedures for transforming each image into the other. The accuracy and reliability of the matching process are critical for subsequent detection tasks. Discrepancies in image acquisition conditions during the registration process can lead to erroneous matching points and noise interference. The RANSAC algorithm effectively mitigates outliers and noise through random sampling and iterative procedures, thereby enhancing the reliability of transformation matrix estimation. This inherent capability of the RANSAC algorithm minimizes the impact of noise and outliers on the matching process, consequently improving the accuracy and robustness of the overall matching procedure.
Finally, the center coordinates of the pointer table in the template image are mapped to derive the corresponding center coordinates in the registered image using the forward transformation matrix M1. Key parameters are then updated, incorporating the transformation matrix M1 from the template image to the registered image of the inspection point, the inverse transformation matrix M2 from the registered to the template image, and the center point coordinate parameters of the registered image. These updated parameters are then added to the binary configuration file.
The registration process establishes a robust correspondence between the registered image and the template image, thereby enhancing the precision and reliability of pointer table recognition and analysis. This approach ensures the method’s consistent performance and stability across diverse scenes and environmental conditions.

3.2.3. Matching of Inspection Image and Template Image

(1) Key Point Matching and Alignment between Inspection Image and Registration Image
The inspection image is indexed and referenced against the relevant registration image. The Scale-Invariant Feature Transform (SIFT) algorithm is then employed to identify key point correspondences between the inspection and registration images, as shown in Figure 7. Using these key points, a perspective transformation matrix M4 and its inverse M3 are computed, enabling the mapping of the pointer table area from the inspection image to the corresponding location in the registration image, and vice versa. This process ensures precise spatial alignment between the inspection and registration images, facilitating reliable detection and analysis of the pointer meters.
(2) Coordinate transformation of pointer
The pointer coordinates undergo two perspective transformations using transformation matrices M4 and M2 to convert the coordinates from the current image space to the target image space. This process mitigates the impact of factors such as angle deviation, rotation, and scaling that may occur during imaging, ensuring the precise depiction of the pointer’s position. Initially, the pointer endpoints are transferred from the inspection image to the registration image, establishing an associative link. Subsequently, the mapped points are transferred from the registration image to the template image, enhancing the accuracy of matching and consolidating the information into the standardized template. This consolidation facilitates subsequent data processing and analysis. Ultimately, the pointer’s position is accurately determined on the template image, enabling the retrieval of the indicated scale value.
The transformed pointer line on the mask image denotes the pointer’s position and direction. By analyzing the relationship between the restricted pointer area and the pointer’s center point, the potential pointer is precisely identified to accurately select the actual pointer, as illustrated in Figure 8.

3.3. Angle Analysis Algorithm to Realize Reading Recognition

The meter image mapping creates a direct correlation between the pointer’s deflection angle and the meter reading. To mathematically link the related pointer orientation to the meter reading, a mapping function is required. For a pointer meter with a uniform scale, a linear mapping can be established by identifying the pointer direction at both the maximum and minimum scale values. In contrast, instruments with non-uniform scales require more sophisticated fitting techniques to define the mapping relationship accurately. Concretely, the two scales between which the pointer is positioned are determined, and subsequently, the fraction of the pointer’s alignment within the division grid is computed.
This study employs the angle method to calculate the central angle formed at the intersection of the pointer and the scale circle, alongside two adjacent scale points. These points may represent the minimum, maximum, or any two neighboring scales on the circle. This angle calculation facilitates the determination of the proportion within the division grid.
The algorithmic concept is illustrated in Figure 9a, and the corresponding formula is as follows:
r = v 1 + θ 0 θ 1 v 2 v 1
In the formula, θ0 represents the angle from the pointer’s straight line to the initial scale (or adjacent scale 1) in the plane coordinate system, while θ1 denotes the angle from the initial scale to the maximum scale (or adjacent scale 2) in the plane coordinate system. Additionally, v1 and v2 correspond to the initial and maximum scale readings (or two adjacent scales) respectively, and r indicates the pointer meter reading result.

4. Experimental Results

4.1. Datasets and Experimental Setting

4.1.1. Datasets Configuration

The experimental dataset consists of 5800 images sourced from video clips recorded in a substation environment. To ensure diversity, the clips captured were selected to reflect various environmental conditions. Each dataset category contains a sufficient number of samples to address class imbalance. Standard image processing techniques, such as cropping, scaling, and data augmentation—including random rotation, translation, flipping, and color adjustment—were employed to enhance diversity and prevent model overfitting. Before partitioning, each image was manually labeled. The dataset was then randomly divided into training, validation, and test sets in an 8:1:1 ratio to maintain the integrity of model training and evaluation. The training set was used for model training, the validation set for hyperparameter tuning and model selection, and the test set for evaluating final model performance.

4.1.2. Environment Configuration

Experiments were conducted on a Windows system featuring an Intel Xeon Gold 6226R processor (manufactured by Intel Corporation, headquartered in Santa Clara, CA, USA), 32 GB RAM, and an NVIDIA GeForce RTX 309 GPU. Python 3.8.2 and PyTorch 1.13.1 were employed. The hyperparameters included an initial learning rate of 0.0031, a decay factor of 0.12, momentum of 0.937, a batch size of 64, and training over 300 epochs.

4.2. Model Comparison Experiment

4.2.1. Model Performance Metrics

In object detection, model performance is commonly assessed through Precision, Recall, Average Precision (AP), and mean Average Precision (mAP). AP represents the area under the curve of recall versus precision. The formula is defined as follows:
P r = T P T P + F P
R e = T P T P + F N
m A P = i = 1 N A P i N
In this formula, Pr denotes precision, Re represents recall, TP stands for true positives, FP for false positives, FN for false negatives, and N is the number of categories detected.

4.2.2. Model Comparison Result

This study presents a comparative evaluation of the performance characteristics of several YOLO model variants, including YOLOv8n, YOLOv9m, YOLOv10n, YOLOv11n, YOLOv11s, and YOLOv11-OBB. The analysis focuses on key metrics such as precision, recall, mean average precision (mAP@50, mAP@75, and mAP@50:90), model weight size, parameter count, and floating-point operations per second (FLOPs). Detailed results are reported in Table 1. Additionally, indicators of inference speed and frames per second (FPS) are provided in Table 2.
The YOLOv11-OBB model presented in this study demonstrates exceptional detection performance across various evaluation metrics. In terms of Precision, all models exhibit comparable results, with the YOLOv11-OBB model ranking first with an accuracy of 98.1%, indicating a low false detection rate. Regarding Recall, all models perform well. The YOLOv11-OBB model significantly outperforms other models in the mAP@50 metric, achieving a score of 99.1%, showcasing a clear advantage in overall detection performance. Furthermore, in the mAP@75 metric, the YOLOv11-OBB model stands out with a performance of 98.7%. In the mAP@50:95 metric, the YOLOv11-OBB model also demonstrates robust detection accuracy under different Intersection over Union (IoU) thresholds, scoring 88.7%. The YOLOv11-OBB model also performs excellently in the point and base categories across the aforementioned metrics.
The YOLOv9m model exhibits the largest weight file size (40.8 MB) and parameter count (75.8 MB) among the models examined. Conversely, the YOLOv11n model presents a smaller weight size (5.5 MB) and parameter count (10.3 MB). The model proposed in this study achieves a weight size and parameter count of 10.6 MB, striking a favorable balance between performance and lightweight design.
Floating-point operations (FLOPs) are key in evaluating a model’s computational complexity. The YOLOv9m model has the highest FLOPs at 76.5G, indicating the most computational demand among the models assessed. In contrast, the YOLOv11n-OBB model records only 6.6G FLOPs, significantly lower than YOLOv9m and surpassing YOLOv8n (8.1 G), YOLOv10n (8.2 G), and YOLOv11s (21.3 G). With its top mAP@50:95 of 88.7% and a minimal weight size of 6.1MB, this model achieves an optimal balance between computational efficiency and detection performance.
YOLOv10n excels with 588 frames per second (FPS) and a total latency of just 1.7 milliseconds (ms). Its post-processing phase is highly efficient, taking only 0.2 ms, far surpassing similar models. Conversely, YOLOv9m shows the lowest performance at 192 FPS due to an inference latency of 3.9 ms, making it more suitable for high-precision tasks. For YOLOv11-OBB, post-processing time increases to 2.4 ms due to the complexity of rotated bounding box detection, resulting in a reduced FPS of 222.
The YOLOv11-OBB model demonstrates exceptional performance across multiple key metrics, including Accuracy, Recall, mAP@50, mAP@75, and mAP@50:95, while maintaining a favorable balance between model size and computational complexity. As illustrated in Figure 10, the training process exhibits dynamic trends in precision, recall, mAP@75, and mAP@50:95.
The model exhibits exceptional target detection performance on the test set, achieving nearly perfect recognition for both target types. For the base class, only 3 out of 550 test samples were missed, yielding a missed detection rate of 0.545% (3/550). For the pointer class, all 569 test samples were correctly detected, resulting in a missed detection rate of 0%. These results demonstrate the model’s absolute robustness in recognizing pointer targets and maintain the detection error for the base category strictly below 1%.

4.3. Pointer Meter Reading Recognition Experiment

To address false positives and negatives in object detection, this experiment concentrates on data reading trials using only images where dial hands were successfully detected in the initial phase.

4.3.1. Pointer Meter Reading Evaluation Metrics

This paper evaluates the accuracy of the measurement and display instruments in industrial process control, using error grade as the reading recognition index. The relative error ε is calculated using the following formula:
ε = ( v v ) L × 100 %
In this formula, v′ is the predicted reading; v is the actual reading; L is the pointer meter range.

4.3.2. Experimental Results and Analysis

(1) Experimental Results and Analysis under Normal Condition
To evaluate the proposed pointer recognition method, we conducted experiments on pointer meter reading recognition, detailed in Table 3. The results indicate that the proposed recognition method effectively accomplishes the pointer recognition task, achieving an average relative error of 0.41568% and a maximum relative error of 1.1464%. Partial experimental results are illustrated in Figure 11. The method by Chi et al. (2015) [29] utilized threshold segmentation via machine vision coupled with the Hough transform, resulting in a mean relative error of 0.613%. Alternatively, Kucheruk et al. (2018) [30] implemented pointer detection through dynamic feature analysis, yielding a mean relative error of 1.375%. In comparison, our proposed method achieves a mean relative error of 0.41568%, demonstrating superior performance over these traditional approaches.
(2) Experimental results and analysis of low-quality meter images
To assess the proposed method’s effectiveness in processing low-quality meter images, this study compares recognition results for four types of low-quality meter images, as shown in Figure 12.
The recognition experiment conducted on low-quality meter images demonstrates the effectiveness of the method presented in this study in detecting pointer and dial center positions with readings falling within acceptable error margins. Notably, the proposed method exhibits the capability to accurately identify readings in low-quality meter images. Table 4 provides a detailed summary of the identification results for such images, revealing maximum relative errors of −0.797% for blurred images, 0.488% for darkness images, 0.507% for overexposure images, and 0.538% for tilted images. These errors comply with the criteria outlined in the China Electric Power Industry Standard Inspection Robot Inspection Technical Specification for pointer meter algorithms, stipulating an error margin of less than ±5%. The recognition errors for all low-quality images remain within acceptable limits. While the method’s performance may slightly diminish when handling blurred images, it maintains high accuracy with most standard meter images and demonstrates exceptional robustness in reading recognition under adverse conditions. Furthermore, a comparative analysis with reference [11] indicates our method’s superior control over maximum relative errors in low-quality image recognition, achieving −0.797% for blurred images and 0.538% for tilted images, compared to reference [11]’s 0.27% and 1.33%, respectively. Notably, the error reduction for tilted images is about 60%. Additionally, our method keeps the absolute error within 0.797% for low-quality images, surpassing the maximum error of 1.33% reported in reference [11].

5. Conclusions

This paper presents an intelligent approach for recognizing pointer meters in complex scenes to tackle challenges such as reduced detection accuracy and lack of robustness in current reading recognition methods based on object detection. The proposed method combines rotating object detection with adaptive template matching. Initially, the YOLOv11 object detection algorithm is employed to improve the feature extraction capacity or pointer rotation direction and dial center by incorporating a rotation bounding box (OBB) detection mechanism. Subsequently, a diverse library of pointer instrument templates is established, and the spatial transformation relationship between the inspection image and registration template is defined. Finally, an angle analysis algorithm is employed to establish a mathematical mapping model for pointer deflection angle and instrument range, enabling accurate reading calculations.
The experimental results reveal that the pointer reading recognition method, integrating YOLOv11-OBB with classic template matching, achieves a mean average precision (mAP) of 99.5% on a custom pointer instrument dataset. The method registers an average relative error of 0.4157% and a maximum relative error of 1.1464%. It exhibits exceptional adaptability and robustness in complex industrial environments, offering a reliable solution for automatic pointer instrument readings in intelligent industrial contexts. This approach has been validated in engineering practice and is ready for direct application in industrial inspections.
This approach faces several limitations. Firstly, the conventional SIFT feature point matching algorithm used in template image matching often produces outliers when comparing real-time inspection images with templates, especially under image blurring or distortion, complicating outlier elimination. Future research will enhance outlier elimination by integrating the GMS (Grid-based Motion Statistics) algorithm and expanding key point matching research based on the SIFT algorithm. Secondly, the detection accuracy of the current YOLOv11-OBB model, while satisfactory on standard datasets, still requires refinement for blurred images and distant targets. Future research endeavors will leverage recent advancements in lightweight attention mechanisms and hybrid architectures to explore the integration of optimized attention modules into the YOLOv11-OBB framework, with the aim of enhancing its capability to detect small, distant targets under challenging imaging conditions. Lastly, the current template library approach requires manual registration of templates for each new instrument type, resulting in a linear increase in maintenance costs as the number of instrument types grows. Future research will explore the use of transfer learning to automate template generation, with the aim of enhancing the system’s detection capabilities for previously unknown instrument types.

Author Contributions

Methodology, L.W.; Software, C.D.; Investigation, B.H.; Writing—review and editing, X.X. All authors have read and agreed to the published version of the manuscript.

Funding

Naval Engineering University Independent Research Project (No. 2023504040) [October 2023–October 2025]. National Key Research and Development Program of China (No. 2022YFC3102800) [November 2022–November 2025].

Institutional Review Board Statement

Not applicable.

Informed Consent Statement

Not applicable.

Data Availability Statement

The original contributions presented in this study are included in the article. Further inquiries can be directed to the corresponding author.

Conflicts of Interest

The authors declare no conflict of interest.

References

  1. Ueda, S.; Suzuki, K.; Kanno, J.; Zhao, Q. A Two-Stage Deep Learning-Based Approach for Automatic Reading of Analog Meters. In Proceedings of the IEEE International Conference on Soft Computing and Intelligent Systems (SCIS-ISIS), Hachijo Island, Japan, 5–8 December 2020. [Google Scholar]
  2. Thomasnet. Analog Gauges vs. Digital Gauges. Available online: https://www.thomasnet.com/insights/analog-vs-digital-gauges/ (accessed on 10 August 2019).
  3. Peixoto, J.; Sousa, J.; Carvalho, R.; Santos, G.; Cardoso, R.; Reis, A. End-to-End Solution for Analog Gauge Monitoring Using Computer Vision in an IoT Platform. Sensors 2023, 23, 9858. [Google Scholar] [CrossRef] [PubMed]
  4. Haine, C.B.; Scharcanski, J. A New Approach for Automatic Visual Monitoring of Analog Meter Displays. In Proceedings of the IEEE International Instrumentation and Measurement Technology Conference (I2MTC), Graz, Austria, 13–16 May 2012. [Google Scholar]
  5. Chen, X.; Peng, P.A.; Wang, L. MAMRS: Mining Automatic Meter Reading System Based on Improved Deep Learning Algorithm Using Quadruped Robots. Appl. Sci. 2024, 14, 10949. [Google Scholar] [CrossRef]
  6. Liu, F.T.; Wu, W.; Ding, J.; Ye, W.; Li, C.; Liang, Q. A Robust Pointer Meter Reading Recognition Method Based on TransUNet and Perspective Transformation Correction. Electronics 2024, 13, 2436. [Google Scholar] [CrossRef]
  7. Alegria, E.C.; Serra, A.C. Automatic Calibration of Analog and Digital Measuring Instruments Using Computer Vision. IEEE Trans. Instrum. Meas. 2000, 49, 94–99. [Google Scholar] [CrossRef]
  8. Yue, G.Y.; Li, B.S.; Zhao, S.T. Intelligence Identifying System of Analog Measuring Instruments. J. Sci. Instrum. 2003, 24, 430–431. [Google Scholar]
  9. Sun, F.J.; An, T.J.; Fan, J.Q.; Yang, C.P. Study on the Recognition of Pointer Position of Electric Power Transformer Temperature Meter. Proc. Chin. Soc. Electr. Eng. 2007, 27, 70–75. [Google Scholar]
  10. Wang, Y.; Li, J.; Zhang, H.; Liu, Y.; Chen, W. Pointer Instrument Reading Recognition Based on Improved YOLOv5 and Attention Mechanism. Measurement 2022, 199, 111554. [Google Scholar]
  11. Zhang, X.; Wang, L.; Zhou, P.; Li, S.; Yang, C. An Efficient Deep Learning Approach for Pointer Instrument Reading in Complex Industrial Scenarios. Pattern Recognit. Lett. 2023, 167, 114–121. [Google Scholar]
  12. Hou, L.; Wang, S.; Sun, X.; Mao, G. A Pointer Meter Reading Recognition Method Based on YOLOX and Semantic Segmentation Technology. Measurement 2023, 218, 113241. [Google Scholar] [CrossRef]
  13. Liu, Y.; Liu, J.; Ke, Y. A Detection and Recognition System of Pointer Meters in Substations Based on Computer Vision. Measurement 2020, 152, 107333. [Google Scholar] [CrossRef]
  14. Wang, L.; Wang, P.; Wu, L.; Xu, L.; Huang, P.; Kang, Z. Computer Vision Based Automatic Recognition of Pointer Instruments: Data Set Optimization and Reading. Entropy 2021, 23, 272. [Google Scholar] [CrossRef] [PubMed]
  15. Wu, X.; Shi, X.; Jiang, Y.; Gong, J. A High-Precision Automatic Pointer Meter Reading System in Low-Light Environment. Sensors 2021, 21, 4891. [Google Scholar] [CrossRef] [PubMed]
  16. Zhang, C.; Wang, K.; Zhang, J.; Zhou, F.; Zou, L. Lightweight Meter Pointer Recognition Method Based on Improved YOLOv5. Sensors 2024, 24, 1507. [Google Scholar] [CrossRef] [PubMed]
  17. Zou, L.; Wang, K.; Wang, X.; Zhang, J.; Li, R.; Wu, Z. Automatic Recognition Reading Method of Pointer Meter Based on YOLOv5-MR Model. Sensors 2023, 23, 6644. [Google Scholar] [CrossRef]
  18. Zhang, C.L.; Shi, L.; Zhang, D.D.; Ke, T.; Li, J.R. Pointer Meter Recognition Method Based on Yolov7 and Hough Transform. Appl. Sci. 2023, 13, 8722. [Google Scholar] [CrossRef]
  19. Tian, E.; Zhang, H.L.; Hanafiah, M.M. A Pointer Location Algorithm for Computer Vision-Based Automatic Reading Recognition of Pointer Gauges. Open Phys. 2019, 17, 136–143. [Google Scholar] [CrossRef]
  20. Gao, S.S.; Wang, Y.Y.; Chen, Z.F.; Zhou, F.; Wang, R.G.; Guo, N.H. Design and Implementation of Local Threshold Segmentation Based on FPGA. J. Electr. Comput. Eng. 2022, 2022, 6532852. [Google Scholar] [CrossRef]
  21. Zhao, W.D.; Huang, H.C.; Li, D.; Chen, F.; Cheng, W. Pointer Defect Detection Based on Transfer Learning and Improved Cascade-RCNN. Sensors 2020, 20, 4939. [Google Scholar] [CrossRef]
  22. Zhao, M.G.; Yu, H.B.; Shao, H.Y. Experimental Study on Instrument Pointer Detection Based on Hough Transform and RANSAC Algorithm. In Proceedings of the 4th International Conference on Algorithms, Computing and Artificial Intelligence (ACAI ‘21), Sanya, China, 22–24 December 2021. [Google Scholar]
  23. Wan, J.; Wang, H.; Guan, M.; Shen, J.; Wu, G.; Gao, A.; Yang, B. An Automatic Identification for Reading of Substation Pointer-Type Meters Using Faster R-CNN and U-Net. Power Syst. Technol. 2020, 44, 3097–3105. [Google Scholar]
  24. Zhang, W.; Ji, D.; Yang, W.; Zhao, Q.; Yang, L.; Zhuoma, C. Application of Swin-Unet for Pointer Detection and Automatic Calculation of Readings in Pointer-Type Meters. Meas. Sci. Technol. 2023, 35, 025904. [Google Scholar] [CrossRef]
  25. Zhang, Y.R.; Deng, C.H. Pointer Meter Reading Recognition Method Based on Rotating Object Detection. Comput. Eng. Des. 2023, 44, 1804–1811. [Google Scholar]
  26. Hassan, H.A.; Zabidi, A.; Yassin, A.I.M. Analog to Digital Meter Reader Converter Using Signal Processing Technique. In Proceedings of the 2021 IEEE Symposium on Computers & Informatics (ISCI), Kuala Lumpur, Malaysia, 16 October 2021. [Google Scholar]
  27. Fan, Z.; Shi, L.; Xi, C.; Wang, H.; Wang, S.; Wu, G. Real Time Power Equipment Meter Recognition Based on Deep Learning. IEEE Trans. Instrum. Meas. 2022, 71, 1–15. [Google Scholar] [CrossRef]
  28. Khanam, R.; Hussain, M. Yolov11: An Overview of the Key Architectural Enhancements. arXiv 2024, arXiv:2410.17725. [Google Scholar]
  29. Chi, J.; Liu, L.; Liu, J.; Jiang, Z.; Zhang, G. Machine Vision Based Automatic Detection Method of Indicating Values of a Pointer Gauge. Math. Probl. Eng. 2015, 2015, 1–19. [Google Scholar] [CrossRef]
  30. Kucheruk, V.; Kurytnik, I.; Kulakov, P.; Lishchuk, R.; Moskvichova, Y.; Kulakova, A. Definition of dynamic characteristics of pointer measuring devices on the basis of automatic indications determination. Arch. Control Sci. 2018, 28, 401–418. [Google Scholar] [CrossRef]
Figure 1. Proposed method overall framework.
Applsci 15 07460 g001
Figure 2. Architecture of the YOLOv11-OBB model.
Applsci 15 07460 g002
Figure 3. Different types of pointer template images. (a) Template images 1; (b) Template images 2; (c) Template images 3; (d) Template images 4.
Applsci 15 07460 g003
Figure 4. (a) The red dots represent scale values; (b) The circle of scale fitting; (c) Pointer area determined by scale and inner diameter.
Applsci 15 07460 g004
Figure 5. (a) Template images; (b) Registration image.
Applsci 15 07460 g005
Figure 6. Registration image with marked scale.
Applsci 15 07460 g006
Figure 7. Feature matching between inspection image and registration image.
Applsci 15 07460 g007
Figure 8. Identify the potential pointer by the pointer area.
Applsci 15 07460 g008
Figure 9. (a) Schematic diagram of angle method to reading recognition; (b) Result of reading recognition.
Applsci 15 07460 g009
Figure 10. Training metrics comparison curve. (a) Comparison of model precision; (b) Comparison of model recall; (c) Comparison of mAP@75; (d) Comparison of mAP@50:95.
Applsci 15 07460 g010
Figure 11. Recognition results of pointer meter reading.
Applsci 15 07460 g011
Figure 12. Recognition results of low-quality meter images.
Applsci 15 07460 g012
Table 1. Comparison of performance indicators of different models.
No.ModelClassPrecision
(%)
Recall
(%)
mAP@50
(%)
mAP@75
(%)
mAP@50:90
(%)
Weight Size
(MB)
Parameter
(MB)
FLOPs
1YOLOv8nall97.799.698.896.283.76.311.48.1
base95.599.198.193.10.762
pointer99.9199.599.50.918
2YOLOv9mall9899.798.395.685.340.820.076.5
base95.999.497.09278
pointer99.9199.599.292.7
3YOLOv10nall97.599.798.595.783.25.810.38.2
base95.398.997.592.175.7
pointer99.9199.599.492.2
4YOLOv11nall97.799.798.89683.45.510.36.3
base96.299.398.292.576
pointer1199.499.492.5
5YOLOv11sall97.899.698.796.585.019.29.4121.3
base95.899.297.993.677.4
pointer99.9199.599.492.6
6YOLOv11-OBBall98.199.799.198.788.76.110.66.6
base96.299.498.798.188.1
pointer1199.599.489.3
Table 2. Comparison of speed performance of different models.
ModelPreprocess
(ms)
Inference (ms)Postprocess
(ms)
Total
(ms)
FPS
YOLOv8n0.50.80.82.1476
YOLOv9m0.53.90.85.2192
YOLOv10n0.51.90.21.7588
YOLOv11n0.50.90.82.2454
YOLOv11s0.51.60.82.9345
YOLOv11-OBB0.51.62.44.5222
Table 3. Pointer meter reading recognition results (normal condition).
No.vvLεNo.vvLε
10.8150.816751.60.1094%239.459.49973100.4973%
20.4750.474221.6−0.049%249.49.48564100.8564%
30.4750.474221.6−0.049%259.39.35447100.5447%
40.14750.147170.16−0.206%269.59.57793100.7793%
50.14750.146840.16−0.412%279.359.38994100.3994%
60.14750.147140.16−0.225%288.48.44358100.4358%
70.14750.148210.160.4438%298.48.41409100.1409%
80.14750.147390.16−0.069%308.458.55788101.0788%
90.13250.132710.160.1312%318.258.36464101.1464%
100.13250.132240.16−0.163%328.258.34174100.9174%
112.42.42996100.2996%335.35.2646510−0.3535%
120.13250.131410.16−0.681%345.455.4072710−0.4273%
130.0860.086640.160.4%355.15.0862710−0.1373%
140.0860.086690.160.4313%362.352.3005710−0.4943%
150.0860.086370.160.2313%372.42.3585410−0.4146%
160.0840.083920.16−0.05%382.42.3230910−0.7691%
170.0460.045590.16−0.256%392.32.31063100.1063%
180.0440.042860.16−0.712%402.52.4689410−0.3106%
190.0450.043950.16−0.656%412.42.3540710−0.4593%
200.04250.041830.16−0.419%422.32.30689100.0689%
210.0450.043720.16−0.8%432.52.4731210−0.2688%
220.04450.043390.16−0.694%442.452.4229510−0.2704%
Avg0.41568%
Table 4. Meter recognition errors for blurred, darkness, overexposure, and tilted images.
GroupNo.vvv′ − vLε
Original Image10.810.816750.006751.60.422%
20.0860.086370.000370.160.231%
35.25.16308−0.0369210−0.369%
Blurred Image10.810.79725−0.012751.6−0.797%
20.0860.086460.000460.160.288%
35.25.16158−0.0384210−0.384%
Darkness Image10.810.817810.007811.60.488%
20.0860.086560.000560.160.35%
35.25.16155−0.0384510−0.385%
Overexposure Image10.810.818110.008111.60.507%
20.0860.086330.000330.160.206%
35.25.16986−0.0301410−0.301%
Tilted Image10.810.818600.00861.60.538%
20.0860.086270.000270.160.169%
35.25.19130−0.008710−0.087%
Disclaimer/Publisher’s Note: The statements, opinions and data contained in all publications are solely those of the individual author(s) and contributor(s) and not of MDPI and/or the editor(s). MDPI and/or the editor(s) disclaim responsibility for any injury to people or property resulting from any ideas, methods, instructions or products referred to in the content.

