1. Introduction
In response to combating climate change and satisfying the requirements of sustainable development, countries are rapidly moving to renewable energy sources like solar power, which is converted using photovoltaic (PV) panels into electric energy [
1]. The development of PV systems is crucial for nations to take advantage of the fact that solar energy is accessible in many regions of the world [
2]. The European Commission has established goals for renewable energy, which will likely result in improvements to existing technology and the introduction of whole new approaches. The target is for 32% of total energy consumption to come from renewable sources by the end of the decade and a remarkable 100% by 2050 [
3]. The move to clean energy sources is becoming critical due to rising environmental concerns, and solar technology has achieved significant advancements and has made continuous attempts to improve photovoltaic technology. In order to maximize the effectiveness of solar power generation systems in response to changing environmental conditions, accurate parameter extraction from PV models is required.
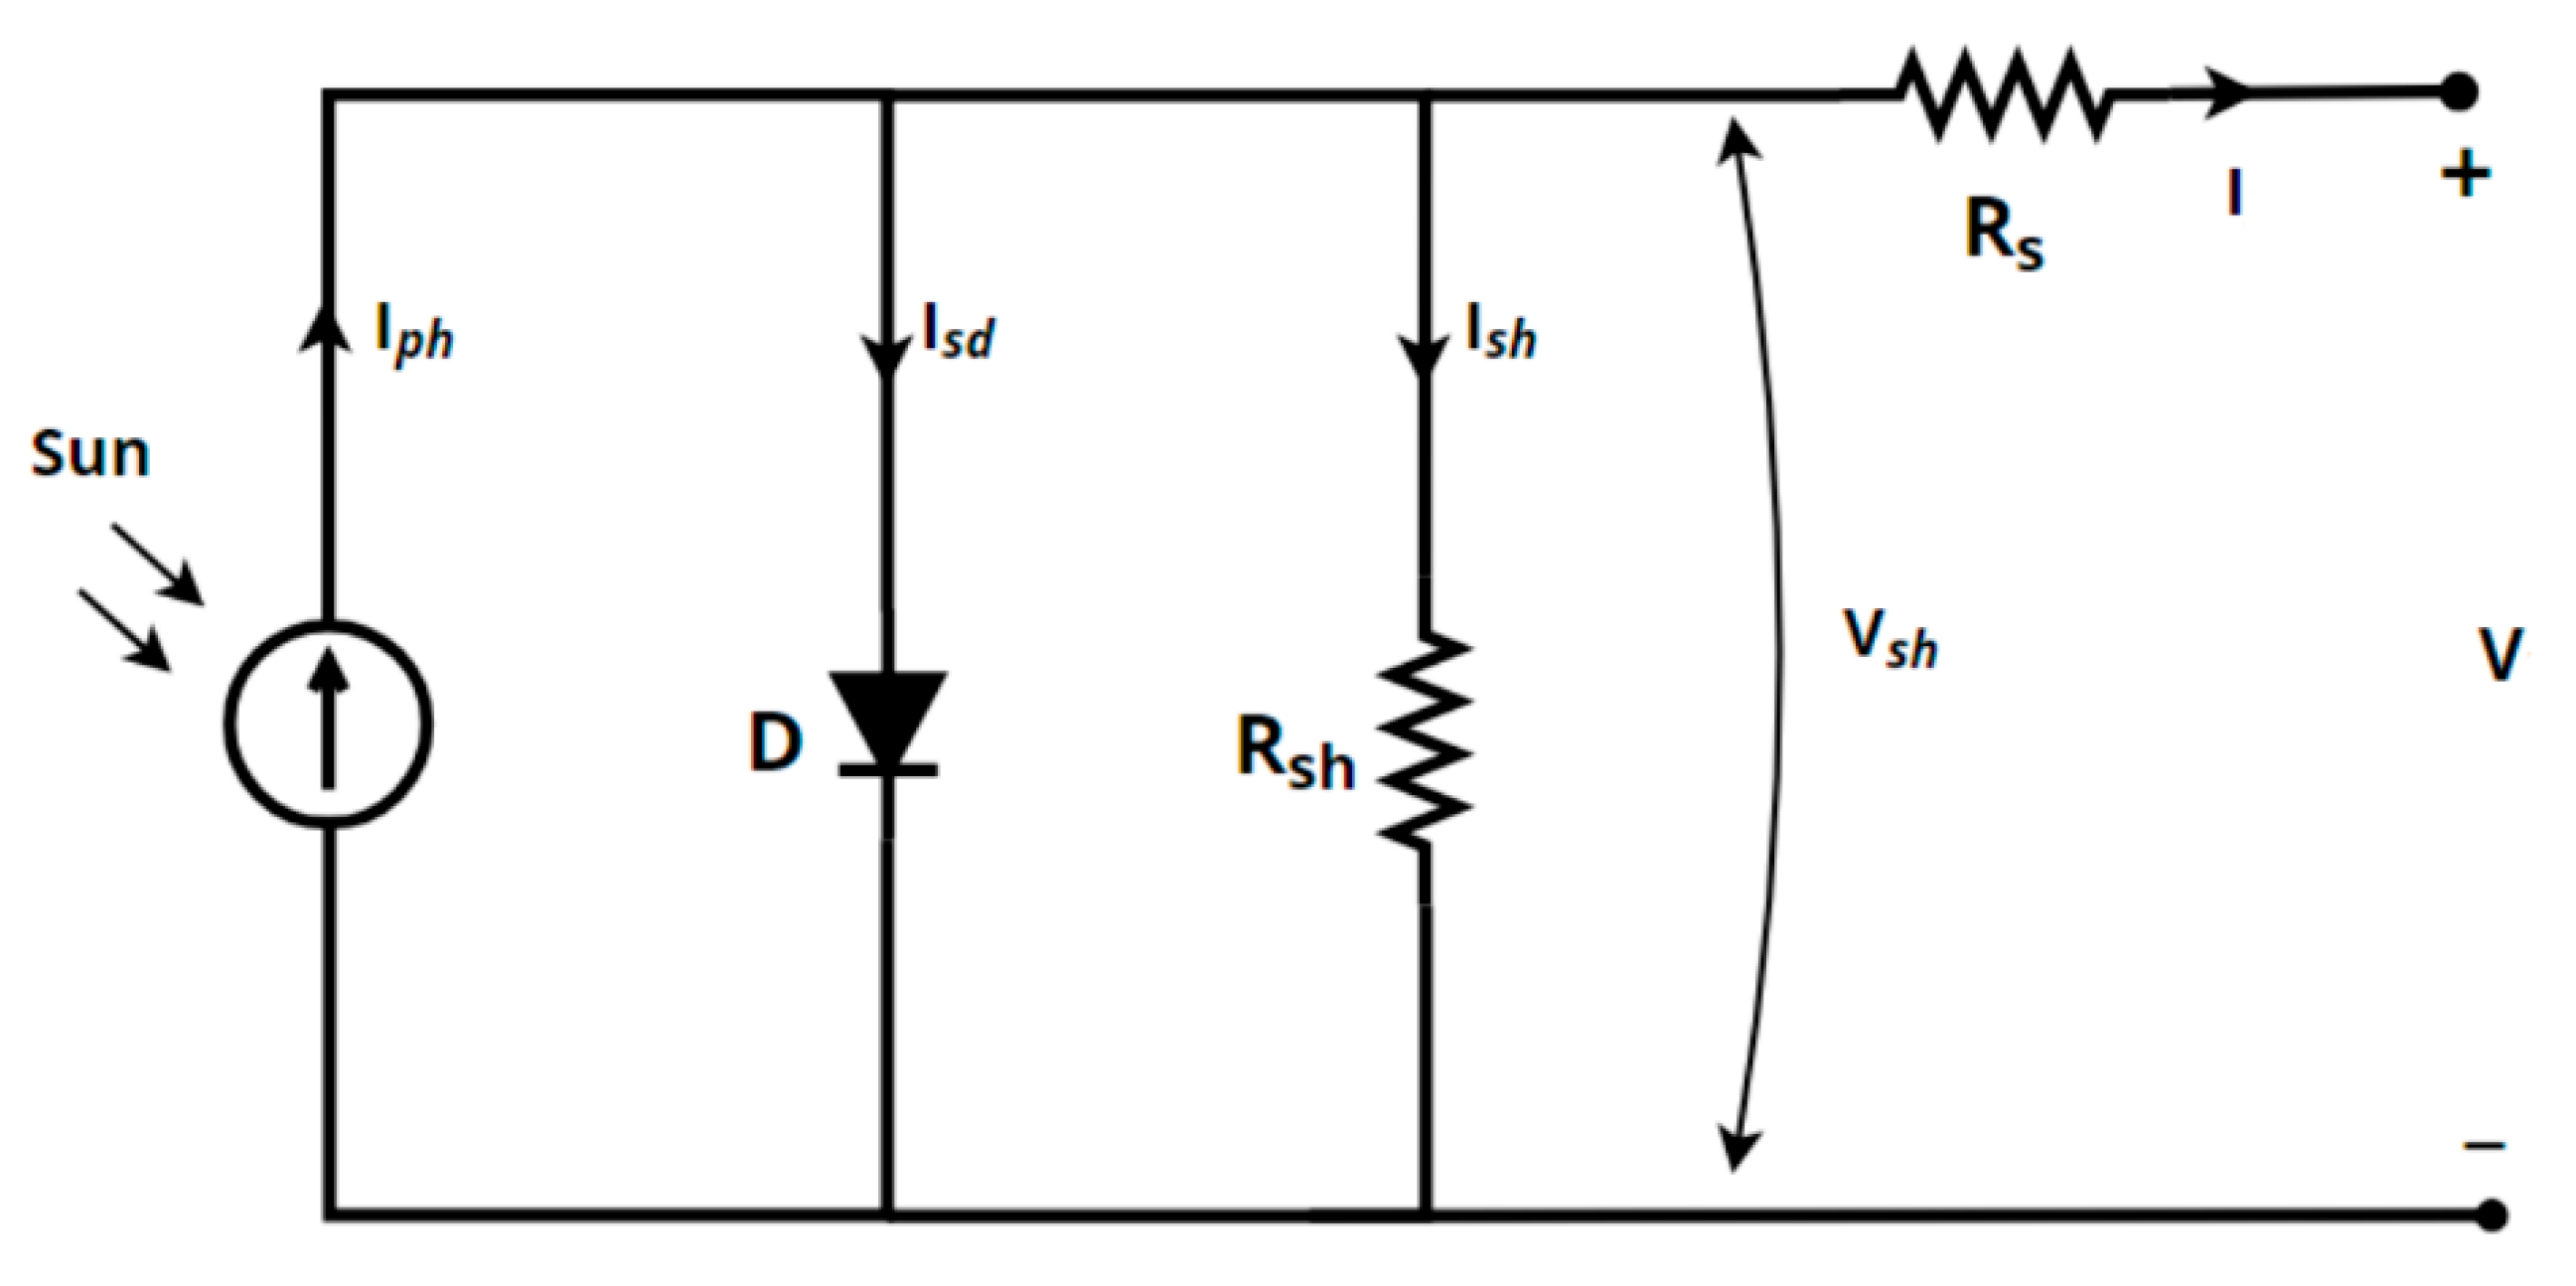
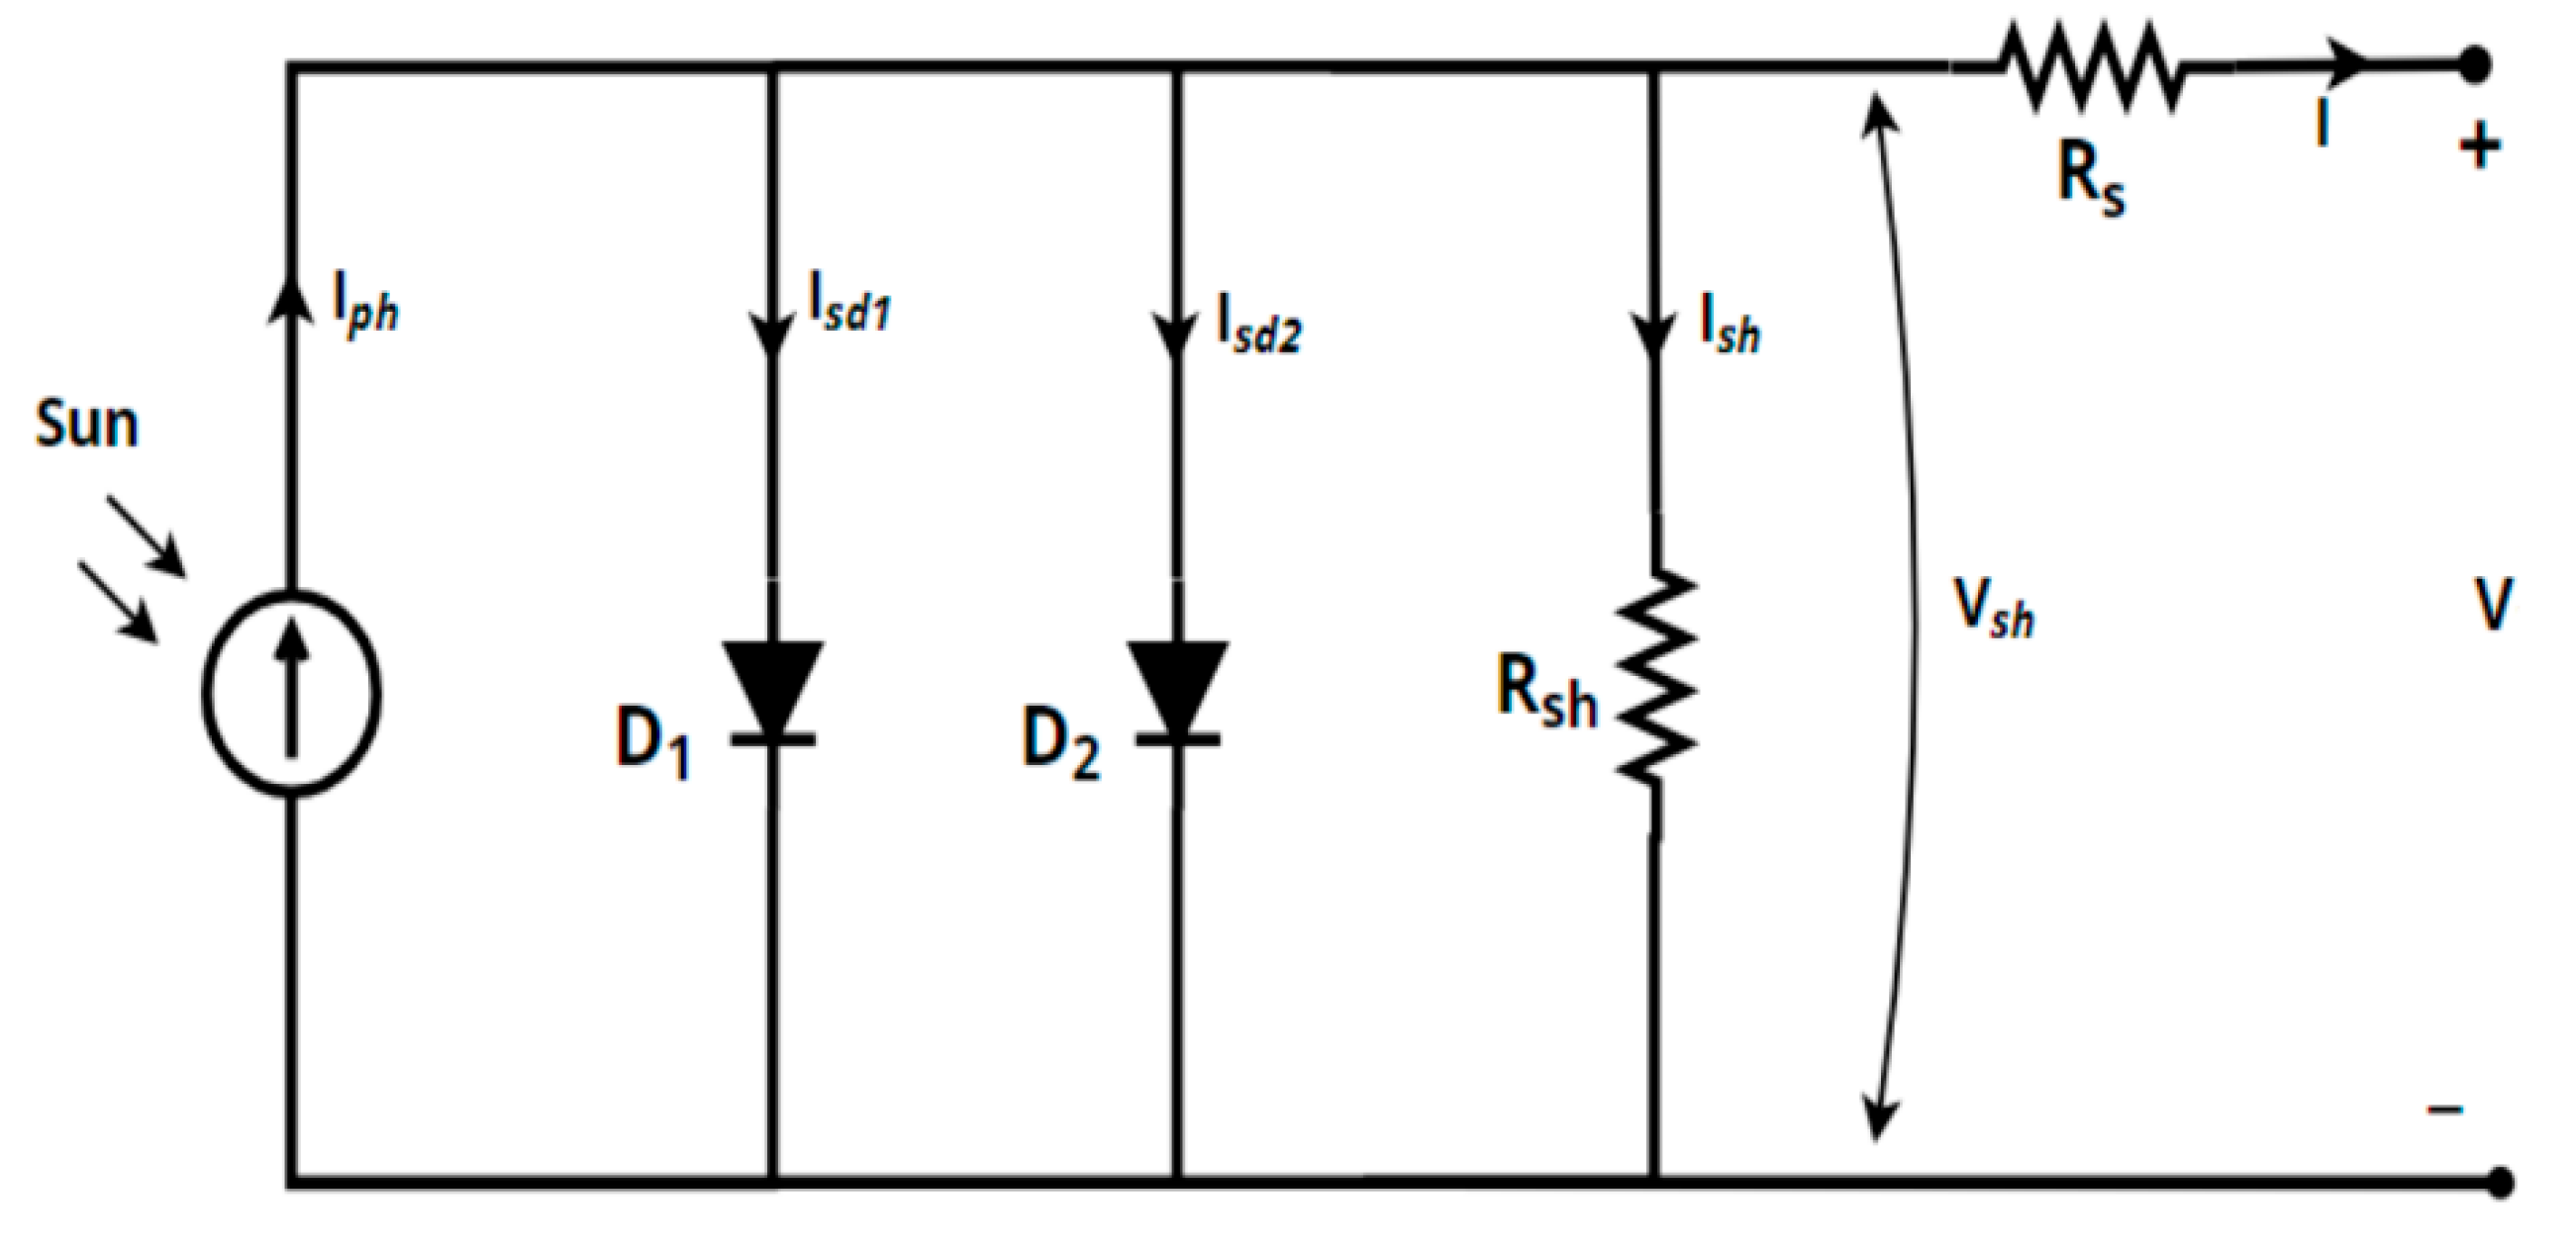
“Parameter extraction” refers to identifying the key electrical parameters such as series resistance, shunt resistance, diode ideality factor, photocurrent, and saturation current in the single- and double-diode photovoltaic models, based on current–voltage (I–V) characteristics. Both analytical methods using complicated equations and metaheuristic algorithms have been used in this field. Both are especially useful when dealing with difficult issues like parameter extraction [
4,
5].
Analytical methods provide a basic strategy, but they are extremely assumption-dependent. However, metaheuristic algorithms, such as genetic algorithms, perform very well when faced with complicated problems and do not require derivatives [
6]. Improvements in clean energy technologies are made possible by combining these analytical methods and metaheuristic algorithms to release photovoltaic systems’ full potential [
7].
To illustrate the broader effectiveness of metaheuristic techniques in energy optimization problems, the War Strategy Optimization (WSO) algorithm has been successfully applied to optimal power flow in wind-integrated systems, achieving significant reductions in electricity generation costs and voltage fluctuations [
8].
Although metaheuristic algorithms have many potential benefits, they can also have limitations, including a slower convergence rate and a higher calculation time [
9]. The pros and cons of the various approaches to parameter extraction are addressed in a review by Cotfas et al. [
10]. Further information on these powerful optimization methods is provided by later review publications that categorize metaheuristic algorithms and their alternatives [
11,
12].
While this study centers on photovoltaic systems, the importance of accurate modeling and parameter estimation extends across energy technologies. For instance, Zhao et al. [
13] emphasized how structural understanding and redox behavior critically affect performance in sodium-ion batteries—highlighting the universal relevance of precise parameter extraction in optimizing next-generation energy systems.
Despite extensive research in the domain of parameter optimization for photovoltaic systems, key challenges persist that limit the real-world applicability of existing algorithms. One notable issue is the computational intensity required for many of these algorithms to function optimally; they often necessitate large populations, a high number of iterations, and extended computational time [
14,
15,
16,
17,
18]. This is particularly problematic as photovoltaic systems continue to grow in complexity, raising questions about the scalability and efficiency of current optimization techniques.
This paper introduces a PID-based search algorithm (PSA) that directly addresses these limitations [
19]. Inspired by PID control systems, PSA is engineered for efficiency, balancing both population size and the number of iterations to significantly reduce computational time. In tests involving both single- and double-diode models across six types of photovoltaic cells and panels, PSA has demonstrated not only effective scalability but also improved efficiency, making it well-suited for complex, real-world applications. Importantly, PSA requires fewer parameters to be configured, making it well-suited for real-world applications.
PID controllers are widely used in control systems due to their simplicity, robustness, and effectiveness in correcting dynamic system deviations in real time. These properties make them well-suited as a foundation for optimization strategies. In the proposed PSA, the proportional, integral, and derivative components are reinterpreted as metaheuristic tuning mechanisms that adaptively adjust the exploration–exploitation balance. This control-inspired structure helps guide the search process more efficiently toward optimal solutions. By incorporating feedback-driven corrections instead of relying purely on stochastic behavior, PSA offers a more structured and dynamically responsive alternative to traditional metaheuristics, improving both convergence speed and robustness against stagnation.
Another prevalent challenge in the existing literature is the susceptibility of optimization algorithms to local minima [
20,
21,
22]. Many algorithms, while designed to seek optimal solutions, often converge to suboptimal points due to this limitation. PSA counters this challenge through its inherent resistance to disturbances and fluctuations, which allows it to avoid being stuck in local minima. The PID-inspired search mechanism in PSA ensures a more robust convergence to the global optimum, thereby elevating its efficacy over algorithms that are prone to local minima. Additionally, the PSA features a zero-output mechanism that adapts the search to prevent becoming stuck in local optima by using Lévy flight in a probabilistic manner. In order to improve convergence towards the global optimum in later steps, the Lévy flight enables the PSA to progressively shift focus towards the phase of exploitation despite larger diversity in the search space during earlier steps.
The PSA’s performance is evaluated through comparisons with twenty-six leading parameter extraction algorithms, each known for achieving optimal root mean square error (RMSE) in PV applications. However, computational efficiency and execution time scalability are the main weaknesses of the majority of these algorithms. To address these issues, this study significantly reduces execution time and iterations by using smaller population sizes under optimal RMSE. This will be achieved by determining preliminary error values outside the main iterative loop, hence providing a benchmark for further calculations in the incremental PSA. The PSA also applies a mechanism of zero-output with Lévy flight that self-tunes probabilistically to avoid entrapment in local optima, which helps to enhance the efficiency of search and solution quality.
Among the algorithms considered for comparison, the improved version of the snake optimization algorithm (ISOA) achieves a perfect balance between exploring and exploiting, proving possibilities with fewer variables and fewer iterations [
23]. Reduced complexity makes it simpler to put into practice. While ISOA has optimized exploration–exploitation balance and accuracy, ISOA requires a high execution time to find the optimal RMSE, which took around 20.6 to 26.9 s per simulation to obtain the optimal RMSE value in the case of SDMs of the RTC France. For the RTC France DDM, it took around 26.87 s to reach the optimal RMSE.
The improved simultaneous heat transfer search algorithm (ISHTS) demonstrates a high level of accuracy in PV parameter estimation because the balance between exploration and exploitation has been enhanced using simultaneous heat transfer along with elitist perturbation strategies, resulting in an optimal RMSE [
24]. The algorithm operates efficiently at 50,000 iterations. However, while ISHTS is highly accurate and optimizes the exploration phase to achieve the optimal RMSE value, it requires substantial processing time, with an average execution time of about 23 s per simulation for SDMs and DDMs.
The black widow optimization algorithm (BWOM), which takes its inspiration from the aggressive behaviors of black widow spiders, has certain distinct advantages over other optimization algorithms by using the cannibalism strategy and mating and reproduction mechanism. However, BWOM requires a higher number of search agents in order to obtain the optimal solution [
25].
The enhanced generalized normal distribution optimization (NSGNDO) algorithm performs a balance between exploration and exploitation by means of neighborhood search strategies, which realize high accuracy in the PV parameter estimation [
26]. In SDMs, NSGNDO achieves an optimal RMSE in 10,000 iterations and completes simulations in about 22 s. In DDMs, it is where NSGNDO yielded an optimal RMSE at about 38 s per run. However, in cases that are very large or highly nonlinear search spaces, the NSGNDO may face a long execution time. That is, the dual neighborhood search strategies make each iteration more complicated, possibly reflecting longer optimization times for high-dimensional problems.
The gaining–sharing knowledge-based algorithm (GSK) proves to be advantageous due to its high accuracy and efficiency when it comes to extracting parameters for solar PV systems [
27]. To achieve a good balance between exploration and exploitation, the GSK algorithm employs a pair of crucial stages known as the “junior” and “senior” phases. However, the iteration in the case of SDMs is 30,000, and the iteration in the case of DDMs is 50,000, both of which resulted in a significant amount of computing time.
Improved shuffled complex evolution algorithm (ISCE) has major advantages include a basic yet effective global search, reliable performance, and less unpredictability [
28]. This was performed by using the competitive complex evolution and reflection and contraction steps. However, when dealing with complicated situations that have multiple local low points, ISCE takes longer to make progress. ISCE achieved the optimal RMSE in the case of SDMs with 5000 iterations completing in approximately 19 s, while in the case of DDMs, it achieved an optimal RMSE with 10,000 iterations, averaging 24 s per simulation.
The hybrid successive discretization algorithm (HSDA) offers a number of advantages, including increased accuracy and a strong capability for global searching [
29]. This is achieved by using vicinity construction around seed solutions, successive discretization techniques, and adaptive adjustment of search radius. However, these benefits require a lot of processing power to fully realize them.
The DIWJAYA algorithm relies on an improved JAYA with an individual weighting scheme, yielding high precision in PV parameter estimation, balancing between exploration and exploitation due to its adaptive weighting mechanism, population mean inclusions, and a Gaussian mutation strategy [
30]. For the SDM, DIWJAYA reaches an optimal RMSE in 50,000 iterations, completing simulations in approximately 27 s. For the DDM, it achieves an optimal RMSE with reduced convergence times, averaging 30 s per run. While DIWJAYA’s advanced features improve convergence speed and solution quality, its higher iteration demands limit scalability in PV parameter extraction, as the algorithm requires 50,000 iterations to reach the optimal RMSE.
The atomic orbital search algorithm (AOS) is inspired by the quantum atomic model, whose concept is based on the movement of electrons around a nucleus’s orbitals. It employs hypothetical orbital layers and photon absorption and emission to find the best possible solution [
31]. It is a population-based algorithm, and its performance comes from the fact that it can find the best global solutions quickly and with fewer iterations.
A memory-based improved gorilla troops optimizer (MIGT), demonstrating outperformance of other metaheuristic algorithms by combining the gorilla memory-saving technique and the explorative gorilla with an adaptive mutation mechanism [
32]. However, the optimization process requires a high number of iterations in order to obtain the optimal solution, including increased computational load due to the memory-saving technique and potential performance fluctuations in high-dimensional PV models.
While parameter extraction in PV systems has been widely studied using metaheuristic algorithms, the current literature still struggles with balancing accuracy, convergence speed, and scalability. The novelty and contributions of the proposed work for extracting parameters of photovoltaic cells and panels are the following:
The work is the first that uses the PID-based Search Algorithm (PSA) to extract parameters for both single- and double-diode models for six types of photovoltaic cells and panels (RTC France, amorphous silicon, and monocrystalline silicon photovoltaic cells, PVM 752 GaAs, and STM6-40 photovoltaic panels). Additionally, multijunction solar cells at three temperatures (41.5 °C, 51.3 °C, and 61.6 °C) were utilized.
The PSA was compared with twenty-six top-performing algorithms and consistently achieved RMSE and MBE levels that are equivalent to or better than the best-performing algorithms. It also proved computationally efficient, requiring a smaller population and faster extraction times, validating its effectiveness for both PV cells and panels.
The PSA’s performance is considerably improved by adjusting the proportion, integral, differential, and beta (β) parameters, aiding the algorithm in both exploration and exploitation phases.
Improving the effectiveness of the PSA by calculating current and historical errors of the deviation signal outside the main iterative loop provides crucial beginning values for the incremental PSA and a solid foundation for further computations.
Implementing a Lévy flight-based zero-output mechanism that allows the PSA to probabilistically adjust to avoid local optima entrapment. This mechanism enables broader search diversity early in the process, whereas λ is decreased over time in order to gradually shift the algorithm’s focus on exploitation in later stages.
The following is the plan for this paper: photovoltaic cell and panel models, statistical tests, problem complexity, and the proposed algorithm are described in
Section 2. Results and discussions are further discussed in
Section 3. Finally, the conclusions and suggestions for further study are presented in
Section 4.
3. Results and Discussion
The strength, efficiency, and accuracy of the algorithm are major factors in the growth and evolution of green energy sources. The extraction of exact parameters from photovoltaic cells and panels is a powerful resource that may help advance the renewable energy sector and lead us to a more sustainable future for the world.
To achieve accurate parameter extraction for PV cells and modules, this section determines how successfully the suggested PSA works. RTC France, amorphous silicon (aSi) and monocrystalline silicon (mSi) photovoltaic cells and panels, multijunction cells (MJS), PVM 752 GaAs, and STM6-40 photovoltaic panels were all used in the experiment. Based on a measured dataset, these PV devices were evaluated using the PSA for SDMs and DDMs. The PSA shows better or at least equivalent results compared to twenty-six of the best-performing algorithms.
Four metrics, including RMSE, MBE, STD, and AE, have been evaluated by comparing them with other top metaheuristic algorithms that have been used to extract the parameters of PV cells and panels to evaluate the performance of the PSA. In terms of improving the manufacturing process for manufacturers, it is crucial to achieve ideal solutions for each device while decreasing computation time. The performance results of the twenty-six comparison algorithms were taken directly from their original studies, using the same datasets and evaluation metrics. While our PSA was fine-tuned for optimal performance, the benchmark results also reflect tuning performed in their respective original papers.
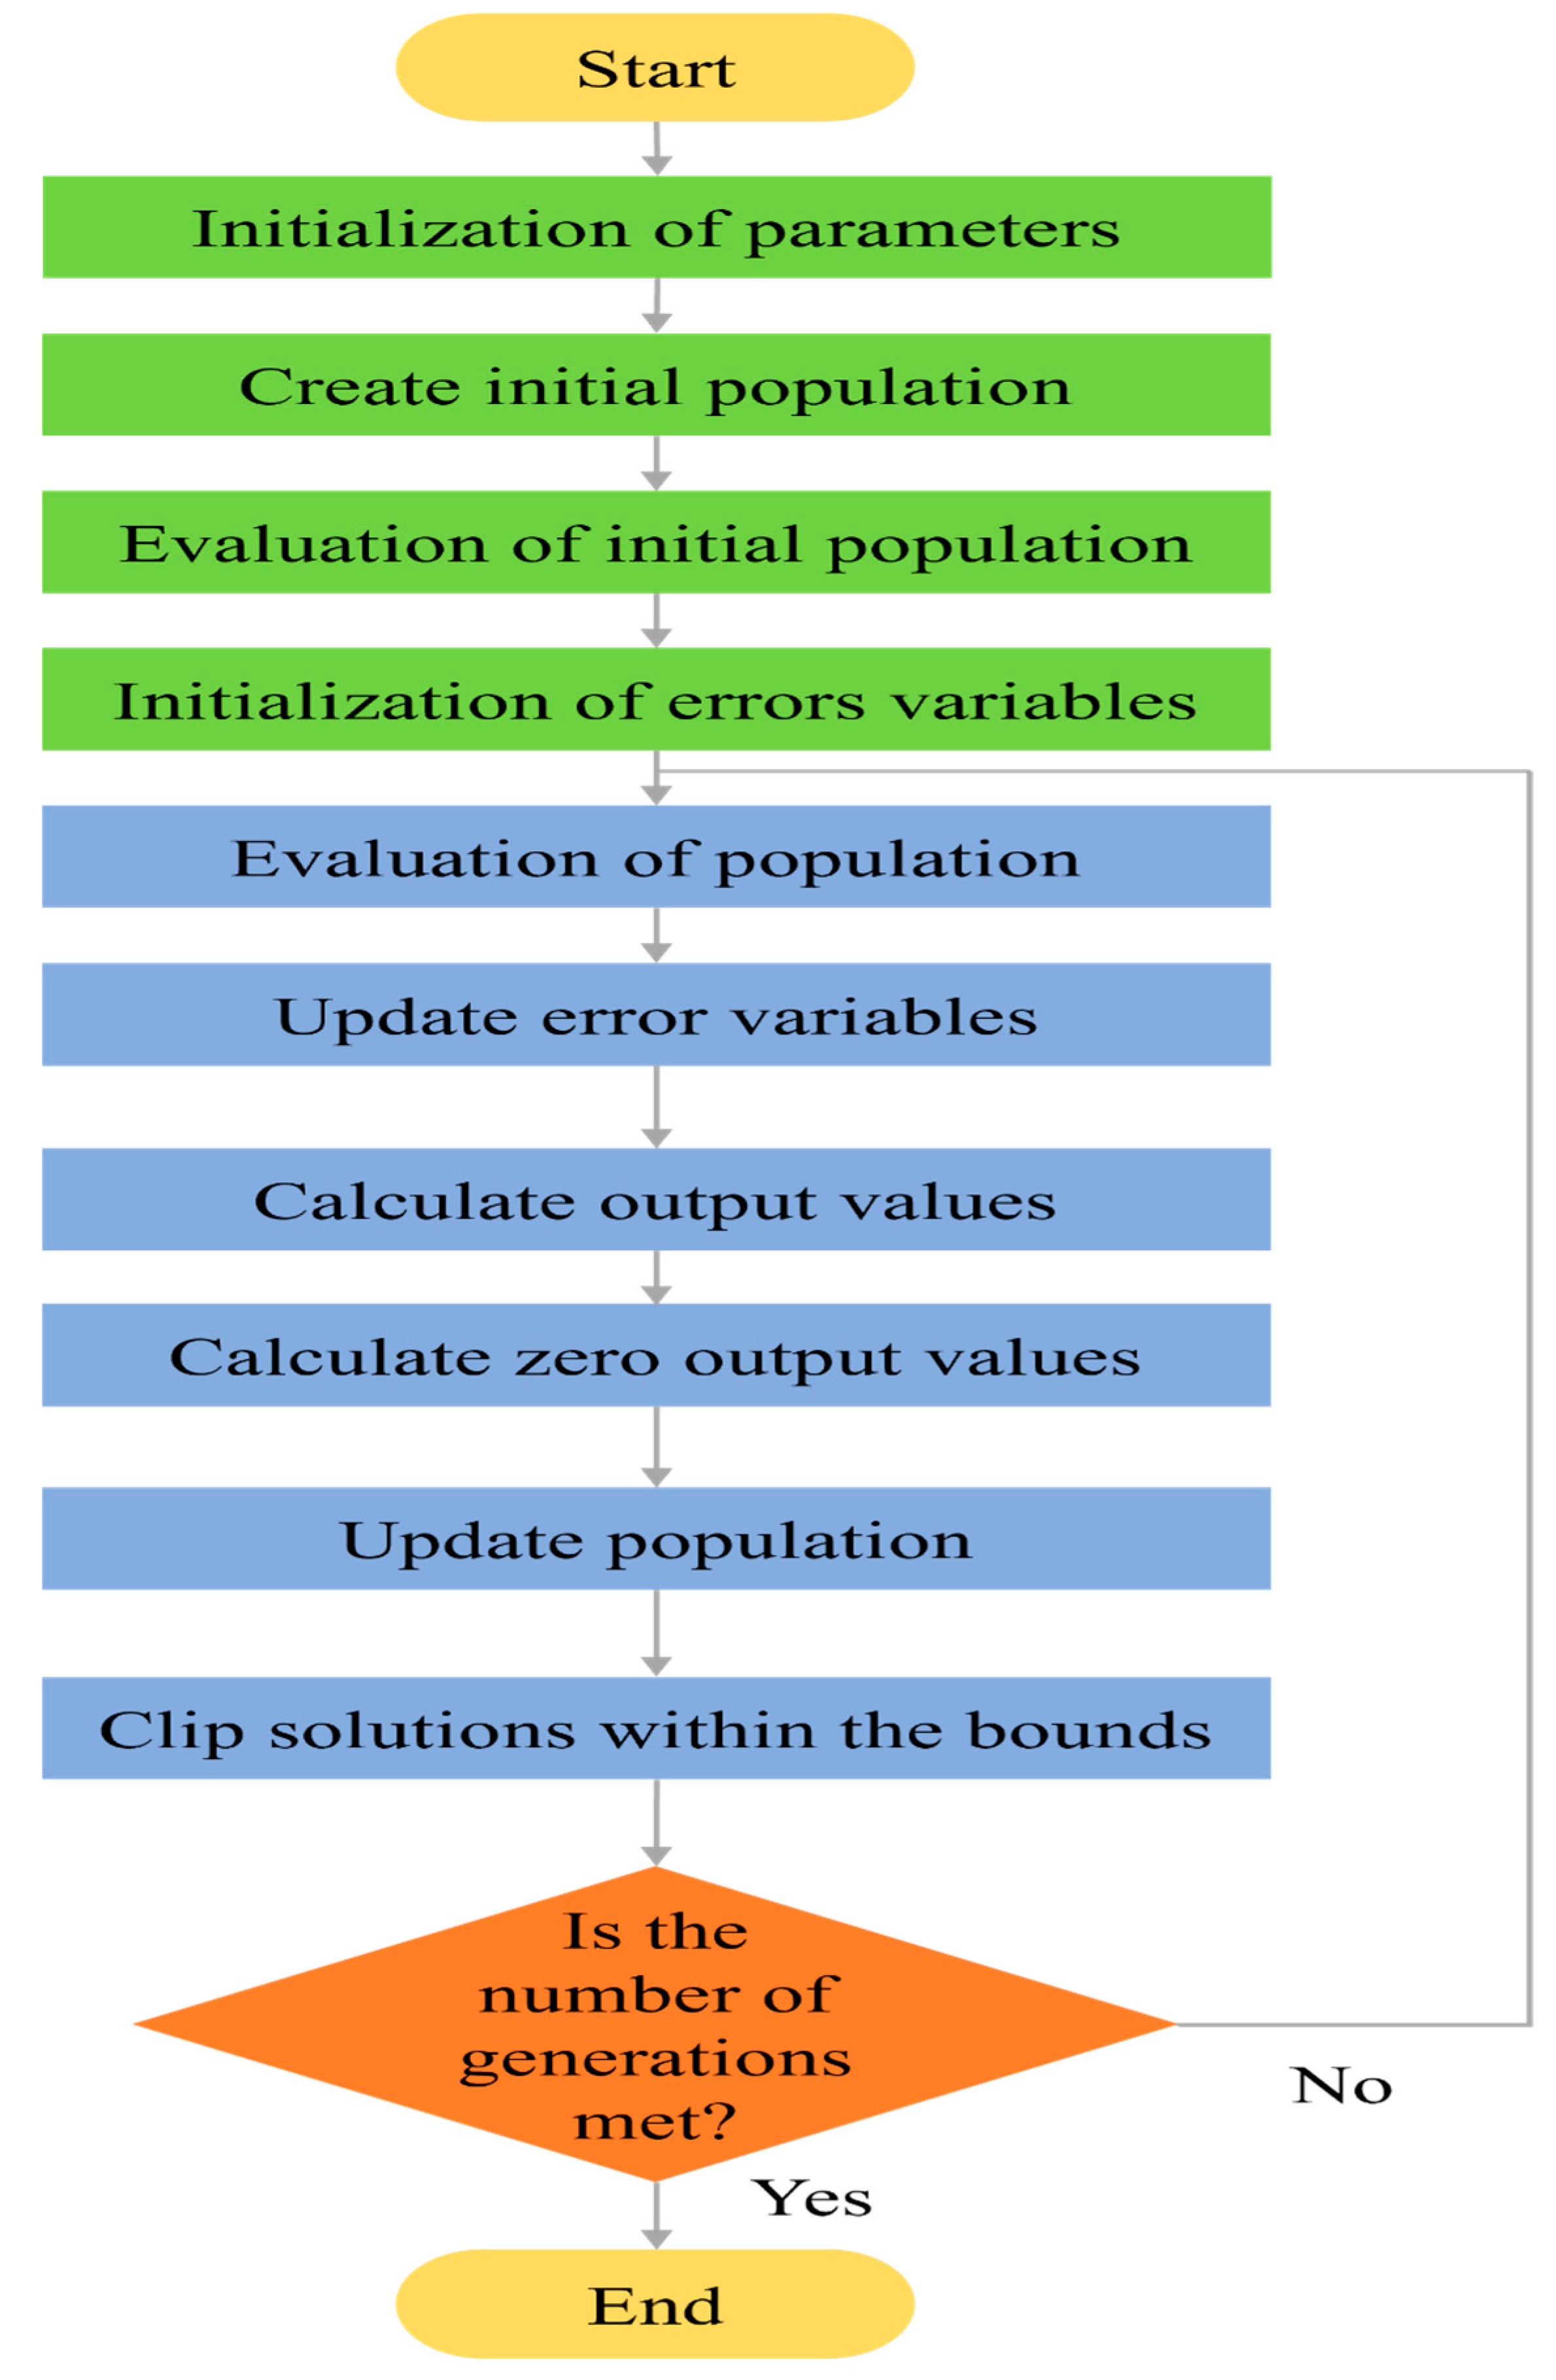
The iteration and population size used for all the tests are 1100 iterations and 100 population sizes. It is significant to know that the PSA leads to better RMSE solutions as the number of iterations increases. This, however, leads to increased computational time. As a result, there is a trade-off between producing better outcomes and requiring more processing resources. In the end, the best combination that led to finding the optimal RMSE value from the first run was 100 population and 1100 iterations. With this iteration and the population size, the PSA provided positive results from its first run. The algorithm’s exploration step was much improved and effectively prevented convergence to local minima, which would otherwise result in less-than-ideal results. All execution times reported in this study include both the initialization phase and the full optimization loop to reflect the complete computational cost of the PSA.
The parameters of the PV cells are provided with their upper and lower bounds in
Table 1, and in
Table 2, the lower and upper bounds applied to the parameters of the PV modules are shown.
3.1. RTC France Cell
The first solar cell being examined is the 57 mm diameter RTC France silicon commercial cell. The majority of studies that extract photovoltaic cell parameters and apply metaheuristic algorithms for the SDMs and DDMs include this specific cell, which has been extensively examined. Although the changes could be slight, they are an essential way to show the new algorithm’s effectiveness and accuracy. At 1000 W/m
2 and 33 °C, the RTC silicon photovoltaic cell’s I–V characteristic is measured. The associated dataset [
34] is shown in
Table S1, and it contains values for the current calculated using the SDMs and DDMs, along with their respective errors.
Both the SDM’s and DDM’s execution times of 3.3512 and 6.5292 s, respectively, are shown in
Table 3, along with the RTC photovoltaic cell parameters retrieved using the PSA. The performance of the proposed algorithm was compared using RMSE, MBE, and STD with BWOA, ISHTS, NSGNDO, ISOA, AOS, HSDA, GSK, DIWJAYA, memory-based improved gorilla troops optimizer (MIGTO) [
32], growth optimizer (GO) [
41], improved marine predators algorithm (IMPA) [
22], improved moth flame algorithms with local escape operators (IMFOL) [
42], modified stochastic fractal search algorithm (MSFS) [
43], a logistic chaotic JAYA algorithm (LCJAYA) [
44], hybrid backtracking search optimization algorithm with differential evolution (DE/BSA) [
45], leveraging the opposition-based exponential distribution optimizer (OBEDO) [
46], and improved differential evolution algorithm (DE) [
47]. As all of them produce the same RMSE value for the SDM, there is almost no difference in RMSE between the PSA and other top-performing algorithms. The RMSE value for the DDM, however, has improved to 0.67% when compared to BWOA and 1.15% when compared to ISOA, which demonstrates that PSA obtained the best RMSE value. Despite this, the RMSE for the DDM produced with the ASO, MSFS, MIGTO, IMFOL, and GSK algorithms is higher than that obtained with the PSA.
In the case of the SDM, because the RMSE values derived from the majority of algorithms are essentially identical, the difference in the retrieved parameters is negligible. This is due to the use of the best algorithms from the specialized literature. Algorithms such as DE and LCJAYA, on the other hand, give limited results because of their tendency to converge to local minima, preventing them from discovering optimal solutions and giving inferior results when compared to other top-performing algorithms for both models. This means that not all the algorithms can obtain the minimum value for RMSE. In this instance, however, the PSA surpasses other algorithms across all statistical tests, as shown in
Table 3. When all retrieved parameters are analyzed for both models using the PSA method, considerable differences can be detected when compared to other algorithms.
In comparison to BWOA, the reverse saturation alteration for the diffusion mechanism is less in the DDM, varying by around 0.28%, but the difference for generation–recombination is high. As a result, it can be concluded that the DDM can accurately match the SDM in terms of parameter extraction and accuracy. Furthermore, the evaluation of all RTC photovoltaic cell parameters and the RMSE, MBE, and STD demonstrates the PSA’s capability to find the optimal solution and avoid hitting local minima.
In comparison to ISOA, both algorithms achieved the same RMSE of 9.8602 × 10⁻⁴; however, PSA yielded a significantly lower mean bias error (MBE) of 9.58 × 10⁻¹¹ compared to ISOA’s −1.57 × 10⁻⁸, indicating greater numerical stability. For the DDM, PSA achieved a better RMSE (9.7078 × 10⁻⁴) than ISOA (9.8215 × 10⁻⁴), as well as a notably reduced MBE (2.31 × 10⁻⁹ vs. −3.62 × 10⁻⁸), confirming its consistency and precision.
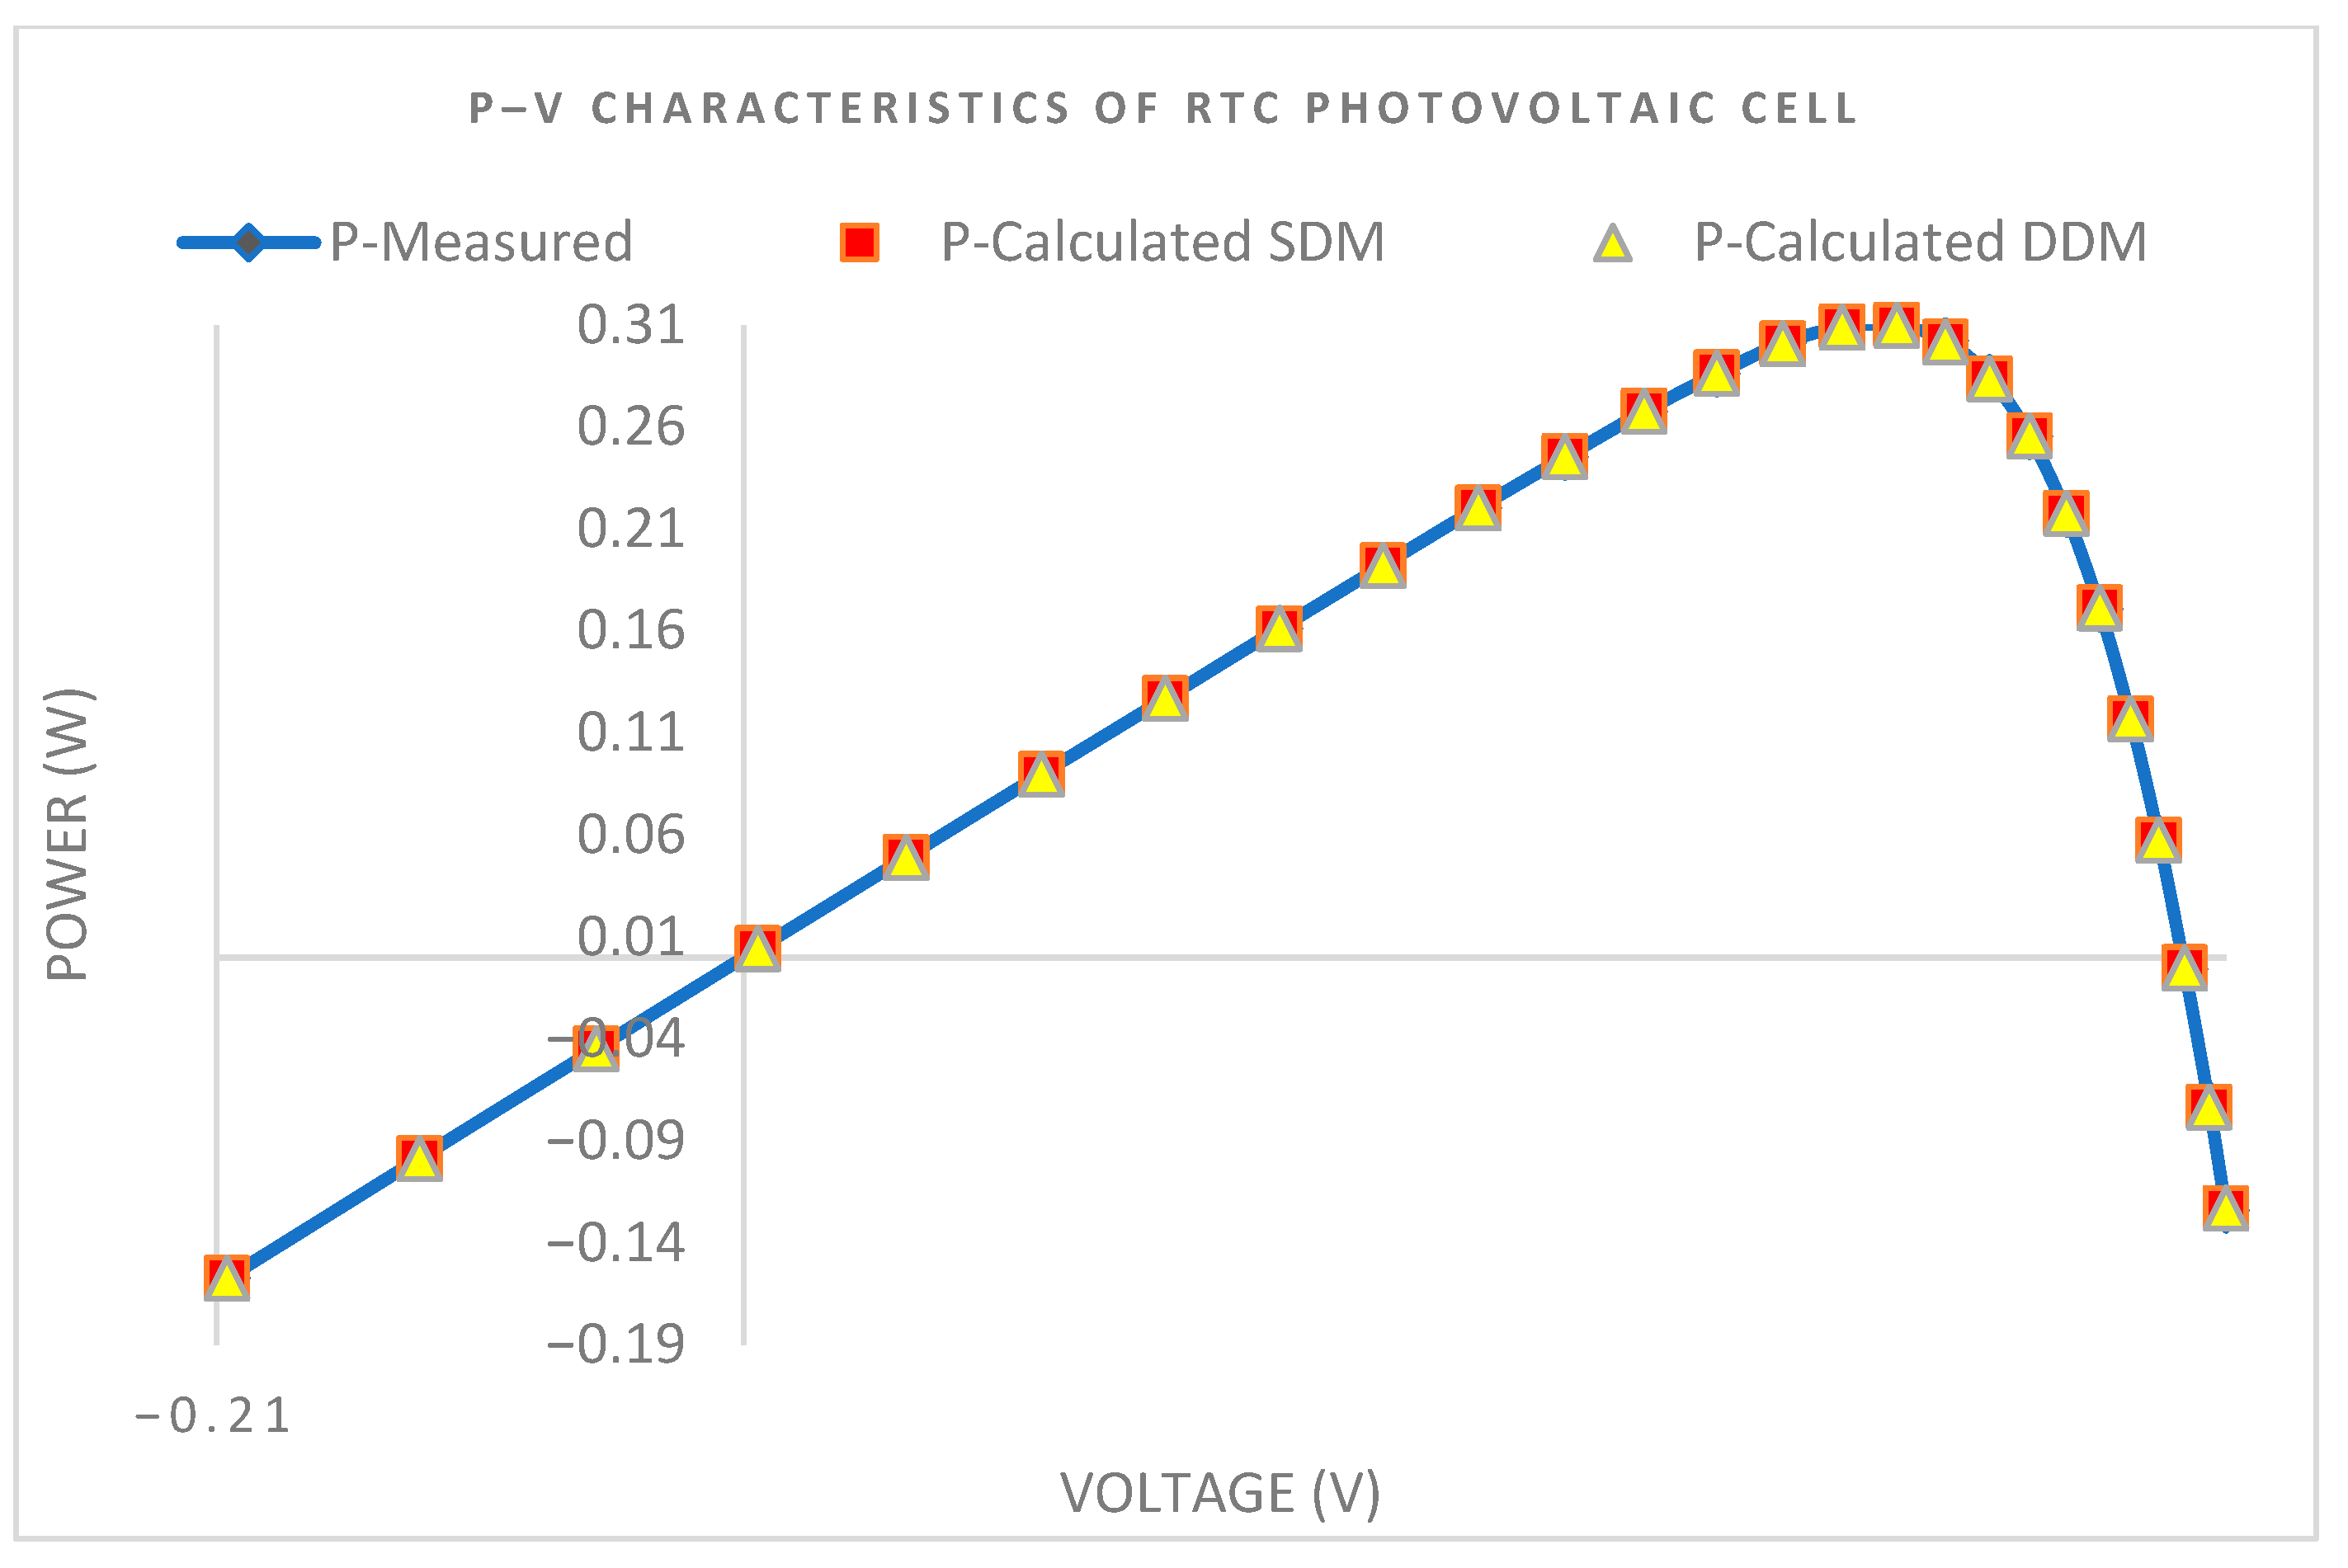
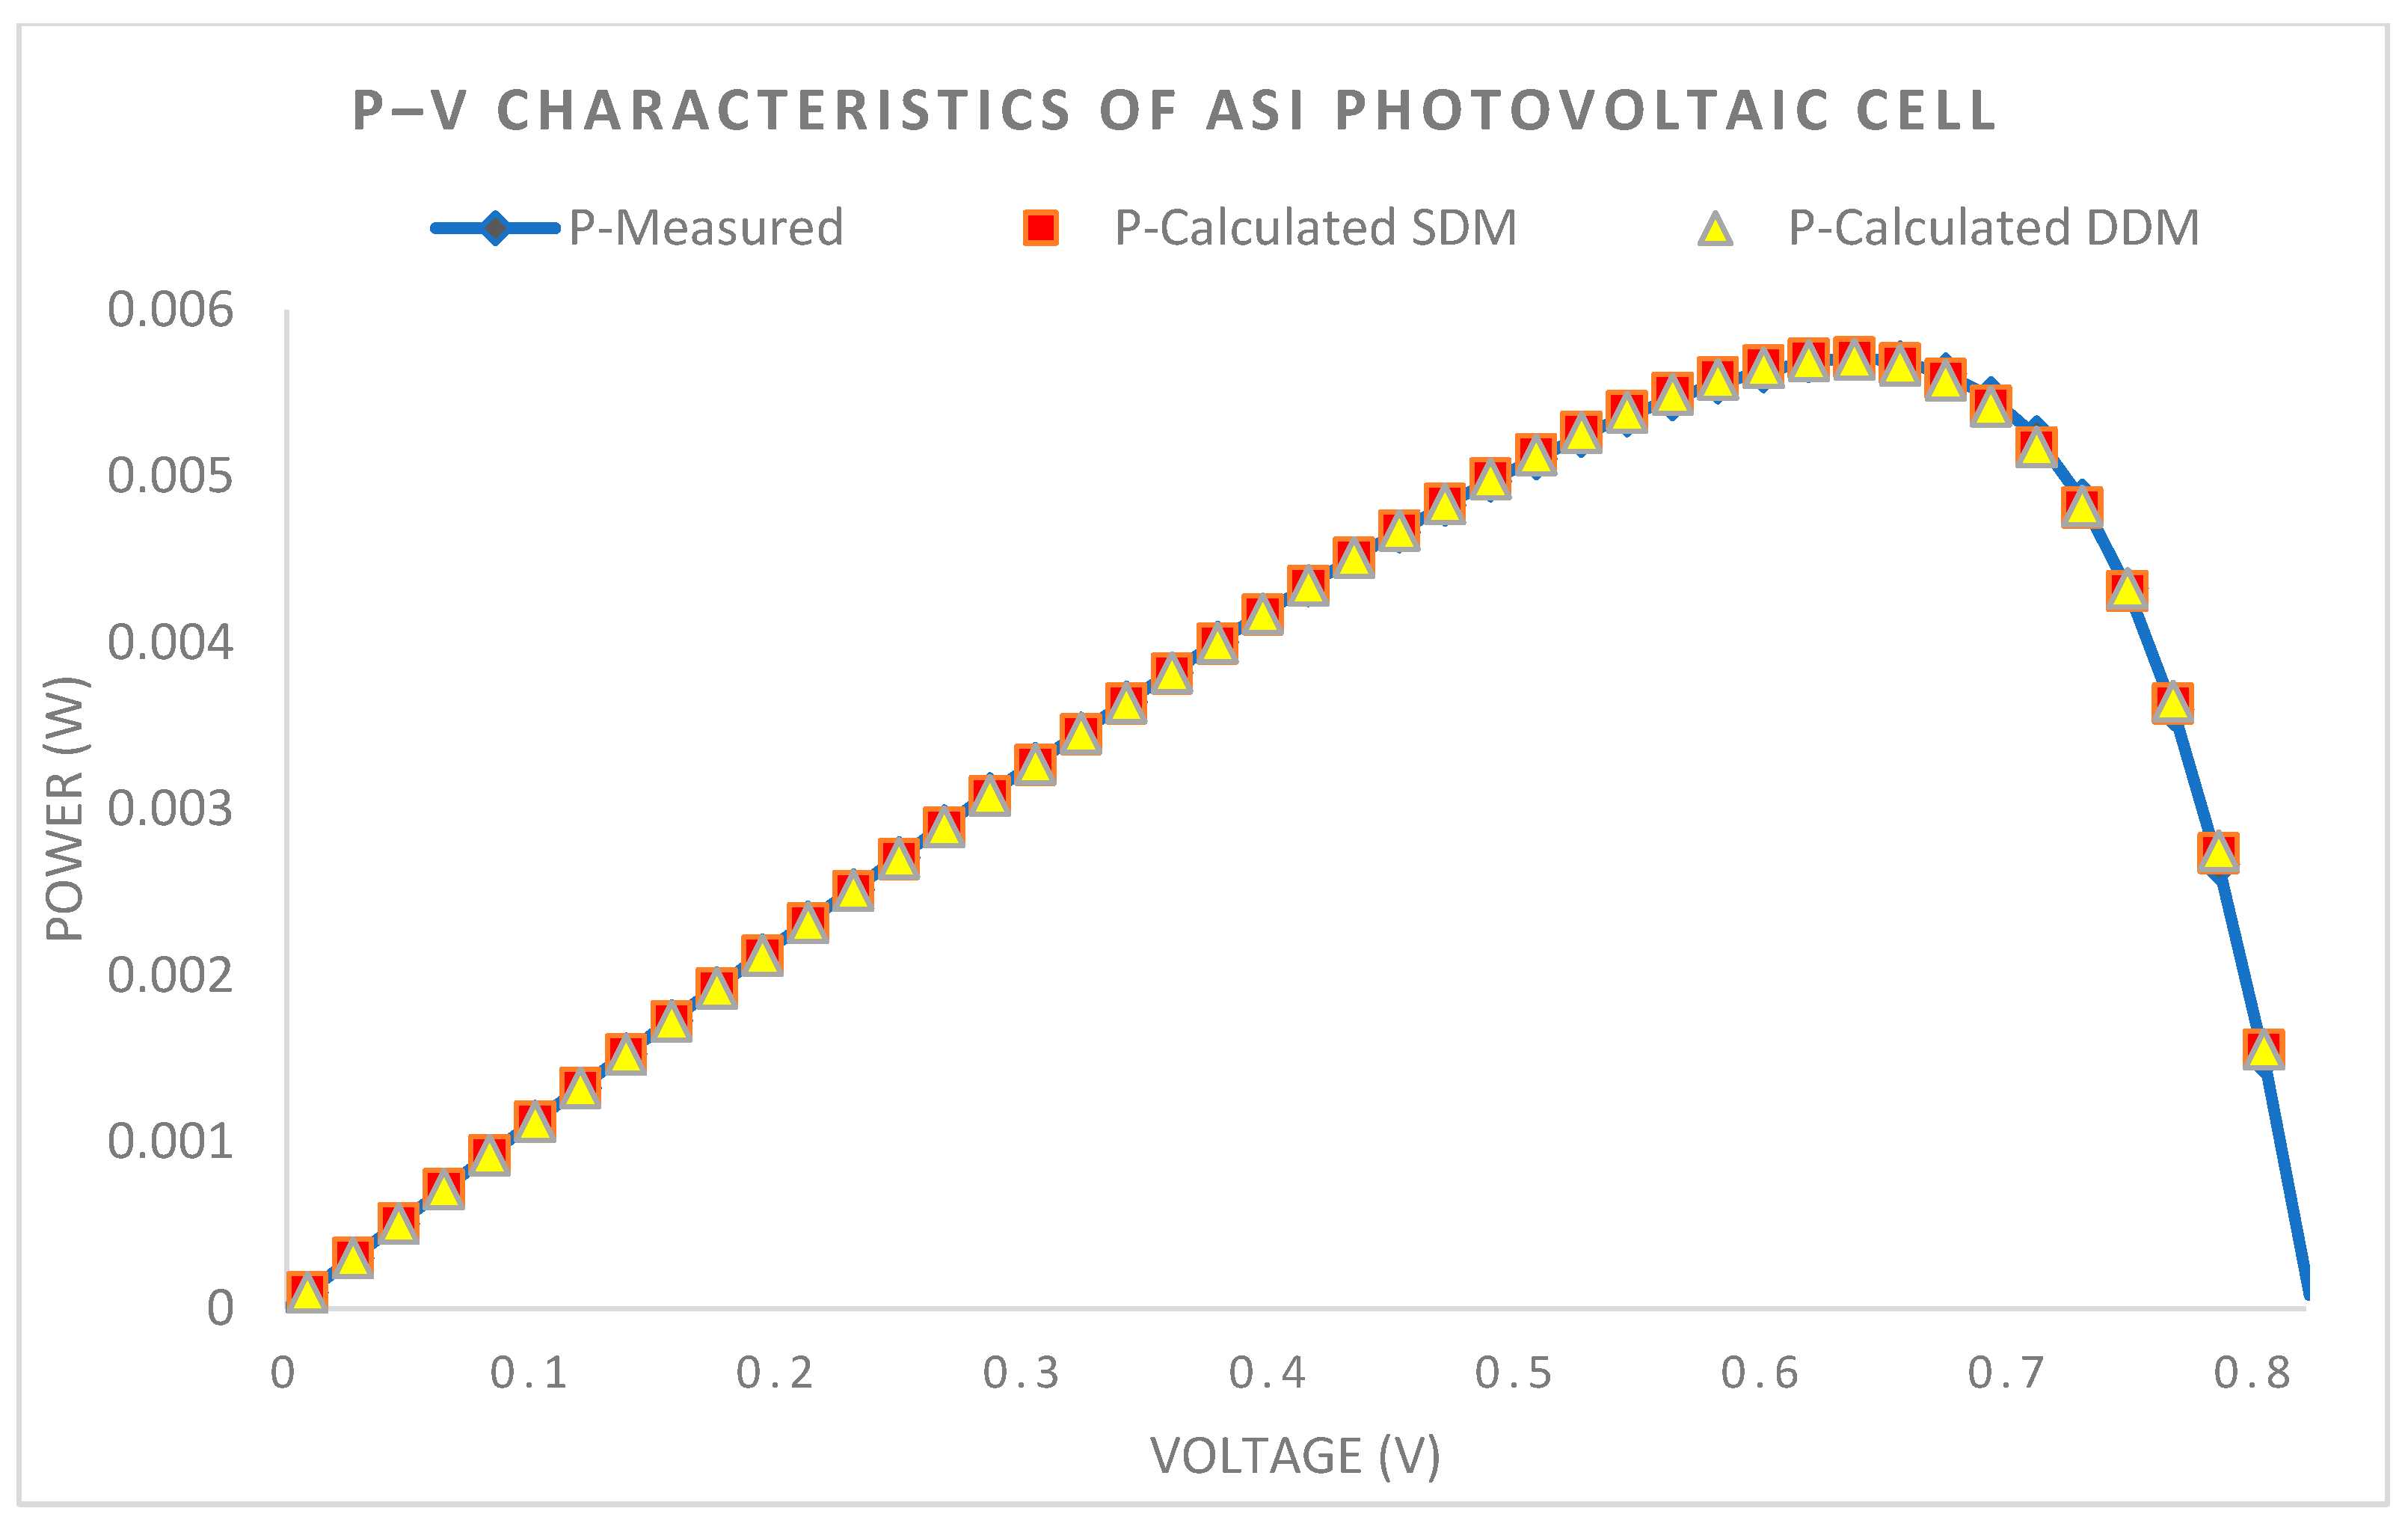
For both the SDMs and DDMs,
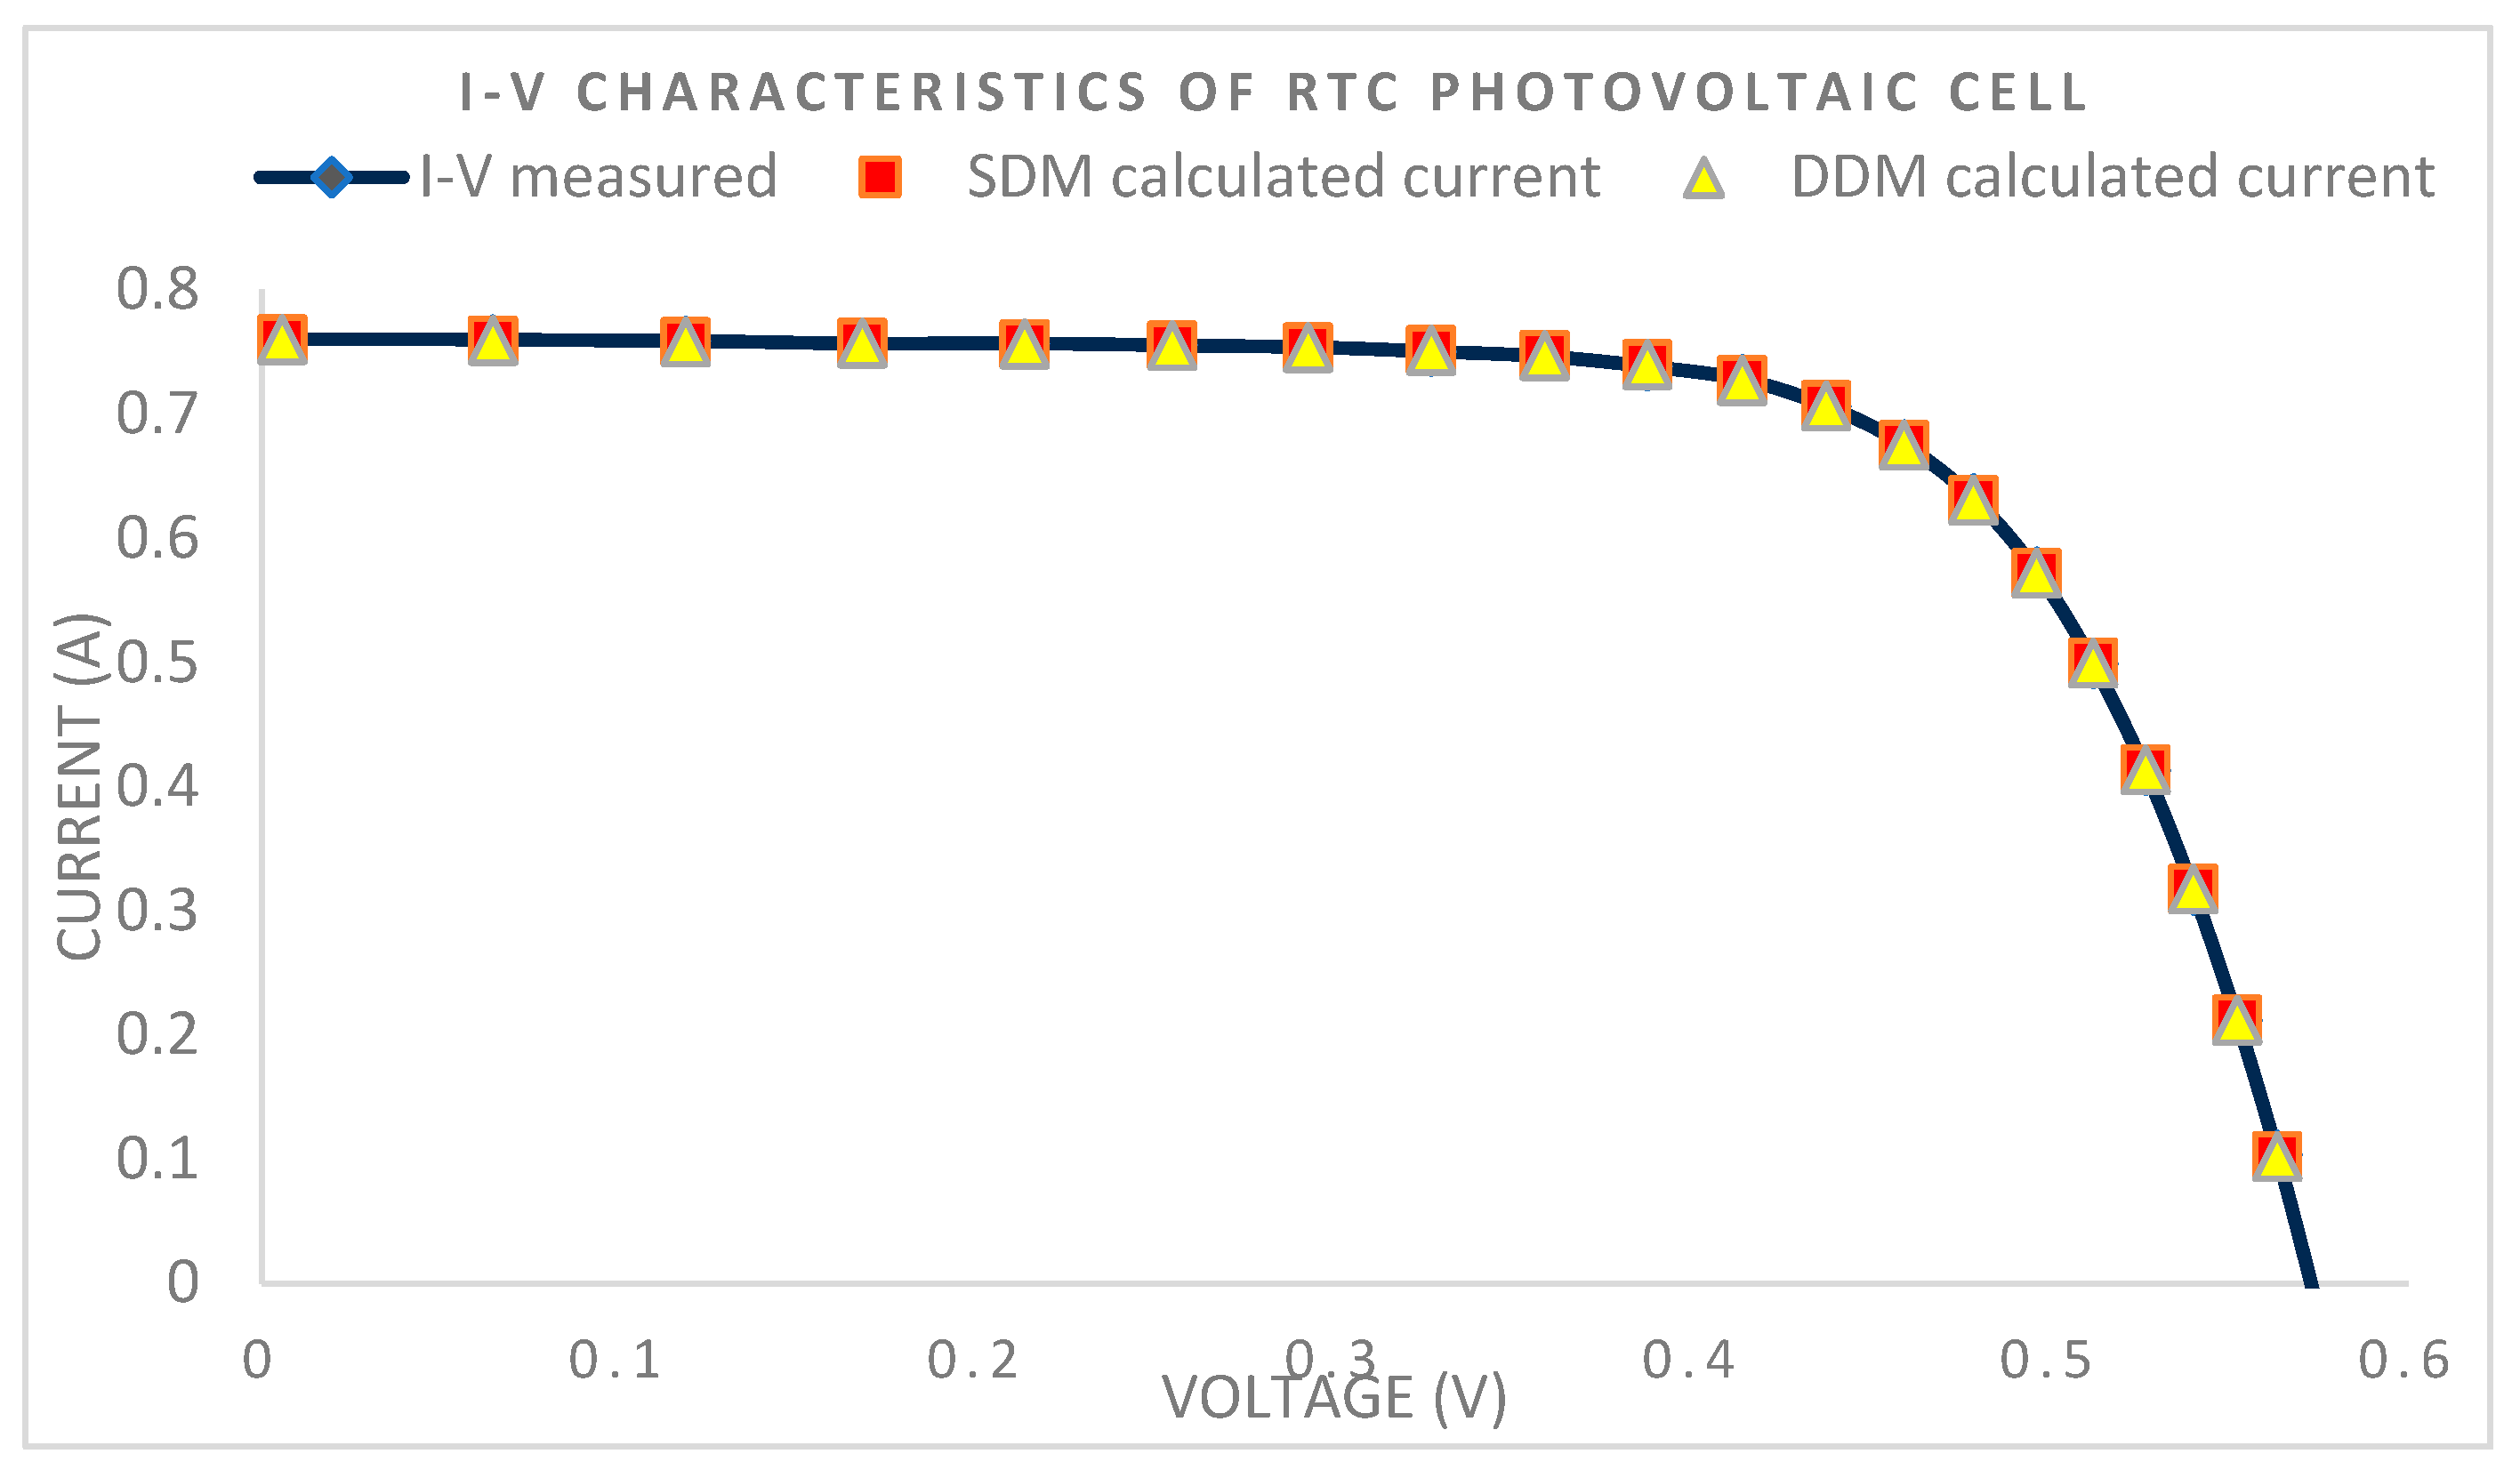
Figure 4 shows how the PSA’s estimated and observed I–V line up, and
Figure 5 displays the P–V characteristics.
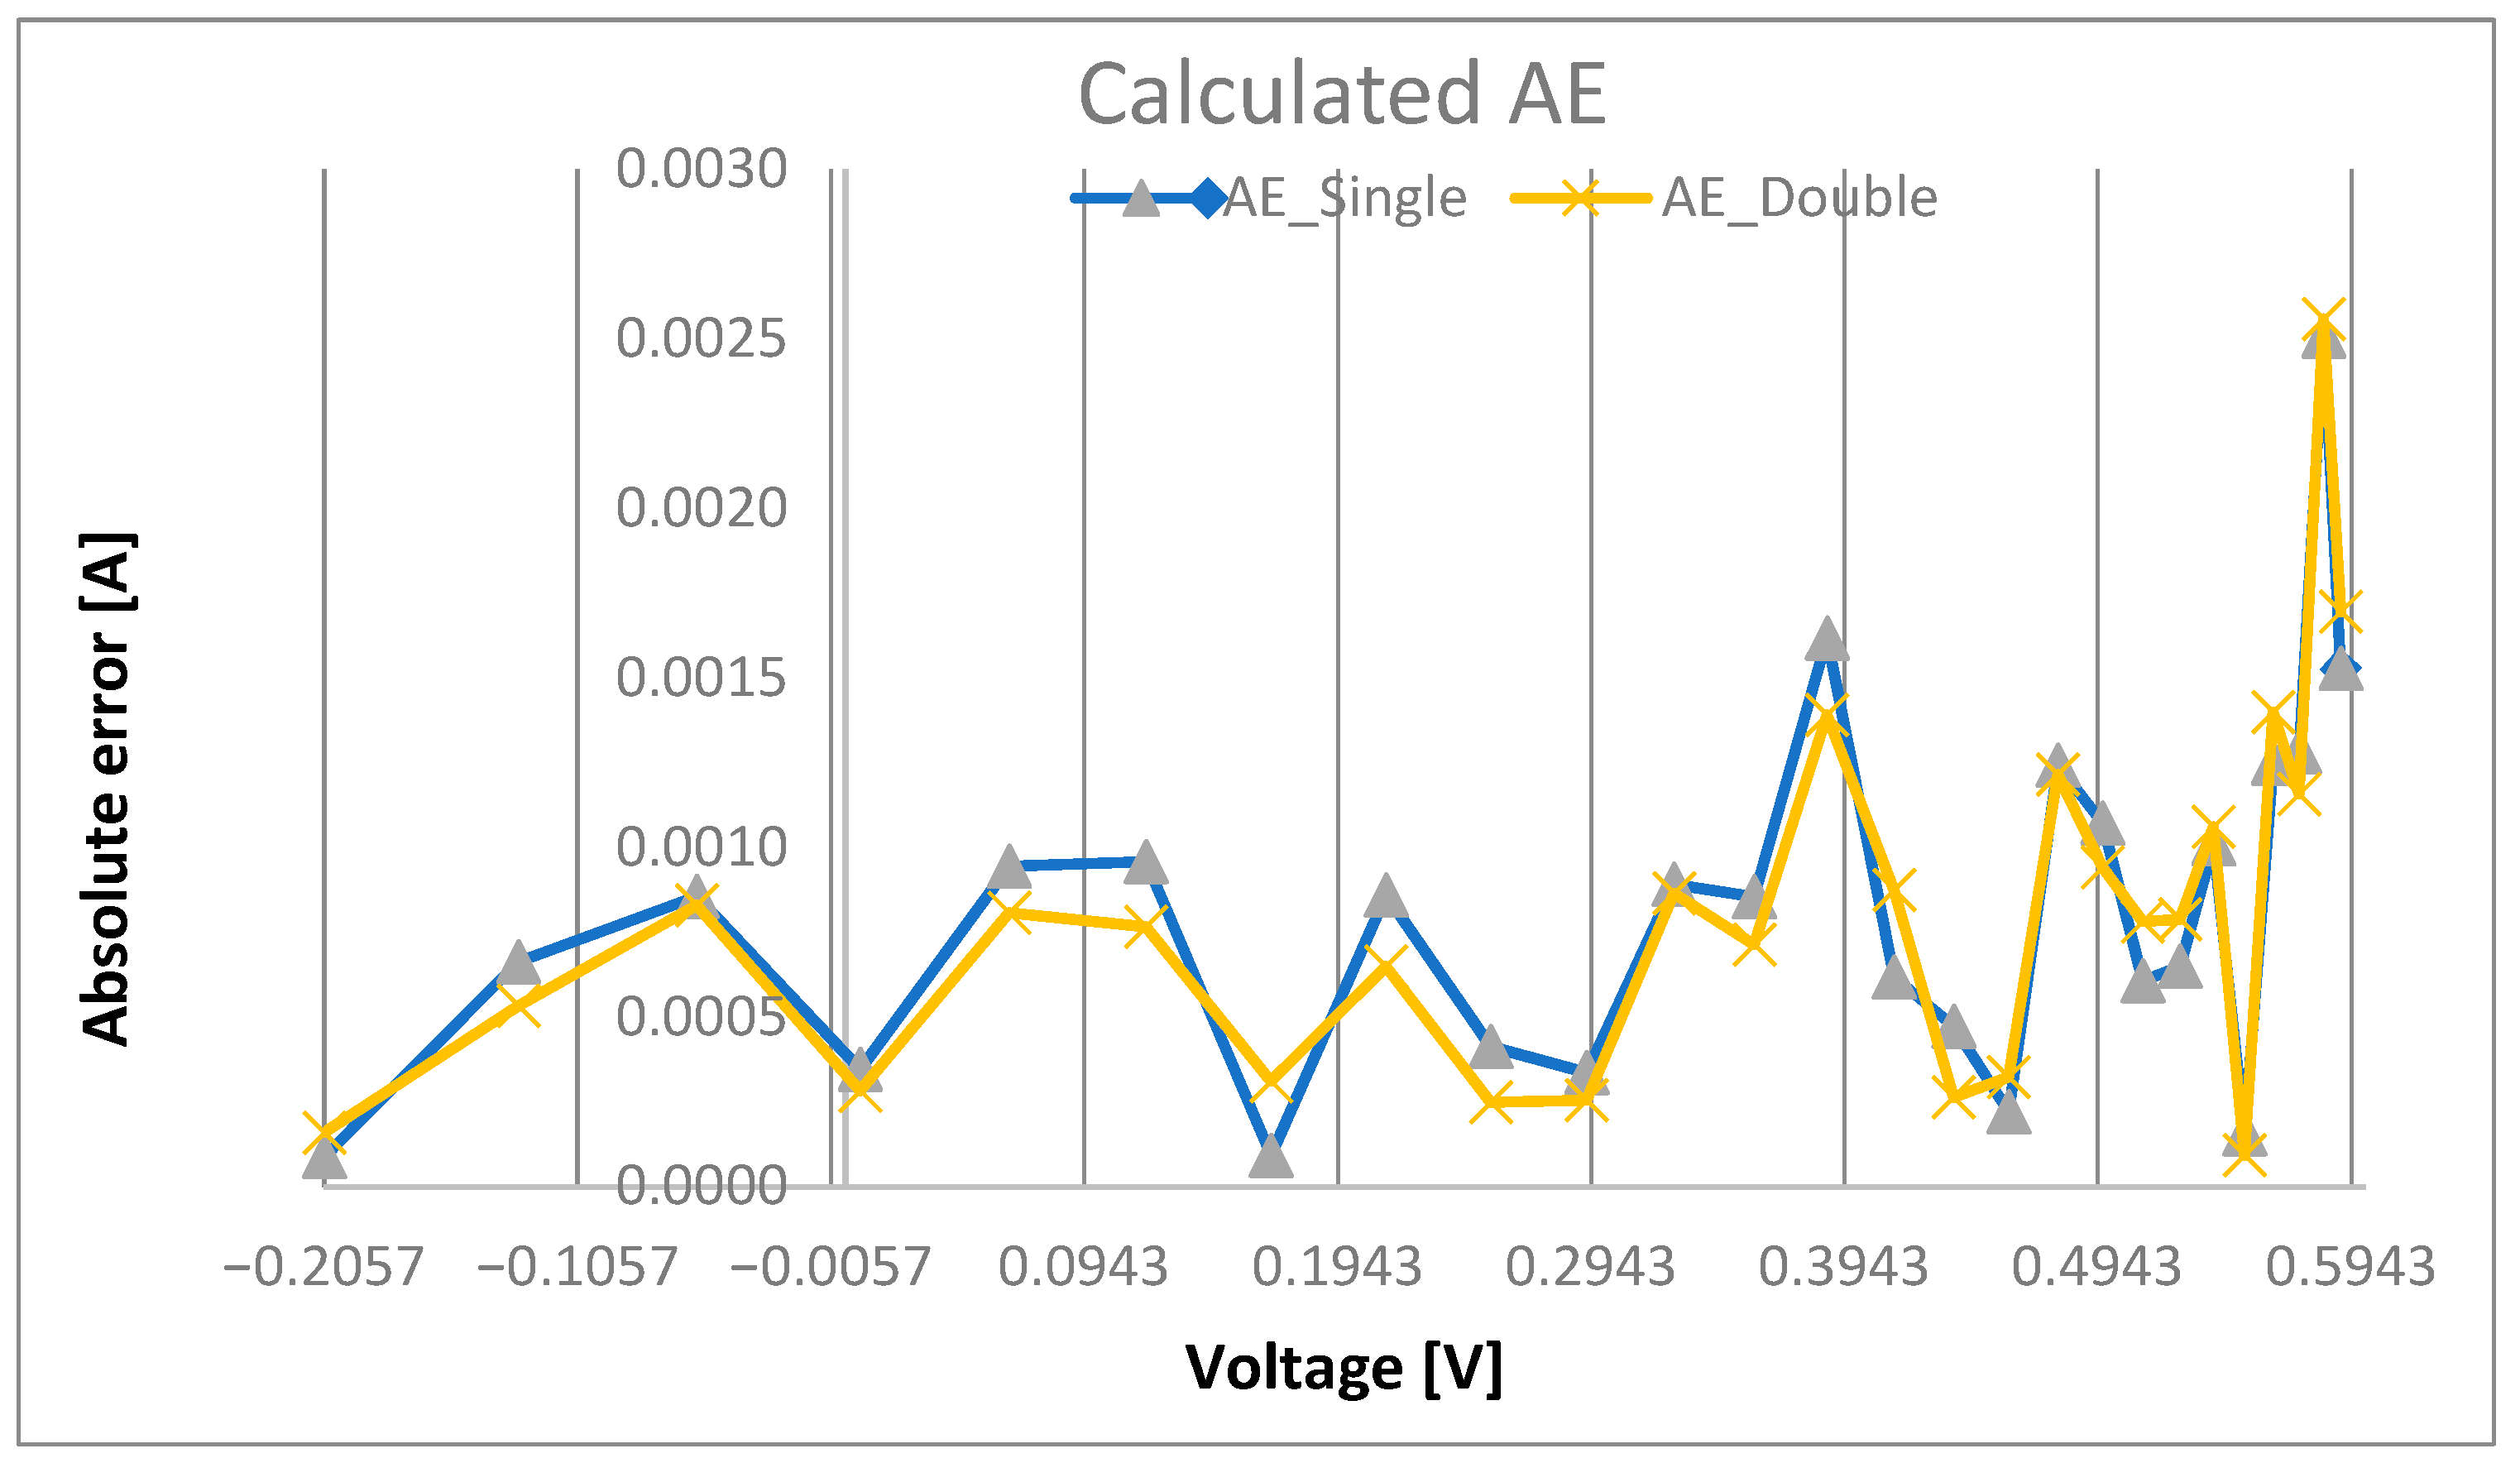
The absolute errors that were calculated by the algorithm, which are the differences between the measured current and the calculated current for both models, are displayed in
Figure 6.
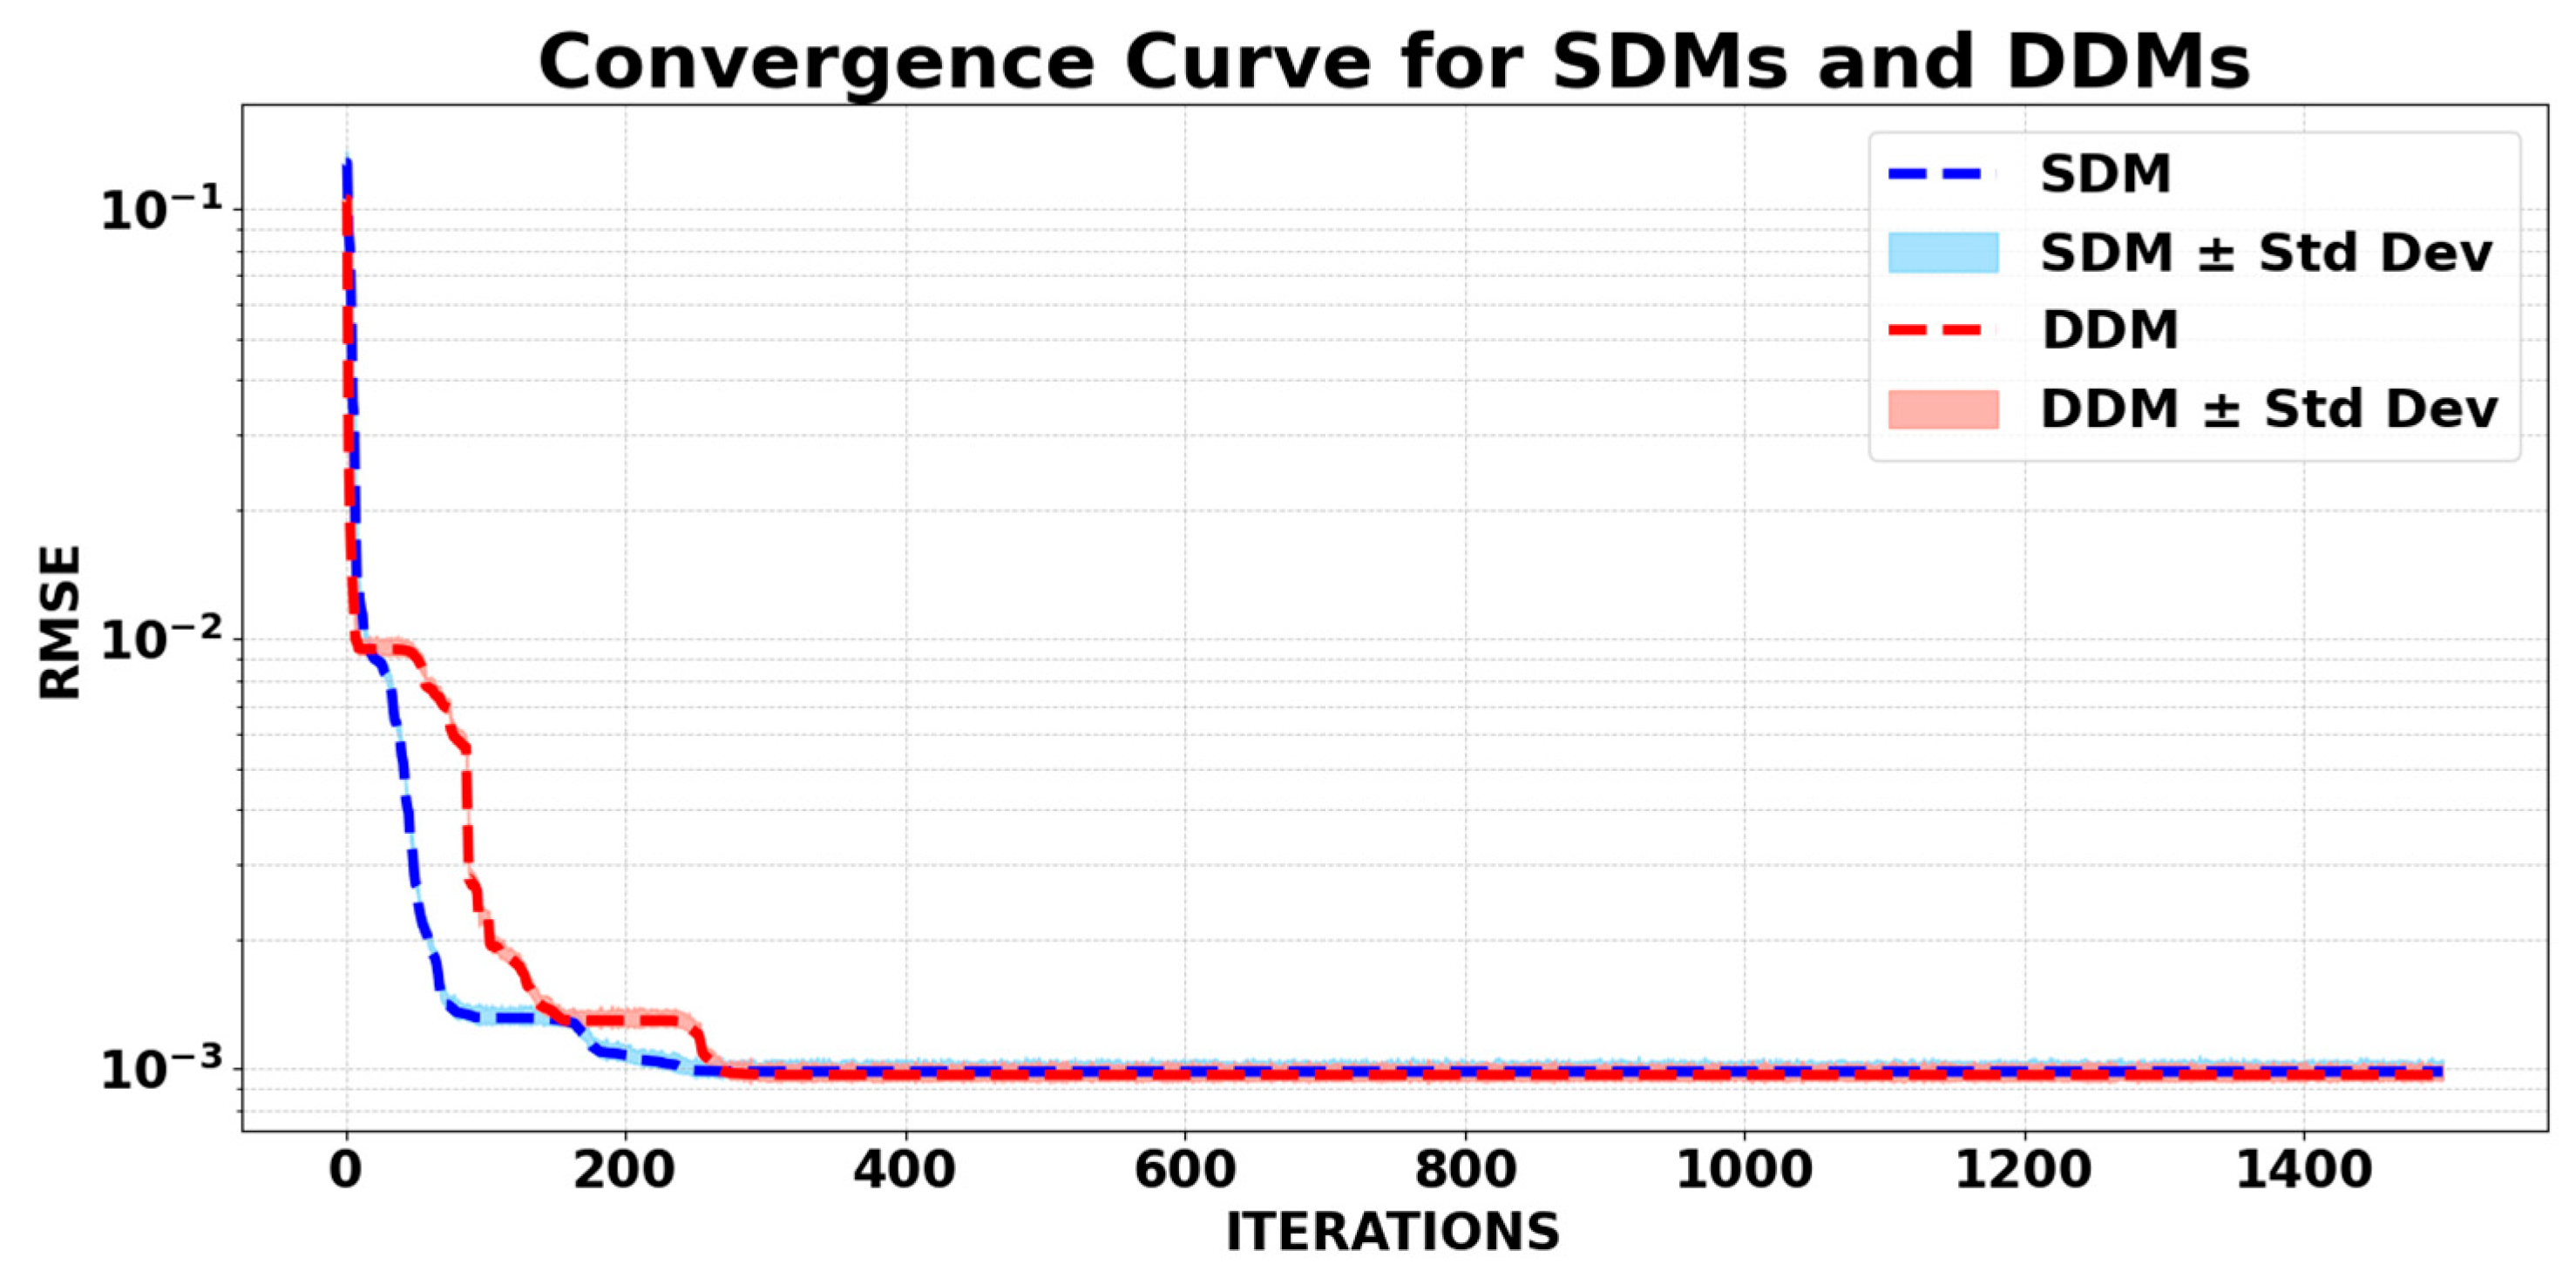
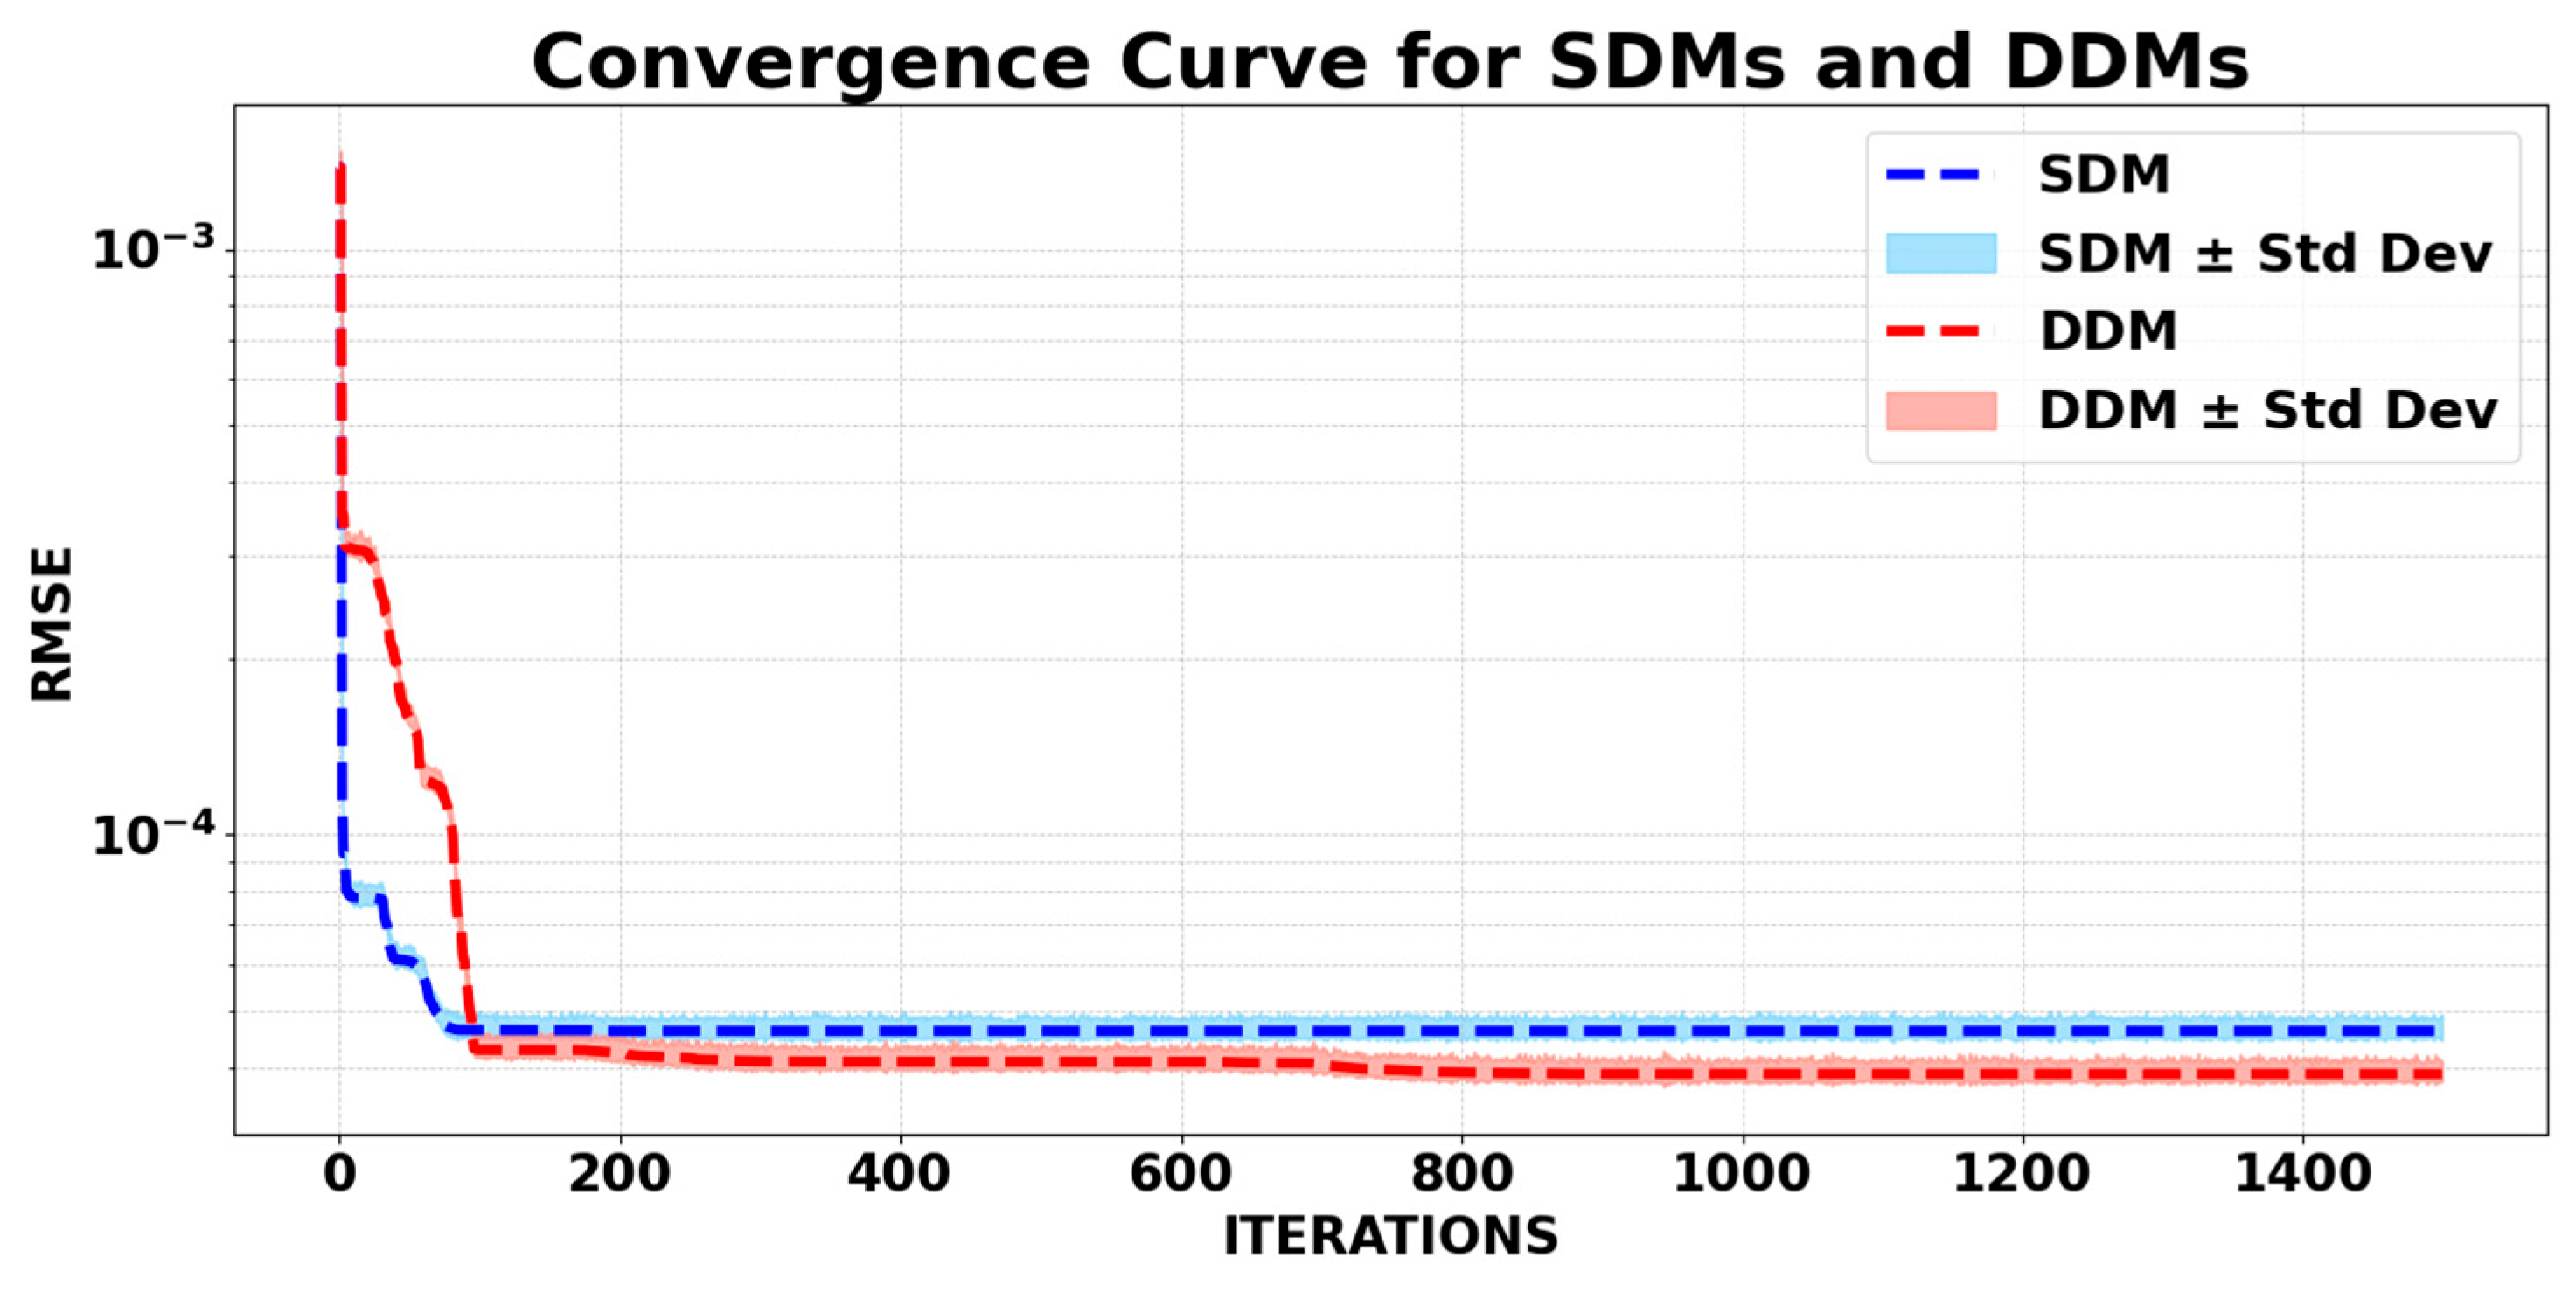
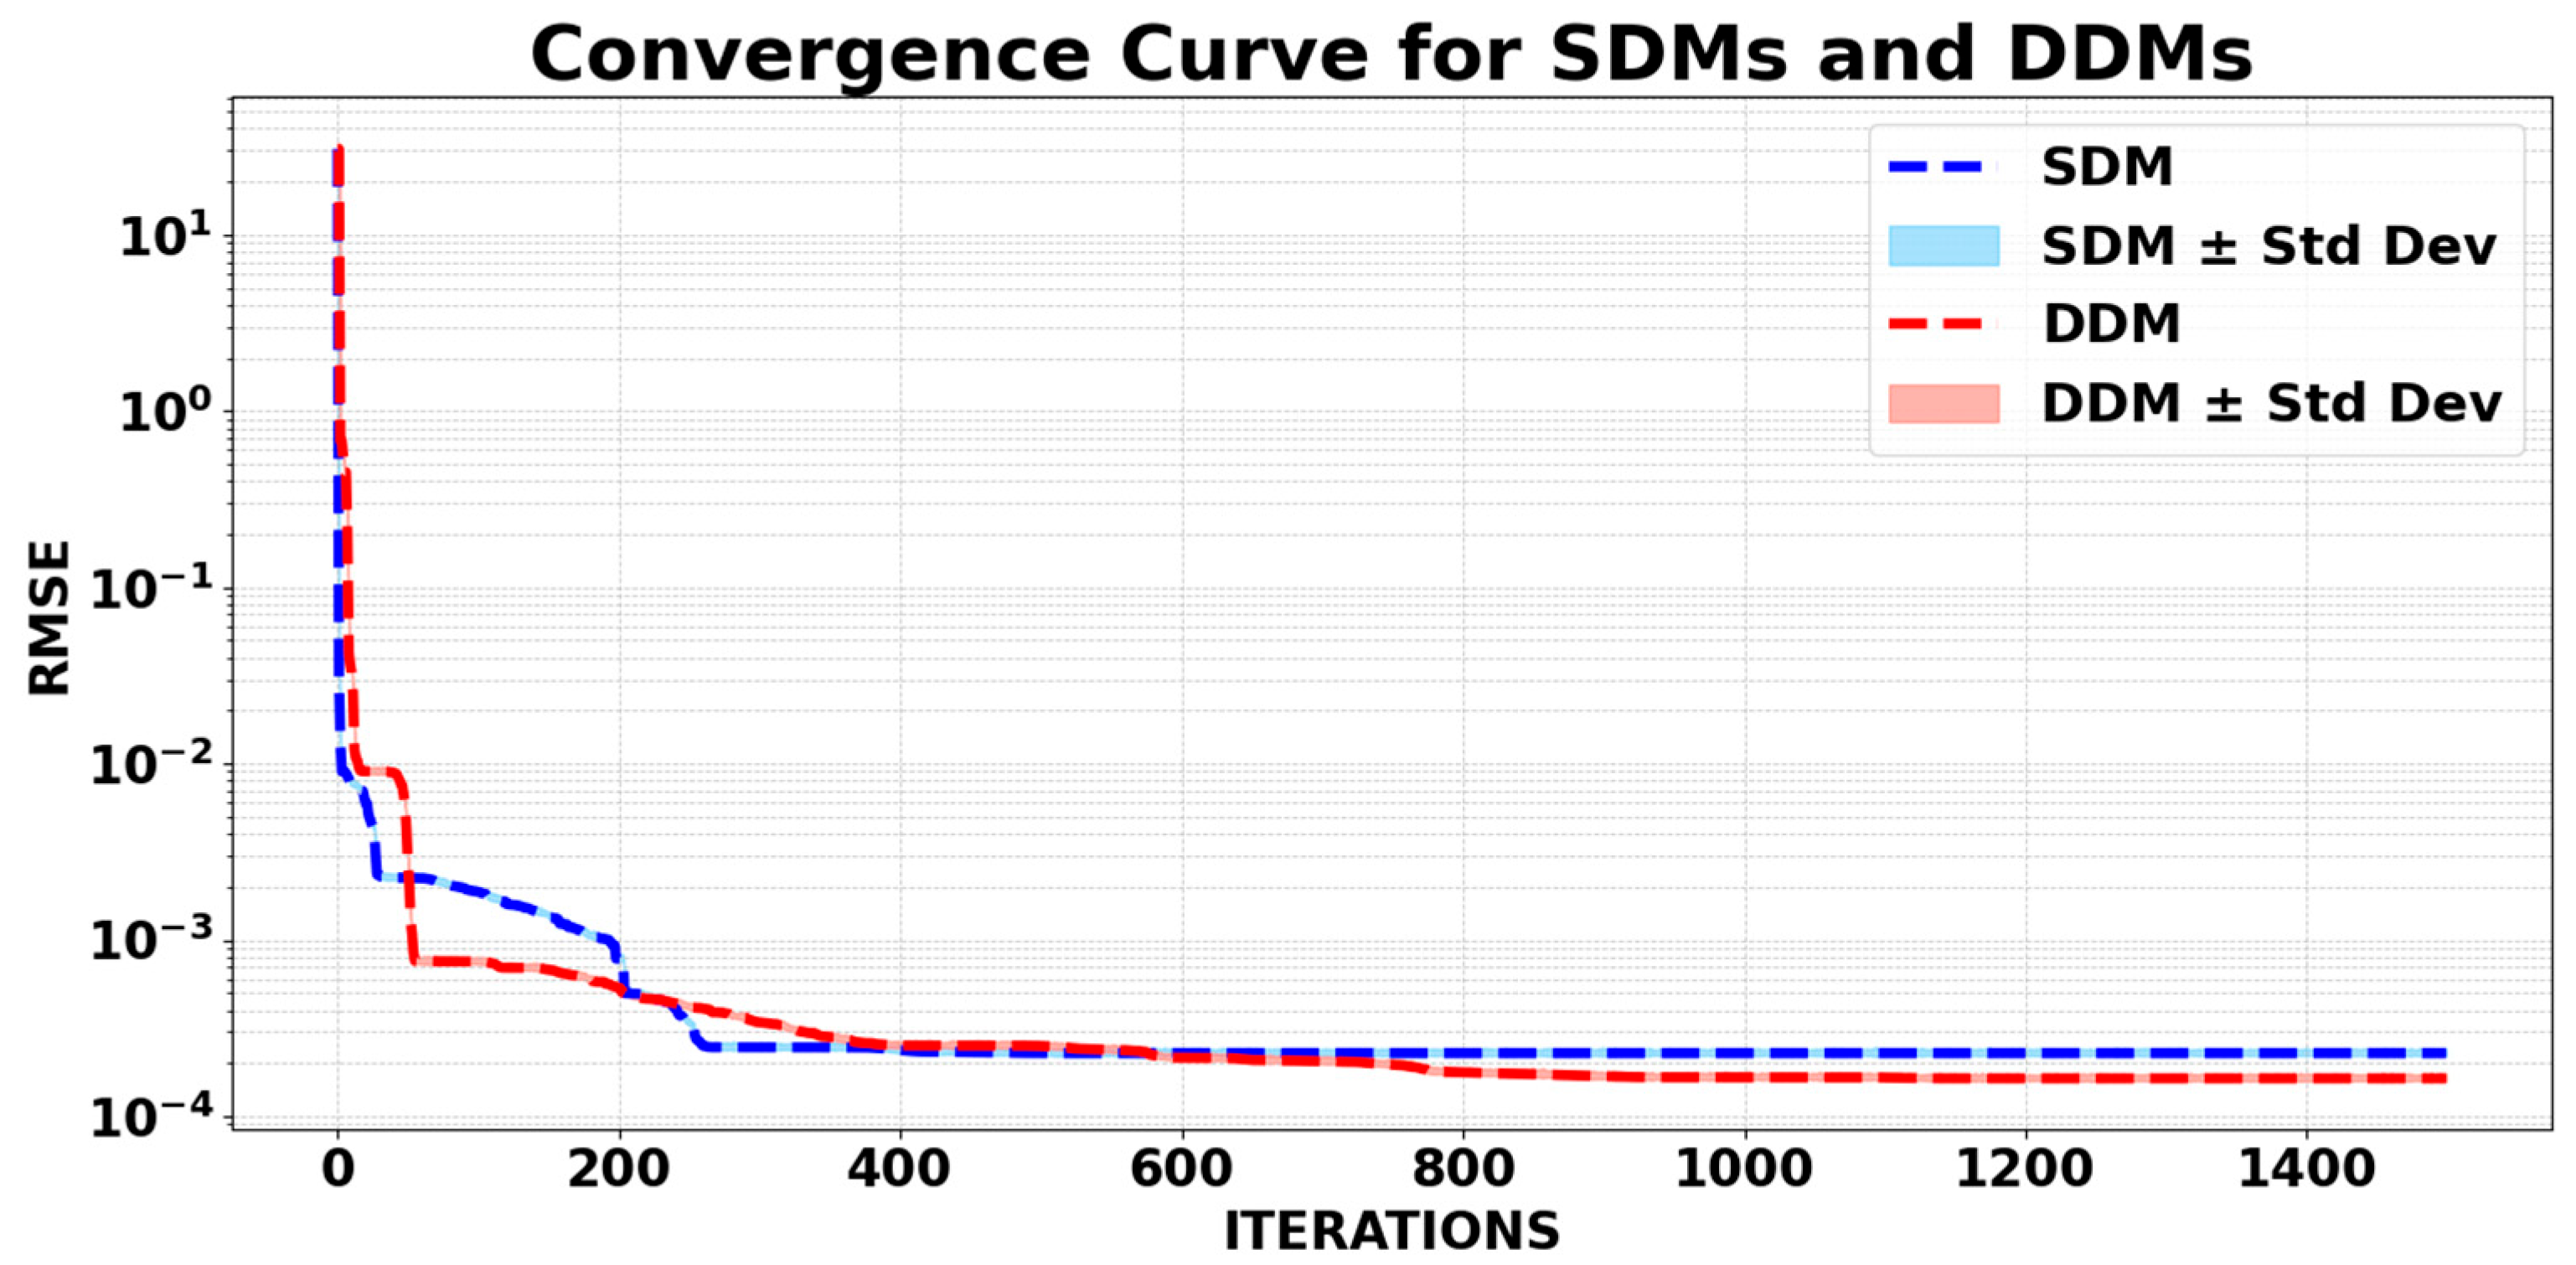
The PSA’s convergence curves for both models are shown in
Figure 7, where the maximum iteration was 1500 and the population size was 100. The figure displays the iteration at which we began obtaining the least RMSE value, which is around 250 iterations at population 45 in the case of the SDM and population 93 in the case of the DDM. Additionally, shaded regions representing ± standard deviation across the iterations are included to illustrate the algorithm’s stability and convergence behavior over time. These bands reflect the variation in RMSE values and help assess the degree of fluctuation in the optimization process. Narrower bands indicate more consistent performance, while wider bands suggest increased variability.
Another study focuses on how the RTC photovoltaic cell’s RMSE and computation time change with iteration and population size. To find the best population size and iteration rate combination for minimizing the RMSE value, two studies were carried out.
The population size ranged from 20 to 100, and both models were examined in the first study with a set number of iterations of 100. However, this method did not produce the best results because the smallest RMSE value was reached when the population size and iteration were both set to 100. The results of this analysis produced a SDM with an RMSE value of 2.0060 × 10⁻³ and a compute time of 0.3747 s. With a computation time of 0.5862 s, the DDM’s minimal RMSE value was 4.5336 × 10⁻³.
In the second study, the number of iterations was changed by a step of 200 while keeping the population size fixed. This method made it possible to determine the algorithm’s lowest possible RMSE value. The optimum RMSE solution for the SDM needed a population size of 50 and 1100 iterations, which took around 2.056 s to compute. With a population size of 50 and 1500 iterations, the DDM took around 4.632 s to compute.
Table 4 displays the analysis for the SDM, whereas
Table 5 displays the analysis for the DDM.
Another experiment was conducted to evaluate the PSA’s effect on CPU execution time across different processors, as presented in
Table 6. The SDM and DDM were tested on Intel Core i9 and AMD Ryzen 5 5600H CPUs. The Intel Core i9 outperformed the AMD Ryzen 5, with execution times of 1.9865 s (SDM) and 4.5221 s (DDM) compared to 3.5441 s (SDM) and 7.6632 s (DDM) for the AMD. The differences are due to the Intel CPU’s better single-threaded performance, optimized instruction sets, and superior thermal management, particularly for the more computationally demanding DDM.
3.2. aSi Cell
The amorphous silicon photovoltaic is the topic of discussion in the second analysis. It was evaluated at a specified 1000 W/m
2 irradiance and 25 °C temperature, and so the I–V characteristic was measured. The result observed [
29], which includes the current values derived using the SDMs and DDMs, including their associated errors, can be found in
Table S2.
Table 7 displays the characteristics of the aSi photovoltaic cell determined from the PSA for both the SDMs and DDMs. The SDM analysis took 3.3512 s to execute, whereas the DDM took 6.5292 s. Statistical tests, RMSE, MBE, and STD were used to evaluate algorithm performance, which included algorithms such as BWOA, ISOA, and HSDA.
The PSA and BWOA algorithms produced identical RMSE values for both models, showing only minor variations. A comparison of the RMSE value with ISOA for the SDM revealed a small improvement of roughly 0.01%, whereas the improvement for the DDM was more considerable at 3.88%. For both models, the RMSE produced by the HSDA was higher than that obtained by the PSA.
When compared to BWOA, the RMSE findings for the SDMs and DDMs are essentially equal, showing insignificant changes in the obtained parameters. However, substantial differences arise when comparing the DDM to other algorithms such as ISOA and HSDA.
Table 7 shows how the PSA beats alternative techniques for the DDM across all statistical tests. As all collected parameters for both models are analyzed using the PSA technique, substantial differences are shown when compared to other algorithms.
Compared to ISOA, the DDM has more changes in reverse saturation for recombination and generation processes as well as changes in series and shunt resistance. This shows that the DDM excels at extracting parameters reliably and with accuracy. Furthermore, the evaluation of all aSi solar cell parameters and the RMSE demonstrates the PSA’s capacity to find the optimal solution and avoid entering local minima.
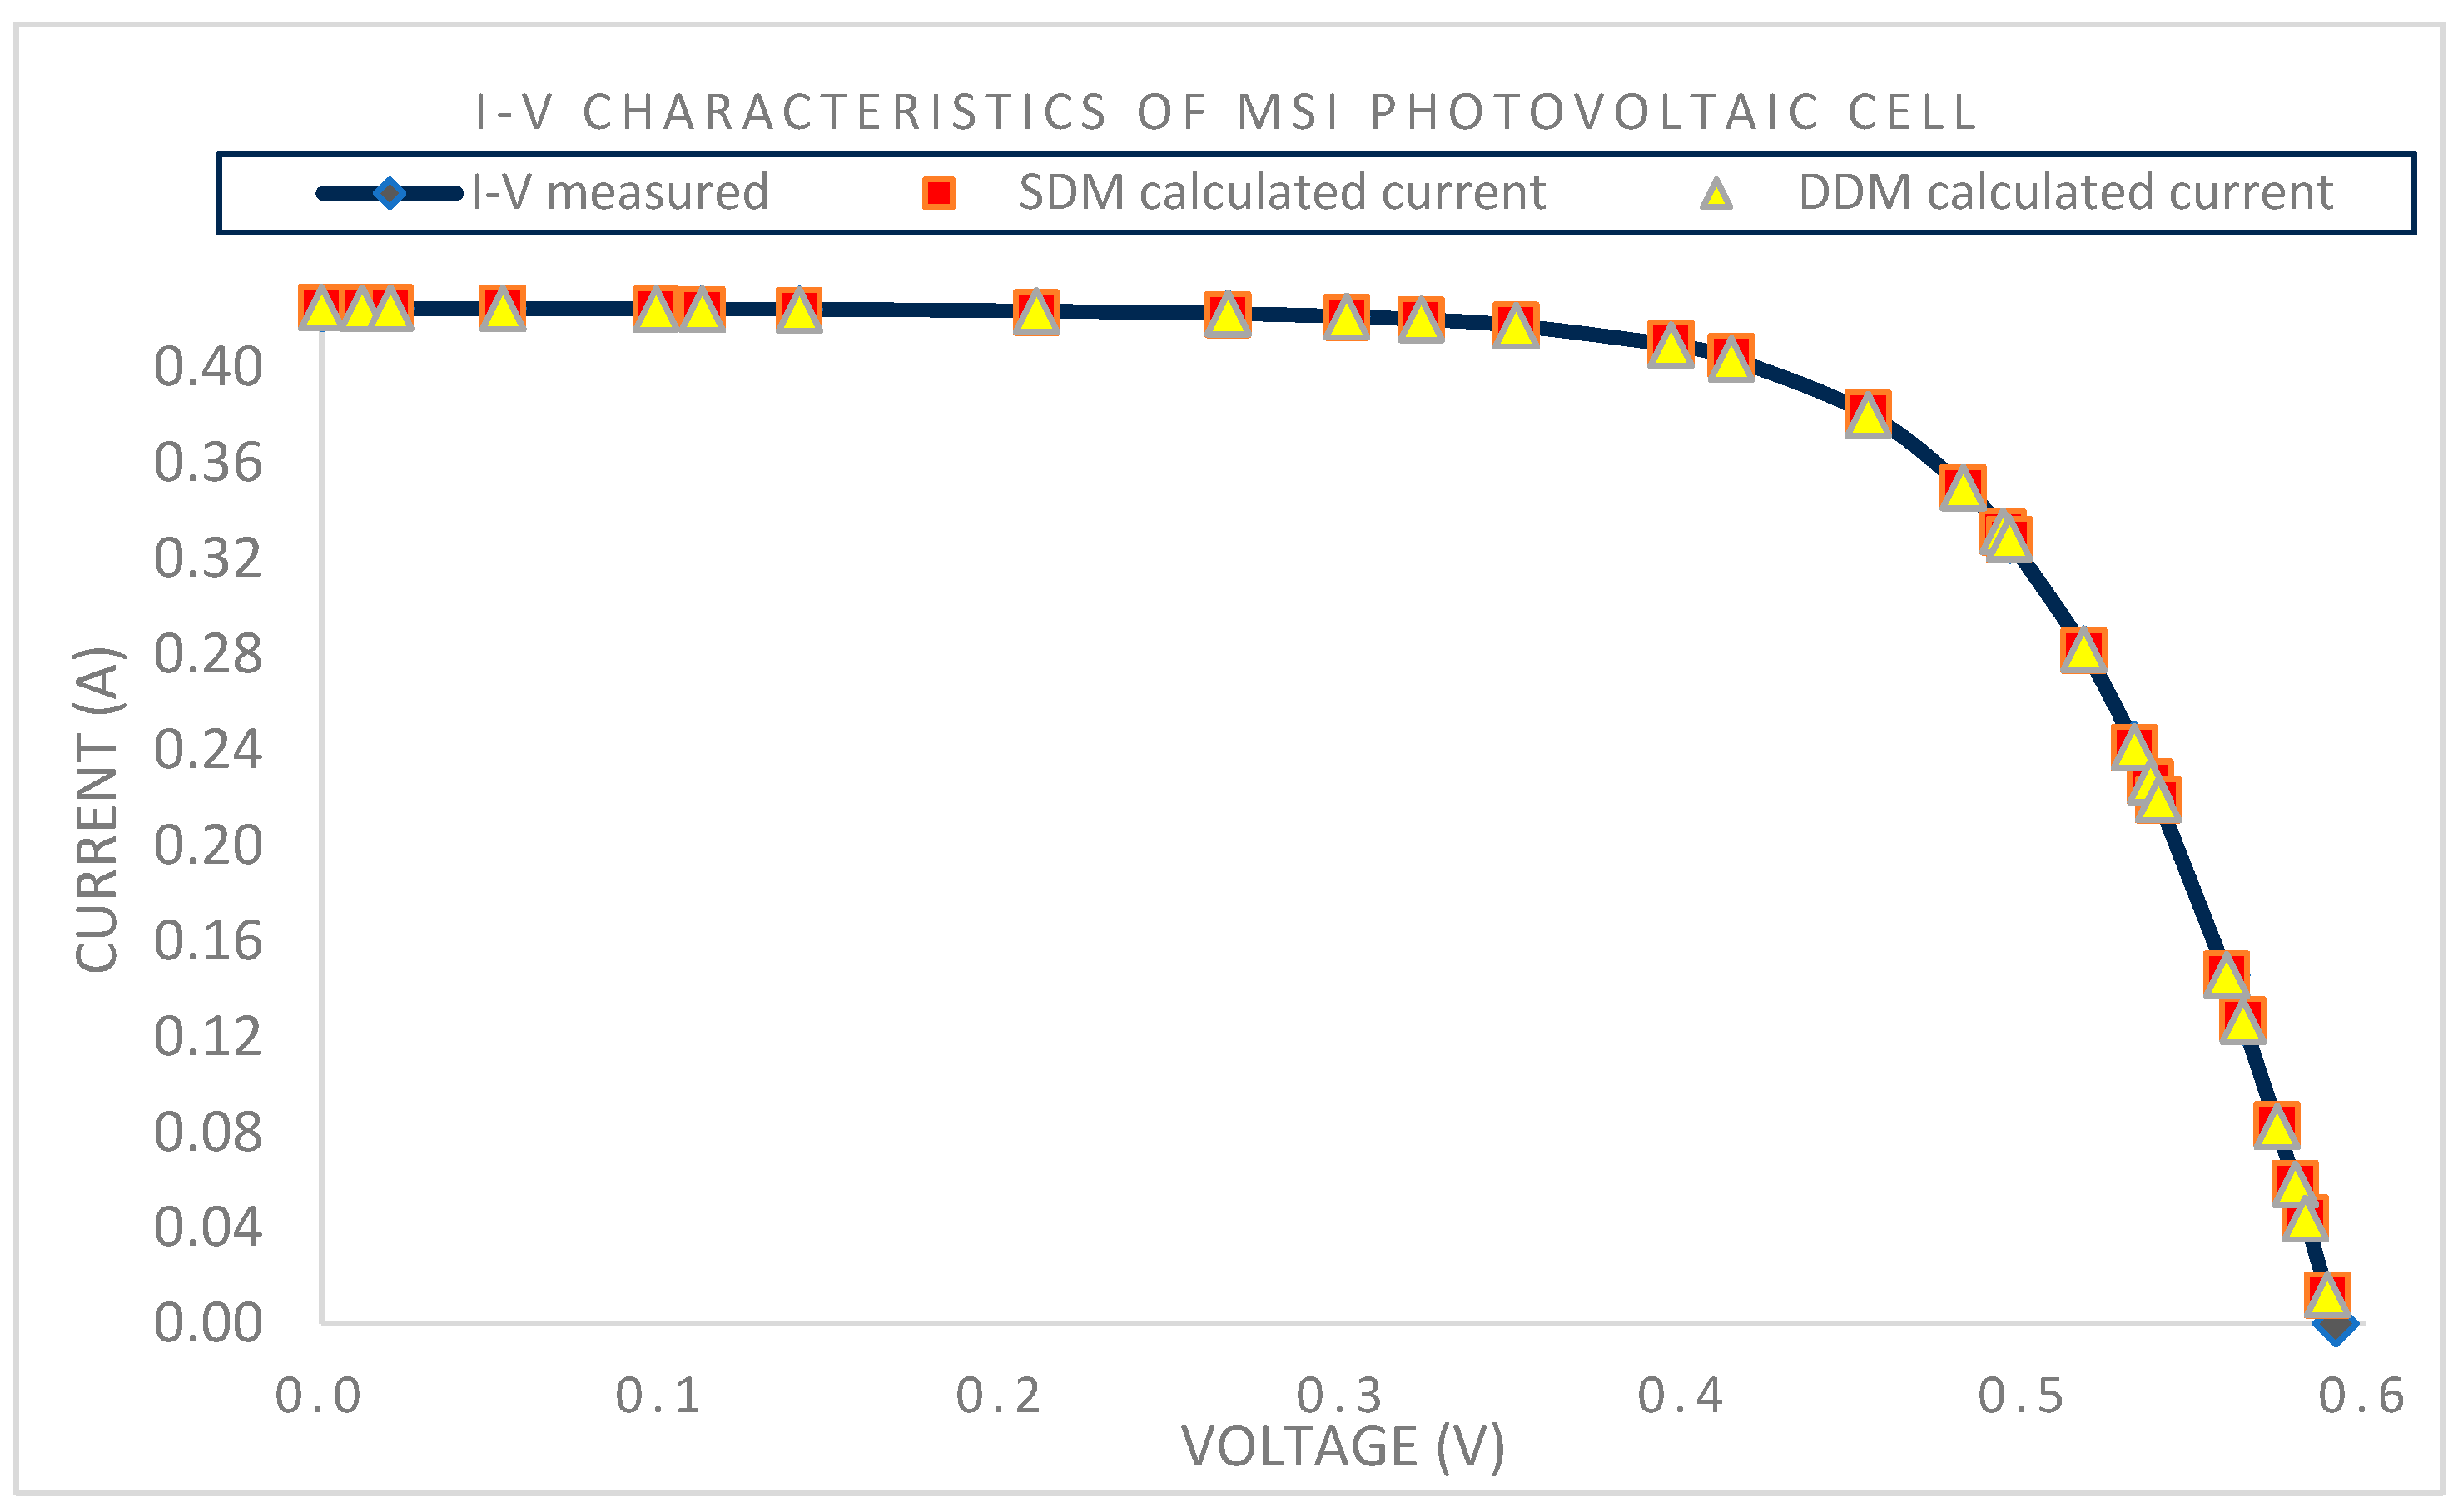
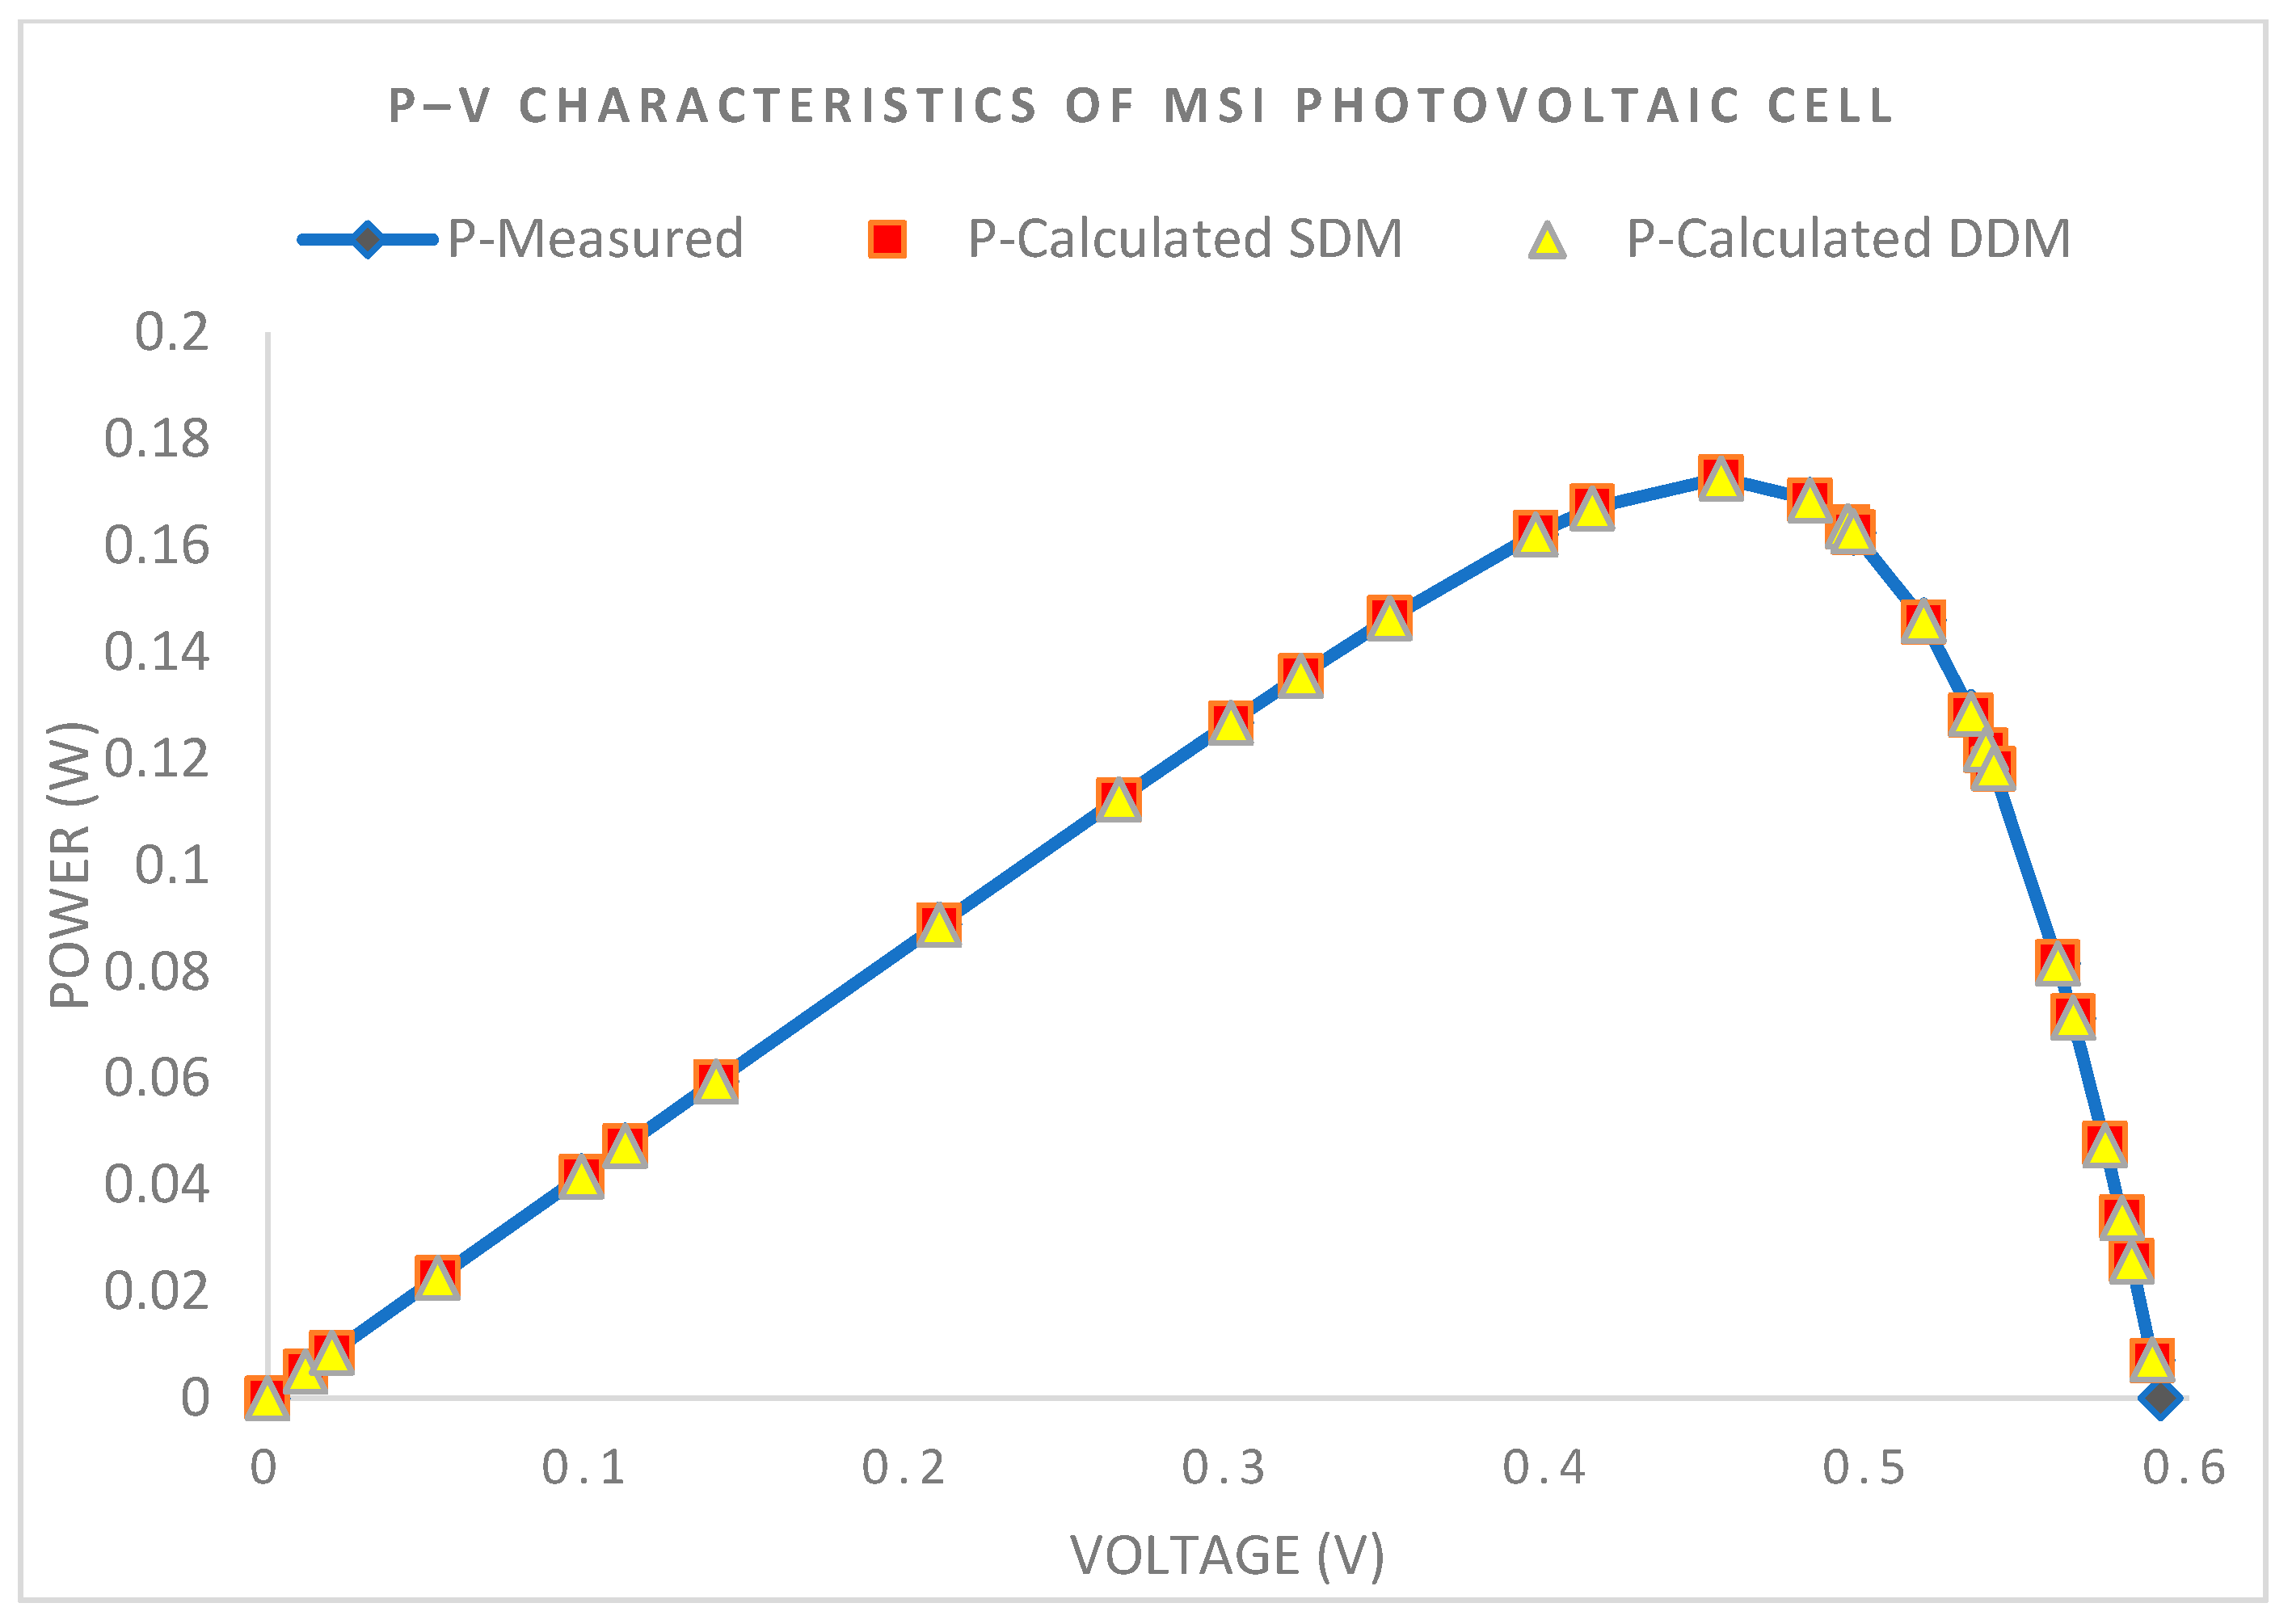
Using the PSA approach, the I–V in
Figure 8 and the P–V in
Figure 9 shows features of the SDMs and DDMs aligned with the actual values.
Disparities between the observed current and the estimated current for both models are shown in
Figure 10 as absolute errors, determined by the algorithm.
The convergence curves of the PSA with a maximum of 1500 iterations and a population size of 100 are shown in
Figure 11. On the graph, the minimum RMSE value is seen to have been reached at roughly 150 iterations at population 37. Additionally, the figure includes shaded regions representing the ± standard deviation of RMSE values across the iterations. These bands serve to highlight the consistency and stability of the PSA throughout the optimization process. A narrow-shaded area indicates that the RMSE values remained closely clustered, reflecting robust convergence behavior, whereas wider regions would signify greater variability and less consistent performance.
In addition to the RTC, the aSi photovoltaic cell benefited from the research that was performed. The original study looked at both models with a fixed number of iterations set to 100, and the population size was between 20 and 100. However, the highest results were obtained by setting both the population size and the number of iterations to 100; therefore, this strategy was not optimal. The investigation showed that the SDM took 0.6133 s to compute and had an RMSE of 4.72 × 10⁻⁵. The DDM, on the other hand, minimized the RMSE to 1.52113 × 10⁻⁴ in only 0.9482 s.
In the next experiment, we kept the sample size the same while increasing the number of iterations by a factor of 200. By making this modification, we were able to find the algorithm’s minimum RMSE. With 900 iterations and a population size of 50, the optimum RMSE solution for the SDM was found, and the resultant calculation time was around 2.6704 s. For the DDM, the optimal solution took 50 population sizes and 1500 iterations, with an execution time of around 7.082 s.
Table 8 displays the results of the experiment with the SDM, whereas
Table 9 displays the experiment results with the DDM.
In this experiment, the CPU execution times for the SDM and DDM were evaluated across two different processors: Intel Core i9 and AMD Ryzen 5 5600H.
Table 10 presents the results, highlighting that the Intel Core i9 consistently outperformed the AMD Ryzen 5 5600H for both models in terms of execution speed. The SDM required less execution time than the DDM on both processors, indicating a simpler computational complexity. Specifically, the Intel Core i9 achieved 3.2214 s for the SDM and 6.2822 s for the DDM, while the AMD Ryzen 5 took 5.9455 s and 9.9611 s, respectively. These differences can be attributed to the Intel Core i9’s superior architecture, clock speeds, and optimizations for single-threaded performance, which the algorithm likely benefits from. Conversely, the AMD Ryzen 5, while powerful, may not be as efficient for workloads with such specific computational demands.
3.3. mSi Cell
The monocrystalline silicon photovoltaic is the subject of this third solar cell analysis. At 1000 W/m
2 irradiance and 27 °C temperature, the I–V characteristic of mSi silicon is evaluated. Current values derived using the SDMs and DDMs, together with their corresponding errors, are reported in
Table S3 of the final dataset [
29].
The mSi photovoltaic cell’s PSA-extracted values for the SDMs and DDMs are shown in
Table 11. The SDM took 3.9440 s to execute, whereas the DDM version took 5.5715 s. Algorithms’ effectiveness is measured using RMSE, MBE, and STD to evaluate solutions obtained by ISOA, HSDA, and the Barnacles Mating Optimizer Algorithm (BMOA) [
48].
In terms of the SDM, the RMSE value achieved by the PSA is not exceeded by ISOA; however, it does vary slightly from HSDA. In the instance of the DDM, the RMSE value improves by 40.9% when compared to ISOA and 50.58% when compared to HSDA. Despite these gains, the RMSE for both models generated by the BMOW algorithm is still greater than that achieved by the PSA.
The SDM’s RMSE findings show that the PSA was below ISOA’s RMSE value, with the discrepancies in the extracted parameters being very small. But there are notable differences when compared to other algorithms like BMOA and HSDA. In contrast, the PSA surpasses all other algorithms in the DDM with a high improvement, as seen in
Table 11.
The performance of the BMOA was poor, since it became stuck in a local minimum and could not achieve the optimal results. When comparing the PSA findings to those of other algorithms, significant discrepancies were found after assessing all of the obtained parameters for both models. The PSA’s parameters, specifically in the SDM, exhibited only minor variations in values compared to ISOA, resulting in a greater RMSE value than that attained by ISOA, where ISOA obtained 5.5854 × 10⁻⁴ while PSA obtained 5.63096 × 10⁻⁴. The PSA, however, produced significant improvements in the DDM, notably in reverse saturation for the recombination and generation processes, as well as changes in series and shunt resistance. In terms of RMSE, PSA obtained 2.6216 × 10⁻⁴ while ISOA obtained 4.4383 × 10⁻⁴, representing an improvement of around 40.9% by PSA in this case. When compared to ISOA and HSDA, these improvements produced a greater overall improvement. Importantly, the PSA’s capability to locate the ideal solution and avoid being trapped in local minima is shown by the assessment of all mSi photovoltaic cell characteristics and the RMSE.
The alignment of the estimated and observed I–V and P–V characteristics generated by the PSA is shown in
Figure 12 and
Figure 13, allowing a comparison of the measured and computed currents for both the SDMs and DDMs.
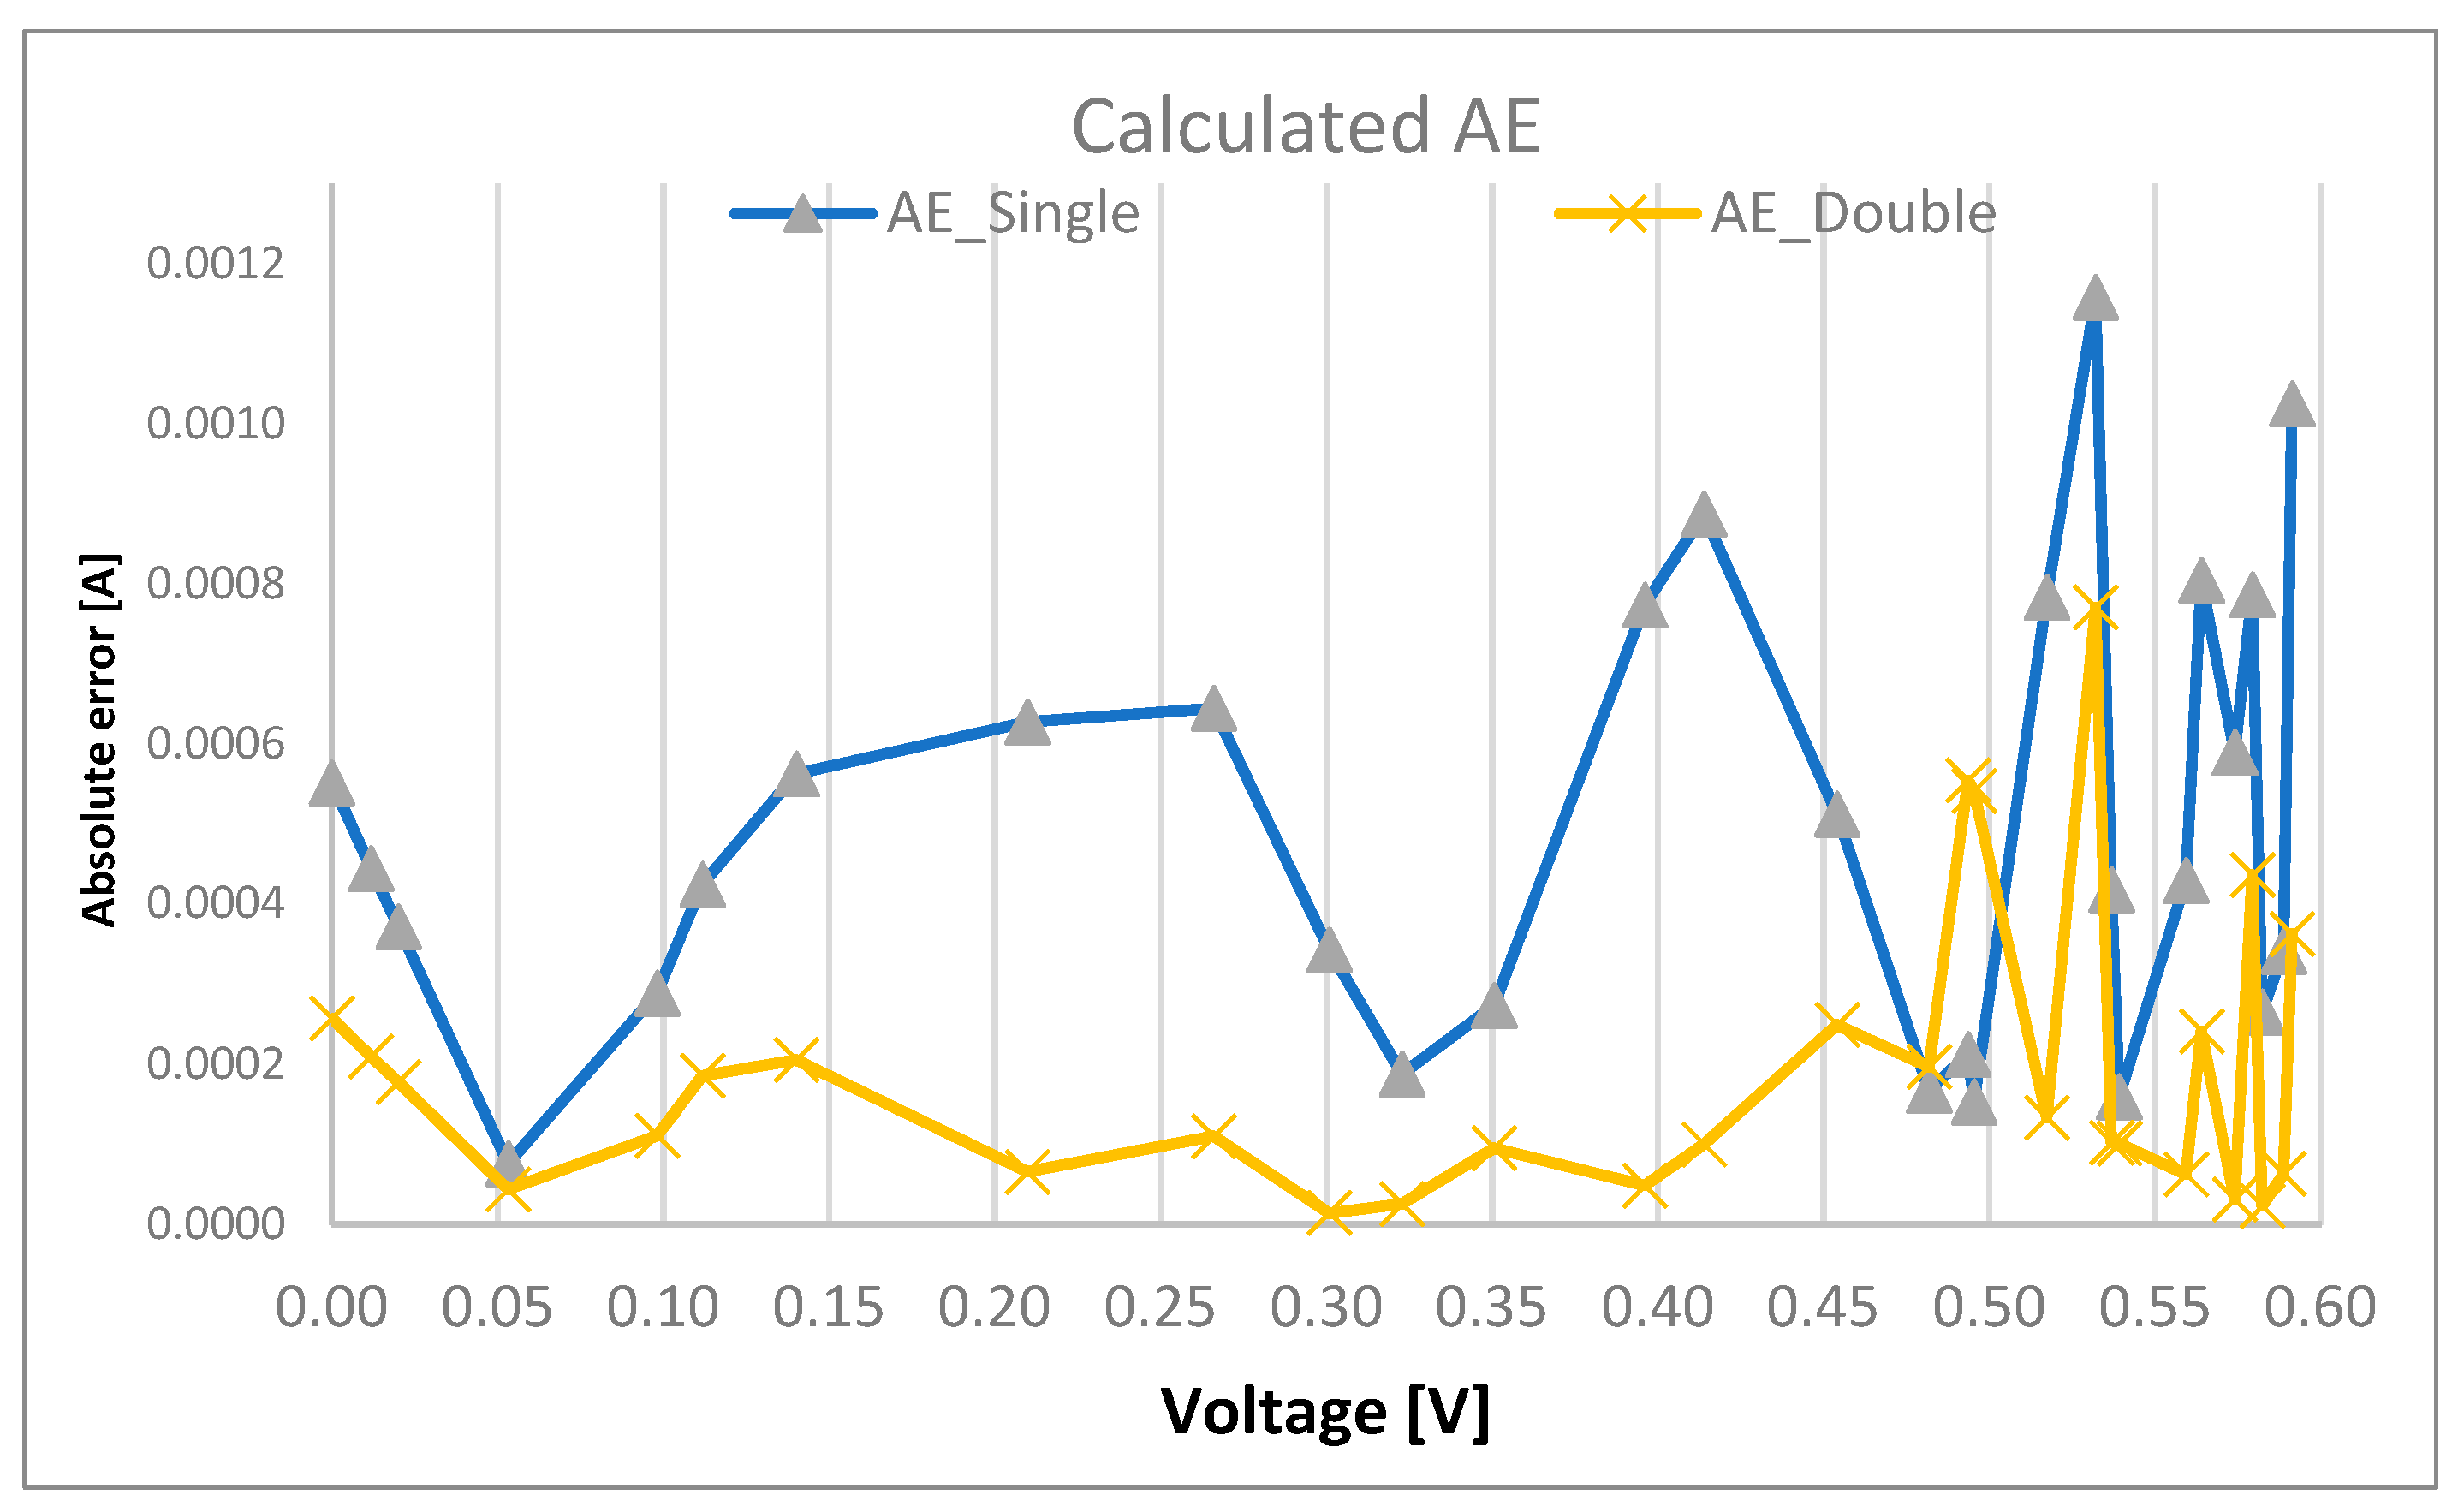
Figure 14 shows the absolute errors, which are the differences between the observed and estimated currents for both models as determined by the algorithm. In the case of the DDM, the absolute errors are very low in comparison with the ones calculated with the SDM.
The convergence curves of the PSA method for both models are shown in
Figure 15, with a maximum iteration of 1500 and a population size of 100. The graphic depicts the iteration at which the algorithm starts producing the lowest RMSE result.
Starting with iteration 220 at 66 population for the SDM, the PSA showed evidence of escaping the local minimum and nearing the ideal RMSE value. For the DDM, the algorithm began this process at iteration 100, although it took a significant jump to obtain the optimum RMSE at iteration 780 and 70 population.
To provide additional insight into the algorithm’s reliability, shaded regions corresponding to ± standard deviation across iterations are included. These bands demonstrate the level of variability in RMSE values at each iteration, offering a visual measure of algorithm stability. Narrower bands indicate consistent behavior across optimization steps, affirming PSA’s robustness in both SDMs and DDMs.
An initial investigation was performed on both models with a fixed iteration number set at 100 and the size of the population ranging between 20 and 100 to determine the most effective combination of iteration size and population size for reaching the best RMSE. The lowest RMSE value was attained when the population size and the number of iterations were both adjusted to 100; therefore, this method clearly did not work. The study showed that the RMSE for the SDM was 1.61 × 10⁻³ and the calculation time was 0.4073 s, whereas the RMSE for the DDM was 1.3605 × 10⁻³ and the computation time was 0.6340 s.
In the next experiment, the population size was held constant, but the number of iterations was increased by 200. The lowest RMSE value achievable by the method was thus determined. It took around 2.2343 s to obtain the optimum RMSE solution for the SDM with a population size of 50 and 1100 iterations. The DDM took around 7.082 s to calculate after 1500 iterations with a population size of 50. Since DDM requires the extraction of seven parameters, the search for the best RMSE takes more time, resulting in a higher number of iterations.
Table 12 presents the results of the SDM study, while
Table 13 presents the findings of the DDM analysis.
In this analysis, the CPU execution times for the SDM and DDM were compared on Intel Core i9 and AMD Ryzen 5 5600H processors, as summarized in
Table 14. The results indicate that the Intel Core i9 performed consistently faster than the AMD Ryzen 5 for both models, with execution times of 3.7890 s for the SDM and 5.2777 s for the DDM on the Intel processor, compared to 6.1665 s and 8.8891 s, respectively, on the AMD processor. The Intel Core i9’s superior execution times can be attributed to its advanced architecture, higher single-threaded performance, and optimizations for computational workloads, while the AMD Ryzen 5, though competitive, lags behind in handling the algorithm’s demands.
3.4. PVM Panel
PVM, short for PVM 752 GaAs thin-film photovoltaic panel, is the second photovoltaic panel being examined. The PVM I–V characteristic is being measured at 1000 W/m
2 irradiance and 25 °C. The result is observed [
29], containing the measured data and current values derived using the SDMs and DDMs, together with the corresponding errors, and can be found in
Table S4.
The characteristics of the PVM photovoltaic panel that were derived using the PSA for the SDMs and DDMs are shown in
Table 15. The SDM takes 5.3845 s to execute, whereas the DDM takes 8.5250 s. The performance of the algorithm, comprising BWOA, HSDA, AOS, OBEDO, and Supply-Demand-Based Optimization (SDO) [
49], is measured by using RMSE.
Both the PSA and the BWOA provide the same RMSE values for the SDM, indicating that there is little difference between the two approaches. However, when HSDA and SDO are put up against PSA, the proposed algorithm performs much better, yielding a 3% advantage over both algorithms.
On the other hand, the RMSE improvement using the PSA for the DDM is impressive: 1.19% better than BWOA and 22.18% better than HSDA. Despite this, for both models, the RMSE produced using the PSA method is still better than other algorithms.
According to the RMSE values for the SDM, the PSA method achieves the same results as BWOA (2.2780 × 10
−4), with hardly any changes in the parameters that are found. However, as demonstrated in
Table 15, when comparing it with other algorithms such as BWOA and HSDA, significant discrepancies are found. The PSA performs better than other algorithms in all statistical tests, as shown in particular by the DDM.
AOS algorithms were unable to locate the lowest RMSE value because they were caught in local minima, which prevented them from obtaining the ideal RMSE. On the other hand, compared to other methods, substantial differences may be found when examining all obtained parameters using the PSA approach for both models.
In the instance of SDM, the PSA produced significantly larger parameter value differences for the of 3.778895 × 10⁻⁶ compared to BWOA with 3.7788 × 10⁻¹², which resulted in a significantly lower RMSE value. Compared to BWOA and HSDA, the PSA improved the DDM the most by changing the reverse saturation for the recombination and generation processes and showing the most change in series and shunt resistance. The evaluation of all PVM solar module parameters and the RMSE show that the PSA can choose the best solution and not become stuck in local minima.
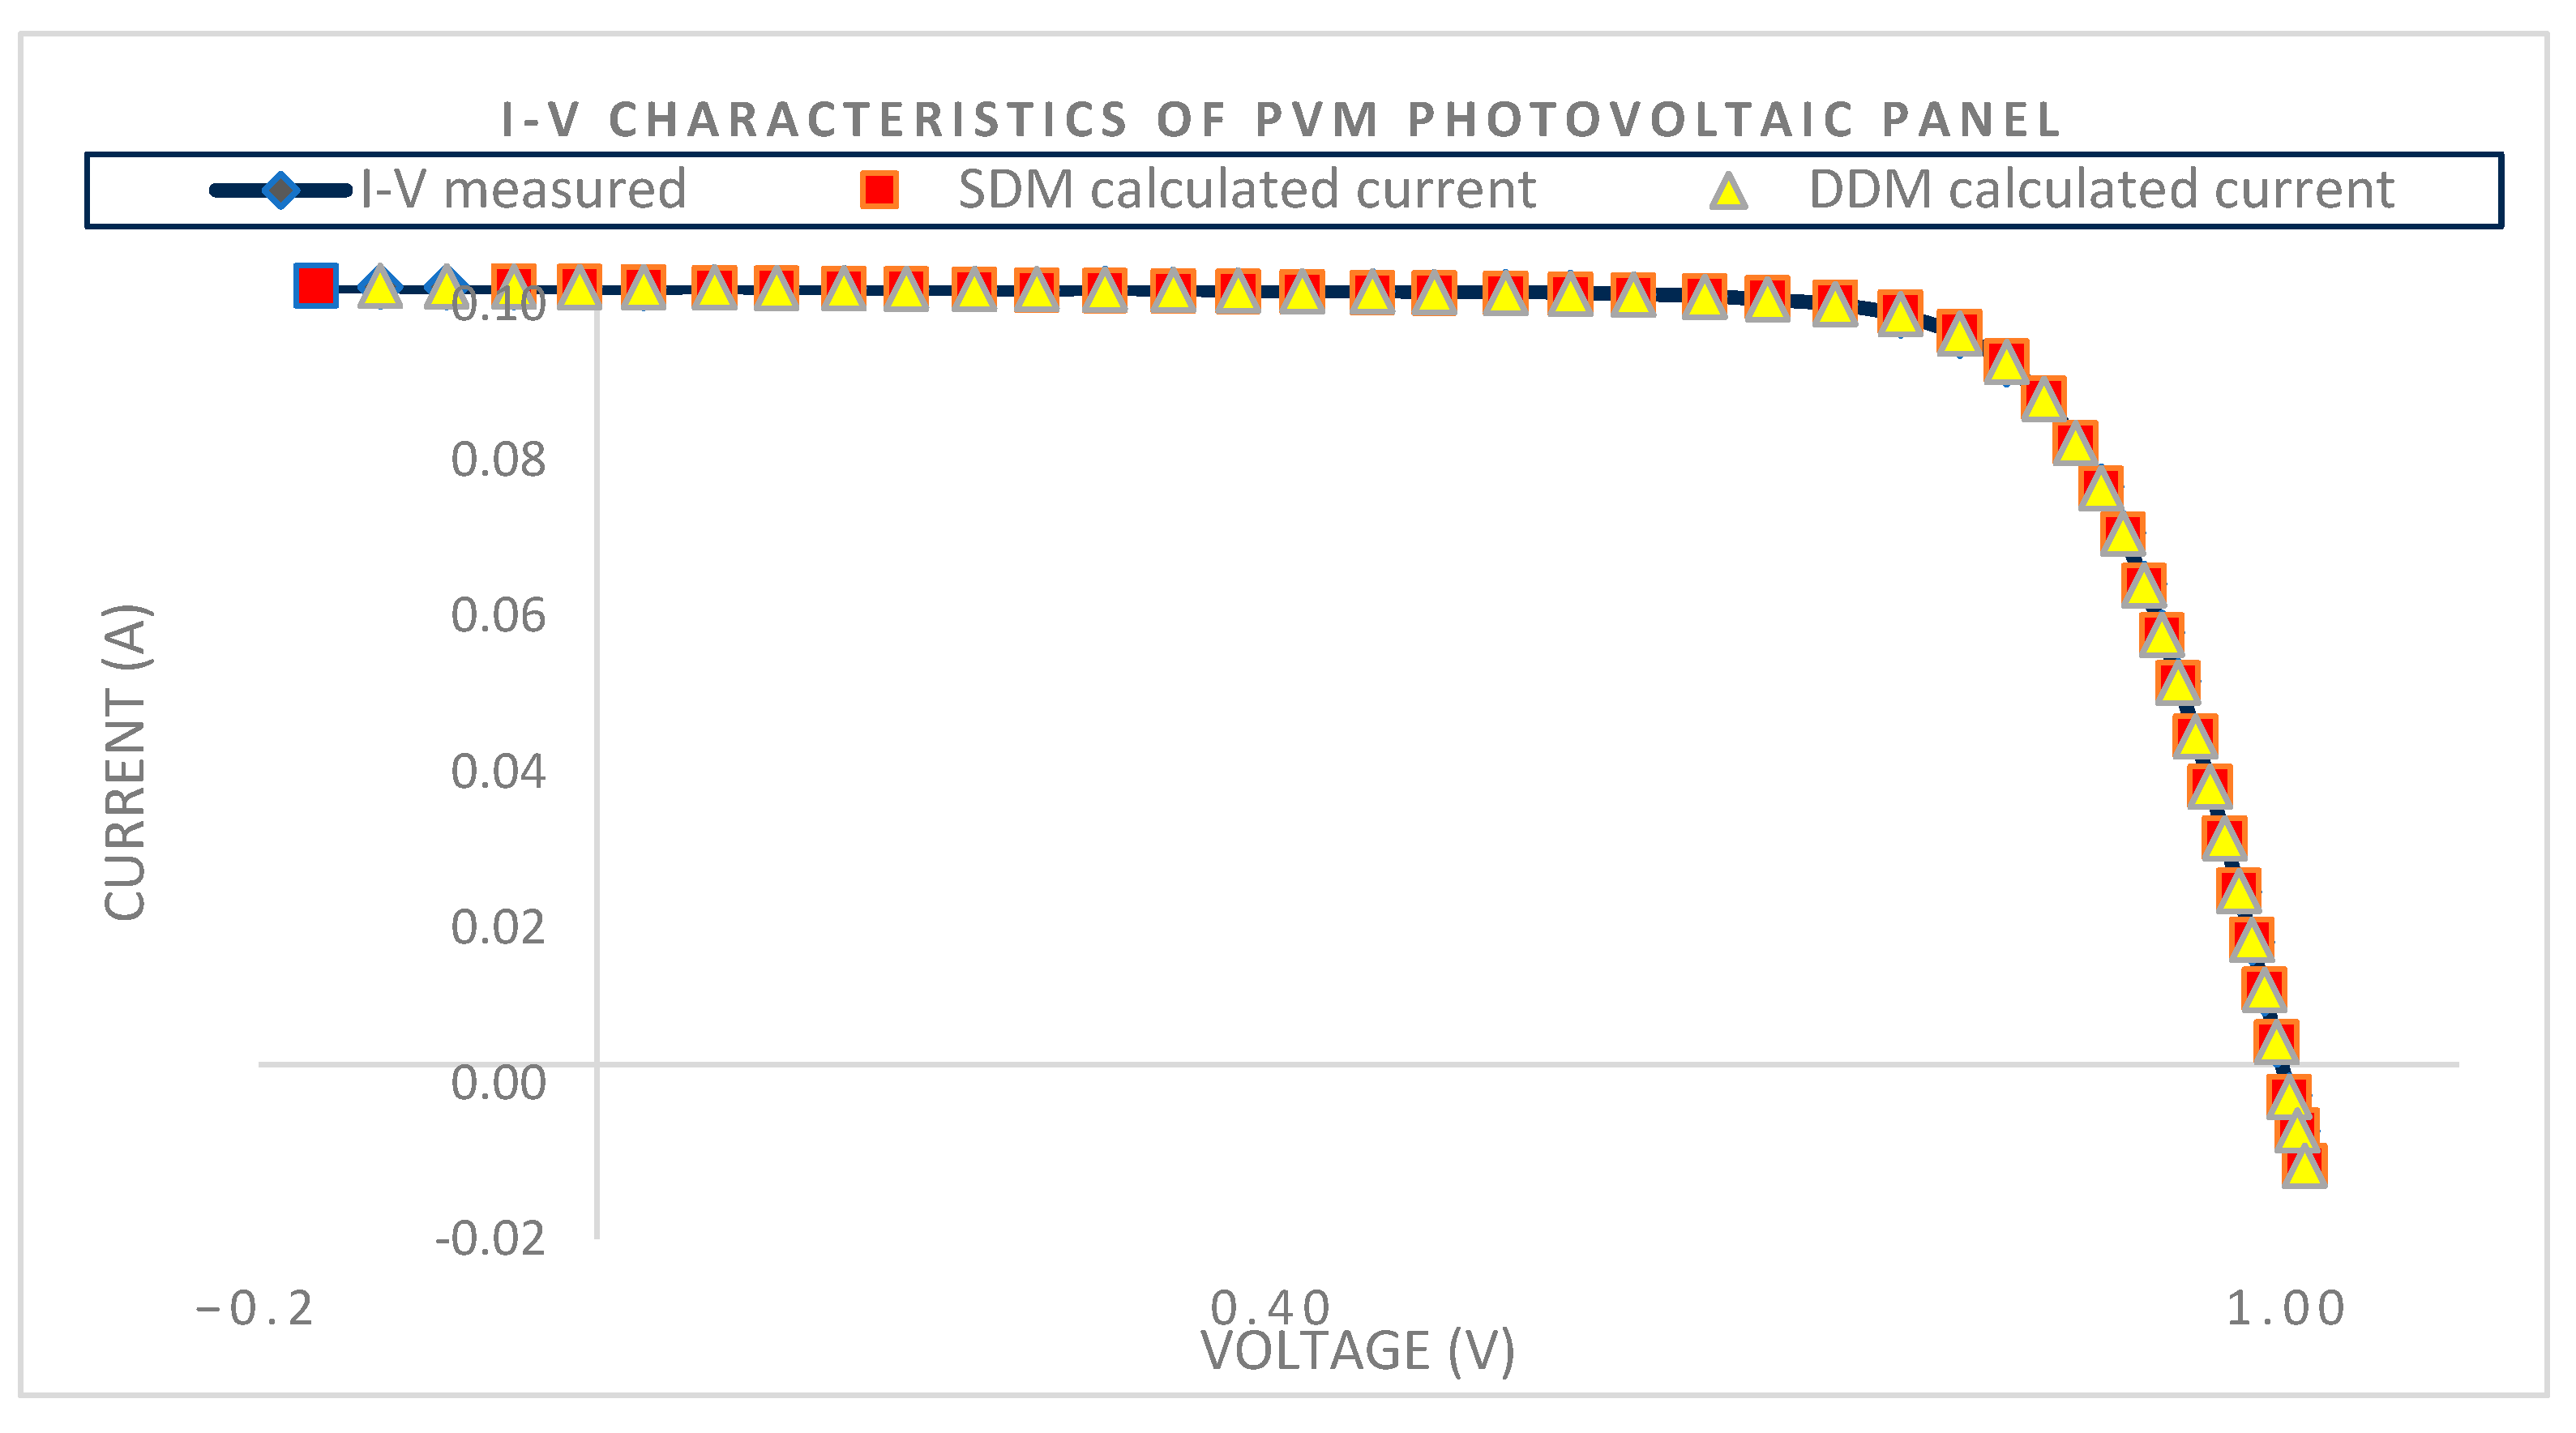
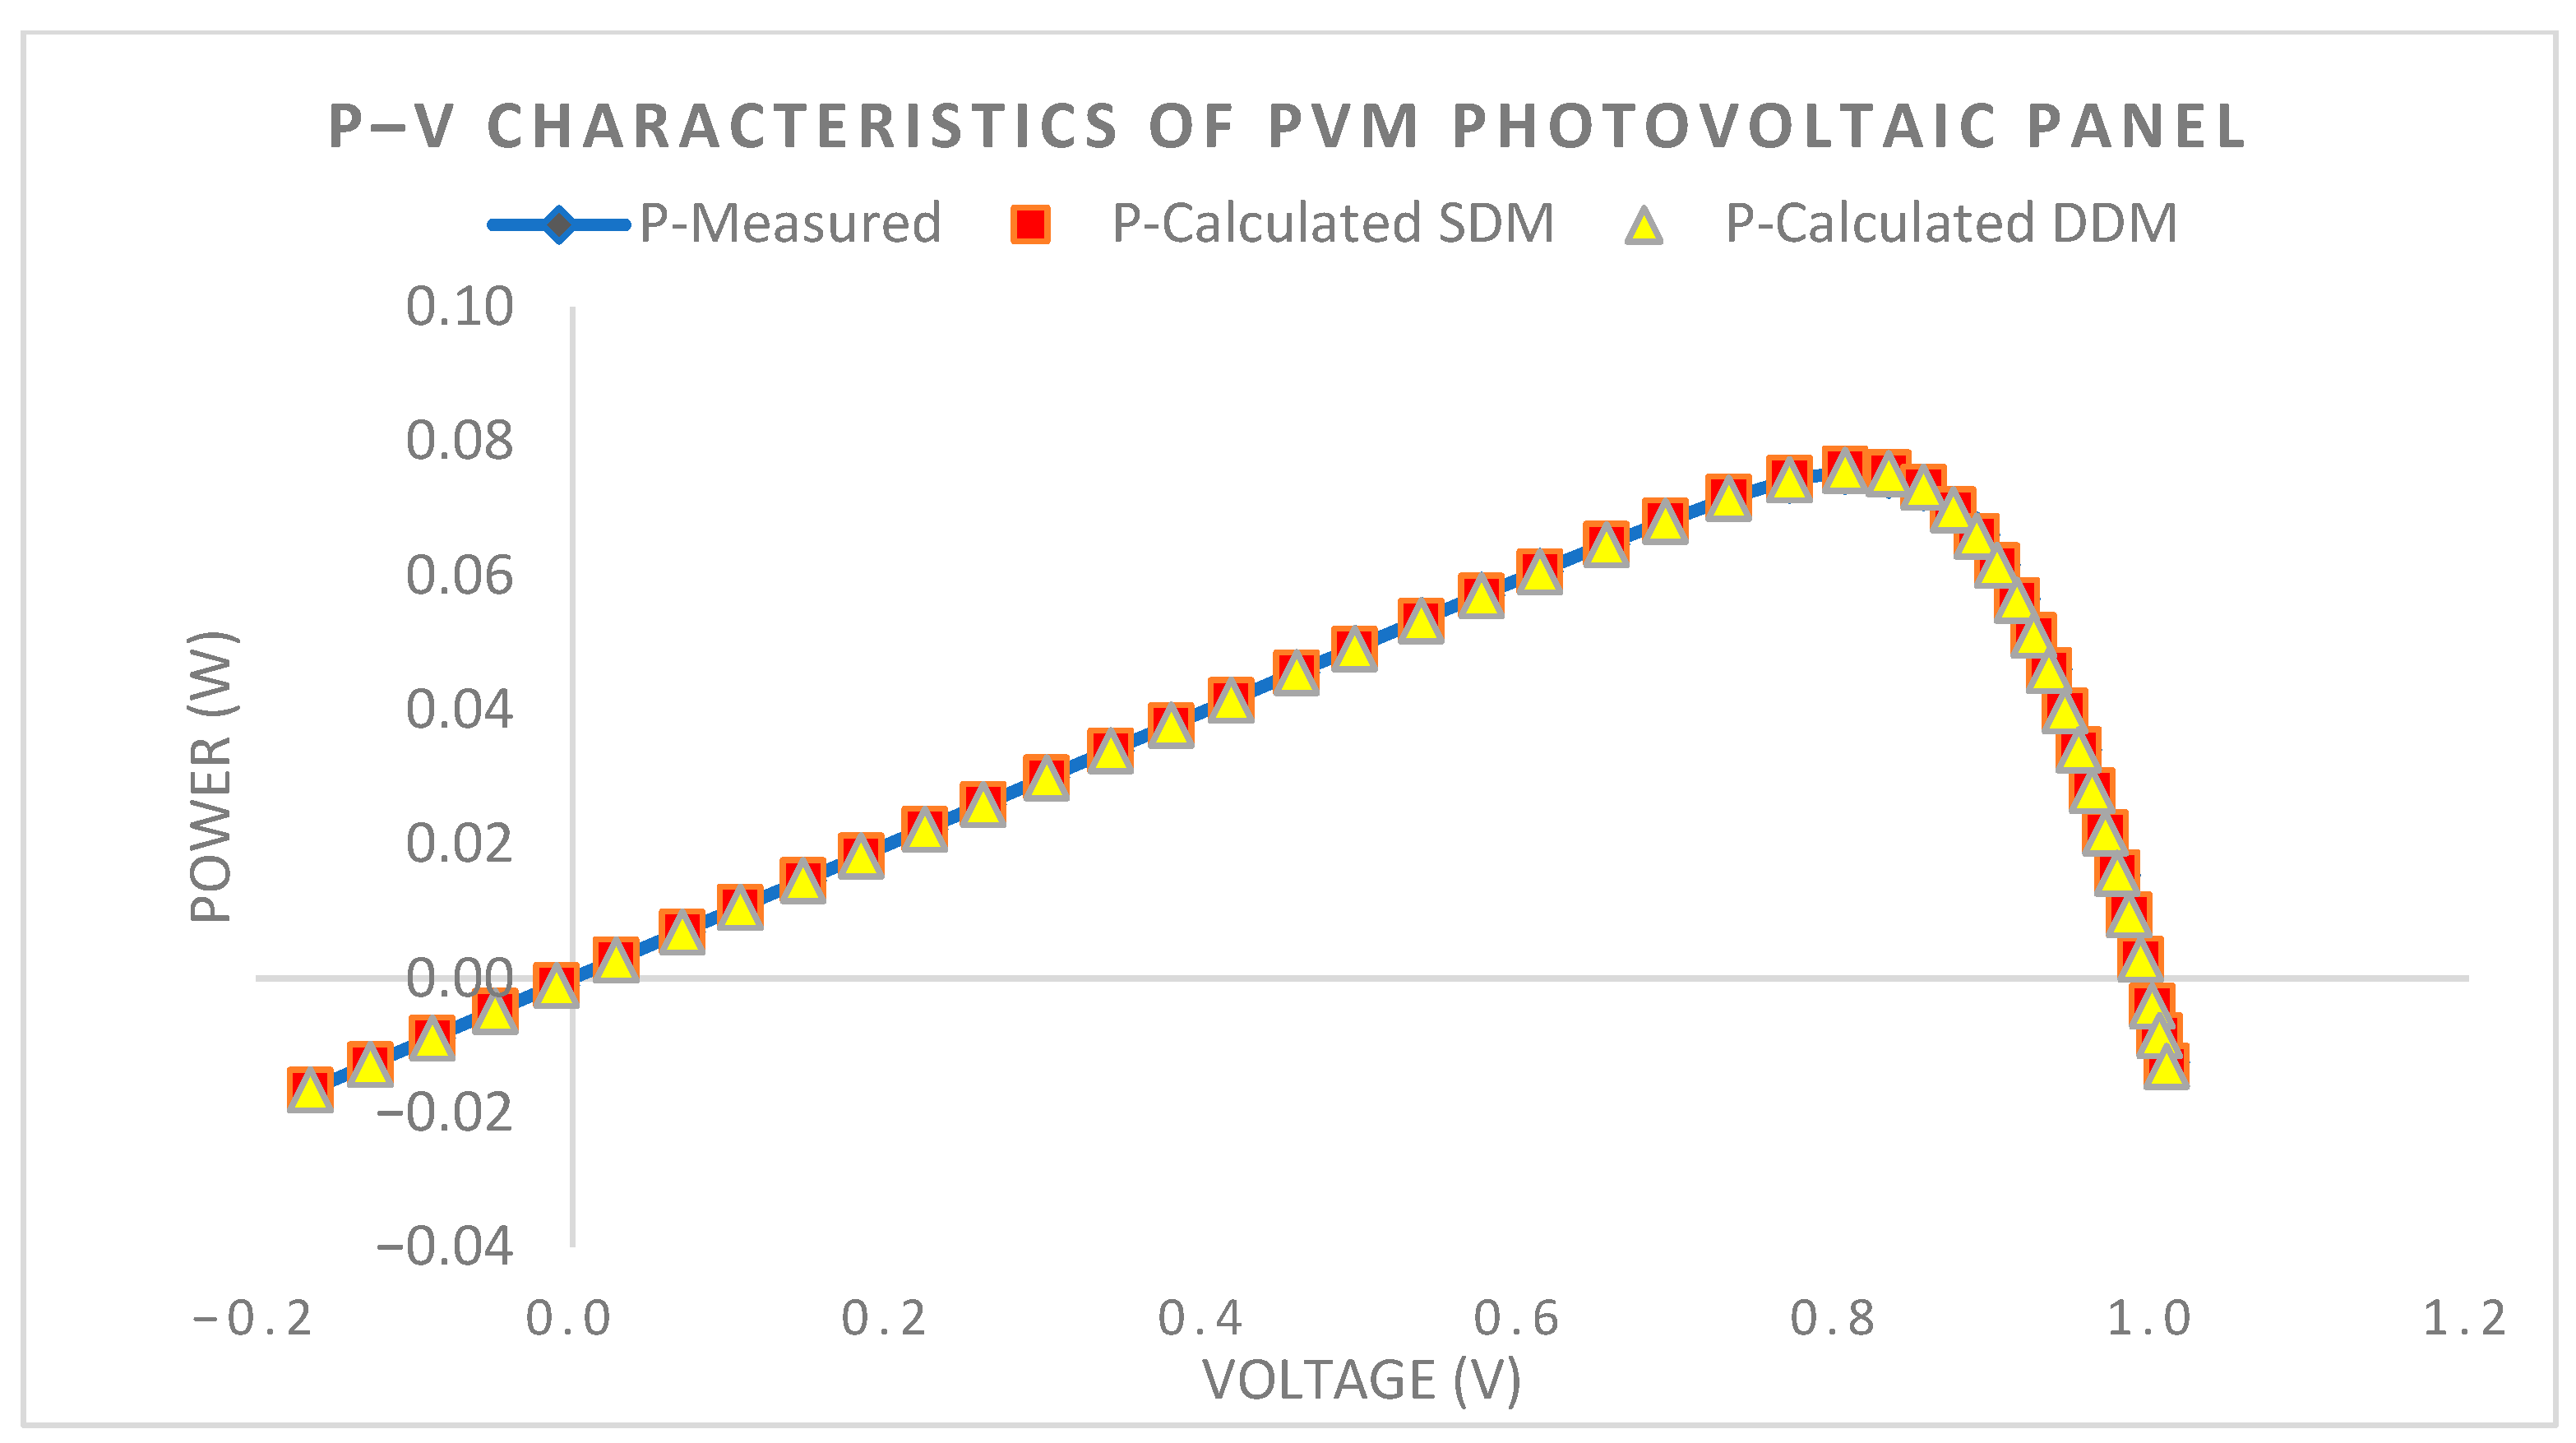
Figure 16 and
Figure 17 show the PSA’s estimated and observed I–V and P–V for the SDMs and DDMs to show the difference between the measured current and the calculated current.
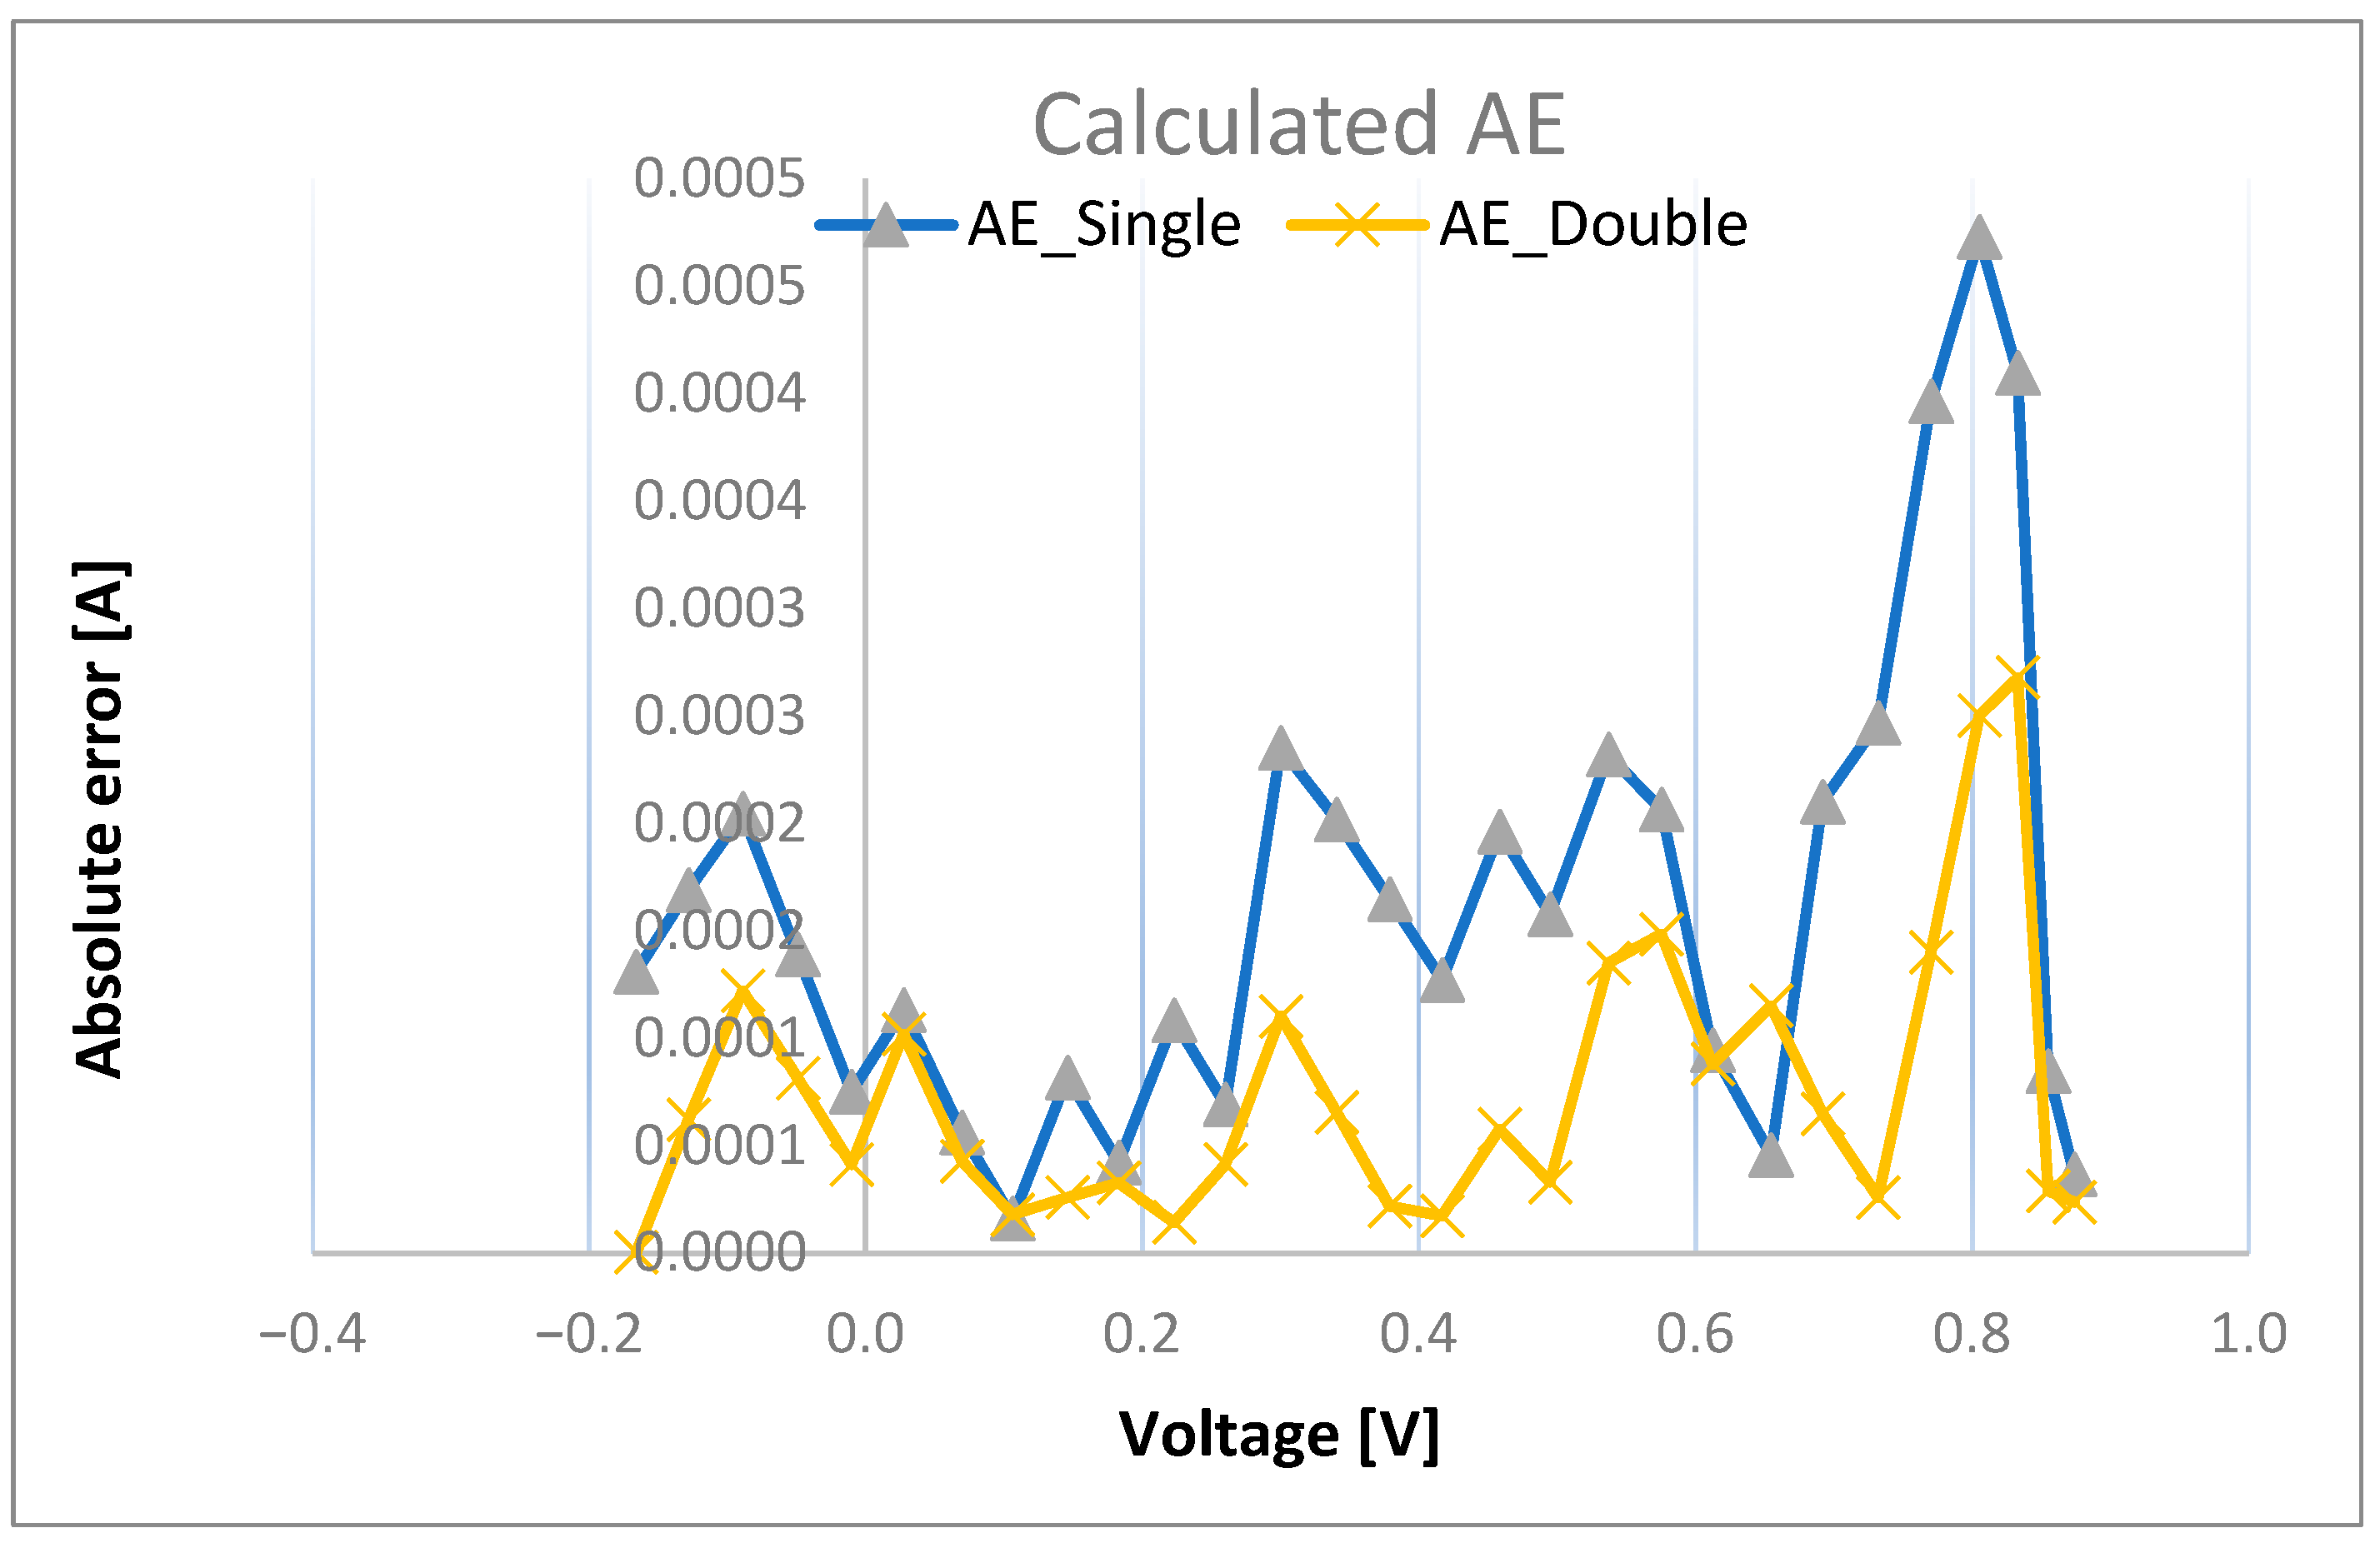
The absolute errors acquired by the algorithm are shown in
Figure 18, which illustrates the differences between the observed current and the predicted current for both the SDMs and DDMs. In the case of the DDM, the absolute errors are very low in comparison with the ones calculated with the SDM.
The PSA’s convergence curves for both models are shown in
Figure 19. The algorithm’s maximum iteration was set at 1500, with a population of 100. The graph shows which iterations the algorithm went through to reach the lowest RMSE value. The PSA began to evade the local minimum for the SDM around iteration 270 at 80 populations, arriving at the ideal RMSE value. For the DDM, on the other hand, this improvement started at iteration 370 at population 65, showing that it required a few more iterations to obtain the ideal RMSE value compared to the SDM.
To provide a clearer view of performance consistency, the convergence curves are accompanied by shaded bands representing ± standard deviation at each iteration. These bands indicate the degree of fluctuation in RMSE values and offer visual confirmation of the PSA’s stability and reliability during the optimization process.
Two tests were undertaken for both the SDMs and DDMs to find the appropriate combination of iteration size and population size for achieving the ideal RMSE in the case of PVM.
The population size in the first experiment varied from 20 to 100, but the number of iterations remained constant at 100. This method, however, did not produce the best results, as the lowest RMSE value was found when both the population size and iteration were set to 100. This resulted in an RMSE of 2.2031 × 10⁻³ and a computation time of 0.6249 s for the SDM. Meanwhile, the DDM achieved a minimal RMSE of 5.9449 × 10⁻⁴ in 0.9250 s of computing time.
In the second experiment, the number of iterations varied by 200 each time while the population size remained the same. The best RMSE value for the algorithm was calculated using this strategy. The SDM’s optimum RMSE solution, computed with 1500 iterations and a population size of 50, took about 4.6392 s to complete. With a population size of 50, the optimal solution in the DDM was similarly discovered after 1500 iterations; however, this time the calculation took roughly 6.8158 s. Finding the ideal RMSE requires more iterations for the DDM than it does for the SDM since the DDM requires the extraction of seven parameters. The findings of the SDM analysis are shown in
Table 16, while the DDM analysis results are shown in
Table 17.
In this experiment, summarized in
Table 18, the performance of the SDMs and DDMs was evaluated in terms of CPU execution times across two processors: Intel Core i9 and AMD Ryzen 5 5600H. On the Intel Core i9, the DDM required 8.5112 s, significantly more than the 5.2231 s for the SDM. Similarly, on the AMD Ryzen 5, the DDM took 12.1566 s compared to 9.8966 s for the SDM. The differences in execution times between the processors also highlight the Intel Core i9’s better efficiency in managing computational workloads, which is likely due to its optimized architecture and superior single-thread performance.
3.5. STM6-40 Panel
The third solar panel under consideration is an STM6-40 monocrystalline panel manufactured by Schutten Solar. These panels are made up of 36 cells connected in series [
50]. The I–V characteristic of the STM6-40 is measured at 1000 W/m
2 irradiance and 51 °C. The dataset of 20 points [
35], which is shown in
Table S5, used to extract the parameters, includes the current values derived using the SDMs and DDMs, as well as their corresponding errors.
The STM6-40 photovoltaic panel’s PSA-obtained parameters are displayed in
Table 19 for both the SDM and DDM types. The SDM took 2.56053 s to execute, while the DDM version took 4.4231 s. RMSE, MBE, and STD were used to evaluate the effectiveness of the algorithm.
The PSA is compared with ELADE, HSDA, GSK, IMPA, DE/BSA, reinforcement learning-based differential evolution (RLDE) [
51], rnhanced leader particle swarm optimization (ELPSO) [
52], conventional PSO (CPSO) [
52], backtracking search algorithm (BSA) [
52], and artificial bee colony (ABC) [
52]. The PSA and other algorithms produce comparable RMSE values for the SDM, showing no variation in performance. However, when comparing PSA with ELPSO, it is roughly 20.6% better. The DDM’s RMSE value is 1.83% better than HSDA’s result and 7.72% better than it was when ELPSO was used. For both models, the RMSE performance of the PSA beats the other algorithms.
RMSE for SDM shows that the PSA yielded the same results (1.72981 × 10
−3) as the ELADE, HSDA, RLDE, IMPA, and GSK algorithms, showing that the differences between them were quite small. In the case of the DDM, when compared to other algorithms like HSDA and ELPSO, however, certain key differences become apparent.
Table 19 shows that, in contrast, the PSA consistently achieves the highest statistical success rates in the DDM. When compared to other methods, the PSA’s study of all obtained parameters reveals significant discrepancies.
The PSA’s parameters displayed slightly bigger variations in values as compared to HSDA in the SDM, leading to a slightly better RMSE value than that produced by other algorithms. On the other hand, the PSA was better in the case of the DDM with an RMSE of 1.6892 × 10⁻³ compared to either HSDA with 1.72072 × 10⁻³ or ELPSO with 1.8307 × 10⁻³. This is because the PSA could make more subtle changes to reverse saturation for the recombination and generation mechanisms, as well as changes to series and shunt resistance. Calculating the RMSE for each parameter of an STM6-40 photovoltaic module shows that the PSA method can find the best solution without becoming stuck in local minima.
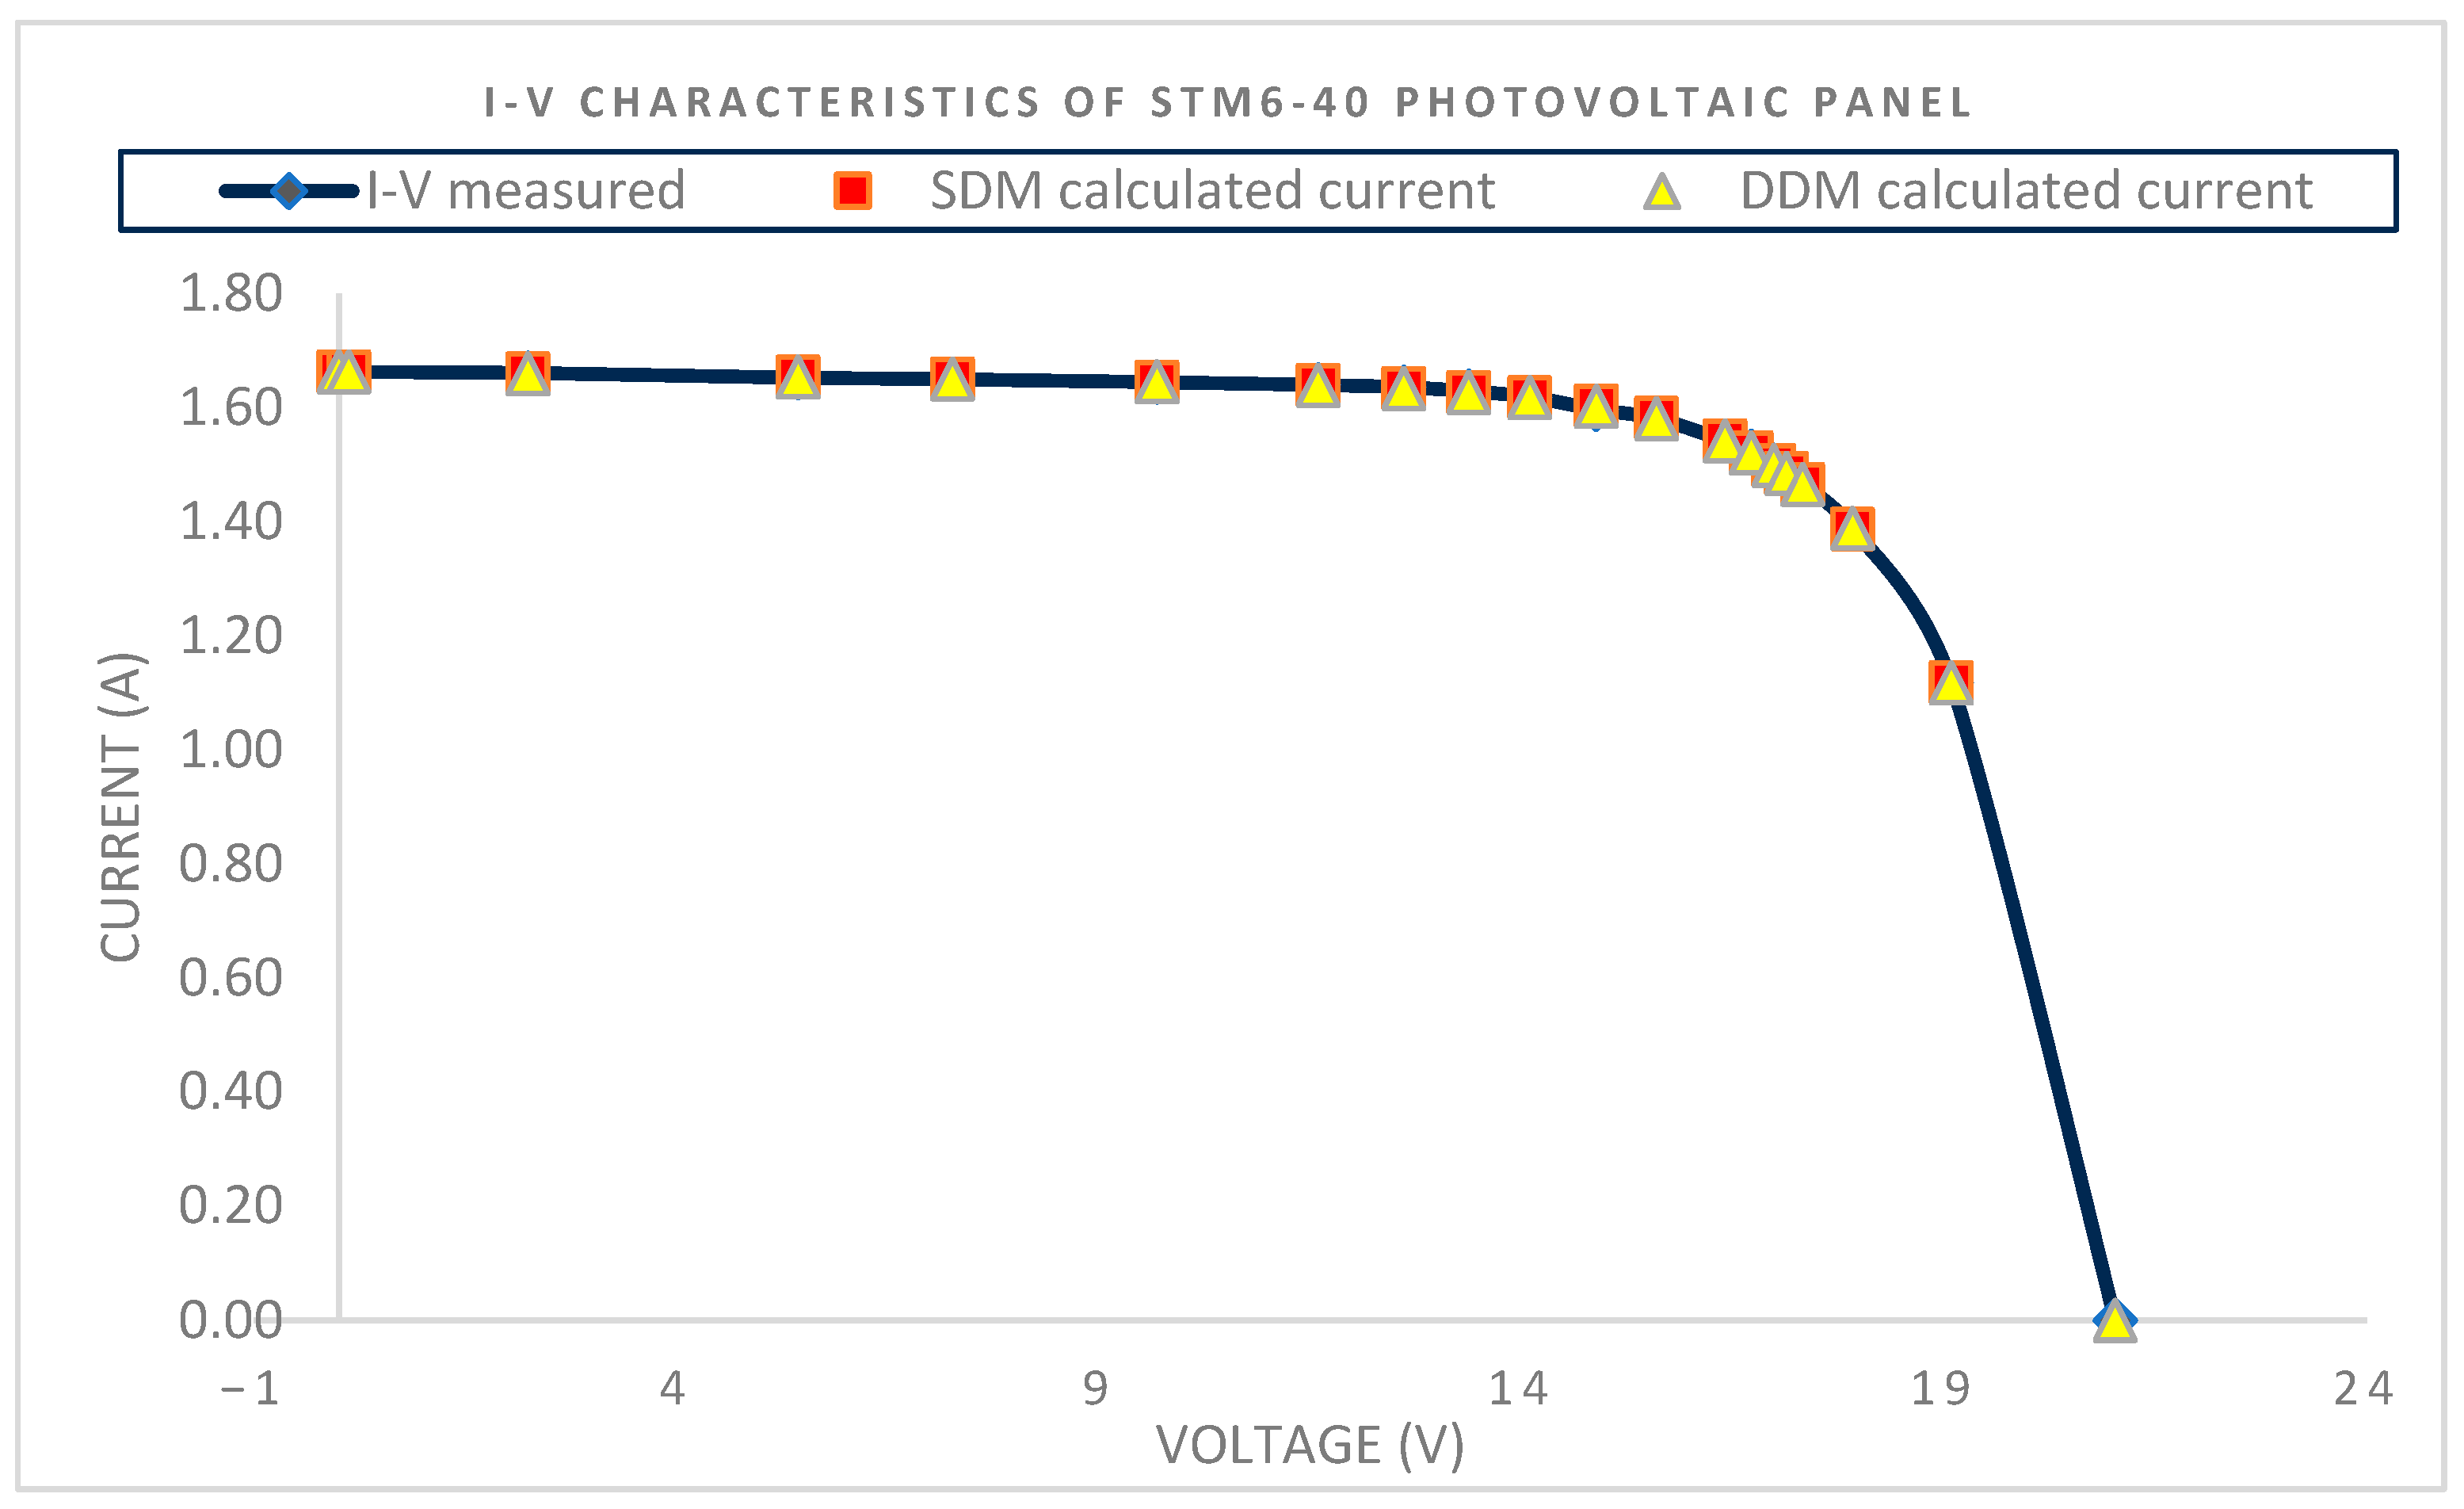
Figure 20 and
Figure 21 depict the consistency between the estimated and observed I–V and P–V characteristics generated by the PSA, allowing one to visually identify the discrepancies between the measured and calculated current in both the SDMs and DDMs.
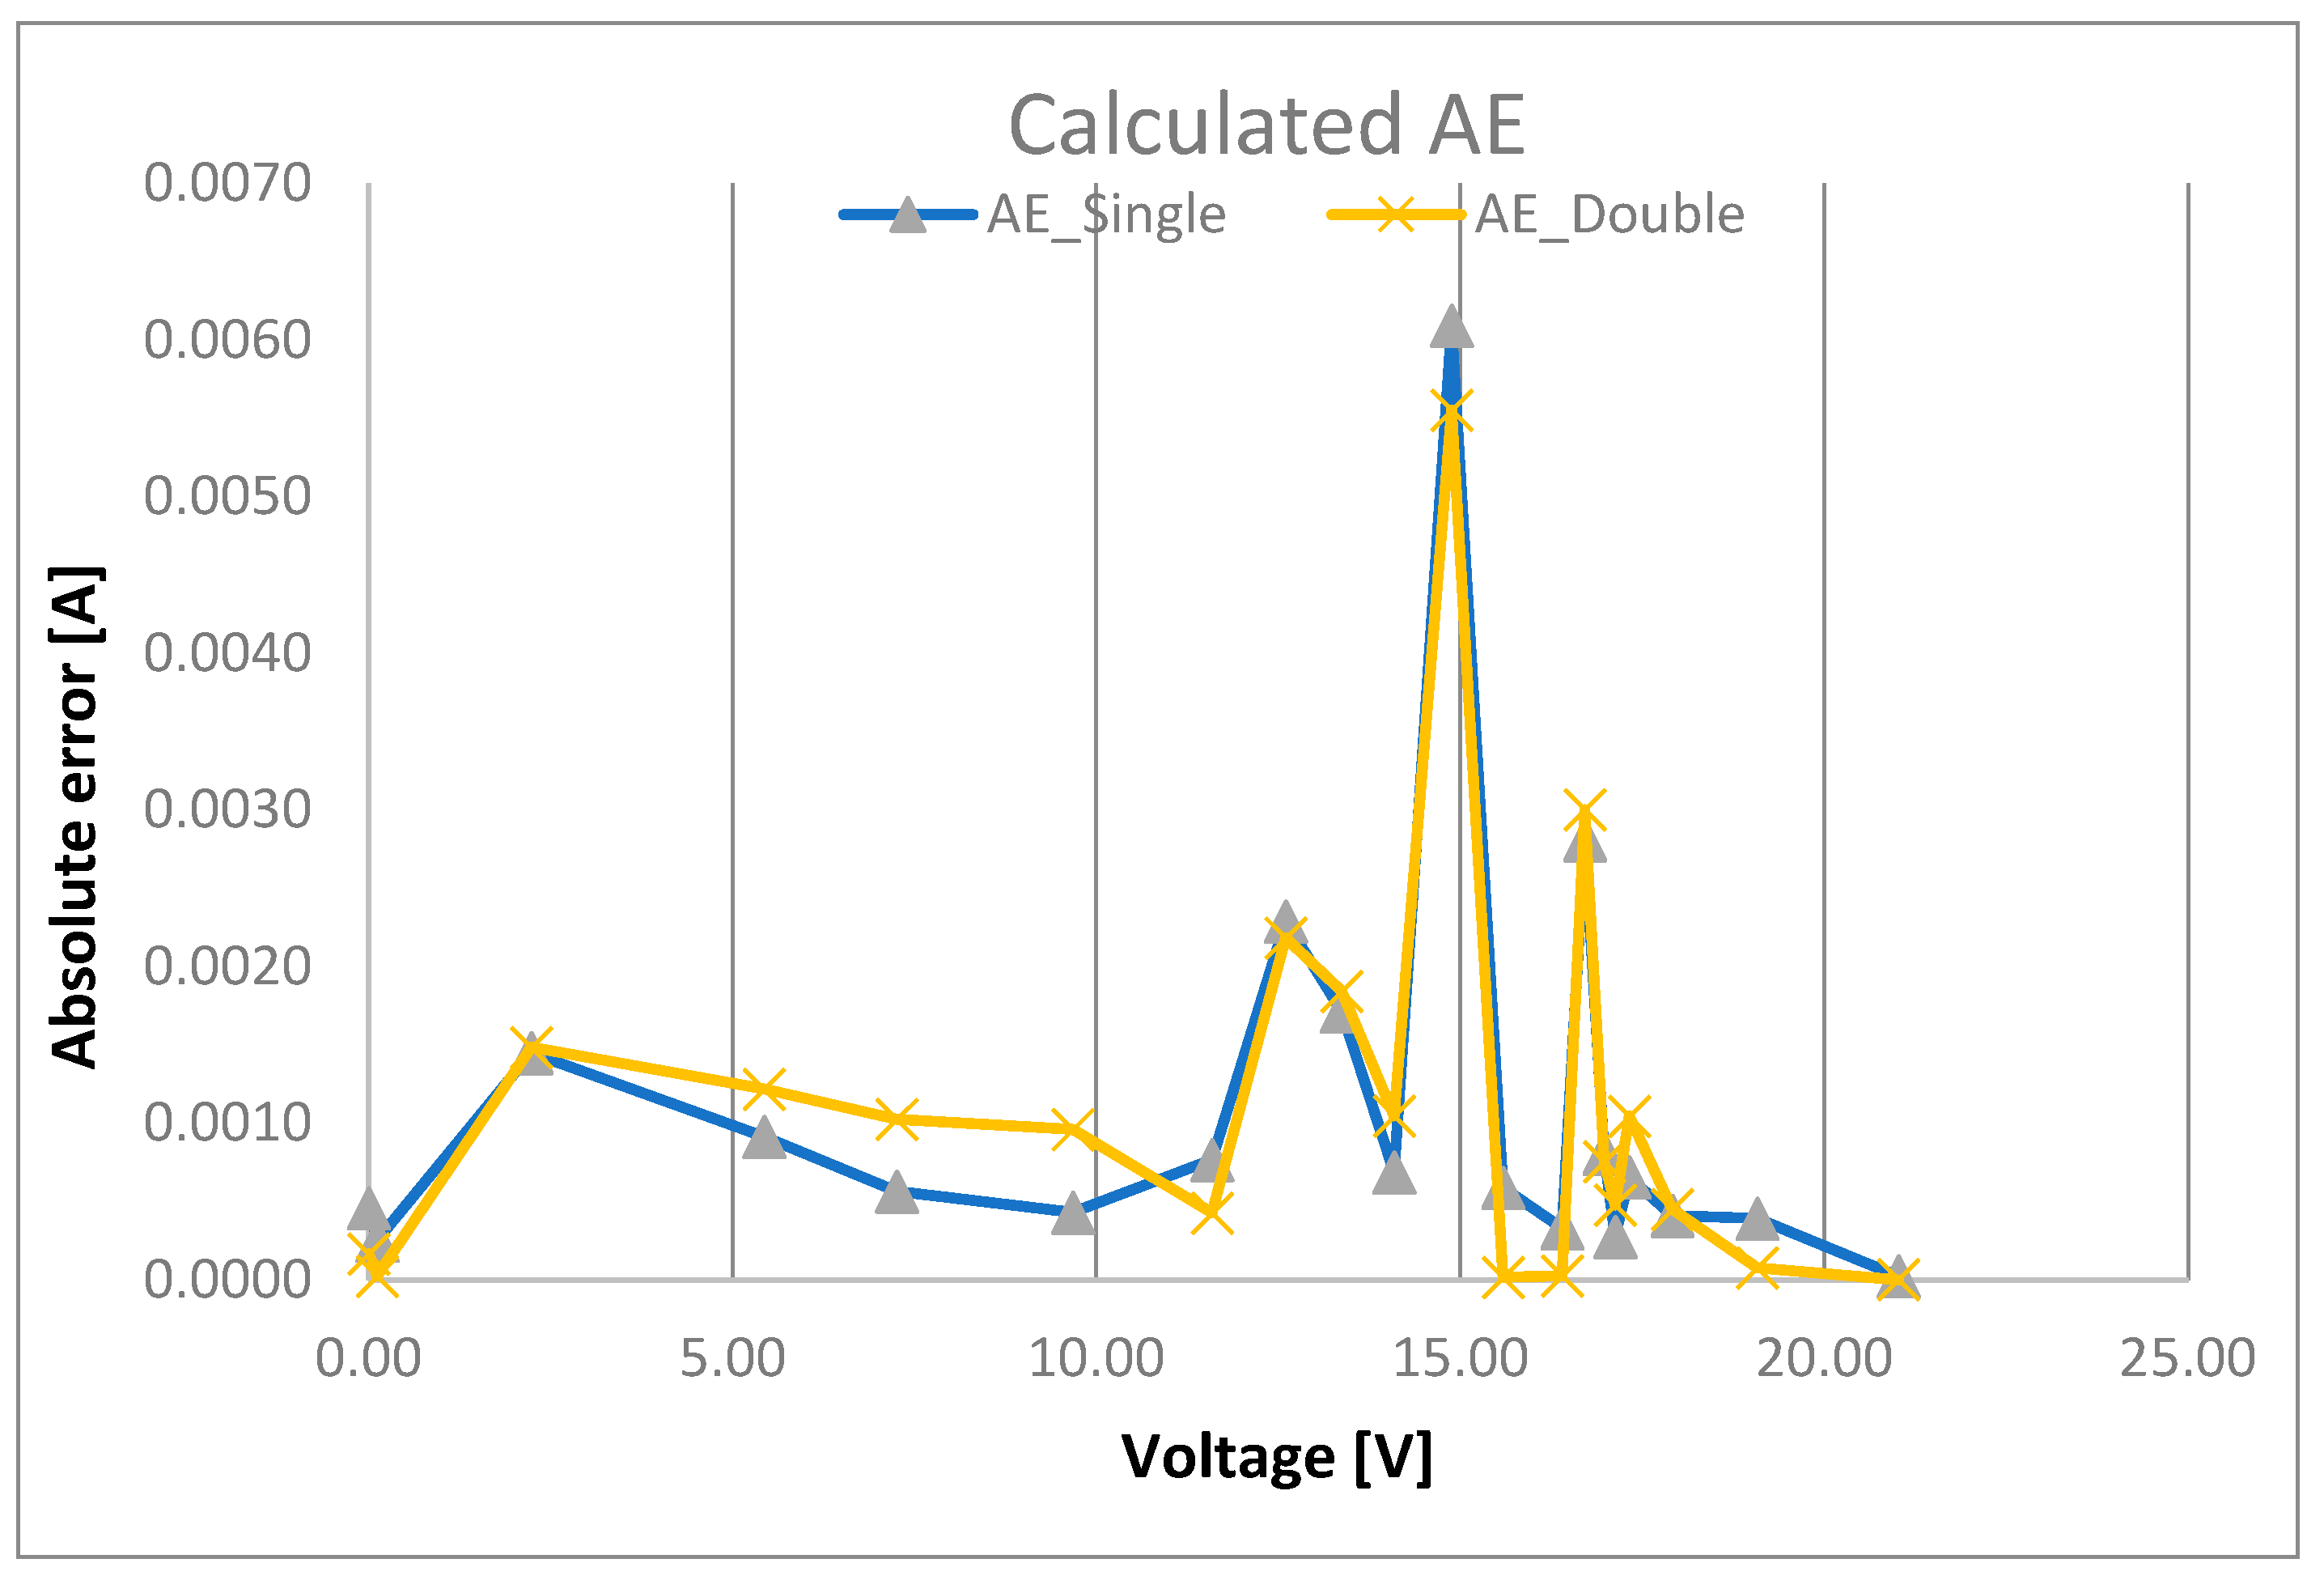
Figure 22 displays the absolute errors, which are estimated by the PSA, between the observed and predicted currents for both models.
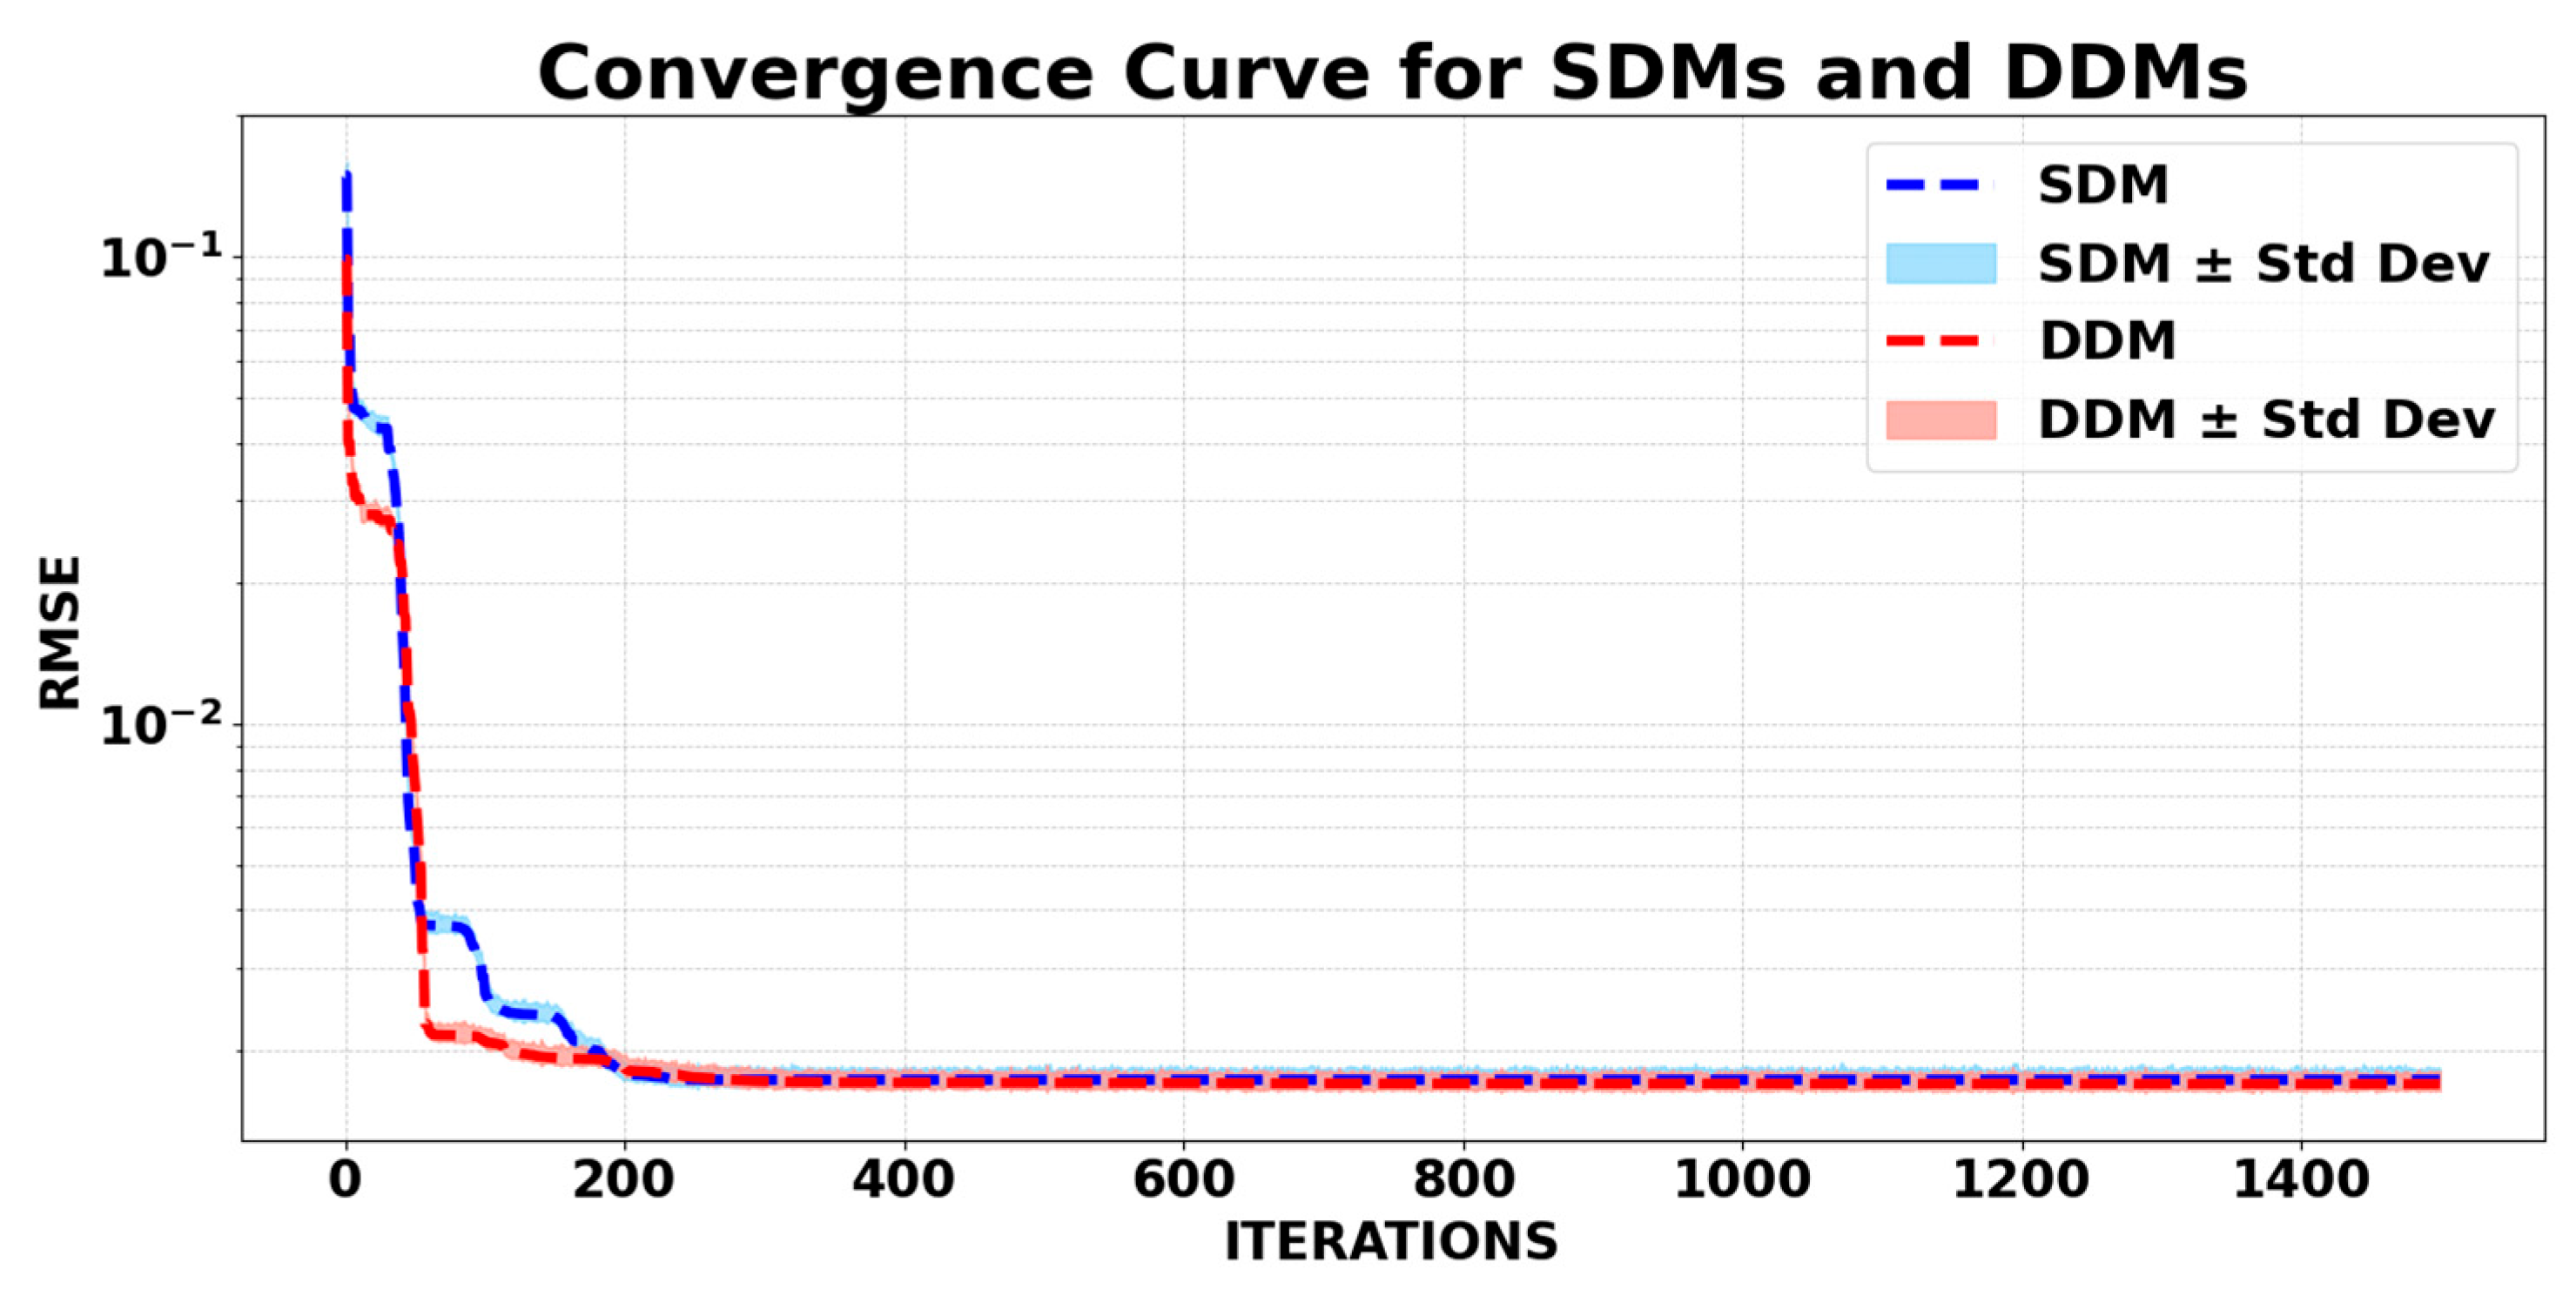
The PSA’s convergence curves are shown in
Figure 23 for both models, with a maximum of 1500 iterations and a population size of 100. The figure shows the iteration at which the algorithm started attaining the minimum RMSE. At iteration 50 and a population of 89, the PSA began to escape the local minimum and eventually reached the optimal RMSE for the SDM. However, in the DDM, the PSA started making headway toward the best possible solution around iteration 120 and a population of 33.
To assess the consistency of the algorithm’s performance, shaded regions representing ± standard deviation across the iterations have been added to the convergence curves. These bands help visualize the variability in RMSE values throughout the optimization and provide further evidence of the algorithm’s robustness and stability across runs.
Two experiments were performed to establish the ideal iteration size and population size for minimizing the RMSE in the context of STM6-40. While the number of iterations was held constant at 100 for both models, the population size ranged from 20 to 100 in the first investigation. The shortest RMSE values were achieved when the population size and iteration were both set to 100; therefore, this strategy did not end up being the most effective. The resulting RMSE for the SDM was 2.08 × 10⁻³, and the computation took 0.3170 s. The best RMSE value for the DDM was 1.80 × 10⁻³, and it took 0.486 s to compute.
The second experiment involved keeping the population size the same but increasing the number of iterations by a factor of 200. This was a more efficient means of determining the RMSE of the algorithm. It took about 1.0971 s to calculate the optimal RMSE solution for the SDM with a population size of 50 and 700 iterations. However, the DDM required a larger number of iterations (1500) and a population size of 50, resulting in a computation time of about 3.5337 s due to the need to extract seven parameters. The intricacy of parameter extraction necessitated a longer iteration time in DDM to achieve the best RMSE.
Table 20 displays the SDM analysis results, and
Table 21 displays the DDM analysis results.
Table 22 examines the performance of both PV models in terms of CPU execution times on two processors: Intel Core i9 and AMD Ryzen 5 5600H. In terms of computational performance, the Intel Core i9 consistently outperformed the AMD Ryzen 5 5600H. For the SDM, the Intel Core i9 required 2.6012 s, significantly faster than the 4.9071 s taken by the AMD Ryzen 5. Similarly, for the DDM, the Intel Core i9 completed the task in 4.4091 s, whereas the AMD Ryzen 5 required 8.0901 s. These results highlight the Intel Core i9’s efficiency and better optimization for the given workload.
3.6. Multijunction Solar Cells (MJSC)
Three datasets were measured for an InGaP/InGaAs/Ge multijunction solar cell (MJSC) at three different temperatures. The MJSC, with a 1 cm
2 active area, was tested under one-sun irradiance at three temperature conditions: Case A (41.5 °C), Case B (51.3 °C), and Case C (61.6 °C). These measurements were conducted in natural sunlight using the RELab system. The datasets were utilized to extract either five or seven parameters of the MJSC based on the SDMs and DDMs [
33]. The associated errors and current values derived from the three cases are presented in
Tables S6–S8.
The PSA was compared with other methods, including BWOA, the Chameleon Swarm Algorithm (CSA) [
33], and the 5P method. The results obtained using the PSA for both the SDMs and DDMs are summarized in
Table 23. To evaluate algorithm performance, the statistical tests RMSE and MBE were employed.
The PSA consistently outperformed BWOA and CSA across all temperatures and models. It achieved significant RMSE reductions, with improvements of up to 42.26% over BWOA and 88.11% over CSA. Additionally, the PSA demonstrated exceptional accuracy and stability in parameter extraction, particularly for , , , and , even in complex scenarios and at higher temperatures.
At Case A (41.5 °C), for the SDM, PSA achieved the lowest RMSE of 7.8273 × 10⁻⁵, improving over BWOA and CSA by 12.17% and 23.17%, respectively. The extracted parameters from PSA showed minimal variation, particularly for the photogenerated current (), which differed by only 0.12% compared to other algorithms. Moreover, PSA outperformed its counterparts in accurately estimating reverse saturation current () and shunt resistance (), with deviations significantly lower than those produced by CSA. In the DDM, PSA continued to lead with an RMSE of 7.803119 × 10⁻⁵, reflecting a 12.42% improvement over BWOA and a 22.67% improvement over CSA. The extracted parameters from PSA were more consistent, with and values remaining stable, while and exhibited less deviation than those obtained using the CSA.
At a higher temperature of 51.3 °C (Case B), PSA maintained its leading performance. For the SDM, it achieved an RMSE of 7.538744 × 10⁻⁵, marking a significant improvement of 20.23% over BWOA and 25.99% over CSA. The parameters extracted by PSA, particularly and , remained stable and accurate despite the increased thermal stress. The differences in were slightly more pronounced, with PSA differing from BWOA by 0.10% and from CSA by 0.14%. These values reflect a slight increase in variability as temperature rises, which is expected due to the thermal impact on solar cell behavior. Additionally, the ideality factor () showed reduced variation, ensuring reliable modeling under these conditions. In the DDM, PSA achieved an RMSE of 7.5161575 × 10⁻⁵, which was dramatically better than the BWOA and CSA, with improvements of 42.26% and 36.74%, respectively. The extracted parameters for and were notably more consistent, avoiding the exaggerated deviations seen with CSA. Furthermore, PSA managed to align its and values with expected trends, demonstrating its robustness in handling the complexity of the DDM.
Under the most challenging conditions at 61.6 °C in Case C, PSA’s ability to maintain accuracy was evident. For the SDM, it achieved an RMSE 6.7754050 × 10⁻⁵, a 30.01% improvement over BWOA and an impressive 88.11% over CSA. The extracted parameters, including and , remained highly accurate, and the differences in increased further, with PSA differing from BWOA by 0.20% and from CSA by 0.30%. These results highlight the challenges posed by high-temperature conditions, where thermal noise and variability in the dataset can affect parameter extraction, reflecting PSA’s capability to handle the noise and variability introduced by higher temperatures. Additionally, and were extracted with significantly reduced deviations compared to CSA, ensuring a more precise representation of the solar cell’s behavior.
The best results obtained to extract the parameters of the MJSC for three temperatures are obtained using the PSA for both models by comparing the obtained results with the other algorithms in terms of RMSE, MBE, and STD.
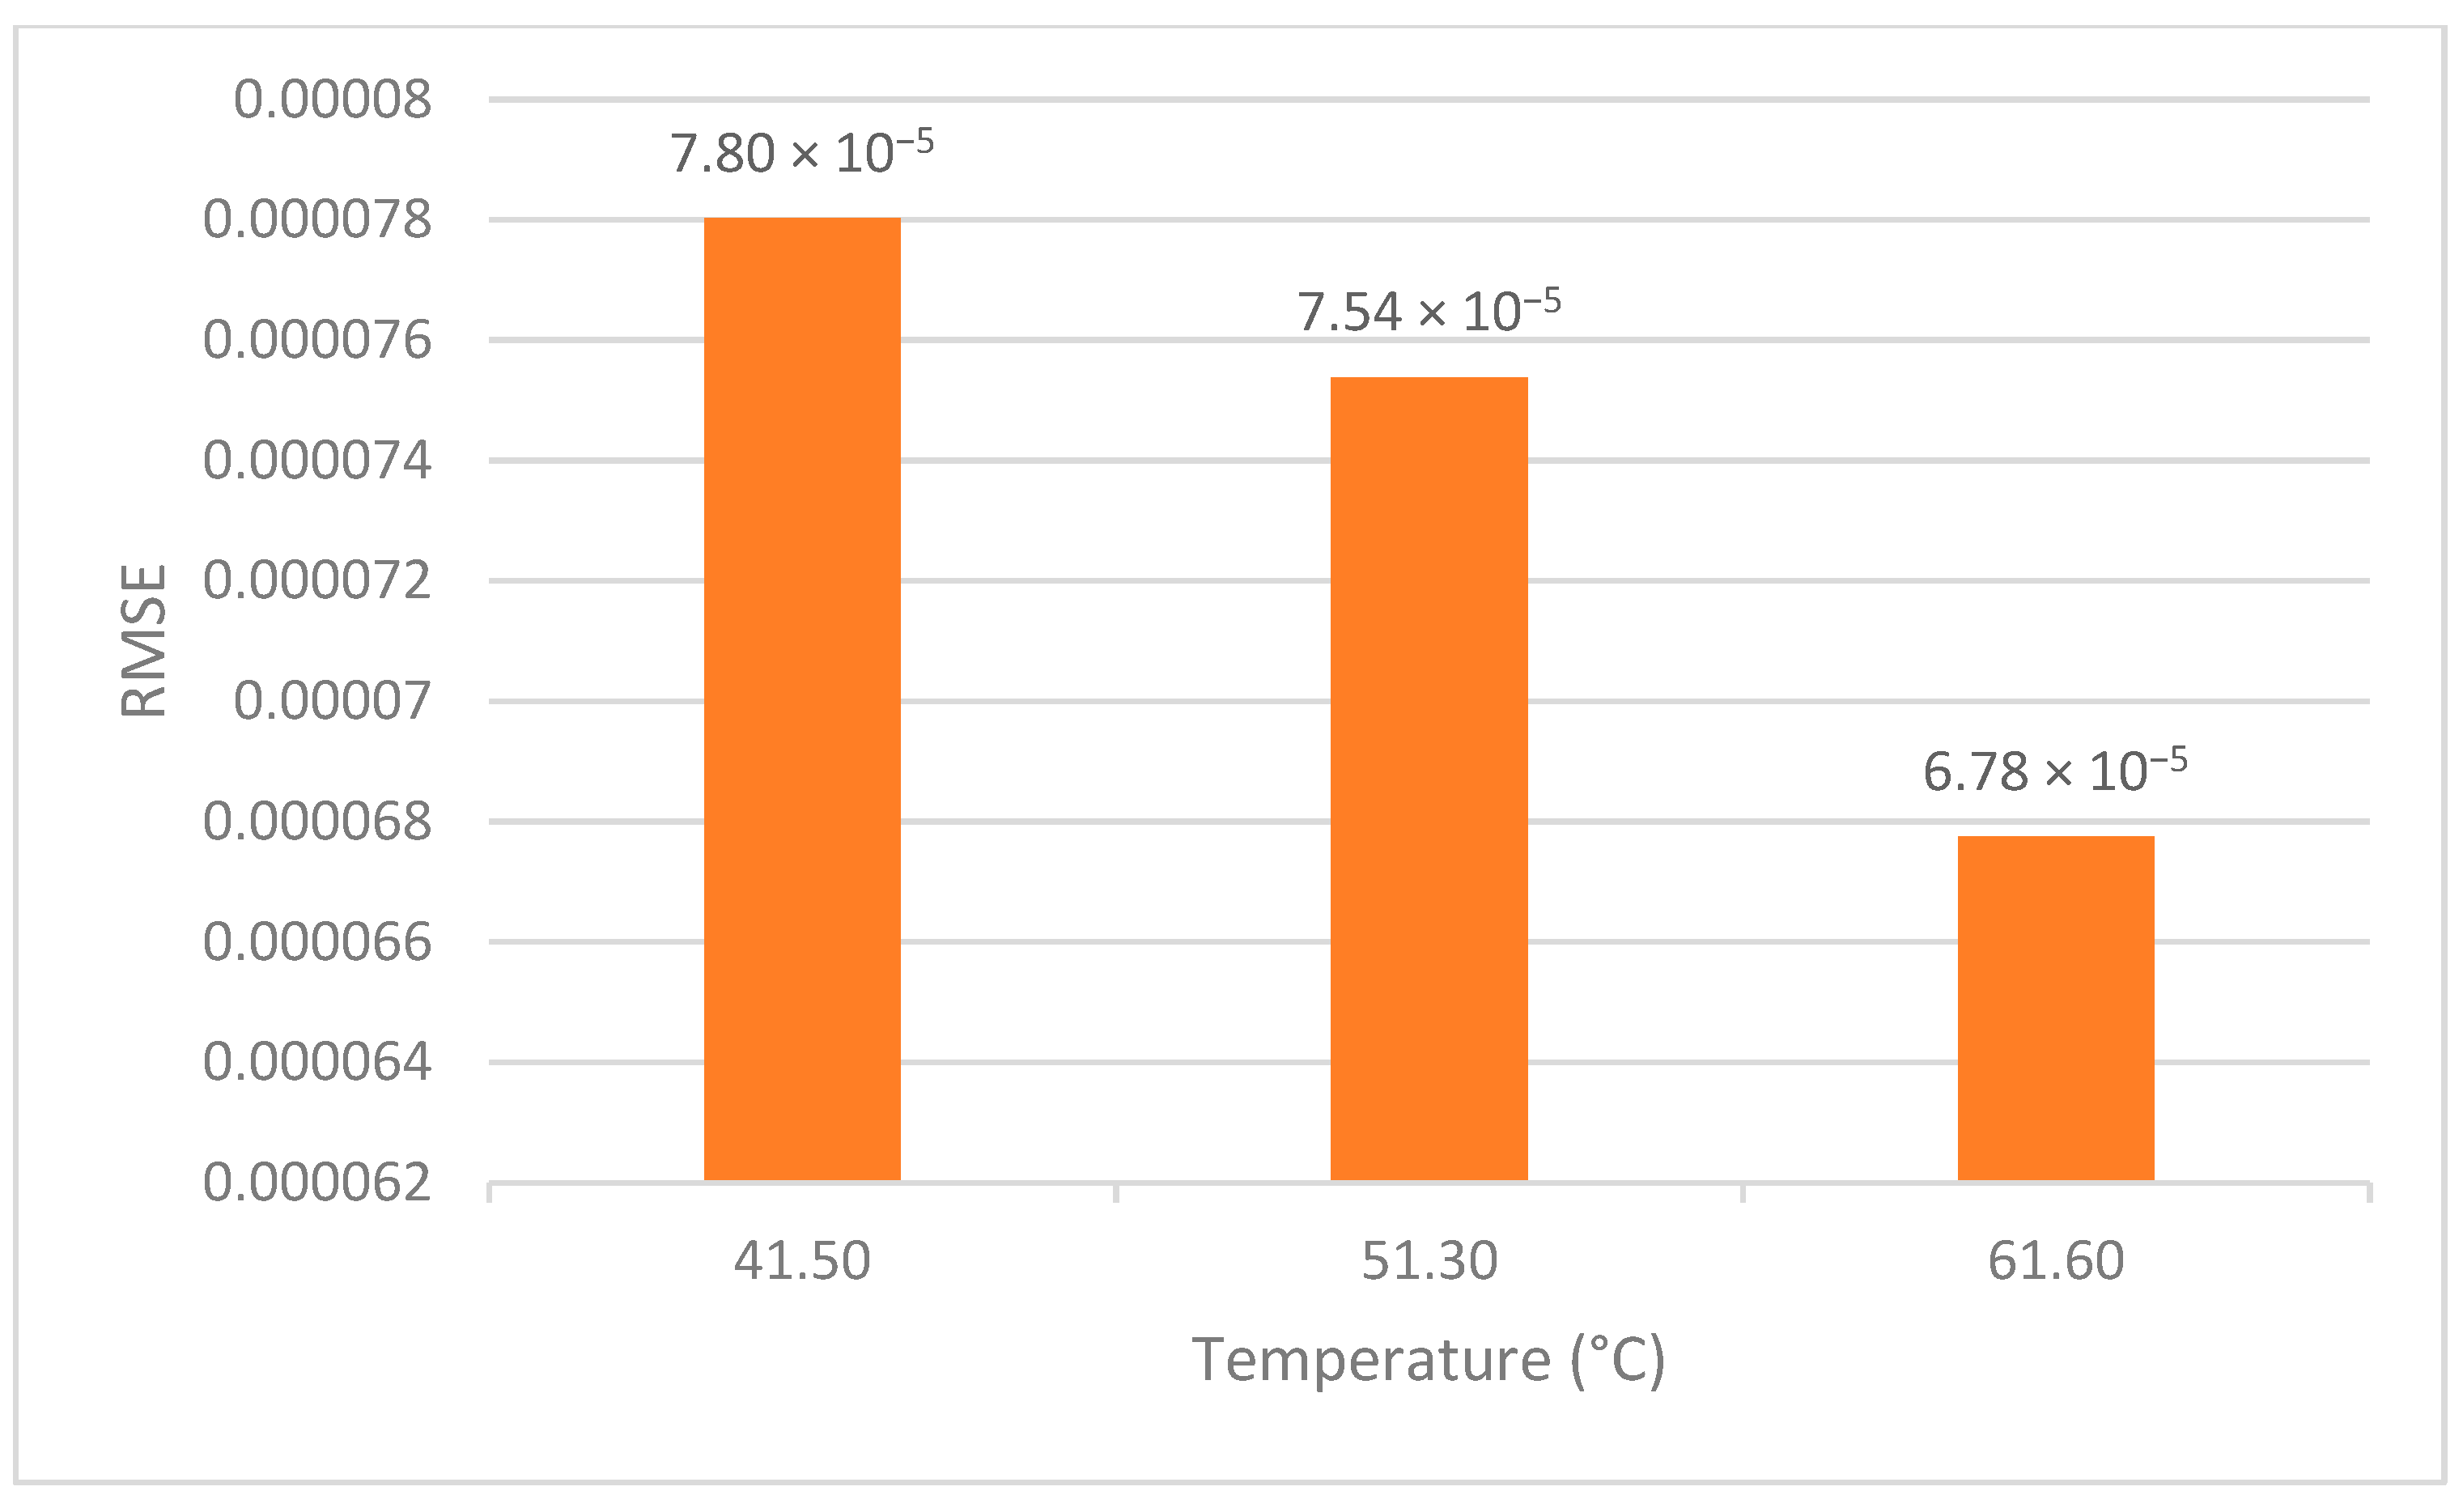
The reduction in RMSE between the temperatures is significant (
Figure 24). At 51.3 °C, the RMSE improves by 3.68% compared to 41.5 °C. As the temperature increases to 61.6 °C, the RMSE further improves by 10.12% compared to 51.3 °C. Overall, the RMSE improves by 13.43% when comparing the highest temperature (61.6 °C) to the lowest (41.5 °C).
Table 24 compares the performance of the SDM and DDM across three temperature scenarios—Case A (41.5 °C), Case B (51.3 °C), and Case C (61.6 °C)—on Intel Core i9 and AMD Ryzen 5 5600H processors. As temperature increases, run times vary slightly, with the SDM consistently requiring less time than the DDM. For example, in Case A, the SDM’s run time is 3.1843 s compared to 4.099 s for the DDM, with similar trends in Cases B and C. The Intel Core i9 consistently outperforms the AMD Ryzen 5 in CPU execution times, completing tasks in as little as 2.9817 s (SDM, Case C) compared to Ryzen’s 4.0331 s. Notably, the Intel Core i9’s CPU execution times are slightly lower than the total run times due to its efficient handling of task overheads, while the AMD Ryzen 5’s results are closer to the total run times, highlighting the i9’s superior computational efficiency.
4. Conclusions
This research introduced a novel metaheuristic algorithm, the PID-based search algorithm (PSA), for extracting parameters of PV cells and panels. By optimizing the proportion, integral, and differential parameters and relocating initial error calculations outside the iterative loop, the PSA demonstrated enhanced exploration, exploitation, and computational efficiency. The algorithm’s performance was validated using both SDMs and DDMs across datasets, including RTC France, aSi, mSi, and various photovoltaic panels. Compared to 26 state-of-the-art algorithms using four statistical tests, the PSA consistently achieved superior or comparable accuracy.
In particular, the RTC France DDM yielded RMSE improvements of 0.67–2.10%, while the mSi cell demonstrated up to 40.9% RMSE improvement compared with the ISOA, which obtained 4.4383 × 10⁻⁴, while PSA obtained 2.6216 × 10⁻⁴ with execution times of 3.94 s for the SDM and 5.57 s for the DDM. Additionally, the PSA required smaller population sizes and fewer iterations, underscoring its practicality. Testing the PSA under diverse conditions, including the multijunction solar cell (MJSC) at three different temperatures (41.5 °C, 51.3 °C, and 61.6 °C), demonstrated its reliability and effectiveness. It achieved average RMSE improvements of 12.17–12.42% across BWOA and CSA and execution times as low as 2.98 s for SDMs and 4.10 s for DDMs. The PSA was also tested using two CPUs—Intel Core i9 and AMD Ryzen 5 5600H—to evaluate CPU efficiency, with Intel Core i9 consistently achieving faster results. The extracted parameters, such as , , , and , were highly accurate and stable, even under high thermal stress.
To enhance the robustness and practical applicability of the PID-based Search Algorithm (PSA) in real-world environments, future work will integrate strategies to handle uncertainties such as sensor noise, environmental variability, and data imperfections commonly encountered in field conditions. One promising direction is the use of stochastic perturbation models that simulate noisy I–V measurements, enabling PSA to be tested and calibrated for resilience under such conditions. Moreover, the control-based nature of PSA allows for adaptive adjustment of the PID coefficients (, , ) in response to the algorithm’s convergence behavior, which can improve stability and prevent premature convergence. Building on these enhancements, future work will apply PSA to emerging challenges, including perovskite solar cell modeling, triple-diode models, and PV panel power output prediction, further demonstrating its accuracy, flexibility, and potential for advancing complex photovoltaic systems.


