Abstract
The objective of this study is to examine the variations in the properties of cementitious materials subjected to bending loads in conjunction with dry and wet cycles of sulfate exposure. This investigation involved applying continuous bending loads at 0%, 20%, and 40% of the ultimate bending capacity to cementitious material specimens. Furthermore, three sets of mortars and concretes with differing water–cement ratios were formulated and analyzed using X-ray diffraction, scanning electron microscopy, and compressive strength tests. The findings indicated that while the flexural strength, compressive strength, and porosity of the specimens initially increased, they ultimately declined as the cementitious materials degraded over time within the sulfate solution. Additionally, it was observed that an increase in bending load corresponded with a decrease in flexural strength, alongside a rise in the internal sulfate ion concentration. By integrating an enhanced form of Fick’s second law with chemical reaction kinetics, a transport model for sulfate ions in cement-based materials was developed under the coupling effect of bending load and sulfate exposure, utilizing Comsol Multiphysics. The simulation results, which align well with the experimental observations, exhibit an error of approximately 5% at a depth of 5 mm.
1. Introduction
Cementitious structures are widely employed in saline regions due to their remarkable construction advantages [1,2,3,4]. In practical engineering applications within such environments, the structures of cementitious materials are inevitably experience damage, primarily through sulfate corrosion and various loading conditions [5,6,7]. This corrosion adversely affects the strength, elastic modulus, and other properties of cementitious materials, ultimately reducing in their durability and service life [8,9]. Consequently, extending the service life of cementitious materials in saline environments has emerged as a critical issue that requires immediate attention [10,11,12].
In recent years, numerous researchers have conducted extensive investigations into the durability of cement-based materials in saline environments relevant to practical engineering. In concrete specimens, as the erosion duration increases under the combined effects of sulfate exposure and dry–wet cycles, noticeable micro-cracks initially develop in their interfacial transition zones [13,14,15]. During the early stages of sulfate attack, the durability of cement-based materials correlates positively with their strength; higher-strength materials demonstrate greater longevity. However, at later stages of sulfate attack, porosity becomes the predominant factor influencing durability [16]. Furthermore, when examining ratios for dry–wet cycle durations such as 1:1, 3:1, 5:1, and 7:1, higher ratios facilitate the more rapid transport of sulfate ions into concrete, resulting in exacerbated erosion [17].
Loading further accelerates sulfate-induced deterioration [18]. Yu et al. [6] investigated the sulfate attack on concrete under dynamic bending loads, and the results indicated that the solution concentration and stress level were the two main factors of the sulfate attack event. Xu et al. [19] studied the influence of sulfate corrosion on the axial compressive load of concrete, and the results showed that under continuous compressive load, the compressive strength, ultrasonic velocity, and dynamic elastic modulus all increased with age. With increasing bending loads coupled with sulfate exposure effects, concrete deterioration becomes increasingly pronounced as the bending load intensifies [20]. Similarly, under simultaneous fatigue loading and dry–wet cycles involving sulfates, both factors can expedite sulfur ion migration within concrete, thereby accelerating its degradation process [21,22].
The behavior of sulfate transport within concrete is typically simulated through both chemical interactions and mechanical coupling effects [23,24,25]. Some studies have identified volumetric strain as a primary contributor to crack formation within concrete structures [26]. The four-point bending test serves as a reliable method for validating model findings that indicate that external loads exacerbate concrete deterioration during sulfate attacks [27]. Moreover, the diffusion model for sulfate ions suggests that the corrosion depth increases with elevated concentrations of sulfur solutions concentrations along with increased water–cement ratios and higher coarse aggregate content levels [28].
How sulfate erosion affects the performance characteristics of cementitious materials subjected to bending loads remains an area requiring further investigation. Currently, there is a limited body of research investigating the microscopic transport of sulfates in cement-based materials under the combined influence of bending loads and environmental factors, particularly concerning the quantitative relationship between sulfate attack and porosity. Therefore, it is essential to analyze sulfate ion transport mechanisms attributable to the coupling of bending forces and sulfate exposure. We designed an experiment to investigate the deterioration effect of cement-based materials under the coupling action of 0%, 20%, and 40% of the ultimate bending load and sulfate in dry–wet cycles. Additionally, a relative model was established, which aimed to predict sulfate-induced degradation processes impacting the integrity of cementitious.
2. Experiments
2.1. Raw Materials
The P·O 42.5 cement used in this study was produced by Xinjiang Tianshan Cement Co., Ltd. (XinJing, China). The chemical composition is detailed in Table 1. The fine aggregate was from Kashi, featuring a fineness modulus of 2.86, an apparent density of 2460 kg/m3, and a silt content of 0.5%. The coarse aggregate comprised crushed gravel, with particles ranging in size from 5 to 10 mm, a mud content of 0.7%, and an apparent density of 2680 kg/m3. The water-reducing agent used was a high-performance, polycarboxylic acid-based liquid with a water reduction rate of 25% to 40%. Tap water was utilized as the mixing water.

Table 1.
Chemical composition of cement from XRF (X-ray fluorescence) test.
2.2. Mix Proportion
The experiments were structured around three different mortar mix ratios, designated as M1, M2, and M3, as well as three concrete mix ratios, referred to as C1, C2, and C3. The specific mix proportions for each group are provided in detail in Table 2.

Table 2.
Mix proportion.
2.3. Sulfate Wet and Dry Cycle
The dry and wet cycle testing was conducted in accordance with the Chinese standard GB/T50082-2009 [29]. The procedure involved several steps: specimens were initially dried for 48 h in an oven maintained at a temperature of 80 °C. Following this, the specimens were immersed in a 5% sodium sulfate solution for 15 h, after which they were removed and exposed to natural environmental conditions for 9 h. Each complete cycle lasted for 24 h, culminating in a total of 150 cycles performed. The dimensions of each specimen measured 40 mm × 40 mm × 160 mm. For preparation prior to testing, five sides of each specimen were sealed using epoxy resin glue, leaving one side exposed to potential erosion. To ensure reliability within each mix proportion group, three specimens were tested and the results were averaged.
2.4. Test Method
2.4.1. Mechanical Analysis
The ETM305F-2 computer-controlled electronic compression-bending integrated testing machine was employed to assess the bending and compressive strength of specimens that had been cured for 28 days and subjected to erosion for durations of 30, 60, 90, 120, and 150 days, in accordance with the Chinese standard GB/T 50081-2002 [30]. The maximum loading capacity of the testing machine was rated 300 kN, with an accuracy level of ±0.5. During the loading process, the loading rate was maintained between 0.5 and 0.8 MPa, while the test specimen was subjected to continuous and uniform loading until failure occurred. At this point, both the failure stress and load value were recorded.
2.4.2. Bending Load Loading Device
The bending load significantly influences the failure of cement-based material specimens, with variations in specimen failure observed at different load levels. In this study, a four-point loading device was selected, and the applied load value was calculated using Hooke’s law during the test design phase. Both the applied load value and the calculated ultimate bearing capacity were utilized to measure the actual loading conditions. To maintain a constant load throughout testing, the stiffness coefficient of the spring was assessed every 30 days. Due to rapid stress loss and changes in the stiffness coefficients associated with conventional springs, HADI et al. [31] investigated differences between butterfly springs and ordinary springs; their findings indicated that butterfly springs exhibited superior safety performance compared to ordinary springs, with carrying capacities several dozen or even hundreds of times greater than those of standard springs. Consequently, this study opted for butterfly springs as the components within the loading device. This apparatus is capable of simultaneously applying stress loads while executing sulfate wet–dry cycles [32].
Before the erosion test, the ultimate bending load of a group of specimens was tested first. Then, a group of specimens was selected for monotonic loading, with 5% of the ultimate bending load as the first-level load. At each load level, a reading microscope was used to observe the cracking condition of the specimens. The results showed that no obvious cracks were observed within the range of 40% of the ultimate bending load, and obvious micro-cracks appeared after exceeding 40%. Therefore, in this study, 20% of the ultimate bending load in the elastic state and 40% of the ultimate bending load in the proportional limit state were, respectively selected as the applied bending loads. During the erosion process, to prevent stress changes, the spring length was tested weekly and the spring stiffness coefficient was tested monthly, and the load was re-applied. To prevent the loading device from rusting due to the action of the erosion solution, the stress loading device was painted before immersion. The side of each specimen without an epoxy resin adhesive coating was designated as the bending and tension surface. A schematic representation of the loader is provided in Figure 1.
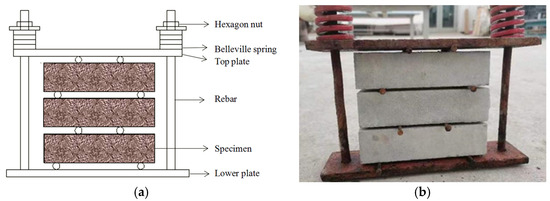
Figure 1.
Bending stress loading device: (a) sketch diagram; (b) picture of real eauipment.
2.4.3. SEM
The erosion products and microstructural morphology were analyzed using the Phenom Prox, an automatic tabletop electron microscope and spectroscope developed by FERNER. After a specified number of wet and dry cycles, a flat specimen measuring less than 5 mm in diameter and 2–3 mm in thickness was meticulously extracted. This sample was subsequently immersed in anhydrous ethanol for 24 h, followed by drying in an oven maintained at 40 °C for another 24 h.
2.4.4. XRD
The erosion products were analyzed using a TD-3500 X-ray diffractometer with a scanning range of 5° to 90°. Following the specified number of dry and wet cycles, the specimen was extracted and immersed in anhydrous ethanol to halt hydration, subsequently baked in an oven at 40 °C for 48 h, and then ground into a fine powder.
2.4.5. MIP
Microstructural analysis was conducted utilizing the AutoPore IV 9510 automatic pore testing system manufactured by Micrometrics. After completing the designated number of dry and wet cycles, a depth range of 5 mm within the specimen was selected, and samples were cut to approximately 3–5 mm in diameter using a cutting machine. The samples were then soaked in anhydrous ethanol for 5 to 7 days to terminate hydration, before being dried in an oven at 50 °C for a duration of 2 to 3 days.
2.4.6. EDTA
In the drill core sampling procedure, cement materials were selected from five depth intervals: 0 to 5 mm, 5 to 10 mm, 10 to 15 mm, 15 to 20 mm, and 20 to 25 mm using a drill core sampler. The EDTA complex titration method was subsequently employed to determine the concentration of sulfate ions at various depths. The detection principle is as follows: BaCl2 reacts with sulfate ions in the sample to form an insoluble white precipitate of BaSO4, while excess barium ions are titrated with an EDTA standard solution to ascertain the sulfate ion content.
3. Results and Discussion
3.1. Effect of Loading on the Mechanical Properties of Cementitious Materials Subject to Sulfate Erosion
Figure 2 illustrates the influence of load and sulfate coupling on the cementitious materials’ properties of cementitious materials. It is evident from Figure 2a–d that both the compressive and flexural strengths of the mortar and concrete, subjected to varying flexural loads, exhibit a general trend characterized by an initial increase followed by a subsequent decline. The peak values for the flexural and compressive strengths were achieved after completing 60 days of wet–dry cycles.
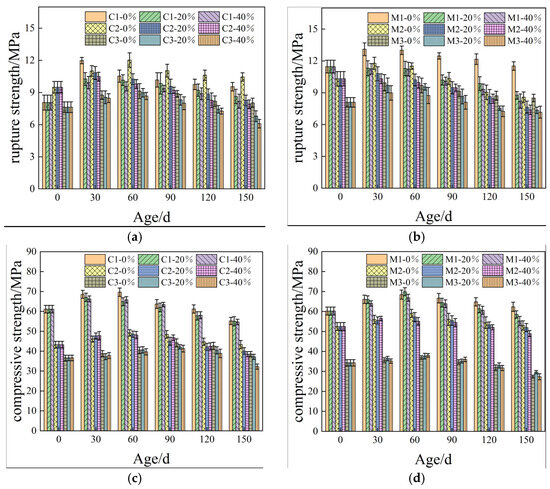
Figure 2.
Mechanical properties of cement-based materials influenced by load and sulfate coupling: (a) Rupture strength of concrete; (b) rupture strength of mortar; (c) compressive strength of concrete; and (d) compressive strength of mortar.
This observed phenomenon can be attributed to water evaporating from within the specimen during the drying cycle, leading to the formation of sulfate crystals formation, as depicted in Equation (1). Simultaneously, the wet cycle promotes the infiltration of sulfate ions into the specimen. Furthermore, once these sulfate ions penetrate the sample, they react with cementitious material to generate plaster. As erosive aging progresses, this plaster further interacts with the calcium aluminate and calcium hydroxide present in the cementitious matrix, resulting in the formation of calcium alumina compounds, as illustrated in Equations (2)–(6).
where CH is calcium hydroxide, C-S-H is calcium silicate hydrate, CS̅H2 is gypsum, C4AS̅H12 and C6AS̅3H32 are natural gas hydrates of calcium sulfoaluminate (AFt), C3A is a tricalcium aluminate hydrate, C is calcium oxide, A is aluminum oxide, S is silicon dioxide, and S̅ is sulfur trioxide.
Na2SO4 + 10H2O→Na2SO4 · 10H2O
CH + Na2SO4 + H2O→CS̅H2 + 2NaOH
C-S-H + Na2SO4 + H2O→CS̅H2 + 2NaOH
C4AS̅H12 + 2CS̅H2 + 16H2O→C6AS̅3H32
C3A + 3CS̅H2 + 26H2O→C6AS̅3H32
C4AH13 + 3CS̅H2 + 14H2O→C6AS̅3H32 + CH
The influence of the bending load on sulfate erosion manifests as an increase in the number of cracks on the specimen’s surface and the width of micro-cracks within the specimen, facilitating sulfate ingress through these fissures. Furthermore, after 28 days of curing, the cement remains incompletely hydrated; thus, applied loads expedite sulfate penetration into the cementitious material while simultaneously promoting hydration processes in certain components. This interaction results in an initial increase in both the flexural and compressive strengths. However, following this peak, a gradual decline in the flexural and compressive strengths is observed due to the expansion forces generated by significant product accumulation, which ultimately leads to the specimens.
3.2. XRD
Figure 3 illustrates the XRD patterns of cement-based materials subjected to sulfate attack. As shown in Figure 3a, the primary phases at day 0 include hydrated calcium silicate, quartz, ettringite, calcite, gypsum, and portlandite gel. In the absence of erosion, neither gypsum nor ettringite is detected in the XRD diffraction patterns. As depicted in Figure 3b, with prolonged erosion exposure, diffraction peaks corresponding to gypsum and ettringite become evident, confirming that these compounds are byproducts of sulfate-induced degradation in cement-based materials. Initially, ettringite and gypsum fill the internal pores within the specimen; however, as their concentrations exceed a critical threshold, internal expansion occurs within the cement matrix. When this expansion force surpasses the tensile strength of the specimen, cracking is initiates. The flexural and compressive strengths of the cement-based material specimens initially increase but subsequently decrease.
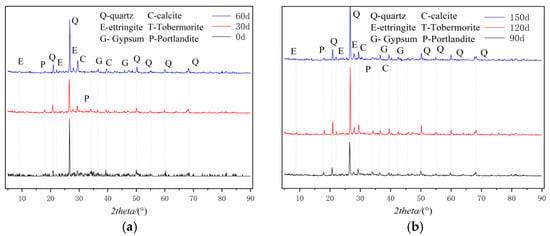
Figure 3.
XRD images of M3 specimen at different erosion durations: (a) 0, 30, and 60 d; (b) 90, 120, and 150 d.
3.3. SEM
Figure 4 presents a scanning electron microscope (SEM) image of the cementitious material subjected to sulfate erosion; (a), (b), (c), (d), (e), and (f) are the microscopic images of sulfate attack at 0 d, 30 d, 60 d, 90 d, 120 d, and 150 d, respectively. From Figure 4, it can be inferred that when the specimen is unaltered by erosion, its internal structure appears relatively smooth with a limited number of pores, indicating the incomplete hydration of the cement. At an erosion duration of 30 days, minor columnar or plate-like erosion products begin to emerge within the specimen. By 60 days of erosion, there is an increase in these products while the internal pore volume decreases; this phenomenon can be attributed both to the complete hydration of the cement and to the formation of erosion products that fill existing pores. At 90 days, numerous columnar or plate-like erosion products accumulate inside the specimen. When reaching an age of 120 days, the substantial accumulation of these products generates significant swelling forces that lead to micro-crack formation within the specimen. Upon reaching 150 days, there is a continued increase in erosion products, alongside a notable presence of needle-like calcarenite structures. As erosive aging progresses further, marked alterations in the internal microstructure are observed; specifically, prolonged exposure results in enhanced crystallization and swelling product formation within the cementitious material, while simultaneously reducing pore space.
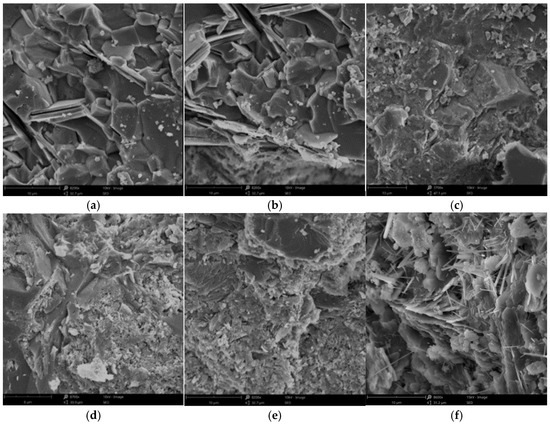
Figure 4.
SEM images of M3 specimen at different erosion durations: (a) 0 d; (b) 30 d; (c) 60 d; (d) 90 d; (e) 120 d; and (f) 150 d.
3.4. MIP
Figure 5 illustrates the graphs depicting the incoming and outgoing tribute pressure for C3 and M3. Under conditions of a constant water–cement ratio, the volume of mercury intake exceeds that of mercury withdrawal. The incorporation of fine aggregates results in a decrease in the amount of incoming mercury, while the addition of coarse aggregates leads to an increase in the incoming mercury; however, this value remains lower than that observed for net slurry. Both the total porosity and effective porosity exhibit an initial upward trend followed by a subsequent decline. During the mercury pressure test, liquid mercury penetrates into the material’s pores under applied pressure, and upon cessation of this pressure application, some liquid mercury is retained within these pores. Consequently, the volume of incoming mercury surpasses that of outgoing mercury; this residual portion resembles ink bottle holes [33]. Pores that can freely discharge after unloading are classified as effective pores. Effective pores serve as primary conduits for moisture transport and erosion mediums, which are critical determinants influencing material durability.
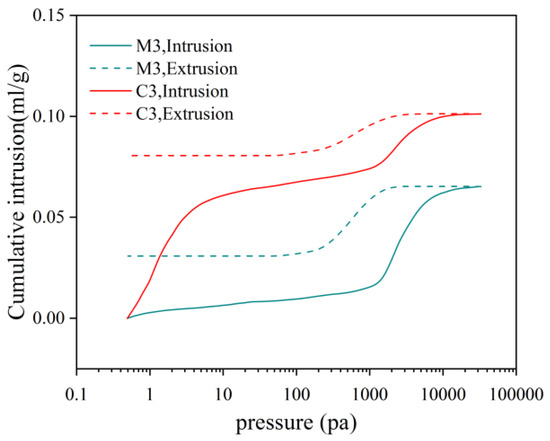
Figure 5.
M3 and C3 incoming and outgoing tribute pressure variation.
Figure 6 and Figure 7 present the pore size distribution curves for C3 and M3 alongside their corresponding cumulative suction curves. In Figure 6, it is observed that within the pore diameter range of 100 nm to 10,000 nm, the pore size distributions of mortar and concrete are essentially comparable. However, when the pore diameter falls below 100 nm or exceeds 10,000 nm, the intrusion volume of concrete surpasses that of mortar. Regardless of pore size, Figure 7 indicates that concrete contributes more significantly than mortar; specifically, this contribution is approximately three to five times greater for concrete in the pore size range of 100 nm to 100,000 nm. Under identical water–cement ratio conditions, both the pore size and mercury intake exhibit a trend where concrete > mortar. This phenomenon can be attributed to increased non-homogeneity as coarse aggregates are incorporated into the mix, resulting in a substantial rise in porosity.
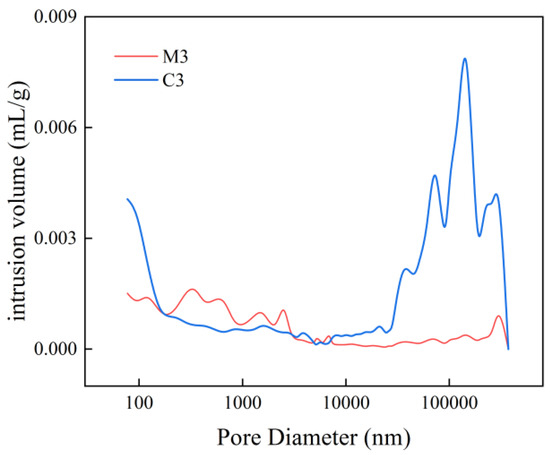
Figure 6.
M3 and C3 pore size distribution curves.
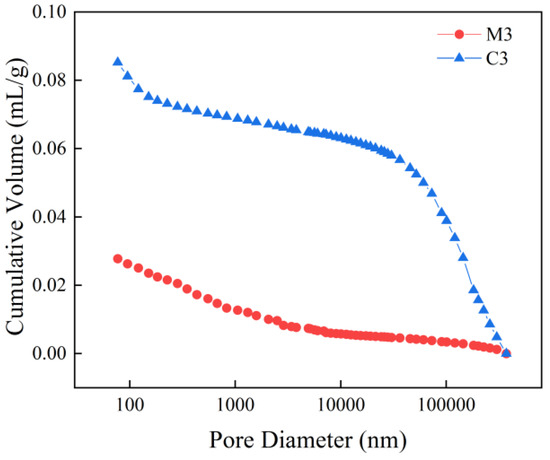
Figure 7.
M3 and C3 cumulative tribute intake curves.
The pore size distribution curves and cumulative contribution curves for M3 withvarious erosion durations of M3 are illustrated in Figure 8 and Figure 9. As depicted in Figure 8, it is apparent that for pore diameters of less than 100 nm, the cumulative distribution of sulfate erosion at 60 days exceeds that observed at 120 days, which in turn surpasses the values recorded for samples without any erosion. For pore diameters ranging from 100 nm to 1000 nm, the cumulative distribution indicates that un-eroded samples exhibit a greater value than those subjected to sulfate erosion for 60 days, but fall short compared to those eroded for a period of 120 days. In the range of pore diameters from 1000 nm to 100,000 nm, the cumulative distribution reveals that sulfate erosion after 120 days is greater than that of both the un-eroded samples at day zero and those eroded for 60 days.
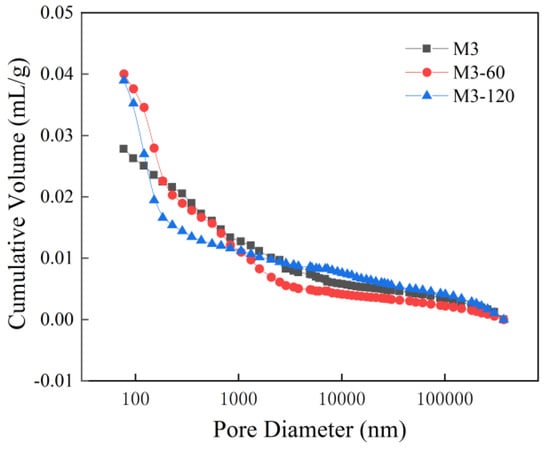
Figure 8.
Cumulative feed curves for M3 with different erosion durations.
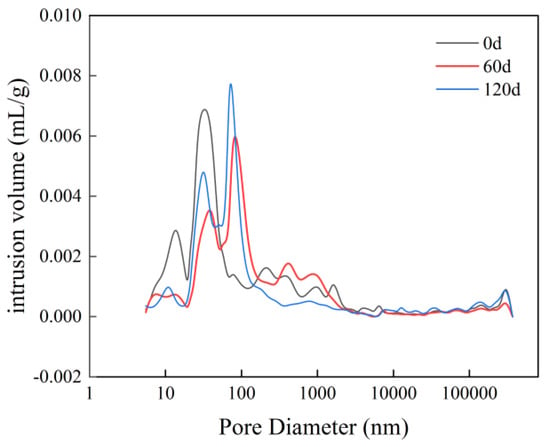
Figure 9.
Pore size distribution curves for different erosion durations of M3.
In Figure 9, the volume of non-eroded material exceeds that of eroded material at 120 days, and also surpasses the erosion volume observed at 60 days when the pore size ranges from 10 nm to 100 nm. In the range of 100 nm to 1000 nm, the erosion volume at 60 days is greater than that of non-eroded samples, and also exceeds the erosion volume recorded at 120 days. When pore sizes fall within the range of 1000 nm to 100,000 nm, the erosion volume after 120 days is greater than both that of non-eroded samples and that observed after 60 days.
This is because in the early stage of erosion, sulfate ions enter the interior of cement-based materials and undergo chemical reactions with calcium silicate hydrate and calcium hydroxide, etc., generating gypsum, ettringite, and other substances. These products occupy the specimen’s internal pores of the specimen, thereby reducing its porosity. In the intermediate and later stages of erosion, while these internal pores remain filled with reaction products, additional erosion products continue to be generated. When the expansive force exerted by these products exceeds the tensile strength of the cement-based material, cracks may develop, along with spalling at edges and corners, ultimately leading to an increased in porosity.
Figure 10 illustrates the variation in pore size distribution for M3 compared to C3 without erosion. Figure 11 indicates significant differences in pore characteristics between mortar and concrete with identical water–cement ratios. Regarding pores exceeding 1000 nm, C3 exhibits larger pores than M3; however, for pores ranging from 100 nm to 1000 nm, the sizes of the pores in M3 and C3 pores are comparable. Notably, when the pore diameter is less than 100 nm, the pore volume of M3 surpasses that of C3 due to the incorporation of aggregates in the concrete, which leads to coarsening within its voids.
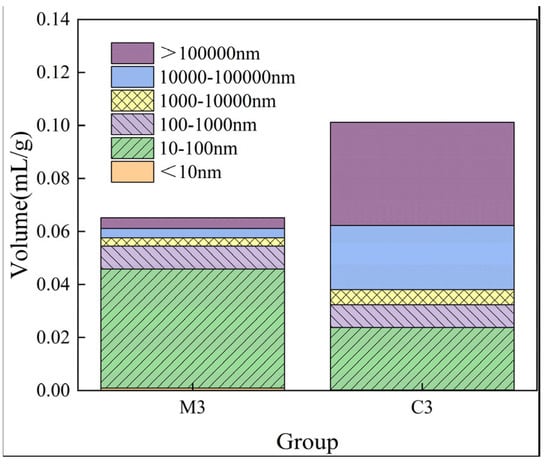
Figure 10.
Pore change stacking diagram of M3 and C3.
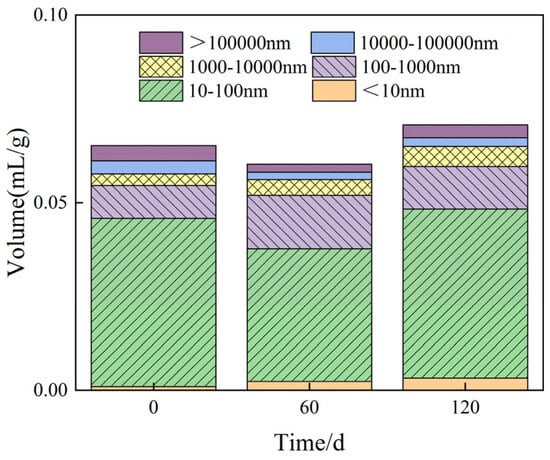
Figure 11.
Pore change stacking diagram of M3 after sulfate erosion degradation.
Furthermore, Figure 11 presents changes in porosity for mortar specimens in group M3 after exposure to sulfate erosion at intervals of 0 days, 60 days, and 120 days. As depicted in Figure 11, the porosity initially decreases before subsequently increasing as erosion progresses. After a period of 60 days under erosive conditions, there is a recorded decrease in porosity of approximately 1.01%. Additionally, it is observed that concrete with an equivalent water–cement ratio possesses a porosity that is approximately 6.48% greater than that of cement mortar. When considering pore diameters greater than 10,000 nm, the porosity of concrete can be estimated to be about four to six times higher than that of mortar.
The volume of pores with diameters ranging from 100 to 1000 nm increased by 84% after 60 days of erosion, followed by an additional increase of 29% after 120 days compared to the initial volume. This trend suggests an initial rise in pore volume, which is subsequently followed by a decline as erosive aging progresses. In contrast, the pore volume within the diameter range of 1000 to 10,000 nm exhibits a consistent upward trend with extended erosion duration, while pores exceeding 10,000 nm demonstrate an initial decrease before experiencing an increase. The change in pore volume for sizes between 10 and 100 nm without erosion corresponds to an initial increase followed by a reduction in capillary pressure during water transfer, thereby directly influencing capillary water absorption characteristics. Additionally, the unit pore volume for sizes less than 10 nm continues to rise with increasing erosive age due to the dissolution of CSH gel.
Table 3 shows the pore size characterization parameters.It can be seen that the mortar specimens, with the increase in erosion porosity, show a trend of decreasing first and then increasing, and the flexural and compressive strength corresponds to that described in Section 3.1, showing a trend of increasing first and then decreasing. After 60d of erosion, the porosity decreases, the flexural and compressive strength increases, the percentage of pore sizes less than 10 nm and 100–10,000 nm increases, and the percentage of pore sizes of 10–100 nm and greater than 10,000 nm decreases. At 120 d of erosion, porosity increases, flexural and compressive strength decreases, the percentage of pore sizes smaller than 100 nm versus 1000–10,000 nm increases, and the percentage of pore sizes of 100–1000 nm versus larger than 10,000 nm decreases. Compared with M3 and C3 specimens with the same water–cement ratio, the porosity increases by 6.48%, and when the pore diameter is larger than 10,000 nm, the porosity of concrete is about 4–6 times that of mortar.

Table 3.
Pore characteristic parameters.
4. Simulation
To evaluate the effects of varying bending stresses on cementitious materials, a numerical simulation was conducted to model the transport of sulfate ions within these materials, with bending stress values set at 0%, 20%, and 40% in the numerical framework.
4.1. Theoretical Basis of Sulfate Ion Diffusion Model
Sulfate ions present in the solution infiltrate the cementitious material, undergoing processes of free diffusion, physical crystallization, and chemical reactions. Utilizing Fick’s second law alongside principles of chemical kinetics, we establish a diffusion equation for sulfate ions within the cementitious matrix [2,34,35].
where is the amount of sulfate ions that are consumed in the chemical reaction in the cement-based material; C1 is the sulfate ion content of cement-based materials; t is the eroding time; x is the eroding depth; Cca is the concentration of calcium ions; K is the chemical reaction rate; and D is the sulfate ion diffusion coefficient.
4.1.1. Diffusion Coefficient of Sulfate Ions in Cement Mortar
The volume fraction of the cement mortar (Vs) is closely related to the diffusion coefficient of sulfate ions in the mortar, the degree of hydration (α), the maintenance time (T), and the porosity (φ). In this paper, we adopted the method of Powers et al. [36] to calculate the following:
In the above equations, φ1 is the capillary space, φ2 is the gel pore, and φs is the initial porosity of cement mortar.
The degree of hydration (α) was obtained by Sun et al. [37] as follows:
According to the theories of Sarkar et al. [38] and Zuo et al. [39], the diffusion coefficient of sulfate ions in cement mortar (Ds) can be deduced, and the calculation model can be obtained, as shown in Equations (13) and (14):
In the above equations, De is the coefficient of diffusion of the sulfate ions in the pore solution, and the value is 1.7 × 10⁻¹¹ m2/s [40]. w is the adjustment coefficient, for which the value is 1.28; βs is a parameter with a value of 1.77; βsa is the sand shape coefficient, for which the value is 1.08; and Vs is the sand volume fraction [39].
4.1.2. Coefficient of Diffusion of the Sulfate Ion in the Interface Transition Zone
The durability and flexural and compressive strength of cementitious materials are greatly influenced by the interfacial transition zone. Therefore, this paper adopts the viewpoint of Cao and He et al. [14,41] that these do not affect the transport of sulfate ions, although the strength at the interface is much lower than that of the mortar, and the porosity is much higher than that of the cement mortar, and simplifies the interfacial transition zone into a homogeneous phase. The diffusion coefficient (DI) of sulfate ions in the interfacial transition zone (ITZ) was obtained as shown in Equation (15):
In the above equation, D0 is 1.06 × 10⁻⁹ m2/s; φi is the porosity of the interfacial transition zone; and H(x) is the Heaviside function, where if x > 0, the value is 1, and otherwise, the value is 0.
4.1.3. Coefficient of Diffusion of Sulfate Ions in Concrete
Concrete consists of cement mortar, coarse aggregate, and a transition zone between them. Since sulfate ions cannot enter into the coarse aggregate, the diffusion coefficient of sulfate ions of coarse aggregate is considered to be zero in this paper. The diffusion coefficient Dx of concrete is obtained via theoretical derivation based on a model in the literature [42].
Here, Va refers to the volume fraction of concrete coarse aggregate and VI refers to the volume fraction of the interfacial transition zone.
The effect of loading on the diffusion coefficient is not considered, as the diffusion coefficient (Dx) only takes into account the transfer coefficient of sulfate ions in the cement mortar, interfacial transition zone, and coarse aggregate. Therefore, the diffusion coefficient of sulfate ions in concrete under bending load (D) is derived by considering the load action and introducing the load influence factor λ as follows:
4.1.4. Effect of Loading Action on the Diffusion Coefficient of Sulfate Ions
The diffusion coefficient and the chemical reaction coefficient of sulfate ions will be altered to a certain extent under bending load conditions. The diffusion coefficient of sulfate ions in cementitious materials can be derived from the aforementioned analysis, while the load deterioration coefficient \( K\) associated with the bending loads on the diffusion coefficient of sulfate ions in these materials can be determined based on the test results presented in Section 4. Considering the impact of load action on the diffusion coefficient, this paper employs a modified form of Fick’s second law, as expressed in Equation (18), along with Equations (19) and (20) for calculating the diffusion coefficients of sulfate ions in cement mortar and concrete, respectively.
4.2. Numerical Simulation
Comsol Multiphysics is a finite element software that can simulate multiple-physical-field coupling simultaneously. The simulation of multiple physical fields is realized by solving partial differential equations. In this study, the coupling simulation of the fine matter transfer module, chemical module, and solid mechanics module is adopted. Definition of boundaries: This paper adopts a three-dimensional prism model with six faces, so there are six boundaries. It is assumed that five boundaries have no flux and that sulfate ions can only enter the specimen through one boundary. This boundary is the tensile surface of the specimen. The boundary concentration is C(0,t) = 5% Na2SO4. Material properties: The ratio coefficients are R1 = 0.6, R2 = 0.5, and R3 = 0.35. The temperature T = 298.15 K, the density of cement ρc = 3100 kg/m3, the density of mortar ρs = 2300 kg/m3, and the density of concrete ρc = 2600 kg/m3.
The specimen size is 40 mm × 40 mm × 160 mm, and the sulfate ion diffuses from the eroded surface of the cementitious material in one dimension, bending load F1 = 0, F2 = 0.2f, and F3 = 0.4f (f is the ultimate flexural strength of the specimen). In this study, a conditional statement command is used to automatically switch between the wet and dry cycle conditions by entering the commands into the COMSOL Multiphysics finite element software physical field boundary conditions input box.
Figure 12 presents the numerical simulations: (a) shows the mesh generation diagram. In this study, triangular meshes were used for mesh division. Triangular meshes have excellent adaptability and numerical stability in simulating concrete erosion, and are particularly suitable for handling complex boundaries, multi-physical field coupling, and heterogeneous material problems; (b) depicts the application of bending stress at a position 20 mm from the edge, with varying magnitudes. Figure 13 displays numerical simulations of sulfate ion concentrations, where panels (a)–(f) represent different erosion ages. As observed in the figures, an increase in erosion age correlates with a rise in sulfate ions within the specimen; however, the sulfate concentration at the bottom of the specimen remains low, approaching zero.
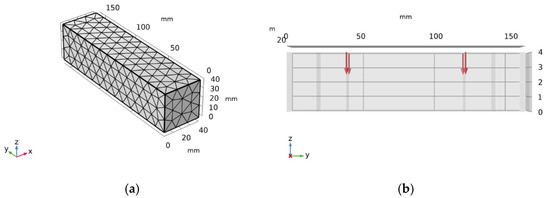
Figure 12.
Numerical simulation diagram: (a) mesh generation; (b) stress application diagram.
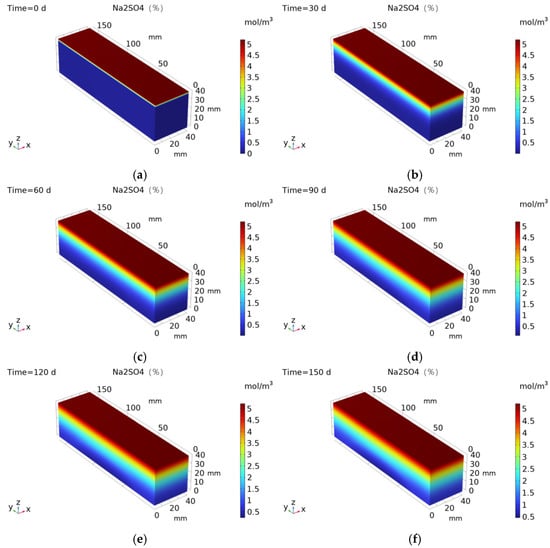
Figure 13.
Numerical simulation of sulfate ion concentration: (a) 0 d; (b) 30 d; (c) 60 d; (d) 90 d; (e) 120 d; and (f) 150 d.
4.3. Numerical Simulation Results and Analysis
Figure 14 illustrates the concentration of sulfate ions at various depths under different bending stresses. The data indicates that the concentration of sulfate ions within cement-based materials increases with increasing load. Bending stress facilitates the ingress of sulfate ions into these materials. For samples of cement-based material at identical depths, it is observed that the ion concentration under 0% bending stress is lower than that under 20% bending stress, which in turn is lower than that under 40% bending stress.

Figure 14.
Sulfate ion concentrations at different depths under different bending stresses: (a) 0% bending stress; (b) 20% bending stress; and (c) 40% bending stress.
Figure 15 presents a comparison of the simulated results and the measured sulfate ion concentrations (obtained through EDTA complexometric titration) at various ages and depths under different magnitudes of bending stress. The figure indicates that the measured sulfate ion concentrations at varying depths are generally consistent with the simulated results across different bending stresses and erosion ages, with an error margin of approximately 5% observed only at a depth of 5 mm. This discrepancy can be attributed to the porous nature of cement-based materials, where applied stress alters the internal pore structure and increases micro-crack formation, leading to some deviation between the experimental and simulation outcomes. However, according to Sharifi and Wu et al. [25,43,44], a simulation error of 5% is within the allowable range. Additionally, as illustrated in the figure, the impact of bending stress on erosion diminishes as the erosion age increases. Consequently, after a certain point in the erosion age, bending stress ceases to enhance sulfate erosion.
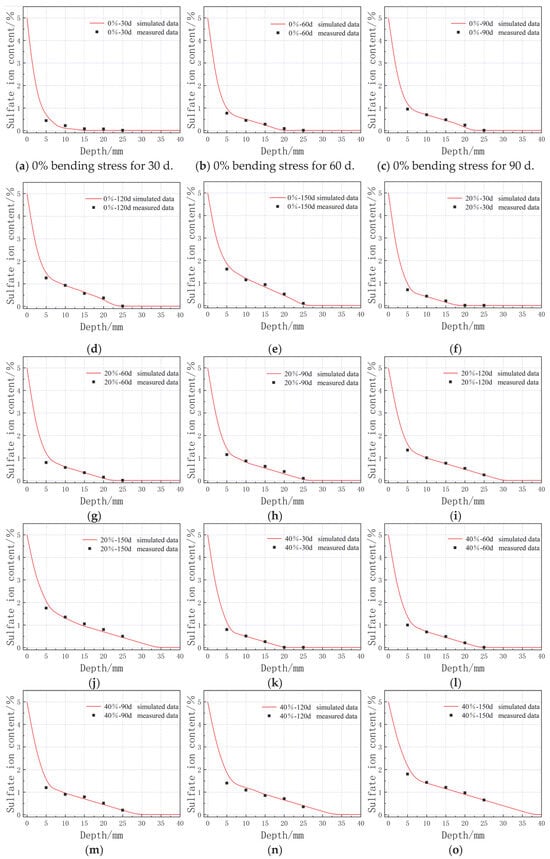
Figure 15.
Graph of sulfate ion concentration of M3 specimens at different depths under different bending stresses for different erosion ages: (a) 0% bending stress for 30 d; (b) 0% bending stress for 60 d; (c) 0% bending stress for 90 d; (d) 0% bending stress for 120 d; (e) 0% bending stress for 150 d; (f) 20% bending stress for 30 d; (g) 20% bending stress for 60 d; (h) 20% bending stress for 90 d; (i) 20% bending stress for 120 d; (j) 20% bending stress for 150 d; (k) 40% bending stress for 30 d; (l) 40% bending stress for 60 d; (m) 40% bending stress for 90 d; (n) 40% bending stress for 120 d; (o) 40% bending stress for 150 d.
5. Conclusions
The following conclusions have been derived from the investigation of cementitious materials and the impact of flexural loading coupled with sulfate exposure on their properties:
- (1)
- The compressive strength of cement-based materials increases first and then decreases with the increase in sulfate corrosion age, reaching its maximum value at 60 d of corrosion; the flexural strength of cement-based materials decreases with the increase in bending stress, and increases first and then decreases with the increase in corrosion age. Bending loads, which accelerate erosion, are to be avoided as much as possible in engineering design;
- (2)
- The main reason for sulfate attack on cement-based materials is that sulfate ions enter the cement-based material through diffusion or other means and react chemically with hydrated calcium silicate and other substances to produce expansive products, such as gypsum and ettringite. When engineering inspections are carried out in areas such as salt lakes containing sulfates, an inspection depth of about 40 mm is sufficient;
- (3)
- The porosity of cement-based materials decreases initially and then increases with the increase in sulfate attack age, and the porosity of concrete is greater than that of mortar at the same water-to-cement ratio;
- (4)
- A multi-physics field coupling model was established. The predicted curve of this model had a high degree of consistency with the experimental curve. However, the model has certain limitations in assuming that there is a certain flux only on the eroded surface of the specimen.
Author Contributions
Methodology, E.H. and G.H.; Validation, K.P.; Formal analysis, Y.C.; Investigation, E.H.; Writing—original draft, Y.W. and Y.L. All authors have read and agreed to the published version of the manuscript.
Funding
This work was financially supported by the National Natural Science Foundation of China (52168036) AND the Research and Application of Key Technologies of Green and Low-Carbon Building Materials (2022B03035–2).
Institutional Review Board Statement
Not applicable.
Informed Consent Statement
Not applicable.
Data Availability Statement
The original contributions presented in the study are included in the article, further inquiries can be directed to the corresponding author.
Conflicts of Interest
The authors declare no conflict of interest.
References
- Spragg, R.P.; Castro, J.; Li, W.; Pour-Ghaz, M.; Huang, P.-T.; Weiss, J. Wetting and drying of concrete using aqueous solutions containing deicing salts. Cem. Concr. Compos. 2011, 33, 535–542. [Google Scholar] [CrossRef]
- Zhou, L.; Cai, Y.; Ma, C. Experimental study and numerical analysis of chloride ion diffusion in hydrotalcite concrete in chloride salt environment. Materials 2023, 16, 6349. [Google Scholar] [CrossRef] [PubMed]
- Xu, D.; Cui, Y.; Li, H.; Yang, K.; Xu, W.; Chen, Y. On the future of Chinese cement industry. Cem. Concr. Res. 2015, 78, 2–13. [Google Scholar] [CrossRef]
- Zhao, L.; Guo, X.; Song, L.; Song, Y.; Dai, G.; Liu, J. An intensive review on the role of graphene oxide in cement-based materials. Constr. Build. Mater. 2020, 241, 117939. [Google Scholar] [CrossRef]
- Li, Y.; Yang, F.; Zhang, G. Synergistic effects of sustained loading and sulfate attack on the damage of UHPC based on lightweight aggregate. Constr. Build. Mater. 2023, 374, 130929. [Google Scholar]
- Yu, D.; Guan, B.; He, R.; Xiong, R.; Liu, Z. Sulfate attack of Portland cement concrete under dynamic flexural loading: A coupling function. Constr. Build. Mater. 2016, 115, 478–485. [Google Scholar] [CrossRef]
- Yu, D.; Feng, C.; Fu, T.; Shen, A. Effect of Sulfate Concentration on Chloride Diffusion of Concrete under Cyclic Load. Materials 2022, 15, 2036. [Google Scholar] [CrossRef]
- Chen, F.; Gao, J.; Qi, B.; Shen, D.; Li, L. Degradation progress of concrete subject to combined sulfate-chloride attack under drying-wetting cycles and flexural loading. Constr. Build. Mater. 2017, 151, 164–171. [Google Scholar] [CrossRef]
- Cheng, H.; Liu, T.; Zou, D.; Zhou, A. Compressive strength assessment of sulfate-attacked concrete by using sulfate ions distributions. Constr. Build. Mater. 2021, 293, 123550. [Google Scholar] [CrossRef]
- Wang, F.; Zhang, Y.; Jiang, J.; Yin, B.; Li, Z. Effect of temperature on the capillary transport of sodium sulfate solution in calcium silicate hydrate nanopore: A molecular dynamics study. Constr. Build. Mater. 2020, 231, 117111. [Google Scholar] [CrossRef]
- He, Z.; Chang, J.; Du, S.; Liang, C.; Liu, B. Hydration and microstructure of concrete containing high volume lithium slag. Mater. Express 2020, 10, 430–436. [Google Scholar] [CrossRef]
- Mohammadi, A.; Ramezanianpour, A.M. Investigating the environmental and economic impacts of using supplementary cementitious materials (SCMs) using the life cycle approach. J. Build. Eng. 2023, 79, 107934. [Google Scholar] [CrossRef]
- Qi, B.; Gao, J.; Chen, F.; Shen, D. Evaluation of the damage process of recycled aggregate concrete under sulfate attack and wetting-drying cycles. Constr. Build. Mater. 2017, 138, 254–262. [Google Scholar] [CrossRef]
- He, R.; Zheng, S.; Gan, V.J.L.; Wang, Z.; Fang, J.; Shao, Y. Damage mechanism and interfacial transition zone characteristics of concrete under sulfate erosion and Dry-Wet cycles. Constr. Build. Mater. 2020, 255, 119340. [Google Scholar] [CrossRef]
- Zhang, D.; Jiang, J.; Zhang, Z.; Fang, L.; Weng, Y.; Chen, L.; Wang, D. Comparative analysis of sulfate resistance between seawater sea sand concrete and freshwater desalted sea sand concrete under different exposure environments. Constr. Build. Mater. 2024, 416, 135146. [Google Scholar] [CrossRef]
- Ikumi, T.; Cavalaro, S.H.P.; Segura, I. The role of porosity in external sulphate attack. Cem. Concr. Compos. 2019, 97, 1–12. [Google Scholar] [CrossRef]
- Wang, K.; Guo, J.; Yang, L. Effect of dry–wet ratio on sulfate transport-reaction mechanism in concrete. Constr. Build. Mater. 2021, 302, 124418. [Google Scholar] [CrossRef]
- Zhang, J.; Li, H.; Liu, S.; Zhang, X.; Yang, C.; Zhang, R. Bond behavior of the CFRP-concrete interface under combined sustained load and sulfate erosion. Structures 2022, 35, 551–564. [Google Scholar] [CrossRef]
- Xu, G.; Zhang, W.; Chen, S.; Zhu, Z.-K.; Liu, W.-J. Experimental Study on the Impact of Sulfate Attack on the Performance of Shaft Lining Concrete under Sustained Compressive Load. Case Stud. Constr. Mater. 2024, 21, e03657. [Google Scholar] [CrossRef]
- Gao, J.; Yu, Z.; Song, L.; Wang, T.; Wei, S. Durability of concrete exposed to sulfate attack under flexural loading and drying–wetting cycles. Constr. Build. Mater. 2013, 39, 33–38. [Google Scholar] [CrossRef]
- Liu, F.; You, Z.; Diab, A.; Liu, Z.; Zhang, C.; Guo, S. External sulfate attack on concrete under combined effects of flexural fatigue loading and drying-wetting cycles. Constr. Build. Mater. 2020, 249, 118224. [Google Scholar] [CrossRef]
- Zhang, P.; Ren, S.; Zhao, Y.; Wang, L.; Long, N.; Chen, F.; Liu, C. Combined effects of sulfate attack under drying–wetting cycles and loading on the fatigue behavior of concrete. Adv. Struct. Eng. 2021, 24, 3825–3836. [Google Scholar] [CrossRef]
- Luo, D.; Zhou, M.; Li, F.; Niu, D. Chloride ion transport in coral aggregate concrete subjected to coupled erosion by sulfate and chloride salts in drying-wetting cycles. J. Mater. Res. Technol. 2024, 30, 3251–3267. [Google Scholar] [CrossRef]
- Gan, L.; Liu, G.; Liu, J.; Zhang, H.; Feng, X.; Li, L. Three-dimensional microscale numerical simulation of fiber-reinforced concrete under sulfate freeze-thaw action. Case Stud. Constr. Mater. 2024, 20, e03308. [Google Scholar] [CrossRef]
- Li, Y.; Zhu, W.; Zheng, X.; Hao, E.; Zhang, D.; Wang, T. Study on chloride attack resistance of concrete with lithium slag content. J. Build. Eng. 2024, 97, 110723. [Google Scholar] [CrossRef]
- He, W. Numerical Simulation of the Ion Transport Behavior in Concrete under Coupled Axial Loading and Sulfate Attack. Teh. Vjesn. 2020, 27, 1791–1799. [Google Scholar]
- Zhang, J.; Sun, M.; Hou, D.; Li, Z. External sulfate attack to reinforced concrete under drying-wetting cycles and loading condition: Numerical simulation and experimental validation by ultrasonic array method. Constr. Build. Mater. 2017, 139, 365–373. [Google Scholar] [CrossRef]
- Zhuang, Y.; Liu, X.; Zhou, X.; Du, L. Diffusion model of sulfate ions in concrete based on pore change of cement mortar and its application in mesoscopic numerical simulation. Struct. Concr. 2022, 23, 3786–3803. [Google Scholar] [CrossRef]
- GB/T 50082-2009; Standard for Long-Term Performance and Durability Test Methods for Ordinary Concrete. China Building Industry Press: Beijing, China, 2009. (In Chinese)
- GB/T 50080-2002; Standard of Test Methods for Mechanical Properties of Ordinary Concrete. China Architecture and Building Press: Beijing, China, 2002. (In Chinese)
- Hadi, M.N.S.; Li, J. External reinforcement of high strength concrete columns. Compos. Struct. 2004, 65, 279–287. [Google Scholar] [CrossRef]
- Zhao, Y.; Gao, J.; Qi, B.; Liu, C. Effect of flexural loading on degradation progress of recycled aggregate concrete subjected to sulfate attack and wetting-drying cycles. J. Southeast Univ. Engl. Ed. 2019, 35, 85–90. [Google Scholar]
- Ma, Y.; Hu, J.; Ye, G. The pore structure and permeability of alkali activated fly ash. Fuel 2013, 104, 771–780. [Google Scholar] [CrossRef]
- Yin, G.J.; Zuo, X.B.; Tang, Y.J.; Ayinde, O.; Wang, J.-L. Numerical simulation on time-dependent mechanical behavior of concrete under coupled axial loading and sulfate attack. Ocean Eng. 2017, 142, 115–124. [Google Scholar] [CrossRef]
- Li, J.; Xie, F.; Zhao, G.; Li, L. Experimental and numerical investigation of cast-in-situ concrete under external sulfate attack and drying-wetting cycles. Constr. Build. Mater. 2020, 249, 118789. [Google Scholar] [CrossRef]
- Powers, T.C. Structure and physical properties of hardened Portland cement paste. J. Am. Ceram. Soc. 1958, 41, 1–6. [Google Scholar] [CrossRef]
- Sun, Y.; Liang, M.; Chang, T. Time/depth dependent diffusion and chemical reaction model of chloride transportation in concrete. Appl. Math. Model. 2012, 36, 1114–1122. [Google Scholar] [CrossRef]
- Sarkar, S.; Mahadevan, S.; Meeussen, J.; van der Sloot, H.; Kosson, D. Numerical simulation of cementitious materials degradation under external sulfate attack. Cem. Concr. Compos. 2010, 32, 241–252. [Google Scholar] [CrossRef]
- Zuo, X.; Sun, W.; Yu, C. Numerical investigation on expansive volume strain in concrete subjected to sulfate attack. Constr. Build. Mater. 2012, 36, 404–410. [Google Scholar] [CrossRef]
- Maltais, Y.; Samson, E.; Marchand, J. Predicting the durability of Portland cement systems in aggressive environments—Laboratory validation. Cem. Concr. Res. 2004, 34, 1579–1589. [Google Scholar] [CrossRef]
- Cao, C.; Cheung, M.M.; Chan, B.Y. Modelling of interaction between corrosion-induced concrete cover crack and steel corrosion rate. Corros. Sci. 2013, 69, 97–109. [Google Scholar] [CrossRef]
- Jin, L.; Zhang, R.; Du, X.; Li, Y. Multi-scale analytical theory of the diffusivity of concrete subjected to mechanical stress. Constr. Build. Mater. 2015, 95, 171–185. [Google Scholar] [CrossRef]
- Sharifi, N.P.; Freeman, G.E.; Sakulich, A.R. Using COMSOL modeling to investigate the efficiency of PCMs at modifying temperature changes in cementitious materials–case study. Constr. Build. Mater. 2015, 101, 965–974. [Google Scholar] [CrossRef]
- Wu, C.; Zhang, H.; Wang, D.; Zhou, X.; Wang, N. Study on mechanical and chloride salt freezing-thawing resistance of CSW concrete. Constr. Build. Mater. 2024, 447, 138078. [Google Scholar] [CrossRef]
Disclaimer/Publisher’s Note: The statements, opinions and data contained in all publications are solely those of the individual author(s) and contributor(s) and not of MDPI and/or the editor(s). MDPI and/or the editor(s) disclaim responsibility for any injury to people or property resulting from any ideas, methods, instructions or products referred to in the content. |
© 2025 by the authors. Licensee MDPI, Basel, Switzerland. This article is an open access article distributed under the terms and conditions of the Creative Commons Attribution (CC BY) license (https://creativecommons.org/licenses/by/4.0/).