Abstract
Scenario analysis and the modeling of typhoons are fundamental prerequisites for effective emergency decision-making. However, current studies on typhoon scenario modeling lack analyses of cascading effects and users’ concerns, failing to represent cascading disaster impacts and user adaptability. This study constructs a scenario evolution model for typhoons and their cascading disasters through typhoon-related public opinion mining and an analysis of disaster evolution characteristics to address these limitations. Specifically, this study analyzes and extracts information about users’ sentiments and concerns based on public opinion data. Then, public opinion and typhoon evolution progression analyses are conducted, identifying cascading disaster evolution characteristics to determine scenario elements. The scenario model is constructed by calculating scenario node probability distributions using dynamic Bayesian networks (DBNs). In this study, Typhoon Bebinca is selected to verify the proposed scenario model; the results demonstrate that the model is reliable and its evolution process aligns with the impacts of typhoon cascading disasters. This study also reveals two critical insights: (1) Users’ concerns will change with typhoon evolution. (2) Emergency measures for dealing with typhoons and their cascading disasters are fragmented. It is essential to consider their cascading effects when enacting these measures. These findings provide novel insights that could aid government agencies in their decision making.
1. Introduction
As a result of global warming, the frequency and intensity of extreme weather events are increasing [1]. In addition to the accelerated urbanization process, human assets and infrastructure are concentrated in coastal cities [2,3], making them vulnerable to disasters. When densely populated regions are hit by typhoons or other extreme weather events, the resulting disasters and their cascading effects often cause extensive damage, including severe casualties and economic losses [4,5].
Typhoons are ”trigger disasters” that induce secondary and derivative disasters with cascading effects in urban areas. They cause direct impacts from wind, rainfall, and large waves, and cascading disasters like urban waterlogging, mudslides, and storm surges [6]. Appropriate emergency decision making and response measures can effectively reduce the negative impacts of typhoons and their cascading effects. Therefore, enhancing the targeting and reliability of decisions and measures in complex disaster environments is critical [7]. However, the current theoretical “prediction–response” model, which relies on historical data and predefined calculation, cannot represent dynamic and complex typhoon cascading disasters. This has prompted scholars to shift their focus toward the “scenario–response” model in decision-making research [8,9].
Scenarios refer to collections of anticipated situations that detail the entire process of an event’s occurrence, development, and future [10]. Reliable scenario models can display multiple possible event states and adjust response strategies to dynamically address complex relationships. However, the selective concern mechanisms that take place when decision makers process disaster information tend to exacerbate cognitive fragmentation, resulting in an inconsistent understanding of disasters and measures [11]. Therefore, a more reliable scenario model can be established by studying the characterization of typhoons and the evolution process of their cascading disasters, combined with relevant information about users’ sentiments.
To overcome the above limitations, this study develops a dynamic scenario evolution model for typhoons and their cascading disasters based on public opinion. Bayesian networks have been widely applied in the representation of uncertain problems and offer notable advantages, such as clear graphical representations of complex situations, explicit modeling of causal relationships, and the performance of uncertain inference [12]. These characteristics make it possible to accurately characterize the evolution path of typhoon-induced cascading disasters. Therefore, this study employs DBNs to enhance uncertainty representation and inference in a knowledge representation model of typhoon-induced cascading disasters, establishing a dynamic scenario model. The main contributions of this study include the following:
(1) Extracting and analyzing information on users’ sentiments and concerns about typhoons and their cascading disasters.
(2) Using knowledge elements to analyze the characteristics of cascading disaster evolution and determine the scenario node elements based on the development of public opinion regarding typhoon events.
(3) Constructing a scenario model of a typhoon and its cascading disasters and using DBNs to calculate the probability distribution of scenario nodes.
The remainder of this paper is organized as follows: Section 2 reviews existing research on typhoons’ cascading effects and typhoon scenario modeling. Section 3 introduces the study area, the experimental data, the pre-processing procedures, and the overall methodology. Section 4 analyzes and discusses the research findings. Section 5 concludes the study and proposes directions for future improvements.
2. Literature Review
2.1. Studies on Typhoons’ Cascading Effects
A cascading effect is defined as a dynamic pattern whereby multiple disasters may interact to generate amplified impacts, while cascading disasters refer to the direct or indirect consequential disasters triggered by an initial disaster [13,14]. The cascading effect of a typhoon disaster is characterized by the continuous expansion of risk in time and space through the dynamic coupling of risk factors [15]. The disaster evolution process exhibits significant regional differences: coastal areas experience compound marine disasters [16,17], with strong winds, large waves, and storm surges, whereas inland regions experience cascading disasters, including floods [18,19], urban waterlogging [20], and mudslides [21]. Notably, the cascading effects of typhoons not only result in disruptions in infrastructure systems [22] such as power systems and water supplies, but may also exacerbate ecological issues through vegetation degradation and saltwater intrusion [23], ultimately having impacts that are far more severe than those of the initial typhoon.
Scholars studying typhoon mechanisms are progressively shifting their research focus from singular typhoon events to cascading disaster events. Existing studies primarily employ mathematical modeling and physical simulations to develop models for simulating typhoons and their cascading effects, such as floods and mudslides, with these approaches demonstrating high accuracy. For instance, Chen et al. utilized the K-means++ method to systematically analyze spatial distribution patterns of typhoon rainfall events in mountainous watersheds of central Hainan Island, explaining flood-inducing rainfall patterns and their correlations with flood characteristics [24]. Li et al. conducted numerical simulations to investigate saltwater intrusion mechanisms in estuarine areas during typhoon events, revealing that peak saltwater intrusion typically occurs approximately one day after typhoon passage [25].
Current research increasingly incorporates cascading-effect analysis into mitigation strategies to strengthen resilience against extreme weather events. For instance, Zhang et al. quantitatively evaluated the dependence between storm surges/wave disasters and typhoon disasters using extreme value theory and Copula models, thereby optimizing coastal engineering to protect against extreme weather scenarios [26]. Chen et al. employed Copula models to capture the relationships between flood events and typhoon-induced storm surges, subsequently integrating these relationships into energy system planning models to strengthen infrastructure resilience [27]. Cai et al. developed policy instruments, through content analysis focused on typhoon–rainstorm disaster chains, to improve policy precision in response to cascading disasters [28].
Cascading disasters are characterized by complex evolution patterns, high dynamic uncertainty, and rapid multi-directional spread [29]. Traditional monitoring methods have limitations in terms of their information timeliness and coverage dimensions, making it difficult for the public to receive disaster information in time. Social media captures disaster data in real time through user-generated content, providing new data sources for early warning, process monitoring, and loss assessment. Wu et al. validated the supplementary value of social media data for disaster intensity assessment through a spatiotemporal correlation analysis between Weibo information and the physical parameters of Typhoon Lekima [30]. Hiroki et al. developed a representation method for disaster cascading processes based on media information, systematically identifying the characteristics of media information using network theory to describe social cascading processes after natural disasters [31]. Hao et al. proposed a data-driven approach to mine data on cascading disasters such as strong winds and floods, as well as various kinds of damage information, including hazard severity and damage types, using text and image information from social media [32].
However, disaster events and their associated cascading processes vary in occurrence probability depending on their temporal, spatial, and environmental characteristics [33]. Neglecting to analyze the critical drivers of typhoons’ cascading effects, as well as the interaction mechanisms between events and environmental factors during their evolution, could result in users misjudging comprehensive typhoon risk assessments and consequently making suboptimal emergency decisions. To address these challenges, it is imperative to investigate the complex spatiotemporal correlations between the evolution processes of typhoon events, their cascading disasters, and the existing environment.
2.2. Studies on Typhoon Scenario Modeling
Recently, the “scenario–response” theoretical model has emerged as an essential research framework in emergency management. This model provides methodological support for dynamic risk assessment and cascading disaster disruption by systematically analyzing scenario elements and their evolution mechanisms [34]. Studies demonstrate that constructing scenario models offers significant advantages in accident, disaster, and risk analysis. For instance, by comprehensively considering the impacts of natural and social environmental changes on typhoon scenarios across multiple spatiotemporal scales, Li et al. developed a risk framework which integrates vulnerability and adaptability [35]. Dong et al. established a typhoon risk scenario analysis method based on an extreme value distribution model, achieving spatial risk probability mapping of typhoon wind fields [36]. Li et al. proposed a scenario-based simulation approach for storm surge flood risk assessment, enhancing the precision of flood zone identification [37]. However, existing research focuses on single-disaster scenario modeling, with insufficient systematic investigation into the cascading effects of typhoon disasters.
In regard to scenario modeling, current research mainly uses three typical technologies: (1) Bayesian networks: Li et al. used ontology clustering and semantic rules to build a dynamic framework for scenario simulation and to calculate the possibility of uncertain events [38]. (2) Case-based multidimensional scenario matching methods: Qian et al. used a “case-scenario-object-element” structure to transfer historical data, supporting decisions via case simulations of oil tank fires [39]. (3) System dynamics-based complex system modeling methods: Yang et al. proposed a ROC-Based CIA-ISM model to analyze nonlinear interactions and evaluate the reliability of metro emergency management during extreme rainfall events [40].
In actual emergency decision-making situations, information asymmetry tends to magnify the bias of subjective and objective factors in modeling efforts [41]. This information bias not only enhances the uncertainty in disaster decision making, but also creates disconnection between the scenario model and users’ requirements in actual emergency analyses. Though current methods can depict objective aspects like situation status, response measures, and environmental impacts, they often fall short in considering subjective variables such as users’ concerns and behavioral preferences. These subjective elements interact dynamically with disaster evolution through bidirectional feedback mechanisms. This may cause deviations between the results of human–disaster interaction simulation and actual decision making during a disaster.
2.3. Limitations of Current Research
(1) Existing research on typhoon scenario modeling primarily employs mathematical and physical methods to develop models for simulating typhoons and their cascading disasters. Though these models achieve high accuracy in scenario simulation, they often neglect to analyze the driving factors and evolution processes of cascading effects. Consequently, they fail to fully depict the dynamic evolution between typhoons and their cascading effects. On the contrary, this study first analyzes the stages of online public opinion, and then explores the dynamic evolution process of typhoons and their cascading effects in the different stages; finally, it establishes the scenario evolution model of typhoon cascading disasters.
(2) The existing research on typhoon scenario modeling lacks analyses of users’ concerns, which creates a bias between the constructed scenario models and users’ cognition in actual emergencies. Information on users’ concerns usually includes data on the real-time impact and spatial distribution of disasters, and the operability of response measures. On the contrary, this study, using information on public opinion regarding typhoon events, analyzed the sentiments and concerns of different users and incorporated them into scenario model construction to overcome the uncertainty and complexity of emergency decision making during typhoons and subsequent cascading disasters.
3. Materials and Methods
3.1. Study Area
This study selected Shanghai, China, the first landfall site of Typhoon Bebinca, as the case study area (as shown in Figure 1). Shanghai is situated at 31°14′ N, 121°29′ E along the western Pacific coast and the eastern edge of the Asian continent and occupies the alluvial plain of the Yangtze River Delta. Its topography slopes gently from elevated eastern, southern, and northern regions toward lower-lying central and western areas, making the city particularly vulnerable to waterlogging during extreme weather events [42].
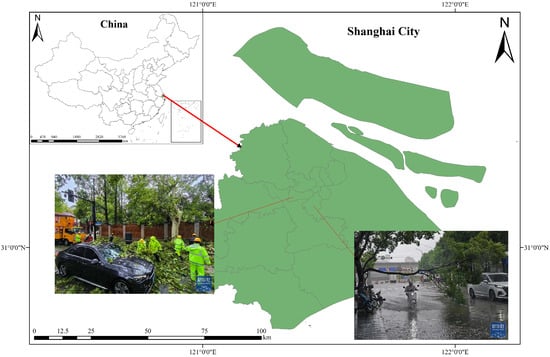
Figure 1.
Overview of the study area.
As the most powerful typhoon to make landfall in Shanghai since 1949, Typhoon Bebinca severely impacted the region [43]. Its landfall caused extensive urban waterlogging in Shanghai, resulting in losses of CNY 460 million and disrupting daily life for millions. The event exemplified the complex interaction between disasters and urban systems and elicited intense public concern. It was therefore selected as the case study for this paper.
3.2. Data Description
Thanks to its capability for real-time dissemination and interactivity, social media has become a crucial medium for analyzing the public perception of disasters [44,45]. Given the extensive active user base of the Sina Weibo platform, it offers data resources for tracking typhoon cascading disasters and user concern patterns. Therefore, this study utilized social media text data as a proxy for public opinion, serving as the basis for our experimental analysis.
The experimental dataset comprised two components: (1) Data 1: These data were extracted from the publicly available Weibo_Senti_100k dataset, which consists of Sina Weibo user reviews. As one of the largest social media platforms in China, Weibo’s user-generated comments are rich and diverse, covering various topics and viewpoints, and can better reflect emotional expressions in the real world; this large-scale dataset provides a rich sample for the training of sentiment analysis models, which helps improve their generalization ability. After preprocessing, the dataset contained 119,820 sentiment-labeled data, including 59,910 positive (labeled “1”) and 59,910 negative samples. (2) Data 2: These data were collected via the Scrapy framework using Sina Weibo’s API. Between 13 September and 18 September 2024, public sentiment text related to keywords such as “Typhoon Bebinca” and “Shanghai Typhoon” was systematically scraped. These data cover four stages of public opinion: latency, occurrence, development, and dissipation. Therefore, the user sentiment and corresponding user concern information extracted from these textual data represent the public opinion trends during the landfall of Bebinca in Shanghai.
However, the collected text data require preprocessing before experimental use. This study standardized the data through three key steps: data cleaning, filtering, classification, and systematic organization. During the cleaning phase, irrelevant content such as noise symbols was removed, resulting in a refined dataset of 27,056 text entries. These entries were then filtered, categorized, and archived to ensure consistency and usability for subsequent analysis.
3.3. Methods
The scenario method was originally defined as a framework for describing future situations and analyzing the progression of events [46], and is now widely adopted to depict the progression of unconventional emergencies, providing a structured framework for understanding complex and unpredictable events. To clarify the interactions and evolution process of typhoons and their cascading effects, and provide decision makers with a systematic understanding of typhoon-related disaster events, it is essential to construct a typhoon cascading disaster scenario model. This model will serve as a foundational tool for analyzing cascading disaster evolution and supporting decision-making processes.
This study innovatively integrates online public opinion data with an analysis of the spatiotemporal evolution patterns of typhoons and their cascading disasters. Building on this analysis, a dynamic temporal scenario model for typhoons and their cascading effects is developed, which mainly includes information on users’ concerns. Details of the methodology are shown in Figure 2.
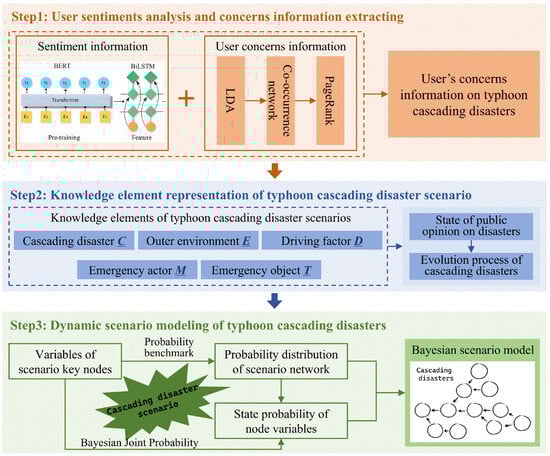
Figure 2.
The overall framework of this study.
3.3.1. Analysis of User Sentiments and Concerns Information
(1) Classification of user sentiments on public opinion
The Bert-BiLSTM model, which possesses both Bert’s semantic representation capabilities and BiLSTM’s ability to capture sequential dependencies, was selected for sentiment analysis. The model effectively extracts sentiment patterns from public opinion texts, precisely analyzing user sentiments in social media contexts [47]. The process is structured as shown in Figure 3:
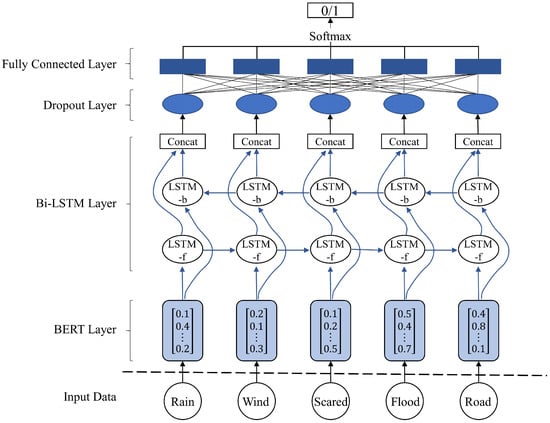
Figure 3.
The Bert-BiLSTM sentiments analysis model.
(i) Semantic Encoding: The input text is first encoded into high-dimensional word vectors using a pre-trained Bert model, leveraging its contextualized embeddings to capture rich semantic information. The calculation formula is shown below:
where , in which n is the dimension of the sentence feature vector output by BERT; is the transformed vector; is the bias vector; is the output of BERT; is the weight; and the activation function uses the Sigmoid function.
(ii) Sequential Processing: The encoded sequences are fed into a BiLSTM layer, which captures bidirectional contextual dependencies. A Dropout layer is applied to the concatenated hidden states to mitigate overfitting and improve generalization. The calculation formula is shown below:
where , , respectively, represent the forward and backward hidden layer outputs at time i, and is the output vector of the hidden layer at time i.
(iii) Classification: The output vectors are passed through a fully connected layer, where the SoftMax function converts logits into probability distributions, enabling binary sentiment classification (positive/negative).
where the weight and are parameters of the output layer; is the number of categories; and H is the sentence-level feature vector.
The classification results are measured using three indicators: accuracy, recall, and F1-score.
In the above equation, TP represents the number of positive samples classified as positive, TN represents the number of negative samples classified as negative, FP represents the number of negative samples classified as positive, and FN represents the number of positive samples classified as negative.
(2) Extraction of information on users’ concerns
Considering our existing computer resource conditions, we employ a combination of the Latent Dirichlet Allocation (LDA) model, co-occurrence network analysis, and the PageRank algorithm to extract information on user concerns. First, we use the LDA model to extract text topics and determine their distribution through iterative optimization. Then, we represent the opinion text data as a word-frequency matrix and construct an online opinion keyword network via co-occurrence network analysis. Finally, by integrating the PageRank algorithm with node centrality calculation, we obtain the User Concern Index (UCI) of each node. The nodes are sorted in descending UCI order, and the TopN + 1 keyword nodes under each topic are selected as the information on user concern. The UCI equation is as follows:
where represents the current node; is the PageRank value of the node, reflecting the importance of the keyword in the net; is the result of normalizing the centrality of the node’s degree centrality, which depicts the influence of the node; is the eigenvector centrality of the node, reflecting the potential propagation ability of the node; and are the weight coefficients, which correspond to the contribution of each feature, respectively.
is calculated as follows:
where represents the current node; denotes the score of the web page ; d denotes the damping factor, which takes the value range of ; denotes the node that is pointing to ; denotes the node that is output from ; and denotes the number of output nodes.
is calculated as follows:
where is the eigenvector centrality of the current node , and denotes that of the other nodes; is the maximum eigenvalue of the eigenvector; and is the adjacency matrix of the graph. is calculated as follows:
where denotes the actual number of connections at node , N represents the number of nodes in the network, and , represents the maximum value of the degree centrality of the points in the network.
3.3.2. Representation of Knowledge Elements Pertaining to Typhoon Cascading Disasters Incorporating User Concern Information
A knowledge element represents an indivisible unit of knowledge that embodies a complete expression of knowledge. As the foundational unit of knowledge management, it is composed of three components: objects, attributes, and relationships. A knowledge element model is typically characterized by three key components: the object knowledge element , the attribute knowledge element , and the relationship knowledge element . In the process of disaster scenario modeling, knowledge element models serve as a tool to comprehensively describe the entire life cycle of disaster events. For instance, when modeling a disaster scenario, these knowledge elements can effectively depict various aspects of the event, including the nature of the scenario, emergency rescue activities, etc. When integrated with DBNs, knowledge element models can accurately simulate the dynamic evolution of disasters.
This study investigates the relationship between disaster scenario evolution, emergency management measures, and public opinion. By focusing on this relationship, the study extracts the critical scenario elements of typhoons and their cascading effects, and employs knowledge theory to analyze these scenario elements. Currently, there are different standards for dividing scenario elements. Wang et al. divided disaster scenario elements into four aspects: disaster events, disaster-causing factors, disaster-bearing entities, and emergency activities [48]. Wang et al. classified disaster scenario elements as driving factors, emergency measures, and emergency targets [49].
Considering the characteristics of the stages of online public opinion, this study integrates data on the cascading effects of typhoons, the factors dynamically influencing the network, and the roles of various users. Through systematic analysis, it identifies the key scenario elements of typhoons and their cascading effects, corresponding to the main nodes in the DBNs. These elements include disaster events, the external environment, driving factors, emergency activities, and emergency targets, represented by , as shown in Figure 4.
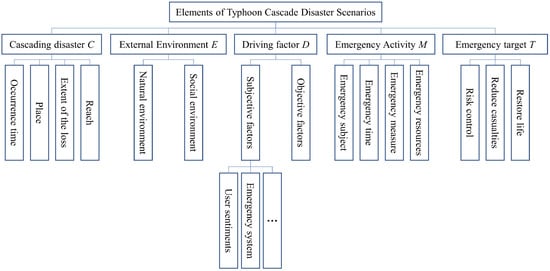
Figure 4.
Composition of knowledge elements for typhoon cascading disaster scenarios.
Driving factors mainly refer to the factors affecting the evolution process of typhoons and their cascading effects, and contain both objective and subjective factors. In this study, subjective driving factors specifically refer to user concern information extracted from the online public discourse regarding typhoons and their cascading effects. In this study, there are two primary types of outcomes produced by the driving factors: a positive outcome that pushes the typhoon event in a positive direction, and a negative outcome that pushes the typhoon event in a negative direction.
Clarifying the relationships among various scenario elements is essential for constructing scenario deduction models. Specifically, the external environment and driving factors jointly influence typhoons and cascading disasters . Emergency decision-making entities, in response to the situation, undertake corresponding emergency measures to achieve specific emergency targets .
Upon the onset of a typhoon cascading disaster event, both the disaster and its associated online public opinion evolve over time. This makes typhoons and their cascading disasters a dynamic process that evolves over a given timeline. Therefore, it is essential to construct our disaster scenario evolution model based on this timeline, as shown in Figure 5.
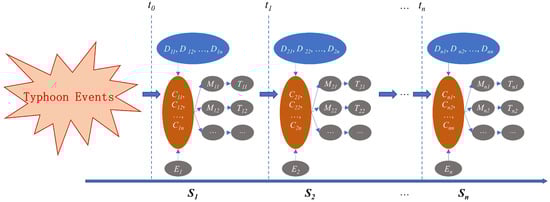
Figure 5.
Schematic diagram of the evolution process of typhoon disaster scenarios from the perspective of online public opinion.
Assume that at a certain moment , due to a certain disaster-causing factor, a typhoon cascading disaster event suddenly occurs under the action of an external environment , and the state of public opinion is . In this situation, the government and other relevant organizations will take corresponding measures to reduce or eliminate harm caused by the event and control its spread in the network. The various components of this scenario serve as the input variables for the next scenario and, under the joint action of the driving factor , result in the development of the disaster event . The event continues to evolve, leading to all public opinion states , which together constitute online public opinion regarding the evolution and development process of the typhoon and the cascading disaster.
3.3.3. Construction of Typhoon Cascading Disaster Scenarios Based on Bayesian Networks
A Bayesian network is a Directed Acyclic Graph (DAG), where nodes symbolize variables and are linked by directed edges [50]. Specifically, the nodes denote random variables, and the directed edges depict the interrelationships among the nodes. In this study, we assume that the discrete states of node variables such as disaster events, the external environment, driving factors, emergency activities, and emergency targets are as shown in Table 1. Conditional probabilities are employed to represent the dependency among variables, whereas prior probabilities are utilized to express nodes without parent nodes.

Table 1.
Node variable types and their discrete states.
The DBNs incorporate time elements into the Bayesian network, keeping the development process of typhoon cascading disasters consistent with the online public opinion stage. This model ensures that the process of typhoon cascading disasters aligns with the stages of online public opinion, thereby offering a more accurate reflection of reality. In the DBNs, the joint event probability formula is adopted to represent uncertainty, as shown in the following equation:
In this equation, is the probability of events A and B occurring simultaneously; is the conditional probability, which is the probability of event A occurring under the premise of event B; and is the probability of event B occurring.
After determining all node variables and conditional probabilities, the joint probability formula of the DBNs can be expressed as the product of the conditional probability of each node:
Here, is the parent node of node , and is the conditional probability of the node.
When constructing a Bayesian model, the conditional probability can be calculated by integrating historical data and relevant material. However, a major challenge arises in calculating the conditional probability distribution for nodes with parent nodes. Because experts usually only use verbal quantifiers to describe probability, it is difficult to provide accurate probability values. There is a definite correlation between common verbal quantifiers and probability values, which can be represented through a probability benchmark. By using a benchmark, experts can use verbal quantifiers to calculate probability. This approach allows for the more accurate construction of a Bayesian network probability distribution table. Therefore, this paper employed a probability benchmark for calculation and then obtained a comprehensive final probability distribution of the nodes.
4. Results
4.1. Classification of User Sentiment Information and Extraction of User Concern Information
4.1.1. Training and Classification of User Sentiment Model
To improve the accuracy of the user sentiment classification results from the public opinion texts, this study used the weibo_senti_100k sentiment dataset with sentiments labels applied to train the Bert-BiLSTM model. The model was implemented based on the Pytorch framework. The initial learning rate for model training was set to , and the model was trained for 10 epochs. Experimental loss and accuracy curves are shown in Figure 6.
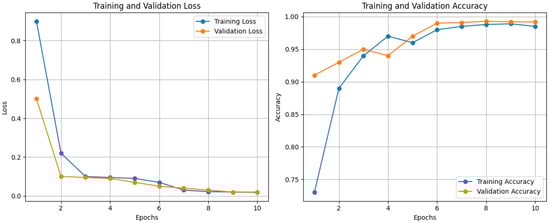
Figure 6.
Curves of loss and accuracy of training and validation.
According to the training results, the accuracy rate of the sentiment analysis model when used on the test set is 98.32%, the recall rate is 97.95%, and the F1 score is 98.32%, indicating that the model has a good classification effect on the dataset.
Then, the trained Bert-BiLSTM model was employed to predict the sentiments expressed in the online public opinion texts after the preprocessing performed in Section 3.2. In total, 21,288 positive sentiments and 5768 negative sentiments were obtained, with positive sentiments accounting for 78.68% of the total.
4.1.2. User Concern Information Extraction
To extract information on users’ concerns about typhoons and their cascading effects, this study first employed a perplexity index to determine the optimal topic number () for positive and negative sentiment data. As shown in Figure 7, the optimal number of topics for positive sentiments is 14, and the optimal number of topics for negative sentiments is 10. For each topic, the top high-frequency words were selected as key terms reflecting user concerns.
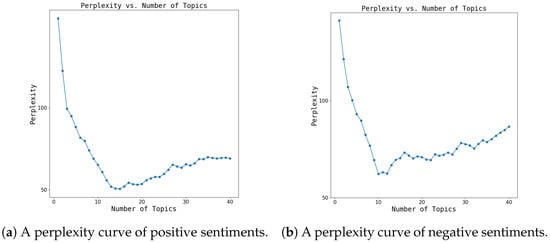
Figure 7.
A perplexity curve of positive/negative sentiments.
This study used GePhi 0.10.1 to visualize a co-occurrence matrix of theme keywords to generate a user network for the co-occurrence of typhoons and their cascading effects. The keywords used had co-occurrence relationships and no directionality, so the constructed network graph was an undirected graph. The greater the degree of centrality, the larger the corresponding nodes, and the thicker the connections between nodes, the greater the co-occurrence between the two phenotypes. Conversely, the thinner the connections, the smaller the co-occurrence. The co-occurrence network intuitively reveals the structural characteristics of and correlation differences in concern hotspots for positive and negative sentiments by presenting the node distribution density and connection strength, as shown in Figure S1.
Based on the node centrality calculation of co-occurrence networks, the UCI values of each network node were calculated, and then sorted using the PageRank algorithm. Finally, the TopN + 1 keyword nodes under each topic were output as user concerns. The distributions of user concerns are shown in Table 2 and Table 3.
Table 2.
Distribution of user concern information for positive sentiments.
Table 3.
Distribution of user concern information for negative sentiments.
4.2. Scenario Representation of Typhoons and Their Cascading Effects Based on User Concern Information
According to the knowledge theory discussed in Section 3.3.2, this study selected the Typhoon Bebinca event as a paradigm. In conjunction with analyzing the outcomes of user concern information derived in Section 4.1.2 for positive and negative sentiments, it analyzed the scenario elements of typhoon cascading disasters and the corresponding emergency responses. Based on this, data on disaster events (C), the external environment (E), driving factors (D), emergency activities (M), and emergency targets (T) at each stage of public opinion were extracted, as shown in Table 4.
Table 4.
Knowledge element representation of typhoon scenarios and their cascading effects (partial).
With reference to the life cycle theory and the evolution characteristics of typhoon cascading disasters, this study proposes four stages of online public opinion: the latent period, the generation period, the development period, and the recovery period.
Upon determining all of the scenario elements of typhoon cascading disasters, this study constructed a Bayesian network for Typhoon Bebinca and its cascading disasters from the perspective of online public opinion. This is shown in Figure 8, where one-way arrows reflect the progression of typhoon events.
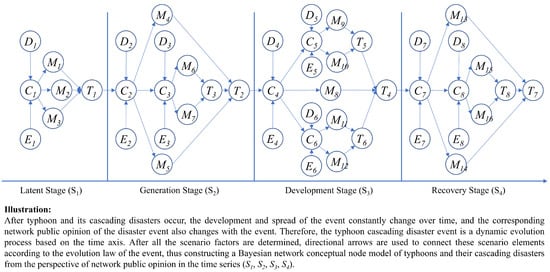
Figure 8.
Structure of Bayesian network for Typhoon Bebinca and its cascading disasters from the perspective of online public opinion.
4.3. Bayesian Scenario Network Model for Typhoon Bebinca and Its Cascading Disasters
In this study, five experts in the field of disaster emergencies were invited to score the above node variables (Table 4) to determine the conditional probability of each node; the partial node variables are shown in Table S1.
Then, according to the calculated conditional probability, a scenario deduction probability distribution diagram of each node variable was obtained for Typhoon Bebinca and its cascading disaster events using the GeNle software, as shown in Figure 9.
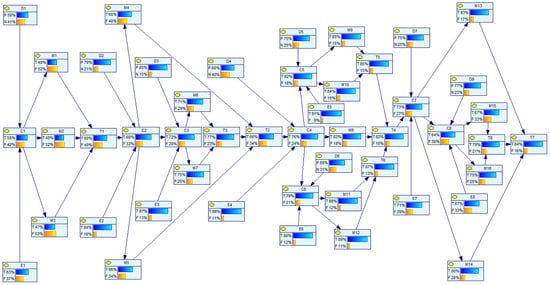
Figure 9.
Bayesian network scenario deduction probability distribution of Typhoon Bebinca and its cascading disasters.
5. Discussion
5.1. Analysis of User Concern Information
The keywords extracted from the above mining of online public opinion themes reveal the focus of users’ concerns in the evolution process of typhoons and their cascading disasters. These keywords, as the core semantic units of public opinion texts, reflect the key characteristics of online users’ concerns about disaster-related information, namely the thematic differentiation in the concerns of the public under positive and negative sentiments.
Users’ concerns under both positive and negative sentiments focus on the impact of typhoons and disaster responses, but there are similarities and differences in the perspectives of their concerns. The core keywords employed by users with positive and negative sentiments are “typhoon”, followed by “impact”, “landing”, etc. These common, central keywords indicate users’ basic understanding of the physical changes caused by typhoons, secondary disasters (such as waterlogging), and emergency responses. “Shanghai”, as the core area affected by typhoons, is at the center of users’ concerns, as shown in Figure S2.
There is a significant difference in the perspective of users’ concerns between positive and negative sentiments. As shown in Table 5, based on indicators such as PageRank and eigenvector centrality, positive-sentiment themes place more emphasis on systematic defense and social collaboration and on early warning of the “intensity” and “path” of disasters by forecasting agencies; government-led actions such as “flood prevention deployment” and “drainage system maintenance”; and behaviors that reflect social cohesion such as “guarding” and “praying for blessings”. The themes of negative sentiments focus on the destructive consequences of disasters and individual difficulties, such as facility damage and disaster anxiety, emphasizing the public’s concern about loss of control during disasters.
Table 5.
Information users focus on under positive and negative sentiments (partial).
Regarding the cascading disasters of typhoons, such as rainstorms and waterlogging, users focus more on the control of disaster elements, using keywords such as “drainage” and “rainstorm”, under positive sentiments, while users focus more on the destructive consequences of disasters such as “seepage” and “waterlogging” under negative sentiments. This is also reflected by the PageRank value and feature vector centrality value under the two sentiments, as shown in Table 6, where ‘\’ represents the lack of an element node in the network.
Table 6.
Information users focus on during rainstorm disasters under positive and negative sentiments.
According to the above analysis results, users differ significantly in their concerns regarding typhoons and their cascading disasters under positive and negative sentiments. Therefore, when conducting scenario modeling on typhoons and their cascading disasters, it is essential to consider the impact factor of user concerns to solve the insufficient user applicability of current typhoon scenario models [34,35]. In addition, the information that users are concerned about can provide a subjective factor basis for the representation of knowledge elements in the subsequent implementation of typhoon chain disaster scenarios and the establishment of typhoon chain disaster scenario evolution models.
5.2. Analysis of Scenario Deduction Results for Typhoon Bebinca and Its Cascading Disasters
The Bayesian network scenario model shown in Figure 9 provides an abstract representation of the conceptual attributes, internal and external connections, and development process of typhoons and their cascading disaster events, driven by online public opinion. It reveals the inherent laws and change logic of various disaster scenarios, which could help decision makers to quickly intervene in developing scenarios and shift sentiments towards optimism.
In addition, according to the modeling results, the probabilities of the occurrence of typhoons and their cascading disaster events , , , , , , , (a sensitivity relationship diagram of eight main node variables is shown in Figure S3, from the generation and development of online public opinion to stable public opinion, are 58%, 68%, 72%, 76%, 82%, 79%, 73%, and 64%, respectively, as shown by the red boxes in Figure 10. This shows that under reasonable emergency intervention, public perceptions of the typhoon and its cascading disaster events continue to evolve in a positive direction, and the deduction process of the scenario model is basically consistent with the impact of the actual typhoon (which caused a storm surge, rainstorm waterlogging, etc.) on the city; this verifies the rationality and reliability of the model.
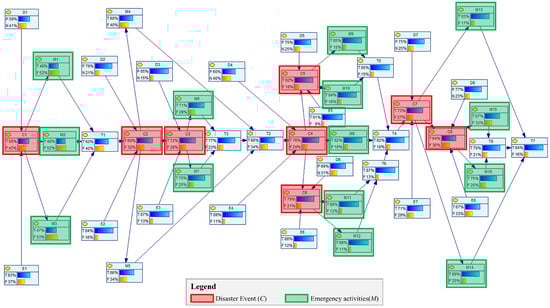
Figure 10.
Scenario knowledge element markers for the evolution process of public opinion on typhoon cascading disasters.
Through our analysis of emergency activities carried out during the evolution of the typhoon and its cascading disaster scenarios (the knowledge elements involved are marked in green in Figure 10), we found that the priority emergency actions taken by various decision makers are the pre-lowering of river network water levels (71%) during the public opinion development stage, the real-time release of waterlogging risk warnings (75%), multi-departmental collaboration to deal with dangerous situations such as fallen trees and objects (82%) during the peak public opinion stage, the reinforcement of embankments (85%), the evacuation of residents in coastal low-lying regions (84%), the emergency drainage of accumulated water (88%), the opening of temporary resettlement points (89%), and the repair of power facilities (83%) during the public opinion stabilization stage, and the clearing of fallen trees (80%). The government’s issuance of a warning before the typhoon, the investigation of hidden dangers in high-altitude structures and outdoor billboards , the pre-lowering of river network water levels , and the thorough drainage of accumulated water and disinfection of affected areas in relation to the cascading effects of urban waterlogging have received relatively little attention and need to be further emphasized.
Additionally, the development of online public opinion is significantly correlated with the evolution of actual disasters, as well as with government issuance of early warnings and emergency measures (the knowledge elements involved are marked in Figure 11). It can be observed that the government has implemented measures such as a Level I response () and the closure of highways (), reducing public fear about Bebinca being the “strongest typhoon in history” () from 79% to 60%. This indicates that timely and effective government action can significantly alleviate public panic and anxiety. When the waterlogging event () occurred, the activity level of the online public opinion platform () was as high as 87%. This indicates that strengthening the guidance of public opinion and information dissemination can effectively alleviate public anxiety and enhance social resilience during disasters.
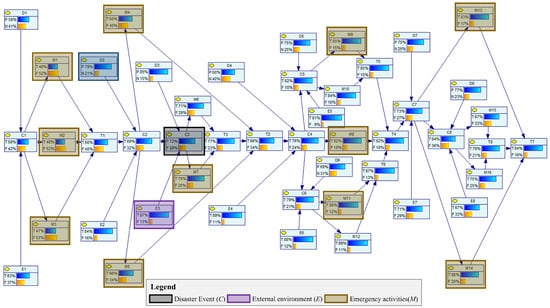
Figure 11.
Labeled scenario knowledge element diagram of emergency responses to typhoon cascading disasters.
Meanwhile, according to the above public opinion deduction process, in the stage, emergency measures are mainly focused on prevention and preparation—considering both the direct impact of the typhoon and subsequent cascading disasters—such as the government issuing warnings (), identifying hidden dangers (), and pre-lowering river network water levels (), lacking comprehensive consideration of subsequent cascading disasters. In the phase, the government’s emergency measures include responding to the direct impact of the approaching typhoon, as well as the resulting floods and transportation issues; these measures include initiating a Level I response (), closing highways (), and issuing flood risk warnings (). In the phase, the government’s emergency measures mainly target typhoon landfall and waterlogging. For example, the disposal of fallen trees and fallen objects (), rushing to drain accumulated water (), and strengthening the embankment (); however, there are fewer measures to mitigate the impact of rainstorms. In the stage, the government mainly focuses on responding to the direct effects of facility damage and waterlogging, such as repairing power facilities () and clearing fallen trees (), while neglecting the public health issues caused by waterlogging. This may limit the efficiency and effectiveness of emergency measures when dealing with the cascading effects of complex disasters.
Based on a deductive analysis of the proposed scenario model of typhoon cascading disasters, this study suggests strengthening the management of emergency responses and simultaneously addressing areas prone to different disasters in future emergencies to better cope with complex disaster chains. For example, when dealing with typhoon disasters, people in areas prone to storm surges and waterlogging can be relocated simultaneously. Unilateral emergency actions considerably affect the efficiency and effectiveness of emergency decision making during complex disasters. It is recommended that decision makers pay attention to such issues and strengthen their responses to cascading disasters.
6. Conclusions
The dynamic scenario modeling of typhoons and their cascading disasters can assist in improving the reliability of emergency decision making. This study proposes a scenario modeling method for typhoon cascading disasters based on online public opinion mining and analysis; this method aims to solve the problems caused by the lack of analyses combining cascading effects and user concern information in previous typhoon scenario modeling. Specifically, we mined online public opinion texts from the Weibo platform regarding Typhoon Bebinca’s landfall in Shanghai from 13 to 18 September 2024. Then, we established a binary sentiment analysis model based on Bert-BiLSTM and trained it on the classic Weibo_Senti_100k sentiment dataset. We used the trained model to extract users’ sentiments from the online public opinion texts and employed the LDA model and UCI equation to calculate and identify user concern information. Subsequently, we selected node elements (disaster events (C), external environment (E), driving factors (D), emergency activities (M), emergency targets (T)) for Bayesian networks by analyzing the evolution characteristics of typhoons and their cascading disasters based on the stages of online public opinion; following this, we analyzed the scenario evolution process of typhoon cascading disasters and constructed corresponding conceptual evolution models (Figure 8). Finally, DBNs were employed to model and simulate typhoons and their cascading disaster scenarios (Figure 9). The simulation results validated the effectiveness of the cascading disaster scenario model (Figure 10 and Figure 11), proving its reliability in disaster emergency applications. The typhoon cascading disaster scenario model developed in this study focused on analyzing the complex pattern and influencing factors of typhoons and their cascading disasters, and based on the deduction results, we recommend strengthening the management of emergency responses and simultaneously addressing areas prone to different disasters in future emergencies to better cope with complex disaster chains, and also strengthening responses to cascading disasters. This could compensate for the shortcomings of the traditional “prediction–response” model and offer more comprehensive and flexible emergency response strategies for typhoons and their cascading disasters.
However, this study predominantly focuses on online public opinion, with the calculation of scenario network node probabilities relying on expert experience. Consequently, it bears limitations regarding data diversity and the adaptability of node probability calculation methods. In future research, the authors intend to incorporate multi-modal public opinion data such as images, videos, sensors (IoT), and meteorological reports, even integrating some fusion models (e.g., multi-modal Transformers). The authors also will consider government behavior regulating public opinion to form a closed-loop feedback public opinion environment. Additionally, the authors will explore the application of AI methods in dynamic scenario deduction and work on developing a self-learning, adaptive scenario evolution model.
Supplementary Materials
The following supporting information can be downloaded at: https://www.mdpi.com/article/10.3390/app15137328/s1, Figure S1: Co-occurrence network of positive/negative sentiments; Figure S2: Word cloud of positive/negative sentiments; Figure S3: Sensitivity diagram of 8 main node variables; Table S1: Conditional probability table of node variables (partial).
Author Contributions
Conceptualization, Y.M., S.H. and J.Q.; methodology, Y.M., S.H. and J.Q.; validation, Y.M., S.H.; formal analysis, Y.M., S.H., J.Q. and S.W.; investigation, Y.M. and S.H.; resources, Y.M. and S.H.; data curation, Y.M. and S.H.; writing—original draft preparation, Y.M.; writing—review and editing, Y.M., S.H., J.Q. and S.W.; supervision, J.Q.; project administration, J.Q.; funding acquisition, S.W. All authors have read and agreed to the published version of the manuscript.
Funding
This work was supported by the National Natural Science Foundation of China (grant 42406190, U24A20600, 42201510), Fundamental Research Funds for the Central Universities (grant 226-2024-00124), Zhejiang Provincial Natural Science Foundation of China (LTGG24D010003). This work was also supported by the Deep-time Digital Earth (DDE) Big Science Program and the Earth System Big Data Platform of the School of Earth Sciences, Zhejiang University.
Data Availability Statement
The raw data supporting the conclusions of this article will be made available by the authors on request.
Conflicts of Interest
The authors declare no conflicts of interest.
References
- Fischer, E.M.; Knutti, R. Anthropogenic contribution to global occurrence of heavy-precipitation and high-temperature extremes. Nat. Clim. Change 2015, 5, 560–564. [Google Scholar] [CrossRef]
- Fang, C.; Zhang, J. Urban agglomerations formation and development in China: Policy guarantee mechanism, countermeasures and suggestions. China Popul. Resour. Environ. 2011, 21, 107–114. [Google Scholar]
- Pandey, B.; Brelsford, C.; Seto, K.C. Rising infrastructure inequalities accompany urbanization and economic development. China Nat. Commun. 2025, 16, 1193. [Google Scholar] [CrossRef] [PubMed]
- Bao, J.; Sherwood, S.C.; Alexander, L.V.; Evans, J.P. Future increases in extreme precipitation exceed observed scaling rates. Nat. Clim. Change 2017, 7, 128–132. [Google Scholar] [CrossRef]
- Han, J.; Du, H.; Wu, Z.; He, H. Changes in extreme precipitation over dry and wet regions of China during 1961–2014. J. Geophys. Res. Atmos. 2019, 124, 5847–5859. [Google Scholar] [CrossRef]
- Hu, Z.; Wu, G.; Wu, H.; Zhang, L. Cross-sectoral preparedness and mitigation for networked typhoon disasters with cascading effects. Urban Clim. 2022, 42, 101140. [Google Scholar] [CrossRef]
- Pescaroli, G.; Alexander, D. Understanding compound, interconnected, interacting, and cascading risks: A holistic framework. Risk Anal. 2018, 38, 2245–2257. [Google Scholar] [CrossRef]
- Zhu, Y.; Yang, Q.; Fu, L.; Cai, C.; Wang, J.; He, L. Scenario construction and evolutionary analysis of nonconventional public health emergencies based on Bayesian networks. Front. Public Health 2025, 13, 1489904. [Google Scholar] [CrossRef]
- Mueller, S.; Sammonds, P.; Bhat, G.M.; Pandita, S.; Suri, K.; Thusu, B.; Le Masson, V. Disaster scenario simulation of the 2010 cloudburst in Leh, Ladakh, India. Int. J. Disaster Risk Reduct. 2019, 33, 485–494. [Google Scholar] [CrossRef]
- Godet, M.; Roubelat, F. Creating the future: The use and misuse of scenarios. Long Range Plan. 1996, 29, 164–171. [Google Scholar] [CrossRef]
- Giorgi, S. The mind and heart of resonance: The role of cognition and sentiment in frame effectiveness. J. Manag. Stud. 2017, 54, 711–738. [Google Scholar] [CrossRef]
- Daly, R.; Shen, Q.; Aitken, S. Learning Bayesian networks: Approaches and issues. Knowl. Eng. Rev. 2011, 26, 99–157. [Google Scholar] [CrossRef]
- Pescaroli, G.; Alexander, D. A definition of cascading disasters and cascading effects: Going beyond the “toppling dominos” metaphor. Planet Risk 2015, 3, 58–67. [Google Scholar]
- Cutter, S.L. Compound, Cascading, or Complex Disasters: What’s in a Name? Environ. Sci. Policy Sustain. Dev. 2018, 60, 16–25. [Google Scholar] [CrossRef]
- Tang, P.; Zhong, W.; Wen, J.; Shao, S.; Zhou, D.; Huang, S. Developing and understanding cascading effects scenario of typhoons in coastal mega-cities from system perspectives for disaster risk reduction: A case study of shenzhen, China. Int. J. Disaster Risk Reduct. 2023, 92, 103691. [Google Scholar] [CrossRef]
- Chen, F.; Ding, K.; Sun, Z. Effect of Nonlinear Factors on Typhoon-Induced Storm Surges. J. Mar. Sci. Eng. 2024, 13, 5. [Google Scholar] [CrossRef]
- Shi, L.; Olabarrieta, M.; Nolan, D.S.; Warner, J.C. Tropical cyclone rainbands can trigger meteotsunamis. Nat. Commun. 2020, 11, 678. [Google Scholar] [CrossRef]
- Galarneau, T.J.; Bosart, L.F.; Schumacher, R.S. Predecessor rain events ahead of tropical cyclones. Mon. Weather. Rev. 2010, 138, 3272–3297. [Google Scholar] [CrossRef]
- Yang, J.; Chen, M. Potential impacts of flood risk with rising sea level in Macau: Dynamic simulation from historical Typhoon Mangkhut (2018). Ocean. Eng. 2022, 246, 110605. [Google Scholar] [CrossRef]
- Hong, S.; Shen, J.; Yang, H.; Pirasteh, S.; Liu, S.; Ishii, K. Enhancing flexibility and efficiency for urban waterlogging response scenarios simulation: An open-ended approach involving user participation. Int. J. Digit. Earth 2025, 18, 2468420. [Google Scholar] [CrossRef]
- Wang, J.J.; Ling, H.I. Developing a risk assessment model for typhoon-triggered debris flows. J. Mt. Sci. 2011, 8, 10–23. [Google Scholar] [CrossRef]
- Huggins, T.J.; E, F.; Chen, K.; Gong, W.; Yang, L. Infrastructural aspects of rain-related cascading disasters: A systematic literature review. Int. J. Environ. Res. Public Health 2020, 17, 5175. [Google Scholar] [CrossRef]
- Hu, S.; Deng, Z.; Liu, B.; Hu, M.; Xu, B.; Yu, X. Impact of tidal dynamics and typhoon-induced inundation on saltwater intrusion in coastal farms. Sci. Total Environ. 2024, 915, 170109. [Google Scholar] [CrossRef]
- Chen, L.; Chen, Y.; Zhang, Y.; Xu, S. Spatial patterns of typhoon rainfall and associated flood characteristics over a mountainous watershed of a tropical island. J. Hydrol. 2022, 613, 128421. [Google Scholar] [CrossRef]
- Li, L.; Wang, C.; Pareja-Roman, L.F.; Zhu, J.; Chant, R.; Wang, G. Effects of typhoon on saltwater intrusion in a high discharge estuary. J. Geophys. Res. Ocean. 2022, 127, e2021JC018206. [Google Scholar] [CrossRef]
- Zhang, H.; Cheng, M.; Fang, W. Joint probability analysis of storm surges and waves caused by tropical cyclones for the estimation of protection standard: A case study on the eastern coast of the Leizhou Peninsula and the island of Hainan in China. Nat. Hazards Earth Syst. Sci. 2023, 23, 2697–2717. [Google Scholar]
- Chen, L.; Luo, Z.; Jing, R.; Ye, K.; Xie, M. Two-stage planning of integrated energy systems under copula models informed cascading extreme weather uncertainty. Appl. Energy 2025, 380, 124990. [Google Scholar] [CrossRef]
- Cai, Y.; Li, L.; Elahi, E.; Qiu, Y. Selection of policies on typhoon and rainstorm disasters in China: A content analysis perspective. Sustainability 2018, 10, 387. [Google Scholar] [CrossRef]
- Zhang, H.; Zhou, H.; Li, J.; Zhang, X. Research on the Situational Awareness of a Major Emergency under Incomplete Information. J. China Soc. Sci. Technol. Inf. 2021, 40, 903–913. [Google Scholar]
- Wu, K.; Wu, J.; Ding, W.; Tang, R. Extracting disaster information based on Sina Weibo in China: A case study of the 2019 Typhoon Lekima. Int. J. Disaster Risk Reduct. 2021, 60, 102304. [Google Scholar] [CrossRef]
- Noguchi, H.; Nishizawa, T.; Fuse, M. A method to characterize the social cascading damage processes of disasters using media information. Nat. Hazards 2021, 107, 231–247. [Google Scholar] [CrossRef]
- Hao, H.; Wang, Y. Leveraging multimodal social media data for rapid disaster damage assessment. Int. J. Disaster Risk Reduct. 2020, 51, 101760. [Google Scholar] [CrossRef]
- Sakahira, F.; Hiroi, U. Designing cascading disaster networks by means of natural language processing. Int. J. Disaster Risk Reduct. 2021, 66, 102623. [Google Scholar] [CrossRef]
- Qie, Z.; Rong, L. A scenario modelling method for regional cascading disaster risk to support emergency decision making. Int. J. Disaster Risk Reduct. 2022, 77, 103102. [Google Scholar] [CrossRef]
- Li, M.; Wang, J.; Sun, X. Scenario-based risk framework selection and assessment model development for natural disasters: A case study of typhoon storm surges. Nat. Hazards 2016, 80, 2037–2054. [Google Scholar] [CrossRef]
- Dong, J.; Wang, J.; Chen, Z.; Xu, S. The risk scenario analysis of typhoon gale in eastern coastal area of China. In Proceedings of the 21st International Conference on Geoinformatics, Kaifeng, China, 20 June 2013. [Google Scholar]
- Li, M.; Wu, W.; Wang, J.; Che, Z.; Xie, Y. Simulating and mapping the risk of surge floods in multiple typhoon scenarios: A case study of Yuhuan County, Zhejiang Province, China. Stoch. Environ. Res. Risk Assess. 2017, 31, 645–659. [Google Scholar] [CrossRef]
- Li, S.; Chen, S.; Liu, Y. A method of emergent event evolution reasoning based on ontology cluster and bayesian network. IEEE Access 2019, 7, 15230–15238. [Google Scholar] [CrossRef]
- Qian, J.; Liu, Y.; Liu, C.; Jiao, Y. Study on case analysis and scenario deduction based on multi-dimensional scenario space method. Syst.-Eng.-Theory Pract. 2015, 35, 146–153. [Google Scholar]
- Yang, Z.; Dong, X.; Guo, L. Scenario inference model of urban metro system cascading failure under extreme rainfall conditions. Reliab. Eng. Syst. Saf. 2023, 229, 108888. [Google Scholar] [CrossRef]
- Fu, S.; Xiao, Y.; Zhou, H. Contingency response decision of network public opinion emergencies based on intuitionistic fuzzy entropy and preference information of decision makers. Sci. Rep. 2022, 12, 3246. [Google Scholar] [CrossRef]
- Liu, X. Thought and practice of flood and drought disaster prevention in Shanghai. China Water Resour. 2020, 17, 40–42. [Google Scholar]
- Wu, L.; Yu, R.; Xiang, C.; Yu, H.; Feng, Y.; Zhou, X. Extreme Impacts of Four Landfalling Tropical Cyclones in China during the 2024 Peak Season. Adv. Atmos. Sci. 2025, 42, 817–824. [Google Scholar] [CrossRef]
- Wukich, C. Government social media messages across disaster phases. J. Contingencies Crisis Manag. 2016, 24, 230–243. [Google Scholar] [CrossRef]
- Ragini, J.R.; Anand, P.R.; Bhaskar, V. Big data analytics for disaster response and recovery through sentiment analysis. Int. J. Inf. Manag. 2018, 42, 13–24. [Google Scholar] [CrossRef]
- Kahn, H.; Wiener, A.J. The next thirty-three years: A framework for speculation. Daedalus 1967, 96, 705–732. [Google Scholar]
- Xu, G.; Meng, Y.; Qiu, X.; Yu, Z.; Wu, X. Sentiment analysis of comment texts based on BiLSTM. IEEE Access 2019, 7, 51522–51532. [Google Scholar] [CrossRef]
- Wang, X.; Yang, X.; Fan, S.; Ruan, J. A Methodology of Scenario Construction and Deduction of Unconventional Emergency. J. Uesstc. Social Sci. Ed. 2013, 15, 22–27. [Google Scholar]
- Wang, Y.; Li, X.; Xu, L. Fuzzy rules reasoning method in emergency context reconstruction. Syst.-Eng.-Theory Pract. 2012, 32, 954–962. [Google Scholar]
- Chen, S.H.; Pollino, C.A. Good practice in Bayesian network modelling. Environ. Model. Softw. 2012, 37, 134–145. [Google Scholar] [CrossRef]
Disclaimer/Publisher’s Note: The statements, opinions and data contained in all publications are solely those of the individual author(s) and contributor(s) and not of MDPI and/or the editor(s). MDPI and/or the editor(s) disclaim responsibility for any injury to people or property resulting from any ideas, methods, instructions or products referred to in the content. |
© 2025 by the authors. Licensee MDPI, Basel, Switzerland. This article is an open access article distributed under the terms and conditions of the Creative Commons Attribution (CC BY) license (https://creativecommons.org/licenses/by/4.0/).