Article

Dynamic Response Mitigation of Offshore Jacket Platform Using Tuned Mass Damper Under Misaligned Typhoon and Typhoon Wave

1
ChinaPower China Huadong Engineering Corporation Limited, Hangzhou 310058, China
2
Ocean College, Zhejiang University, Zhoushan 316021, China
*
Authors to whom correspondence should be addressed.
Appl. Sci. 2025, 15(13), 7321; https://doi.org/10.3390/app15137321
Submission received: 23 May 2025 / Revised: 25 June 2025 / Accepted: 26 June 2025 / Published: 29 June 2025

Abstract

This study addresses the dynamic response control of deep-water jacket offshore platforms under typhoon and misaligned wave loads by proposing a Tuned Mass Damper (TMD)-based vibration suppression strategy. Typhoon loading is predicted using the Weather Research and Forecasting (WRF) model to simulate maximum wind speed and direction, a customized exponential wind profile fitted to WRF results, and a spectral model calibrated with field-measured data. Correspondingly, typhoon wave loading is calculated using stochastic wave theory with the Joint North Sea Wave Project (JONSWAP) spectrum. A rigorous Finite Element Model (FEM) incorporating soil–structure interaction (SSI) and water-pile interaction is implemented in the Opensees platform. The SSI is modeled using nonlinear Beam on Nonlinear Winkler Foundation (BNWF) elements (PySimple1, TzSimple1, QzSimple1). Numerical simulations demonstrate that the TMD effectively mitigates dynamic platform responses under aligned typhoon and wave conditions. Specifically, the maximum deck acceleration in the X-direction is reduced by 26.19% and 31.58% under these aligned loads, with a 17.7% peak attenuation in base shear. For misaligned conditions, the TMD exhibits pronounced control over displacements in both X- and Y-directions, achieving reductions of up to 29.4%. Sensitivity studies indicated that the TMD’s effectiveness is more significantly impacted by stiffness detuning than mass detuning. It should be emphasized that the effectiveness verification of linear TMD is limited to the load levels within the design limits; for the load conditions that trigger extreme structural nonlinearity, its performance remains to be studied. This research provides theoretical and practical references for multi-directional coupled vibration control of deep-water jacket platforms in extreme marine environments.

1. Introduction

A jacket platform is a fixed-type marine engineering structure composed of a steel truss (jacket), pile foundations, and an upper module (deck). It is widely used in offshore oil and gas exploitation, offshore wind turbine support, and oceanographic observation. Notably, there are approximately 7000 offshore platforms worldwide for marine energy production, with 93% being jacket-type platforms constructed by welding tubular members [1]. The deployment of marine structures in deep-water environments intensifies the coupled effects between complex hydrodynamic loads (including wind-wave-current interactions) and structural dynamic responses. Under extreme marine environmental excitations, structural vibrational energy may excite higher-order modal responses, leading to distortion of local stress fields and fatigue crack initiation/propagation, thereby significantly compromising structural integrity. Crucially, such vibrations persist until the energy is fully dissipated through damping mechanisms. However, conventional passive damping systems relying on frictional effects at joint interfaces and microcrack friction energy dissipation in reinforced concrete exhibit notably insufficient energy dissipation efficiency during elastic working stages [2].
Traditional vibration mitigation design paradigms primarily rely on structural stiffness enhancement principles, achieving natural frequency regulation through large-scale material augmentation. Although this mass-driven solution can attain predefined frequency response control objectives, it induces exponentially escalating construction costs in deep-water engineering practices, significantly undermining economic feasibility [3]. Consequently, dynamic control methodologies such as vibration suppression technologies and energy dissipation systems have demonstrated substantial mitigation efficacy through experimental validation [4]. Vibration control strategies are categorized into active and passive modes. Active control systems depend on real-time sensor-actuator networks and external energy supply [5]. However, for offshore infrastructure exposed to harsh marine environments, their complexity, energy dependency, and maintenance sensitivity render them prohibitively challenging. Passive control systems have gained widespread adoption due to their energy autonomy and operational robustness, classified into two categories based on energy dissipation media: solid dampers (e.g., Tuned Mass Damper (TMD), Friction Damper (FD), Shape Memory Alloy Damper (SMA)) and fluid-based dampers (e.g., Tuned Liquid Damper (TLD), Tuned Liquid Column Damper (TLCD), Hydrodynamic Buoyant Mass Damper (HBMD)) [6]. Among these, TMD has emerged as a primary research focus in solid damper applications owing to its parameter tunability, engineering maturity, and adaptability to multimodal vibrations in deep-water jacket platforms.
As a classic passive control device, the Tuned Mass Damper (TMD) was initially proposed by Frahm (1909) [7] to mitigate ship vibrations induced by ocean waves. The TMD neutralizes primary structural vibrations through the counter-phase inertial forces generated by its mass-spring-damper system. Typically, a TMD with a mass equivalent to 1–2% of the structure’s first modal mass is installed at optimal elevations and tuned to the structure’s fundamental frequency. When excited at this frequency, the damper mass absorbs and dissipates vibrational energy through out-of-phase motion relative to the host structure. Wu et al. [8] implemented TMDs on offshore platforms under seismic loads. The vibration suppression performance of passive TMDs critically depends on precise matching of core parameters: mass ratio, frequency ratio, and damping ratio. Guo et al. [9] developed a frequency-domain iterative optimization framework for nonlinear TMDs, quantitatively revealing the influence of primary structural damping ratios and excitation intensities on parametric sensitivity. Their work confirmed that nonlinear stiffness design can transcend the bandwidth limitations inherent to linear TMD configurations. To address time-varying loads and uncertainties in practical engineering, multi-objective robust optimization methods have gained prominence. Bui and Tran [10] introduced Pareto frontier solution theory in bridge-TMD design, simultaneously optimizing displacement suppression rates under high wind speeds and mass block travel constraints. Recent advancements focus on intelligent optimization algorithms (e.g., genetic algorithm, particle swarm optimization) for coordinated TMD-structure tuning in deep-water jacket platforms, addressing wave-structure nonlinear coupling effects. By decoupling multimodal resonance peaks from the multi-peak characteristics of nonlinear dynamic equations, these advancements have expanded the operational applicability boundaries of passive TMD systems in deep-water engineering [11,12].
Notably, the placement position of TMDs significantly influences vibration suppression efficiency. Xu et al. [13] demonstrated that installing TMDs on platform decks maximizes inertial force effectiveness, providing theoretical guidance for TMD deployment in deep-water jacket platforms. While alternative solid dampers, such as FD and SMA, exhibit potential application, their performance is constrained by nonlinear characteristics or environmental sensitivity. For instance, SMA dampers rely on temperature-phase transition coupling for energy dissipation, which can induce distortions in the hysteresis loop under extreme conditions [14]. Conversely, FD systems face damping ratio degradation due to frictional interface wear during prolonged service [15]. In contrast, TMDs, with their linear dynamic characteristics and operational robustness, prove better suited for complex time-varying load scenarios in deep-water electrical platforms.
Fluid-based dampers, including Tuned Liquid Dampers (TLDs) and Tuned Liquid Column Dampers (TLCDs), dissipate energy through the resonant sloshing of liquids. However, their performance is constrained by fluid nonlinearities and spatial installation limitations. Jin et al. [16] demonstrated that TLDs can mitigate seismic responses in jacket platforms, with larger mass ratios yielding more significant vibration suppression. Yet, this approach conflicts with structural lightweighting imperatives. Sardar et al. [17] identified optimal TLD placement at the top deck level, where increasing mass ratios enhance control effectiveness. Paul et al. [18] proposed semi-active hydraulic dampers to reduce deck accelerations, shear forces, and foundation displacements.
Nevertheless, the sealing integrity and corrosion resistance requirements of fluid dampers escalate maintenance costs in deep-water environments. Viscous Dampers (VDs), leveraging broadband vibration suppression and hermetic sealing, represent classical liquid-based solutions. However, their velocity-dependent performance causes response deficiencies under low-frequency wave loads. Patil et al. [19] systematically compared viscoelastic, viscous, and friction dampers for wave-induced jacket platform responses. Tabeshpour et al. [20] optimized VD deployment configurations using long-term metocean data to enhance structural longevity. Janbazi Rokni et al. [21] emphasized that VD fatigue life optimization requires precise phase synchronization with platform motions. Critically, multimodal coupling vibrations in deep-water jackets may induce localized VD overloading. In contrast, TMDs maintain stable dissipation efficiency across low-frequency excitations due to their inertial forces’ direct proportionality to structural accelerations [22].
This study investigates the vibration mitigation performance of Tuned Mass Dampers (TMDs) on deep-water jacket platforms under typhoon-induced wind and wave loads. The jacket platform was modeled in OpenSees using P-y, T-z, and Q-z nonlinear springs to capture soil–structure interaction (SSI). Wind velocity profiles were simulated using the von Kármán spectrum, while wave kinematics were generated via the JONSWAP spectrum, with hydrodynamic forces calculated using Morison’s equation. Dynamic responses of the offshore platform were analyzed under both aligned and misaligned wind-wave loading conditions. The paper is structured as follows: Section 2 covers the theoretical framework of TMD operational mechanisms; Section 3 discusses the structural configuration of the jacket platform and finite element modeling methodology; Section 4 discusses typhoon-induced wind and wave loading characterization; and Section 5 concludes with an evaluation of implementation and efficacy evaluation of TMD for dynamic response mitigation.

2. Research Methodology and TMD Fundamentals

2.1. Overall Research Methodology

This study adopts a comprehensive numerical simulation framework to evaluate the control effect of TMD on the dynamic response of deep-water jacket platforms under typhoon-wave loads. The overall research process is shown in Figure 1, with the main process depicted in Figure 1a, involving the following key steps. In terms of platform structure modeling, a three-dimensional nonlinear finite element model of the deep-water jacket platform is established in OpenSees based on actual engineering parameters. The model strictly considers soil-pile interaction (SSI) and water-pile interaction, where SSI effects are accurately simulated by the nonlinear BNWF model (PySimple1, TzSimple1, and QzSimple1) (Figure 1b).
For an environmental load simulation, it can be divided into typhoon wind loads and typhoon wave loads. The typhoon wind loads use the WRF model to simulate extreme typhoon scenarios (Section 4.1) to obtain key wind parameters. Dynamic wind loads acting on the structure are generated by combining the exponential wind speed profile fitted based on WRF results and the wind spectrum model calibrated with measured data. The typhoon wave loads adopt random wave theory combined with the JONSWAP spectrum (Section 4.2) to characterize the extreme wave field. Wave particle kinematics are calculated based on linear wave theory, and Morison’s equation is applied to compute wave loads on the pile foundation (Figure 1c). The implementation of the TMD control strategy will be introduced in the subsequent sections of this chapter.
Finally, dynamic response analysis and evaluation are conducted. Nonlinear time-history analysis is performed under the simulated typhoon-wave loads (Section 5). The peak values and decay rates of key response indicators (deck acceleration, displacement, and base shear) are compared to quantify the vibration reduction efficiency of TMD.

2.2. Theoretical Framework of TMD

The dynamic behavior of offshore jacket structures under environmental loads such as waves, wind, etc., necessitates a rigorous analysis of structural vibrations. To characterize the time-dependent response of offshore platforms, the governing equations of motion under external excitation have the following expression.
M δ ¨ + C T δ ˙ + K δ = F
where M represents the structural mass matrix. C T indicates the damping matrix. K refers to the structural stiffness matrix. δ , δ ˙ , and δ ¨ define the deformation, velocity, and acceleration of the structure, respectively. F denotes the external forces, including wind load F w i n d , wave and current load F w c
F = F w i n d + F w c
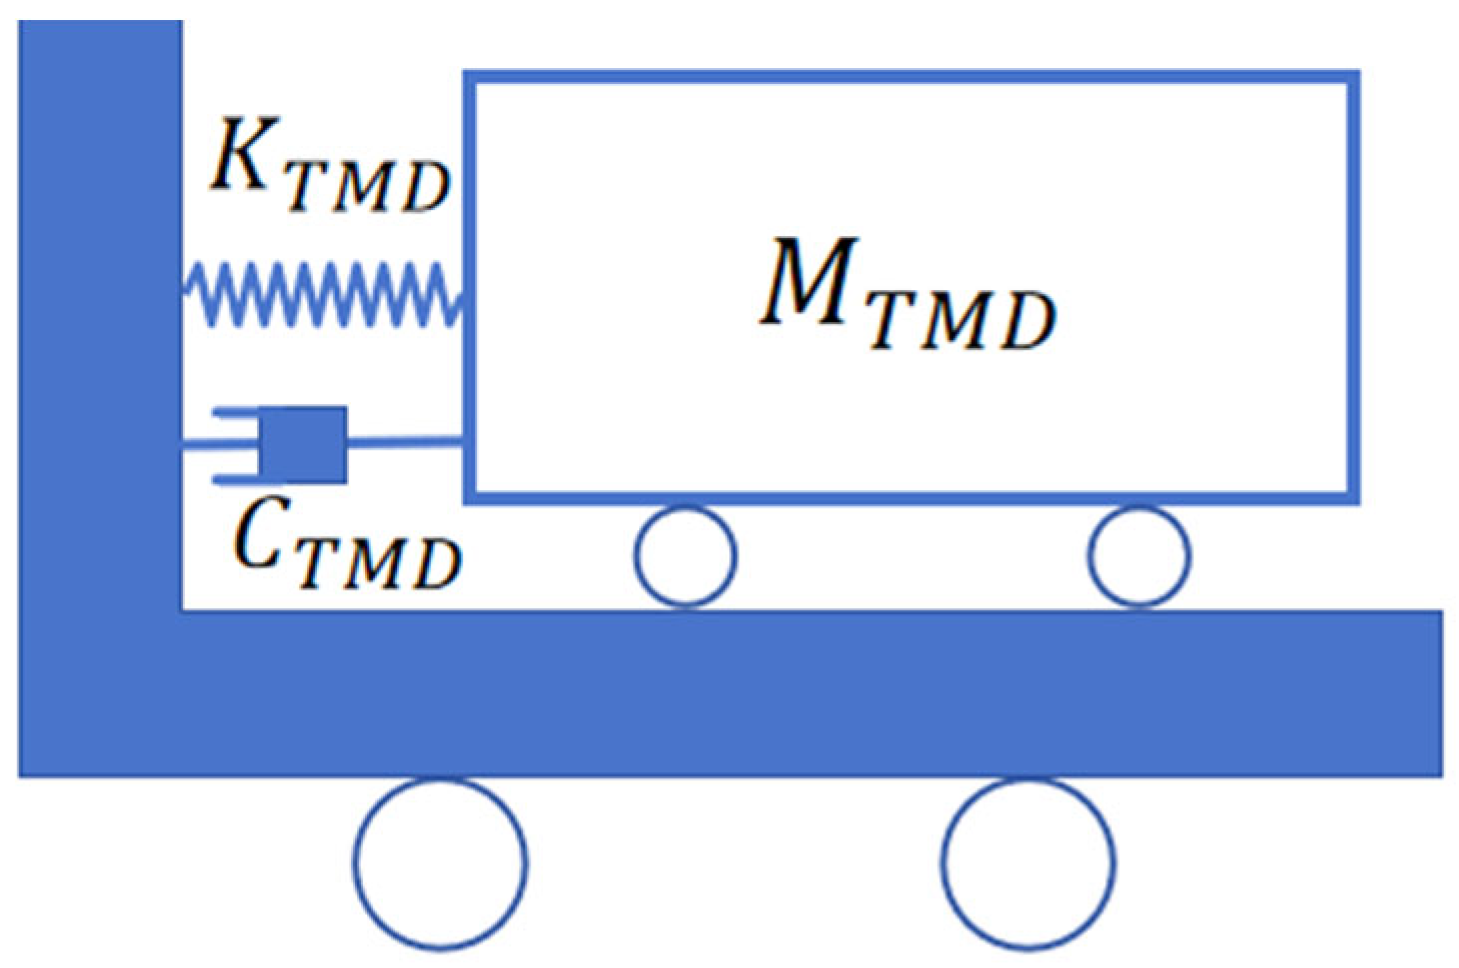
For the TMD control device, this study employs a node and two zero-length elements for modeling and simulation. The computational model is shown in Figure 2. The node is connected to the structural node via two zero-length elements to model K T M D (stiffness) and C T M D (damping), respectively, with M T M D (mass) applied to this node. The stiffness coefficient and damping coefficient of the TMD, considering linear spring and linear damping characteristics, are determined using elastic and viscous materials, respectively.
As shown in Equation (1), the motion equation of the TMD under external excitation on the offshore platform can be expressed as:
M TMD Z ¨ + C TMD Z ˙ Z s ˙ + K TMD Z Z s = 0
where the equation, Z ¨ ,     Z ˙ and Z represent the horizontal acceleration, velocity, and displacement of the TMD, respectively, while Z ˙ s and Zs denote the horizontal velocity and displacement of the primary structure. This TMD modeling method modifies the global quality matrix (M), damping matrix (C), and stiffness matrix (K) in Equation (1) in the following equations:
M = M 0 0 M TMD
C = C + C TMD C TMD C TMD C TMD
K = K + K TMD K TMD K TMD K TMD
In this study, a mass ratio of 0.02 was adopted for the TMD. This ratio balances three key criteria: vibration suppression efficacy, [9] indicated that a mass ratio between 1% and 3% optimizes the attenuation of dominant low-frequency structural modes in the floating platform’s main deck, ensuring optimal control of dynamic responses under wave excitation; economic viability, ratios exceeding 3% incur substantial costs due to increased deck weight and reinforcement needs [12], making the 2% selection a pragmatic compromise between performance and budget constraints; and physical feasibility, the chosen TMD mass adheres to spatial limitations during actual deck installation, ensuring structural compatibility and operational feasibility without compromising usable workspace. The frequency and optimal damping percentage of the TMD are calculated using Equations (7) and (8) proposed by Pastia and Luca [23]:
f o p t = f 1 1 + μ
ξ o p t = 3 μ 8 ( 1 + μ ) 3
where f o p t and f 1 are the frequencies of the Tuned Mass Damper (TMD) and the structure, respectively μ is the mass ratio, and ξ o p t represents the optimal damping percentage of the TMD. The total mass of the offshore platform system is 8,737,068.65 kg, with the damper mass being 174,741.37 kg. The natural frequency of the jacket system is 1.021 Hz, while the TMD is tuned to 1.001 Hz. The optimal damping percentage of the TMD is calculated as 8.4%. Since the mass ratio of the TMD relative to the entire structure is low, it does not induce significant inertial redistribution. Meanwhile, the operating bandwidth of the TMD is tuned exclusively for the fundamental frequency mode, while higher modes remain uncoupled. Consequently, the local coupling addressed in Equations (4)–(6) exerts a negligible influence on higher-frequency modes. The stiffness and damping of the system can be derived using Equations (9) and (10):
K T M D = 2 × π × f o p t 2 × M T M D
C T M D = 4 × π × f o p t × M o p t × ξ o p t

3. Offshore Platform Overview and Finite Element Model

3.1. Deep-Water Offshore Platform

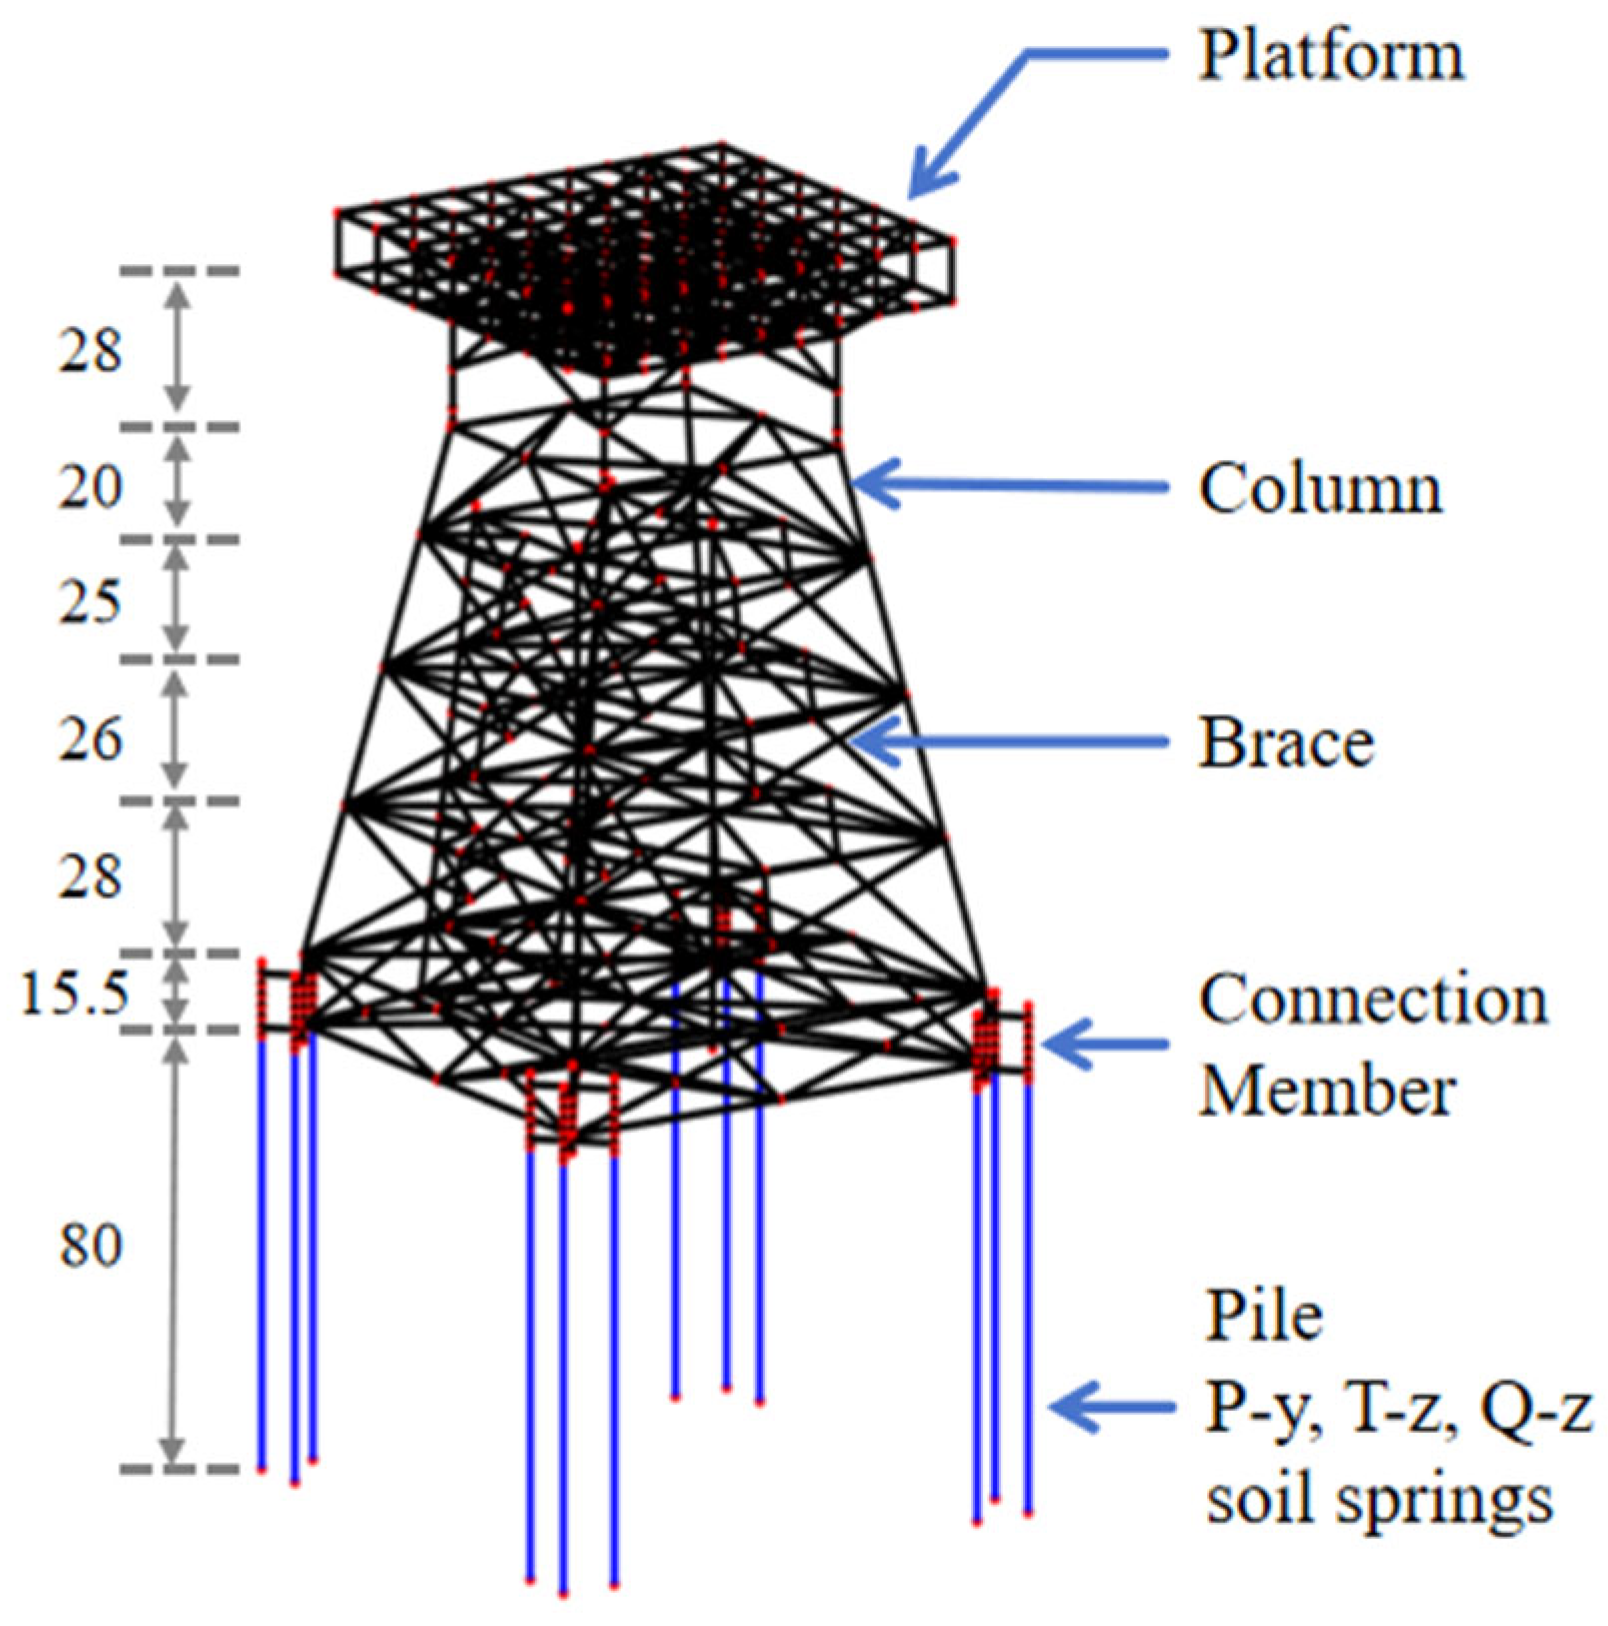
As illustrated in Figure 3, the deep-water offshore platform (designed for water depths reaching 105 m) consists of an upper module and a lower jacket substructure. The substructure utilizes a bucket-supported four-legged jacket configuration to enhance stability in deep-water conditions. Upon the completion of fabrication, installation, and commissioning for the upper module, the entire structure will be transported to the offshore site for ultimate installation. The upper module adopts a four-level configuration with footprint dimensions of 51 m × 47 m, an overall height of around 11 m, and the top deck elevation reaching approximately 48 m above mean sea level. Functional modules mounted on the deck—such as power distribution systems, HVAC (Heating, Ventilation, and Air Conditioning) setups, and fire protection apparatuses—have been meticulously integrated into the finite element (FE) model through the application of equivalent mass modeling methodologies.
The jacket foundation is composed of four primary legs anchored by twelve open-tip steel pipe piles, featuring six horizontally framed layers strategically placed along its vertical axis. The uppermost layer at +9.0 m mean sea level (MSL) connects to the topside modules, with subsequent layers positioned at −11 m, −36 m, −62 m, −90 m, and −103 m MSL—each layer incorporating a progressively denser X-brace configuration and thicker member walls. At the seabed interface, the substructure forms a 55 m × 55 m square footprint, with its legs inclined at a 1:7 slope to enhance lateral rigidity against overturning moments. The piles have a 2.5 m diameter, 40 mm wall thickness, and 80 m total length, while the jacket’s tubular components are constructed from S355 steel.

3.2. Finite Element Model

This paper assumes that all steel components (including piles, braces, and horizontal members) are modeled using linear elastic materials. This simplification is justified based on: (1) the research focus on global structural dynamic responses (displacement/internal force distributions) rather than local plastic failure mechanisms; (2) typhoon loads represent short-term events, with post-processing verification confirming maximum stresses remain below the yield strength of Q345 steel [24]; (3) soil nonlinearity (plastic deformation and gap effects) is independently characterized through P-y/T-z/Q-z curves. It should be noted that both the typhoon loads adopted in this study and the maximum pile—head forces derived from simulations are lower than those in [24]. Thus, it can be reasoned that the stresses in the present model never exceed the elastic limit defined in [24].
This study employs the OpenSees software Version 3.7.1 to develop a high-fidelity finite element (FE) model of the offshore platform for dynamic analysis. As illustrated in Figure 4, the FE model comprises 456 nodes and 956 elements, strategically discretized to balance computational efficiency and resolution. Structural components are modeled using beam-column elements, and the nonlinear pile-soil interaction is simulated using the PySimple1, TzSimple1, and QzSimple1 material models within the OpenSees framework to capture axial, lateral, and tip resistance mechanisms. In this paper, the mesh size adopted in Ref. [25] is that the element length of the Tubular Joints is 1.5 D (D represents the outer diameter of the tubular component). Ref. [26] sets the time step as Δ t = 0.1 T m i n , where T m i n denotes the fundamental period.
In terms of model loading and boundary condition setting, the combined effects of environmental loads and gravity loads are considered at the same time. The foundation model uses nonlinear soil springs to simulate pile-soil interaction and is based on the nonlinear Winkler foundation beam theory for modelling and analysis. The P-y cell is used to simulate the lateral response characteristics of the soil, while the T-z and Q-z cells are used to describe the lateral frictional resistance behavior of the soil and the end-bearing response of the soil in the near-field, respectively, so as to achieve an accurate simulation of the complex pile-soil interaction mechanism.

3.3. Soil–Structure Interaction

Existing simulation techniques for pile-soil interaction forces primarily include direct consolidation modeling, equivalent fixed-base modeling, m-method simulation, and P-y curve analysis. Among these, the direct consolidation approach overlooks pile-soil interaction, while the equivalent fixed-base method ignores soil effects [27]. Considering the soil properties in the East China Sea, this study employs P-y, T-z, and Q-z curve methodologies for simulation. The P-y curve method is rooted in elastic subgrade reaction theory: as depicted in Figure 5, it substitutes soil with nonlinear soil springs, overcoming the limitations of earlier linear elastic spring models. This approach accurately captures the nonlinear response of soil surrounding piles under loading conditions.
The PySimple1 material model in OpenSees captures nonlinear pile-soil interactions, theoretically based on the three-component series framework proposed by Shahin et al. [27]. This model breaks down soil resistance into three serial components—elastic (p- y e ), plastic (p- y p ), and gap (p- y g )—governed by displacement superposition and force equilibrium principles, as detailed in Equation (11).
y = y e + y p + y g p = p d + p c
where y e denotes the elastic displacement component, modeled via linear springs to capture the far—field soil’s elastic response; y p represents the plastic displacement component, capturing post—yield soil stiffness decay through the kinematic hardening criterion; and y g signifies the gap displacement component, accounting for pile-soil separation and re-contact via a nonlinear closure spring coupled with a trailing spring. This decomposition overcomes the limitations of traditional P-y curves in modeling stiffness degradation and gap effects under cyclic loading. The model’s core constitutive equations are detailed in Equations (12)–(14).
Spanning from C r p p u l t to C r p p u l t , the initial stiffness range demarcates the elastic response regime. Under kinematic hardening, the plastic component equations adhere to a modified hardening criterion, where C r (the initial yield ratio) assumes 0.2 for sandy soils and 0.35 for clayey soils.
p = p p u l t p p u l t p 0 c y 50 c y 50 + z p z 0 p n
Within this formulation, p stands for the total soil resistance, p p u l t signifies the ultimate bearing capacity, c and n shape the curve profile, z p tracks the current plastic displacement, and z 0 p marks the initial displacement of the active plastic loading cycle. For API sand, optimal fitting to the specification-prescribed sand backbone curve is achieved with default parameters c = 0.5 and n = 2 .
The gap closure spring’s contact nonlinearity is characterized by a hyperbolic function, where p c denotes the closure force governing the nonlinear compressive response during pile-soil recontact.
p c = 1.8 p p u l t y 50 y 50 + 50 y o + y g y 50 y 50 + 50 y o y g n
Memory variables y o + (capturing the peak positive displacement during pile-soil separation as the maximum historical gap opening in the positive direction) and y o (tracking the peak negative displacement in the negative direction) ensure stiffness continuity during load reversal. y 50 corresponds to the characteristic displacement associated with 1 / 2 p p u l t .
The drag-resistance spring simulates the governing equations for soil shear effects, where p d denotes the drag force characterizing pile-soil shear interactions.
p d = C d p p u l t ( C d p p u l t p 0 d ) y 50 y 50 + 2 y g y o g n
The drag resistance coefficient C d , which dictates the ratio of the maximum drag force to p p u l t , is set to 0.5 in this study.
The model’s implementation unfolds as such: As pile displacement y grows, the elastic component y e engages first, with the plastic component y p subsequently taking dominance. Should displacement surpass the historical peak, the gap component y g activates, adjusting y o + or y o according to displacement direction (positive or negative). During gap opening, the drag force p d wanes, whereas the closure force p c rises non-linearly once contact is re-established. This model effectively reproduces the hysteretic behavior, gap-related effects, and inherent stiffness degradation traits of pile-soil interactions.

3.4. Pile-Water Interface

The hydrodynamic coupling between a vibrating pile and its ambient water medium introduces an inertial load component, quantified as the added mass effect (Equation (15)). This interaction alters the dynamic impedance of the pile-water system, necessitating its explicit consideration in offshore structural design [28].
m α = C α A p ρ W
m α denotes the hydrodynamic added mass induced by the interaction between the pile and surrounding water, with units of kilograms (kg). It quantifies the inertial effects of water on the pile’s dynamic response, thereby altering structural dynamic characteristics (e.g., natural frequency). The coefficient C α , determined through the theoretical model in this study, represents the hydrodynamic added mass coefficient. This dimensionless parameter depends on the pile’s geometry (e.g., cylindrical, square), dimensions, and flow conditions. A p refers to the pile’s cross-sectional area in square meters (m2), ρ is the density of ambient water in kilograms per cubic meter (kg/m3), and W represents the submerged length of the pile along its axial direction in meters (m).

4. Typhoon-Induced Wind and Wave Loading

4.1. Typhoon-Induced Wind Loading

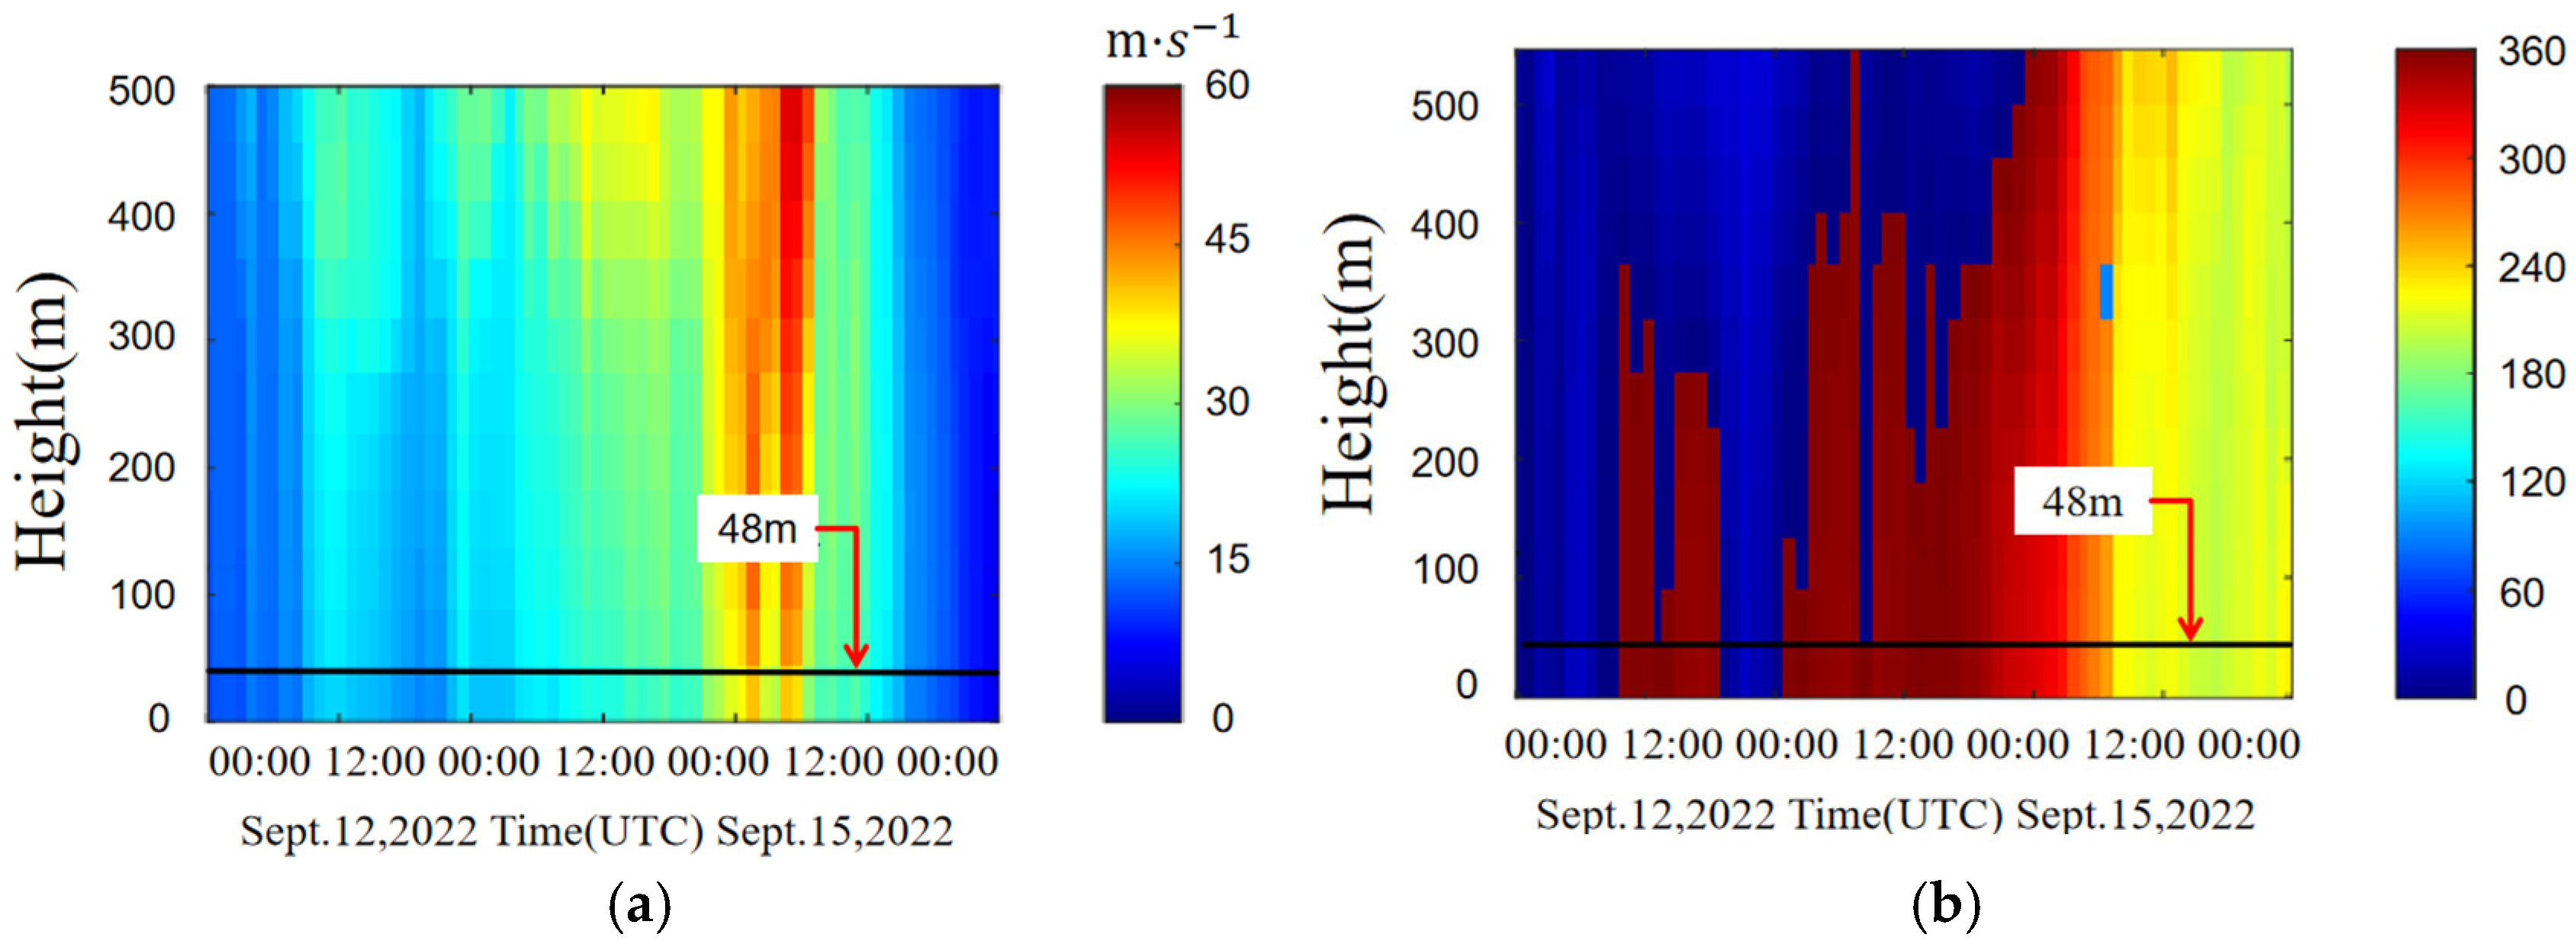
To advance theoretical research and engineering practices on stress concentration phenomena in fixed offshore platforms, this study focuses on a nearshore wind farm in Zhejiang Province as a case study, systematically reconstructing the historical typhoon process of the severe typhoon “Muifa”. Leveraging the WRF mesoscale meteorological model, a high-resolution numerical simulation framework was developed to investigate typhoon-induced dynamic impacts on wind fields [29]. As shown in Figure 6, spatiotemporal coupling analysis reveals three-dimensional wind speed and direction profiles in the target wind farm area. Results indicate that during Typhoon “Muifa”, the wind farm experienced significant dynamic meteorological changes, with the peak measured wind speed at the platform top ( V t o p ) exceeding 45 m/s, consistent with regional meteorological monitoring data. Through multi-scenario comparative analysis and uncertainty quantification, the wind speed profile at 04:00 UTC on 14 September 2022, was selected as the extreme design scenario, providing reliable boundary conditions and load input parameters for subsequent structural stress response analysis of the platform.
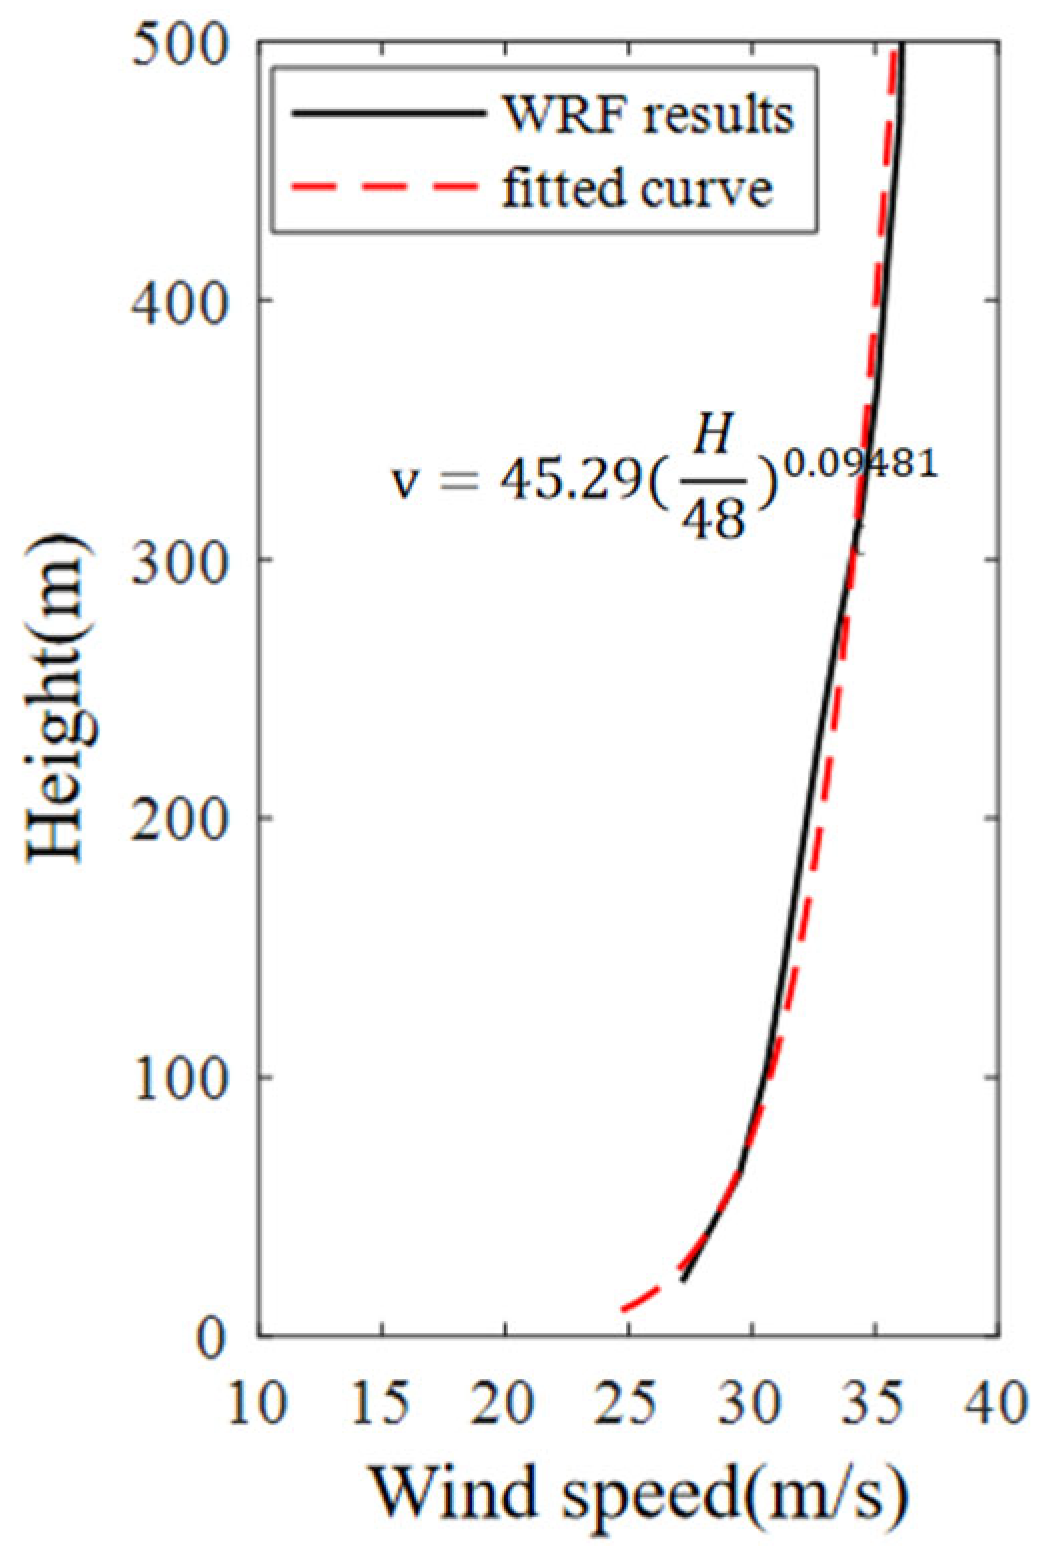
Figure 6 illustrates the wind profile at the most critical moment. A customized wind profile, derived by fitting an exponential function to WRF simulation results, is input into the typhoon module to generate turbulent wind speeds. Importantly, the application of WRF in this study was validated against available field measurements. Specifically, the exponential wind profile fit applied to the WRF output (as shown in Figure 6) was calibrated using measured wind data from the target site in Taizhou. Furthermore, the key spectral model (Equation (12)) used within the Zwind typhoon module to characterize turbulence was itself derived from and fitted to field-measured data at the site. Additionally, the turbulence intensity values utilized in the analysis (0.1023, 0.0665, and 0.0665) were directly obtained from these field measurements. This multi-faceted approach—calibrating the mean wind profile shape, employing a site-fitted turbulence spectrum, and incorporating measured turbulence intensities—provides a robust validation foundation for the WRF-simulated wind conditions used in this specific engineering scenario. When a structure obstructs the airflow path, it induces stagnation or deflection of the airflow, converting the wind’s kinetic energy into static pressure either partially or entirely.
Consequently, the wind load on the structure originates from the pressure differential caused by airflow obstruction, with its magnitude determined by parameters such as wind speed, inflow direction, wind-exposed area of structural components, and aerodynamic shape. The aerodynamic excitation mechanism follows the principle of the Strouhal number ( S t ) for cylindrical components, where the calculated S t = 0.2 in this paper is consistent with the vortex shedding model of offshore structures [30]. This approach replicates wind-structure interaction dynamics observed in field studies of slender marine infrastructure. Although wind loading is inherently a dynamic force action, it is typically simplified as equivalent static pressure in engineering design. The typhoon module in Zwind [31], a software previously developed by our team, supports user-defined spectral models. Therefore, this study adopts a spectral model fitted to field-measured data (Equation (16)) as the computational basis for this specific scenario. The wind pressure distribution diagram formed under the most severe load conditions is shown in Figure 7.
S u f = 8.1 σ 2 L u V t o p 1.15 + 10.6 f L u V t o p 5 3
In the aforementioned equations, the turbulence integral length scale L u is determined in accordance with the IEC standard (IEC 61400-1) [32], with values in the three directions set as 340.2, 113.4, and 27.72, respectively. The turbulence intensity, as stated, was derived from field measurement results, with values of 0.1023, 0.0665, and 0.0665 in the three directions, respectively [33].
The wind velocity field comprises a stationary mean flow and stochastic turbulence, with their combined effects dictating the dynamic load on structures.
U t , z = U ¯ z + u t , z
The wind load acting on the platform is given by Equation (18) [34]:
F i = 1 2 ρ a C D D i Δ l U 2 ( t , z )
The resultant forces F i are subsequently distributed as concentrated forces to the corresponding finite element nodes of the tower and monopile components located above MSL; Air density ( ρ a ), Assumed constant at 1.29 kg/m3; Drag coefficient ( C D ), which is 1.2 in this study; Segment diameter ( D i ), Computed through linear interpolation between adjacent nodes ( D i = ( D i + D i + 1 ) / 2 ) and the length of each beam segment ( Δ l ). Using these parameters, the resultant force F i For each beam element, concentrated nodal forces are assigned to the finite element model. For nodes above the mean sea level (MSL) on both the tower and monopile, equivalent static loads are imparted via shape function interpolation.

4.2. Typhoon-Induced Wave Loading

The wave-induced hydrodynamic load on the monopile structure requires explicit modeling of extreme sea states under typhoon conditions. Following the stochastic wave modeling framework, the JONSWAP spectrum ( S J f ) is employed to characterize the irregular wave field. Considering the directional distribution of wave energy, the directional spectral function can be expressed as Equation (19).
S f , θ = S J f · D J ( θ )
where D J ( θ ) is the directional distribution function adopting a cosine exponential model. S f , θ is a wave energy distribution model that simultaneously considers frequency and direction. D J ( θ ) and S J f can be expressed by Equations (20) and (21), respectively.
D J θ = Γ s + 1 2 π Γ s + 1 / 2 c o s 2 s θ w θ 0 2
where θ 0 is the principal wave direction (taken as 150°) based on on-site observation data during typhoons); s is the directional concentration factor (taken as s = 8 ) based on measured data from the Taizhou Sea Area); θ w is the wave propagation direction; Γ · is the gamma function. Therefore, the wave angle is expressed as α = θ w i n d θ w , where θ w i n d denotes the wind direction.
S J f = α g 2 2 π 4 f 5 exp 5 4 f f p 4 γ exp 0.5 f f p σ f p 2
where f is the wave frequency, f = 1 / T , T is the wave period; g is the acceleration of gravity; The generalized Phillips’ constant α in the JONSWAP spectrum is formulated as: α = 5 ( H s 2 f p 4 / g 2 ) ( 1 0.287 l n γ ) π 4 , with key parameters defined as follows: the spectral peak frequency ( f p ); the wave peak period ( T P ) is 6.5 s; The peak enhancement factor ( γ ) is determined as follows:
γ = 5 , T p H s 3.6 exp 5.75 1.15 T p H s , 3.6 < T p H s 5 1 , T p H s > 5
Significant wave height H s = 4   m (100-year return period). The spectral energy density S J ( f i ) enables calculation of representative wave component amplitudes through: H i = 2 2 S J ( f i ) f Where f is the frequency discretization interval. Subsequently, linear wave theory [35] provides the horizontal water particle kinematics:
u x = i = 1 n H i w i 2 c o s h k i z w s i n h k i z d cos k i x w i t + φ i
u x t = i = 1 n H i w i 2 2 c o s h k i z w s i n h k i z d sin k i x w i t + φ i
Wave kinematics adhere to the dispersion relation ω 2 = g k t a n h   ( k d ) , where k i and w i , respectively, characterize the wave number and angular frequency of the i-th component. Key parameters are defined as: water depth d (seabed—MSL): vertical coordinate z w (origin at the seabed), and stochastic phase angle φ i (uniformly distributed in [ 0,2 π ] , Monte Carlo-sampled). The spectral peak frequency produces a dominant wavelength (63 m) surpassing five times the monopile diameter, fulfilling the Morison regime criterion [36]. Thus, Morison’s equation is utilized for wave load computation.
d F W = d F D + d F I = 1 2 C D ρ W D u x u x d z + C M ρ W π D 2 4 u x t d z
where d F W is the wave force action on each segment of the monopile, d F D and d F I are the force acting on each segment of the monopile; C D and C M are the drag coefficient and inertia coefficient, respectively; C D is the drag coefficient taken as 1.2; C M is the inertia coefficient, which is taken as 2.0 in this study; and ρ W denotes the water density, which is 1030   k g / m 3 ; d F D and d F I act on the nodes along the monopile under the mean sea level as nodal loads.

5. Dynamic Loading Mitigation of Offshore Platform Using TMD

5.1. Metocean Conditions

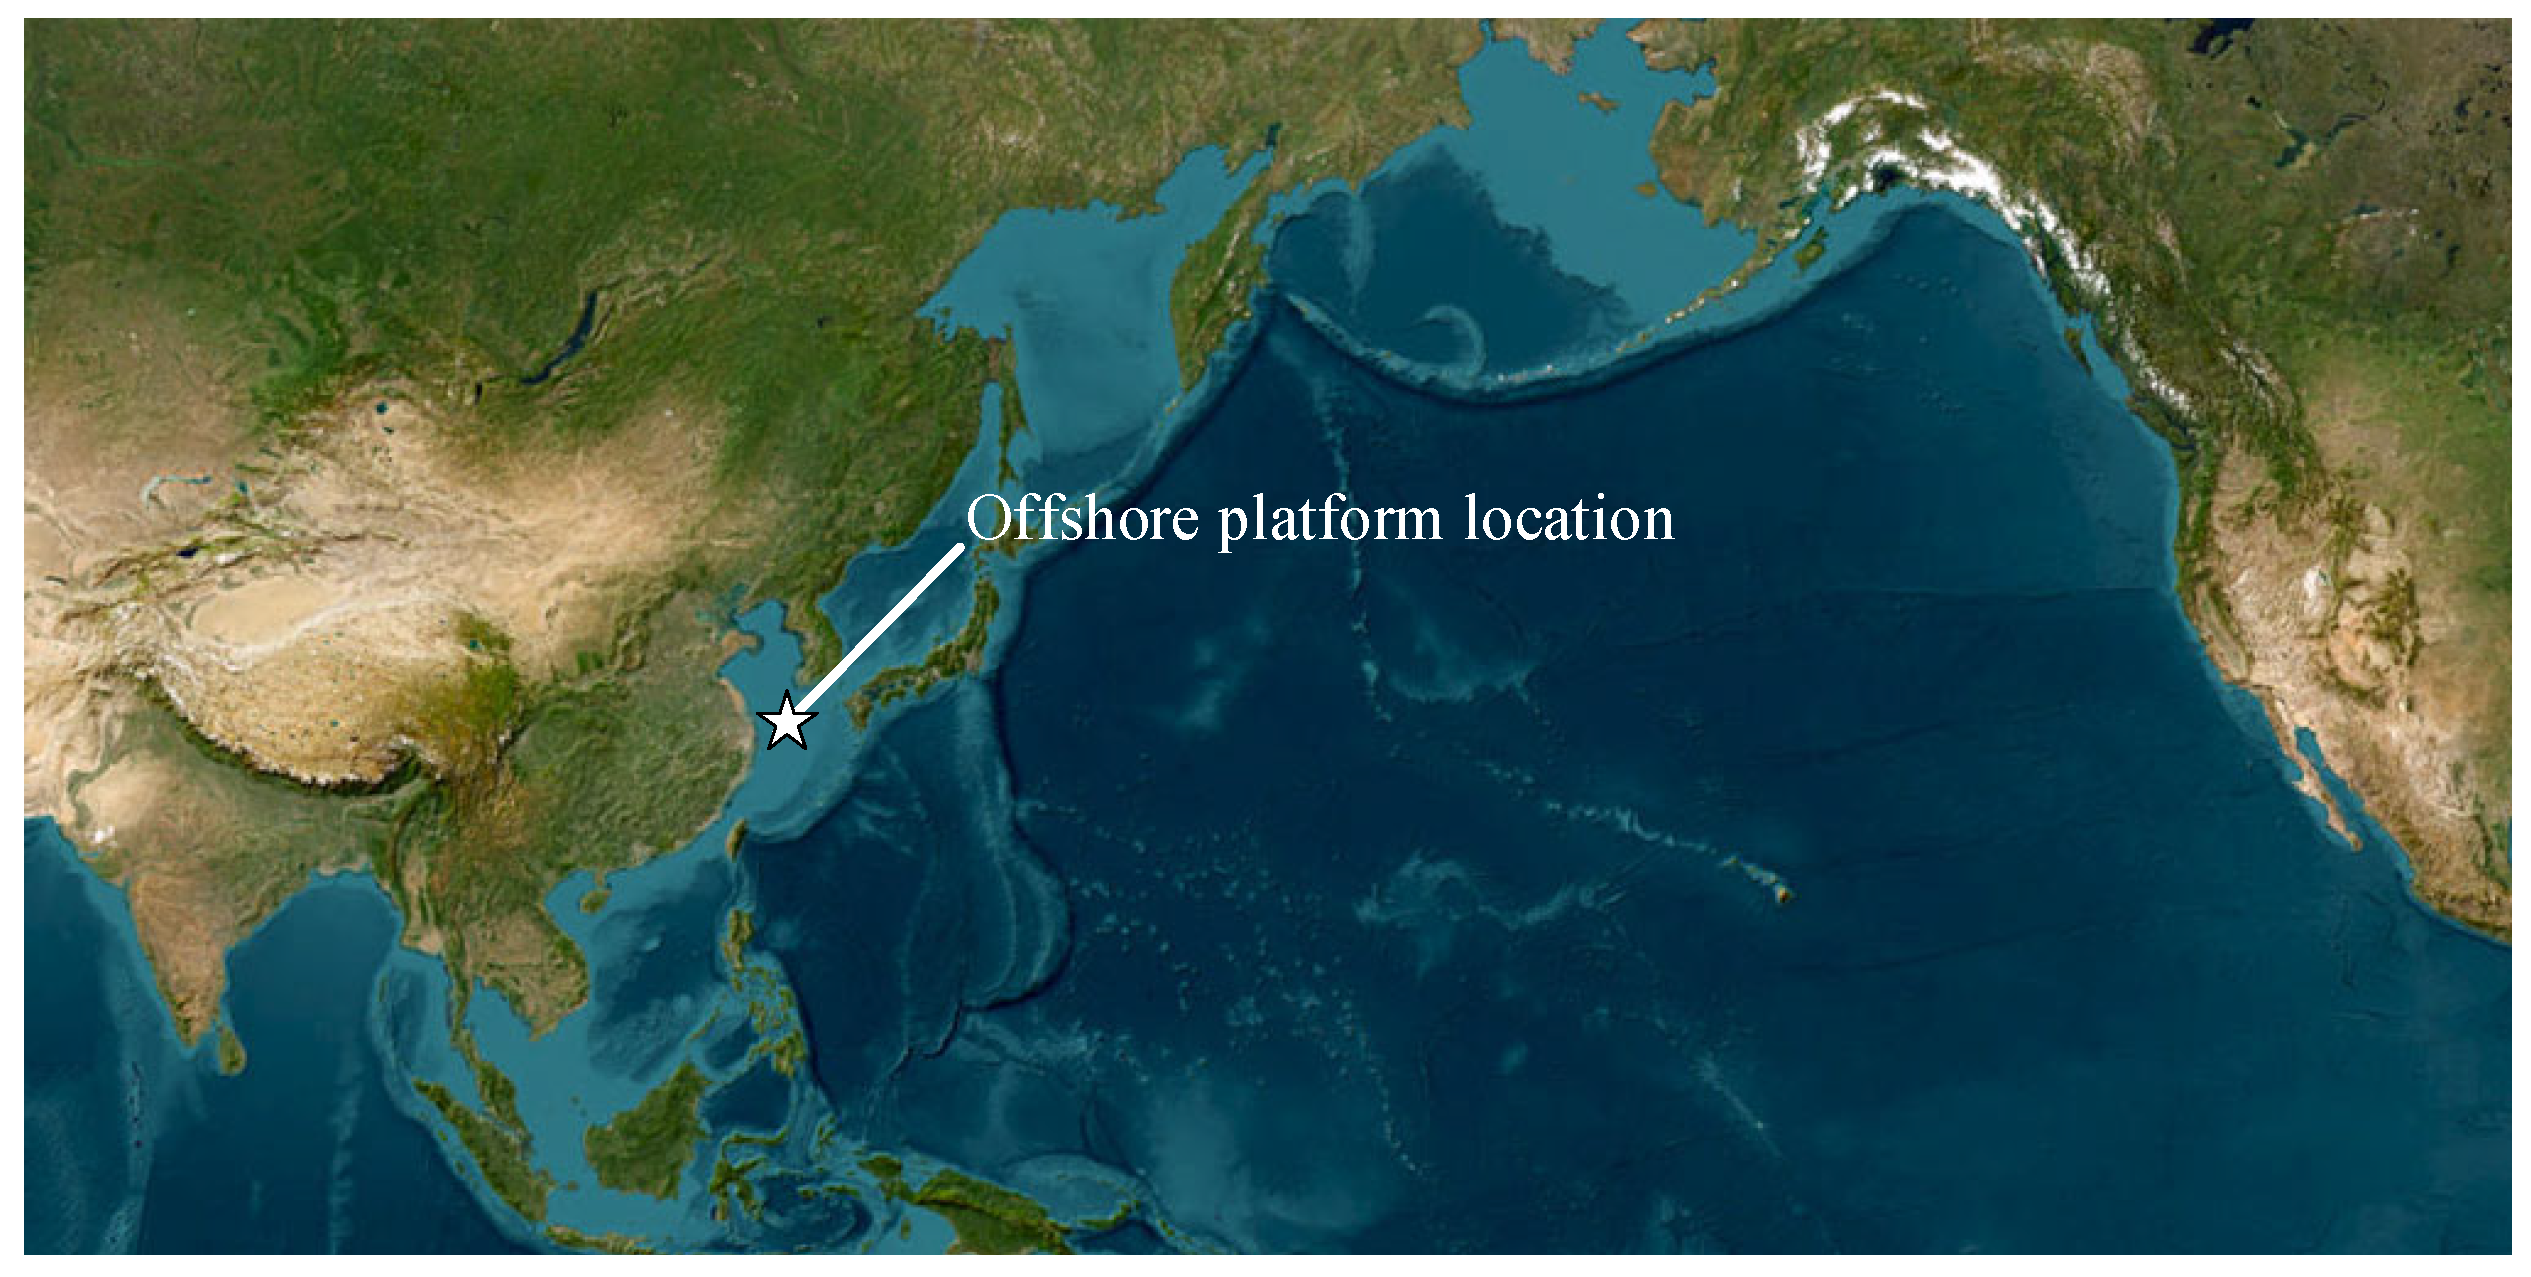
The offshore platform is located in a deep-water region off the coast of Zhejiang Province, China, as illustrated in Figure 8 (Map data in Figure 8 was obtained from Google Maps under academic fair use. Copyright 2024 Google LLC), where the marine environment is characterized by high-intensity typhoons and stratified seabed geology. Environmental parameters governing the platform design were derived from a combination of hindcast data and field measurements, with wave characteristics and current velocities for extreme return periods summarized in Table 1. The 100-year return period storm condition exhibits a significant wave height of 32.2 m paired with a spectral peak period of 18.9 s, while currents demonstrate marked asymmetry between flood and ebb phases.
Subsea geotechnical conditions, as shown in Table 2, established through a campaign of boreholes below the mud line, reveal a stratigraphic sequence critical to foundation design. From the seabed downward, four distinct sand-dominated strata are identified: an upper loose sand unit transitioning to medium-dense sands with gradual increases in effective unit weight and friction angle. These are underlain by three clay interlayers with undrained shear strength progressively intensifying from 96 kPa to 179 kPa. The basal soil unit comprises highly compacted sand, forming a competent bearing stratum for pile tip embedment.

5.2. Dynamic Responses and Discussion

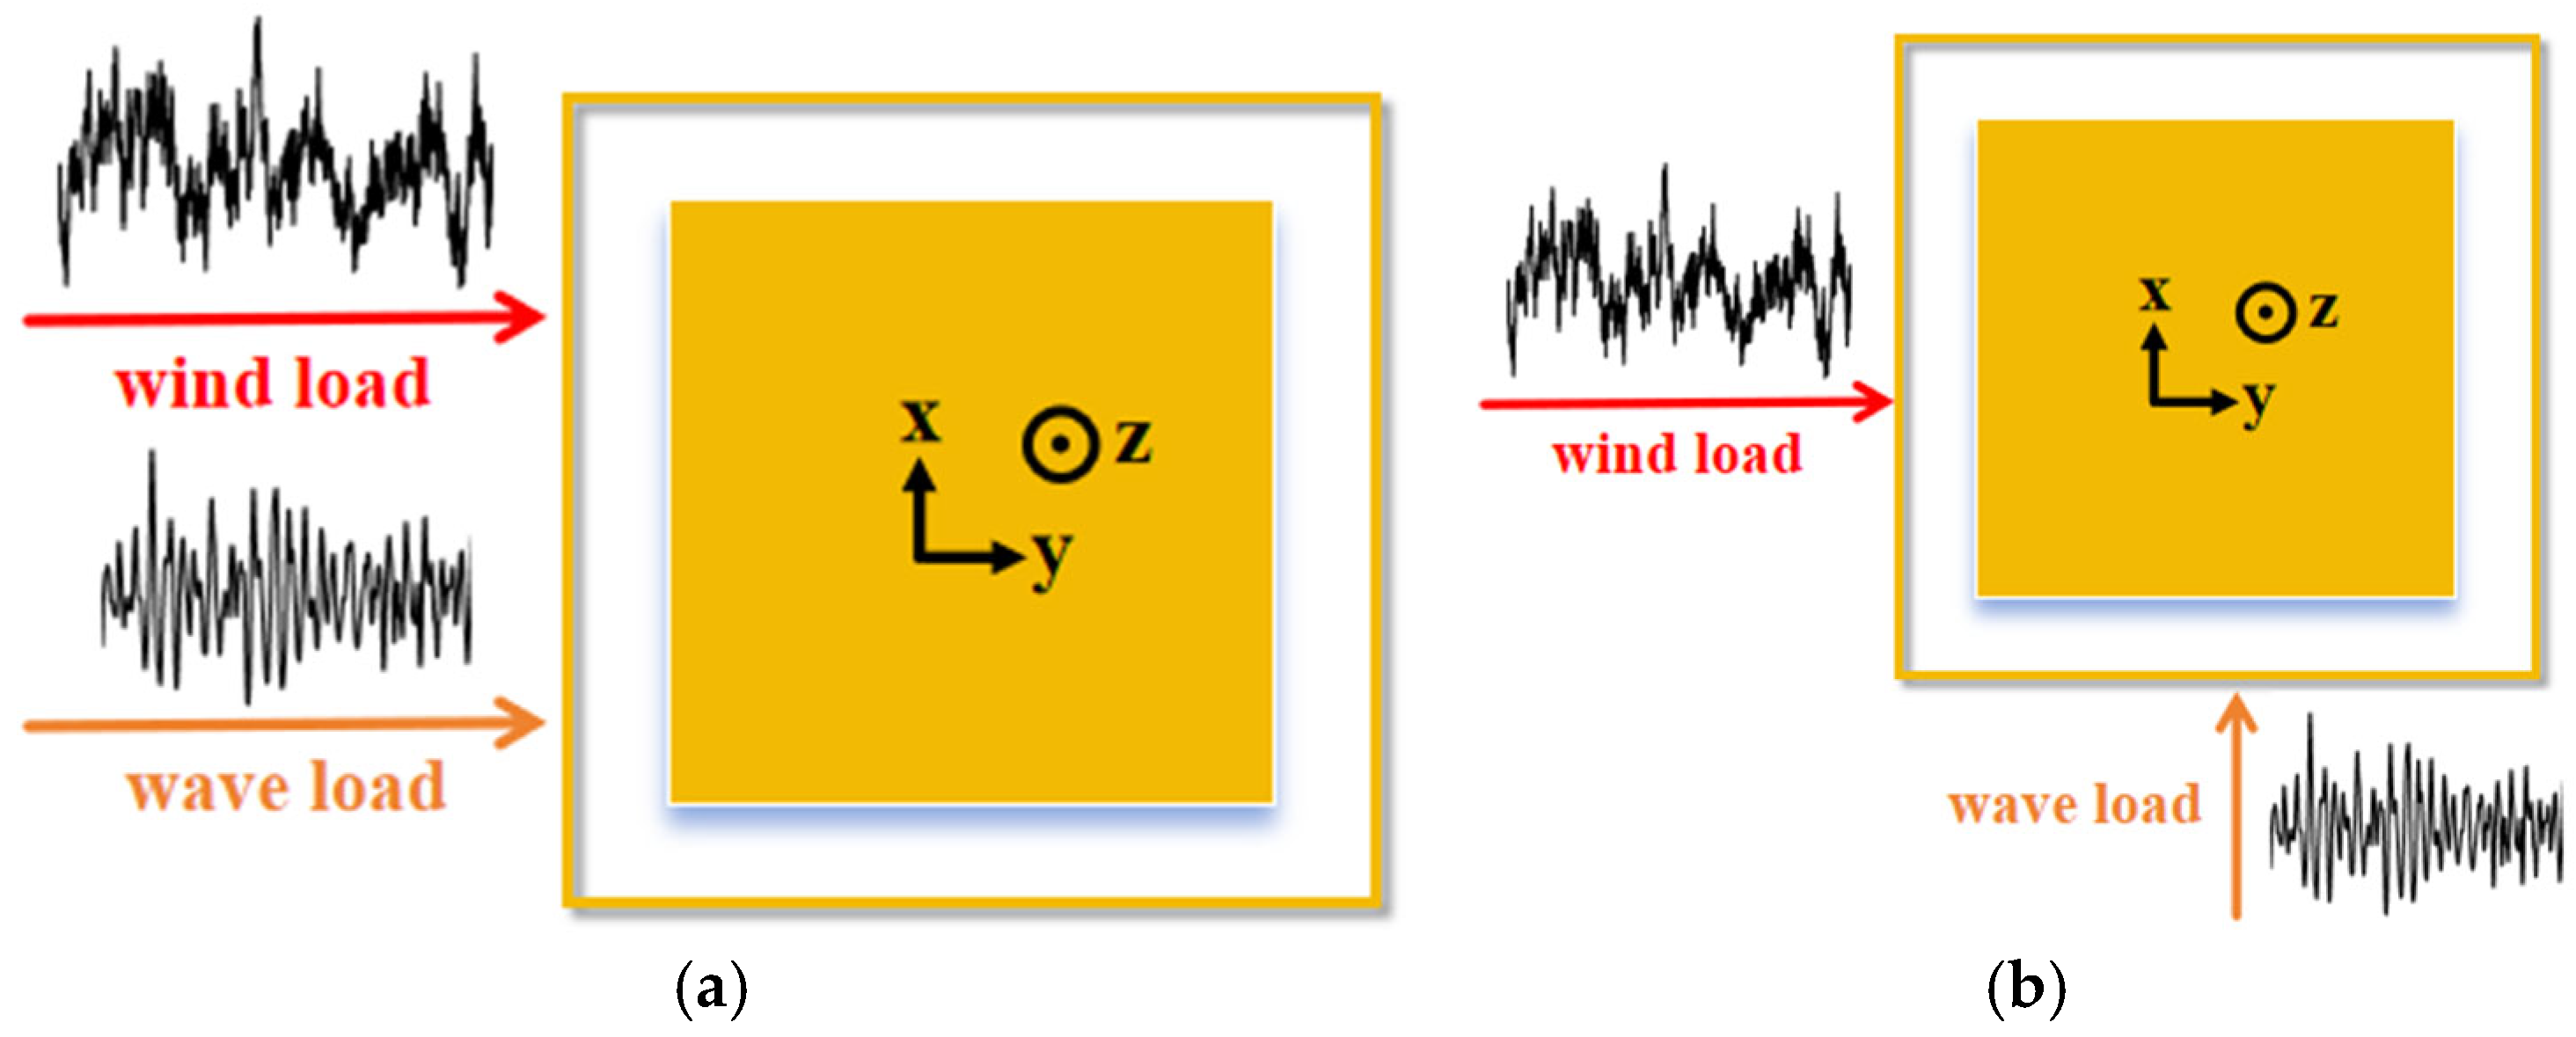
This section comparatively evaluates the dynamic performance of an offshore platform under two excitation patterns (Figure 9), aligned and misaligned typhoon-wave loads. The effectiveness of the TMD in mitigating acceleration, velocity, deck displacement, and base shear is quantitatively assessed. The TMD is positioned at the mid-span of the top deck. The numerical model utilizes a right-hand Cartesian coordinate system as the global reference frame, where the Z-axis is vertically upward, and the origin is defined at sea level. Notably, the maximum pile top force observed in the simulation did not trigger irreversible plastic deformation, confirming the structural integrity under the applied loads. The simulation spans 0–700 s, with results from the 100~200 s interval selected for presentation.

5.2.1. Aligned Typhoon and Typhoon-Wave

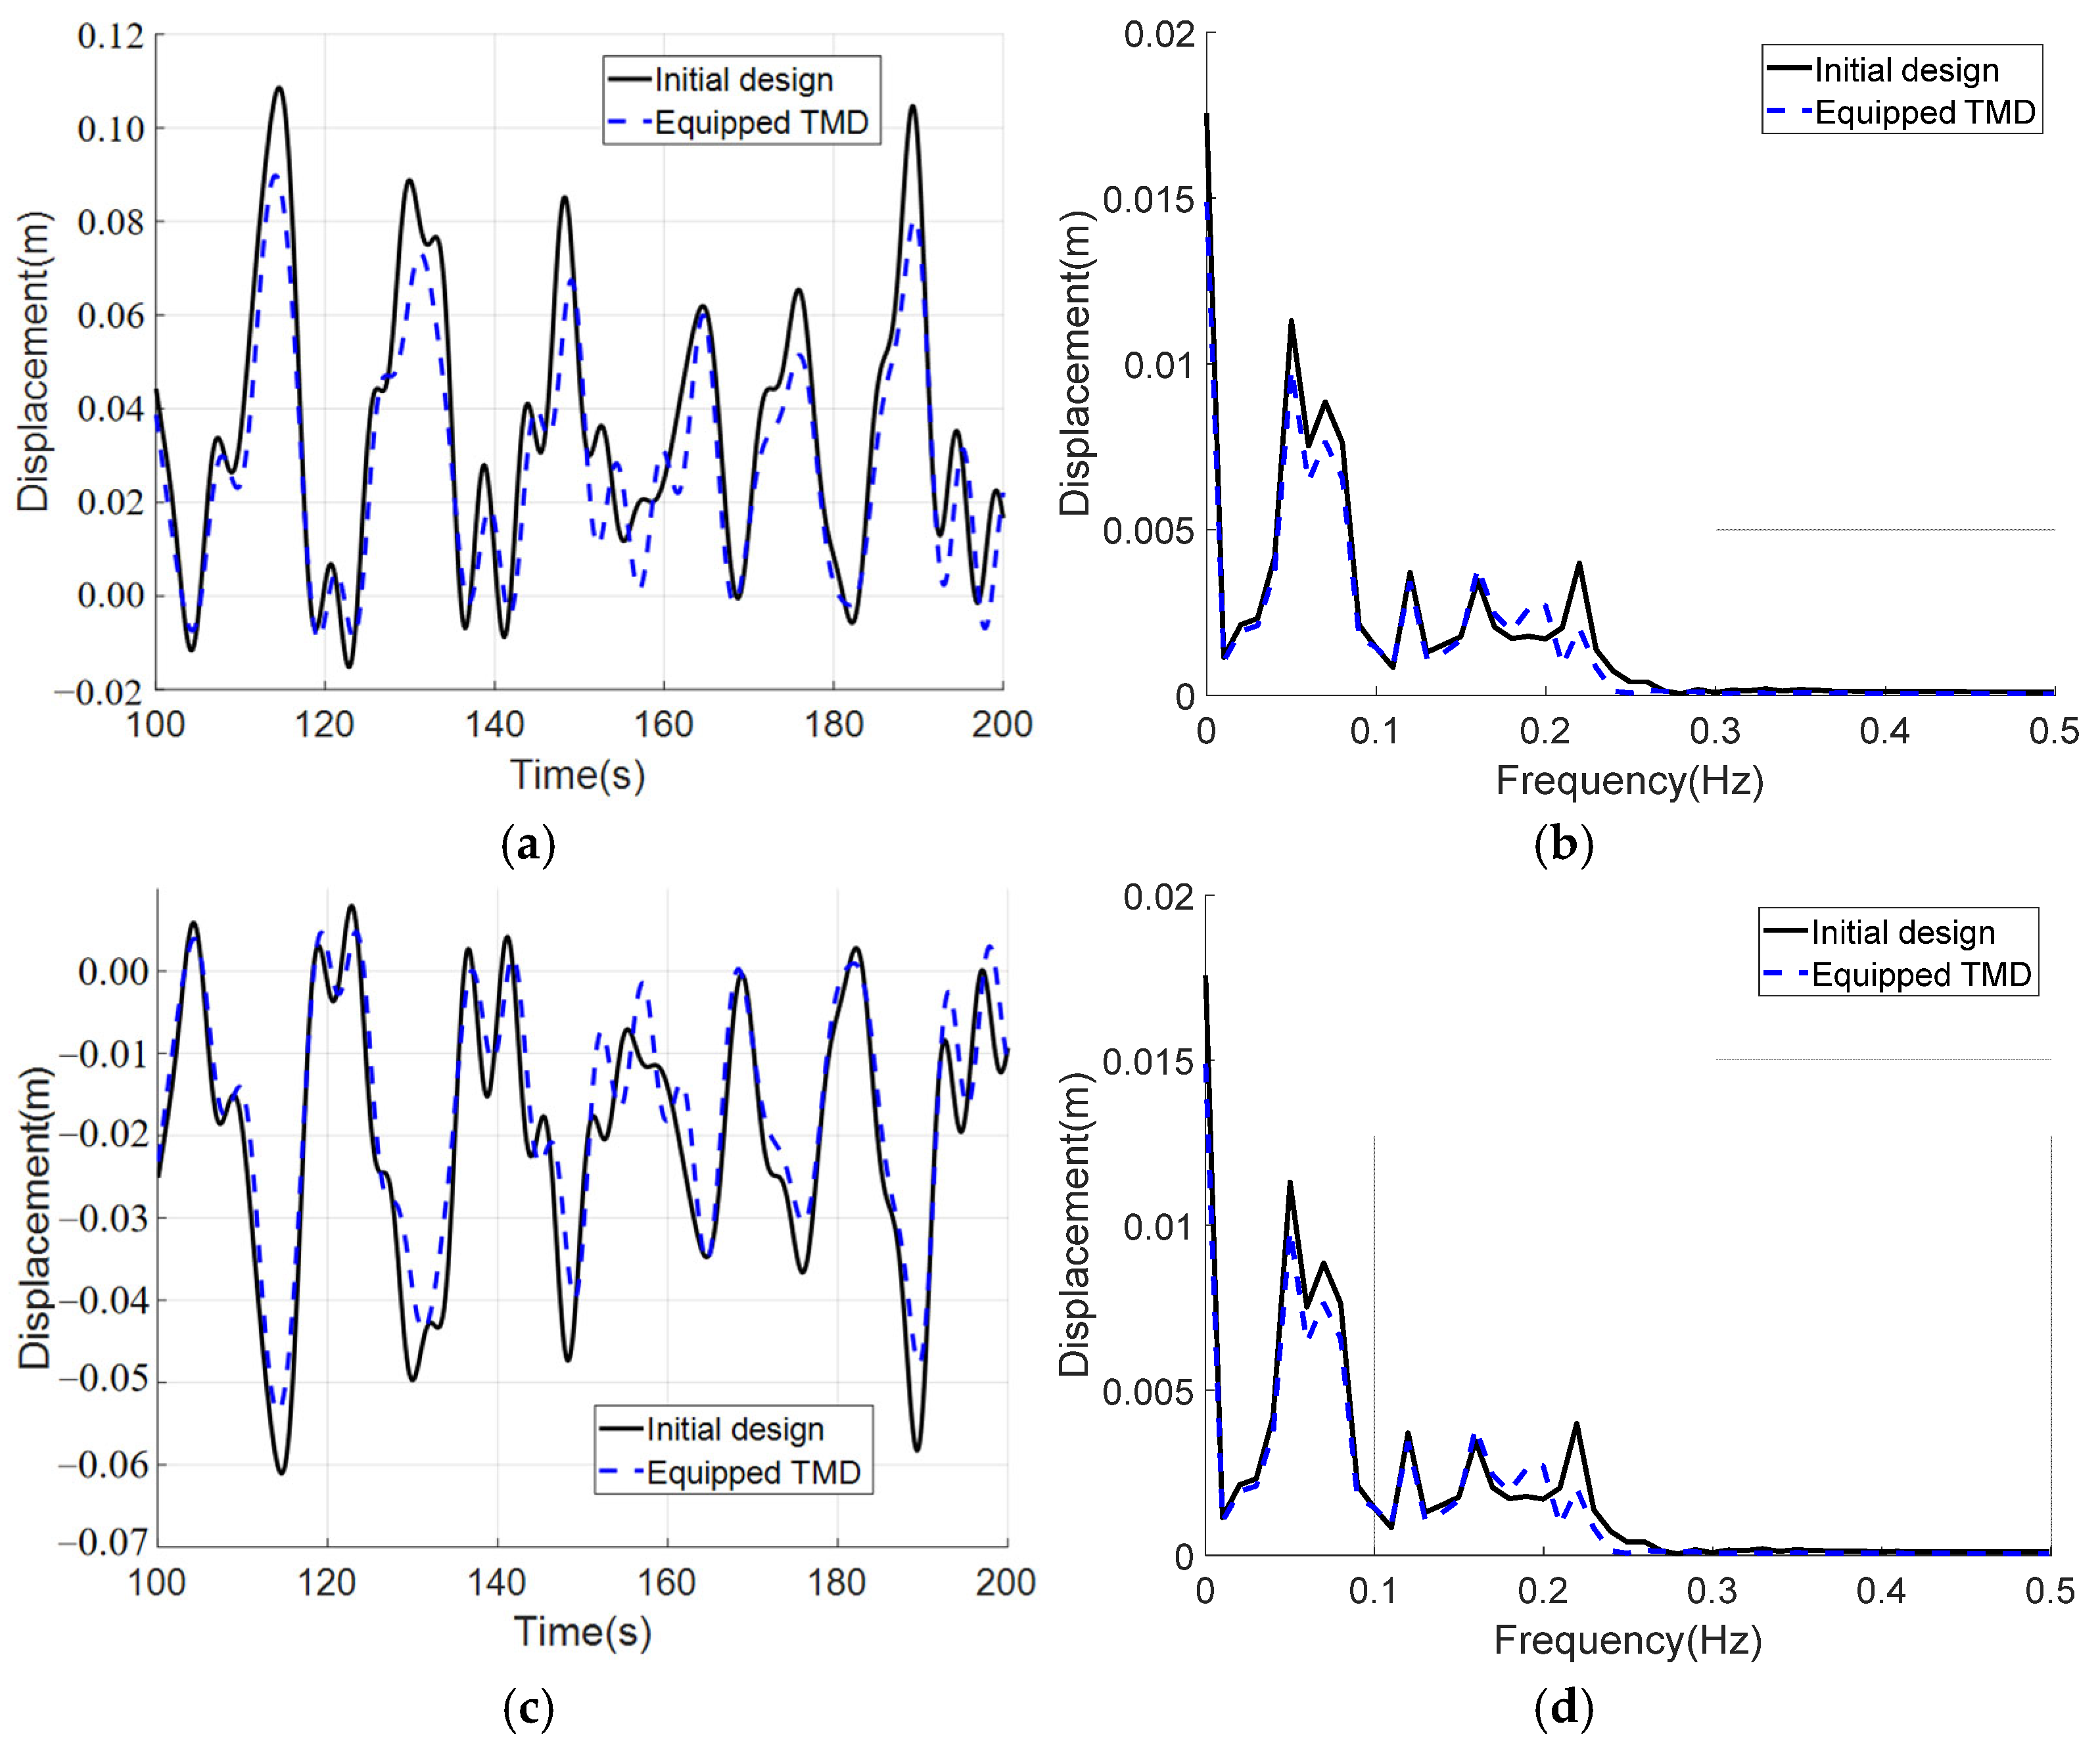
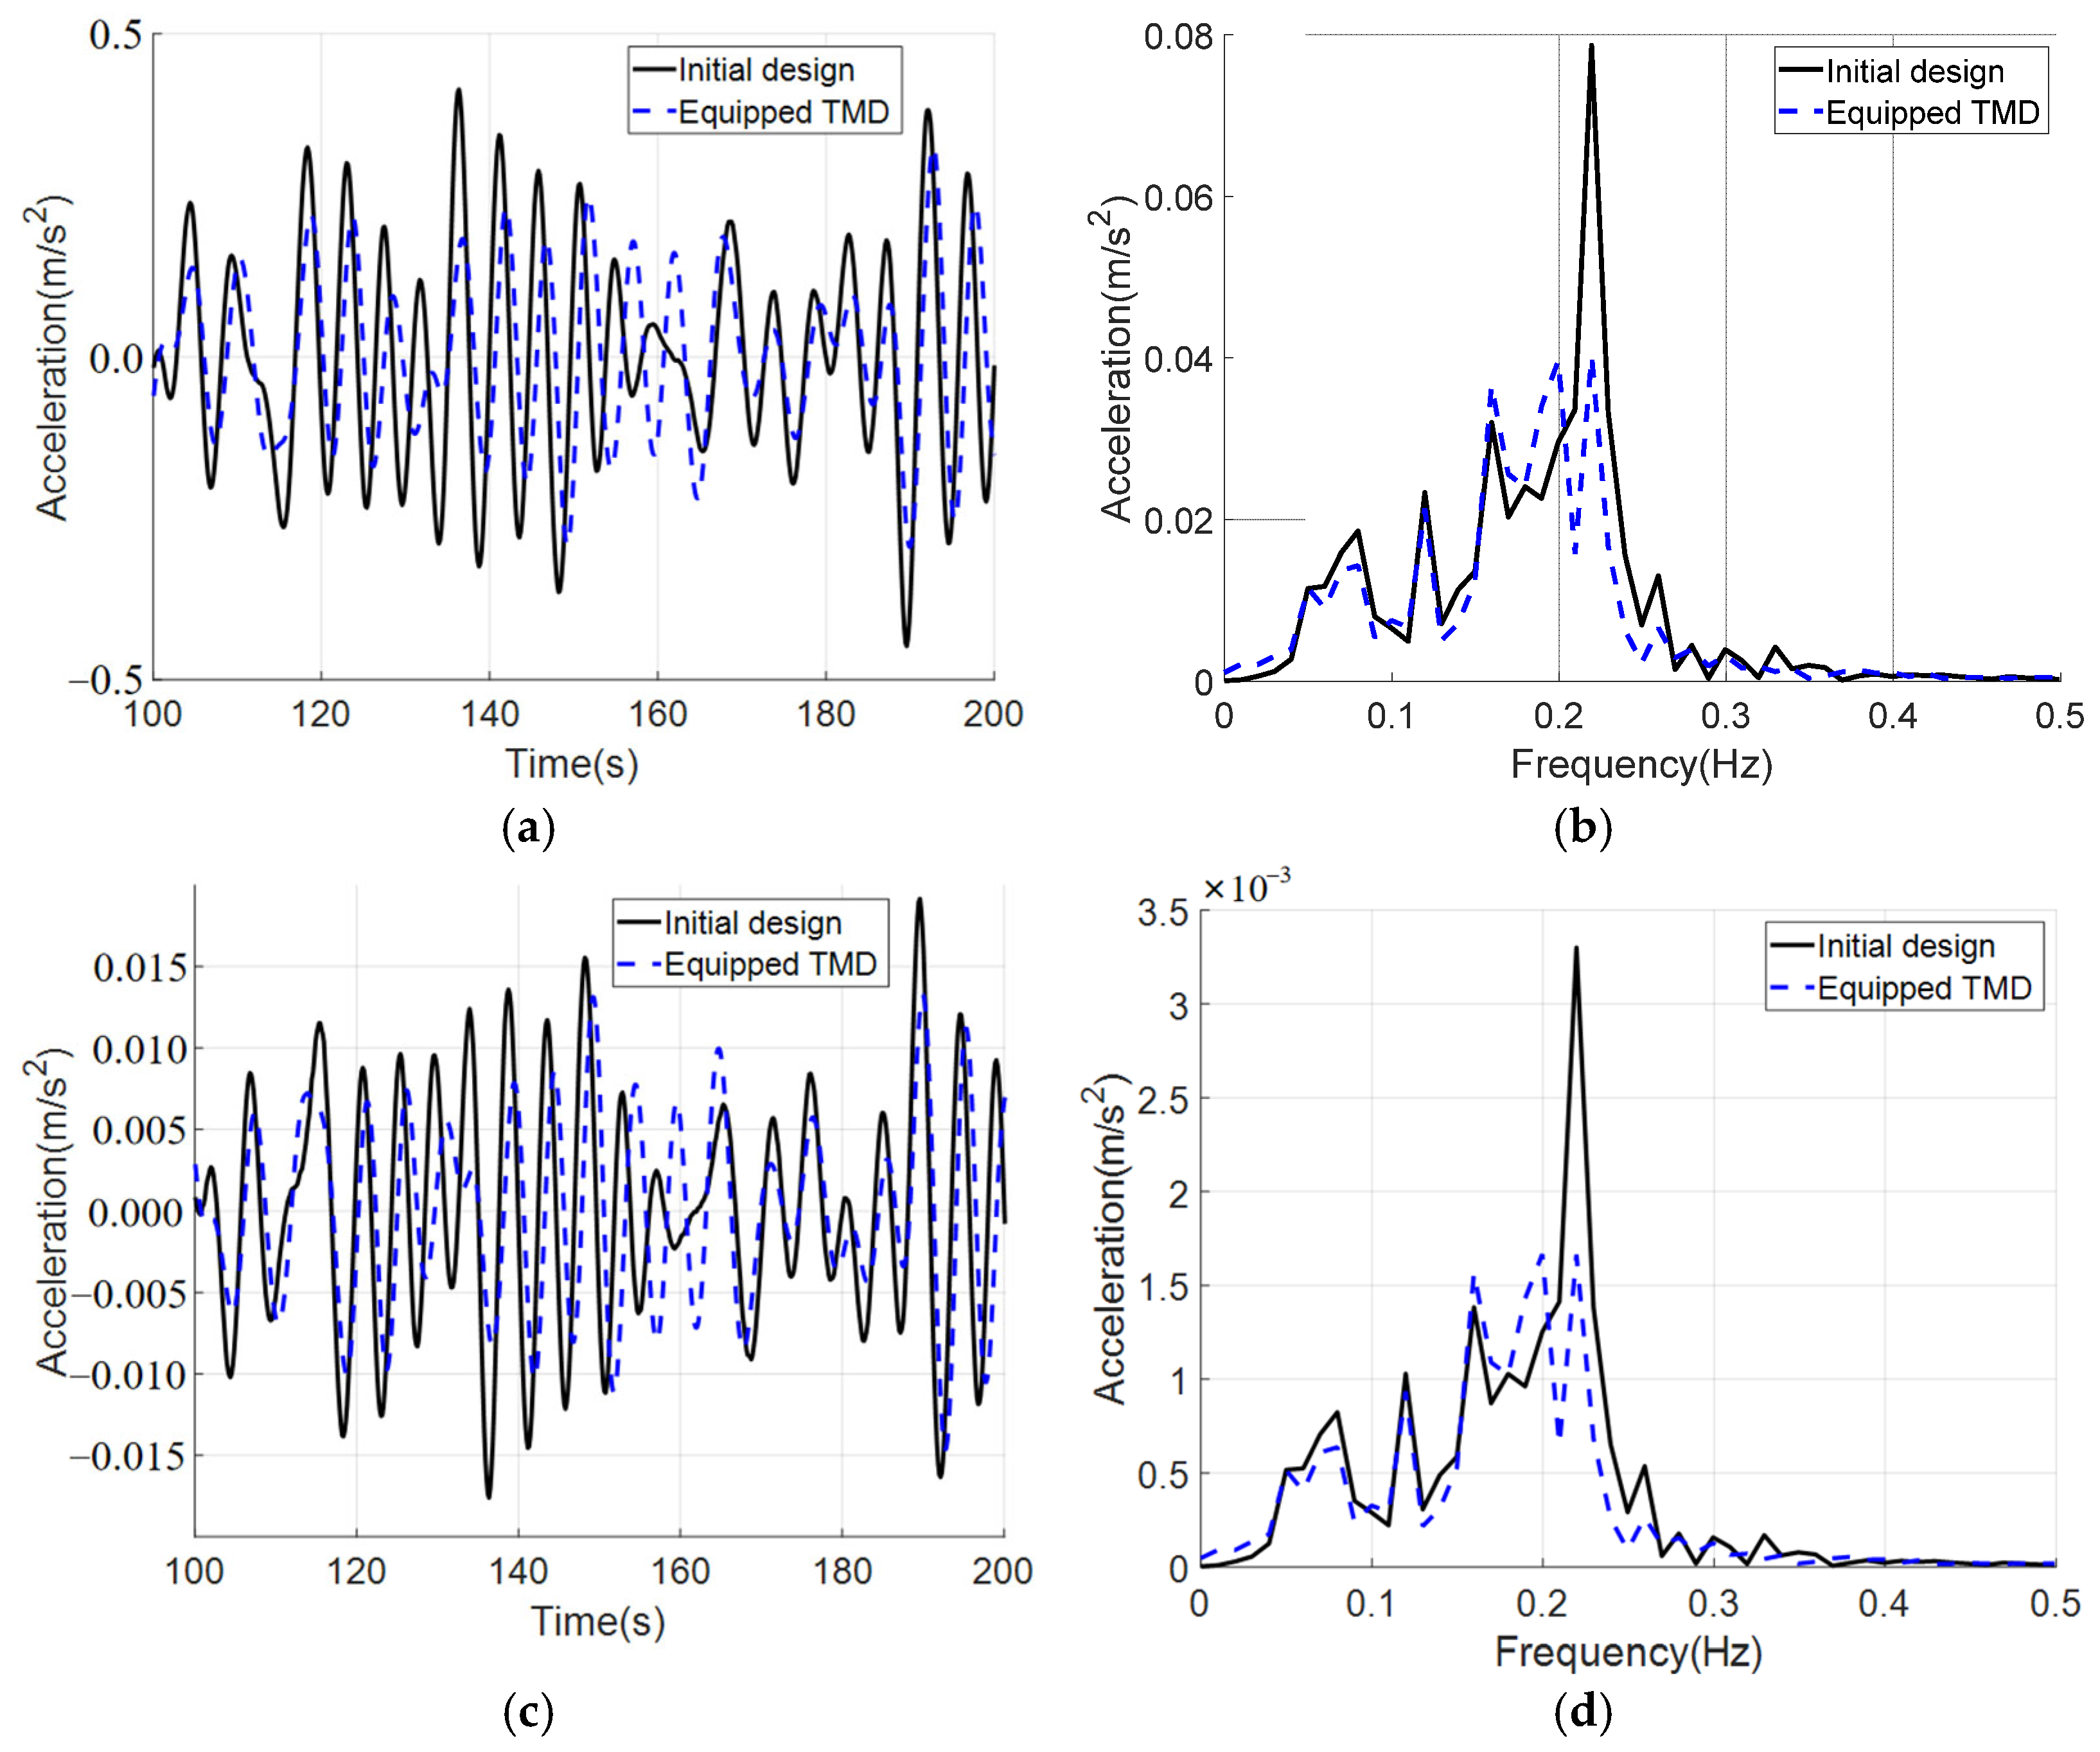
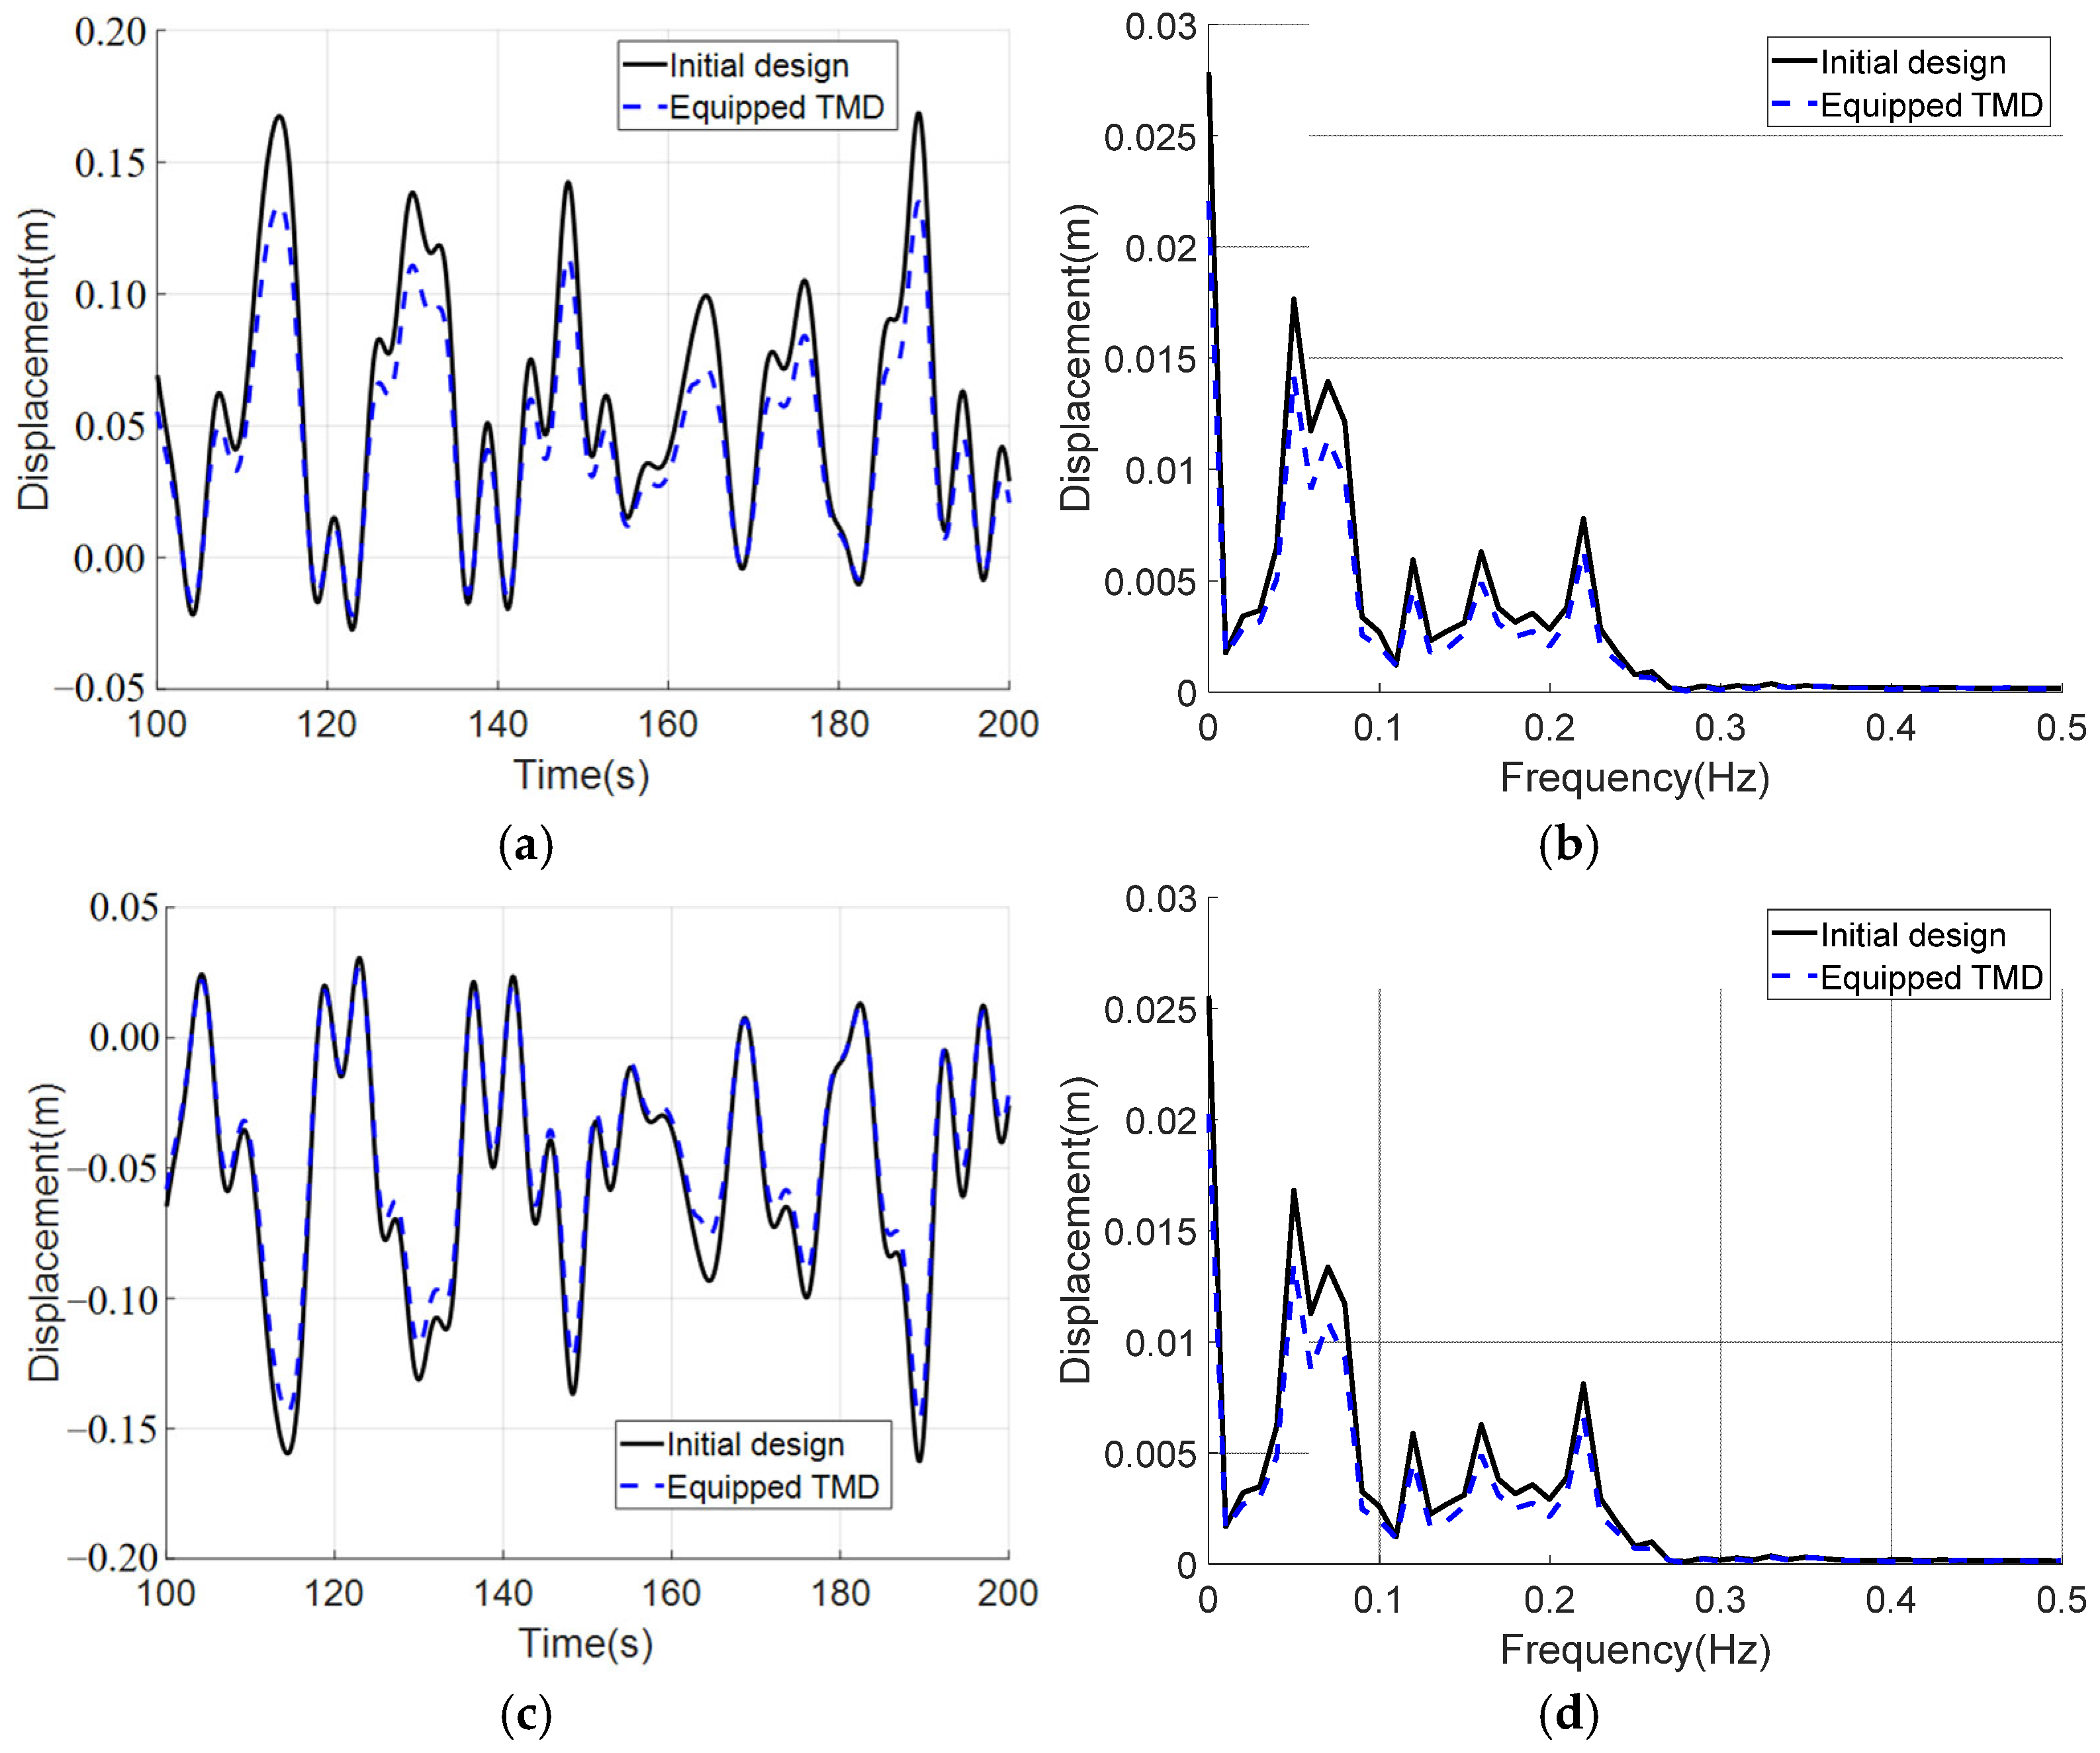
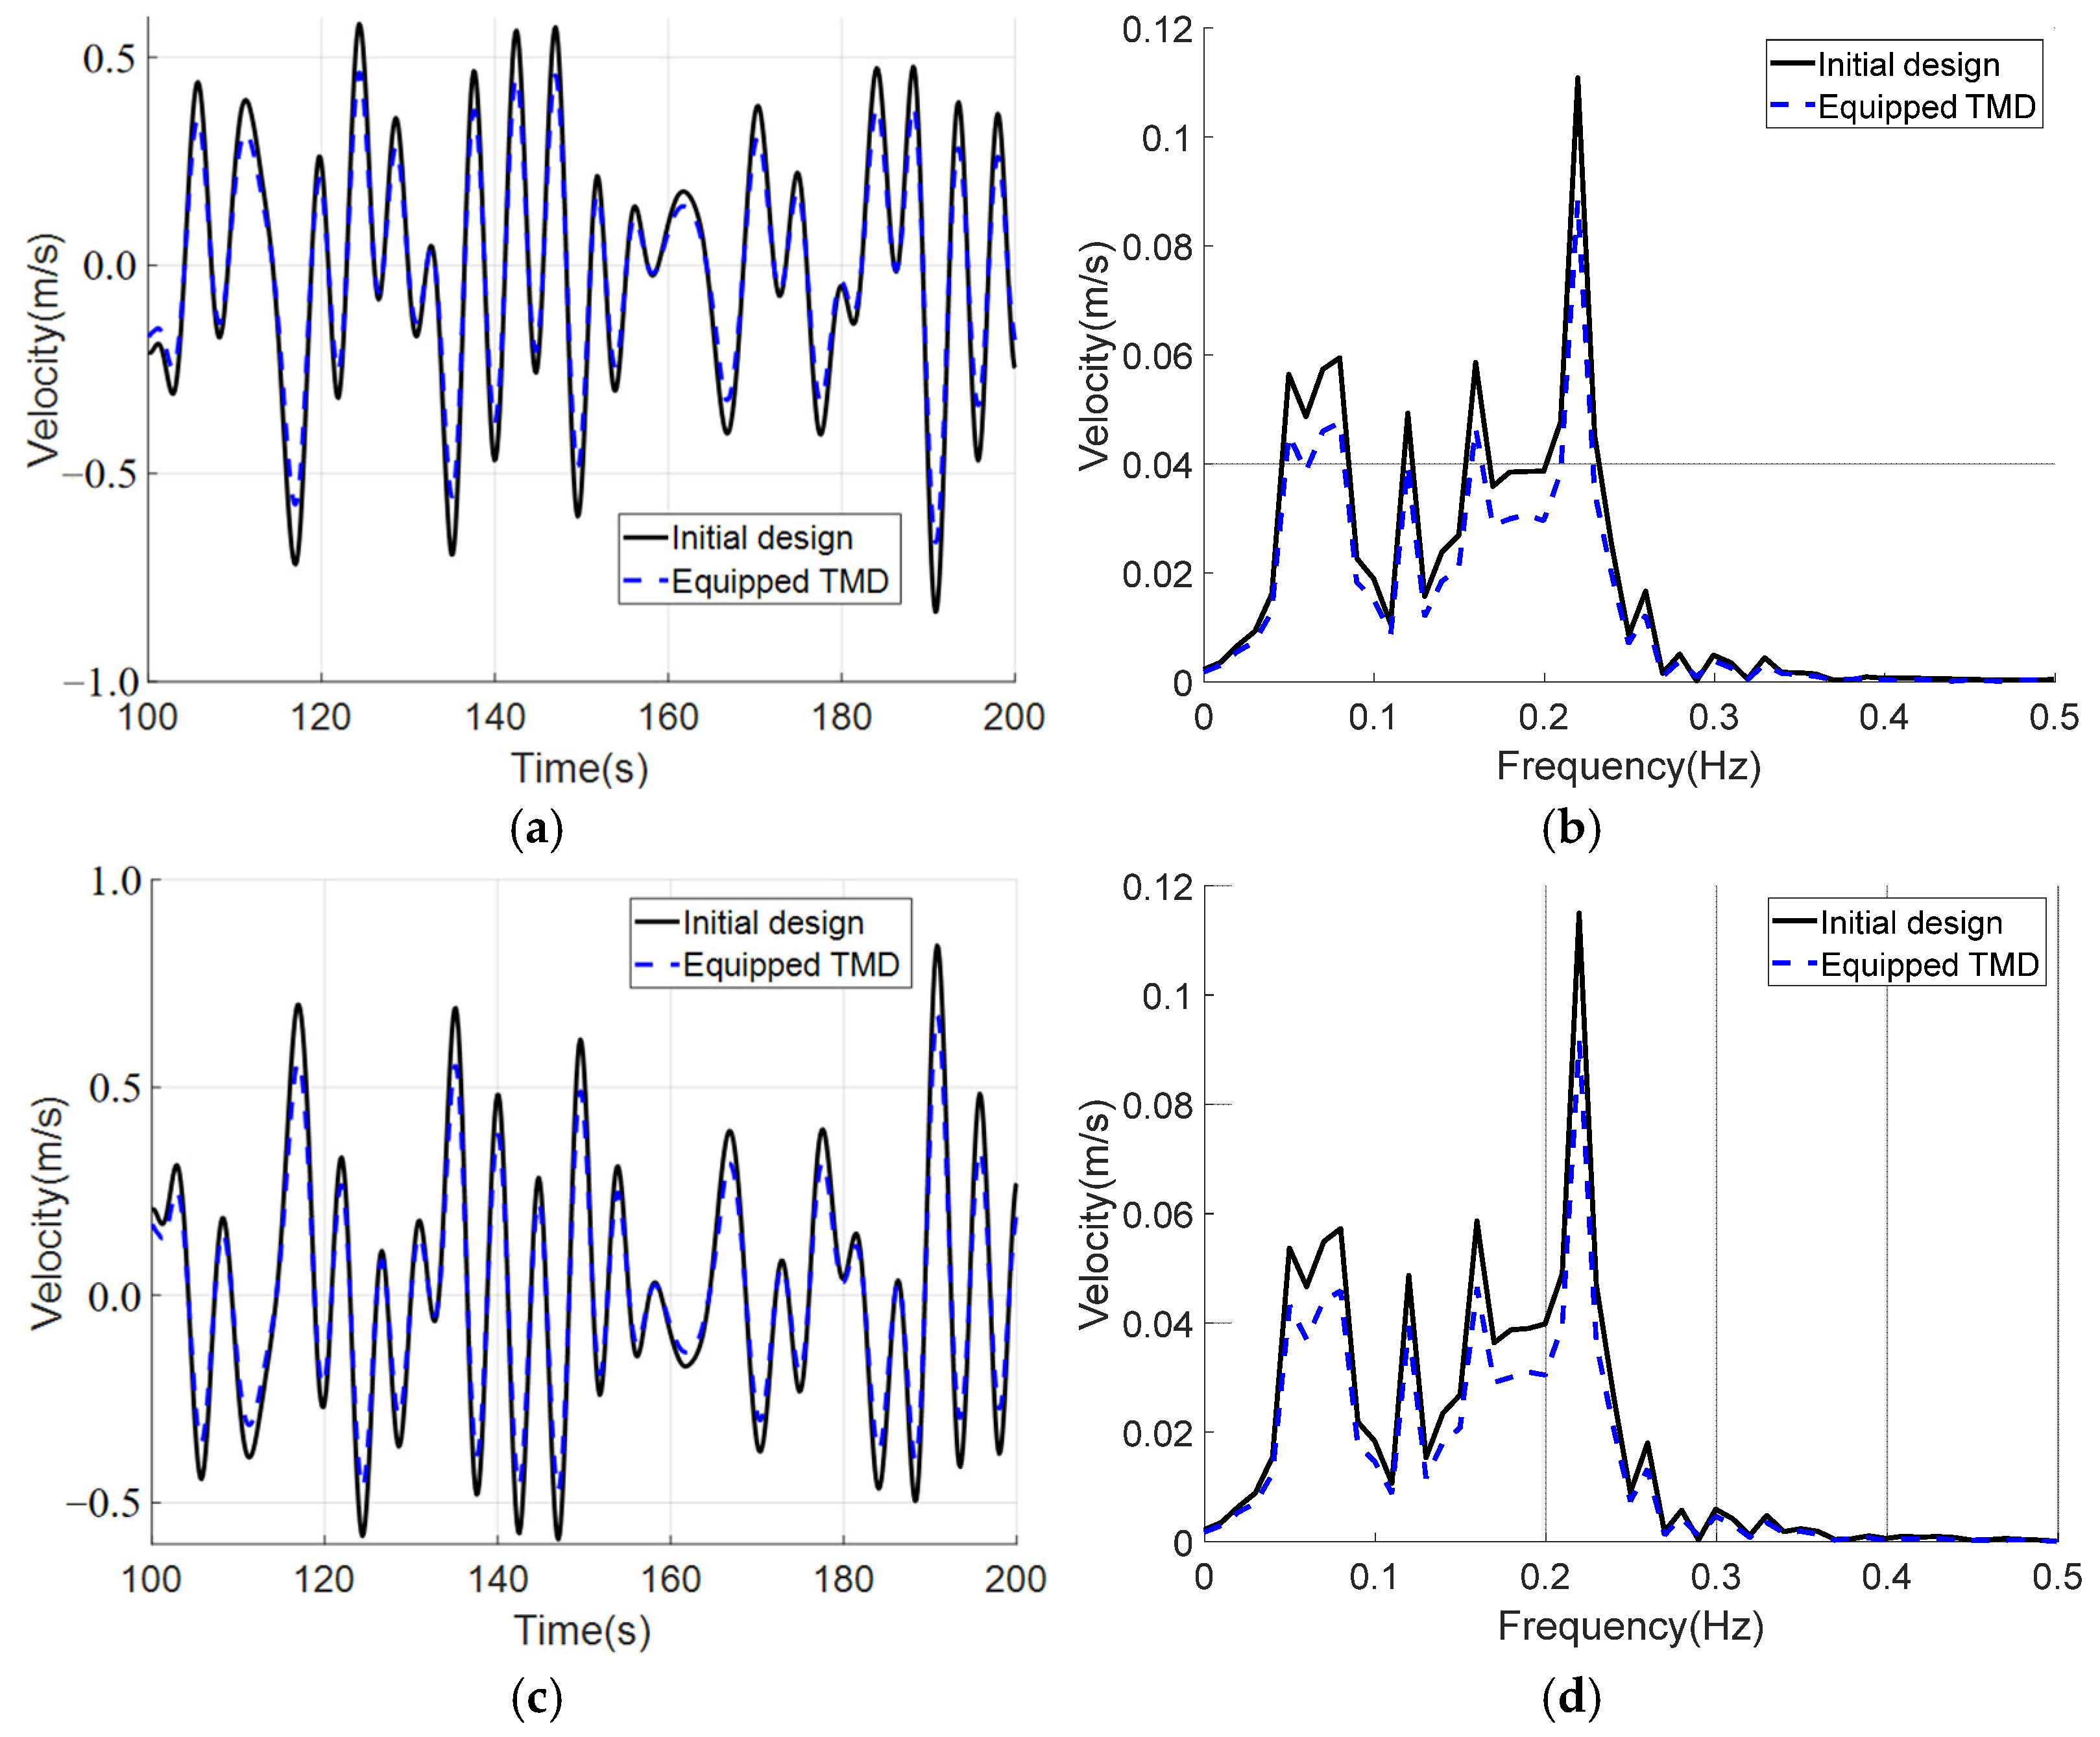
Figure 10, Figure 11 and Figure 12 systematically demonstrate the comparative responses of acceleration, velocity, and displacement in the X- and Y-axis induced by aligned typhoon-wave loads on the Deck equipped with TMD (DTMD) versus the Initial Design deck (IDD), in both the time and frequency domains. In the X-axis direction, the maximum values of displacement, velocity, and acceleration in the time domain for the IDD are 0.17 m, 0.68 m/s, and 0.42 m/s2, respectively. For the DTMD, the corresponding values are 0.15 m, 0.52 m/s, and 0.27 m/s2, representing reductions of 18.18%, 13.33%, and 26.19%, respectively. In the Y-axis direction, the maximum values of displacement, velocity, and acceleration in the time domain for the IDD are 0.06 m, 0.20 m/s, and 0.19 m/s2, respectively. For the DTMD, the corresponding values are 0.04 m, 0.17 m/s, and 0.13 m/s2, representing reductions of 33.33%, 15%, and 31.58%, respectively. For both X- and Y-axis directions, the acceleration and velocity responses exhibit predominant spectral energy concentration in the low-frequency range, while the displacement displays two distinct peaks within the same frequency range. The implemented TMD demonstrates significant mitigation of low-frequency peaks in acceleration and velocity, with additional reduction observed in displacement peaks. To gain an in-depth understanding of the TMD’s performance, the relative energy dissipation ratio is used to quantify its energy dissipation efficiency: E d i s / E i n p . Where E i n p is the input wave energy, and E d i s is the energy dissipated by the TMD. Details of the formula can be referred to in [37]. Since this paper mainly focuses on the TMD’s performance and the TMD Is Installed at the top, the Input energy at the top deck and the energy dissipation of the TMD are calculated. The simulation results show that the relative energy dissipation ratio is 62.3% in the X-direction and 65.7% in the Y-direction.
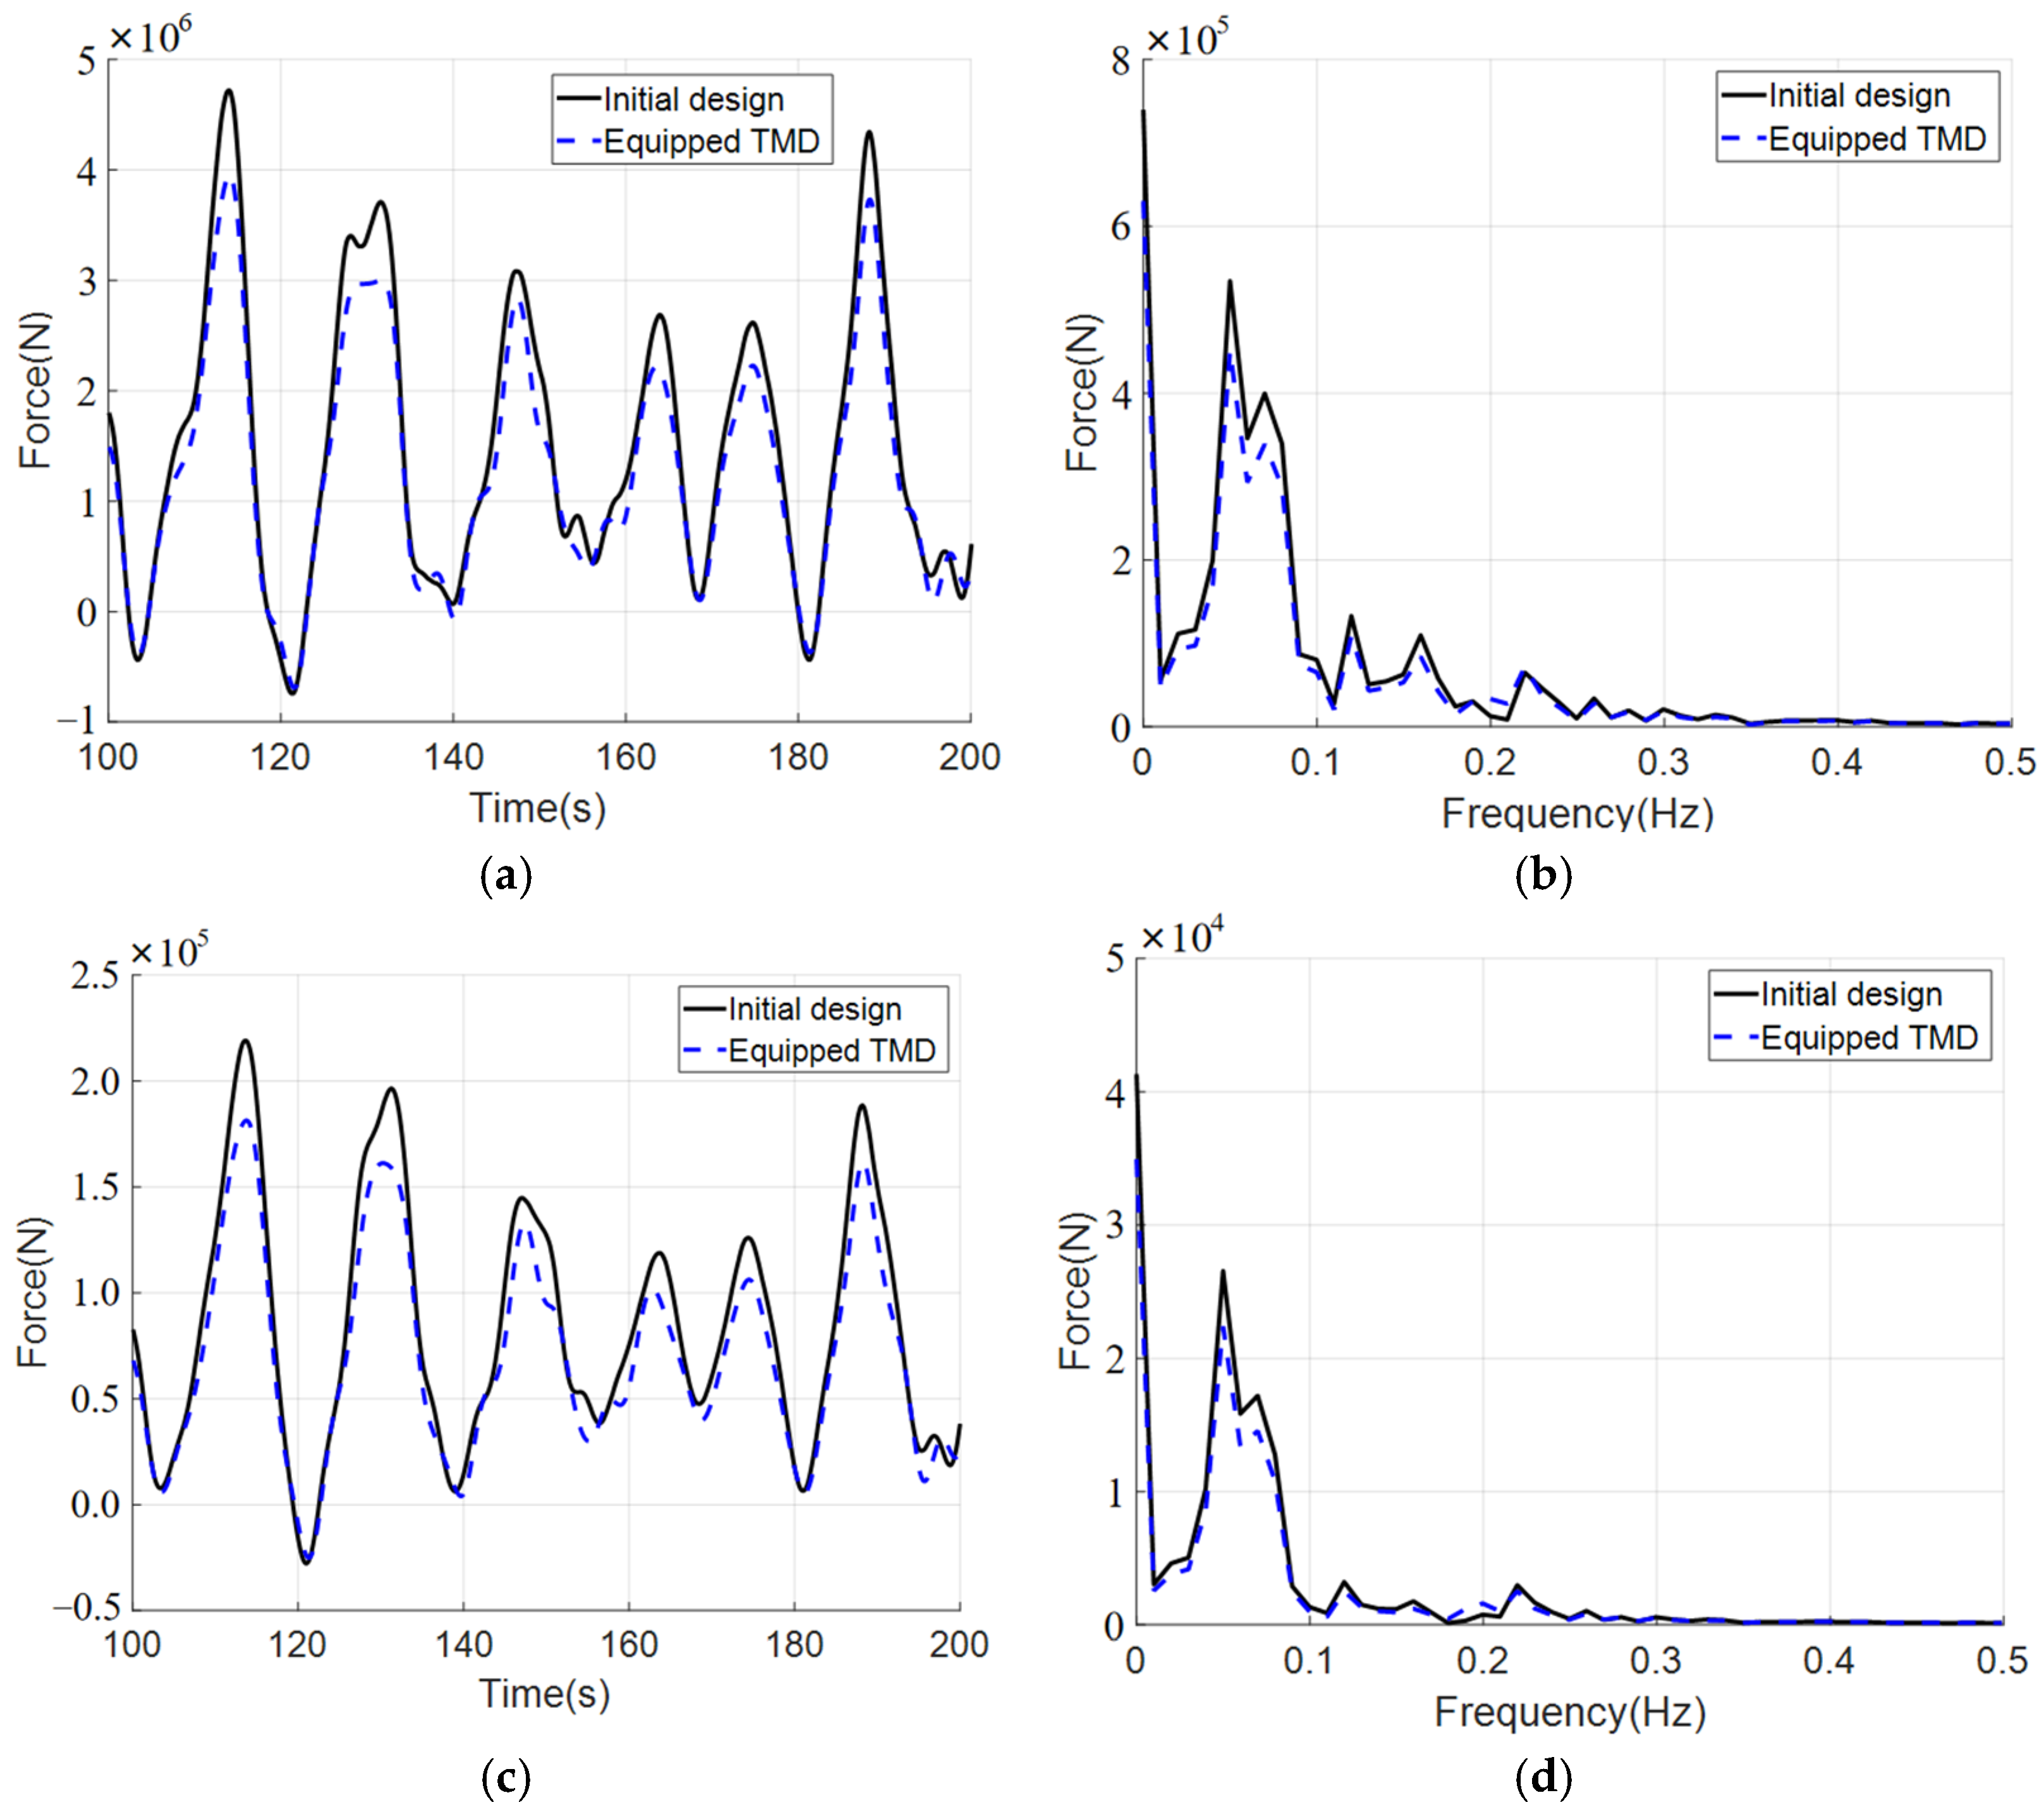
Figure 13 illustrates the influence of the TMD on the base shear at the leg bottom under aligned typhoon-wave load conditions. In the X-axis direction, the maximum and minimum base shear values for the IDD are 4715.8 kN and −743.8 kN, respectively, while the corresponding values for the DTMD are 3880.8 kN and −667.0 kN, representing reductions of 17.71% and increases of 10.33%, respectively. In the Y-axis direction, the absolute maximum and minimum base shear values for the IDD are 219.0 kN and −27.8 kN, respectively, whereas the DTMD values are 181.1 kN and −24.2 kN, showing reductions of 17.31% and increases of 12.95%, respectively. Spectral analysis of the shear force reveals that energy in both X- and Y-axis directions is predominantly concentrated within the low-frequency range of 0~0.7 Hz, with the TMD achieving significant peak attenuation.

5.2.2. Misaligned Typhoon and Typhoon-Wave

Figure 14, Figure 15 and Figure 16 systematically illustrate the time-domain and frequency-domain responses of acceleration, velocity, and displacement in the X- and Y-axis directions for the DTMD and Initial Design (ID) under misaligned typhoon and wave load conditions. In the X-axis direction, the peak values of displacement, velocity, and acceleration in the time domain are 0.17 m, 0.58 m/s, and 0.75 m/s2, respectively. For the DTMD, the corresponding values are 0.14 m, 0.49 m/s, and 0.54 m/s2, representing reductions of 17.65%, 15.52%, and 28.00%, respectively. In the Y-axis direction, the peak values of displacement, velocity, and acceleration in the time domain are 0.30 m, 0.84 m/s, and 0.85 m/s2, respectively. For the DTMD, the corresponding values are 0.24 m, 0.68 m/s, and 0.70 m/s2, representing reductions of 20.00%, 19.05%, and 17.65%, respectively. In both the X-axis and Y-axis directions, the displacement and velocity responses exhibit multiple distinct peaks within the low-frequency range, while the acceleration response demonstrates predominant spectral energy concentration within the same frequency band. The implemented TMD significantly mitigates the low-frequency peaks in acceleration and achieves additional reduction in the peaks of displacement and velocity responses. The energy dissipation efficiency for this condition is 59.8% in the X-direction and 68.2% in the Y-direction.
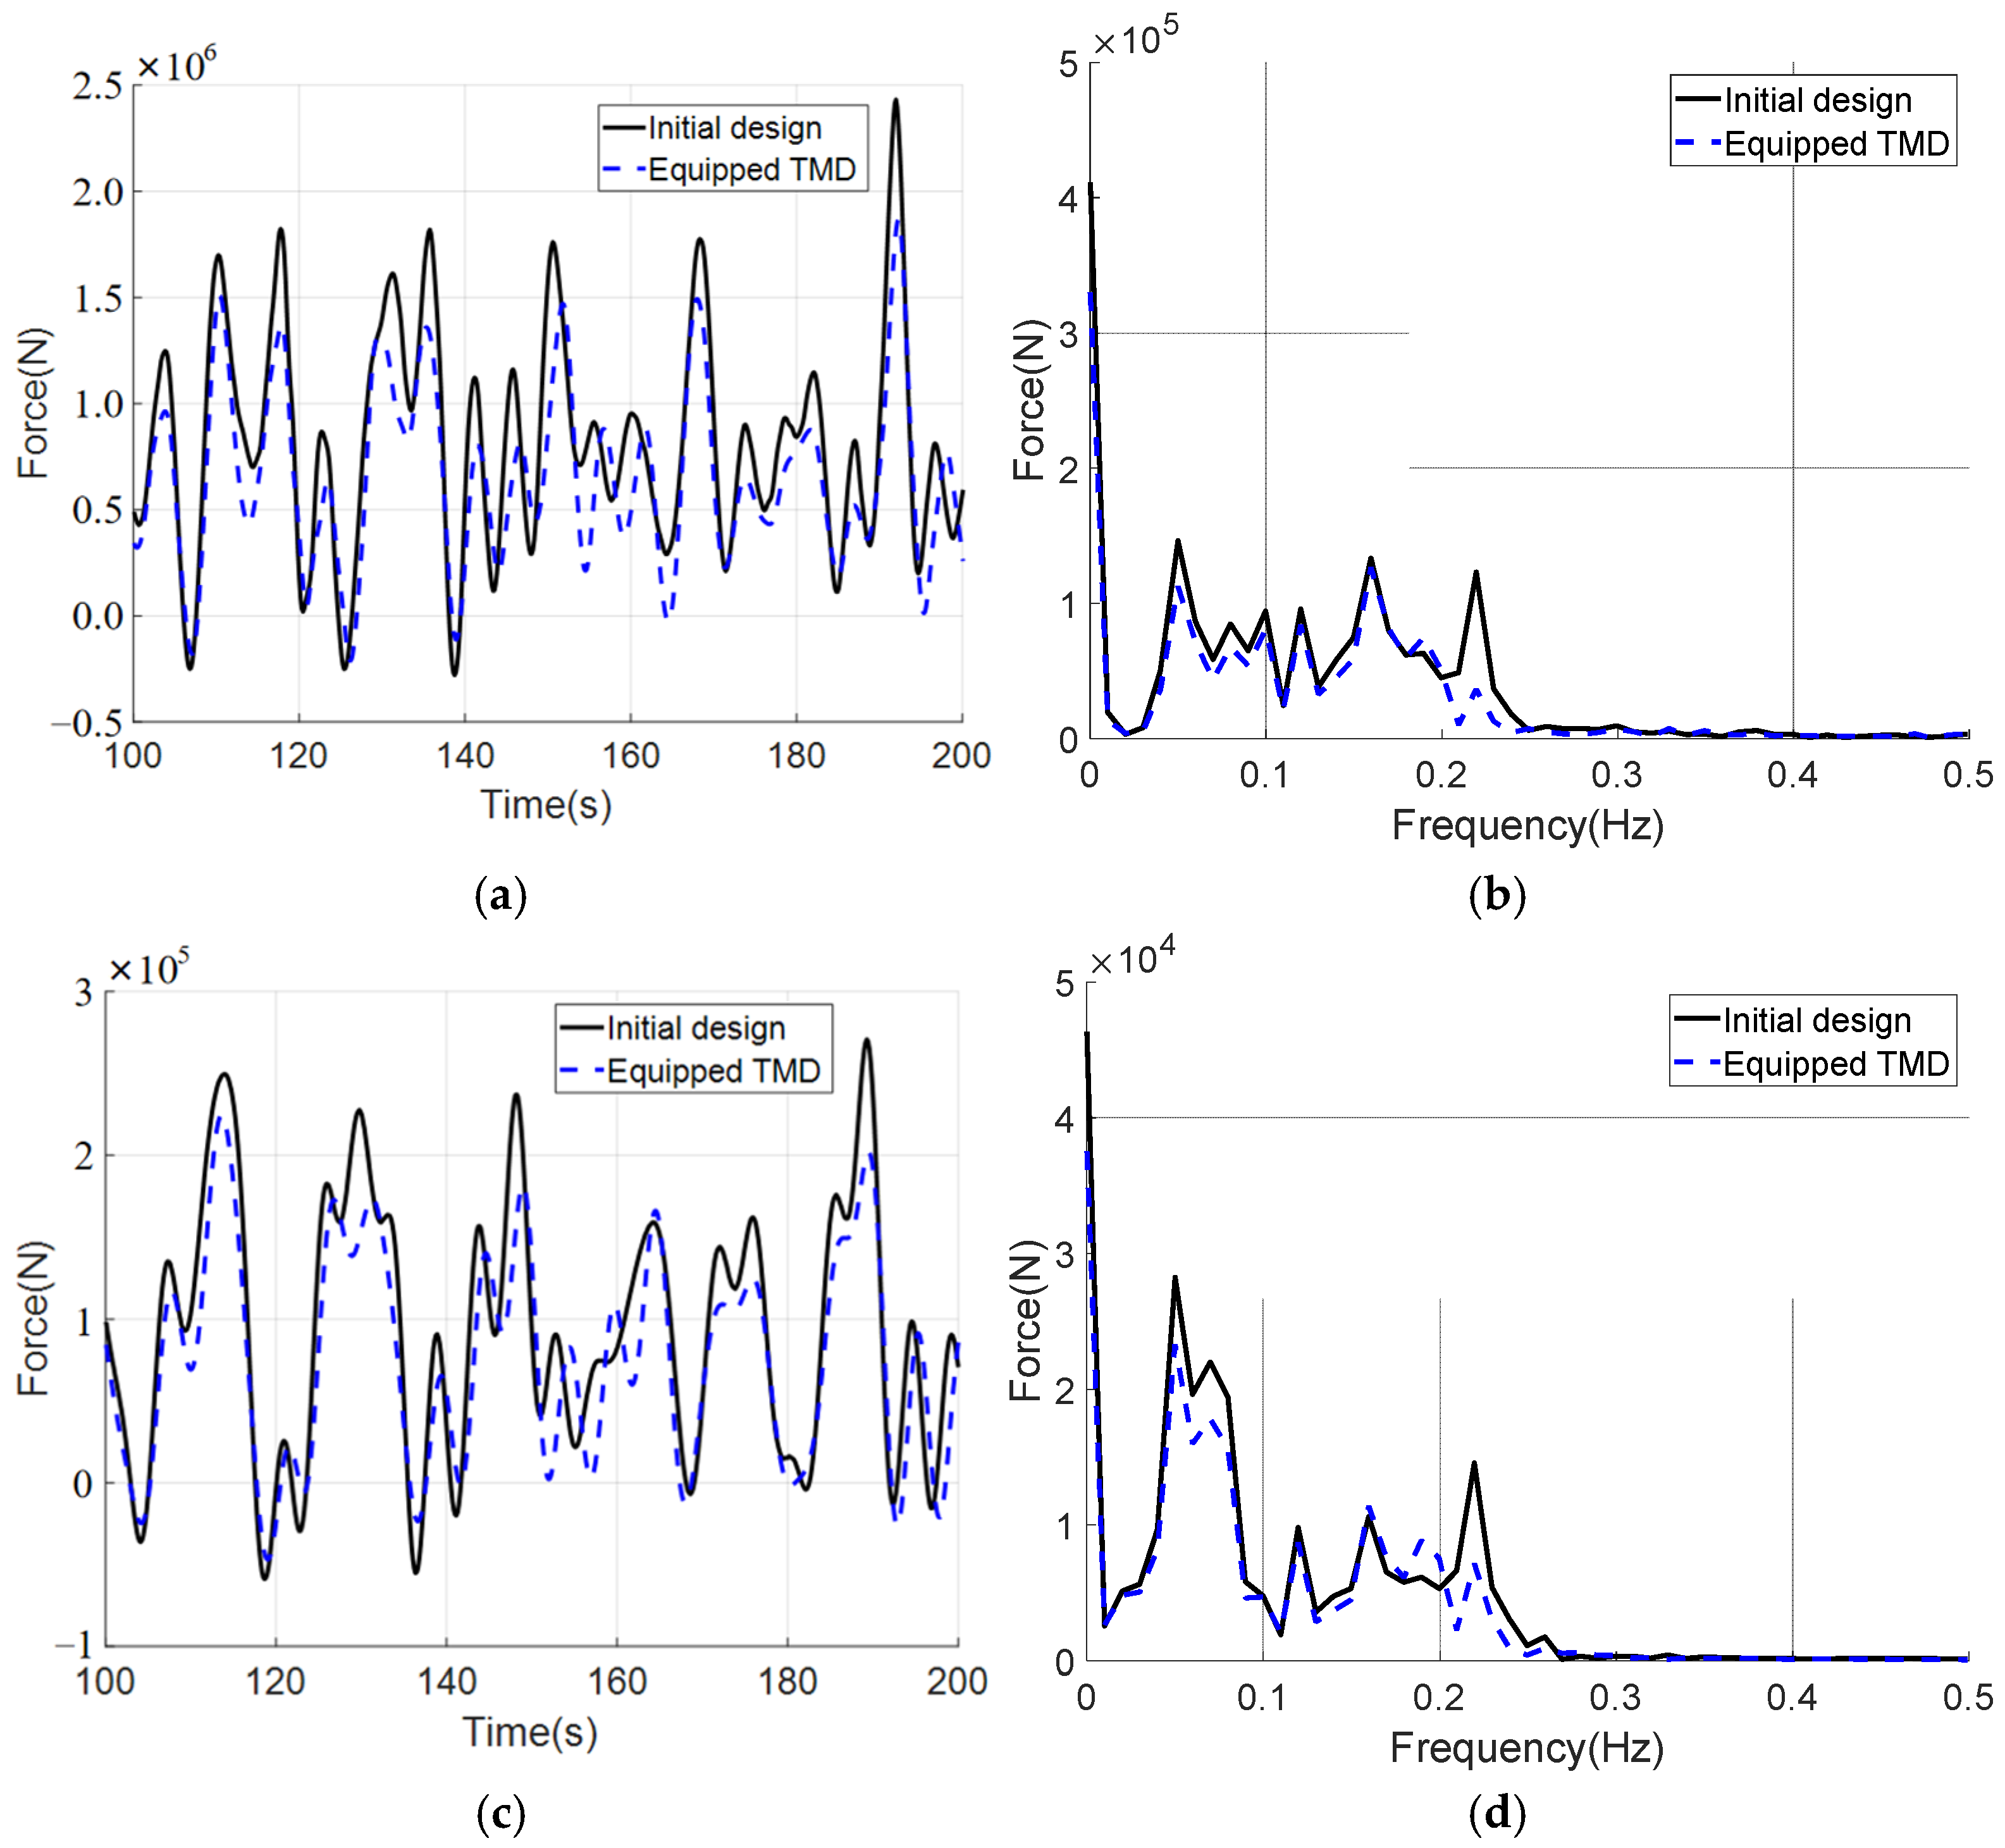
Figure 17 illustrates the influence of the TMD on the base shear at the leg bottom under misaligned typhoon-wave load conditions. In the X-axis direction, the maximum and minimum base shear values for the IDD are 2431.9 kN and −279.6 kN, respectively, while the corresponding values for the DTMD are 1865.5 kN and −142.1 kN, representing reductions of 23.29% and increases of 49.17%, respectively. In the Y-axis direction, the absolute maximum and minimum base shear values for the IDD are 269.2 kN and −59.0 kN, respectively, whereas the DTMD values are 205.0 kN and −46.3 kN, showing reductions of 23.85% and increases of 21.53%, respectively. Spectral analysis of the shear force reveals that energy in both X- and Y-axis directions is predominantly concentrated within the low-frequency range of 0~0.2 Hz, where the TMD achieves significant peak attenuation.

5.2.3. Experiment on Frequency Detuning Sensitivity of TMD

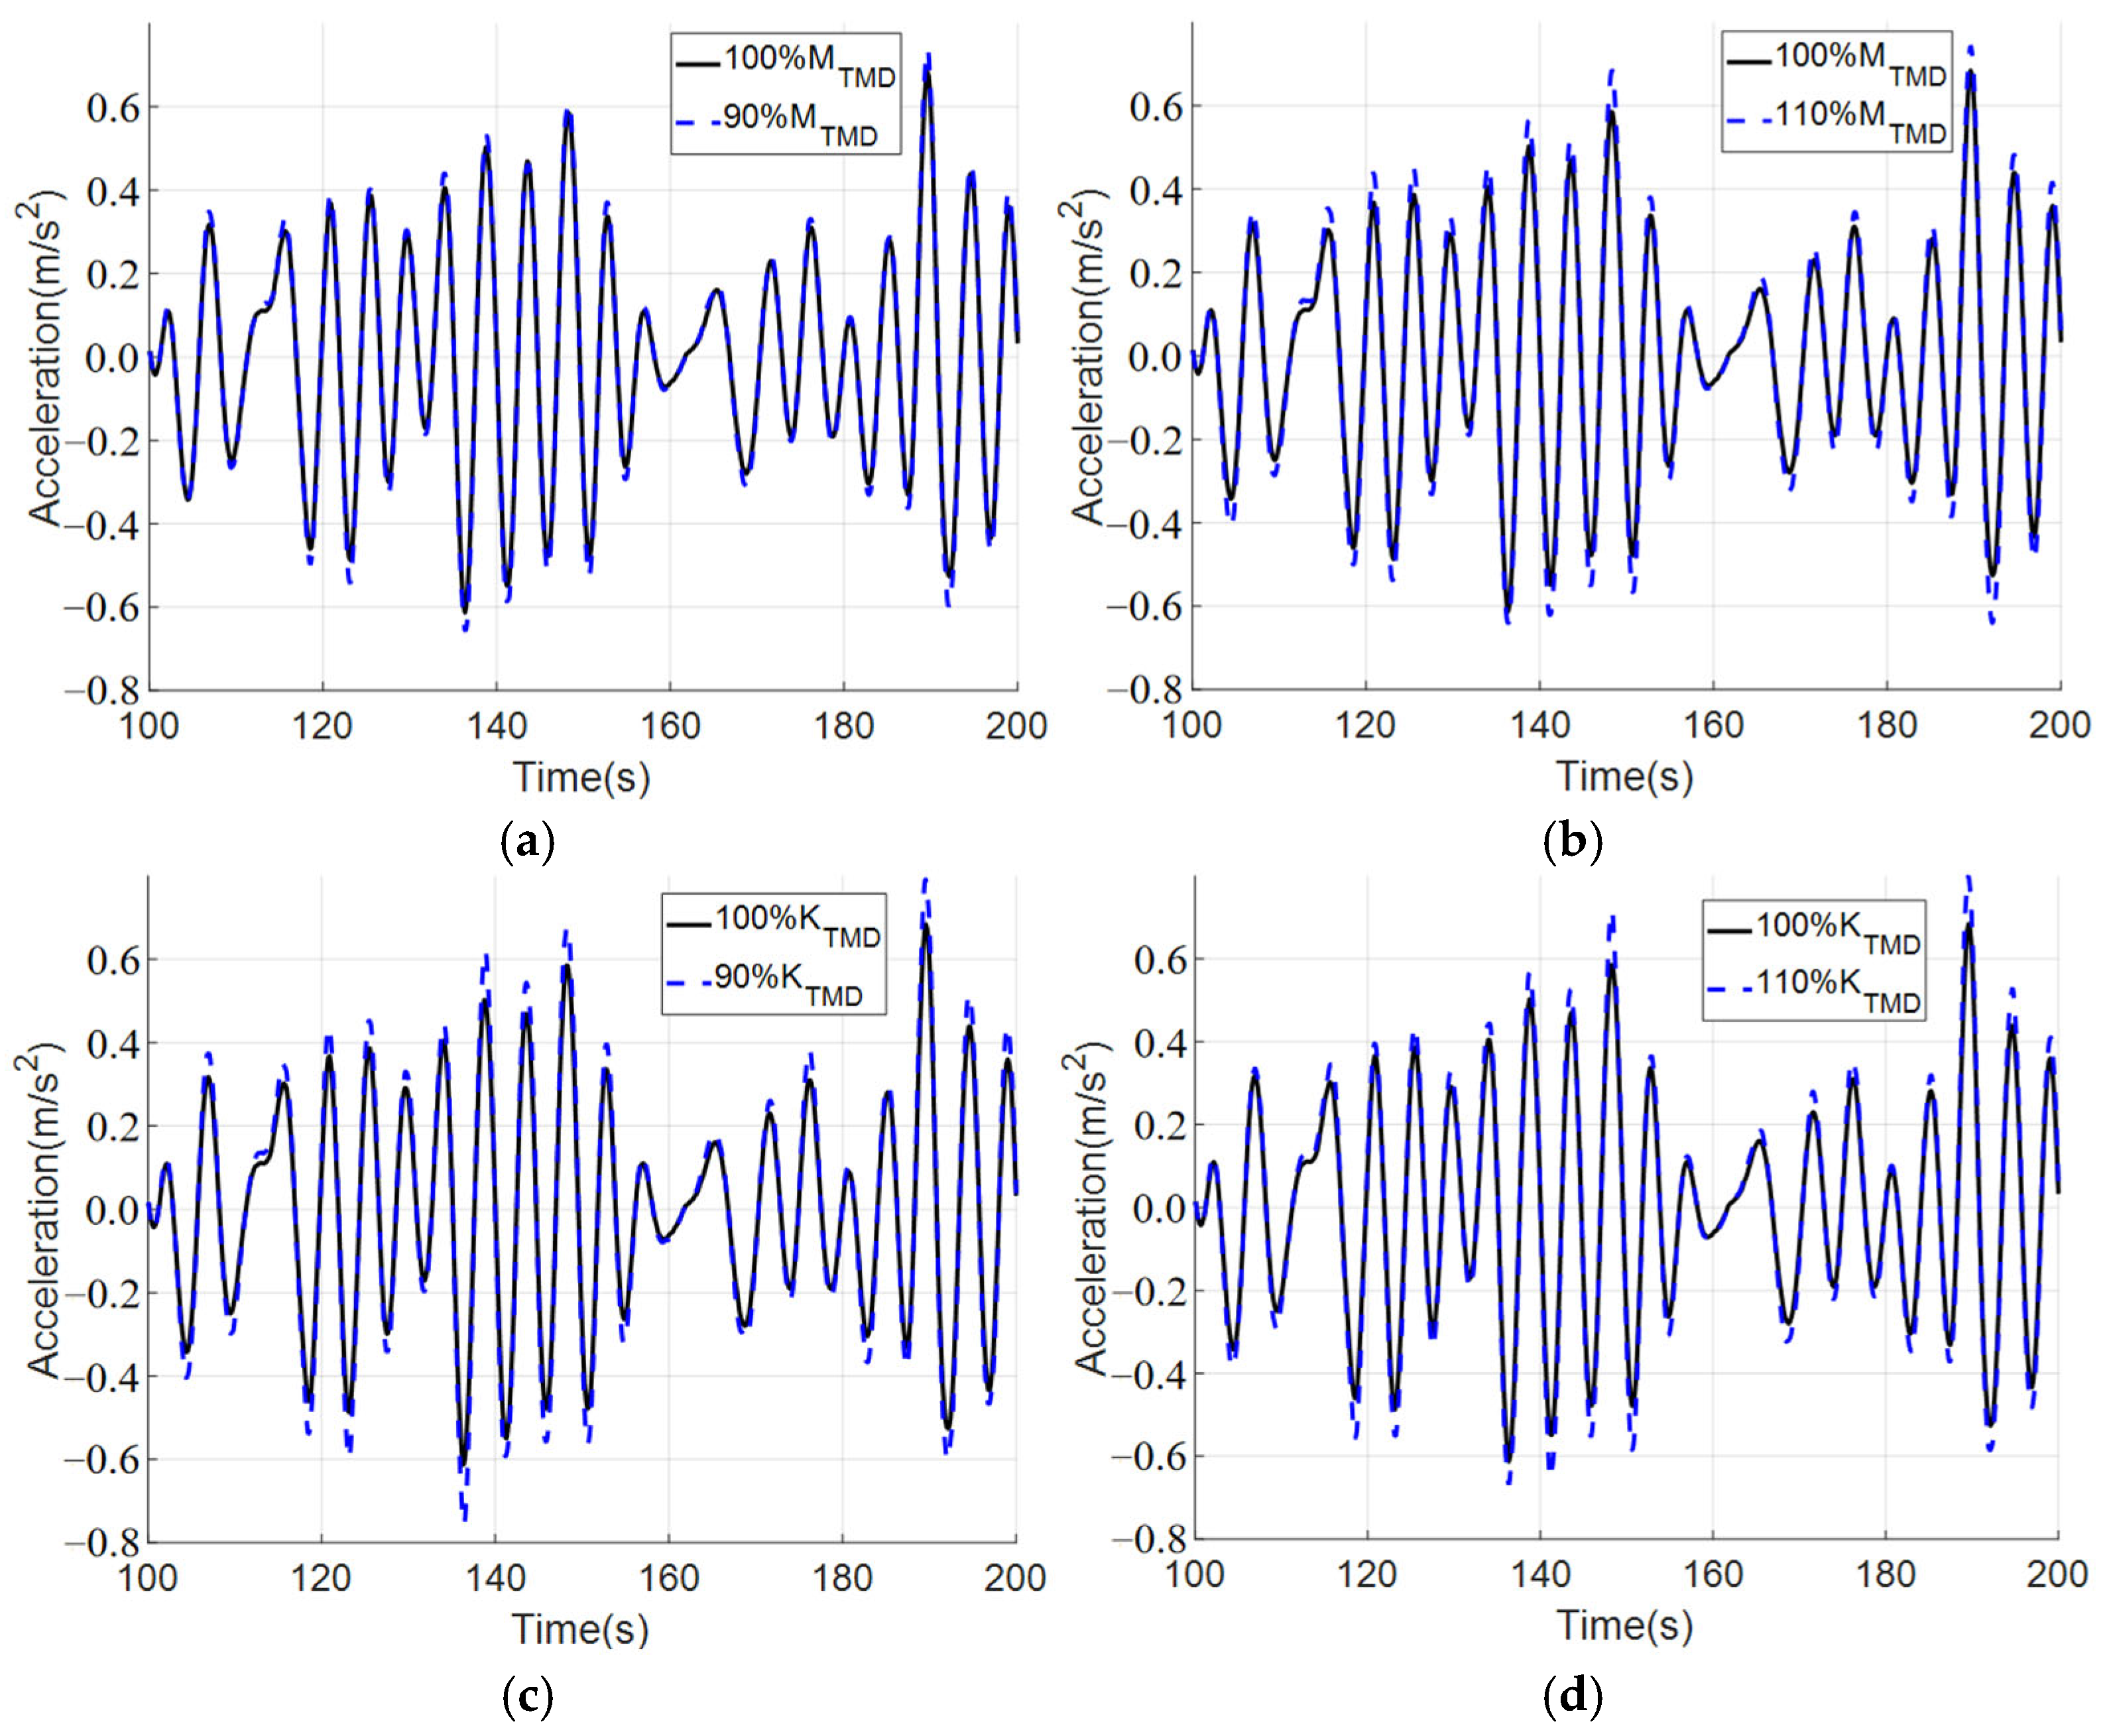
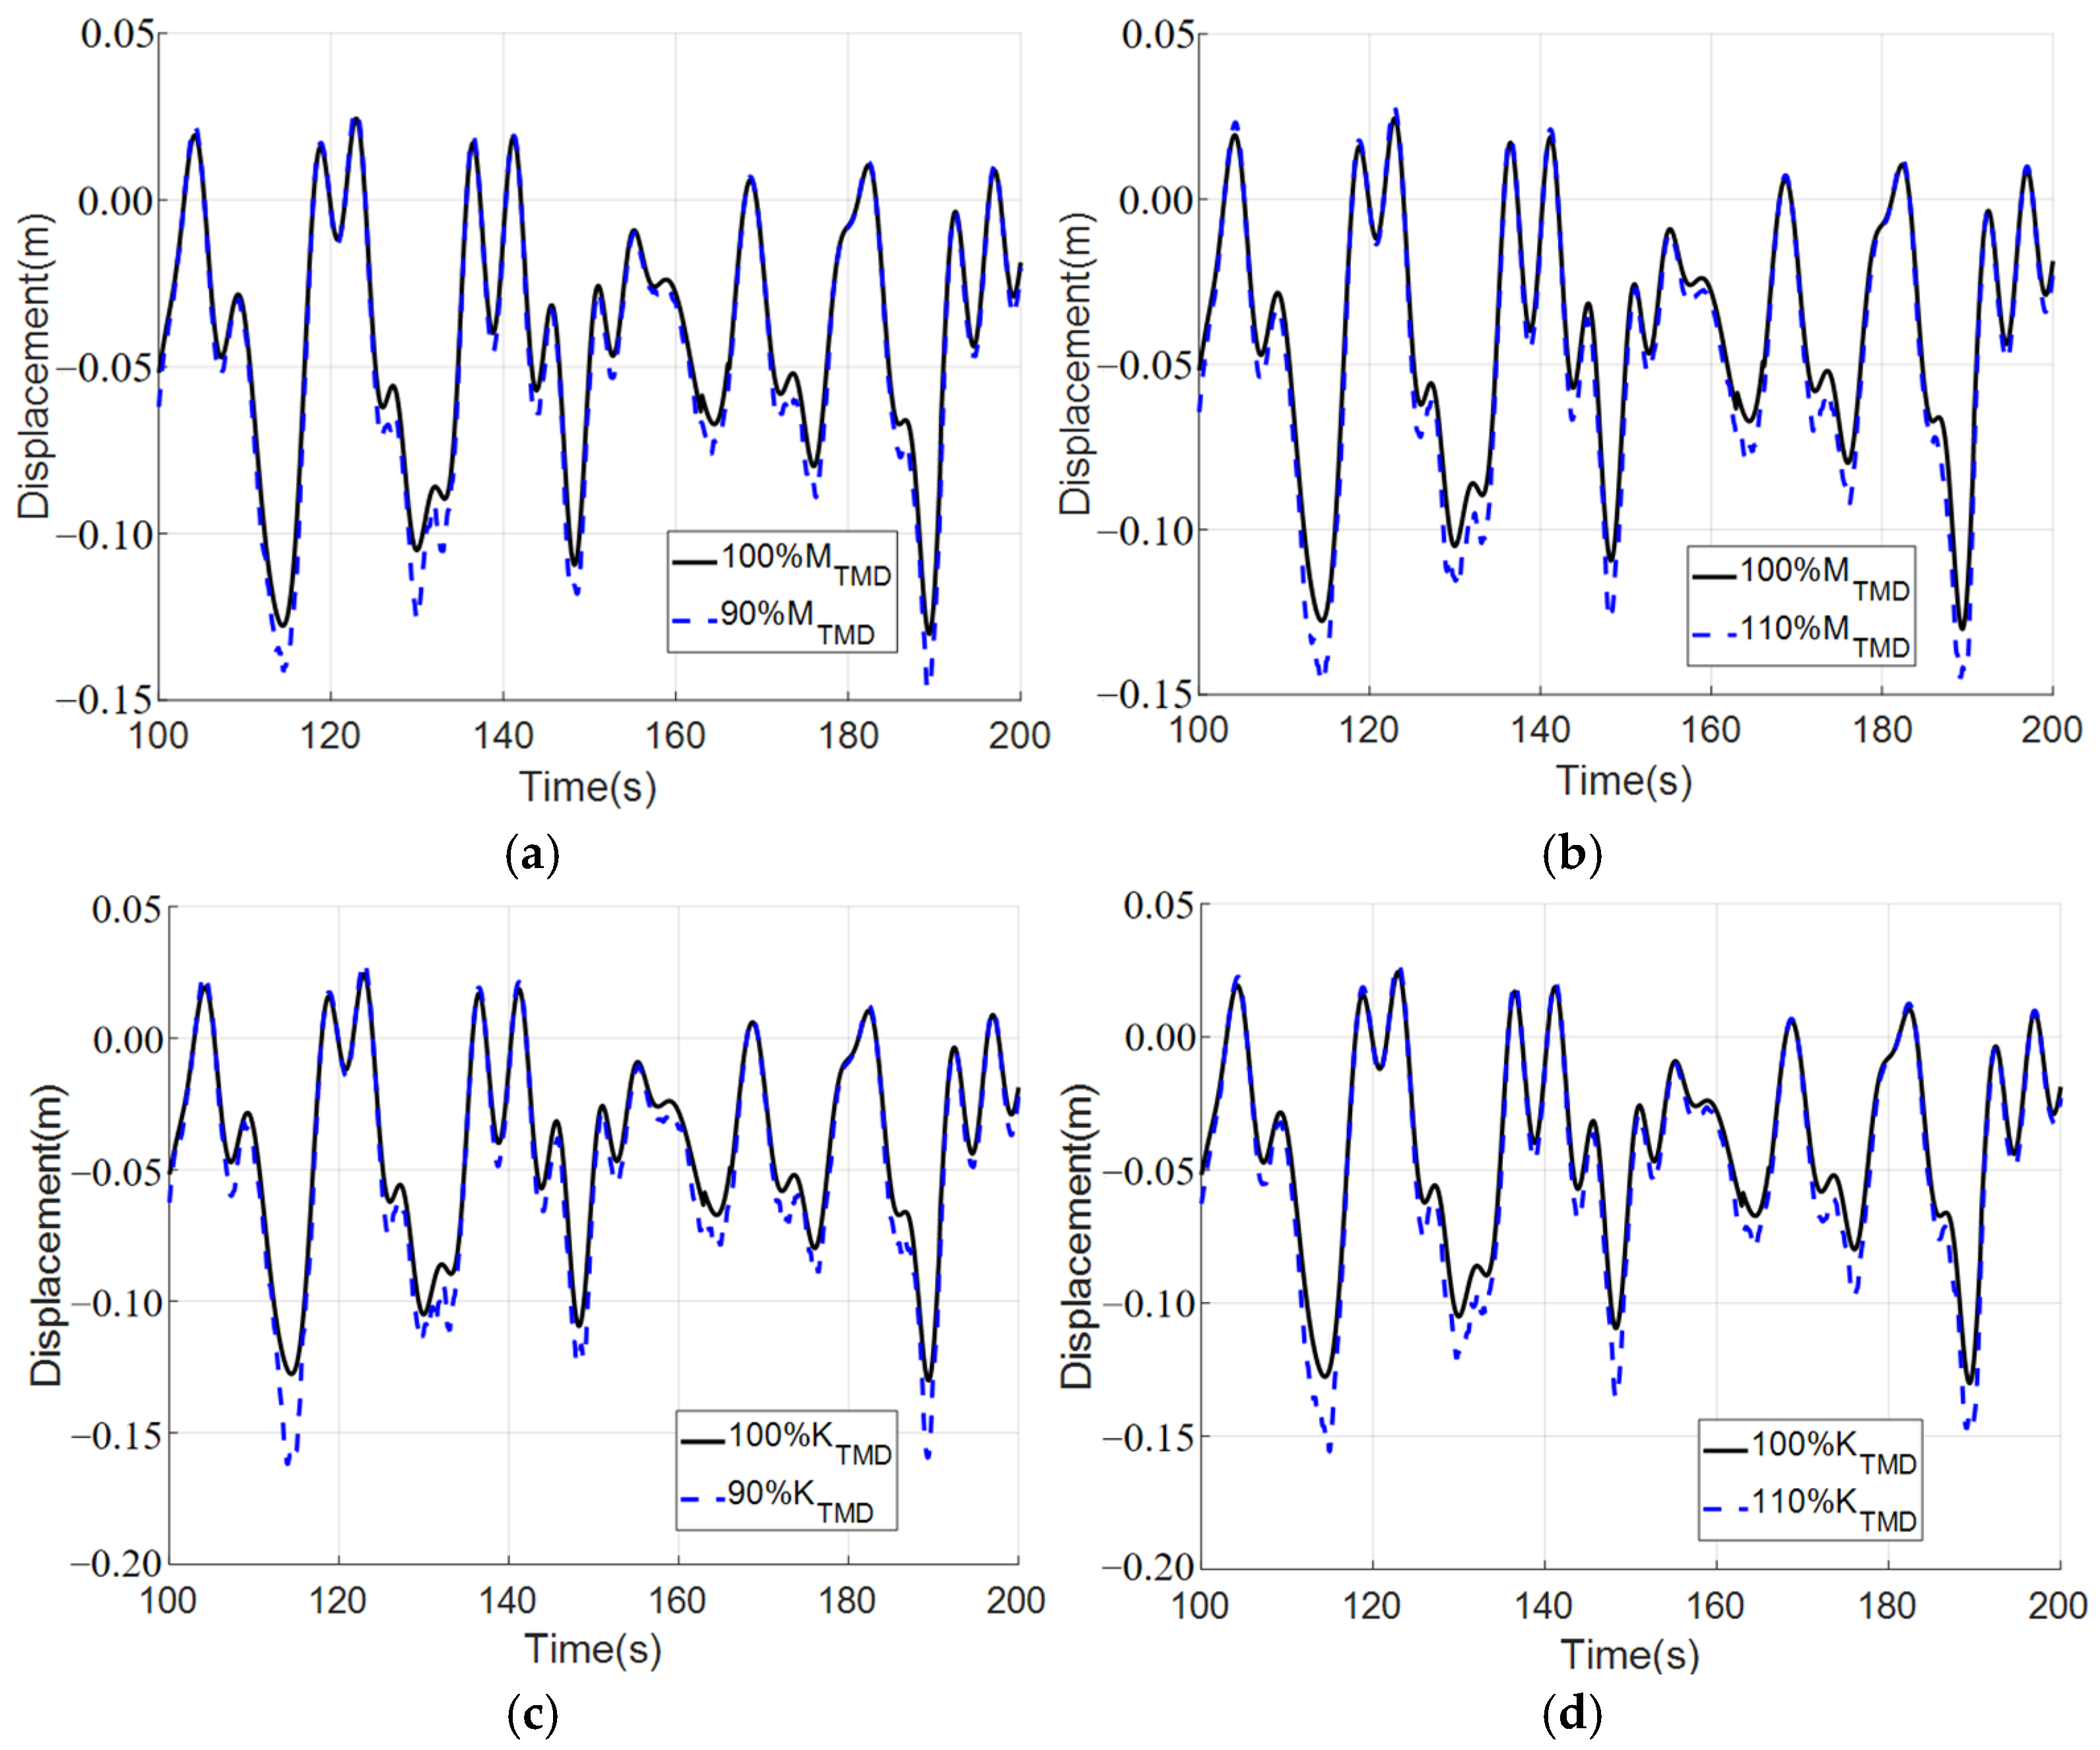
To assess the sensitivity of TMDs to their own frequency detuning, this study conducted supplementary numerical analyses focusing on the impacts of mass or stiffness variations caused by disturbances on TMD performance. Building upon the previous experimental results, the misaligned typhoon and typhoon-wave condition was selected as the analysis backdrop, as it poses challenges to TMD performance and demonstrated favorable control effects in the original study. The research concentrated on the frequency offset in the deck’s Y-direction, as well as displacement and acceleration response metrics. Four disturbance scenarios were designed in this chapter, where the TMD’s mass was either reduced or increased by 10% of its original value. Similarly, the TMD’s stiffness was either decreased or increased by 10% of its original value, while keeping other variables constant. These four parameter-altered scenarios were individually compared against the undisturbed TMD scenario, and the results are presented in Figure 18 and Figure 19.
To better demonstrate the sensitivity of TMD to frequency detuning, this paper processes the simulation data. First, the frequency offset of TMD, denoted as Δ f o f f , is introduced (Equation (26)).
Δ f o f f = f n e w f 0 f 0 × 100 %
where f 0 is the original TMD frequency, i.e., the value f o p t calculated by Equation (6), and f n e w is the disturbed frequency. f n e w can be calculated by Equation (27).
f n e w = 1 2 π K T M D M T M D
In addition, two vibration reduction performance offsets are introduced: the displacement suppression offset Δ d o f f and the acceleration suppression offset Δ a o f f (Equations (28) and (29)).
Δ d o f f = d n e w d 0 d 0 × 100 %
Δ a o f f = a n e w a 0 a 0 × 100 %
where d 0 is the structural displacement suppressed by the TMD in Section 5.2.2, and d n e w is the structural displacement suppressed by the TMD after perturbation. a 0 is the structural acceleration value suppressed by the TMD in Section 5.2.2, and a n e w is the structural acceleration value suppressed by the TMD after disturbance.
The specific calculation results are presented in Table 3. It can be found that the perturbation direction is consistent with the theoretical expectation: Δ f o f f = 1 / M T M D , Δ f o f f = K T M D . Both the reduction in mass and the increase in stiffness result in a positive frequency offset; however, the vibration reduction effect exhibits asymmetric attenuation. The sensitivity of mass perturbation is higher than that of stiffness perturbation. The displacement attenuation amount (−8.60%) for a 10% reduction in stiffness is 1.96 times that for a 10% reduction in mass (−4.38%). The acceleration attenuation amount (9.38%) for a 10% reduction in stiffness is 1.73 times that for a 10% reduction in mass (−5.40%).
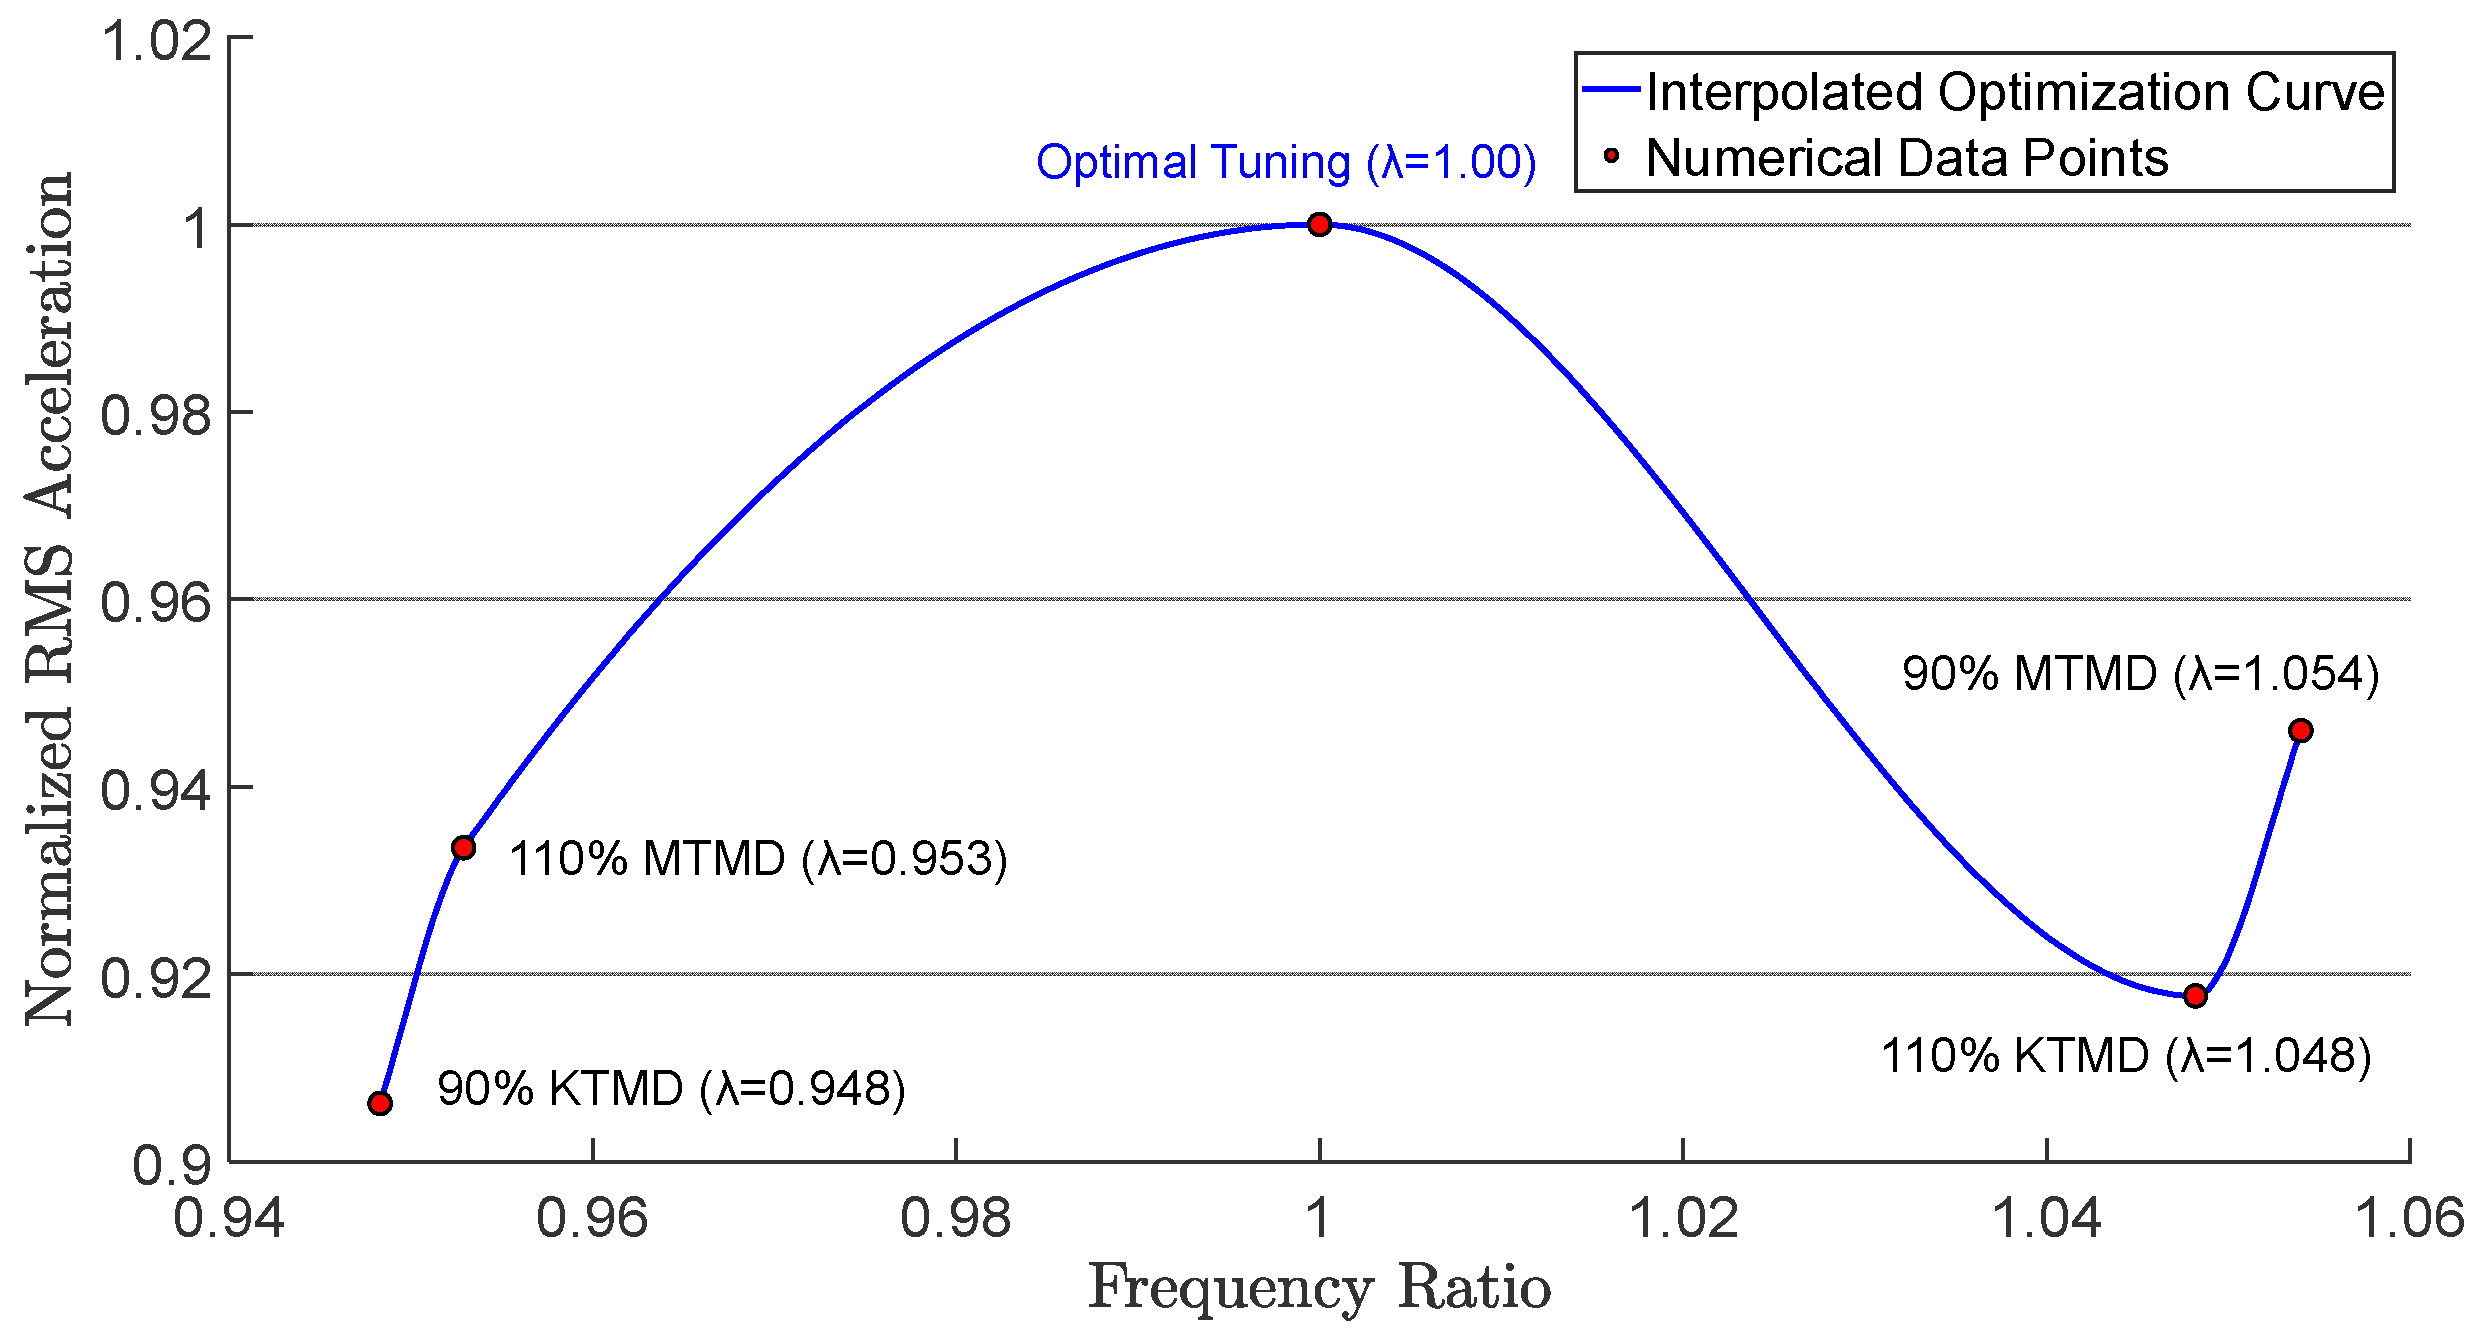
Based on the data in Table 3, we plotted a curve of the frequency ratio ( λ = f n e w / f 0 ) versus the normalized root-mean-square (RMS) acceleration. As shown in Figure 20, the frequency without disturbance achieves an almost minimum structural response. Figure 20 also intuitively demonstrates that the overall performance decreases asymmetrically.

5.2.4. The Influence of Key Design Parameters on the Applicability of Results

The essential experimental results show that TMD has a significant effect in mitigating the dynamic response of the studied jacket platform in 105 m water depth under extreme aligned and misaligned typhoon wave loads. However, it is crucial to discuss the influence of key design parameters on the applicability of these results. The analysis assumes idealized linear TMD behavior, excluding secondary damping contributions from non-structural components. While this simplification is common in preliminary TMD studies, future work should incorporate these effects for higher-fidelity predictions.
The performance of a TMD is inherently tied to the dynamic characteristics (natural frequencies, mode shapes, damping) of the primary structure it is controlling. Variations in platform geometry (e.g., leg spacing, bracing configuration, and deck mass distribution), water depth, and especially seabed stratigraphy (governing SSI) will alter these dynamic characteristics. For instance, a significant increase in water depth would likely lead to longer structural members, increased flexibility, lower natural frequencies, and larger environmental loads. This would require re-optimizing TMD parameters (especially the frequency ratio f o p t ) to maintain effectiveness, although the fundamental energy dissipation mechanism of TMD remains valid [38]. Similarly, changes in soil conditions (e.g., transition from the layered clay/sand in Table 2 to extremely stiff or soft soils) profoundly affect soil–structure interaction (SSI), influencing the stiffness and damping of the entire system [39]. TMD design must account for site-specific SSI characteristics, as rigorously modeled using the PySimple1, TzSimple1, and QzSimple1 elements in this study.

6. Conclusions

Notably, the vibration suppression efficiency of the TMD depends on structural frequency, and accurate simulation of pile-soil interaction is critical. The findings provide an economically viable and reliable solution for vibration-resistant design of deep-water jacket platforms under extreme marine conditions. Future research will focus on optimizing hybrid control strategies combining TMDs with fluid dampers. This study systematically evaluates the effectiveness of Tuned Mass Dampers (TMDs) in controlling the dynamic response of deep-water jacket platforms under typhoon and typhoon-wave loads through numerical simulations. The results indicate that TMDs demonstrate significant vibration reduction performance under both aligned and misaligned typhoon-wave load conditions.
Under aligned load conditions, the TMD reduces the maximum displacements of the platform deck in the X-axis by 18.18%. The maximum velocities decrease by 13.33%, and the maximum accelerations are reduced by 26.19%. For base shear in the X-direction, the maximum value decreases by 17.71%. Under misaligned load conditions, the TMD shows more pronounced control over Y-direction displacement responses, with maximum displacement, velocity, and acceleration reductions of 20.00%, 19.05%, and 17.65%, respectively. Additionally, the maximum base shear decreases by 23.85%. The energy dissipation analysis demonstrates the effectiveness of the TMD in converting structural kinetic energy into heat through its damping mechanism under two conditions. The highest efficiency (68.2%) was observed in the Y-direction under misaligned load conditions.
The experimental study on the frequency detuning sensitivity of the TMD reveals a key finding: the vibration suppression performance is significantly more sensitive to the stiffness deviation (±10%) than to the mass deviation (±10%). It is important to note that the quantitative mitigation performance presented in this study was obtained for a specific jacket platform design founded on a particular stratified seabed profile. The effectiveness of a TMD is sensitive to variations in platform geometry, water depth, and, crucially, the seabed stratigraphy that governs SSI. For significantly different platform configurations or site conditions, the TMD mass, stiffness, damping ratio, and potentially placement should be re-optimized based on a site-specific dynamic analysis incorporating detailed SSI modeling, as performed in this study.
Overall, the research results presented in this article provide an economically viable and reliable solution for the vibration-resistant design of deep-water jacket platforms under extreme marine conditions. Future research will focus on optimizing hybrid control strategies combining TMDs with fluid dampers.

Author Contributions

K.J.: Methodology: writing—original draft and visualization; G.Z.: Investigation, conceptualization, software, and writing—original draft; M.H.: Visualization, data curation, data analysis and interpretation; G.L.: Investigation, validation, and experimental design optimization; H.Y.: Investigation and writing—original draft; L.W. (Lizhong Wang) and L.W. (Lilin Wang): Project administration and writing—review and editing. All authors have read and agreed to the published version of the manuscript.

Funding

This research was funded by National Natural Science Foundation of China (Grant No. 52409144) and the Zhejiang Provincial “Pioneer” R&D Program (Grant No. 2024C03031).

Institutional Review Board Statement

Not applicable.

Informed Consent Statement

Not applicable.

Data Availability Statement

The raw data supporting the conclusions of this article will be made available by the authors on request.

Conflicts of Interest

Authors Kaien Jiang, Guoer Lv and Huafeng Yu were employed by the company ChinaPower China Huadong Engineering Corporation Limited. The remaining authors declare that the research was conducted in the absence of any commercial or financial relationships that could be construed as a potential conflict of interest.

References

  1. Havigh, S.N.; Askar, M.B. The process of fatigue analysis on fixed metal offshore platforms. Mar. Sci. 2017, 7, 10–16. [Google Scholar] [CrossRef]
  2. Peng, B.-F.; Chang, B.; Llorente, C. Nonlinear dynamic soil-pile-structure interaction analysis of a deepwater platform for ductility level earthquakes. In Proceedings of the Offshore Technology Conference, Houston, TX, USA, 2–5 May 2005; p. OTC–17274-MS. [Google Scholar] [CrossRef]
  3. Liu, J.; Ma, X.; Zhang, X.; Zhang, Z.; Liu, G. Axial vibration of deep-water drilling risers under lifting conditions. J. Pet. Sci. Eng. 2022, 209, 109903. [Google Scholar] [CrossRef]
  4. Huang, X.; Yang, B. Towards novel energy shunt inspired vibration suppression techniques: Principles, designs and applications. Mech. Syst. Signal Process. 2023, 182, 109496. [Google Scholar] [CrossRef]
  5. Zhang, B.-L.; Han, Q.-L.; Zhang, X.-M.; Tang, G.-Y. Active Control of Offshore Steel Jacket Platforms; Springer: Berlin/Heidelberg, Germany, 2019. [Google Scholar]
  6. Yang, F.; Sedaghati, R.; Esmailzadeh, E. Vibration suppression of structures using tuned mass damper technology: A state-of-the-art review. J. Vib. Control 2022, 28, 812–836. [Google Scholar] [CrossRef]
  7. Frahm, H. Device for Damping Vibrations of Bodies. U.S. Patent 989,958, 18 April 1911. [Google Scholar]
  8. Wu, Q.; Zhao, X.; Zheng, R.; Minagawa, K. High Response Performance of a Tuned-Mass Damper for Vibration Suppression of Offshore Platform under Earthquake Loads. Shock Vib. 2016, 2016, 7383679. [Google Scholar] [CrossRef]
  9. Guo, W.; Li, H.N.; Liu, G.H.; Yu, Z.W. A simplified optimization strategy for nonlinear tuned mass damper in structural vibration control. Asian J. Control 2012, 14, 1059–1069. [Google Scholar] [CrossRef]
  10. Bui, H.-L.; Tran, N.-A. Multi-objective optimal design of TMDs for increasing critical flutter wind speed of bridges. J. Wind Eng. Ind. Aerodyn. 2022, 225, 104992. [Google Scholar] [CrossRef]
  11. Leung, A.Y.; Zhang, H.; Cheng, C.; Lee, Y. Particle swarm optimization of TMD by non-stationary base excitation during earthquake. Earthq. Eng. Struct. Dyn. 2008, 37, 1223–1246. [Google Scholar] [CrossRef]
  12. Nie, W.; Liu, S.; Yin, H.; Lu, S.; Zhao, D.; Xu, H. Application of the Improved Multipopulation Genetic Algorithm in the TMD Controlled System considering Soil-Structure Interaction. Adv. Civ. Eng. 2022, 2022, 8212766. [Google Scholar] [CrossRef]
  13. Xu, T.; Li, Y.; Leng, D. Mitigating jacket offshore platform vibration under earthquake and ocean waves utilizing tuned inerter damper. Bull. Earthq. Eng. 2023, 21, 1627–1650. [Google Scholar] [CrossRef]
  14. Delavar, M.A.; Bargi, K. Seismic response control of offshore platforms equipped with optimum localization of SMA. engrxiv 2020. [Google Scholar] [CrossRef]
  15. Gavgani, S.A.M.; Homami, P.; Darbanian, R.; Moharrerzadeh, K. Probabilistic assessment of optimum tuned mass damper in offshore platforms considering fluid–structure interaction. Mar. Syst. Ocean Technol. 2024, 19, 57–67. [Google Scholar] [CrossRef]
  16. Jin, Q.; Li, X.; Sun, N.; Zhou, J.; Guan, J. Experimental and numerical study on tuned liquid dampers for controlling earthquake response of jacket offshore platform. Mar. Struct. 2007, 20, 238–254. [Google Scholar] [CrossRef]
  17. Sardar, R.; Chakraborty, S. Wave vibration control of jacket platform by tuned liquid dampers. Ocean Eng. 2022, 247, 110721. [Google Scholar] [CrossRef]
  18. Paul, S.; Datta, T.; Kapuria, S. Control of fixed offshore jacket platform using semi-active hydraulic damper. J. Offshore Mech. Arct. Eng. 2009, 131, 041106. [Google Scholar] [CrossRef]
  19. Patil, K.; Jangid, R. Passive control of offshore jacket platforms. Ocean Eng. 2005, 32, 1933–1949. [Google Scholar] [CrossRef]
  20. Tabeshpour, M.R.; Rokni, H.J. Frequency domain long-term efficiency of viscous damper in jacket platforms under random wave load. Arab. J. Sci. Eng. 2017, 42, 4523–4534. [Google Scholar] [CrossRef]
  21. Janbazi Rokni, H.; Tabeshpour, M.R. Spectral fatigue analysis of jacket platform under wave load equipped with viscous damper. J. Mar. Sci. Technol. 2019, 24, 855–870. [Google Scholar] [CrossRef]
  22. Espinoza, G.; Benedetti, F.; Alvarez-Mendoza, P.; Bonilla, E. Influence of the seismic excitation frequencies content on the behavior of a tuned mass damper in low-rise building considering soil-structure interaction. Lat. Am. J. Solids Struct. 2018, 15, e75. [Google Scholar] [CrossRef]
  23. Pastia, C.; Luca, S.-G. Vibration control of a frame structure using semi-active tuned mass damper. Bul. Institutului Politeh. Lasi Sect. Constr. Arhit. 2013, 59, 31. [Google Scholar]
  24. Ju, S.H.; Su, F.C.; Jiang, Y.T.; Chiu, Y.C. Ultimate load design of jacket-type offshore wind turbines under tropical cyclones. Wind Energy 2019, 22, 685–697. [Google Scholar] [CrossRef]
  25. Fan, T.-Y.; Lin, C.-Y.; Huang, C.-C.; Chu, T.-L. Time-domain fatigue analysis of multi-planar tubular joints for a jacket-type substructure of offshore wind turbines. Int. J. Offshore Polar Eng. 2020, 30, 112–119. [Google Scholar] [CrossRef]
  26. Bai, Y.; Yan, H.-B.; Cao, Y.; Kim, Y.; Yang, Y.-Y.; Jiang, H. Time-dependent reliability assessment of offshore jacket platforms. Ships Offshore Struct. 2016, 11, 591–602. [Google Scholar] [CrossRef]
  27. Shahin, M.A. State-of-the-art review of some artificial intelligence applications in pile foundations. Geosci. Front. 2016, 7, 33–44. [Google Scholar] [CrossRef]
  28. Boulanger, R.W.; Curras, C.J.; Kutter, B.L.; Wilson, D.W.; Abghari, A. Seismic soil-pile-structure interaction experiments and analyses. J. Geotech. Geoenviron. Eng. 1999, 125, 750–759. [Google Scholar] [CrossRef]
  29. Liang, Z.; Jeng, D.-S. The instantaneous seabed liquefaction around offshore pile-type foundation and seabed protection under combined wave and current loading. Ocean Eng. 2022, 257, 111649. [Google Scholar] [CrossRef]
  30. Haghroosta, T.; Ismail, W.; Ghafarian, P.; Barekati, S. The efficiency of the Weather Research and Forecasting (WRF) model for simulating typhoons. Nat. Hazards Earth Syst. Sci. 2014, 14, 2179–2187. [Google Scholar] [CrossRef]
  31. Iuso, G.; Virone, G.; Cafiero, G.; Bonisoli, E.; Lisitano, D.; Venturini, S. Aeroelastic-structural coupling in antenna prototype for windy open-space. In Proceedings of the COUPLED VIII: Proceedings of the VIII International Conference on Computational Methods for Coupled Problems in Science and Engineering; Sitges, Spain, 3–5 June 2019, pp. 481–492.
  32. IEC 61400-1:2019; Wind Energy Generation Systems—Part 1: Design Requirements. International Electrotechnical Commission: Geneva, Switzerland, 2019.
  33. Teng, L.; Hang, X.; Wang, L.; Wang, L.; Guo, Z. Interactive Validation of Real-Time Hybrid Wave Basin Test for Fowts Using an Aero-Hydro-Servo Multibody Program Zwind. SSRN 2025. [Google Scholar] [CrossRef]
  34. Otoniel Canuet, L.F. Atmospheric Turbulence Profile Modeling for Satellite-Ground Laser Communication; Universitat Politècnica de Catalunya: Barcelona, Spain, 2015. [Google Scholar]
  35. Van Binh, L.; Ishihara, T.; Van Phuc, P.; Fujino, Y. A peak factor for non-Gaussian response analysis of wind turbine tower. J. Wind Eng. Ind. Aerodyn. 2008, 96, 2217–2227. [Google Scholar] [CrossRef]
  36. Cao, T. A Theoretical and Numerical Study of Turbulent Wind-Wave Interaction; University of Minnesota: Minneapolis, MN, USA, 2020. [Google Scholar]
  37. Zhang, S.-f.; Chen, C.; Zhang, Q.-x.; Zhang, D.-m.; Zhang, F. Wave loads computation for offshore floating hose based on partially immersed cylinder model of improved Morison formula. Open Pet. Eng. J. 2015, 8, 130–137. [Google Scholar] [CrossRef]
  38. Shayesteh Bilondi, M.R.; Yazdani, H.; Khatibinia, M. Seismic energy dissipation-based optimum design of tuned mass dampers. Struct. Multidiscip. Optim. 2018, 58, 2517–2531. [Google Scholar] [CrossRef]
  39. Elias, S.; Matsagar, V. Research developments in vibration control of structures using passive tuned mass dampers. Annu. Rev. Control 2017, 44, 129–156. [Google Scholar] [CrossRef]
Figure 1. Overall research flow. (a) Main process; (b) Platform structure modeling process; (c) Environmental load simulation process.
Applsci 15 07321 g001
Figure 2. TMD computational model.
Applsci 15 07321 g002
Figure 3. Offshore platform layout. (a) Oblique view; (b) Side view; (c) Front view.
Applsci 15 07321 g003
Figure 4. FE model of the Offshore platform.
Applsci 15 07321 g004
Figure 5. Schematic diagram of P-y curves for soft clay.
Applsci 15 07321 g005
Figure 6. Wind speed and direction profiles at a wind farm site in Taizhou. (a) Wind speed profile; (b) Wind direction profile.
Applsci 15 07321 g006
Figure 7. Wind profile under the most critical loading condition.
Applsci 15 07321 g007
Figure 8. Location of the offshore platform.
Applsci 15 07321 g008
Figure 9. Two excitation patterns. (a) Aligned typhoon-wave loads; (b) Misaligned typhoon-wave loads.
Applsci 15 07321 g009
Figure 10. Deck displacement under aligned typhoon and typhoon-wave. (a) Time-domain simulation results in the X-axis direction; (b) Frequency-domain simulation results in the X-axis direction; (c) Time-domain simulation results in the Y-axis direction; (d) Frequency-domain simulation results in the Y-axis direction.
Applsci 15 07321 g010
Figure 11. Deck velocity under aligned typhoon and typhoon-wave. (a) Time-domain simulation results in the X-axis direction; (b) Frequency-domain simulation results in the X-axis direction; (c) Time-domain simulation results in the Y-axis direction; (d) Frequency-domain simulation results in the Y-axis direction.
Applsci 15 07321 g011
Figure 12. Deck acceleration under aligned typhoon and typhoon-wave. (a) Time-domain simulation results in the X-axis direction; (b) Frequency-domain simulation results in the X-axis direction; (c) Time-domain simulation results in the Y-axis direction; (d) Frequency-domain simulation results in the Y-axis direction.
Applsci 15 07321 g012
Figure 13. Base shear forces under aligned typhoon and typhoon-wave. (a) Time-domain simulation results in the X-axis direction; (b) Frequency-domain simulation results in the X-axis direction; (c) Time-domain simulation results in the Y-axis direction; (d) Frequency-domain simulation results in the Y-axis direction.
Applsci 15 07321 g013
Figure 14. Deck displacement under a misaligned typhoon and typhoon wave. (a) Time-domain simulation results in the X-axis direction; (b) Frequency-domain simulation results in the X-axis direction; (c) Time-domain simulation results in the Y-axis direction; (d) Frequency-domain simulation results in the Y-axis direction.
Applsci 15 07321 g014
Figure 15. Deck velocity under a misaligned typhoon and typhoon-wave. (a) Time-domain simulation results in the X-axis direction; (b) Frequency-domain simulation results in the X-axis direction; (c) Time-domain simulation results in the Y-axis direction; (d) Frequency-domain simulation results in the Y-axis direction.
Applsci 15 07321 g015
Figure 16. Deck acceleration under a misaligned typhoon and typhoon-wave. (a) Time-domain simulation results in the X-axis direction; (b) Frequency-domain simulation results in the X-axis direction; (c) Time-domain simulation results in the Y-axis direction; (d) Frequency-domain simulation results in the Y-axis direction.
Applsci 15 07321 g016
Figure 17. Base shear forces under misaligned typhoon and typhoon-wave. (a) Time-domain simulation results in the X-axis direction; (b) Frequency-domain simulation results in the X-axis direction; (c) Time-domain simulation results in the Y-axis direction; (d) Frequency-domain simulation results in the Y-axis direction.
Applsci 15 07321 g017
Figure 18. The time-domain simulation results of deck acceleration in the Y-axis direction under misaligned typhoon and typhoon-wave loads. (a) The comparison between 90% MTMD and 100% MTMD; (b) The comparison between 110% MTMD and 100% MTMD; (c) The comparison between 90% KTMD and 100% KTMD; (d) The comparison between 110% KTMD and 100% KTMD.
Applsci 15 07321 g018
Figure 19. The time-domain simulation results of deck displacement in the Y-axis direction under misaligned typhoon and typhoon-wave loads. (a) The comparison between 90% MTMD and 100% MTMD; (b) The comparison between 110% MTMD and 100% MTMD; (c) The comparison between 90% KTMD and 100% KTMD; (d) The comparison between 110% KTMD and 100% KTMD.
Applsci 15 07321 g019
Figure 20. TMD Frequency Optimization Curve.
Applsci 15 07321 g020
Table 1. Wave Parameters and Current Velocity for 100-year Return Period.
Water Level (m)Hs (m)Tp (s)Current Velocity (m/s)
110.1832.218.91.905
Table 2. Soil property.
No.SoilDepth (m)Effective Weight (kN/m3)Friction
Angle (°)
Undrained Shear Strength (kPa)
Top (m)Bottom (m)
1Sand010923°-
2Sand1014.29.223.5°-
3Sand14.221.59.526.5°-
4Sand21.533.19.627°-
5Clay33.151.18.8-96
6Sand51.153.19.729°-
7Clay53.165.19-134
8Sand65.167.99.830°-
9Clay67.975.59.2-163
10Clay75.581.99.2-179
11Sand81.982.89.930.5°-
Table 3. Analysis of TMD frequency detuning sensitivity.
Disturbance Parameterfoffdoffaoff
Mean ValueMaximumMean ValueMaximum
90% MTMD5.4%−4.38%−3.21%−5.40%−4.41%
110% MTMD−4.71%−6.95%−3.22%−6.65%−4.76%
90% KTMD−5.17%−8.60%−5.38%−9.38%−6.40%
110% KTMD4.82%−7.30%−8.06%−8.23%−5.31%
Disclaimer/Publisher’s Note: The statements, opinions and data contained in all publications are solely those of the individual author(s) and contributor(s) and not of MDPI and/or the editor(s). MDPI and/or the editor(s) disclaim responsibility for any injury to people or property resulting from any ideas, methods, instructions or products referred to in the content.