Abstract
Simulation experiments are a crucial method for investigating overburden failure, strata movement, and strata control during coal mining. However, traditional similar materials struggle to effectively monitor internal damage, fracturing, and dynamic development processes within the strata during mining. To address this issue, carbon fibers were introduced into the field of similar material simulation experiments for mining. Leveraging the excellent conductivity and the sensitive feedback of resistivity changes in response to damage of this composite material enabled real-time monitoring of internal damage and fracture patterns within the mining strata during similar simulation experiments, leading to the development of a carbon fiber similar simulation composite material with damage self-sensing properties. This study found that as the carbon fiber content increased, the evolution patterns of the electrical resistance change rate and the damage coefficient of the similar material tended to coincide. When the carbon fiber content in the similar material exceeded 2%, the electrical resistance change rate and the damage coefficient consistently exhibited synchronized growth with identical increments. A similar simulation experiment revealed that after the completion of workface mining, the thick sandstone aquifer did not develop significant cracks and remained stable. In the early stages of mining, damage rapidly accumulated at the bottom of the thick aquifer, approaching the failure threshold. In the middle layers, a step-like increase in the damage coefficient occurred after mining reached a certain width, while the top region was less affected by mining activities, resulting in less significant damage development. The research findings offer new experimental insights into rock layer movement and control studies, providing theoretical guidance for the prediction, early warning, and prevention of dynamic disasters in mines with thick key layers.
1. Introduction
Similar material simulation experiments are one of the primary methods for studying the movement and failure of overburden due to mining and for controlling rock layers [1,2,3]. Underground mine face pressure monitoring can only passively and indirectly observe the process of rock layer failure and movement, and the pressure manifestation formed at the face [4]. This approach struggles to effectively study the microscopic processes of damage, crack development, and expansion within the mining-induced rock layers [5]. Consequently, numerous scholars domestically and internationally are dedicated to developing more sophisticated boundary conditions and multi-dimensional joint monitoring techniques in similar simulation equipment. They aim to deeply analyze and uncover the micromechanical behavior characteristics of rock layer damage, crack propagation, and fracture patterns, to more intuitively and reliably reproduce and understand these mechanical processes [6,7,8].
The design and modification of similar material simulation platforms is an important approach for scholars conducting technical research. In the field of platform development, in addition to experimental platforms simulating conditions of thin bedrock or hard roof strata [9], large-scale stope model testing platforms and corresponding hydraulic support simulation devices have also been introduced [10], enriching the fundamental tools for experimental research. Meanwhile, multi-functional three-dimensional physical simulation [11] platforms and two-dimensional similar material simulation platforms, approaching the issue from different dimensional perspectives, have effectively expanded the depth and breadth of research, driving technical studies toward more refined and comprehensive development. Moreover, in response to special conditions such as steeply inclined working faces, the invention of novel parallelogram-type hydraulic supports and the application of new three-dimensional loadable model testing systems [12] have not only optimized structural design but also provided new methods for verifying mining behaviors, further advancing the innovation and progress of similar material simulation technologies.
In terms of experimental monitoring, numerous studies have explored similar material simulation results using various monitoring techniques, including fiber Bragg grating stress sensors [13,14], 3D ultra-high-definition borehole video systems [15], XTDIC systems [16], graphical processing software [17], microseismic monitoring [18], and resistance strain gauges [19]. These technologies and devices are employed to monitor stress variations, rock layer movement, fracture development, and strain field distribution. However, a review of existing studies reveals that current similar material simulation experiments mainly focus on the improvement and innovation of external monitoring equipment, with limited attention given to the physical and chemical modifications of the simulation materials themselves. There is still a lack of development in materials with damage and fracture self-sensing capabilities, as well as the corresponding monitoring methods.
In recent years, researchers in structural monitoring have actively pursued innovative exploration. By incorporating carbon fibers into cement-based materials, they have successfully developed composite materials with self-sensing health capabilities [20,21,22], opening new pathways for structural health monitoring. When carbon fibers are uniformly mixed with cement-based materials, they form a complex and orderly conductive network [23,24]. Establishing this network significantly reduces the electrical resistivity of the composite material [25], laying the foundation for it to exhibit a range of excellent properties [26]. Studies show that carbon fiber composites not only possess excellent piezoresistive properties [27,28] but are also highly sensitive to the development and propagation of internal cracks [29,30]. When microcracks appear within the material, the integrity of the conductive network is compromised. By precisely monitoring its electrical properties, the dynamic evolution of internal cracks can be captured in real time [31,32]. In practical engineering applications, this material serves as an intelligent monitoring component, providing continuous and accurate feedback on the mechanical state and health of structures. It offers reliable data support and technical assurance for the safe operation and maintenance management of large structures, thereby driving the structural monitoring field towards greater intelligence and precision. It has already been successfully applied in the health monitoring of large structures such as bridges [33,34] and highways [26,35].
From the perspective of multi-physical field coupling analysis [21], the self-sensing capabilities of carbon fiber composites stem from the enhanced coupling among electrical, mechanical, thermal, and humidity fields, facilitated by the formation of a conductive network within the composite. By monitoring real-time variations in the composite’s electrical field and leveraging the coupling relationships, particularly between the electrical and mechanical fields, along with established theoretical models, it becomes possible to effectively infer the dynamic evolution of the mechanical field within the composite.
In light of this, this study developed a carbon fiber-reinforced similar simulation material (CFSSM) by incorporating carbon fibers into traditional similar materials and applied it in similar material simulation experiments. On this basis, a novel method for the quantitative characterization of mining-induced rock layer damage and fracture in similar simulation experiments was proposed. This study also reveals the damage propagation patterns and fracture sequencing characteristics of rock strata at different levels within the mining-induced overburden. These findings provide a technical foundation for in-depth investigation of detailed rock layer movement behaviors and the formulation of scientifically effective strategies for controlling rock strata.
2. Principle of Damage Self-Sensing in the CFSSM
In similar material simulations, incorporating a small amount of carbon fiber can significantly reduce the resistivity of CFSSM and greatly enhance the sensitivity of the resistivity response during internal damage, crack development, and fracture. The principle is that carbon fibers, when uniformly dispersed in similar materials, interconnect to form conductive pathways. When CFSSM is subjected to an external force, causing damage and fracture, the interconnections between carbon fibers detach, altering the internal conductive network structure and changing the material’s resistivity. Therefore, monitoring the resistivity of CFSSM allows for an analysis of the material’s damage state. Figure 1 illustrates the conductive path of CFSSM. When cracks appear in CFSSM, parts of the conductive network are severed, reducing the cross-sectional area of the low-resistivity conductive region, forcing current to pass through high-resistivity areas, which leads to an increase in resistivity between the two electrodes. By laying multiple carbon fiber layers in a similar model, the resistivity changes at different layers can be measured to determine the material’s damage condition and the development of mining-induced cracks.
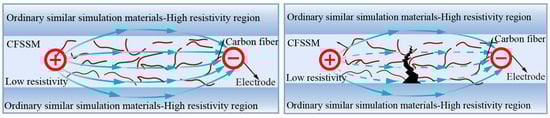
Figure 1.
Principles of damage self-monitoring in the carbon fiber composite materials.
3. Damage Self-Sensing Performance of CFSSM
3.1. Experimental Design and Specimen Preparation
To analyze the influence of carbon fiber on the damage self-sensing performance of similar simulation materials, this study selects a composition of sand, calcium carbonate, and gypsum as a similar material. Depending on the simulation requirements for different rock lithologies, the material ratios vary. For simulating fine sandstone, the mass ratio of sand to calcium carbonate to gypsum is 4:0.3:0.7 [19,36]. Based on this ratio, the experiment further explores the effects of carbon fiber. We incorporate different mass fractions of carbon fiber into similar materials, with gradients of 0% (control group), 0.5%, 1%, 1.5%, and 2%. The carbon fibers used were 6 mm long chopped carbon fibers (from Toray Industries, Inc. in Tokyo, Japan) whose main parameters (sourced from the productive parameters of the manufacturer) are given in Figure 2.
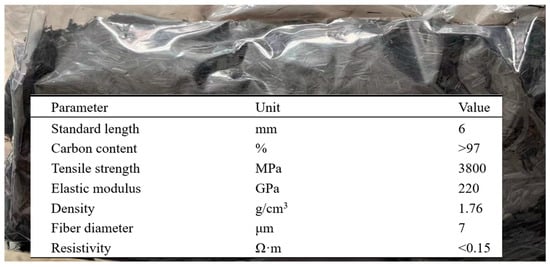
Figure 2.
Parameters of chopped carbon fiber material.
The preparation of CFSSM includes the following steps:
(1) Mix sand, calcium carbonate, and gypsum in a mixer for 3 min.
(2) Due to the hydrophobic nature of carbon fibers, they are difficult to disperse in water. Therefore, adding 1.6 wt% hydroxyethyl cellulose (which contains more polar groups) can significantly improve their dispersion [37]. Hydroxyethyl cellulose forms more hydrogen bonds with the carbon fibers through its polar groups, enhancing the hydrophilicity and wettability of the carbon fibers, thereby achieving the best dispersion effect. The mixture should be thoroughly stirred, and the mixture from Step 1 added to prepare CFSSM.
(3) Apply lubricant evenly on the inner walls of a mold sized 4 cm × 4 cm × 16 cm and fix a set of carbon fiber cloth at both ends of the mold to serve as electrodes. Then, pour CFSSM into the steel mold and compact it repeatedly with a rubber mallet to simulate the compaction process in similar material models, enhancing the density and uniformity of the composite material.
(4) Place the mold in a constant humidity room at a temperature of 23 °C and relative humidity of 100% for 2 days of curing. After curing, CFSSM should be in a slightly moist state without further water seepage, simulating the state before removing baffles in similar models.
(5) Allow the sample to dry naturally in a similar material simulation laboratory for 5 days. Once the sample has fully set, remove it from the mold, and continue drying for 21 days, simulating the state after the removal of baffles in similar models.
(6) To screen and polish the specimens after curing, strictly follow The ISRM Suggested Methods for Rock Characterization, Testing and Monitoring: 2007–2014. For each concentration group, three specimens were selected for testing.
Subsequently, a three-point bending test was conducted. The experimental setup comprised loading equipment, resistivity acquisition equipment, and acoustic emission (AE) monitoring equipment (Figure 3). The loading equipment was the MTS C64.106 rock mechanics testing system manufactured by MTS Industrial Systems (China) Co., Ltd. (Shanghai, China). The loading process was conducted in the displacement loading mode (loading rate of 0.3 mm/min).
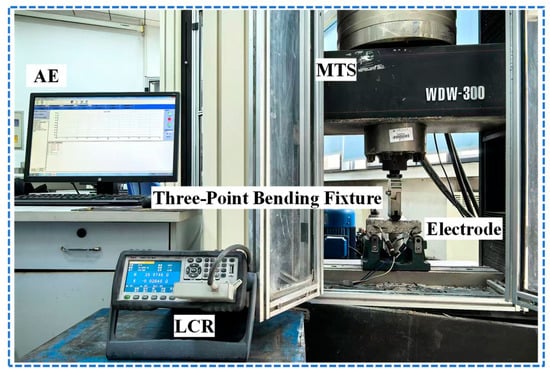
Figure 3.
Experimental testing system.
The resistivity acquisition equipment adopted the LCR developed by the Yisheng Victor Tech Co., Ltd. in Shenzhen, China. To avoid short-circuits, an insulating paper was placed between the specimens and metal parts of the testing machine to separate the specimens from the testing machine. To investigate resistivity changes caused by fracture development within the CFSSM during uniaxial compression tests, the resistivity change rate (RCR) of the CFSSM was defined as:
where Rn is the resistivity measured at the n-th time, and R0 is the resistivity measured before starting a test. Note: R0 is measured before starting the uniaxial compression test.
The AE monitoring equipment was the PCI-2 type AE monitoring instrument by Physical Acoustic Corporation, West Windsor Township, NJ, USA. The AE probe was arranged on the unloaded surface of the specimen. The pre-amplifier gain was locked to 40 dB, and the sampling rate was 1 MHz. Vaseline was applied between the AE probe and the specimen to improve the coupling condition of the contact surface and reduce the loss of AE signals. To quantify the damage characteristics of the CFCBM, the cumulative count coefficient was used as the variable, and the damage coefficient (D) was defined as:
where Ct is the cumulative count of AE at the time of t, and C0 is the cumulative count of AE at the time of complete damage.
3.2. Microstructure and Mineral Composition of CFSSM
After curing, the microstructure of the CFSSM was observed using a scanning electron microscope (SEM) (VEGA type, TESCAN, Brno-Kohoutovice, Czech Republic), as shown in Figure 4. It can be seen that the carbon fibers exhibit various orientations in the mortar and are interwoven with each other. Numerous crossover points are formed between the fibers, creating a stable network structure. Based on the analysis of mineral composition using X-ray diffractometer (XRD) (Model D8ADVANCE, Bruker, Berlin, Germany, the results (Figure 5) indicate that the main mineral composition of the cement is calcite (39.9%), dolomite (13.9%), CSH (13.3%), gypsum (12.5%), and albite (11.8%).
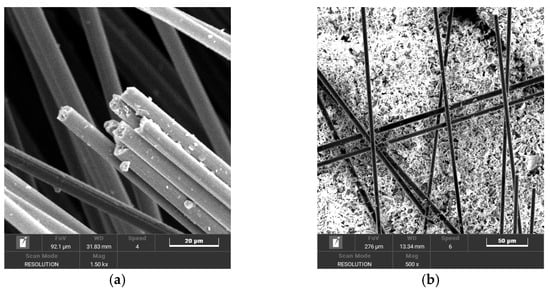
Figure 4.
The micromorphology characteristics of the materials; (a) carbon fiber; (b) CFSSM.
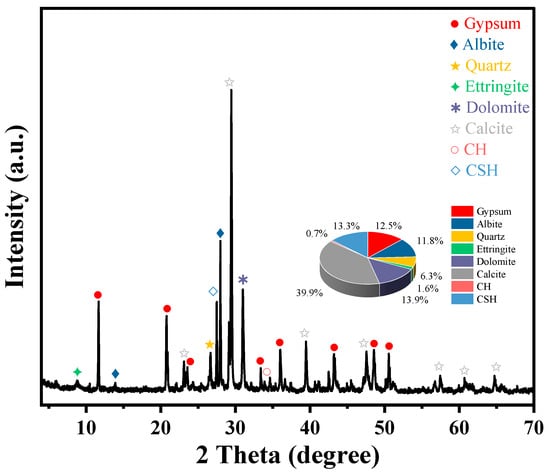
Figure 5.
The mineral composition of CFSSM.
3.3. Effect of Carbon Fiber Content on the Resistivity of CFSSM
During the curing process, the resistivities of the carbon fiber similar simulation material were monitored, and the results are shown in Figure 6. The initial resistivity of the specimens gradually decreased with the increase in the carbon fiber content. During curing, the resistivity of the specimens continuously increased, but the rate of increase diminished as the carbon fiber content rose. The initial resistivity of the baseline group was 310.0 Ω·m, which increased to 5170.2 Ω·m after 28 days of curing, a 16.6-fold increase. With the addition of 0.5%, 1%, and 1.5% carbon fiber contents, the initial resistivity of the samples decreased to 230.0 Ω·m, 110.9 Ω·m, and 37.2 Ω·m, respectively. After 28 days of curing, the resistivity increased to 1120.5 Ω·m, 260.1 Ω·m, and 71.7 Ω·m, respectively. When the carbon fiber content reached 2%, the initial resistivity dropped to 8.7 Ω·m, and after 28 days of curing, it rose to 9.8 Ω·m, an increase of only 12.6%. This indicates that the addition of carbon fibers significantly enhances the conductivity of the composite material, and as the carbon fiber content increases, the material’s conductive performance becomes more stable.
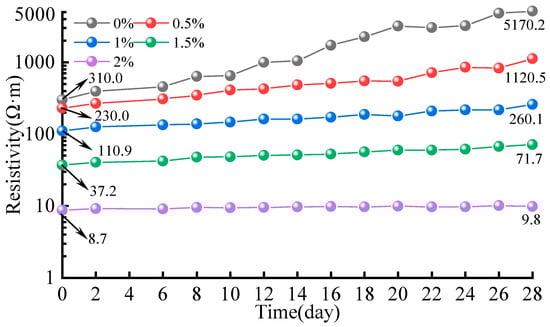
Figure 6.
Resistivity monitoring results of CFSSM during curing period.
3.4. The Corresponding Relationship of D-RCR for CFSSM
During the three-point bending test, the variation characteristics of RCR and D in CFSSM were continuously monitored, and the D–RCR curves were plotted. For each concentration, three specimens were tested. The final D–RCR curve for each concentration was obtained by fitting the curves of the three specimens, as shown in Figure 7. As the carbon fiber mass fraction increases, the correlation between RCR and D becomes more significant. Grouping by carbon fiber mass fraction, the correlations between RCR and D are as follows.
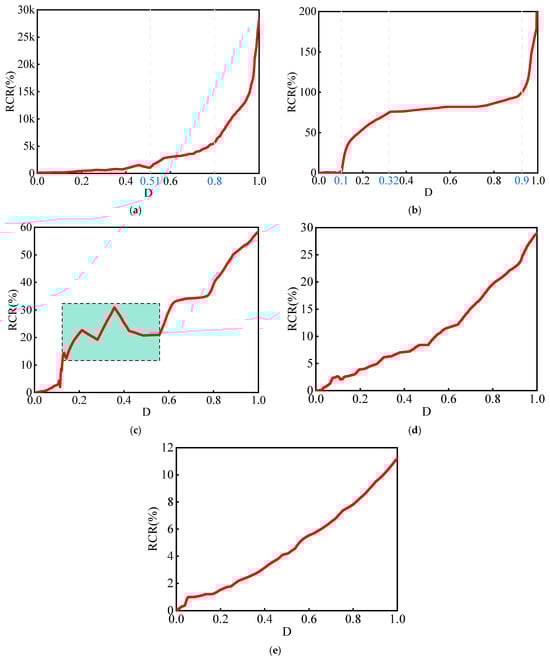
Figure 7.
The correspondence between RCR and D; (a) 0 wt%; (b) 0.5 wt%; (c) 1 wt%; (d) 1.5 wt%; (e) 2.0 wt%.
When the carbon fiber mass fraction falls between 0% and 1%, the correlation between RCR and D is ambiguous, as the two do not exhibit concurrent growth. In Figure 7a, with the D range from 0 to 0.51, RCR grows slowly and consistently lags behind D. In Figure 7b, with the D ranges from 0 to 0.1 and 0.32 to 0.9, RCR rises slowly. In Figure 7c, with the strain range from 0.12 to 0.56, RCR fluctuates for a long time and over a wide range.
Between 1.5% and 2% carbon fiber mass fraction, a significant correlation is observed between RCR and D, as both exhibit a generally consistent growth trend. In Figure 7e, both RCR and D increase together. The fluctuations are smaller and more stable compared with Figure 7d.
This indicates that as the carbon fiber content increases, the material’s ability to characterize rock mass damage and fracture progressively strengthens. When the carbon fiber content reaches 2 wt%, each point’s damage coefficient D corresponds to a unique RCR, which can effectively reflect the degree of damage in the specimen throughout the damage and fracture process. Therefore, CFSSM with 2 wt% carbon fiber content is selected for subsequent similar material simulation tests. Furthermore, when the RCR of this CFSSM exceeds 11.2%, it signifies that the material has been completely fractured.
This finding indicates that, when the mass fraction of carbon fibers exceeds 1.5%, the electrical conductivity of the CFSSM composite reaches the lower limit of the percolation threshold [29], thereby significantly enhancing its self-sensing capability for structural health monitoring. Beyond this critical concentration, a continuous conductive network is formed within the matrix, enabling efficient electron transport. This markedly improves the material’s sensitivity to structural changes, such as strain or cracking. The result not only verifies the effectiveness of carbon fibers as conductive fillers but also provides a theoretical basis for optimizing their content in sensing–functional composites.
The CFSSM with 2% carbon fiber content, which exhibits excellent self-sensing damage properties, is selected to establish the relationship between strain and RCR, as shown in Figure 8. As the strain in the CFSSM increases, the RCR initially remains nearly constant, indicating minimal changes in the material’s resistance at lower strain levels. This is followed by a gradual increase in RCR, which corresponds to the early stages of material deformation. Finally, at higher strain levels, the RCR experiences a sharp rise, reflecting significant damage or the onset of failure within the material structure, as evidenced by the steep slope in the graph. The figure clearly illustrates this transition, with a gradual change at first, followed by a marked increase in resistance, which signifies the material’s response to increasing strain and the progression of damage. This trend demonstrates the material’s sensitivity to strain, making it a useful tool for damage detection and monitoring in similar material model tests.
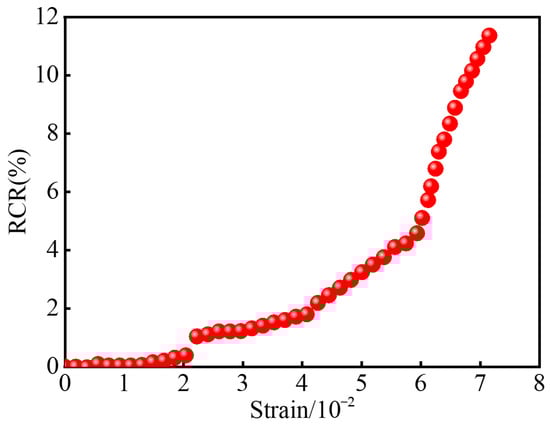
Figure 8.
RCR–Strain Relationship of 2% CFSSM.
4. Simulation Test of Damage and Fracture in Extremely Thick Sandstone Aquifers
4.1. Experimental Background and Design
The experimental mine is located in the Ordos mining area of China. The overlying strata of this mine widely contain a Cretaceous sandstone aquifer with a thickness ranging from approximately 112 to 262 m, characterized by its considerable thickness, widespread distribution, and high water content. The initial coal seam to be mined is the 2-2 seam, with a thickness of about 4.5 to 9 m, and it is situated at a distance of approximately 138 to 398 m from the aquifer. Mining this coal seam may damage or fracture the overlying thick aquifer, resulting in water resource loss and interference with underground safety production.
To investigate the damage to the thick aquifer during coal seam mining, a similar physical simulation study was conducted. Considering the overburden conditions of multiple borehole mining sites and the thickness of the initial coal seam, the design of rock layer arrangement and material ratios was developed, as shown in Table 1. The geometric similarity ratio of the experiment is 1:200, the density similarity ratio is 1:1.60, the stress similarity ratio is 1:560, and the Poisson’s ratio similarity is 1:1. The total model laying thickness is 170 cm, which corresponds to an actual thickness of 340 m according to the geometric similarity ratio. However, the actual burial depth of the initial coal seam is approximately 800 m, necessitating the application of an additional load equivalent to 460 m (11.5 MPa) above the model to simulate the real overburden conditions.

Table 1.
Parameters of rock laying and material ratio for similar physical simulation [19,36].
The experiment uses a steel-frame vertical model stand as the supporting platform. Various rock layer materials are prepared by mixing river sand, calcium carbonate (CaCO3), and gypsum powder (CaSO4·1/2H2O) with water. River sand forms the primary structural framework, while calcium carbonate and gypsum powder play key roles in the consolidation and shaping of the material. By adjusting the proportions of these three components and the amount of water added, a simulated material is created that closely matches the mechanical properties of actual rock layers, providing a reliable material foundation for the experimental model.
To reduce experimental errors, the river sand is pre-treated by sieving, using screens with different mesh sizes to control its particle size and ensure it meets the required standards. Next, river sand, calcium carbonate, and gypsum powder are accurately weighed according to the pre-designed proportions. After thorough mixing in a mixing tank, the materials are added layer by layer to the model stand and compacted using a compaction hammer. Due to the limited height of the model stand, which cannot fully simulate the entire thickness of the geological layers, a pressure pump is installed at the top of the model. By adjusting the applied pressure, the missing overburden weight is simulated, compensating for the lack of overlying stress in the model and ensuring the accuracy and realism of the experimental environment.
During the model setup, CFSSM measurement lines were laid within the rock layers No. 4, No. 6, and No. 8. Specifically, one line was placed in each layer No. 4 and No. 6, while three lines were positioned at the top and bottom of the layer numbered No. 8. Copper rods were installed at 10 cm intervals within each monitoring layer to serve as electrodes. By observing changes in resistance between these electrodes, microfracture monitoring in localized areas can be effectively achieved.
During the mining process in the model, a photogrammetry system was used to record the movement of the overburden above the working face, while the resistance of the CFSSM was monitored using a digital LCR bridge. The detailed arrangement plan is illustrated in Figure 9.
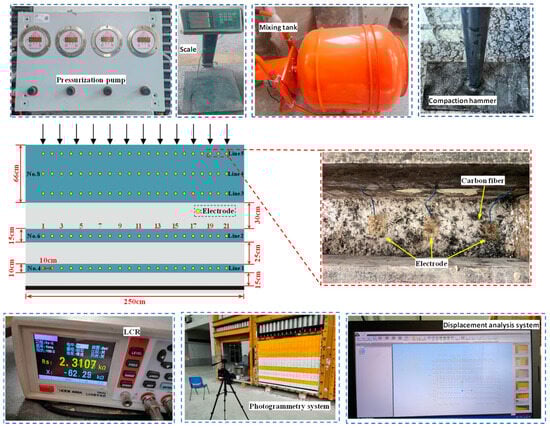
Figure 9.
Model layout diagram.
4.2. Dynamic Characteristics of Fracture Development—Close in Overlying Strat
During the advancement of the workface, the reflection coefficient (RCR) of the overlying strata at different mining stages was monitored, as shown in Figure 10. The variations in RCR can be used to infer the dynamic processes of fracture development and closure within the overlying strata. Taking the No. 2 overlying strata as an example, when the coal seam is mined to a depth of 40 cm, the RCR shows a slight increase, indicating the initiation of damage and fracture development in the strata. As the coal seam advances to 60 cm, the RCR rises to 18.1, marking the complete fracturing of the strata. With continued mining, the RCR decreases rapidly, suggesting that the strata are entering a compaction phase, during which internal fractures begin to close. When the coal seam reaches 80 cm, the RCR exhibits minor dynamic fluctuations. This is attributed to the proximity of the No. 2 overlying strata to the coal seam, which leads to a higher degree of damage and difficulty in achieving complete fracture closure. In contrast, the No. 4 strata shows an RCR approaching zero after fracturing and compaction, indicating that the fractures within the No. 4 strata are almost completely closed. This is due to the No. 4 strata being farther from the coal seam and thus less affected by mining activities.
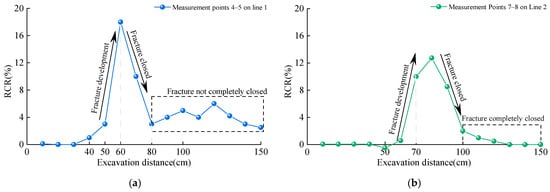
Figure 10.
Dynamic characteristics of fracture development—close in overlying strata; (a) Line 1; (b) Line 2.
4.3. Deformation Characteristics of the Very Thick Sandstone Aquifer
The initial coal seam was advanced 200 cm, with an extraction step distance of 5 cm, resulting in 40 extraction cycles. After completing the working face extraction, the situation is shown in Figure 11.
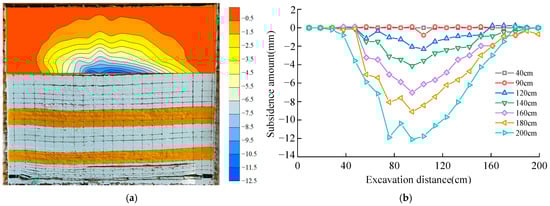
Figure 11.
Deformation characteristics of the very thick sandstone aquifer; (a) the deformation of the thick sandstone aquifer; (b) the deformation values at the bottom of the thick aquifer.
Figure 11a illustrates the deformation cloud map of the thick sandstone aquifer after the completion of the workface mining. At this point, the aquifer remains in a stable suspended state, with only minor bending and subsidence occurring in the middle of the workface. Its internal structure remains intact, and no significant crack development is observed.
Figure 11b shows the deformation values at the bottom of the thick aquifer during the excavation process. In the early stages of workface advancement, the thick sandstone aquifer is not affected by mining activities and thus exhibits no deformation. When the workface progresses to 90 cm, the aquifer begins to deform, but the deformation amount is only −0.5 mm. As the workface advances, the aquifer’s deformation range gradually expands, and the deformation amount increases. By the end of the workface retreat, deformation is observed within approximately a 90 cm range in the middle of the aquifer, with a maximum deformation amount of −12 mm. This indicates that the thick key layer possesses considerable strength and can maintain a stable suspended state even after extensive mining.
4.4. Damage Distribution Characteristics of a Very Thick Sandstone Aquifer
Figure 12 illustrates the D variation pattern of different measurement lines within the thick sandstone aquifer during the mining process. According to the results shown, after the workface advancement, varying degrees of damage and failure occurred in different layers within the thick sandstone aquifer. Specifically, the damage and fracturing were most severe in the center of the workface. The maximum D values for measurement lines 3, 4, and 5 above this area were 0.43, 0.19, and 0.12, respectively. It is noteworthy that the damage and failure regions of the thick key layer correspond to its deformation characteristics, with the area experiencing the greatest deformation also being the most severely damaged.
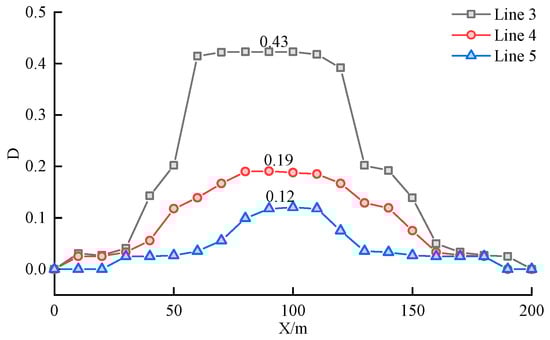
Figure 12.
Damage distribution of the very thick aquifer.
The damage distribution characteristics of the thick aquifer at the same stratum level show that the central region experiences consistent damage and fracturing, while the damage decreases rapidly towards the sides, with the outermost areas almost unaffected by mining activities, resulting in a damage coefficient D of 0. Taking Line 3 at the bottom of the thick aquifer as an example, in the central region from 45 to 90 m, the damage values remain around 0.43. In the ranges from 20 to 45 m and 90 to 120 m, the damage values quickly decrease from 0.43 to 0.04. In the ranges of 0 to 20 m and 120 to 150 m, the areas are almost unaffected by mining, with damage values approaching 0.
4.5. Damage Evolution Process of a Very Thick Sandstone Aquifer
To understand the deformation and damage evolution process of the thick sandstone aquifer, the displacement and damage coefficient (D) in the central region of the thick sandstone aquifer were selected for analysis. This measurement point also represents the location of the maximum displacement along the measurement line in the thick sandstone aquifer. Figure 13 presents the variation curves of displacement and damage coefficient D of the thick sandstone aquifer during the workface advancement process.
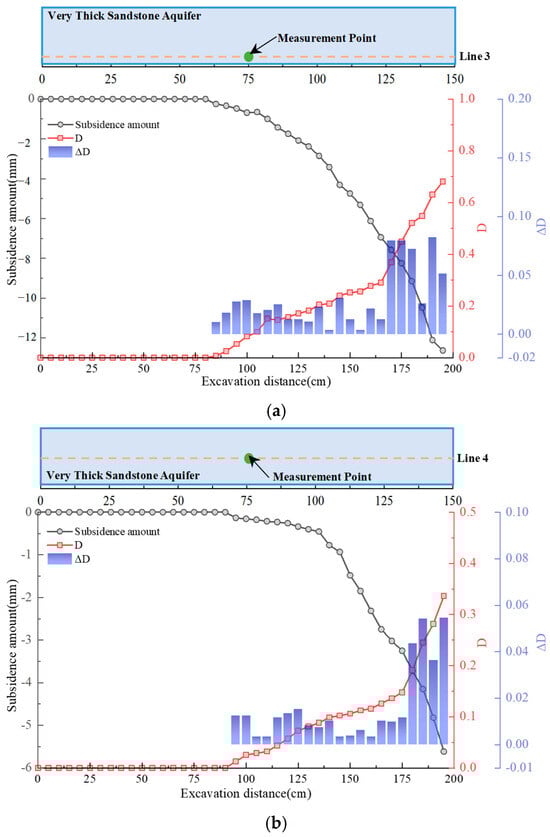
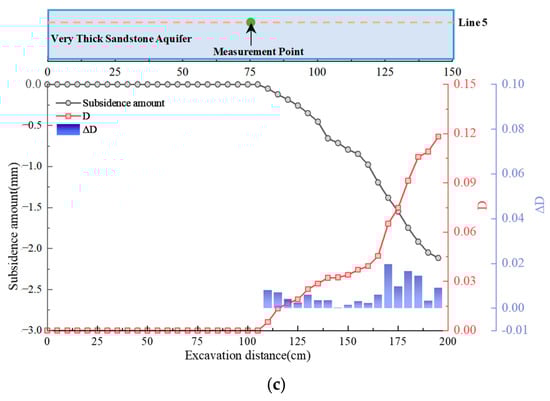
Figure 13.
Damage accumulation characteristics of very thick sandstone aquifers during coal mining; (a) Line 3; (b) Line 4; (c) Line 5.
Figure 13a illustrates the response of Line 3, located at the bottom of the very thick sandstone aquifer. As mining progresses to 85 m, vertical displacement is first observed at the central measurement point, indicating early deformation. The damage variable D increases rapidly, ultimately reaching 0.69, while the damage increment ΔD exhibits a concentrated distribution in the middle and lower regions. This reflects sustained crack development and significant damage accumulation, although complete structural failure has not occurred. This confirms that the basal interface is the most vulnerable zone during the early mining stages.
Figure 13b illustrates the response of Line 4, located in the middle section of the very thick sandstone aquifer. When the mining depth reached 95 m, deformation began at the central measurement point, and the RCR gradually increased. The damage variable D subsequently rose more rapidly, reaching a final value of 0.34. The damage increment ΔD was concentrated primarily in the later stages of mining, indicating delayed fracture development compared with the bottom layer. Overall, the middle section experienced moderate damage evolution, maintaining better structural integrity than the lower zone.
Figure 13c illustrates the response of Line 5, located at the top of the very thick sandstone aquifer. When mining reached a depth of 110 m, minor deformation occurred in the overburden, with the RCR slowly increasing. The damage variable D reached a final value of 0.12, indicating a relatively slow damage evolution at the top compared with the bottom and middle sections. The damage increment ΔD exhibited small fluctuations, suggesting a slower and more moderate fracture development at the top, with the structure remaining relatively stable during mining.
In summary, the thick aquifer exhibits a bottom-to-top progressive damage and fracture pattern under mining disturbance. The basal interface experiences early-stage fracturing and sustained crack development, showing significant damage and fracture propagation. The middle layer enters an accelerated fracture phase in the later stages of mining, characterized by dense crack formation, while the top layer remains relatively intact, exhibiting a slower rate of damage evolution.
5. Discussion
5.1. Advantages
Traditional similar material simulations are typically composed of sand, gypsum, and calcium carbonate. Due to the lack of sufficient cementing agents to bind the individual components, the resulting materials often exhibit high internal porosity. When acoustic monitoring techniques such as acoustic emission (AE) or ultrasonic testing are applied, the acoustic signals tend to dissipate within the porous medium, leading to potential failure in damage detection. However, when short-cut carbon fibers are incorporated into the material, their dispersion within the matrix can reduce porosity [38] and improve the reliability of acoustic signal transmission. In contrast, when using tag position monitoring methods, the sensors or markers are usually placed on the surface of the model. These surface-mounted tags are prone to detachment during material collapse or deformation, introducing measurement errors. Moreover, even in the absence of noticeable deformation or displacement, microcrack damage may still develop internally, which is typically beyond the detection capability of this monitoring technique.
5.2. Limitation
In laboratory, similar material simulations, the self-sensing functionality of carbon fibers depends on forming a continuous and uniform conductive network within the material. However, in the actual preparation process, carbon fibers are often difficult to distribute uniformly within the material [39]. Due to their low density, tendency to entangle, and significant influence from electrostatic forces during mixing, carbon fibers tend to agglomerate or float, leading to enhanced conductivity in local areas, while other regions cannot sense.
This uneven distribution directly weakens the overall self-sensing monitoring performance of the material. Signals may become overly concentrated in certain areas, producing “short-circuit” responses, while other areas lack conductive pathways, making it impossible to detect microdamage. Furthermore, the accumulation of carbon fibers in some areas may obscure the development of fine cracks, leading to distorted monitoring results. To address this issue, future work could consider replacing carbon fibers with easily dispersible carbon nanotubes (CNTs) [40] in similar materials. Due to their unique structure and better dispersibility, carbon nanotubes can distribute more evenly within the material, forming a stable conductive network that enhances self-sensing performance. Additionally, superconductive carbon black also exhibits good dispersibility and conductivity, serving as an alternative to carbon fibers. It can reduce dispersion problems while maintaining good conductivity, thus improving the accuracy and reliability of damage monitoring.
6. Conclusions
(1) A carbon fiber composite material with health self-sensing characteristics was developed. By incorporating carbon fibers into the simulated material, a stable physical conductive network structure was constructed, significantly reducing the material’s resistivity. Compared with ordinary simulated materials, when the carbon fiber content reaches 2%, the resistivity decreases by 98.5%. During the bending failure process, the material’s resistance change rate (RCR) and damage coefficient (D) exhibit a consistent change trend, with a unique mapping relationship between the two, fully demonstrating its significant self-sensing damage characteristics.
(2) Carbon fiber composites’ resistance change rates (RCRs) in overlying rock can accurately characterize the development degree and distribution range of mining-induced fractures. When the RCR continues to increase, it indicates that the overlying rock in this range is in the damage fracture stage, with mining-induced fractures continuously developing and expanding; whereas when the RCR gradually decreases, it indicates that the overlying rock in this range enters the compaction stage, with mining-induced fractures gradually being compacted and closed.
(3) The damage fracture in a very thick sandstone aquifer exhibits a progressive evolution pattern from bottom-to-top: at the early stage of mining, noticeable damage fractures appear at the bottom of the very thick key layer, which continuously expand and develop as mining progresses, eventually approaching the critical value of failure; the damage evolution process in the middle of the very thick key layer shows clear stage characteristics, where upon reaching the critical mining range, the area enters an accelerated fracture stage, manifested by a sudden leap in the material’s RCR. Since the top of the very thick key layer is far from the mining influence source, it is subjected to relatively minor disturbances, resulting in slower damage development.
Author Contributions
For this paper, X.G. and W.Z. put forward the research ideas and directions, B.Z. organized the whole structure and wrote the paper, B.Z. and X.G. collected the data from the experiment, W.Z. and B.Z. revied the entire paper, J.D. and B.Z. corrected the errors in the English translation version, P.G. and J.D. analysed the experiment data. All authors have read and agreed to the published version of the manuscript.
Funding
The work reported here was financially supported by the Independent Research Project of State Key Laboratory for Fine Exploration and Intelligent Development of Coal Resources, CUMT (Grant No. SKLCRSM22X004).
Institutional Review Board Statement
Not applicable.
Informed Consent Statement
Not applicable.
Data Availability Statement
The original contributions presented in this study are included in the article. Further inquiries can be directed to the corresponding author.
Acknowledgments
We gratefully acknowledge the technical support provided by Shan Ning.
Conflicts of Interest
The authors declare no conflicts of interest.
References
- Yang, Y.; Yue, H.; Zhao, Y.; Zhang, S.; Zhang, J.; Wang, Z.; Yang, W. Experimental Study on Ratio Optimization of Similar Materials for Underground Mining of Shendong Coalfield: A Case Study of Shangwan Coal Mine. Processes 2023, 11, 1352. [Google Scholar] [CrossRef]
- Zhang, J.; Qin, X.; Liu, S.; Su, H.; Yang, Z.; Zhang, G. Study on Overburden Fracture and Structural Distribution Evolution Characteristics of Coal Seam Mining in Deep Large Mining Height Working Face. Sustainability 2023, 15, 13365. [Google Scholar] [CrossRef]
- Zhu, W.; Xu, J.; Xu, J.; Chen, D.; Shi, J. Pier-Column Backfill Mining Technology for Controlling Surface Subsidence. Int. J. Rock Mech. Min. Sci. 2017, 96, 58–65. [Google Scholar] [CrossRef]
- Li, H.; Guo, G.; Zha, J. Study on Time-Varying Characteristics of Similar Material Model Strength and the Regulation Measures. Environ. Earth Sci. 2017, 76, 518. [Google Scholar] [CrossRef]
- Zhu, W.; Yu, S.; Xuan, D.; Shan, Z.; Xu, J. Experimental Study on Excavating Strip Coal Pillars Using Caving Zone Backfill Technology. Arab. J. Geosci. 2018, 11, 554. [Google Scholar] [CrossRef]
- Zheng, K.; Xuan, D.; Li, J. Study on Fluid-Solid Characteristics of Grouting Filling Similar-Simulation Materials. Minerals 2022, 12, 502. [Google Scholar] [CrossRef]
- Zha, J.; Li, H.; Guo, G.; Wang, J. Influence of Temperature and Humidity on Similar Material and Its Control Measures. Environ. Earth Sci. 2017, 76, 740. [Google Scholar] [CrossRef]
- Chen, S.; Wang, H.; Zhang, J.; Xing, H.; Wang, H. Experimental Study on Low-Strength Similar-Material Proportioning and Properties for Coal Mining. Adv. Mater. Sci. Eng. 2015, 2015, 696501. [Google Scholar] [CrossRef]
- Wu, G.M.; Bai, H.B.; Wu, L.Y.; He, S.X. Study on the Influence of Bedrock Thickness on Deformation and Failure of Overlying Soil Layer in Thin Bedrock Coal Seam Mining. J. Min. Sci. 2020, 56, 518–528. [Google Scholar] [CrossRef]
- Yang, K.; Fu, Q.; Liu, Q.; He, X.; Lyu, X. Evolution of Mining-Induced Stress in Downward Mining of Short-Distance Multiseam. Geofluids 2022, 2022, 3305734. [Google Scholar] [CrossRef]
- Ding, L.; Liu, Y. Three-Dimensional Physical Simulation on Overlying Strata’s Motion Rule in Shallow Seam. Fresenius Environ. Bull. 2017, 26, 5314–5322. [Google Scholar]
- Xiong, Y.; Kong, D.; Song, G.; He, Y. Failure Mechanism and 3D Physical Modeling Test of Coal Face Pyramid Sliding in Steeply Inclined Working Face: A Case Study. Eng. Fail. Anal. 2024, 159, 108064. [Google Scholar] [CrossRef]
- Zhang, D.; Duan, Y.; Du, W.; Chai, J. Experimental Study on Physical Similar Model of Fault Activation Law Based on Distributed Optical Fiber Monitoring. Shock Vib. 2021, 2021, 4846977. [Google Scholar] [CrossRef]
- Xie, J.; Qu, Q.; Zhu, W.; Wang, X.; Xu, J.; Ning, S.; Hou, T.; Luo, X. Distributed Strain Monitoring of Overburden Delamination Propagation at a Deep Longwall Mine. Int. J. Rock Mech. Min. Sci. 2023, 171, 105589. [Google Scholar] [CrossRef]
- Zhang, Y.; Liu, Z.; Guo, D. Study on Simulation and Monitoring of Overburden Failure Height of Multifull-Mechanized Caving Mining. In Proceedings of the 2010 Proceedings of the International Conference on Mine Hazards Prevention and Control, Qingdao, China, 15–17 October 2010; Wang, C.Q., Bu, C.S., Guo, W.J., Cheng, W.M., Eds.; Atlantis Press: Paris, France, 2010; Volume 12, p. 548. [Google Scholar]
- Li, L.; Kong, D.; Liu, Q.; Cai, H.; Chen, L. Study on Law and Prediction of Surface Movement and Deformation in Mountain Area under Repeated Mining of Shallow Coal Seam. Bull. Eng. Geol. Environ. 2023, 82, 76. [Google Scholar] [CrossRef]
- Zhang, X. The Application of Image J in Geosciences Image Processing. In Proceedings of the Near-Surface Geophysics And Environment Protection, Changsha, China, 15–18 June 2012; Liu, J., Xu, Y., Dai, Q., Zhu, D., Guo, R., Feng, D., Yan, J., Liu, H., Tong, X., Zhang, D., et al., Eds.; Science Press USA Inc.: Monmouth Junction, NJ, USA, 2012; pp. 383–385. [Google Scholar]
- Li, D.; Zhang, J.; Wang, C.; Jiang, F. Propagation Patterns of Microseismic Waves in Rock Strata during Mining: An Experimental Study. Int. J. Miner. Metall. Mater. 2019, 26, 531–537. [Google Scholar] [CrossRef]
- Xie, J.; Ning, S.; Qu, Q.; Zhu, W.; Zhao, B.; Xu, J. A Carbon Nanocomposite Material Used in the Physical Modelling of the Overburden Subsidence Process. Nanomaterials 2023, 13, 2962. [Google Scholar] [CrossRef]
- Kang, Z.; Zhang, J.; Li, N.; Yang, Y.; Lv, T.; Lu, J. Development of Self-Sensing Cement Composites by Incorporating Hybrid Biochar and Nano Carbon Black. Cem. Concr. Compos. 2024, 153, 105708. [Google Scholar] [CrossRef]
- Ding, S.; Dong, S.; Ashour, A.; Han, B. Development of Sensing Concrete: Principles, Properties and Its Applications. J. Appl. Phys. 2019, 126, 241101. [Google Scholar] [CrossRef]
- Han, B.; Guan, X.; Ou, J. Electrode Design, Measuring Method and Data Acquisition System of Carbon Fiber Cement Paste Piezoresistive Sensors. Sens. Actuator A-Phys. 2007, 135, 360–369. [Google Scholar] [CrossRef]
- Ivorra, S.; Garces, P.; Catala, G.; Andion, L.G.; Zornoza, E. Effect of Silica Fume Particle Size on Mechanical Properties of Short Carbon Fiber Reinforced Concrete. Mater. Des. 2010, 31, 1553–1558. [Google Scholar] [CrossRef]
- Laflamme, S.; Ubertini, F. Self-Sensing Materials for Nondestructive Evaluation. Mater. Eval. 2020, 78, 526–536. [Google Scholar] [CrossRef]
- Vaidya, S.; Allouche, E.N. Strain Sensing of Carbon Fiber Reinforced Geopolymer Concrete. Mater. Struct. 2011, 44, 1467–1475. [Google Scholar] [CrossRef]
- Borke Birgin, H.; D’Alessandro, A.; Favaro, M.; Sangiorgi, C.; Laflamme, S.; Ubertini, F. Field Investigation of Novel Self-Sensing Asphalt Pavement for Weigh-in-Motion Sensing. Smart Mater. Struct. 2022, 31, 085004. [Google Scholar] [CrossRef]
- Chu, H.; Chen, J. The Experimental Study on the Correlation of Resistivity and Damage for Conductive Concrete. Cem. Concr. Compos. 2016, 67, 12–19. [Google Scholar] [CrossRef]
- Dong, W.; Li, W.; Tao, Z.; Wang, K. Piezoresistive Properties of Cement-Based Sensors: Review and Perspective. Constr. Build. Mater. 2019, 203, 146–163. [Google Scholar] [CrossRef]
- Chen, B.; Wu, K.; Yao, W. Conductivity of Carbon Fiber Reinforced Cement-Based Composites. Cem. Concr. Compos. 2004, 26, 291–297. [Google Scholar] [CrossRef]
- Zuo, J.; Yao, W.; Liu, X.; Qin, J. Sensing Properties of Carbon Nanotube–Carbon Fiber/Cement Nanocomposites. J. Test. Eval. 2012, 40, 20120092. [Google Scholar] [CrossRef]
- Segura, I.; Faneca, G.; Torrents, J.M.; Aguado, A. Self-Sensing Concrete Made from Recycled Carbon Fibres. Smart Mater. Struct. 2019, 28, 105045. [Google Scholar] [CrossRef]
- Sun, M.; Li, Z.; Mao, Q.; Shen, D. Study on the Hole Conduction Phenomenon in Carbon Fiber-Reinforced Concrete. Cem. Concr. Res. 1998, 28, 549–554. [Google Scholar] [CrossRef]
- Wang, Y.; Wang, Y.; Wan, B.; Han, B.; Cai, G.; Li, Z. Properties and Mechanisms of Self-Sensing Carbon Nanofibers/Epoxy Composites for Structural Health Monitoring. Compos. Struct. 2018, 200, 669–678. [Google Scholar] [CrossRef]
- Ou, J. Research and Practice of Intelligent Sensing Technologies in Civil Structural Health Monitoring in the Mainland of China. Proc. SPIE—Int. Soc. Opt. Eng. 2006, 6176, 293–304. [Google Scholar] [CrossRef]
- Han, B.; Yu, X.; Kwon, E. A Self-Sensing Carbon Nanotube/Cement Composite for Traffic Monitoring. Nanotechnology 2009, 20, 445501. [Google Scholar] [CrossRef]
- Xu, J.; Juan, P.; Zhu, W. Movement Laws of the Overlying Strata at the Working Face Ends and Their Effects on the Surface Deformation. Minerals 2022, 12, 1485. [Google Scholar] [CrossRef]
- Chuang, W.; Lei, P.; Bing-Liang, L.; Ni, G.; Li-Ping, Z.; Ke-Zhi, L. Influences of Molding Processes and Different Dispersants on the Dispersion of Chopped Carbon Fibers in Cement Matrix. Heliyon 2018, 4, e00868. [Google Scholar] [CrossRef] [PubMed]
- Wang, B.; Zhang, Y.; Ma, H. Porosity and Pore Size Distribution Measurement of Cement/Carbon Nanofiber Composites by 1H Low Field Nuclear Magnetic Resonance. J. Wuhan Univ. Technol.-Mat. Sci. Edit. 2014, 29, 82–88. [Google Scholar] [CrossRef]
- Gao, J.; Wang, Z.; Zhang, T.; Zhou, L. Dispersion of Carbon Fibers in Cement-Based Composites with Different Mixing Methods. Constr. Build. Mater. 2017, 134, 220–227. [Google Scholar] [CrossRef]
- Kojima, K.; Kosugi, N.; Jintoku, H.; Kobashi, K.; Okazaki, T. Preparing a Liquid Crystalline Dispersion of Carbon Nanotubes with High Aspect Ratio. Beilstein J. Org. Chem. 2024, 20, 52–58. [Google Scholar] [CrossRef]
Disclaimer/Publisher’s Note: The statements, opinions and data contained in all publications are solely those of the individual author(s) and contributor(s) and not of MDPI and/or the editor(s). MDPI and/or the editor(s) disclaim responsibility for any injury to people or property resulting from any ideas, methods, instructions or products referred to in the content. |
© 2025 by the authors. Licensee MDPI, Basel, Switzerland. This article is an open access article distributed under the terms and conditions of the Creative Commons Attribution (CC BY) license (https://creativecommons.org/licenses/by/4.0/).