Article

Honey as a Bioindicator: Pollution’s Effects on Its Quality in Mining vs. Protected Sites

by
Mirel Glevitzky
1,2,
Mihai-Teopent Corcheş
1,*,
Maria Popa
1 and
Mihaela Laura Vică
3,4
1
Faculty of Informatics and Engineering, “1 Decembrie 1918” University of Alba Iulia, 5 Gabriel Bethlen Street, 510009 Alba Iulia, Romania
2
Faculty of Engineering Hunedoara, Politehnica University Timişoara 5, Revolutiei Street, 331128 Hunedoara, Romania
3
Department of Cellular and Molecular Biology, “Iuliu Hațieganu” University of Medicine and Pharmacy, 6 Louis Pasteur Street, 400012 Cluj-Napoca, Romania
4
Institute of Legal Medicine, 3-5 Clinicilor, Street, 400006 Cluj-Napoca, Romania
*
Author to whom correspondence should be addressed.
Appl. Sci. 2025, 15(13), 7297; https://doi.org/10.3390/app15137297 (registering DOI)
Submission received: 23 May 2025 / Revised: 25 June 2025 / Accepted: 26 June 2025 / Published: 28 June 2025
(This article belongs to the Special Issue Advances in Honeybee and Their Biological and Environmental Threats)

Abstract

Heavy metal toxicity is an ecological concern in regions affected by processes like mining. This study underscores the potential of honey as a natural bioindicator for monitoring and assessing the levels of environmental contamination in mining-impacted areas. The study evaluated the physico-chemical characteristics, heavy metal content, and antimicrobial activity of honey samples collected from areas adjacent to former mining sites, as well as from protected areas within the same county in Romania. The results revealed significant differences between the two categories of locations. The samples from the protected areas showed higher levels of bioactive compounds (phenols and flavonoids) and exhibited stronger antibacterial activity. The heavy metal analysis indicated significantly higher concentrations of lead, cadmium, and iron in the honey samples from former mining areas compared to those from protected zones, suggesting pronounced industrial-origin contamination. The maximum recorded values were for Pb (0.607 mg/kg), Cd (0.02 mg/kg), Fe (12.131 mg/kg), Cu (0.545 mg/kg), and Zn (6.170 mg/kg). Their antimicrobial activity was tested against several bacterial and fungal strains, including Escherichia coli, Salmonella enteritidis, Pseudomonas aeruginosa, Staphylococcus aureus, Staphylococcus epidermidis, Bacillus cereus, Listeria monocytogenes, Candida albicans, Aspergillus niger, Aspergillus flavus, Penicillium chrysogenum, Rhizopus stolonifer, Fusarium oxysporum, and Alternaria alternata. The antibacterial and antifungal activity were more pronounced in the honey samples from the protected areas. These findings support the use of honey as a bioindicator of environmental quality and highlight the influence of its geographical origin on its therapeutic and chemical properties.

1. Introduction

Honey is a complex natural substance rich in bioactive compounds of both plant and bee origin [1]. Its chemical composition varies significantly depending on the botanical source, seasonal dynamics, and environmental conditions [2]. As a natural bioindicator, honey can accumulate and reflect environmental pollutants, providing insight into ecosystem health and contamination levels [3]. In areas impacted by mining activities, the presence of contaminants, such as heavy metals, can further influence the quality and safety of honey, reflecting the local ecological status [4]. Honey is regarded as a complex bioindicator of environmental contamination, particularly in mining-affected areas, as the foraging activity of honeybees facilitates their direct and prolonged exposure to airborne and soil-associated pollutants [5]. Honeybee health is also increasingly compromised by a combination of biotic (parasites, pathogens) and abiotic (pesticides, pollutants, and climate change) stressors. These stressors can weaken bees’ innate immune systems, increasing their vulnerability to infections and environmental hazards [6]. Modern strategies to protect colony health aim to reduce exposure and support immune resilience through natural compounds and innovative technologies [7].
Globally, the number of bee colonies has increased by approximately 85% over the past six decades, surpassing 100 million hives according to the FAO [8]. However, this positive trend has been overshadowed by the intensification of industrial and urban pollution, which exposes bees and bee products to increasingly higher concentrations of particulate matter, pesticides, fertilizers, industrial emissions, heavy road traffic, and various atmospheric deposits [9]. Bees are increasingly exposed to environmental contaminants, especially in urban and industrial areas, where air pollution is intense. One of the most important sources of contamination is particulate matter (PM10 and PM2.5), which can carry heavy metals such as lead, nickel, cadmium, and arsenic. These particles settle on the leaves and flowers of plants, where they are then unintentionally collected by bees along with nectar and pollen [10]. The transport of airborne dust containing heavy metals and their deposition onto plant leaves is intensified in areas affected by mining activities, where the lack of vegetation promotes wind erosion. These particles can be carried by wind over considerable distances and may settle on the surfaces of leaves and flowers, which, due to their morphology, more easily retain atmospheric particles [11]. Regarding honey, bees can accumulate heavy metals from contaminated pollen, nectar, and water, as well as through direct contact with airborne particles that settle on leaves and flowers and can adhere to their bodies. Plants can also absorb heavy metals directly from the soil through their roots, with the metals being translocated to the stems, leaves, flowers, nectar, and pollen [12].
Additionally, emissions from industry, the burning of fossil fuels, and heavy road traffic contribute to the release of significant amounts of heavy metals into the atmosphere, which then enter the beekeeping ecosystem [13]. Even agricultural practices, such as the use of fertilizers and pesticides, can promote the accumulation of these toxic elements in the soil, from which they are absorbed by nectar-producing plants [14]. All of these factors lead to the progressive contamination of honey and other bee products, putting both the health of bee colonies and the safety of human consumers at risk. Given its sensitivity to environmental changes, honey serves not only as a valuable food product but also as a biological matrix for monitoring pollution levels [15]. In mining-affected regions, the accumulation of toxic elements, such as lead, cadmium, and arsenic, in honey may provide insight into the extent of environmental contamination and potential risks to ecosystem and human health [16].
In various geographic regions, the contamination of soil and water resources with heavy metals has become a growing environmental concern. This phenomenon is particularly pronounced in areas characterized by high levels of anthropogenic activity, such as urbanized and industrialized zones, mining and fossil fuel extraction sites, and intensively managed agricultural landscapes [17]. The persistence and mobility of these toxic elements in the environment pose significant risks to ecological systems and human health, making their monitoring and assessment a priority in environmental research and policy [18].
The accumulation of heavy metals in Apis mellifera and its products is closely associated with the ambient atmospheric concentrations, with the particulate matter (PM10) levels playing a significant role in the elevated detection of lead (Pb) and nickel (Ni) within these organisms [19]. Given the risks that heavy metal contamination poses to human health, it is essential that such correlations with other pollution factors be regulated through strict standards [20], as is the case with Regulation (EC) No. 1881/2006. It highlights the importance of food safety by establishing strict limits for contaminants, and in the case of honey, the focus is on lead (Pb), with a maximum allowable limit of 0.10 mg/kg due to its toxic effects on human health [21].
The aim of this study is to monitor the heavy metal content in honey and to highlight its variation based on the specific characteristics of the area where an apiary is located, by comparing regions affected by mining activities with protected natural areas. The study also seeks to correlate contamination levels with the physico-chemical properties and antimicrobial activity of bee products, emphasizing the potential of honey as a bioindicator of environmental quality.

2. Materials and Methods

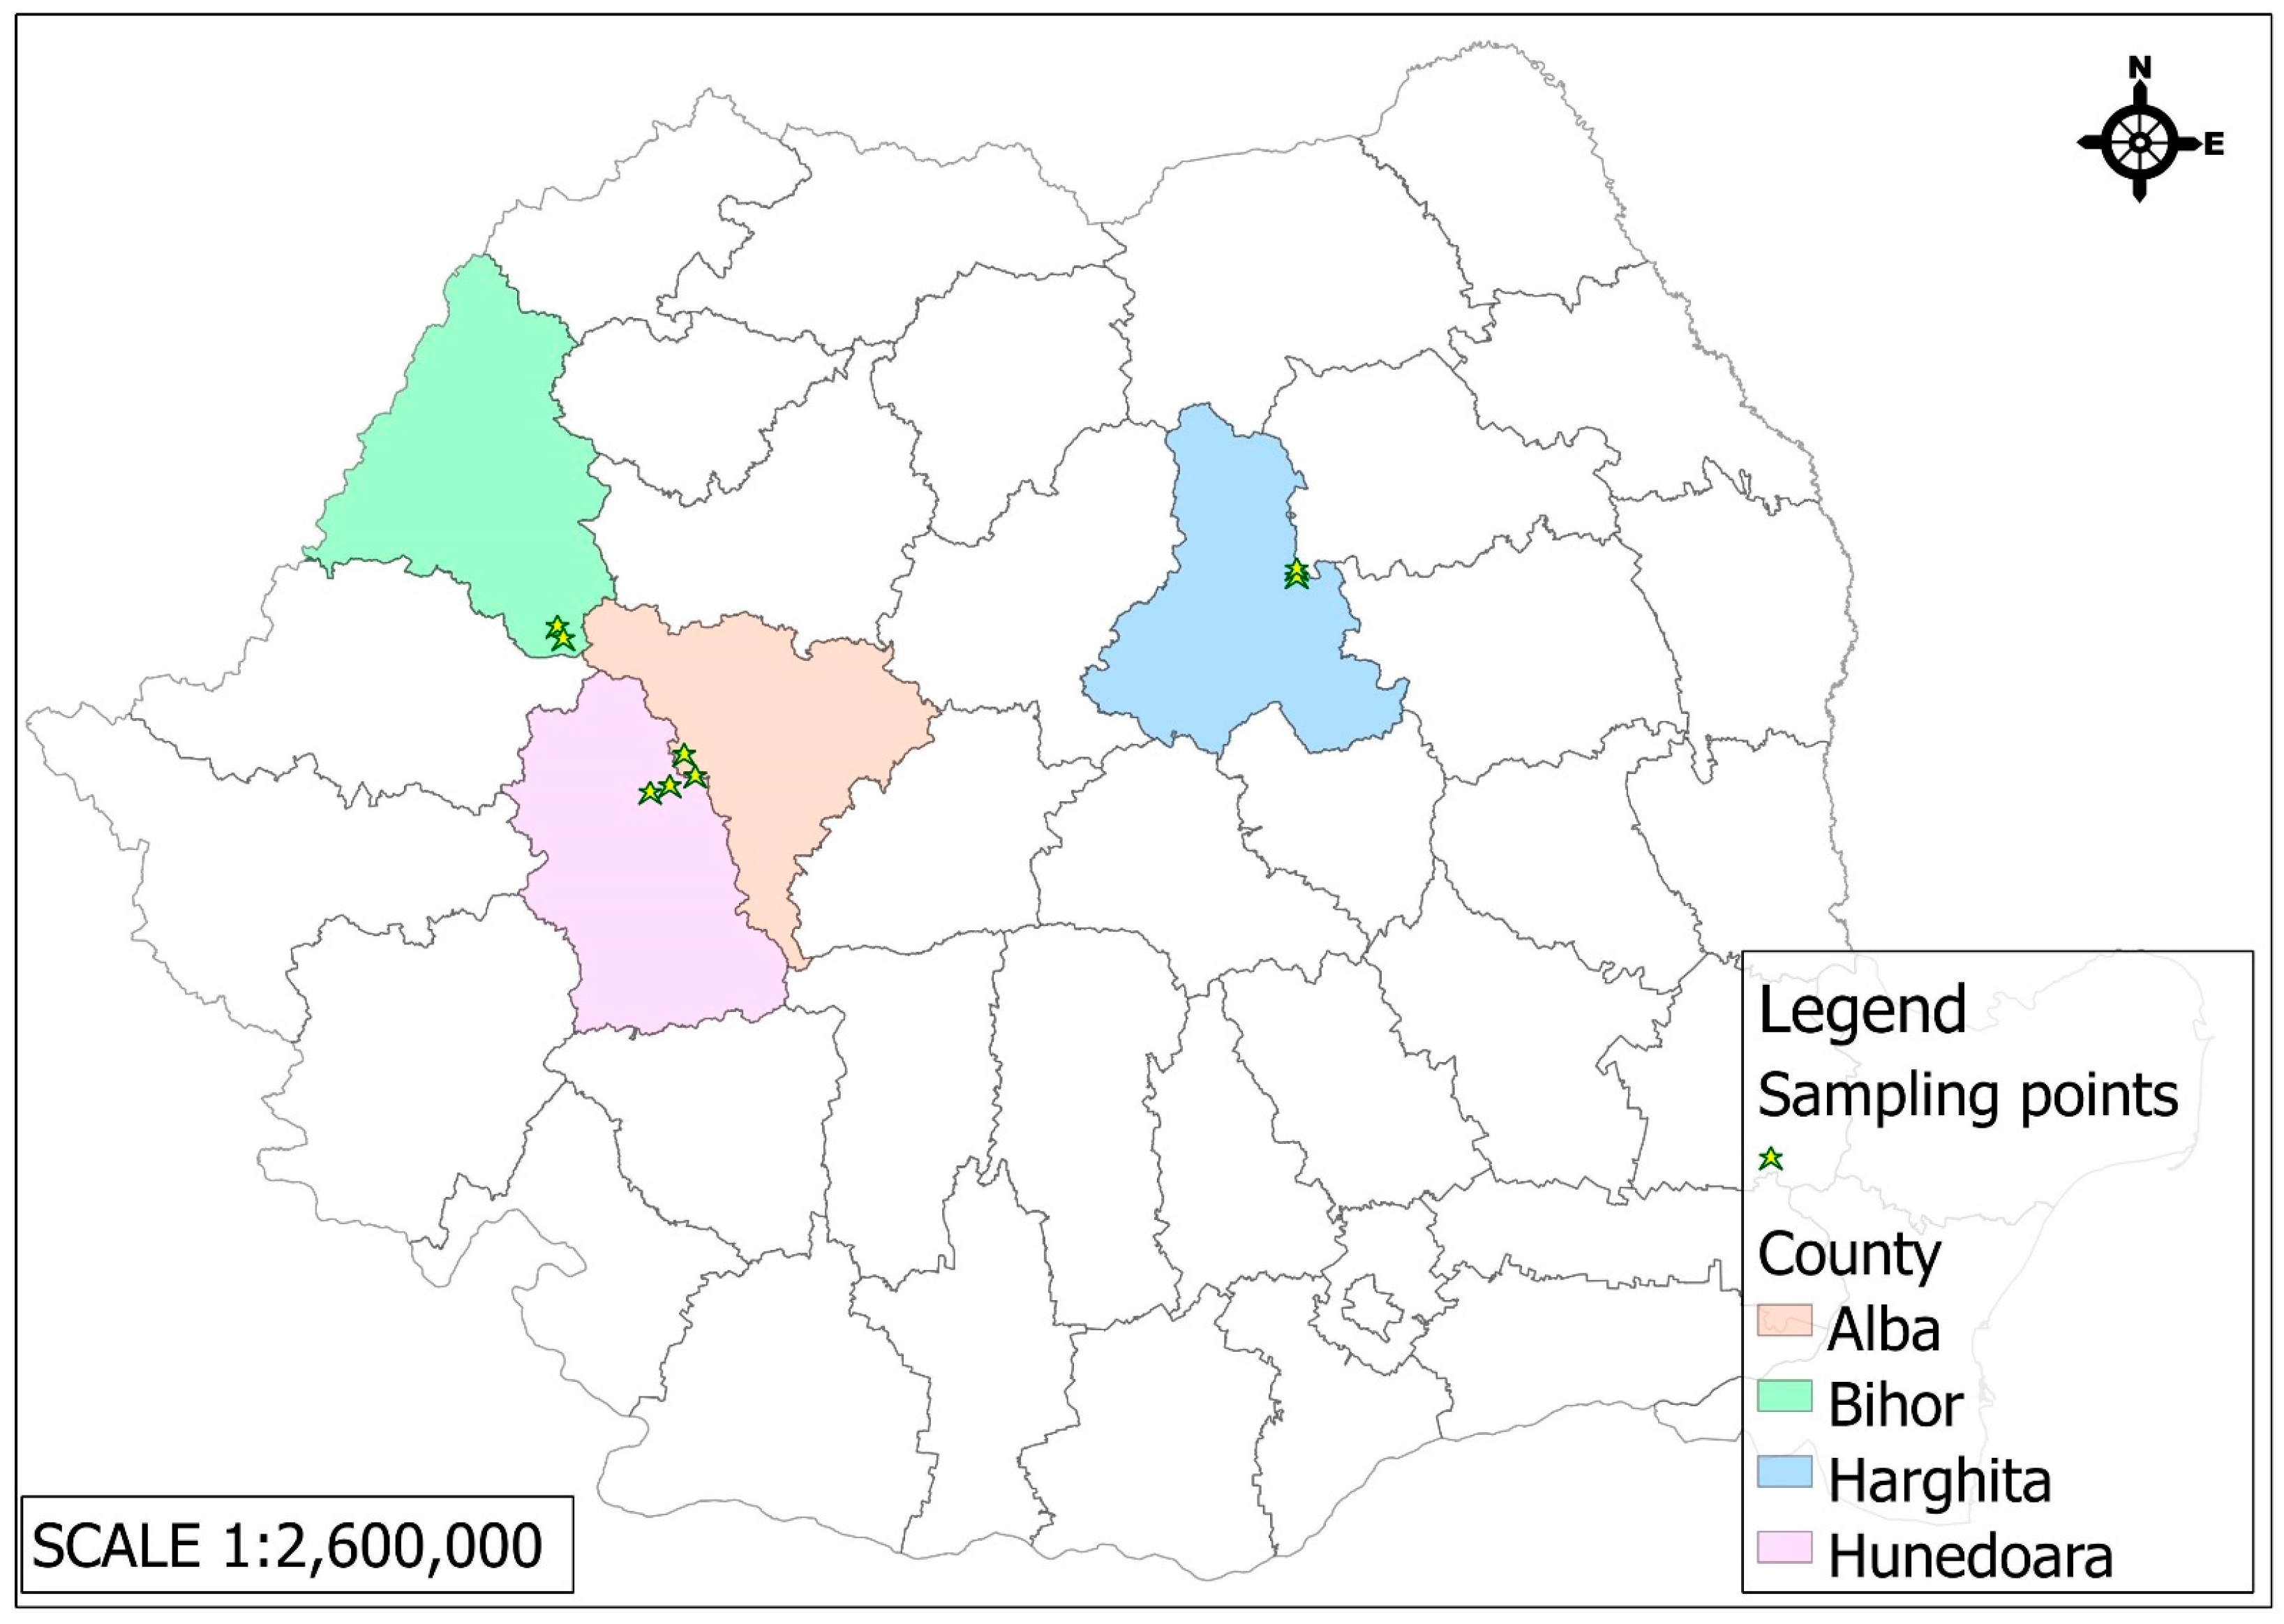
2.1. Honey Samples and the Description of the Area

In July 2024, 1–2 kg of polyfloral honey (with a moisture content of approximately 16–18% at the time of sampling) was collected from each apiary (from about 100 hives per apiary), out of the total amount harvested by beekeepers. A total of 8 honey samples were collected, including 4 composite honey samples from mining areas (Table 1) and 4 composite samples from adjacent protected areas (Table 2). The composite samples consisted of homogenized honey from the same apiary, originating from approximately 100 beehives. Each composite sample was divided into 3 subsamples, so that each could be analyzed in triplicate. The samples were collected from plastic containers in which the honey was stored. They were then placed in glass jars and kept at a temperature of approximately 2–8 °C until analysis.
Table 1 presents the identification of the honey samples collected from areas located in the vicinity of former mining sites in Romania, highlighting the geographical location and the types of mineral resources associated with each area.
Table 2 includes the identification of the honey samples collected from protected natural areas in Romania, indicating the administrative location and the sites of community or avifaunal importance where each apiary’s area is located.
Figure 1 presents a map of Romania showing the locations where the honey samples were collected, both from areas near mining operations and from protected natural zones, highlighting the geographical distribution of the apiaries analyzed in the study.
  • The Zlatna Mining Operation—Haneș Mine (Alba County), located in the Apuseni Mountains, has a millennia-long mining tradition. Industrial exploitation began in the 18th century under Austrian administration, focusing on polymetallic ores—mainly copper, as well as gold, silver, lead, and zinc. The mine expanded significantly during the communist era, becoming part of the Zlatna Mining Complex after nationalization in 1948. Operations declined in the 1990s, due to declining resources, high operational costs, and environmental issues, and it was officially closed in 2003. The area has undergone ecological rehabilitation, through heavy metal pollution and abandoned infrastructure remain [22,23].
  • The Certeju de Sus Mining Operation (Hunedoara County), part of the gold-rich Metaliferi Mountains, was industrially developed starting in the 19th century and intensified under communism. The mine produced complex ores rich in gold and silver, as well as copper, lead, and zinc. Its mineralization is characterized by the presence of auriferous pyrites, commonly associated with galena, sphalerite, chalcopyrite, and gold tellurides. It became a key site within the Deva Mining Complex, equipped with flotation plants and concentrating processing facilities. A major ecological disaster occurred in 1971 due to a tailings dam failure. Declining profitability led to its closure in 2006. Recent years have brought ecological efforts and controversial plans to restart mining using cyanide, which have faced strong public opposition [24,25].
  • The Băița Mining Operation (Bihor County), a historically significant site, shifted from polymetallic mining to uranium extraction after World War II in collaboration with the Soviet Union (Sovrom-Kvarțit). Mining was conducted under hazardous, secretive conditions involving political prisoners. Post-Soviet operations continued under Romanian control but declined after 1990. In addition to uranium, the Băița area also produced smaller quantities of gold, silver, molybdenum, bismuth, and other rare metals. Mining activity was officially discontinued in the 2000s. Nevertheless, the former mining perimeter remains under environmental monitoring, as radioactive waste deposits and ongoing soil and water contamination continue to pose a significant ecological risk [26,27].
  • The Bălan Mining Operation (Harghita County), active since the late 18th century, was a major copper extraction site. The primary mineral extracted was copper ore (chalcopyrite), although the deposit also contained variable amounts of gold, silver, pyrite, galena (lead sulfide), and sphalerite (zinc sulfide). The Bălan mine was officially closed in 2006. In recent years, the area around the former mine has been undergoing ecological rehabilitation, though issues related to heavy metal pollution and landscape degradation persist, caused by abandoned industrial buildings and abandoned mining galleries [28,29].
Figure 2 shows the geographical location of the honey sample collection points (S1–S3, SS1–SS3) in Romania, highlighting both the areas affected by mining and the protected areas, while Figure 3 shows the geographical location of the honey sample collection points S4 and SS4 in Romania.
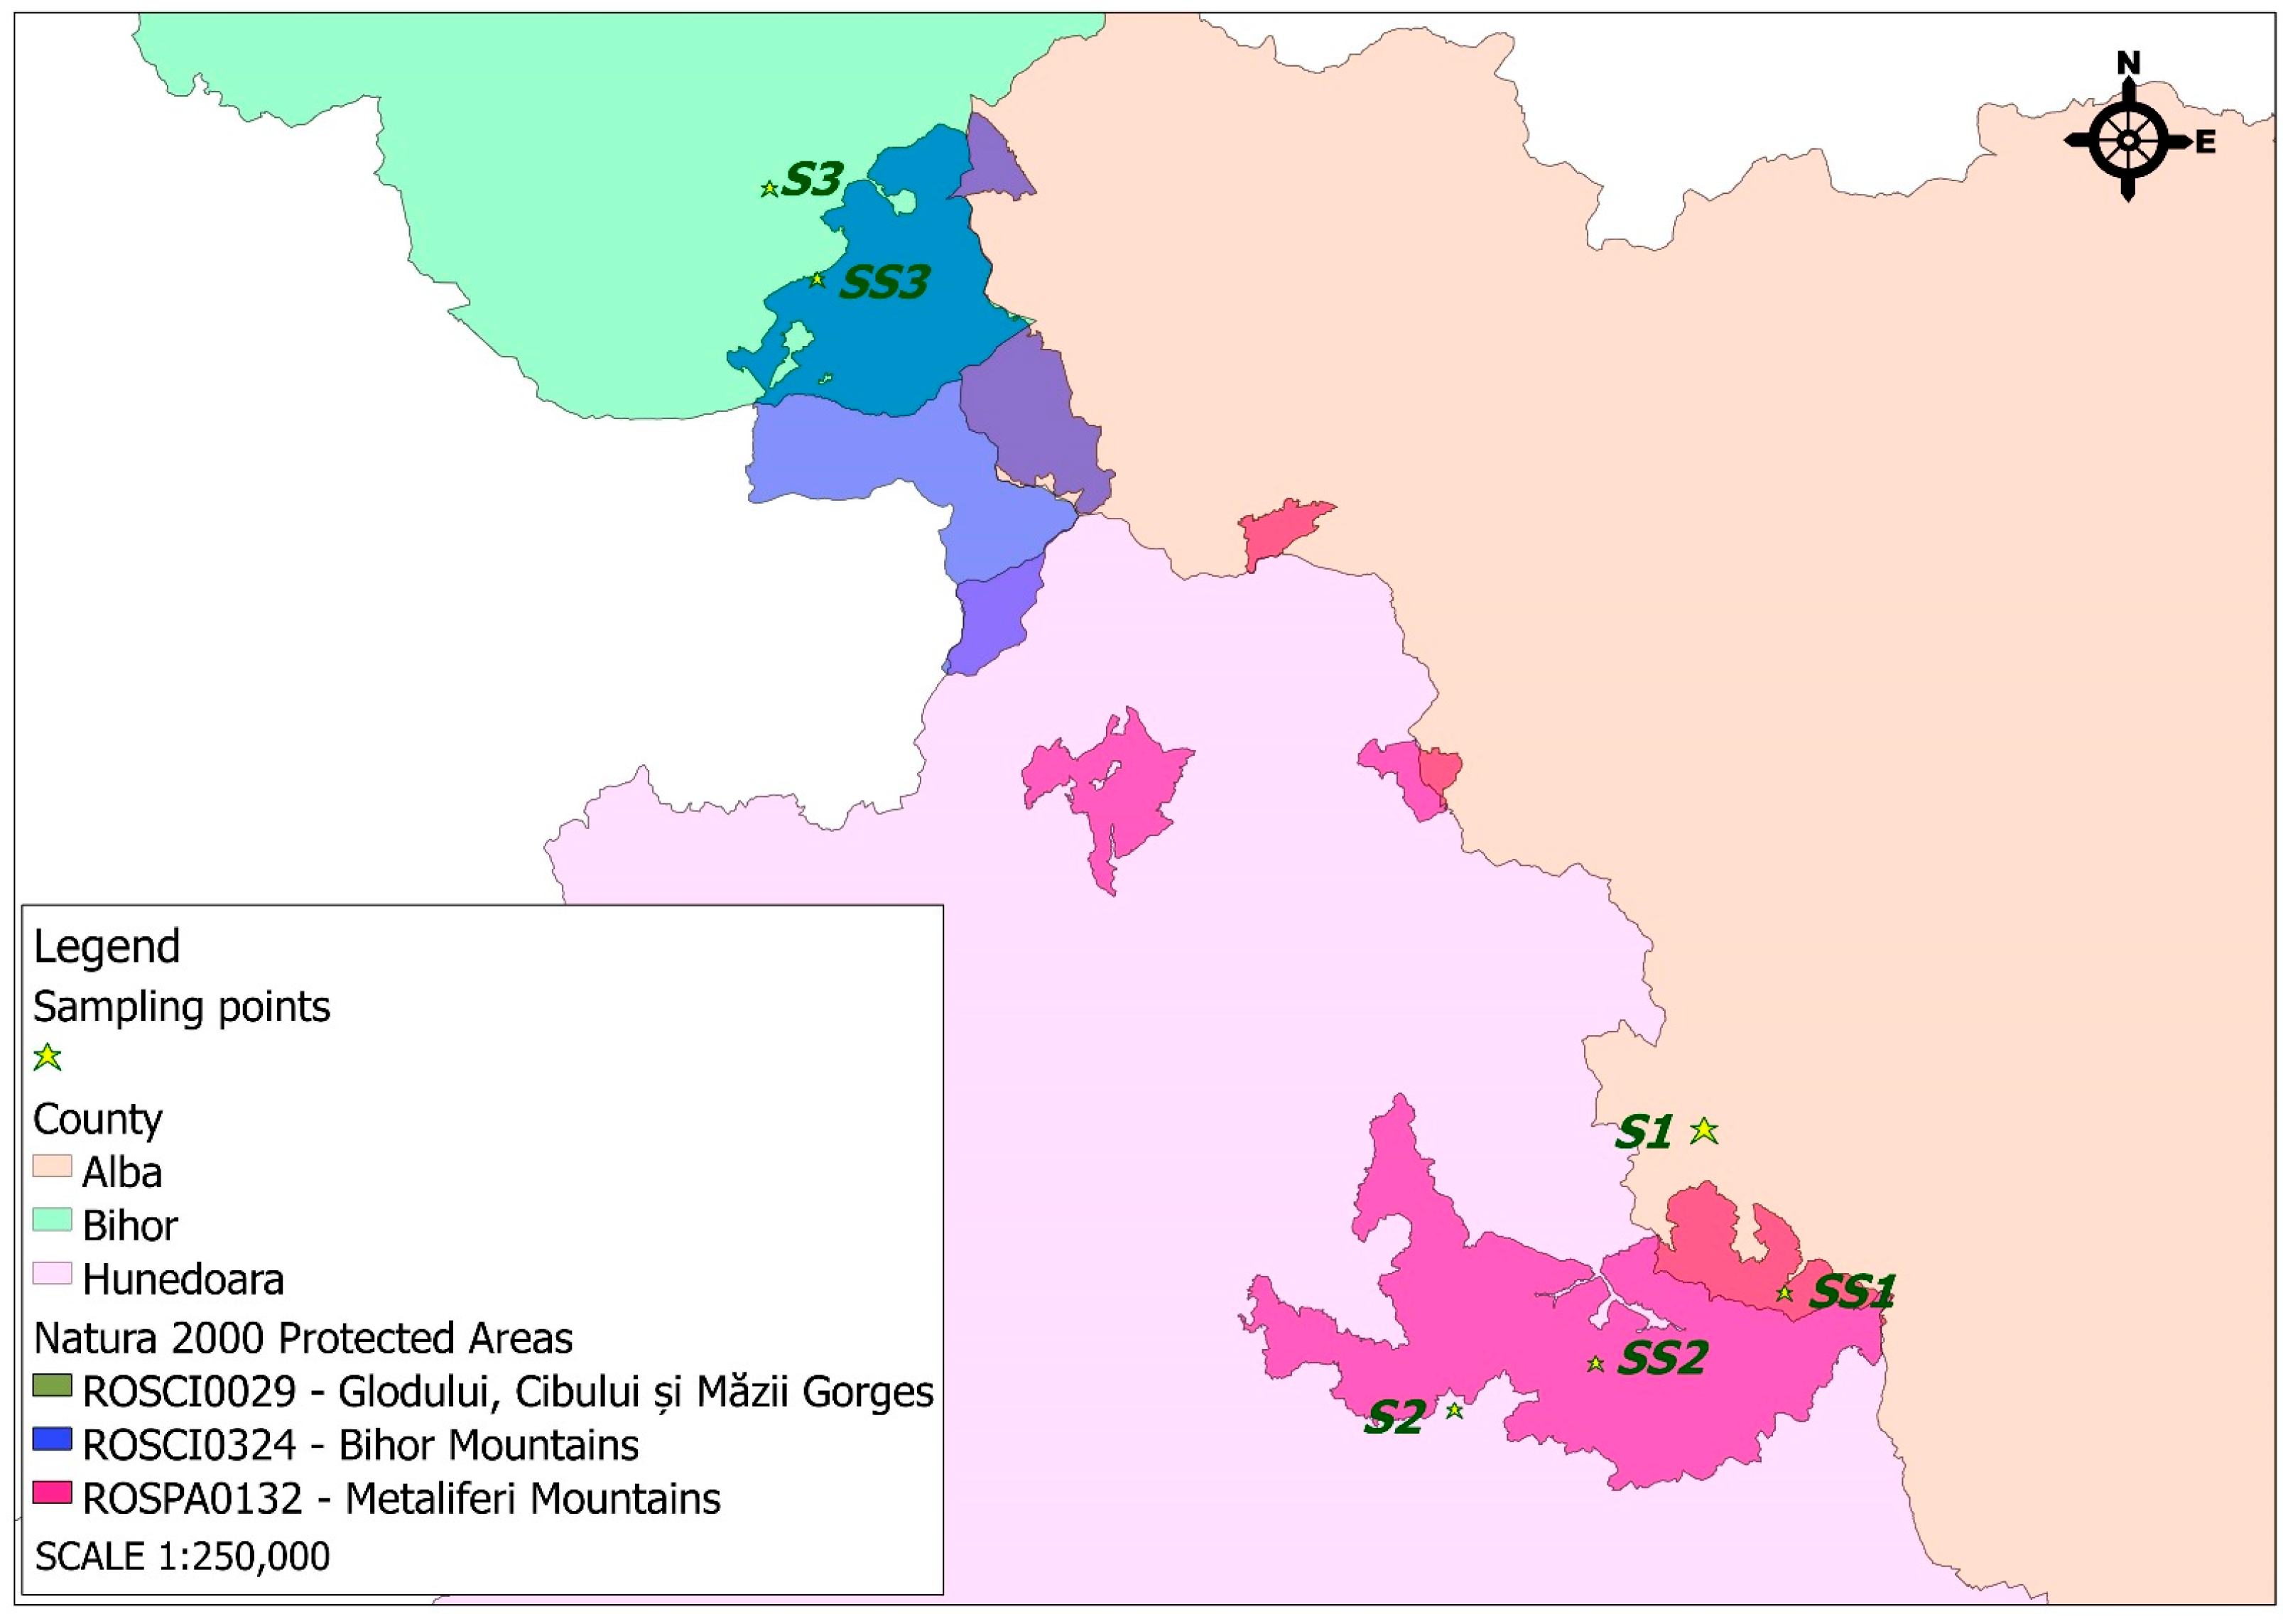
  • The Natura 2000 Site ROSCI0029 Glodului, Cibului, and Măzii Gorges, is a 735 ha Site of Community Importance (SCI) located entirely in Alba and Hunedoara counties, within the Continental biogeographical region. The following protected habitat types and species of conservation interest have been identified within the site: 6110 *—Rupicolous calcareous or basophilic grasslands of the Alysso-Sedion albi; 6190—Rupicolous Pannonic grasslands (Stipo-Festucetalia pallentis); 6210 *—semi-natural dry grasslands and scrubland facies on calcareous substrates (Festuco-Brometalia); 8210—calcareous rocky slopes with chasmophytic vegetation; 8310—caves not open to the public; 9110—Luzulo-Fagetum beech forests; 9180 *—Tilio-Acerion forests of slopes, screes, and ravines (mixed broadleaf forests); 91E0 *—alluvial forests with Alnus glutinosa and Fraxinus excelsior (Alno-Padion, Alnion incanae, and Salicion albae), Iris aphylla ssp. hungarica (Hungarian leafless iris), Bombina variegata (yellow-bellied toad), Triturus vulgaris ampelensis (Danube crested newt), Barbastella barbastellus (Barbastelle bat), Miniopterus schreibersii (Schreiber’s bat), Myotis blythii (lesser mouse-eared bat), Myotis myotis (greater mouse-eared bat), Rhinolophus blasii (Blasius’s horseshoe bat), Rhinolophus euryale (Mediterranean horseshoe bat), Rhinolophus ferrumequinum (greater horseshoe bat), Rhinolophus hipposideros (lesser horseshoe bat), and Lutra lutra (Eurasian otter) [30].
  • The Natura 2000 Site ROSPA0132 Metaliferi Mountains, is a 26,673.4 ha Special Protection Area (SPA) for birds in Alba and Hunedoara counties, spanning both the Alpine and Continental biogeographical regions. Within its territory, 15 bird species are considered species of conservation interest: Aquila chrysaetos (Golden Eagle), Bubo bubo (Eurasian Eagle-Owl), Caprimulgus europaeus (European Nightjar), Circaetus gallicus (Short-toed Snake Eagle), Dendrocopos leucotos (White-backed Woodpecker), Dendrocopos medius (Middle Spotted Woodpecker), Dryocopus martius (Black Woodpecker), Falco peregrinus (Peregrine Falcon), Ficedula albicollis (Collared Flycatcher), Ficedula parva (Red-breasted Flycatcher), Lanius collurio (Red-backed Shrike), Lullula arborea (Wood Lark), Milvus migrans (Black Kite), Pernis apivorus (European Honey Buzzard), and Picus canus (Grey-headed Woodpecker). These species have benefitted from special protection under the Natura 2000 network [31].
  • The Natura 2000 Site ROSCI0324 Bihor Mountains, is a Site of Community Importance (SCI) of 20,932.2 ha located across Arad, Alba, Bihor, and Hunedoara counties, being in the Alpine biogeographical region. The following protected habitat types and species of conservation interest have been identified within the site: 4070 *—bushes of Pinus mugo and Rhododendron hirsutum (Mugo-Rhododendretum hirsuti); 9110—Luzulo-Fagetum beech forests; 9130—Asperulo-Fagetum beech forests; 9170—Galio-Carpinetum oak–hornbeam forests; 91V0—Dacian beech forests (Symphyto-Fagion); and 9410—acidophilous Picea abies forests in a mountain zone (Vaccinio-Piceetea); Rosalia alpina (Rosalia longhorn beetle), Carabus variolosus (varied ground beetle); Bombina variegata (yellow-bellied toad), Triturus vulgaris ampelensis (Danube crested newt), Canis lupus (grey wolf), Lynx lynx (Eurasian lynx), and Ursus arctos (brown bear) [32].
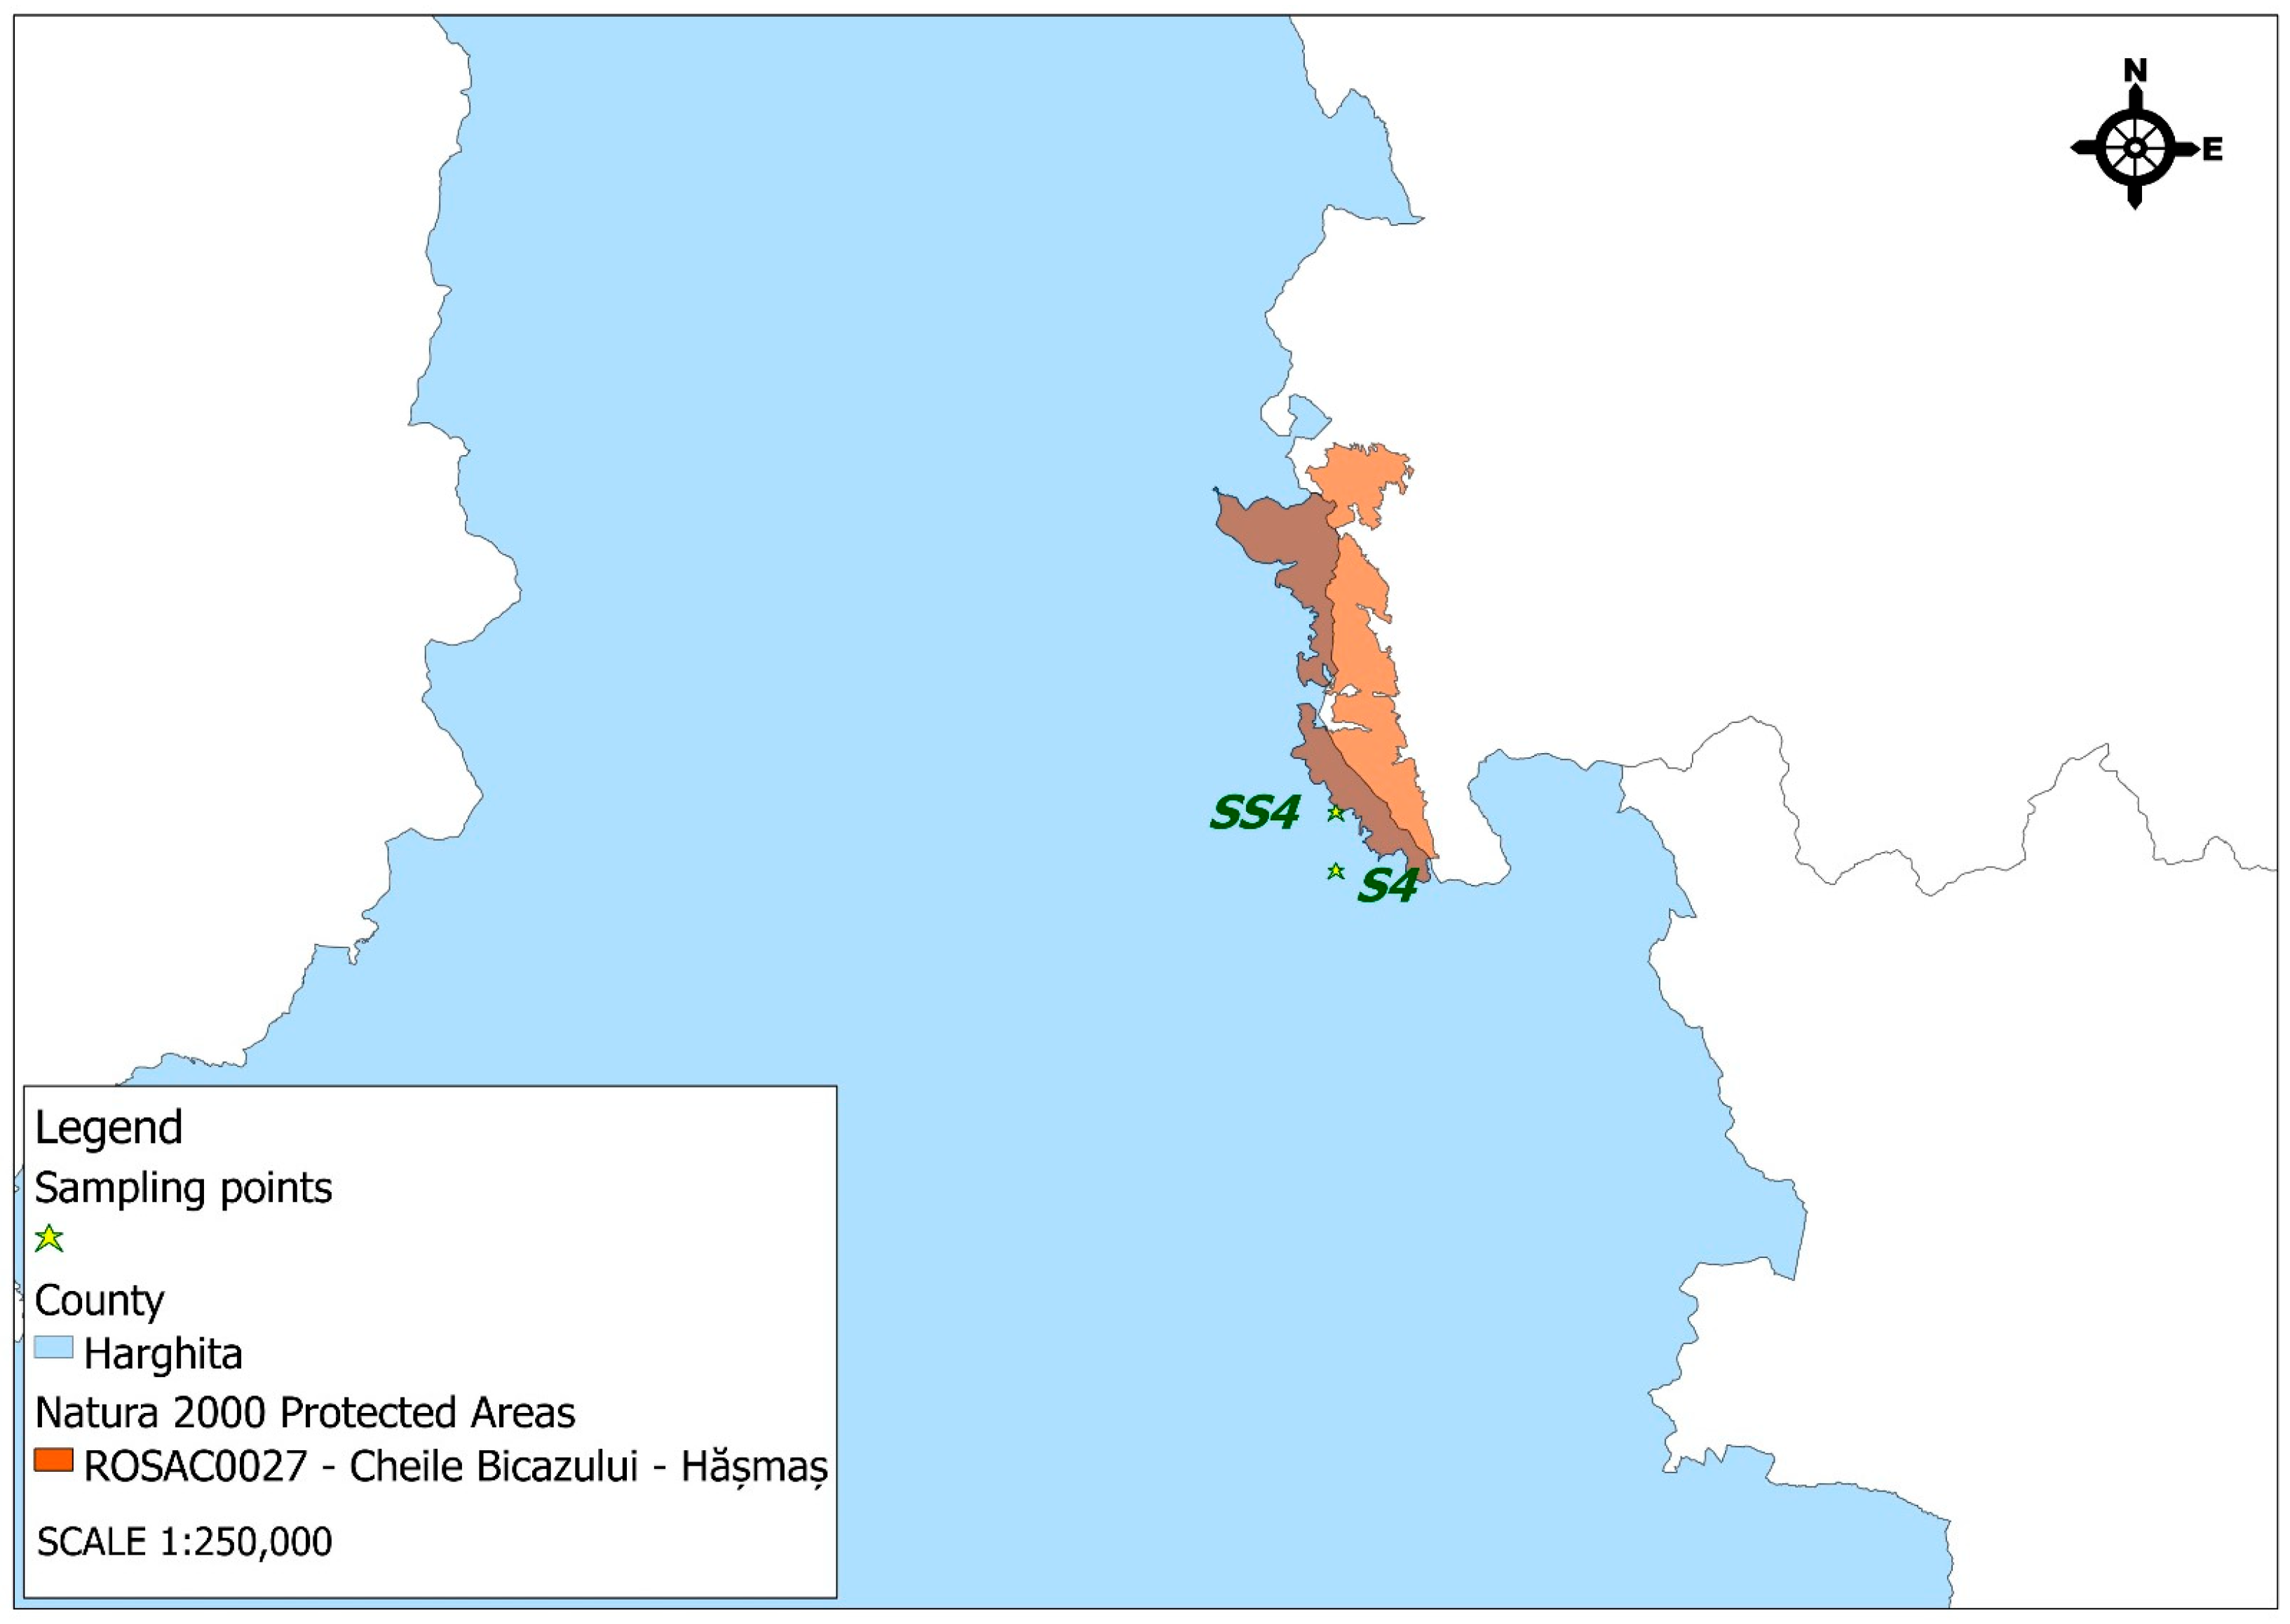
  • The Natura 2000 site ROSAC0027 Bicaz Gorge-Hășmaș, is a 7642 ha Special Area of Conservation (SAC) in Harghita and Neamț counties, entirely within an Alpine biogeographic region. The following habitat types have been identified within the special conservation area: 150—natural eutrophic lakes with Magnopotamion- or Hydrocharition-type vegetation; 4060—alpine and boreal heaths; 6170—alpine and subalpine calcareous grasslands; 6190—Rupicolous Pannonic grasslands (Stipo-Festucetalia pallentis); 6210*—semi-natural dry grasslands on calcareous substrates (Festuco-Brometalia); 6430—hydrophilious, tall herb fringe communities of plains and montane to alpine levels; 6510—lowland hay meadows (Alopecurus pratensis, Sanguisorba officinalis); 6520—mountain hay meadows; 8120—calcareous and calcshist screes of montane to alpine levels (Thlaspietea rotundifolii); 8210—calcareous rocky slopes with chasmophytic vegetation; 8310—caves not open to the public; 91E0 *—alluvial forests with Alnus glutinosa and Fraxinus excelsior (Alno-Padion, Alnion incanae, and Salicion albae); 91Q0—calcicolous Pinus sylvestris forests; 91V0—Dacian beech forests (Symphyto-Fagion); 9110—Luzulo-Fagetum beech forests; and 9410—acidophilous Picea abies forests of the mountain zone (Vaccinio-Piceetea). The species of conservation interest identified within this site are as follows: Cypripedium calceolus (Lady’s Slipper Orchid), Asplenium adulterinum (Ladder Spleenwort), Campanula serrata (Serrated Bellflower), Iris aphylla ssp. hungarica (Hungarian Leafless Iris), Pholidoptera transsylvanica (Transylvanian Dark Bush-cricket), Euphydryas aurinia (Marsh Fritillary Butterfly), Barbus petenyi (Petényi’s Barbel), Cottus gobio (European Bullhead), Cottus poecilopus (Alpine Bullhead), Triturus cristatus (Great Crested Newt), Triturus montandoni (Carpathian Newt), Bombina variegata (Yellow-bellied Toad), Barbastella barbastellus (Western Barbastelle Bat), Miniopterus schreibersii (Common Bent-wing Bat), Myotis bechsteinii (Bechstein’s Bat), Myotis blythii (Lesser Mouse-eared Bat), Myotis myotis (Greater Mouse-eared Bat), Rhinolophus hipposideros (Lesser Horseshoe Bat), Canis lupus (Gray Wolf), Lynx lynx (Eurasian Lynx), and Ursus arctos (Brown Bear) [33].

2.2. Physico-Chemical Analyses

2.2.1. Water Activity (aw)

Each honey sample was homogenized and brought to room temperature (approximately 21 °C). A quantity of about 5–10 g from each sample was transferred into a clean container for use with the measuring device. The analyses were performed using an Aquaspector AQS-2-TC water activity analyzer (Nagy Messsysteme GmbH, Gäufelden, Germany). After placing the container in the analysis compartment, the automatic measurement was initiated, with the aw values displayed digitally. The result was the average of 3 consecutive readings [34].

2.2.2. Moisture Content (H)

The honey samples were brought to room temperature (approximately 21 °C) and homogenized to ensure an even distribution of their content. For each measurement, 2–3 drops of honey were applied to the measurement prism of a Pocket Digital Refractometer PAL-22S (ATAGO, Tokyo, Japan), which was previously cleaned and dried with a lint-free cloth. The moisture value was displayed digitally. For each sample, three successive readings were taken, with the contact surface cleaned with isopropyl alcohol and allowed to dry completely between readings. The final value was calculated as the arithmetic mean of the three measurements [35].

2.2.3. Phenolic Compounds (Phenols)

For each sample, a honey solution with a concentration of 0.1 g/mL was prepared by dissolving 1 g of honey in a final volume of 10 mL of distilled water. From this solution, 0.5 mL was taken and added to a clean test tube, followed by 2.5 mL of Folin–Ciocalteu reagent (diluted 1:10 with distilled water). After homogenization, 2 mL of 7.5% Na2CO3 solution was added, and the volume was adjusted to 10 mL with distilled water. The mixture was incubated for 30 min at room temperature in the dark. The absorbance of the solution was then measured spectrophotometrically using a Lambda 20 UV–VIS Spectrophotometer (Perkin Elmer UV/VIS, Washington, DC, USA) at 760 nm, using distilled water as a blank.
To quantify the phenolic content, a calibration curve was constructed using gallic acid standards of known concentrations. The total phenolic content was expressed as mg gallic acid equivalents (GAE) per 100 g of honey, and the values obtained for each sample were calculated based on the linear regression equation. All the determinations were performed in triplicate, and the results were expressed as the mean ± standard deviation [36].

2.2.4. Flavonoid Compounds (Flavonoids)

A stock solution was prepared by dissolving 1 g of honey in a final volume of 10 mL of 80% methanol (v/v), followed by stirring until complete dissolution. From the obtained extract, 0.5 mL was placed into a test tube, to which 0.1 mL of 10% AlCl3 solution, 0.1 mL of 1 M sodium acetate, and 4.3 mL of 80% methanol were added. The mixture was homogenized and incubated for 30 min at room temperature in the dark. The absorbance was measured at 415 nm using a Lambda 20 UV–VIS Spectrophotometer (Perkin Elmer UV/VIS, Washington, DC, USA), with a blank.
For the quantification of the flavonoids, a calibration curve was constructed using quercetin standard solutions of known concentrations. The flavonoid content was calculated based on the linear equation of the standard curve. The determinations were performed in triplicate for each sample, and the final values were expressed as the mean ± standard deviation [37,38].

2.2.5. Hydroxymethylfurfural Content—White Method (HMF)

Precisely 10 g of honey was weighed and dissolved in 25 mL of distilled water that was boiled and cooled to remove dissolved air, with the mixture homogenized by stirring. The solution was quantitatively transferred into a 50 mL volumetric flask, filled to the mark, and homogenized by gentle inversion (cold dissolution, without heating). Into two test tubes, 2 mL of the honey solution and 5 mL of the p-toluidine solution were pipetted. In the sample test tube, 1 mL of barbituric acid solution was added, while in the reference test tube, 1 mL of distilled water was added. Immediately after the addition of the barbituric acid, the contents were mixed, and the absorbance was measured at a wavelength of 550 nm, using 1 cm path length cuvettes, with the reference tube as the blank. The absorbance value gradually increased, reaching a maximum in a short time (approximately 2 min), after which it began to decrease. The maximum absorbance of the sample was measured using a Lambda 20 UV–VIS Spectrophotometer (Perkin Elmer UV/VIS, Washington, DC, USA). HMF (mg/100 g) = E × 19.2, where E is the absorbance value read on the instrument scale and 19.2 is the conversion factor of absorbance into the HMF equivalent. All the determinations were performed in triplicate, and the results were expressed as the arithmetic mean [39,40].

2.2.6. Sugar [41]

Precisely 3 g of honey was weighed and quantitatively transferred with water into a 200 mL volumetric flask, then brought to volume and homogenized. This constituted the stock solution. From the stock solution, 20 mL was pipetted into a 100 mL volumetric flask, filled to the mark with water, and homogenized. This constituted the working solution. Into a 300 mL conical flask, 20 mL of copper sulfate solution, 20 mL of KNaC4H4O6·4H2O (Seignette salt) solution, and 20 mL of distilled water were added and mixed. The flask was placed on an asbestos wire gauze over a gas burner flame, and once boiling began, 20 mL of the working solution was added using a pipette. From the moment boiling resumed, a 5 min timer started. After that, the flask was cooled with water, 25–30 mL of acidified sodium chloride solution was added, and the mixture was shaken vigorously. Then, 2–3 g of NaHCO3 was added. After effervescence ceased, a visible residue of bicarbonate remained in the flask. Titration was carried out with 0.05 N iodine solution under continuous stirring until the liquid became clear and the color shifted toward green. When a clear green hue appeared, with no tendency to revert to blue, the titration was considered complete, and the volume of 0.05 N iodine solution used was recorded. To determine the excess iodine, 0.5 mL of starch solution was added, and titration was continued with 0.05 N Na2S2O3·5H2O, drop by drop, until the color abruptly changed from dark blue to light blue. The volume of iodine solution used for oxidizing the cuprous ion was determined by the difference between the volume of iodine solution used in the titration and the volume of sodium thiosulfate solution used in the back-titration. The amount of inverted sugar was then read from recognized tables, in milligrams, corresponding to the actual volume of iodine solution used for oxidizing the cuprous ion.
A.
Determination of Easily Hydrolysable Sugar by the Elser Method—Honey
From the stock solution prepared for the determination of the reducing sugars, 20 mL was transferred into a 100 mL volumetric flask, diluted with water to about 50 mL, then 1 mL of 1N HCl was added. The mixture was homogenized and heated in a boiling water bath for 30 min.
After the 30 min period, the flask was cooled under running water, and 1 mL of 1N NaOH was added. The solution was then brought to volume with water and mixed thoroughly.
B.
Determination of Invert Sugar
In a 200 mL Erlenmeyer flask, 30 mL of the solution obtained after sucrose hydrolysis, 10 mL of copper solution, and 10 mL of sodium solution were added and boiled for exactly 2 min. Heating the flask to boiling took no more than 3 min. After boiling, the flask was rapidly cooled to room temperature (using a cold-water stream), then 10 mL of KI solution and 10 mL of H2SO4 were added. Titration was carried out immediately with sodium thiosulfate solution until the color changed from brown to light yellow. Then, 5 mL of starch solution was added, and titration was continued until the brown-blue color completely disappeared (V).
A blank determination was performed using the same reagents and under the same conditions and order as above, replacing the test solution with an equal volume of water (30 mL). Two parallel determinations were carried out from the same sample for analysis.
CInvert Sugar [%] = [(m × 105)/(m × 104)] · 100, where m = the amount of invert sugar, read from the tables, in milligrams; m1 = the amount of honey used in the analysis, in grams; 10 = the ratio between the volume of the solution in the 200 mL volumetric flask and the volume of the solution taken for dilution (200/20 = 10); 5 = the ratio between the volume of the solution in the 100 mL volumetric flask and the volume of the diluted solution used for analysis (100/20 = 5); 1000 = the conversion factor from mg to g; and 100 = the factor for percentage expression.
The content of easily hydrolysable sugar was calculated and expressed as sucrose equivalent using the formula
Csucrose = (m − m1) × 0.95 [%], where m = total amount of invert sugar (after acid hydrolysis) [%]; m1 = initial amount of invert sugar (before acid hydrolysis) [%]; and 0.95 = conversion factor from invert sugar to sucrose equivalent. The factor 0.95 was derived from the ratio between the molecular mass of sucrose and the combined molecular masses of glucose and fructose (invert sugar), namely, sucrose: 342 g/mol; glucose + fructose: 180 + 180 = 360 g/mol; 342/360 ≈ 0.95.

2.2.7. Heavy Metals (Pb, Cd, Fe, Cu, and Zn)

A quantity of 10 g of each honey sample was accurately weighed and transferred into a porcelain crucible. The crucible was placed in a furnace at an initial temperature not exceeding 100 °C. The temperature was then increased at a maximum rate of 50 °C/hour until it reached 450 °C, where it was maintained for 24 h. After cooling, 5 mL of 6 M HCl was added to the crucible containing the ash to ensure full contact with the acid. The acid evaporated on a sand bath. The residue was dissolved in an exactly measured volume (10–25 mL) of 0.1 M HNO3. A blank was prepared following the same procedure. The crucible was rotated to ensure that the entire residue encountered the acid, then covered and left to stand for 2 h. The solution was mixed and filtered into a plastic container. From the resulting mineralized solution, the metal content was determined. To calibrate the instrument, working standard solutions were prepared by diluting 1000 mg/L stock solutions for each element. The concentrations ranged from 0.5 to 5.0 µg/L for Cd; 1.0 to 10.0 µg/L for Pb; and 1.0 to 20.0 µg/L for Cu, Zn, and Fe, depending on the linear range of each element. The standard solutions were prepared in the same matrix as the samples (0.1 M nitric acid) to ensure the comparability of the results. The solutions were analyzed by AAS using a Perkin Elmer AA700 spectrometer equipped with a graphite furnace HGA-700 and an AS 800 Autosampler (PerkinElmer, Waltham, MA, USA). The sample volume was automatically injected into the center of the graphite tube, which was then gradually heated using an electric current source. To prevent sample loss, the temperature was increased gradually according to a three-step program: 1. Drying the sample at a low temperature (100–200 °C) for a few seconds. 2. Pyrolysis of the organic components at 500–1400 °C. 3. Atomization of the sample at 2500 °C. The absorption of light radiation by the metal atoms in the graphite tube cavity was measured. A narrow, tall, well-defined peak was recorded as the absorbance versus time. The measurements were made at element-specific wavelengths: Pb: 283.3 nm; Cd: 248.3 nm; Fe: 248.3 nm; Cu: 324.8 nm; and Zn: 213.9 nm. For each determination, a Zeeman background correction was used, along with the specific matrix modifiers NH4H2PO4 and Mg(NO3)2·6H2O. A volume of 20 µL from each sample was injected, comprising the standard solution, matrix modifier, blank, and sample. The calibration solutions were automatically prepared by the instrument, which performed the dilutions based on the programmed method. A minimum calibration curve linearity coefficient (R2) of 0.995 was required. All the measurements were performed in duplicate. The concentrations obtained were placed on the calibration curve, and the results were expressed in mg/kg, using the following formula—C [mg/kg] = (Ccurve [mg/L] × Vdigestion [mL])/mhoney [g]—where Ccurve is the concentration read from the instrument, Vdigestion is the final volume after dilution, and mhoney is the mass of the honey sample. For concentrations exceeding the calibration range, the mineralized sample was diluted accordingly, and the final concentration was corrected using the appropriate dilution factor [42].

2.2.8. Microbiological Analysis

To assess the antibacterial activity of the honey, 7 bacterial strains (Gram-negative and Gram-positive bacteria) were used: Escherichia coli (ATCC 25922), Salmonella enteritidis (ATCC 13076), Pseudomonas aeruginosa (ATCC 27853), Staphylococcus aureus (ATCC 25923), Staphylococcus epidermidis (ATCC 14990), Bacillus cereus (ATCC 11788), and Listeria monocytogenes (ATCC 19115).
Several colonies from each bacterial strain were dispersed in 10 mL of nutrient broth (Mikrobiologie Labor-Technik, Arad, Romania) and incubated for 18 h at 37 °C. The turbidity was adjusted to a 0.5 McFarland standard and was measured using a McFarland Densitometer (Mettler Toledo, Columbus, OH, USA), corresponding approximately to a homogeneous suspension of 1.5 × 10⁸ CFU (colony forming units)/mL.
The antifungal activity of the honey was tested using 7 fungal strains: Candida albicans (ATCC 10239), Aspergillus niger (derived from ATCC 16888), Aspergillus flavus (ATCC 9643), Penicillium chrysogenum (ATCC 10106), Rhizopus stolonifer (ATCC 14037), Fusarium oxysporum (ATCC 48112), and Alternaria alternata (TX 8025).
For the fungal cultures, colonies from each fungal strain were dispersed in 10 mL of nutrient broth, incubated for 72 h at 25 °C, and adjusted to a 0.5 McFarland standard.
All strains used in this study were sourced from Thermo Fisher Scientific, Inc. (Waltham, MA, USA) and MicroBioLogics, Inc. (St. Cloud, MN, USA).
For evaluating the antimicrobial activity, the well diffusion method was used, following the procedures recommended by the CLSI [43]. The inhibition zones diameters (IZDs) were measured and served as a semi-quantitative indicator of antimicrobial effectiveness. Mueller–Hinton agar (Merck KGaA, Darmstadt, Germany) was used for culturing the bacterial strains, while Sabouraud 4% dextrose agar (Merck KGaA) was used for the fungal strains. The surfaces of the Petri dishes were inoculated by flooding them with 1 mL of culture. Using a sterile stainless-steel tube, 6 mm diameter circles were created by pressing into the culture medium on the Petri dishes. Each hole was then filled with 150 μL of undiluted and liquefied honey. The Petri dishes were incubated with their lids up for 18 h at 37 °C for bacterial growth and for 5 days at 25 °C for fungal growth. Discs with 5 μg ciprofloxacin (Bio-Rad, Hercules, Marnes-la-Coquette, France) were used as positive controls for bacterial growth, and discs with 1 μg voriconazole (Bio-Rad Laboratories, Marnes-la-Coquette, France) were used as positive controls for fungal growth. An artificial honey sample was prepared by dissolving 40.5 g fructose, 33.5 g glucose, 7.5 g maltose, and 1.5 g sucrose in 17 mL sterile deionized water. This solution contained the proportions of the four predominant sugars in the natural honey samples and was used as the sugar control.
The antimicrobial activity was evaluated by measuring the diameter of the inhibition zones (in mm) using a DIN 862 ABS digital caliper (Fuzhou Conic Industrial Co., Ltd., Fuzhou, China) [44].

2.3. Determination of Botanical Origin

The melissopalynological analysis of the honey was performed by dissolving 10 g of honey in 20 mL of distilled water, centrifuging the solution at 3000 rpm for 10 min, resuspending the sediment in 1 mL of distilled water, placing a drop on a microscope slide, mounting it with gelatinous glycerin, and examining it under a Hund Wetzlar H600LL phase-contrast microscope (Helmut Hund GmbH, Wetzlar, Germany) at 400× magnification. At least 300 pollen grains were analyzed to identify the botanical origin by comparisons with reference atlases and to calculate the relative pollen frequency [45,46].

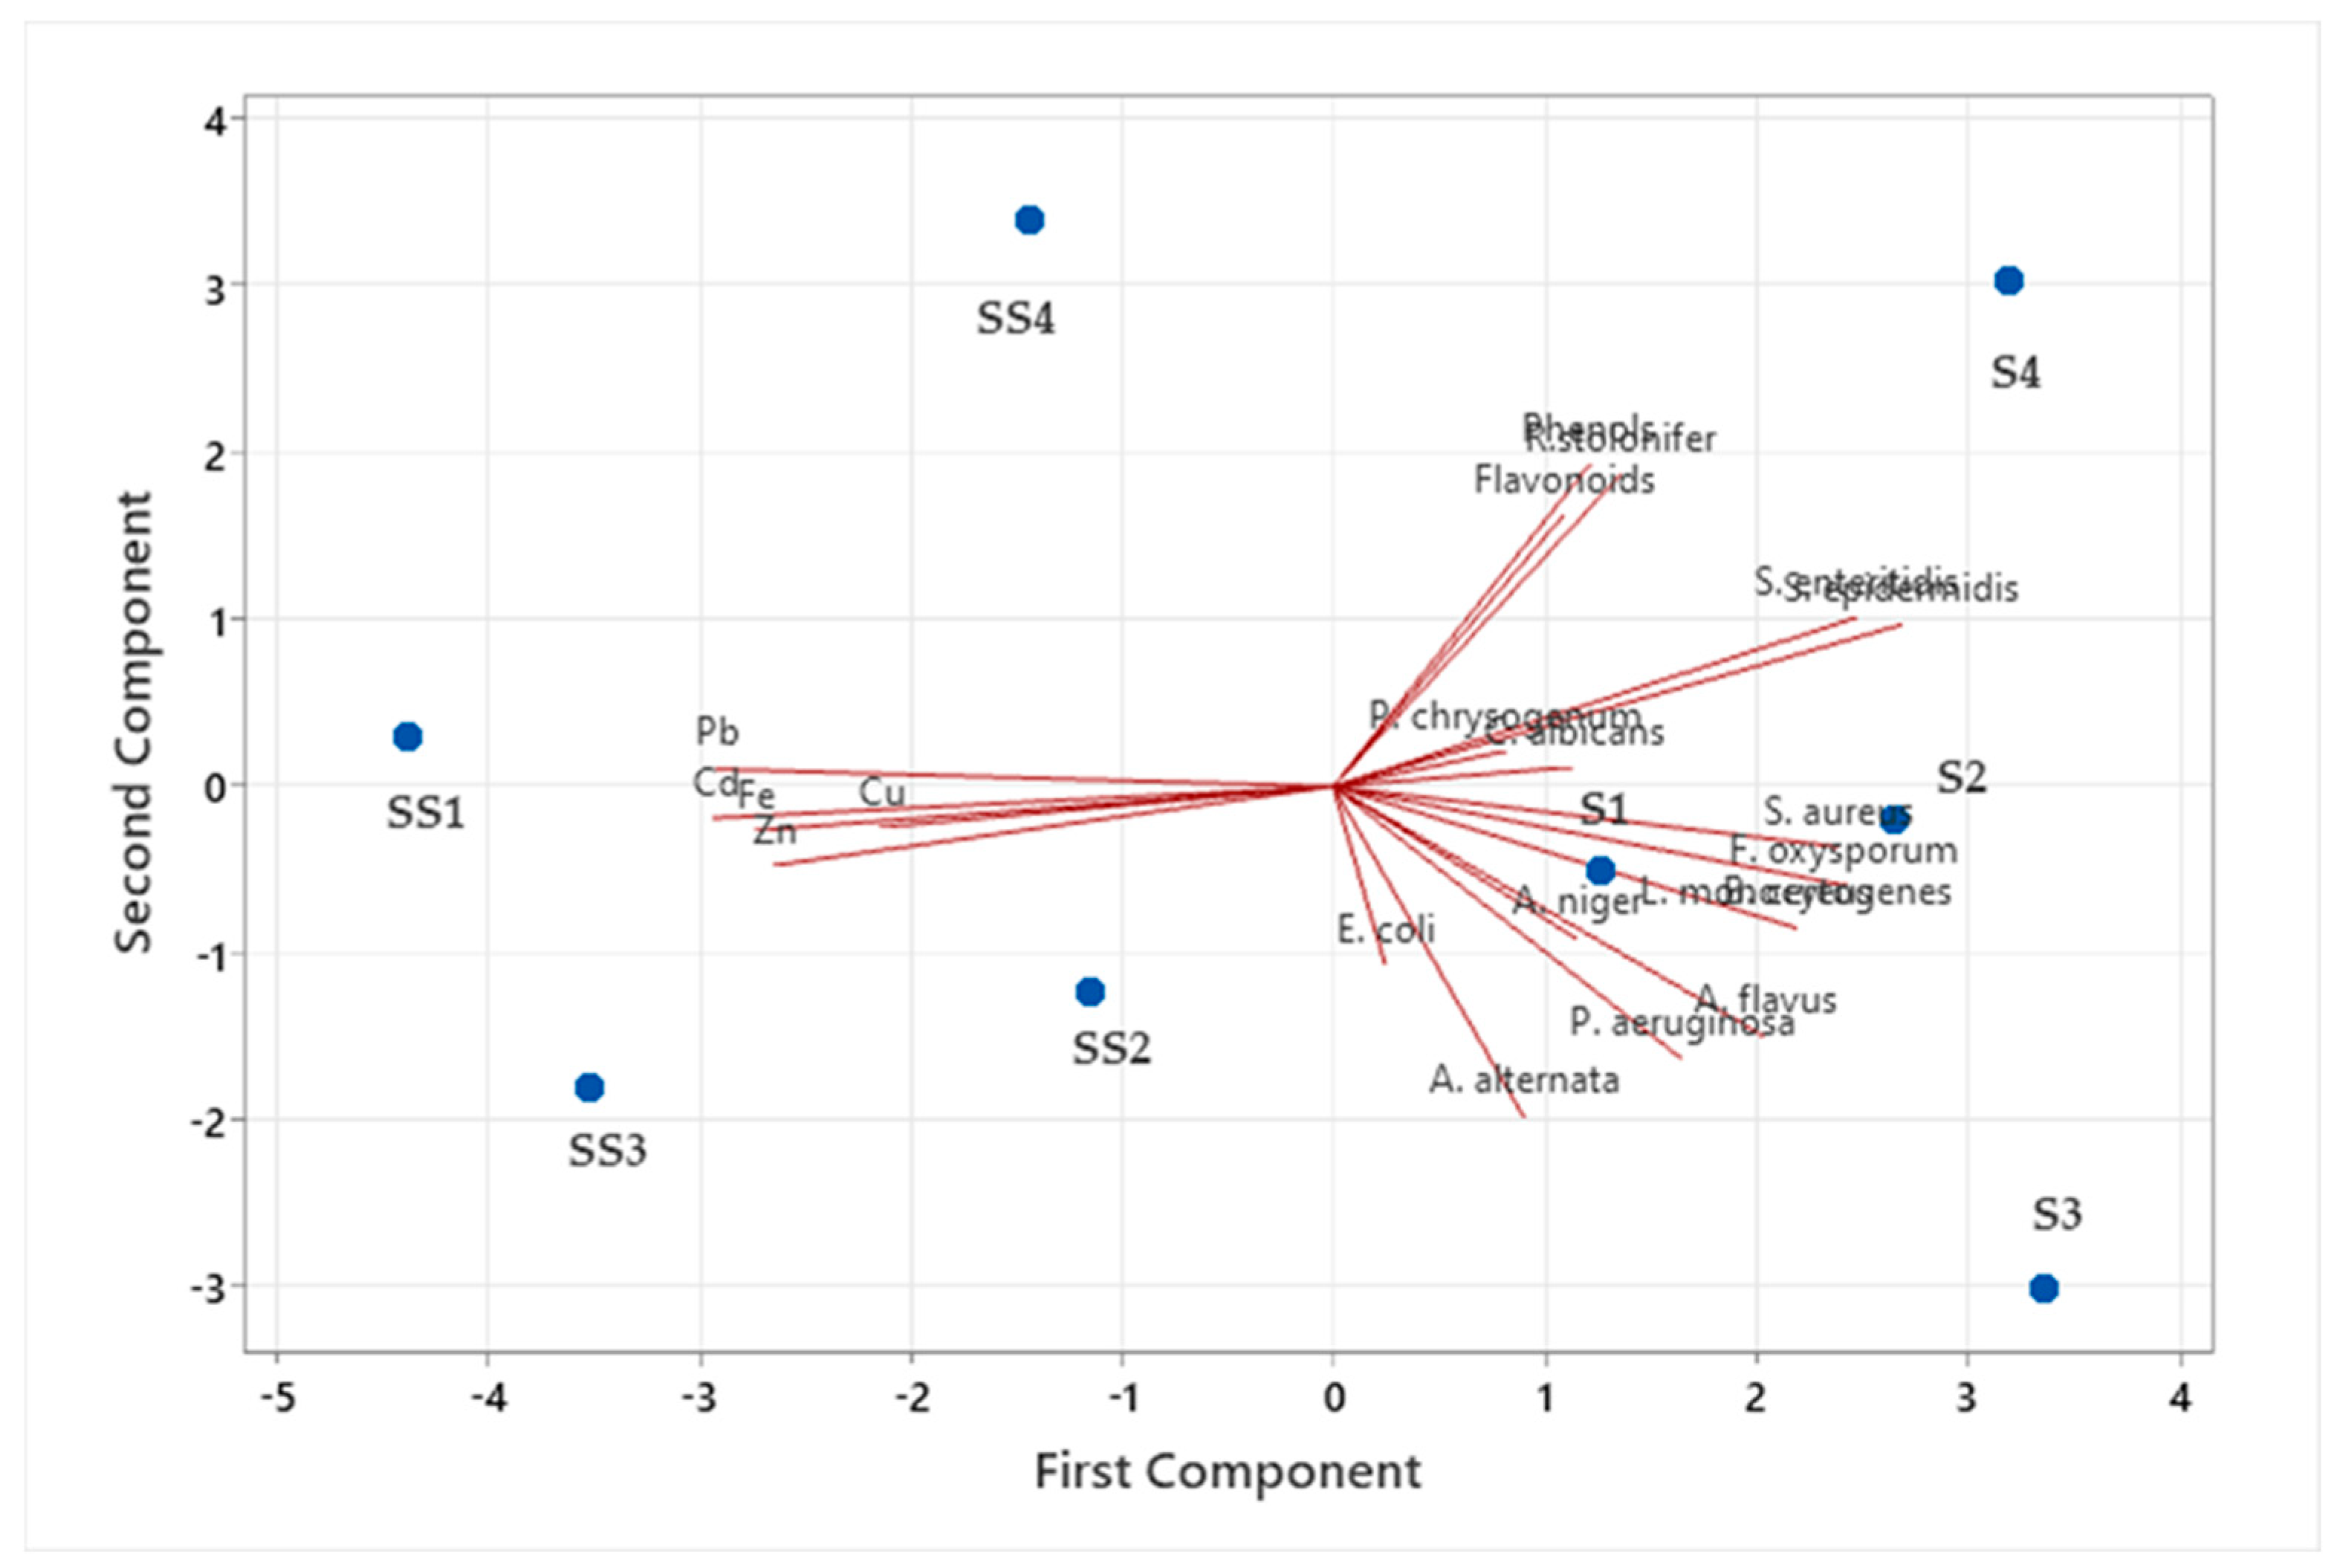
2.4. Statistical Analysis

The statistical analysis was performed using Minitab 21.4.1 software (Minitab, LLC, State College, PA, USA). The Parson’s correlation coefficients among the investigated parameters were determined, and a principal component analysis (PCA) was also conducted.

3. Results

Table 3 presents the results of the physico-chemical evaluation of the honey samples, highlighting key parameters, such as the moisture content, water activity, phenols and flavonoids contents, HMF, and sugar composition.
The physico-chemical analyses revealed a moisture content ranging from 16.42% to 18.03%, complying with the maximum limit of 20% set by Directive 2001/110/EC [47]. The samples showed water activity values ranging from 0.528 to 0.592, while the phenolic content varied between 59.73 and 96.49 mg GAE/100 g, and the flavonoid content ranged from 2.30 to 5.45 mg QE/100 g. The sugar content in the samples varied between a minimum of 1.89% and a maximum of 3.68%, while the inverted sugar content ranged from 72.23% to 80.97%. The HMF content ranged from 0.49 to 1.10 mg/kg across the analyzed samples.
Table 4 presents the concentrations of heavy metals detected in the honey samples analyzed, providing insight into potential environmental contamination.
The values determined for the heavy metals in the analyzed samples (S1–S4 from mining areas and samples SS1–SS4 from protected areas) show significant variations depending on the location. The lead concentrations were highest in sample S1 (0.607 mg/kg), suggesting a strong industrial or mining influence. Cadmium was present in small amounts in the samples, but its presence, even at low levels, indicates anthropogenic influences, such as traffic or pesticide use. Iron appeared in high concentrations in sample S1—12.131 mg/kg, indicating a significant contribution from geological or industrial–mining sources. Copper showed moderate values, with the highest found in S4 (0.545 mg/kg), pointing to local mining activities. Zinc was present in considerable amounts in samples S2 and S1 (6.17 and 5.25 mg/kg, respectively), which, although potentially reflecting a natural presence, also suggests possible environmental contamination. Overall, the lower values in the samples from protected areas compared to those from mining zones may indicate a different distribution of metals between phases, influenced by solubility, pH, the impact of mining areas, or organic matter content.
All the analyzed samples were classified as polyfloral honey, exhibiting a diversified palynological profile without a dominant floral taxon (>45%). The microscopic analysis of the pollen grains revealed the presence of approximately 8–10 pollen types, with the predominant ones being Robinia pseudoacacia (black locust)—22–25%; Tilia spp. (linden)—16–18%; Brassica napus (rapeseed)—11–15%; Helianthus annuus (sunflower)—10–12%; Trifolium spp. (clover)—9–10%; Centaurea spp. (knapweed)—5–8%; Acer spp. (maple)—3–6%,;while the remaining pollen originated from other diverse species. This distribution indicates a mixed origin, characteristic of meadows, forest edges, and agricultural crops, reflecting a high floral biodiversity during the harvesting period.
Table 5 and Table 6 present the antimicrobial activity (antibacterial and antifungal) of the honey samples against the tested strains. The artificial honey did not inhibit any of the strains.
The results of the IZDs of the honey samples for different bacterial strains, compared to the standard antibiotic (Ciprofloxacin, 5 μg), show interesting trends. All the honey samples, regardless of the sampling site, had antibacterial activity, with inhibition diameters ranging from 7 mm to 21 mm. The largest diameters were observed in the case of the two strains of Staphylococcus, followed by P. aeruginosa. In almost all cases, it was observed that the inhibition produced by the honey samples from the protected areas was more intense than in the honey polluted with heavy metals. The highest IZD (21 mm) was observed in the case of S. aureus for sample SS1 from the protected area, followed by 20 mm IZDs in samples SS3 and SS4, both from protected areas. The lowest IZDs (7 mm) were observed for the strains of S. enteritidis for samples S1 and S2 and in the case of B. cereus for sample S4, all from polluted areas.
As with the bacterial strains, Table 6 shows that all the honey samples, regardless of the sampling area, had an antifungal effect on all the strains studied. The IZDs varied between 7 and 12 mm, with the most sensitive strains being those of R. stolonifer and P. chrysogenum. In the case of R. stolonifer, the most effective sample was SS3, from a protected area, with a diameter of 12 mm, close to that produced by the antifungal voriconazole (16 mm). A 12 mm IZD was also produced for P. chrysogenum by the same sample. And, in the case of the fungal strains, it could be observed that the inhibition produced by the honey samples from the protected areas was more intense than that of those from the mining areas.
To understand the relationship between the chemical composition of the honey originating from mining areas and its antimicrobial efficacy, a correlation analysis was performed, shown in Table 7, between the inhibition zone diameter (IZD) determined for the various bacterial strains and the content of the bioactive compounds (phenols, flavonoids), HMF, and heavy metals (Pb, Cd, Fe, Cu, and Zn).
The values of the Pearson correlation coefficients indicate the nature (positive or negative) and strength of these relationships, highlighting the possible influences of contaminants or natural compounds on the antibacterial activity. The Pearson correlation coefficients between the microorganism’s activity (IZD) and various chemical compounds indicate diverse relationships. For example, E. coli showed strong positive correlations with Cd and Fe, while P. aeruginosa exhibited very strong positive correlations with Cu. S. aureus had positive correlations with Cd and Zn. B. cereus and L. monocytogenes displayed strong positive correlations with Cu. The remaining variables showed moderate or weak correlations, suggesting complex interactions with environmental factors.
To evaluate the influence of the chemical parameters on the antifungal activity of the honey from the mining areas, a correlation analysis was conducted, shown in Table 8, between the IZD values for the different fungal species and the content of phenols, flavonoids, HMF, and heavy metals (Pb, Cd, Fe, Cu, and Zn). The results provide insight into how metal contamination or natural composition may affect the antifungal effectiveness of bee products.
The Pearson correlation coefficients between the fungal microorganisms (IZD) and various chemical compounds reveal complex patterns of interaction. For instance, C. albicans showed positive correlations with phenols and Cd, Fe, and Zn, while A. niger and P. chrysogenum displayed strong positive correlations with Pb, Cd, Fe, and Zn. A. alternata showed a strong positive correlation with Cu.
For the protected area, the correlation between the IZD values for the bacterial strains and the chemical composition of the honey was analyzed (Table 9), highlighting the possible influences of bioactive compounds and metals on antimicrobial activity.
The Pearson correlation coefficients for the bacterial microorganisms (IZD) in the protected zone reveal varied interactions with chemical compounds. E. coli exhibited strong negative correlations with flavonoids and Cu, but a strong positive correlation with Cd and Zn, while S. enteritidis showed positive correlations with phenols, flavonoids, and HMF. Conversely, P. aeruginosa had negative correlations with HMF and phenols. Pb exhibited the strongest correlations with the investigated bacterial strains among the analyzed heavy metals.
In the case of honey from the protected areas, the correlations were calculated and are shown in Table 10 between the IZD values for the various fungal strains and chemical parameters to highlight the possible links between composition and antifungal activity.
The Pearson correlation coefficients for the fungal microorganisms (IZD) in the protected zone show distinct patterns of interaction with various chemical compounds. C. albicans and A. niger exhibited positive correlations with Pb, Cd, Fe, and Zn, suggesting the possible stimulatory effect of these metals on their growth, while A. flavus and A. alternata displayed strong negative correlations with HMF and flavonoids, indicating potential inhibitory effects of these compounds on their proliferation. Additionally, P. chrysogenum showed a strong positive correlation with phenols, flavonoids, and HMF, and for the latter, this suggests its potential adaptability to this compound in the environment.

4. Discussion

Honey is a natural product valued not only for its taste but also for its health benefits, making food safety a key concern. The content of heavy metals in honey is an important indicator of its quality and purity [48]. Typically, clean honey contains low levels of heavy metals: Pb ranges from 0.01 to 0.05 mg/kg, with a maximum recommended limit of 0.10 mg/kg according to the Codex Alimentarius and EU regulations [21]; Cd is found in concentrations below 0.005 to 0.02 mg/kg, with a suggested limit of 0.05 mg/kg, though it is not uniformly regulated; As is generally present at levels below 0.01 mg/kg, with a general food limit of 0.1 mg/kg set by the EU; Hg is found at very low levels, under 0.002 mg/kg, with some national regulations allowing up to 0.01–0.02 mg/kg. Additionally, essential metals like Cu and Zn are found in concentrations of 0.1–0.5 mg/kg and 0.5–3 mg/kg, respectively, with maximum recommended limits of 2 mg/kg for copper and 5 mg/kg for zinc, according to FAO standards. Adhering to these limits is crucial to ensure safe consumption and to maintain consumer trust in the quality of honey [49].
The situation changes when polluted areas are considered. For instance, Šerevičienė et al. [10] reported that Pb levels in honey from Lithuania ranged between 0.004 and 450.6 μg/kg. Similarly, Godebo et al. [15] found a high concentration of lead—451 μg/kg—in a honey sample collected from an urban area in North Carolina. The Pb content of honey samples from Italy ranged between 0.010 and 1.390 mg/kg [50]. A study in Iran by Aghamirlou et al. [51] reported one of the highest Pb concentrations in honey globally, at 1627.82 μg/kg (1.6278 mg/kg), over 16 times the EU and Codex Alimentarius limits of 0.10 mg/kg. This suggests significant environmental contamination, likely from industrial activity, traffic, or polluted agricultural inputs. High lead concentrations in honey have been reported in several countries, including Israel, 2560 μg/kg [52]; Turkey, 800 μg/kg [53]; and Poland, 438 μg/kg [54]; highlighting potential environmental contamination in these regions.
The maximum Zn concentrations reported in various studies vary significantly across regions. In Siena, Italy—an area with limited industrial activity—the maximum Zn concentration was 3.66 mg/kg [55]. Higher maximum levels have been observed in other countries, such as Hungary, where values up to 6.66 mg/kg were recorded [56]. Notably, much higher maxima were found in New Zealand, 2.46 mg/kg [57]; Saudi Arabia, 1707.93 μg/kg [58]; and the United Kingdom, 1042 μg/kg [59]. Greece reported one of the highest recorded zinc levels in honey, with a peak value of 8.99 mg/kg [60].
Higher maximum concentrations of cadmium have been found in other countries: Hungary reported values up to 18.0 μg/kg [56], while in Croatia, the maximum reported was 24.4 μg/kg [61]. Even higher levels were observed in New Zealand, with a peak of 34 μg/kg [57], and in Saudi Arabia, cadmium concentrations went as high as 49.2 μg/kg [58]. The United Kingdom also showed significant contamination, with a maximum of 57.3 μg/kg [59], while Greece reported one of the highest known values, reaching 81 μg/kg [60].
The maximum concentrations of essential trace metals, such as Fe, Cu, and Zn, in honey vary widely depending on regional environmental conditions and agricultural practices. For Fe, the highest levels were reported in Turkey, reaching up to 44.1 mg/kg [53], while in Saudi Arabia, the maximum value was 36.8 mg/kg [58]. Copper concentrations peaked at 8.5 mg/kg in Croatia [61], followed by 7.8 mg/kg in Saudi Arabia [58], and 6.3 mg/kg in Iran [51]. For Zn, some of the highest reported values were observed in honey from Greece, with a maximum of 29.4 mg/kg [60]; as well as in Turkey, at 26.0 mg/kg [53]; and Saudi Arabia, at 24.7 mg/kg [58]. Although these elements are essential for human health in trace amounts, elevated levels may reflect environmental contamination from fertilizers, soil composition, or processing equipment.
In mining-polluted areas of Central and Eastern Europe, honey has been identified as an effective bioindicator of heavy metal contamination. Studies conducted in regions such as Copșa Mică and Maramureș (Romania), Bor (Serbia), and industrial zones in Poland have revealed elevated concentrations of toxic metals in honey, often exceeding internationally recommended limits. For instance, in Copșa Mică, Romania, multifloral honey samples showed average concentrations of lead of 1.49 mg/kg, cadmium of 2.20 mg/kg, zinc of 20.40 mg/kg, and copper of 3.70 mg/kg [61], significantly higher than the values reported in other studies. Similarly, in Maramureș, Romania, honey collected near mining areas contained maximum values of Cu of 0.79 mg/kg and Zn of 2.10 mg/kg, surpassing international safety thresholds [62].
Directive 2001/110/EC [47] on the production and marketing of honey has specific references to the permissible limits of potentially hazardous substances in honey and other beekeeping products. However, these are few, and the only metal for which honey has maximum values is lead, which, according to EU Regulation 915/2023 [21], cannot exceed 0.10 mg/kg.
The comparative nature of Table 11 highlights the significant differences in the maximum allowable limits for heavy metals in honey as set by various countries and international organizations. The European Union and Codex Alimentarius enforce a strict limit of 0.10 mg/kg only for Pb, without regulating other contaminants. In contrast, India allows much higher thresholds, with up to 2.5 mg/kg for Pb, 1.5 mg/kg for Cd, 1.0 mg/kg for Hg, and high levels for copper (30 mg/kg) and tin (250 mg/kg) [63]. Prior to its accession to the European Union, Poland applied Regulation no. 37/2003, which set significantly stricter limits for honey: Pb—0.30 mg/kg, Cd—0.03 mg/kg, Hg—0.01 mg/kg, and As—0.20 mg/kg [64]. According to the Chinese standards GB 2762-2022 [65] and GB 14963-2011 [66], China applies more stringent limits, with 0.05 mg/kg for Pb and As, and 0.01 mg/kg for Hg. These variations reflect differing food safety standards shaped by national policies and local industrial conditions.
In 2020, Mititelu et al. [67] collected polyfloral honey samples from Copșa Mică, Romania—an area exposed to over six decades of non-ferrous metal industrial activity. The results revealed elevated concentrations of heavy metals, with maximum values of 3.41 mg/kg for Pb, 3.81 mg/kg for Cd, 36.40 mg/kg for Zn, and 33.00 mg/kg for Cu.
In areas impacted by mining, industrial activities, and intensive agriculture, heavy metal contamination poses a significant environmental hazard. Elevated concentrations of these metals can be toxic to honeybees, while their accumulation in bee-derived products presents potential risks to human health [18]. In their studies, Aksu and Altunatmaz [68] highlighted that lead has emerged as a significant environmental contaminant, often occurring in elevated concentrations due to various anthropogenic activities, particularly mining operations.
The microbiological analysis demonstrated that all the honey samples, regardless of the area from which they were sampled, had both antibacterial and antifungal activity against all the strains studied. These results are consistent with those of other studies conducted in our country [37,69] and in other parts of the world [70,71] on the antibacterial and antifungal effects of polyfloral honey. It is already known that the antimicrobial activity of honeys is different according to the source of the flower and origin area. For polyfloral honey, because the sources are varied and combined from several plant species, it is expected that the antimicrobial effect will be intense.
There is data from the literature that highlights the use of honey as a natural indicator of pollution in mining areas, demonstrating its ability to detect contaminants, such as heavy metals and pesticides [15,72,73]. Due to different antimicrobial effects of honey from mining areas compared to protected ones, our results indicate honey as a possible indicator of polluted areas.
The values presented for the honey samples from mining regions and protected areas can be statistically preprocessed using a principal component analysis (PCA). This method is suitable for reducing the dimensionality of the large dataset, containing variables such as bacteria, fungi, chemical compounds, and heavy metals. It helps identify the relationships between samples and determine whether the samples from mining areas are clearly distinguishable from those from protected areas.
A PCA was applied to a dataset containing the microbiological parameters (presence of bacteria and fungi), bioactive compounds (phenols, flavonoids), and heavy metal content (Pb, Cd, Fe, Cu, and Zn) of the honey samples. The aim of this analysis was to identify the main directions of variation in the data and highlight any distinctions between honey from the mining areas (S) and that from the protected areas (SS).
Figure 4 presents the results of the PCA applied to the honey samples to explore patterns and groupings based on their chemical composition and antimicrobial activity.
The resulting PCA plot illustrates a clear separation between the two types of samples. The samples labeled “S” (S1–S4), corresponding to the mining areas, are distinctly grouped apart from the “SS” samples (SS1–SS4), originating from the protected areas.
This separation highlights the evident impact of the environment on the quality and composition of the honey. The samples from the mining areas are associated with higher levels of heavy metals, such as Pb, Cd, Fe, Cu, and Zn, as well as lower concentrations of bioactive compounds like phenols and flavonoids. On the other hand, the honey from the protected areas contains significantly higher amounts of flavonoids and phenols, indicating superior antioxidant potential and reduced heavy metal contamination.
The analysis indicates that the first three principal components together explain a significant percentage of the total variance in the dataset, namely 85.1%. The first principal component accounts for approximately 43% of the total variance, the second adds 23.8%, and the third contributes 18.3%. Together, these three components represent a considerable portion of the total variability, suggesting that most of the meaningful information in the dataset is captured by just the first three main directions.
Thus, the PCA analysis confirms that environmental factors, especially exposure to heavy metals in mining areas, have a significant influence on the characteristics of honey. This statistical approach provides a valuable visual and analytical method for differentiating honey based on ecological origin and for assessing its qualitative and therapeutic potential.

5. Conclusions

The content of metal cations in honey depends on the specific characteristics of an apiary’s location. The study highlighted significant differences regarding heavy metal contamination in honey depending on the area of origin, showing that the mining regions were associated with high levels of lead, cadmium, iron, copper, and zinc, often exceeding allowable limits. The results indicated maximum values for Pb of 0.607 mg/kg, and detected the presence of the heavy metals investigated in all the honey samples analyzed, except for Cd and Cu, which did not exist in significant amounts.
A comparison of international regulations revealed that only lead is uniformly regulated at both the European Union and Codex Alimentarius levels, while other heavy metals remain insufficiently monitored, emphasizing the need for the global harmonization of food safety standards.
The comparative analysis of the antimicrobial activity of the honey samples from mining areas and protected areas revealed that the samples from protected areas exhibited stronger inhibitory activity against bacteria and fungi compared to those from mining areas.
The statistical correlations between heavy metals and antimicrobial activity suggested, as a whole, the influence of contaminants on microorganism development, with some metals exhibiting inhibitory effects and others possibly playing a stimulatory role, depending on the type of pathogen analyzed. Through the principal component analysis (PCA), a clear separation was observed between the samples from industrial areas and those from protected natural environments, confirming the negative impact of pollution on the chemical composition of honey.
The honey samples collected from ecological zones stood out for their higher concentrations of bioactive compounds, especially phenols and flavonoids, which provide these products with superior antioxidant and antimicrobial potential. The results highlight not only the risks associated with consuming contaminated honey, but also the importance of protecting ecological environments to maintain the quality of bee products, recommending the implementation of strict and continuous monitoring of contamination factors.

Author Contributions

Conceptualization, M.G. and M.L.V.; methodology, M.L.V.; software, M.-T.C.; validation, M.P., M.G. and M.L.V.; formal analysis, M.L.V.; investigation, M.L.V.; resources, M.P.; data curation, M.G.; writing—original draft preparation, M.G.; writing—review and editing, M.G.; visualization, M.-T.C.; supervision, M.P.; project administration, M.G.; funding acquisition, M.-T.C. All authors have read and agreed to the published version of the manuscript.

Funding

This research received no external funding.

Institutional Review Board Statement

Not applicable.

Informed Consent Statement

Not applicable.

Data Availability Statement

The data are contained within the article.

Acknowledgments

The authors would like to express their sincere gratitude to all those who contributed to this research. Special thanks go to the local beekeepers from both the mining and protected sites in Romania, whose cooperation and access to apiaries made the collection of honey samples possible. We also acknowledge the support of all the universities involved, for providing access to analytical equipment and technical expertise. Finally, we thank our colleagues whose valuable feedback helped improve the clarity and quality of this manuscript.

Conflicts of Interest

The authors declare no conflicts of interest.

References

  1. Bonsignore, G.; Martinotti, S.; Ranzato, E. Honey Bioactive Molecules: There Is a World Beyond the Sugars. BioTech 2024, 13, 47. [Google Scholar] [CrossRef]
  2. Tafere, D.A. Chemical composition and uses of Honey: A Review. J. Food Sci. Nutr. Res. 2021, 4, 194–201. [Google Scholar] [CrossRef]
  3. Celli, G.; Maccagnani, B. Honey bees as bioindicators of environmental pollution. Bull. Insectology 2003, 56, 137–139. [Google Scholar]
  4. Bora, F.D.; Andrecan, A.F.; Călugăr, A.; Bunea, C.I.; Popescu, M.; Petrescu-Mag, I.V.; Bunea, A. Comprehensive Elemental Profiling of Romanian Honey: Exploring Regional Variance, Honey Types, and Analyzed Metals for Sustainable Apicultural and Environmental Practices. Foods 2024, 13, 1253. [Google Scholar] [CrossRef] [PubMed]
  5. Tlak Gajger, I.; Pavliček, D.; Oreščanin, V.; Varenina, I.; Sedak, M.; Bilandžić, N. Mineral Concentrations in Different Types of Honey Originating from Three Regions of Continental Croatia. Foods 2024, 13, 2754. [Google Scholar] [CrossRef]
  6. Lin, Z.; Shen, S.; Wang, K.; Ji, T. Biotic and abiotic stresses on honeybee health. Integr. Zool. 2024, 19, 442–457. [Google Scholar] [CrossRef]
  7. El-Seedi, H.R.; Ahmed, H.R.; El-Wahed, A.A.A.; Saeed, A.; Algethami, A.F.; Attia, N.F.; Guo, Z.; Musharraf, S.G.; Khatib, A.; Alsharif, S.M.; et al. Bee Stressors from an Immunological Perspective and Strategies to Improve Bee Health. Vet. Sci. 2022, 9, 199. [Google Scholar] [CrossRef] [PubMed]
  8. International Statistics. Bee colonies: Worldwide Population on the Rise. Available online: https://www.destatis.de/EN/Themes/Countries-Regions/International-Statistics/Data-Topic/AgricultureForestryFisheries/Bees.html (accessed on 10 April 2025).
  9. Margaoan, R.; Papa, G.; Nicolescu, A.; Cornea-Cipcigan, M.; Kösoğlu, M.; Topal, E.; Negri, I. Environmental pollution effect on honey bees and their derived products: A comprehensive analysis. Environ. Sci. Pollut. Res. Int. 2025, 32, 10370–10391. [Google Scholar] [CrossRef]
  10. Šerevičienė, V.; Zigmontienė, A.; Paliulis, D. Heavy Metals in Honey Collected from Contaminated Locations: A Case of Lithuania. Sustainability 2022, 14, 9196. [Google Scholar] [CrossRef]
  11. Tong, D.Q.; Gill, T.E.; Sprigg, W.A.; Van Pelt, R.S.; Baklanov, A.A.; Barker, B.M.; Bell, J.E.; Castillo, J.; Gassó, S.; Gaston, C.J.; et al. Health and Safety Effects of Airborne Soil Dust in the Americas and Beyond. Rev. Geophys. 2023, 61, e2021RG000763. [Google Scholar] [CrossRef]
  12. Borsuk, G.; Sulborska, A.; Stawiarz, E.; Olszewski, K.; Wiącek, D.; Ramzi, N.; Nawrocka, A.; Jędryczka, M. Capacity of honeybees to remove heavy metals from nectar and excrete the contaminants from their bodies. Apidologie 2021, 52, 1098–1111. [Google Scholar] [CrossRef]
  13. Demková, L.; Hauptvogl, M.; Oboňa, J.; Bobuľská, L.; Jančo, I.; Harangozo, Ľ.; Lakatošová, J.; Kowalski, S.; Árvay, J. Comprehensive assessment of mercury contamination in bees, bee products and moss and lichen bags. Ecotoxicol. Environ. Saf. 2024, 285, 117132. [Google Scholar] [CrossRef] [PubMed]
  14. Abd Wahid, D.N.; Wan Mohamad Nazarie, W.F.; Jawan, R.; Abdulla, R.; Gansau, J.A.; Sabullah, M.K. Potential Existence of Heavy Metal Pollution and Pesticide in Honey-Based Products. Preprints 2021, 2021120379. [Google Scholar] [CrossRef]
  15. Godebo, T.R.; Stoner, H.; Taylor, P.; Jeuland, M. Metals in honey from bees as a proxy for environmental contamination in the United States. Environ. Pollut. 2025, 364, 125221. [Google Scholar] [CrossRef]
  16. Moghimi Dehkordi, M.; Pournuroz Nodeh, Z.; Soleimani Dehkordi, K.; Salmanvandi, H.; Rasouli Khorjestan, R.; Ghaffarzadeh, M. Soil, air, and water pollution from mining and industrial activities: Sources of pollution, environmental impacts, and prevention and control methods. Results Eng. 2024, 23, 102729. [Google Scholar] [CrossRef]
  17. Angon, P.B.; Islam, M.S.; Kc, S.; Das, A.; Anjum, N.; Poudel, A.; Suchi, S.A. Sources, effects and present perspectives of heavy metals contamination: Soil, plants and human food chain. Heliyon 2024, 10, e28357. [Google Scholar] [CrossRef]
  18. Burden, C.M.; Morgan, M.O.; Hladun, K.R.; Amdam, G.V.; Trumble, J.J.; Smith, B.H. Acute sublethal exposure to toxic heavy metals alters honey bee (Apis mellifera) feeding behavior. Sci. Rep. 2019, 9, 4253. [Google Scholar] [CrossRef]
  19. Costa, A.; Veca, M.; Barberis, M.; Tosti, A.; Notaro, G.; Nava, S.; Lazzari, M.; Agazzi, A.; Tangorra, F.M. Heavy Metals on Honeybees Indicate Their Concentration in the Atmosphere. a Proof of Concept. Ital. J. Anim. Sci. 2018, 18, 309–315. [Google Scholar] [CrossRef]
  20. Vică, M.L.; Glevitzky, I.; Glevitzky, M.; Siserman, C.V.; Matei, H.V.; Teodoru, C.A. Antibacterial Activity of Propolis Extracts from the Central Region of Romania against Neisseria gonorrhoeae. Antibiotics 2021, 10, 689. [Google Scholar] [CrossRef]
  21. European Commission. Commission Regulation (EU) 2023/915 of 25 April 2023 on Maximum Levels for Certain Contaminants in Food and Repealing Regulation (EC) No 1881/2006. Available online: https://eur-lex.europa.eu/eli/reg/2023/915/oj (accessed on 10 April 2024).
  22. Ispas, G.; Roba, C.; Bălc, R.; Coadă, M.; Gligor, D. The Quality of Water and Soil in Haneș Mining Area, Alba County, Romania. Carpathian J. Earth Environ. Sci. 2018, 13, 505–514. [Google Scholar] [CrossRef]
  23. Iatan, E.-L. Environmental Problems Associated with the Mining Activities in the Apuseni Mountains, Romania Conference. In Proceedings of the The Annual Scientific Session Of The Institute Of Geodynamics, Bucharest, Romania, 27–28 March 2018; pp. 82–86. Available online: https://www.geodin.ro/CUTE/wp-content/uploads/2019/11/Iatan-2019.pdf (accessed on 24 March 2025).
  24. Certej—Mining Watch Romania. Available online: https://miningwatch.ro/en/certej-2/ (accessed on 24 March 2025).
  25. 42 Years Since the Accident at the GOLD mine in Certej, Romania. Available online: https://2celsius.org/media/42-years-since-the-accident-at-the-gold-mine-in-certej-romania/ (accessed on 25 March 2025).
  26. Zajzon, N.; Szentpéteri, K.; Szakáll, S.; Kristály, F. The origin of the Avram Iancu U–Ni–Co–Bi–As mineralization, Băiţa (Bihor) metallogenic district, Bihor Mts., Romania. Int. J. Earth Sci. (Geol. Rundsch.) 2015, 104, 1865–1887. [Google Scholar] [CrossRef]
  27. Environmental Restoration Plans and Activities in the Zones of Uranium Ore Extraction and Milling in Romania: 1995–1996 Progress Report, Planning for Environmental Restoration of Uranium Mining and Milling Sites in Central and Eastern Europe. Proceedings of a Workshop Held Under the Technical Co-Operation Project RER/9/022 on Environmental Restoration in Central and Eastern Europe, Workshop on Planning for Environmental Restoration of Uranium Mining and Milling Sites in Central and Eastern Europe. 4–8 Nov 1996, Felix (Romania). pp. 135–152. International Atomic Energy AgENcY. 1997. Available online: https://inis.iaea.org/records/3yfjf-9h824 (accessed on 1 March 2025).
  28. Bara, N.; Stefanescu, L. Water Quality Assessment in Balan, Romania—Case Study. 2018. Available online: https://www.researchgate.net/publication/327499313_WATER_QUALITY_ASSESSMENT_IN_BALAN_ROMANIA_-_CASE_STUDY?channel=doi&linkId=5b923f95a6fdccfd541faafd&showFulltext=true (accessed on 3 March 2025). [CrossRef]
  29. Bara, N.; Gati, G.; Pop, C.; Gurzău, E. The Pollution Effects of Mining Industry on Small Rivers—A Case Study. 2016. Available online: https://www.researchgate.net/publication/327499303_The_pollution_effects_of_mining_industry_on_small_rivers_-_A_Case_Study?channel=doi&linkId=5b923f954585153a5300465a&showFulltext=true (accessed on 7 March 2025). [CrossRef]
  30. National Agency for Protected Natural Areas—Note No. 2415 Dated 19.04.2021, Regarding the Approval of the Minimum Set of Special Protection and Conservation Measures for Biological Diversity, as Well as the Conservation of Natural Habitats, Wild Flora and Fauna, Public Safety, and Investments in ROSCI0029 Glodului, Cibului, and Măzii Gorges. Available online: https://ananp.gov.ro/wp-content/uploads/ROSCI0029-SKM_28722030210380.V.pdf (accessed on 4 March 2025).
  31. National Agency for Protected Natural Areas—Note No. 4647 Dated 26.07.2021, Regarding the Approval of the Minimum Set of Special Protection and Conservation Measures for Biological Diversity, as Well as the Conservation of Natural Habitats, Wild Flora and Fauna, Public Safety, and Investments in ROSPA0132 Metaliferi Mountains. Available online: https://ananp.gov.ro/wp-content/uploads/ROSPA0132-SKM_28721080508200.pdf (accessed on 4 March 2025).
  32. National Agency for Protected Natural Areas—Note No. 1787 Dated 24.03.2022, Regarding the Approval of the Minimum Set of Special Protection and Conservation Measures for Biological Diversity, as Well as the Conservation of Natural Habitats, Wild Flora and Fauna, Public Safety, and Investments in ROSCI0324 Bihor Mountains. Available online: https://ananp.gov.ro/wp-content/uploads/ROSCI0324-SKM_28722033010380.pdf (accessed on 4 March 2025).
  33. National Agency for Protected Natural Areas—Decision No. 145 Dated 08.04.2021, Regarding the Approval of the Methodological Rules for Implementing the Conservation Objectives from the Annex to Order No. 1523/2016 of the Ministry of Environment, Waters and Forests, Concerning the Approval of the Management Plan and the Regulation of the Bicazului-Hășmaș Gorges National Park and the Natura 2000 sites ROSCI0027 and ROSPA0018 Bicazului-Hășmaș Gorges (Excluding the Overlapping Area with ROSCI0033 Șugăului-Munticelu Gorges). Available online: https://ananp.gov.ro/wp-content/uploads/ROSCI0027-SKM_28722030210320.V.pdf (accessed on 4 March 2025).
  34. AOAC. 978.18 Water Activity. In Official Methods of Analysis of the Association of Official Analytical Chemist, 16th ed.; Association of Official Analytical Chemists: Washington, DC, USA, 1995. [Google Scholar]
  35. Ebrahimi, Y.; Ramírez-Coronel, A.A.; Al-Dhalimy, A.M.B.; Alfilm, R.H.C.; Al-Hassan, M.; Obaid, R.F.; Alameri, A.A.; Rastiani, F.; Yousef, K.; Shokri, S. Contamination of honey products by Clostridium botulinum spores and fungi along with their effects on human health. Casp. J. Environ. Sci. 2023, 20, 1143–1148. [Google Scholar]
  36. Singleton, V.L.; Orthofer, R.; Lamuela-Raventós, R.M. Analysis of total phenols and other oxidation substrates and antioxidants by means of folin-ciocalteu reagent. Methods Enzymol. 1999, 29, 10–18. [Google Scholar]
  37. Vica, M.L.; Glevitzky, M.; Dumitrel, G.A.; Junie, L.M.; Popa, M. Antibacterial activity of different natural honeys from Transylvania, Romania. J. Environ. Sci. Health—B Pestic. Food Contam. Agric. Wastes. 2014, 49, 176–181. [Google Scholar] [CrossRef] [PubMed]
  38. Sultana, S.; Lawag, I.L.; Lim, L.Y.; Foster, K.J.; Locher, C. A Critical Exploration of the Total Flavonoid Content Assay for Honey. Methods Protoc. 2024, 7, 95. [Google Scholar] [CrossRef] [PubMed]
  39. Bogdanov, S.; Harmonized Methods of the European Honey Commission. International Honey Commission. 2009. Available online: www.bee-hexagon.net (accessed on 5 September 2024).
  40. Vică, M.L.; Glevitzky, M.; Dumitrel, G.-A.; Bostan, R.; Matei, H.V.; Kartalska, Y.; Popa, M. Qualitative Characterization and Antifungal Activity of Romanian Honey and Propolis. Antibiotics 2022, 11, 1552. [Google Scholar] [CrossRef]
  41. SR 784/3:2009/C(91:2012); Honey Part 3: Analysis Methods. ASRO: Bucharest, Romania, 1984. Available online: https://e-standard.eu/en/standard/174480 (accessed on 7 January 2025). (In Romanian)
  42. Glevitzky, M.; Corcheş, M.T.; Popa, M.; Glevitzky, I.; Vică, M.L. Propolis: Biological Activity and Its Role as a Natural Indicator of Pollution in Mining Areas. Environments 2025, 12, 105. [Google Scholar] [CrossRef]
  43. CLSI M100; Performance Standards for Antimicrobial Susceptibility Testing. Clinical and Laboratory Standard Institute: Wayne, PA, USA, 2020. Available online: https://clsi.org/shop/standards/m100/ (accessed on 22 January 2025).
  44. Vică, M.L.; Glevitzky, M.; Heghedűş-Mîndru, R.C.; Glevitzky, I.; Matei, H.V.; Balici, S.; Popa, M.; Teodoru, C.A. Potential Effects of Romanian Propolis Extracts against Pathogen Strains. Int. J. Environ. Res. Public Health 2022, 19, 2640. [Google Scholar] [CrossRef]
  45. Louveaux, J.; Maurizio, A.; Vorwohl, G. Methods of Melissopalynology. Bee World. 1978, 59, 139–157. [Google Scholar] [CrossRef]
  46. Marghitaș, L.A. Bees and Their Products; Ceres Press: Bucharest, Romania, 2008; p. 390. (In Romanian) [Google Scholar]
  47. 2001/110/EC; Council Directive of 20 December 2001 Relating to Honey. European Parliament: Luxembourg, 2001.
  48. Sharaf El-Din, M.G.; Farrag, A.F.S.; Wu, L.; Huang, Y.; Wang, K. Health benefits of honey: A critical review on the homology of medicine and food in traditional and modern contexts. J. Tradit. Chin. Med. Sci. 2025, 12, 147–164. [Google Scholar] [CrossRef]
  49. Derrar, S.; Nava, V.; Ayad, M.A.; Saim, M.S.; Aggad, H.; Spanò, I.M.; Litrenta, F.; Leonardi, M.; Albergamo, A.; Lo Turco, V.; et al. Safety Assessment of Honeys from Northern and Southern Algerian Regions. Agriculture 2024, 14, 1503. [Google Scholar] [CrossRef]
  50. Perna, A.; Intaglietta, I.; Simonetti, A.; Gambacorta, E. Metals in Honeys from Different Areas of Southern Italy. Bull. Environ. Contam. Toxicol. 2014, 92, 253–258. [Google Scholar] [CrossRef]
  51. Aghamirlou, H.M.; Khadem, M.; Rahmani, A.; Sadeghian, M.; Mahvi, A.H.; Akbarzadeh, A.; Nazmara, S. Heavy Metals Determination in Honey Samples Using Inductively Coupled Plasma-Optical Emission Spectrometry. J. Environ. Health Sci. Eng. 2015, 13, 39. [Google Scholar] [CrossRef]
  52. Dag, A.; Afik, O.; Yeselson, Y.; Schaffer, A.; Shafir, S. Physical, chemical and palynological characterization of avocado (Persea americana Mill.) honey in Israel. Int. J. Food Sci. Technol. 2006, 41, 387–394. [Google Scholar] [CrossRef]
  53. Tutun, H.; Kahraman, H.A.; Aluc, Y.; Avci, T.; Ekici, H. Investigation of some metals in honey samples from West Mediterranean region of Turkey. Vet. Res. Forum 2019, 10, 181–186. [Google Scholar] [CrossRef] [PubMed]
  54. Chudzinska, M.; Baralkiewicz, D. Estimation of honey authenticity by multielements characteristics using inductively coupled plasma-mass spectrometry (ICP-MS) combined with chemometrics. Food Chem. Toxicol. 2010, 48, 284–290. [Google Scholar] [CrossRef]
  55. Pisani, A.; Protano, G.; Riccobono, F. Minor and trace elements in different honey types produced in Siena County (Italy). Food Chem. 2008, 107, 1553–1560. [Google Scholar] [CrossRef]
  56. Czipa, N.; Andrasi, D.; Kovacs, B. Determination of essential and toxic elements in Hungarian honeys. Food Chem. 2015, 175, 536–542. [Google Scholar] [CrossRef]
  57. Vanhanen, L.P.; Emmertz, A.; Savage, G.P. Mineral analysis of mono-floral New Zealand honey. Food Chem. 2011, 128, 236–240. [Google Scholar] [CrossRef]
  58. Bazeyad, A.Y.; Al-Sarar, A.S.; Rushdi, A.I.; Hassanin, A.S.; Abobakr, Y. Levels of heavy metals in a multifloral Saudi honey. Environ. Sci. Pollut. Control Ser. 2019, 26, 3946–3953. [Google Scholar]
  59. Shaw, J.; Cunningham, C.; Harper, S.; Ragazzon-Smith, A.; Lythgoe, P.R.; Walker, T.R. Biomonitoring of honey metal(loid) pollution in Northwest England by citizen scientists. Environ. Adv. 2023, 13, 100406. [Google Scholar] [CrossRef]
  60. Karabagias, I.; Louppis, A.; Kontakos, S.; Papastephanou, C.; Kontominas, M. Characterization and geographical discrimination of Greek pine and thyme honeys based on their mineral content, using chemometrics. Eur. Food Res. Technol. Z. Lebensm. Unters. Forsch. 2016, 243, 101–113. [Google Scholar] [CrossRef]
  61. Bartha, S.; Taut, I.; Goji, G.; Vlad, I.A.; Dinulică, F. Heavy Metal Content in Polyfloral Honey and Potential Health Risk. A Case Study of Copșa Mică, Romania. Int. J. Environ. Res. Public Health 2020, 17, 1507. [Google Scholar] [CrossRef]
  62. Bora, F.D.; Babeș, A.C.; Călugăr, A.; Jitea, M.I.; Hoble, A.; Filimon, R.V.; Bunea, A.; Nicolescu, A.; Bunea, C.I. Unravelling Heavy Metal Dynamics in Soil and Honey: A Case Study from Maramureș Region, Romania. Foods 2023, 12, 3577. [Google Scholar] [CrossRef] [PubMed]
  63. The Food Safety and Standards Authority of India, 2.8.3 Honey and It’s by Products. Available online: https://fpas.fssai.gov.in/getSubCategoryList?exportProduct=false&isNewProduct=1&productid=470&productname=1&utm (accessed on 17 March 2025).
  64. Regulation of the Minister of Health of January 13, 2003 on the Maximum Levels of Chemical and Biological Contaminants That May Be Present in Food, Food Ingredients, Permitted Food Additives, Processing Aids, or on the Surface of Food the Official Journal of 2003, No. 37, Item 326, Annex 1, pp. 2411–2439. Available online: https://isap.sejm.gov.pl/isap.nsf/download.xsp/WDU20030370326/O/D20030326.pdf (accessed on 15 June 2025).
  65. National Committee of Standardization. GB2762-2022; Maximum Levels of Contaminants in Foods. State Administration for Market Regulation: Beijing, China; Standardization Administration of PRC: Beijing, China, 2022.
  66. GB14963-2011; National Food Safety Standard Honey. National Standards of People’s Republic of China, National Food Safety Standard Honey People’s Republic of China Ministry of Health: Beijing China, 2011.
  67. Mititelu, M.; Udeanu, D.I.; Nedelescu, M.; Neacsu, S.M.; Nicoara, A.C.; Oprea, E.; Ghica, M. Quality Control of Different Types of Honey and Propolis Collected from Romanian Accredited Beekeepers and Consumer’s Risk Assessment. Crystals 2022, 12, 87. [Google Scholar] [CrossRef]
  68. Yılmaz Aksu, F.; Sandikci Altunatmaz, S. Risks related to heavy metal contamination in foods. J. Food Hyg. Technol.-Spec. Top. 2017, 3, 218–230. [Google Scholar]
  69. Junie, L.M.; Vică, M.L.; Glevitzky, M.; Matei, H.V. Physico-chemical Characterization and Antibacterial Activity of Different Types of Honey Tested on Strains Isolated from Hospitalized Patients. J. Apic. Sci. 2016, 60, 5–18. [Google Scholar] [CrossRef]
  70. Tajik, H.; Shokouhi, F. In vitro evaluation of antimicrobial efficacy of natural honey in comparison with sulfonamide derivatives. J. Anim. Vet. Adv. 2009, 8, 23–25. [Google Scholar]
  71. Tumin, N.; Arsyiah, N.; Halim, A.; Shahjahan, M.; Izani, N.; Sattar, M. Antibacterial activity of local Malaysian honey. Malay. J. Pharm. Sci. 2005, 13, 129. [Google Scholar]
  72. Bastías, J.M.; Jambon, P.; Muñoz, O.; Manquián, N.; Bahamonde, P.; Neira, M. Honey as a bioindicator of arsenic contamination due to volcanic and mining activities in Chile. Chil. J. Agric. Res. 2013, 73, 147–153. [Google Scholar] [CrossRef]
  73. Herrero-Latorre, C.; Barciela-García, J.; García-Martín, S.; Peña-Crecente, R.M. The use of honeybees and honey as environmental bioindicators for metals and radionuclides: A review. Environ. Rev. 2017, 25, 463–480. [Google Scholar] [CrossRef]
Figure 1. Geographical distribution of honey sampling points analyzed from various areas affected by mining activities and from protected natural zones.
Applsci 15 07297 g001
Figure 2. Geographical location of honey sampling points S1–S3 and SS1–SS3 in Romania.
Applsci 15 07297 g002
Figure 3. The geographical location of the honey sample collection points S4 and SS4 in Romania.
Applsci 15 07297 g003
Figure 4. PCA observations biplot of the first two components performed on the honey samples from mining and protected areas, illustrating the differentiation based on the chemical composition and microbial parameters.
Applsci 15 07297 g004
Table 1. Identification of honey samples from locations associated with mining operations in Romania.
Sample No.CountyAreaMineral Resource Type
S1AlbaZlatna Mining Operation, Haneș MineGold, silver, copper, lead, and zinc.
S2HunedoaraCerteju de Sus Mining OperationGold, silver, copper, lead, and zinc.
S3BihorBăița Mining OperationGold, silver, copper, lead, zinc, and uranium.
S4HarghitaBălan Mining OperationCopper, gold, silver, lead, and zinc.
Table 2. Identification of honey samples collected from protected natural areas in Romania.
Sample No.CountyAreaBiodiversity Protection Site
SS1AlbaAlmașu Mare CommuneROSCI0029 Glodului, Cibului, and Măzii Gorges
SS2HunedoaraBalșa CommuneROSPA0132 Metaliferi Mountains
SS3BihorCriștioru de Jos CommuneROSCI0324 Bihor Mountains
SS4HarghitaBălan TownROSAC0027 Bicaz–Hășmaș Gorges
Table 3. Physico-chemical evaluation of honey samples.
Sample No.H, %awPhenols,
mg GAE/100 g
Flavonoids,
mg QE/100 g
Sugar,
%
Inverted
Sugar, %
HMF,
mg/100 g
S116.53 ± 0.520.583 ± 0.01170.39 ± 0.474.11 ± 0.202.29 ± 0.3372.23 ± 1.390.59 ± 0.10
SS117.18 ± 0.180.547 ± 0.01382.14 ± 0.614.26 ± 0.182.84 ± 0.3079.99 ± 2.800.76 ± 0.14
S216.42 ± 0.390.528 ± 0.02663.84 ± 0.302.30 ± 0.112.88 ± 0.2878.96 ± 2.441.10 ± 0.23
SS217.09 ± 0.310.569 ± 0.01872.67 ± 0.522.67 ± 0.042.68 ± 0.3678.44 ± 1.050.92 ± 0.20
S316.74 ± 0.200.571 ± 0.02384.91 ± 0.864.08 ± 0.233.68 ± 0.4179.11 ± 2.670.80 ± 0.16
SS316.90 ± 0.440.535 ± 0.00996.49 ± 1.035.45 ± 0.173.65 ± 0.7778.47 ± 2.531.03 ± 0.12
S418.03 ± 0.570.592 ± 0.01459.73 ± 0.263.08 ± 0.101.89 ± 0.2080.97 ± 3.310.68 ± 0.10
SS417.25 ± 0.260.560 ± 0.01563.20 ± 0.443.31 ± 0.153.16 ± 0.6379.15 ± 2.020.49 ± 0.15
Abbreviations: H—moisture content; aw—water activity; HMF—hydroxymethylfurfural content. Note: All values are expressed as mean ± standard deviation (n = 3).
Table 4. Heavy metals identified in honey samples.
Sample
No.
Pb,
mg/kg
Cd,
mg/kg
Fe,
mg/kg
Cu,
mg/kg
Zn,
mg/kg
S10.607 ± 0.0610.018 ± 0.00112.131 ± 0.8850.428 ± 0.0475.250 ± 0.278
SS10.072 ± 0.005<0.0011.068 ± 0.0700.073 ± 0.0030.091 ± 0.016
S20.451 ± 0.0430.020 ± 0.0049.260 ± 0.6510.211 ± 0.0516.170 ± 0.235
SS20.058 ± 0.0040.013 ± 0.0010.472 ± 0.0320.031 ± 0.0020.114 ± 0.023
S30.320 ± 0.0390.014 ± 0.0022.210 ± 0.0930.185 ± 0.0370.822 ± 0.057
SS30.056 ± 0.003<0.0010.623 ± 0.0810.060 ± 0.0080.060 ± 0.019
S40.218 ± 0.025<0.0013.432 ± 0.1260.545 ± 0.0641.202 ± 0.162
SS40.055 ± 0.002<0.0010.067 ± 0.0190.063 ± 0.0050.075 ± 0.024
Note: All values are expressed as mean ± standard deviation (n = 3).
Table 5. Antibacterial activity of honey samples against the used strains—inhibition zone diameter (mm).
Bacterial
Strain
SampleSynthetic Antibiotic
S1SS1S2SS2S3SS3S4SS4Ciprofloxacin, 5 µg
E. coli91112148881029
S. enteritidis7878898827
P. aeruginosa141713151113151825
S. aureus182119191820182030
S. epidermidis161816181819171829
B. cereus88899107830
L. monocytogenes89888991024
Table 6. Antifungal activity of honey samples against the used strain—inhibition zone diameter (mm).
Fungal
Strain
SampleSynthetic Antibiotic
S1SS1S2SS2S3SS3S4SS4Voriconazole, 1 µg
C. albicans910910998937
A. flavus89998991043
A. niger910910798945
R.stolonifer101181011129916
F. oxysporum8991091091129
P. chrysogenum101111118128918
A. alternata9109978101116
Table 7. Pearson correlation coefficients between IZD values and chemical parameters of honey from mining areas for different bacterial strains.
Correlation IZD VersusPhenolsFlavonoidsHMFPb, mg/kgCd, mg/kgFe, mg/kgCu, mg/kgZn, mg/kg
E. coli−0.36 *9−0.74 *110.81 *30.44 *50.64 *40.57 *4−0.45 *90.84 *3
S. enteritidis0.27 *80.25 *6−0.27 *8−0.89 *11−0.77 *11−0.96 *120.15 *6−0.99 *12
P. aeruginosa−0.88 *11−0.29 *8−0.39 *90.01 *6−0.50 *100.32 *50.91 *20.19 *6
S. aureus−0.36 *9−0.84 *110.92 *20.21 *50.52 *40.35 *5−0.50 *100.68 *4
S. epidermidis0.64 *40.42 *5−0.15 *8−0.70 *10−0.43 *9−0.92 *12−0.22 *8−0.92 *12
B. cereus−0.60 *10−0.24 *8−0.34 *9−0.72 *11−0.96 *12−0.47 *90.78 *3−0.53 *10
L. monocytogenes−0.60 *10−0.24 *8−0.34 *9−0.72 *11−0.96 *12−0.47 *90.78 *3−0.53 *10
Note: *1—perfect positive correlation (r value: +1); *2—very strong positive correlation (r value: +0.9 to +1.0); *3—strong positive correlation (r value: +0.7 to +0.9); *4—moderate positive correlation (r value: +0.5 to +0.7); *5—weak positive correlation (r value: +0.3 to +0.5); *6—very weak positive or no correlation (r value: 0 to +0.3); *7—no linear correlation (r value: 0); *8—very weak negative or no correlation (r value: 0 to −0.3); *9—weak negative correlation (r value: −0.3 to −0.5); *10—moderate negative correlation (r value: −0.5 to −0.7); *11—strong negative correlation (r value: −0.7 to −0.9); *12—very strong negative correlation (r value: −0.9 to −1.0); *13—perfect negative correlation (r value: −1).
Table 8. Pearson correlation coefficients between IZD values and chemical parameters of honey from mining areas for different fungal strains.
Correlation IZD VersusPhenolsFlavonoidsHMFPb, mg/kgCd, mg/kgFe, mg/kgCu, mg/kgZn, mg/kg
C. albicans0.60 *100.24 *60.34 *50.72 *30.69 *40.47 *5−0.78 *110.53 *4
A. flavus−0.83 *11−0.93 *120.51 *4−0.44 *90.01 *6−0.10 *80.24 *60.14 *6
A. niger−0.64 *10−0.42 *90.15 *60.70 *110.82 *30.92 *20.22 *60.92 *2
R. stolonifer0.86 *30.94 *2−0.57 *10−0.01 *8−0.44 *9−0.34 *9−0.15 *8−0.55 *10
F. oxysporum−0.04 *8−0.55 *100.61 *4−0.82 *11−0.44 *9−0.76 *11−0.33 *9−0.46 *9
P. chrysogenum−0.33 *9−0.47 *90.52 *40.76 *30.98 *20.86 *3−0.28 *80.99 *2
A. alternata−0.97 *12−0.51 *10−0.15 *8−0.04 *30.08 *60.32 *50.79 *30.28 *6
Note: *1—perfect positive correlation (r value: +1); *2—very strong positive correlation (r value: +0.9 to +1.0); *3—strong positive correlation (r value: +0.7 to +0.9); *4—moderate positive correlation (r value: +0.5 to +0.7); *5—weak positive correlation (r value: +0.3 to +0.5); *6—very weak positive or no correlation (r value: 0 to +0.3); *7—no linear correlation (r value: 0); *8—very weak negative or no correlation (r value: 0 to −0.3); *9—weak negative correlation (r value: −0.3 to −0.5); *10—moderate negative correlation (r value: −0.5 to −0.7); *11—strong negative correlation (r value: −0.7 to −0.9); *12—very strong negative correlation (r value: −0.9 to −1.0); *13—perfect negative correlation (r value: −1).
Table 9. Pearson correlations between IZD values and chemical parameters of honey from protected areas—bacterial strains.
Correlation IZD VersusPhenolsFlavonoidsHMFPb, mg/kgCd, mg/kgFe, mg/kgCu, mg/kgZn, mg/kg
E. coli−0.53 *10−0.85 *11−0.01 *80.19 *60.87 *30.01 *6−0.69 *100.99 *2
S. enteritidis0.84 *30.84 *30.65 *4−0.36 *9−0.33 *90.11 *60.12 *6−0.72 *11
P. aeruginosa−0.79 *11−0.52 *10−0.94 *120.31 *5−0.23 *8−0.21 *80.37 *50.21 *6
S. aureus0.27 *60.54 *4−0.28 *80.72 *3−0.82 *110.59 *40.95 *2−0.41 *9
S. epidermidis0.84 *30.84 *30.65 *4−0.36 *9−0.33 *90.11 *60.12 *6−0.72 *11
B. cereus−0.27 *80.22 *6−0.75 *11−0.15 *8−0.82 *11−0.40 *90.72 *3−0.69 *10
L. monocytogenes−0.27 *80.22 *6−0.75 *11−0.15 *8−0.82 *11−0.40 *90.72 *3−0.60 *10
Note: *1—perfect positive correlation (r value: +1); *2—very strong positive correlation (r value: +0.9 to +1.0); *3—strong positive correlation (r value: +0.7 to +0.9); *4—moderate positive correlation (r value: +0.5 to +0.7); *5—weak positive correlation (r value: +0.3 to +0.5); *6—very weak positive or no correlation (r value: 0 to +0.3); *7—no linear correlation (r value: 0); *8—very weak negative or no correlation (r value: 0 to −0.3); *9—weak negative correlation (r value: −0.3 to −0.5); *10—moderate negative correlation (r value: −0.5 to −0.7); *11—strong negative correlation (r value: −0.7 to −0.9); *12—very strong negative correlation (r value: −0.9 to −1.0); *13—perfect negative correlation (r value: −1).
Table 10. Pearson correlations between IZD values and chemical parameters of honey from protected areas—fungal strains.
Correlation IZD VersusPhenolsFlavonoidsHMFPb, mg/kgCd, mg/kgFe, mg/kgCu, mg/kgZn, mg/kg
C. albicans−0.10 *8−0.44 *90.20 *60.69 *40.58 *40.59 *4−0.30 *90.87 *3
A. flavus−0.72 *11−0.34 *9−0.88 *11−0.44 *9−0.33 *9−0.80 *110.23 *6−0.29 *8
A. niger−0.10 *8−0.44 *90.20 *60.69 *40.58 *40.59 *4−0.30 *90.87 *3
R. stolonifer0.99 *20.86 *30.80 *30.28 *6−0.26 *80.71 *30.24 *6−0.38 *9
F. oxysporum−0.54 *10−0.32 *9−0.47 *9−0.88 *110.00 *7−0.99 *12−0.23 *8−0.28 *8
P. chrysogenum0.91 *20.60 *40.96 *20.21 *60.13 *60.67 *4−0.14 *8−0.06 *8
A. alternata−0.82 *11−0.52 *10−0.98 *120.18 *6−0.26 *8−0.33 *90.37 *50.12 *6
Note: *1—perfect positive correlation (r value: +1); *2—very strong positive correlation (r value: +0.9 to +1.0); *3—strong positive correlation (r value: +0.7 to +0.9); *4—moderate positive correlation (r value: +0.5 to +0.7); *5—weak positive correlation (r value: +0.3 to +0.5); *6—very weak positive or no correlation (r value: 0 to +0.3); *7—no linear correlation (r value: 0); *8—very weak negative or no correlation (r value: 0 to −0.3); *9—weak negative correlation (r value: −0.3 to −0.5); *10—moderate negative correlation (r value: −0.5 to −0.7); *11—strong negative correlation (r value: −0.7 to −0.9); *12—very strong negative correlation (r value: −0.9 to −1.0); *13—perfect negative correlation (r value: −1).
Table 11. Maximum permissible limits for heavy metals in honey—international comparison.
Country/OrganizationLead, mg/kgCadmium, mg/kgMercury, mg/kgMethyl-mercury, mg/kgArsenic, mg/kgCopper, mg/kgTin, mg/kg
UE (EFSA)0.10
Codex Alimentarius0.10
Poland (RMH)0.300.030.01-0.20--
India (FSSAI)2.501.501.000.251.1030.00250.00
China (CFSA)0.051.000.010.05
Note: EFSA—European Food Safety Authority; RMH—Regulation of the Minister of Health from Poland; FSSAI—Food Safety and Standards Authority of India; CFSA—China National Center for Food Safety Risk Assessment, part of SAMR—State Administration for Market Regulation.
Disclaimer/Publisher’s Note: The statements, opinions and data contained in all publications are solely those of the individual author(s) and contributor(s) and not of MDPI and/or the editor(s). MDPI and/or the editor(s) disclaim responsibility for any injury to people or property resulting from any ideas, methods, instructions or products referred to in the content.

