Article

Multi-Dimensional AE Signal Features in Eccentrically Loaded Concrete Structures: A Machine Learning Classification for Damage Progression

1
College of Civil Engineering and Architecture, Xinjiang University, Urumqi 830046, China
2
Xinjiang Key Laboratory of Building Structure and Earthquake Resistance, Xinjiang University, Urumqi 830046, China
3
Department of Civil and Environmental Engineering, Pusan National University, Busan 46241, Republic of Korea
*
Author to whom correspondence should be addressed.
These authors contributed equally to this work and they are co-first authors.
Appl. Sci. 2025, 15(13), 7243; https://doi.org/10.3390/app15137243 (registering DOI)
Submission received: 2 June 2025 / Revised: 24 June 2025 / Accepted: 24 June 2025 / Published: 27 June 2025

Abstract

Acoustic emission (AE) signals exhibit a strong correlation with concrete damage. However, the relationship between column damage and AE signals under eccentric loading conditions, combined with the application of traditional RA-AF classification methods for crack characterization, demonstrates limitations. These approaches provide insufficient resolution to accurately identify damage types throughout the entire structural failure process. This study employed K-means clustering algorithm and Gaussian mixture models (GMMs) to analyze AE signal features from reinforced concrete (RC) columns undergoing failure under the eccentric compression loading of different eccentricity. Subsequently, a random forest model was used for automated damage stage classification. Experimental results demonstrate that the damage progression in eccentrically compressed columns comprises four distinct stages, each exhibiting unique AE signal characteristics. The integrated approach of clustering and random forest modeling demonstrates robust feasibility in identifying AE signal patterns associated with specific damage stages, achieving an 85% recognition rate for damage stage classification. These findings provide quantitatively validated evidence supporting the efficacy of machine learning-based methodologies for enabling stage-specific damage characterization in structural health monitoring applications.

1. Introduction

Reinforced concrete (RC) columns serve as critical load-bearing elements in building and bridge structures, effectively distributing loads across large-span spaces and enhancing structural stability and load-bearing capacity. Consequently, their damage evolution mechanisms have long been a primary research focus in structural engineering. Eccentric compression—a common loading condition in frame edge columns and bridge piers subjected to lateral loads—induces a stress gradient across the section. This gradient drives a progressive, multi-stage damage process, spanning from microcrack initiation and propagation to macroscopic failure [1,2,3]. Traditional damage assessment techniques, such as strain gauge monitoring and visual inspection, are constrained by insufficient spatial resolution and struggle to quantitatively characterize the dynamic evolution of internal microcracks. In contrast, acoustic emission (AE) technology enables the high-sensitivity, non-destructive monitoring of internal damage in concrete structures by detecting high-frequency elastic waves released during material fracture [4,5,6]. Critically, AE signals generated by damage in eccentrically compressed RC columns exhibit significant complexity due to stress gradient effects. This complexity arises from coupled mechanisms, including lateral crack propagation in the tension zone, longitudinal cracking in the compression zone, and interfacial delamination [7,8,9]. The central challenge, therefore, lies in analyzing these multi-stage damage mechanisms and crack evolution through the spatiotemporal distribution of AE signal characteristics.
Recent research has extensively explored AE signal characteristics in concrete structures, consistently demonstrating the applicability of AE parameters for characterizing complex damage mechanisms in composite materials. These parameters exhibit high sensitivity to incipient damage, enabling effective identification of damage stages and crack modes [10]. Pan et al. [11] established a three-stage damage evolution process (initial damage, damage propagation, and damage failure) in concrete through analysis of cumulative ring count curves during uniaxial compression tests. Utilizing AE parameters (average frequency, rise angle value, and energy), Dimitrios G. Aggelis [12] successfully distinguished tensile micro-cracking, macro-cracking, and fiber pull-out (the phenomenon of fibers being pulled out during the expansion of concrete tensile cracks) mechanisms in fiber-reinforced concrete beams.
Advances in machine learning have introduced novel approaches for damage pattern classification through clustering of multi-parametric AE signals, where algorithms including K-means, hierarchical clustering, and Gaussian mixture models (GMMs) are widely employed for AE feature analysis [13,14]. Resultant clustering outputs facilitate damage-type identification [15,16]. As a straightforward hard-clustering algorithm, K-means has demonstrated efficacy in clustering AE feature signals. Distinct clusters exhibit characteristic energy and amplitude ranges, enabling the correlation of cluster signatures with specific concrete damage mechanisms. Radhika V. et al. [17] employed the K-means clustering of AE parametric features during studies on concrete crack propagation under monotonic and fatigue loading, successfully identifying four damage mechanisms in conventional concrete: cement matrix cracking, aggregate sliding, interfacial transition zone (ITZ) fracture, and aggregate fracture.
In contrast, GMM constitute a soft-clustering approach that better accommodates irregular data distributions by permitting probabilistic cluster memberships. S. Ju et al. [18] introduced a machine learning-enhanced rise angle (RA)–average frequency (AF) segmentation scheme for clustering AE signals of known crack patterns. Their comparative evaluation of four clustering techniques confirmed GMM’s superior classification accuracy. While these clustering-based methods demonstrate utility, most simplify crack classification into binary tension/shear categories, overlooking the prevalence of mixed-mode fractures where both mechanisms coexist.
Hybrid K-means/GMM methodologies offer enhanced crack-type discrimination. Arash Eshraghi et al. [15] implemented a two-stage framework analyzing AE data from concrete four-point bending tests: K-means clustering provided initial data preprocessing before feature refinement through GMM classification. Subsequent ensemble voting categorized AE sources into shear, tensile, and mixed-mode fractures, significantly reducing the misclassification of shear cracks observed when using raw parameters alone.
In recent years, most scholars have combined clustered acoustic emission parameters with other deep learning models to propose a series of damage prediction models. Specifically, Diez et al. [19] developed a clustering-based methodology for detecting joint damage in the Sydney Harbour Bridge using vibration monitoring data, significantly enhancing structural damage detection robustness. Yue et al. [20] utilized self-organizing maps (SOM) coupled with support vector machines (SVM) to classify cracks in steel-fiber reinforced concrete under uniaxial tension, while quantifying damage evolution across varying fiber contents through AE energy analysis. X. Yu et al. [21] devised a continuous wavelet transform (CWT)–convolutional neural network (CNN) framework that autonomously extracts features from AE time–frequency representations for damage-type recognition in composites, with classification results demonstrating strong alignment with K-means clustering. Xiao Wang et al. [22] integrated K-means++ with a Gaussian mixture model sequence (GMMSEQ, a modified version of the original GMM that accounts for the fact that AE signals are indexed by continuous timestamps) clustering, subsequently combining both outputs with SVM to achieve automated labeling of four damage signal modes in cementitious materials. Bo Yu et al. [16] proposed a semi-parametric clustering (SPC)–SVM hybrid method for AE signal classification, attaining over 95% accuracy in concrete crack characterization.
However, two significant limitations persist in current research: First, studies have predominantly focused on components with relatively simple damage processes, such as simply supported beams or axially compressed columns. Consequently, the damage-to-signal mapping mechanisms in complex stress components like eccentrically compressed columns remain inadequately investigated. Second, existing methods rely heavily on manual feature engineering, which struggles to effectively characterize the dynamic evolution of damage. In this context, the integration of unsupervised clustering with supervised methods offers distinct advantages. This combined approach can leverage unlabeled signal data to explore intrinsic relationships between damage mechanisms and signal clusters, thereby enabling the establishment of supervised clustering models that link discrete micro-crack events to macroscopic damage evolution.
This study investigates reinforced concrete RC columns under eccentric compression through loading tests. Load–displacement curves and acoustic emission signals were synchronously acquired to analyze the evolution of AE parameters throughout the damage progression. By integrating K-means clustering with Gaussian mixture models, the damage stages and crack types within the RC columns were classified based on multimodal AE characteristics, including amplitude, energy, rise angle, and average frequency. Furthermore, a random forest-based model was established for automated crack classification.

2. Materials and Methods

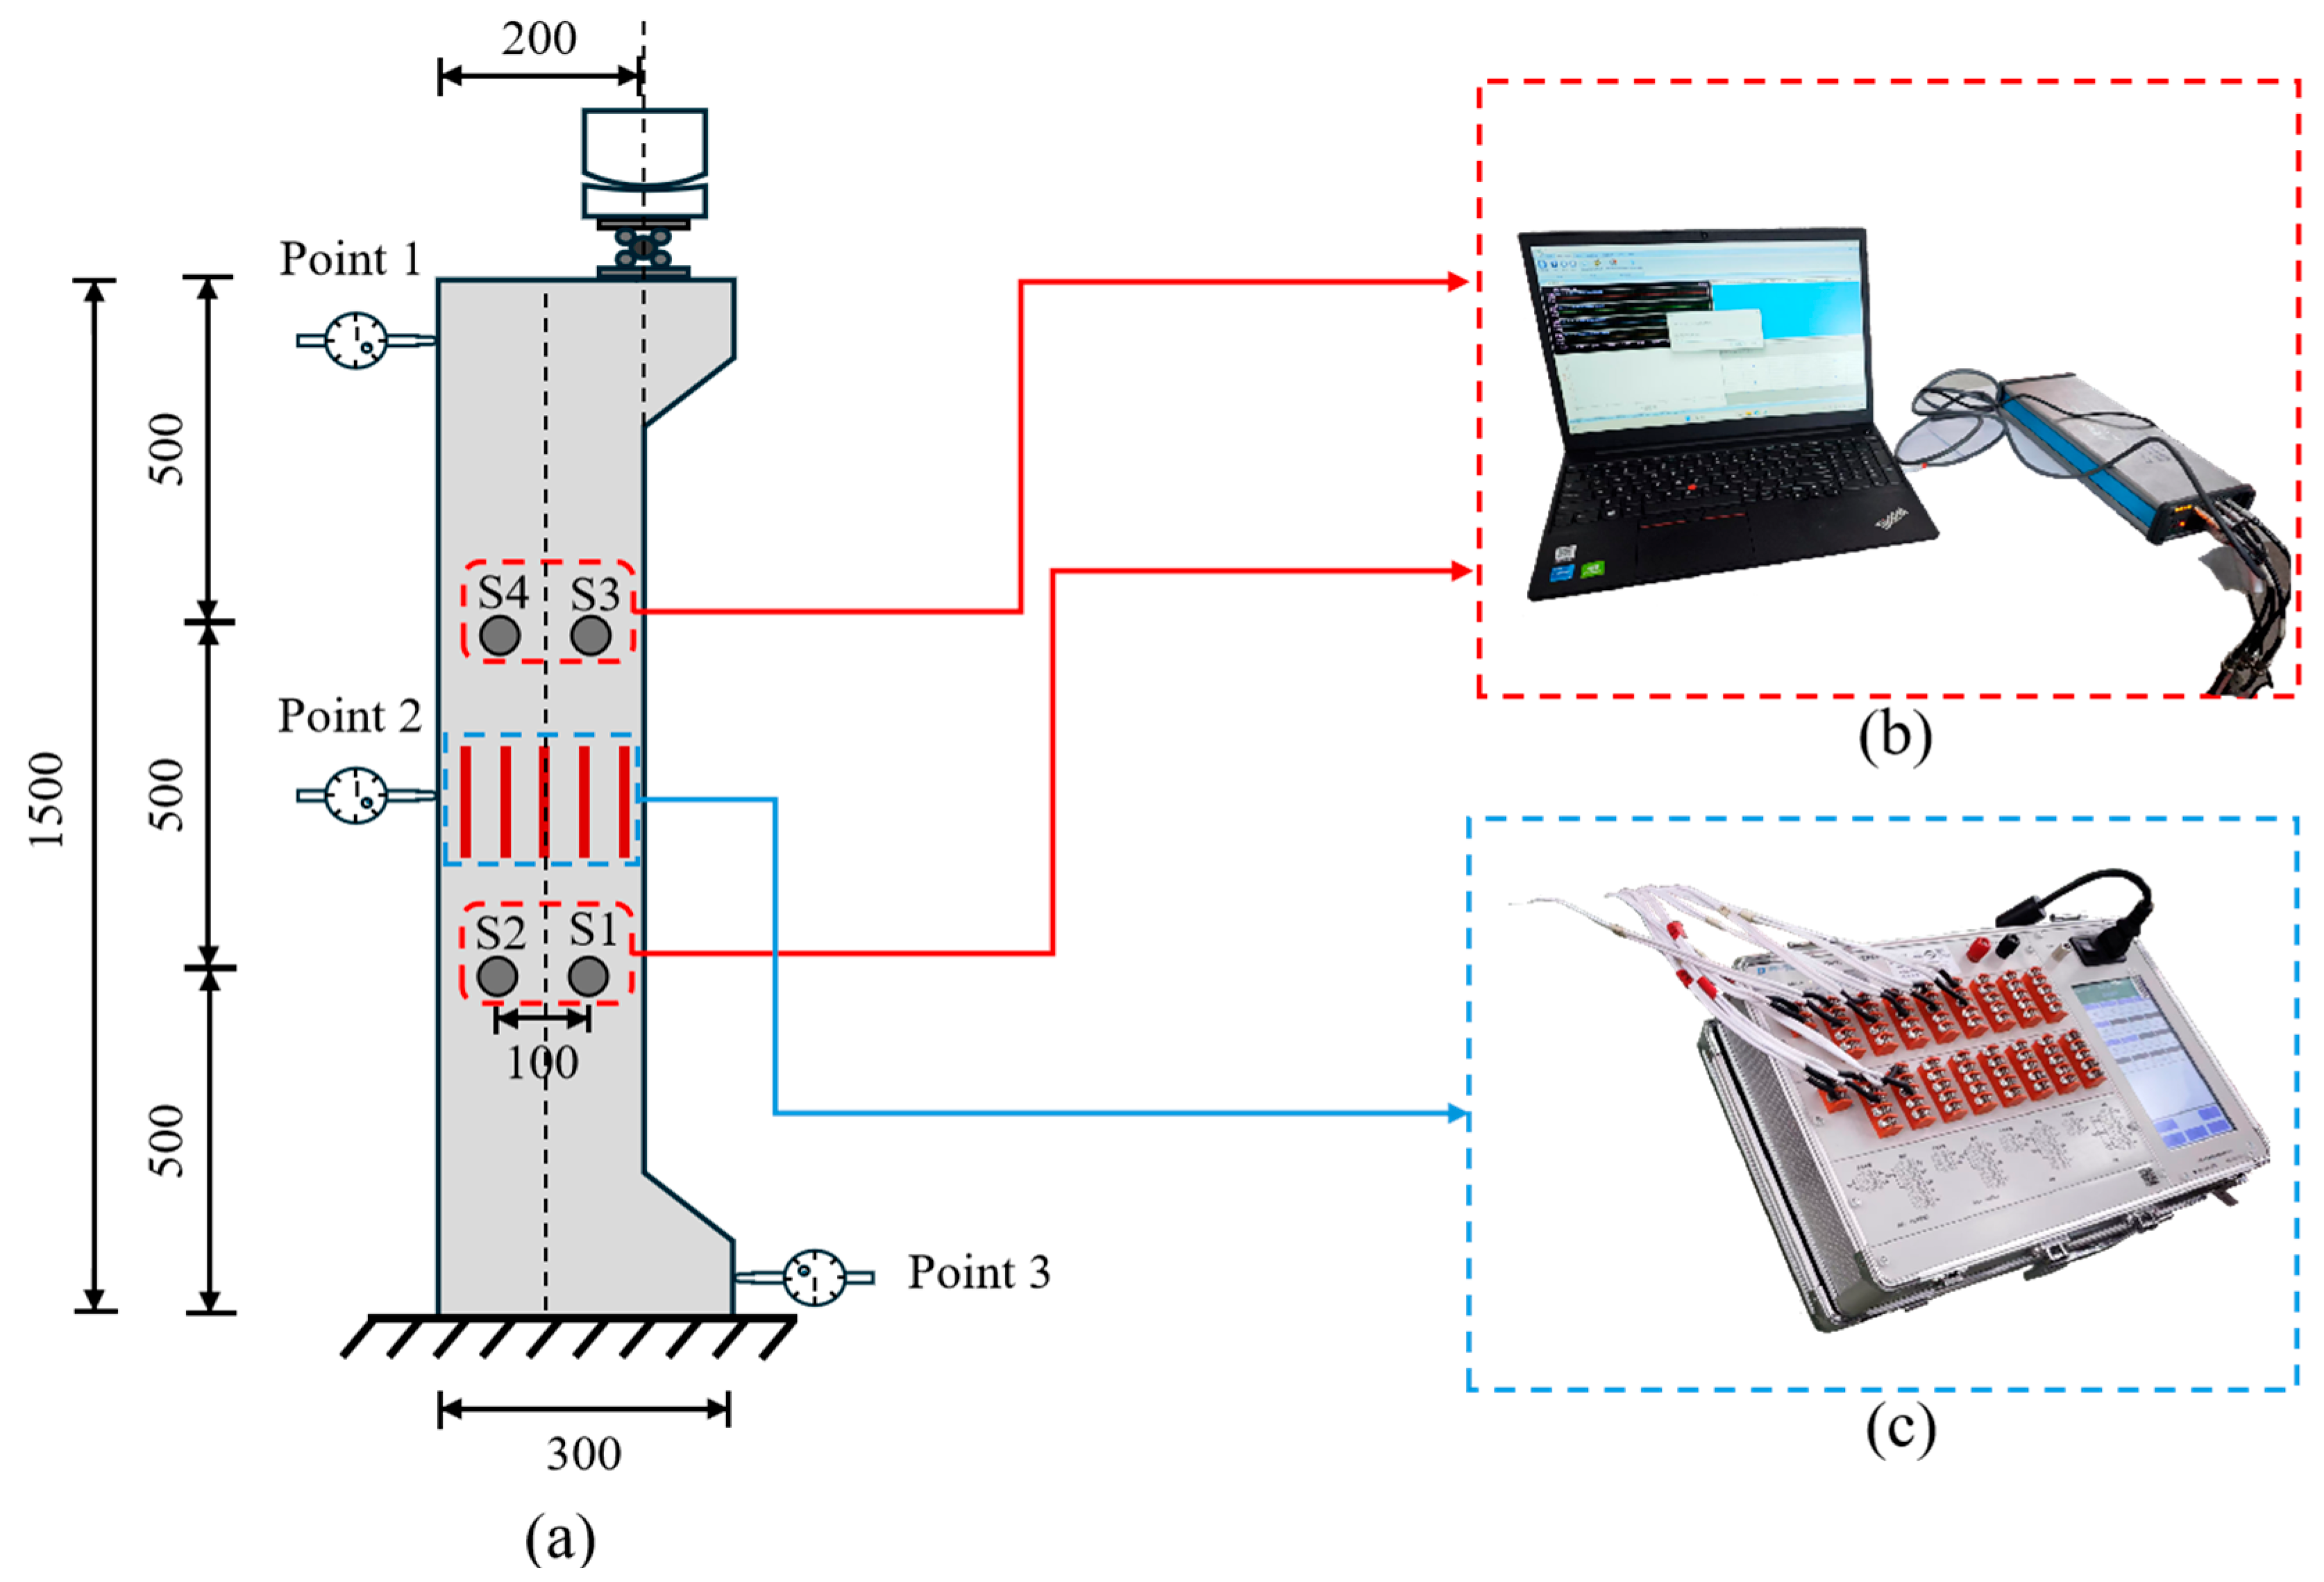
2.1. Experimental Setup

To examine the characteristics of acoustic emission signals throughout the damage progression of reinforced concrete columns subjected to eccentric compressive loads and to delineate the signals correlating with various failure modes, experimental investigations were undertaken on RC columns involved in eccentric compression tests. Figure 1 demonstrates the geometric dimensions and reinforcement configuration of the RC column. The experiment used the Chinese standard (GB 50010-2010) to prepare reinforced concrete columns with a strength grade of C30, using ordinary Portland cement produced by Xinjiang Tianshan Cement Co., Ltd. (Urumqi, China), with a strength grade of 42.5 MPa as the cementitious material. The concrete mix proportions by weight were formulated as follows: cement/water/sand/coarse aggregate = 2.375:1:4.42:6.58; this meant that the required amounts of water, cement, sand, and stone per cubic meter were 170 kg, 404 kg, 751 kg, and 1119 kg, respectively. The specimens featured longitudinal reinforcement spaced at 150 mm intervals, symmetrically arranged with two 8 mm diameter HPB300 steel bars (Chinese standard GB 50010-2010) per side, exhibiting a tensile strength of 300 MPa. A concrete cover thickness of 25 mm was maintained throughout. The coarse aggregates featured a diameter range of 15–31 mm, while river sand was employed as the fine aggregate. The cubic specimens, measuring 150 mm, were cured under standard conditions for a duration of 28 days, achieving an axial compressive strength of 38.6 MPa. Furthermore, the RC columns were demolded 24 h post-casting and subsequently cured for 28 days under regulated environmental conditions with a relative humidity maintained at 90% ± 5% and a temperature set at 20 ± 2 °C.
Eccentric static loading tests on the RC columns were conducted using a servo-hydraulic testing machine (JSKF–IV/31.5–8) with a maximal loading capacity is 60 t, manufactured by Chengdu Servo Hydraulic Equipment Co., Ltd. in Chengdu, China. The load was incrementally applied in 5 kN stages until the load-bearing capacity stabilized, after which testing proceeded under displacement control at a rate of 1 mm/min. The test was terminated when the load capacity dropped to 80% of its peak value. A 2 kN preload was applied prior to data acquisition to enhance equipment stability. Figure 2 illustrates the experimental setup and instrumentation. Dial indicators with a measurement range of 0–50 mm were positioned at points 1, 2, and 3 in the schematic diagram to monitor displacement at these locations.
Displacement strain gauges were uniformly distributed along the mid-height region of the column. Gauges were positioned at 40 mm intervals across the width, with the central gauge aligned along the column’s longitudinal axis. The strain gauge was the BX120-80AA type with a size of 80 × 3 mm2, and the data acquisition instrument uses the DH3818Y static stress–strain testing and analysis system from Donghua Company, Jiangsu, China. According to the critical eccentricity (e = 55 mm), the eccentric load was applied at a position offset 100 mm and 50 mm from the column centerline. AE signals were monitored using sensors and a data acquisition system from Qingcheng AE (4-channel SAEU3H acoustic emission detector Manufactured by Qingcheng Sound Emission Research Co., Ltd., Guangzhou, China). The model of the acoustic emission sensor is Qingcheng AE GI150, with a resonant frequency of 150 KHz and a frequency range of 60–400 KHz. The built-in amplifier has an amplification amplitude of 40 dB. Four sensors (S1, S2, S3, S4) were mounted as shown in Figure 2a. To minimize noise interference, the AE detection threshold was set to 45 dB.

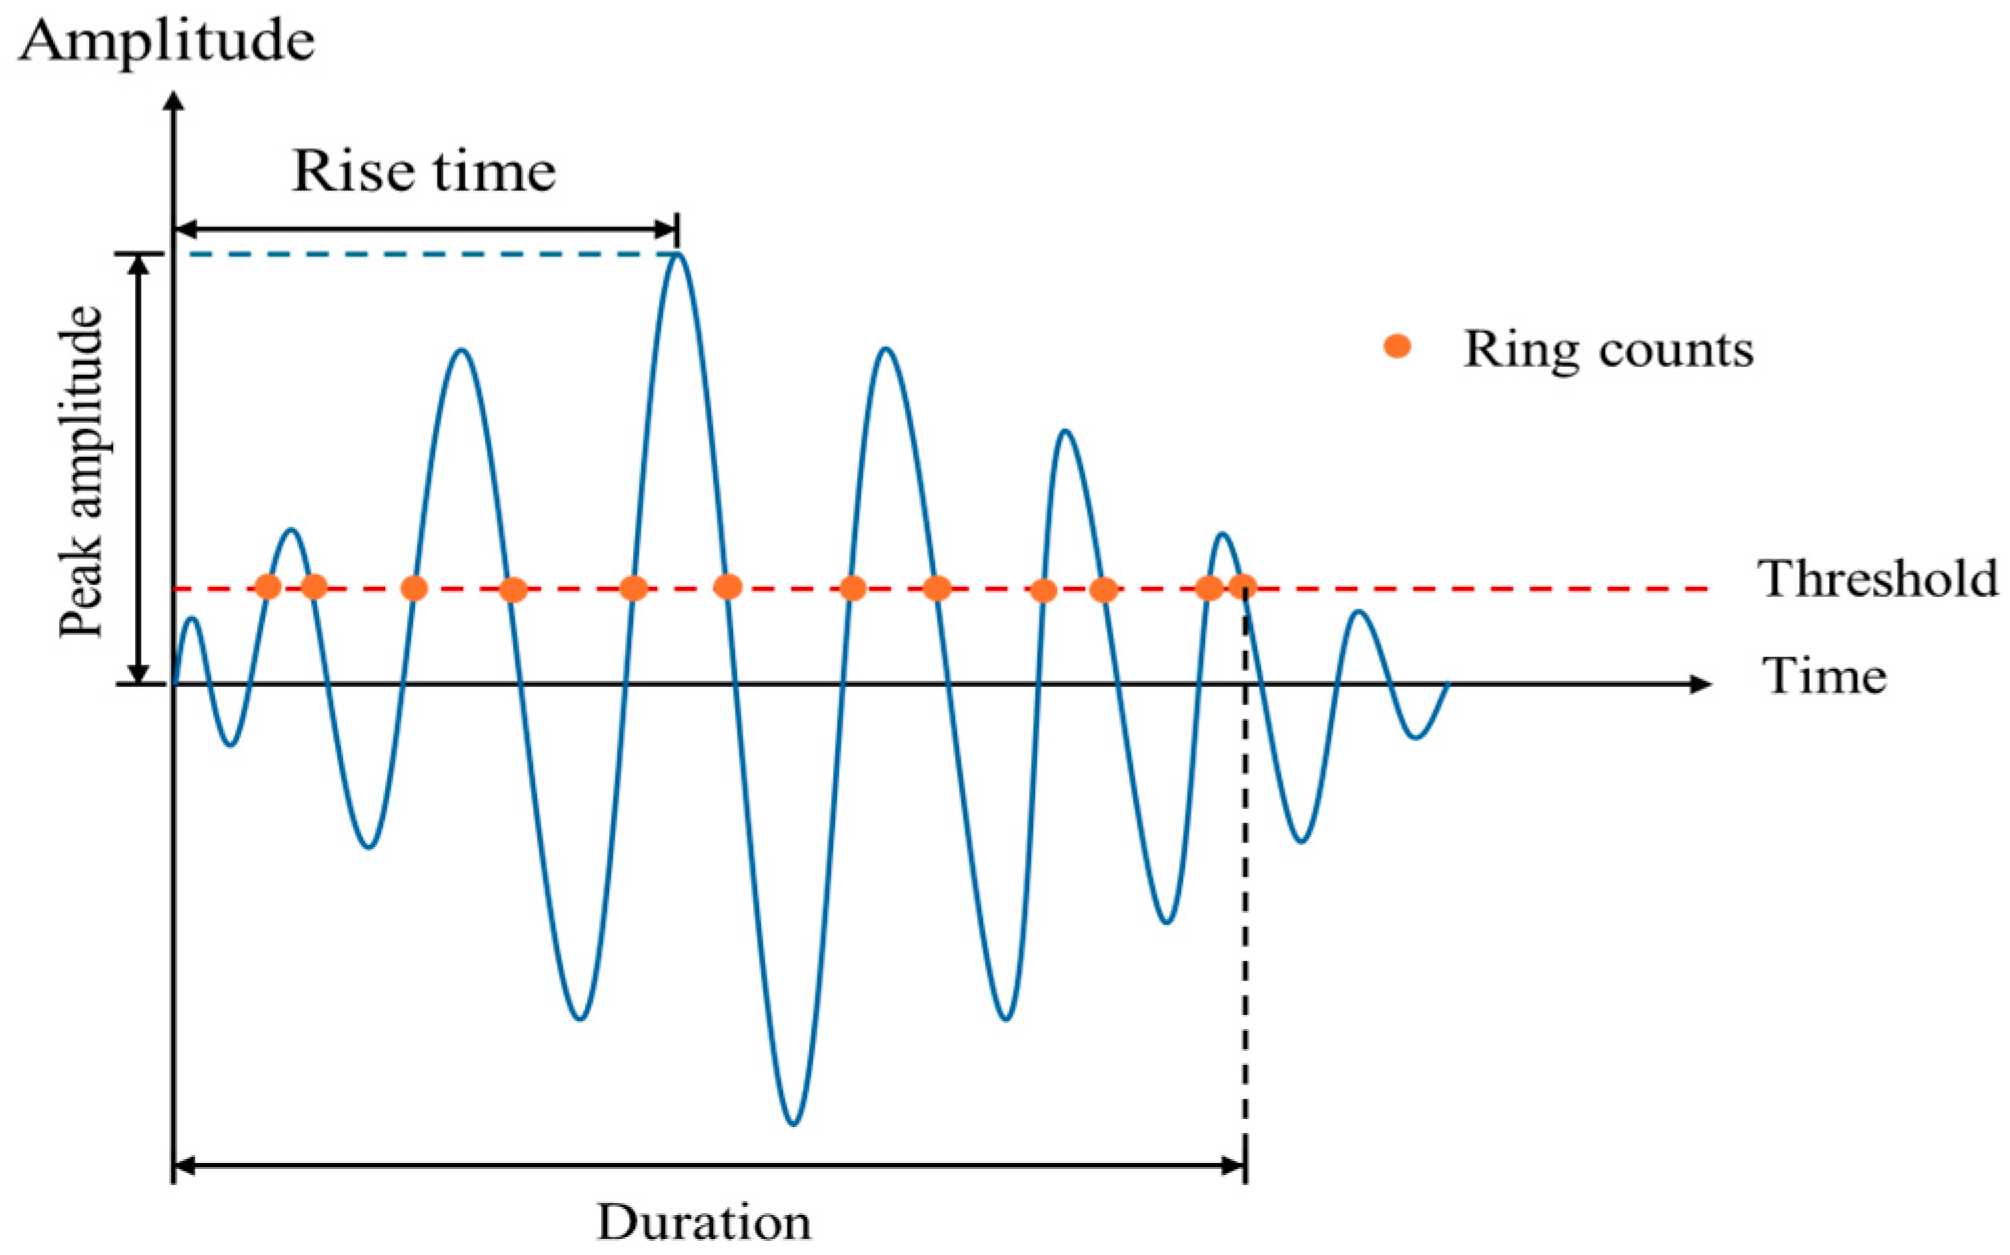
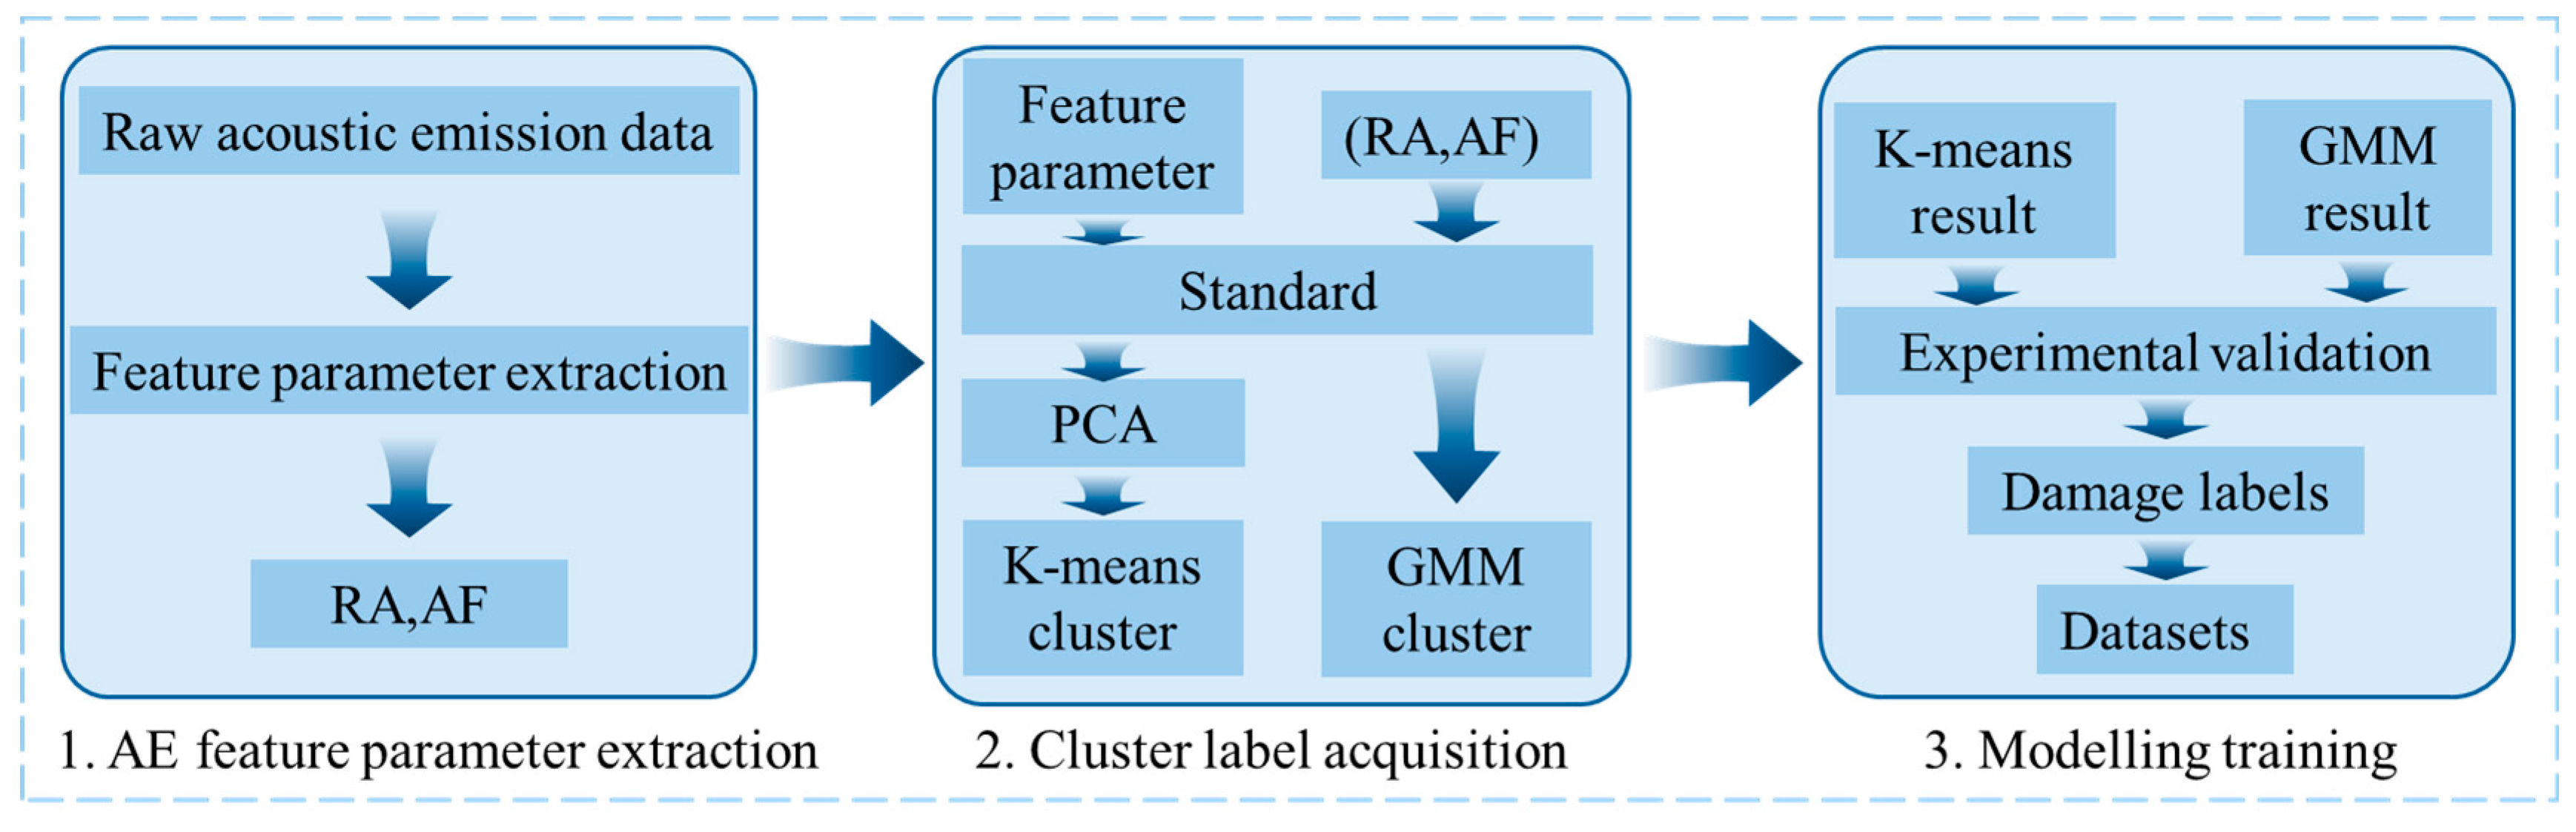
2.2. Acoustic Emission Analysis Methods

The characteristic parameters of the acoustic emission signal usually include amplitude, count, duration, energy, rise time, rise count, etc. By analyzing the characteristic parameters of acoustic emission, it is possible to describe the damage evolution of the specimen as well as to determine the crack type [23,24,25,26]. As shown in Figure 3, the amplitude (dB) of the AE signal is the maximum value of the amplitude in an acoustic emission event, which reflects the strength of the acoustic emission signal; the ring counts is the number of times the AE waveform passes the threshold, the duration is the time from the first time the AE waveform exceeds the threshold to the first time it is lower than the threshold; the energy (KpJ) is the integral under the envelope of the waveform; the rise time (μs) is the time difference between the first time the waveform exceeds the threshold and reaches the amplitude peak; and the rising count is the ring count of the waveform exceeding the threshold for the first time and the arrival at the peak of the amplitude.

2.2.1. K-Means Cluster

K-means is a simple and effective unsupervised clustering algorithm, which is widely used to process concrete acoustic emission signals [27]. K-means clustering selects N initial cluster center positions according to the number of clusters selected N and redistributes the cluster center positions by calculating the distance from each datapoint to different cluster centers and iterations until the intra-cluster distances were minimized and the inter-cluster distance was maximized. K-means clustering can effectively divide the normalized acoustic emission data into different clusters, and different clusters correspond to different concrete damage. The standard implementation workflow of K-means includes the following steps:
  • Determine the preset number of K clusters;
  • Randomly select K sample points as initial centroids;
  • Assign the remaining data points to the nearest neighboring centroid’s cluster based on the Euclidean distance criterion;
  • Iteratively update the coordinates of each cluster’s centroid.
Repeat steps 3–4 until the convergence criteria are met (e.g., the centroid offset is less than a threshold or the maximum number of iterations is reached).

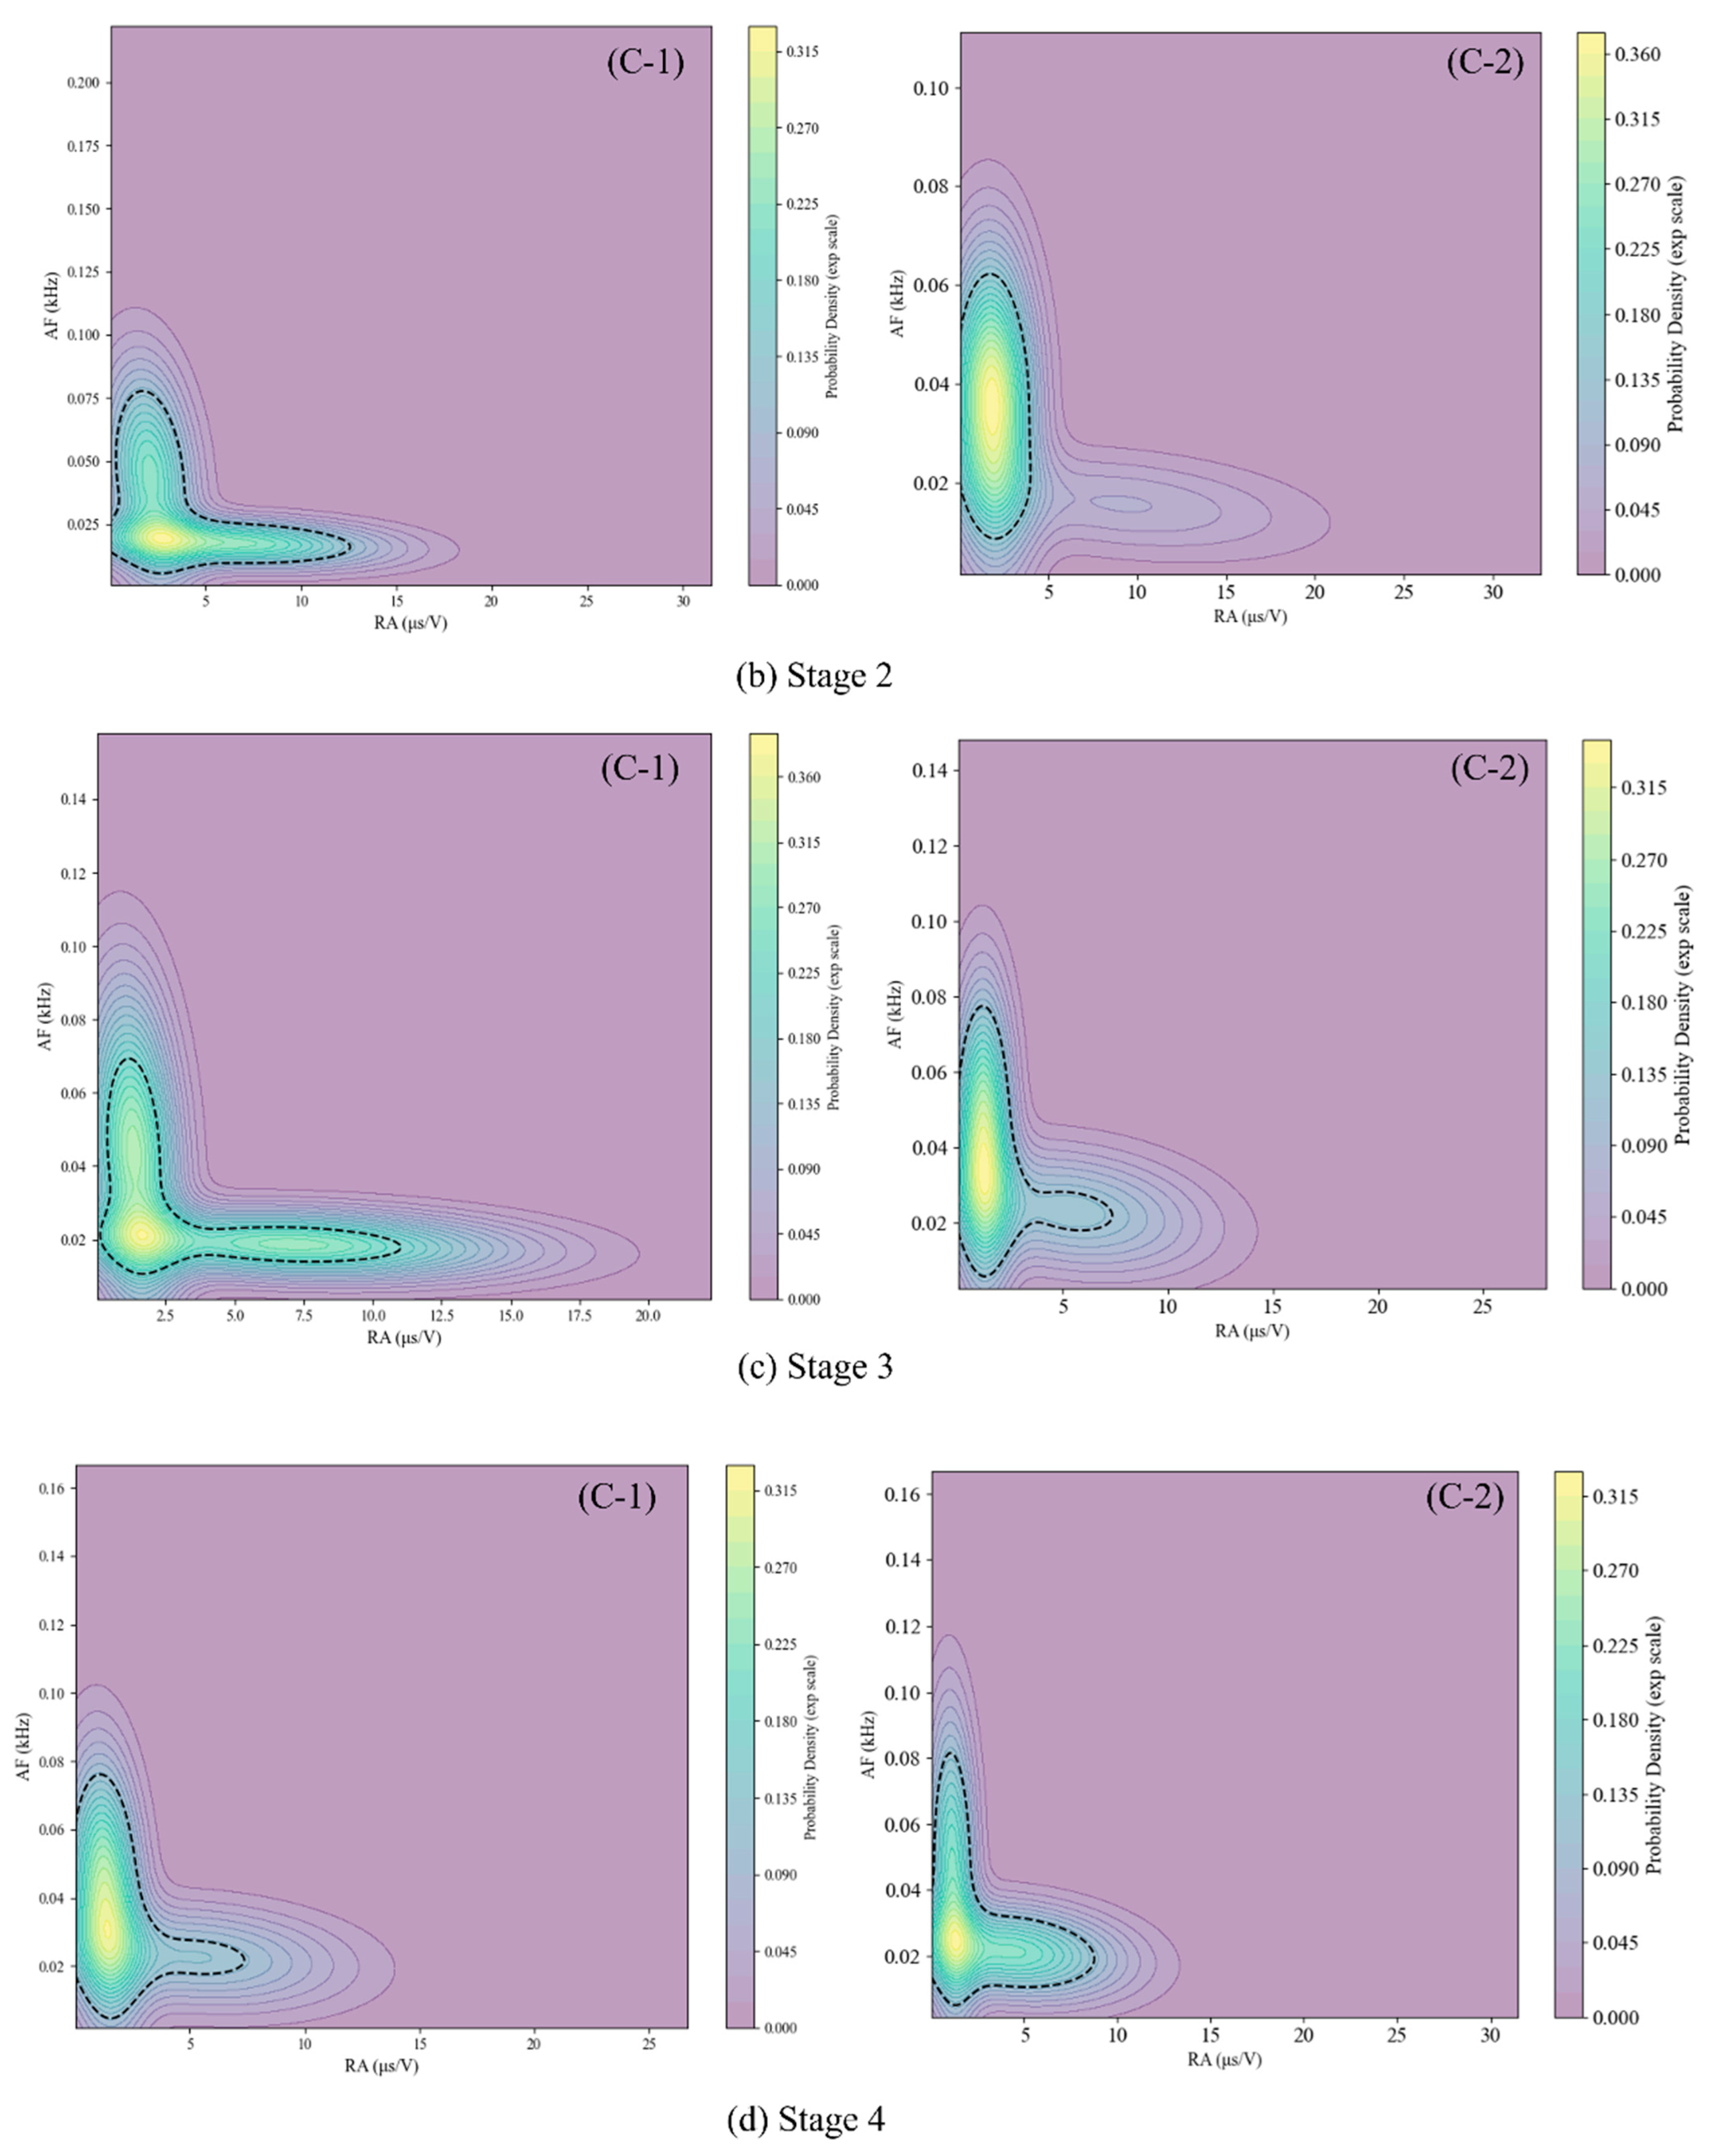
2.2.2. RA-AF Analysis

The RA value (rise angle, the ratio of rise time to amplitude) and AF value (average frequency) are critical parameters in AE signal analysis for distinguishing damage modes. RA values are typically associated with shear-type cracks (e.g., steel–concrete interface debonding), while AF values correspond to tensile-type cracks (e.g., concrete matrix cracking). Research demonstrates that RA-AF two-dimensional correlation plots can effectively identify damage types in concrete columns [18,28].
As shown in Figure 4a, traditional methods use a single-threshold segmentation to classify RA-AF data: regions with high RA and low AF (upper boundary) are identified as tensile cracks, while regions with low RA and high AF (lower boundary) are classified as shear cracks. However, the failure process of eccentrically loaded reinforced concrete columns often involves the coexistence of tensile and shear cracks, termed mixed-mode cracks. Traditional single-boundary classification methods struggle to accurately characterize such complex scenarios.
To address this, improved methods such as the GMM have been introduced for crack classification. As illustrated in Figure 4b, GMM employs mixed-distribution modeling to simultaneously identify tensile, shear, and mixed-mode cracks. Its multimodal analysis capability significantly enhances classification accuracy, aligning more closely with the complex crack evolution patterns observed in real-world engineering applications.

2.2.3. GMM Cluster

GMM is also an unsupervised learning algorithm, as well as a soft clustering model based on probability distributions, which portrays the overall distributional structure of the data through linear mixtures of multiple Gaussian distributions and iteratively optimizes the parameters (mean, covariance, mixing weights) using an expectation maximization (EM) algorithm [22,28]. Each Gaussian component is described by the mean, covariance, and mixing coefficients (weights), given as follows:
p x = k = 1 K π k N ( x | μ k , k )
where k is the number of clusters, π k is the mixing coefficient of the kth Gaussian component, N ( x | μ k , k ) denotes the kth Gaussian distribution, and μ k ,   k is the mean vector and covariance matrix of the kth Gaussian submodel. Since GMMs can handle overlapping data well, they are often used to cluster RA and AF data and thus create crack types corresponding to different clusters.

3. Results and Analyses

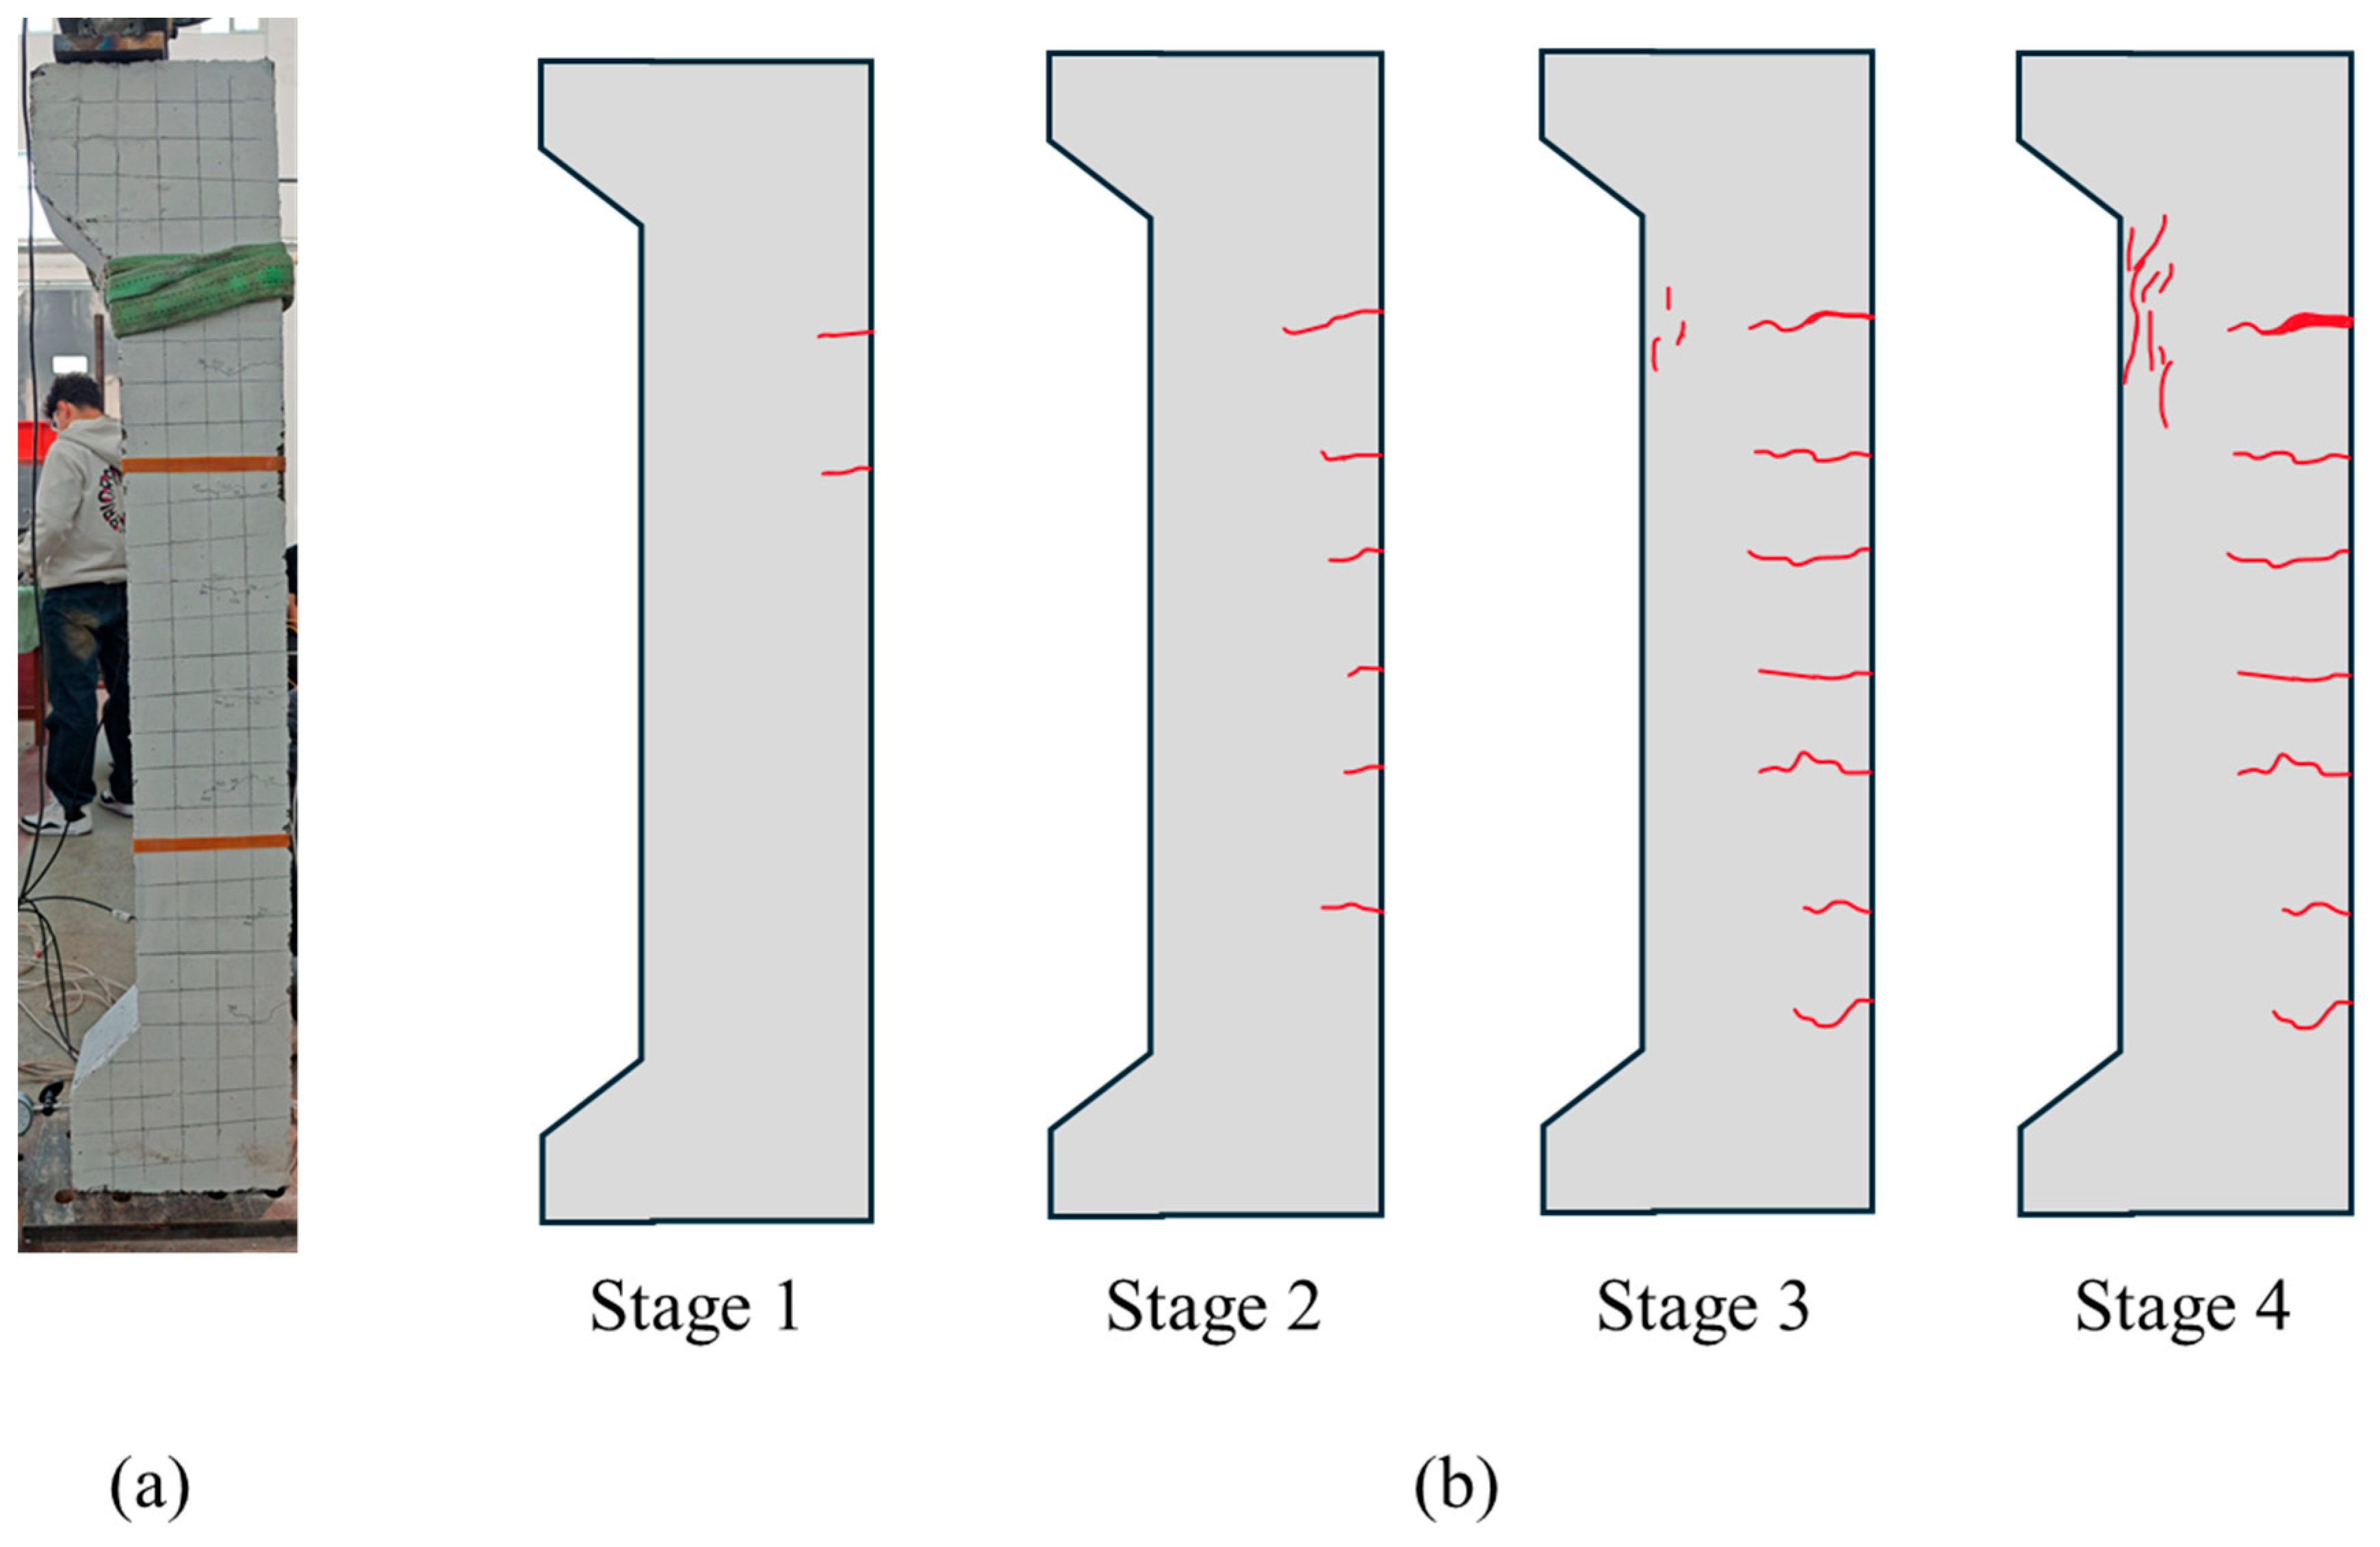
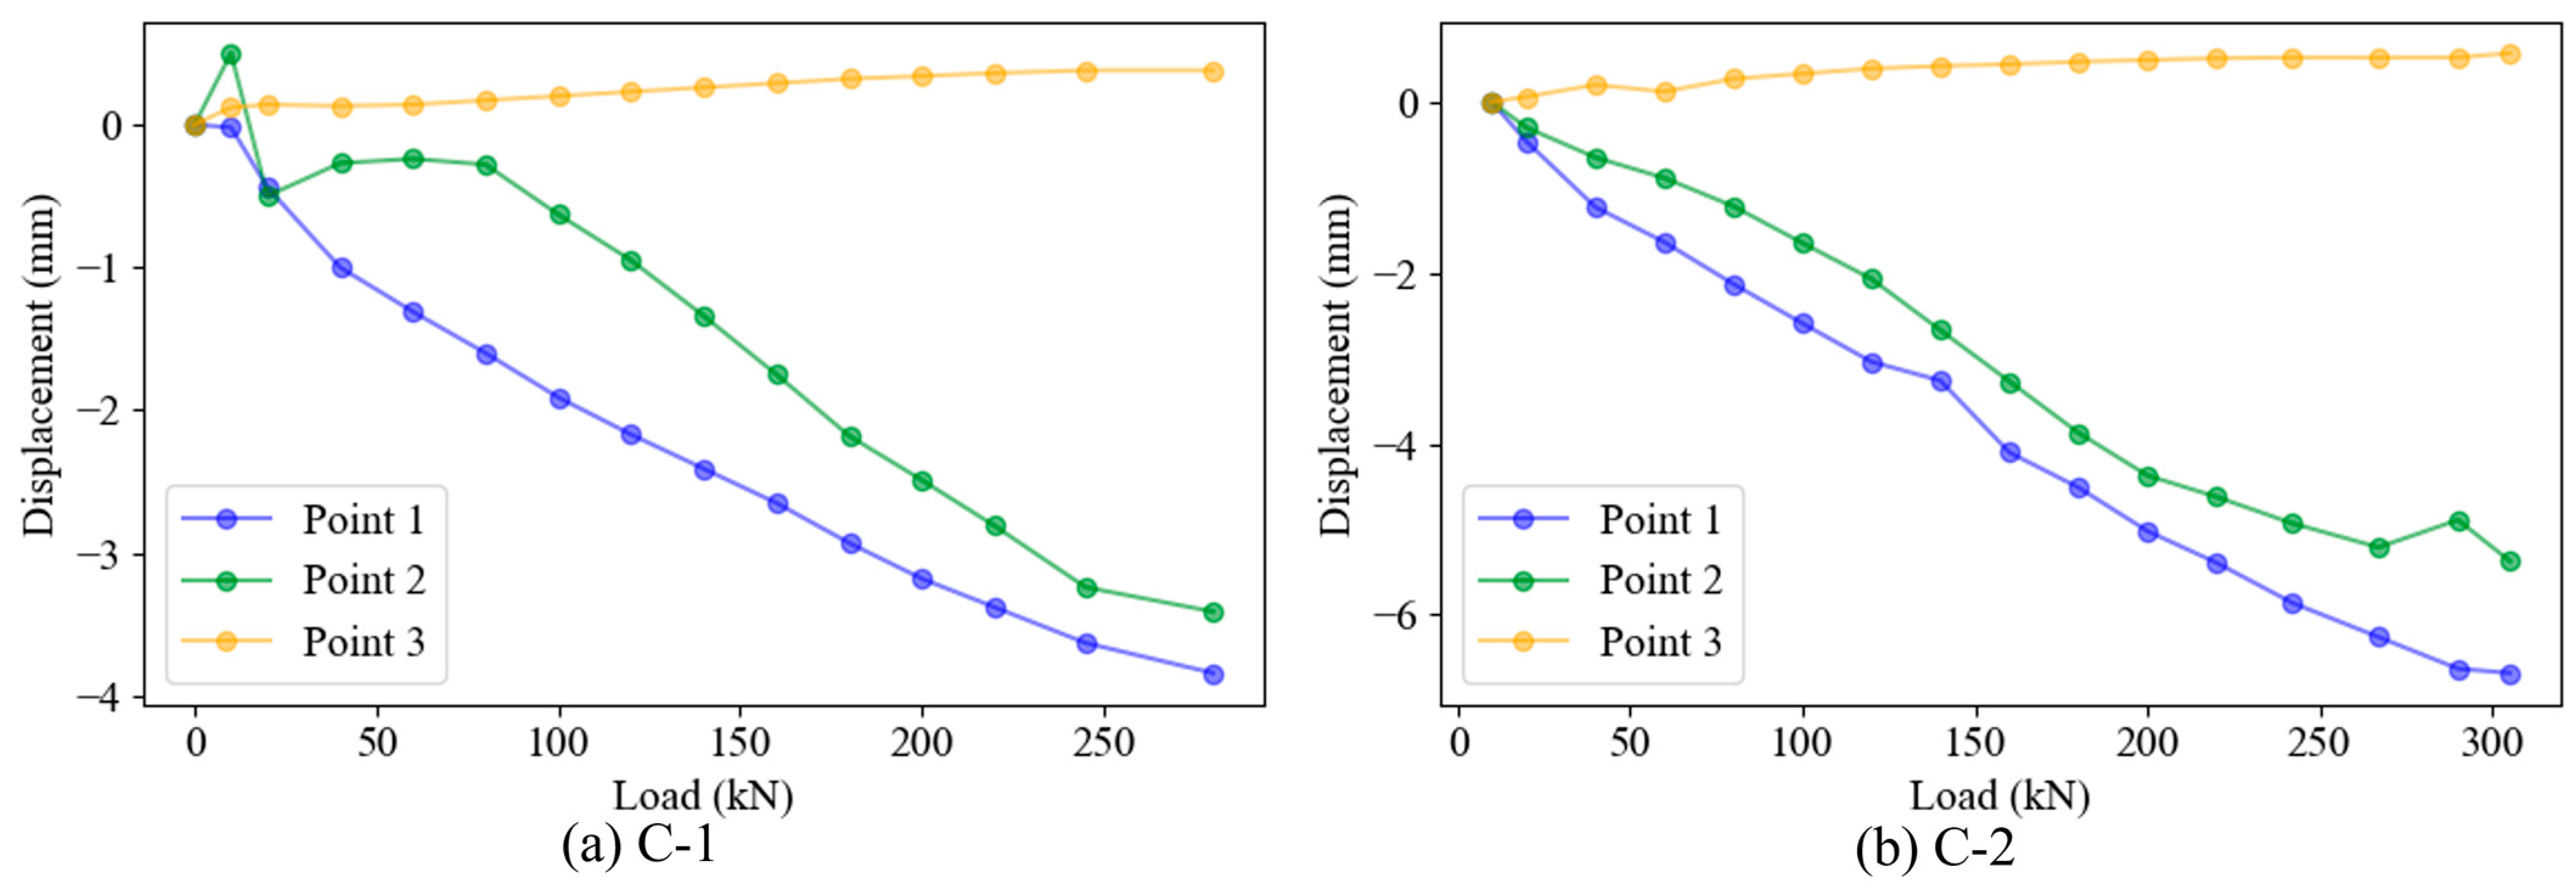
3.1. Damage Process of Specimens

Six eccentrically compressed specimens were tested in this experimental program. Due to spatial constraints and the similarity in experimental parameters among specimens, detailed data presentation and analysis will focus on two representative specimens, C-1 and C-2. C-1 is a sample with the load position 50 mm from the center axis, and C-2 is a sample with the load 100 mm from the center axis. The remaining specimen data were utilized to validate the accuracy of the automated crack classification model.
The failure process of eccentrically compressed members typically comprises four distinct phases, as shown in Figure 5:
  • Phase I (Elastic Compression): Inter-particle compression within the concrete aggregate densifies the internal structure. Macroscopic cracks are generally absent during this stage.
  • Phase II (Tensile Crack Initiation and Propagation): Visible cracks initiate on the tension face, penetrating the cross-section and propagating laterally onto adjacent side faces.
  • Phase III (Crack Widening and Reinforcement Yielding): Cracks on the tension face widen significantly, while propagation continues on the side faces until longitudinal reinforcement in the tension zone yields.
  • Phase IV (Compressive Zone Failure and Capacity Degradation): Vertical cracks develop in the concrete compression zone. The subsequent yielding of compression reinforcement and crushing of the compressive concrete precipitate a decline in the member’s load-bearing capacity.
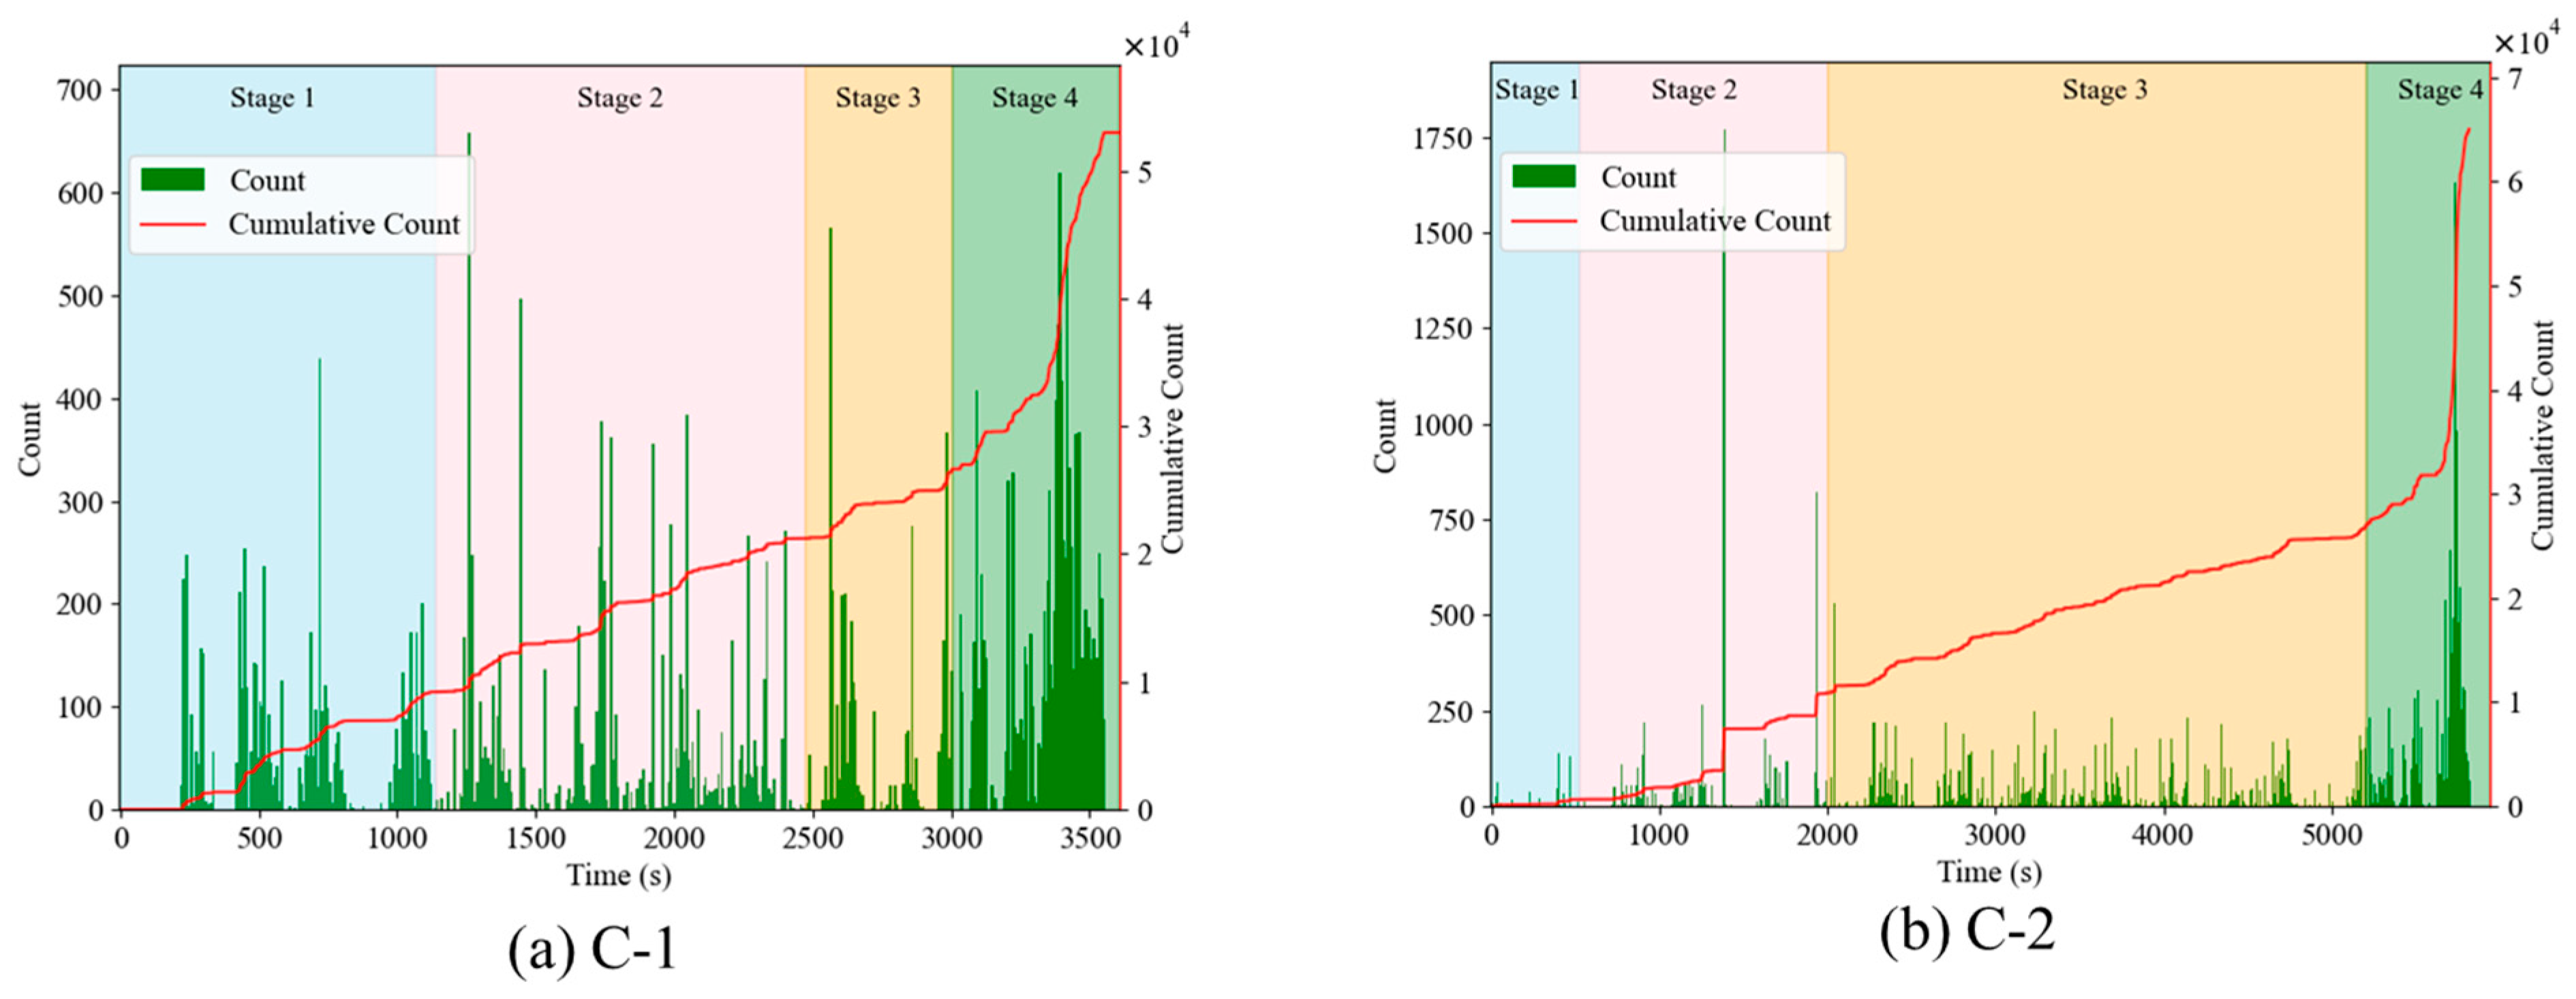
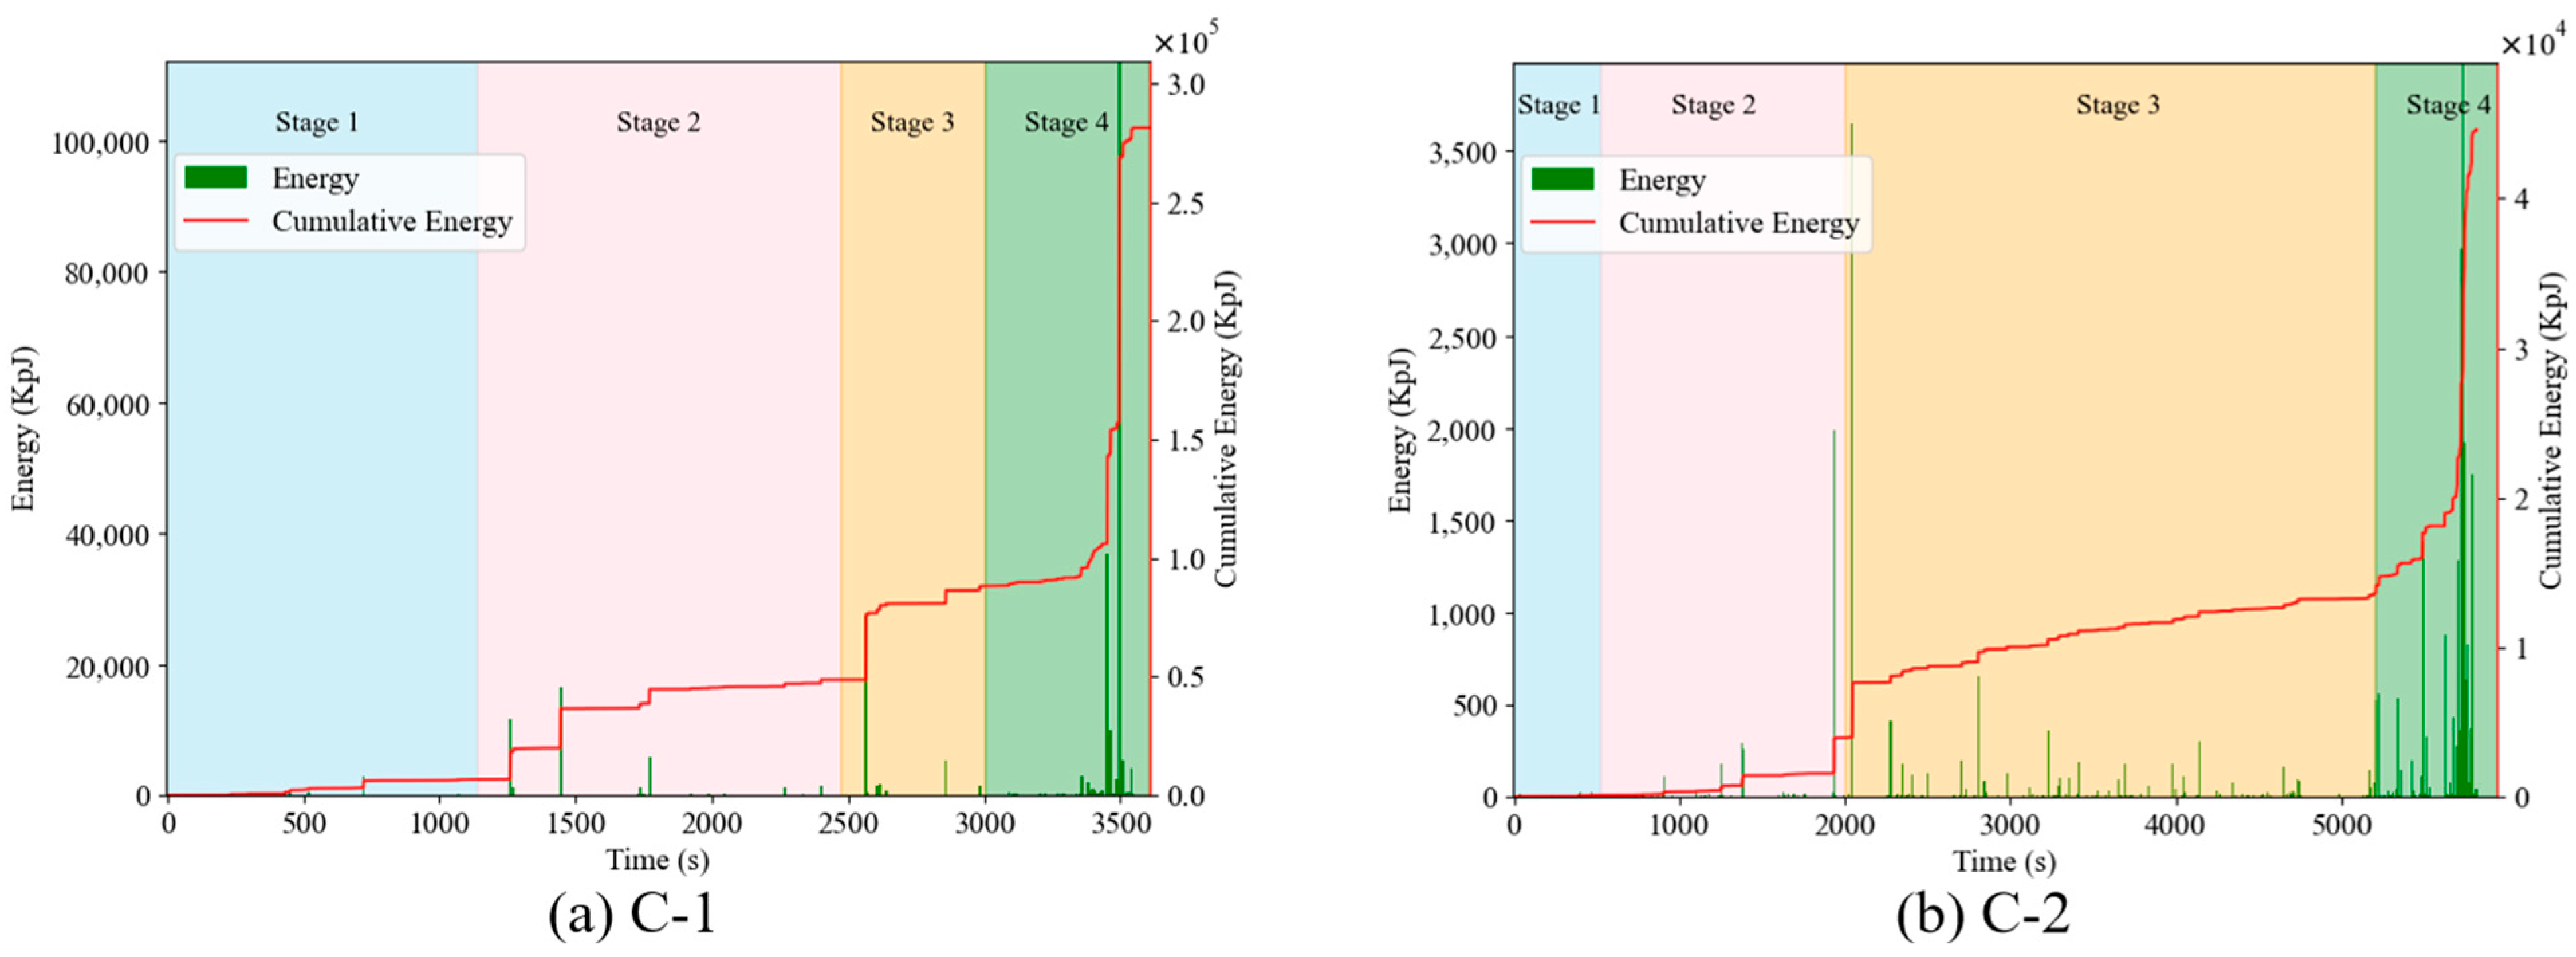
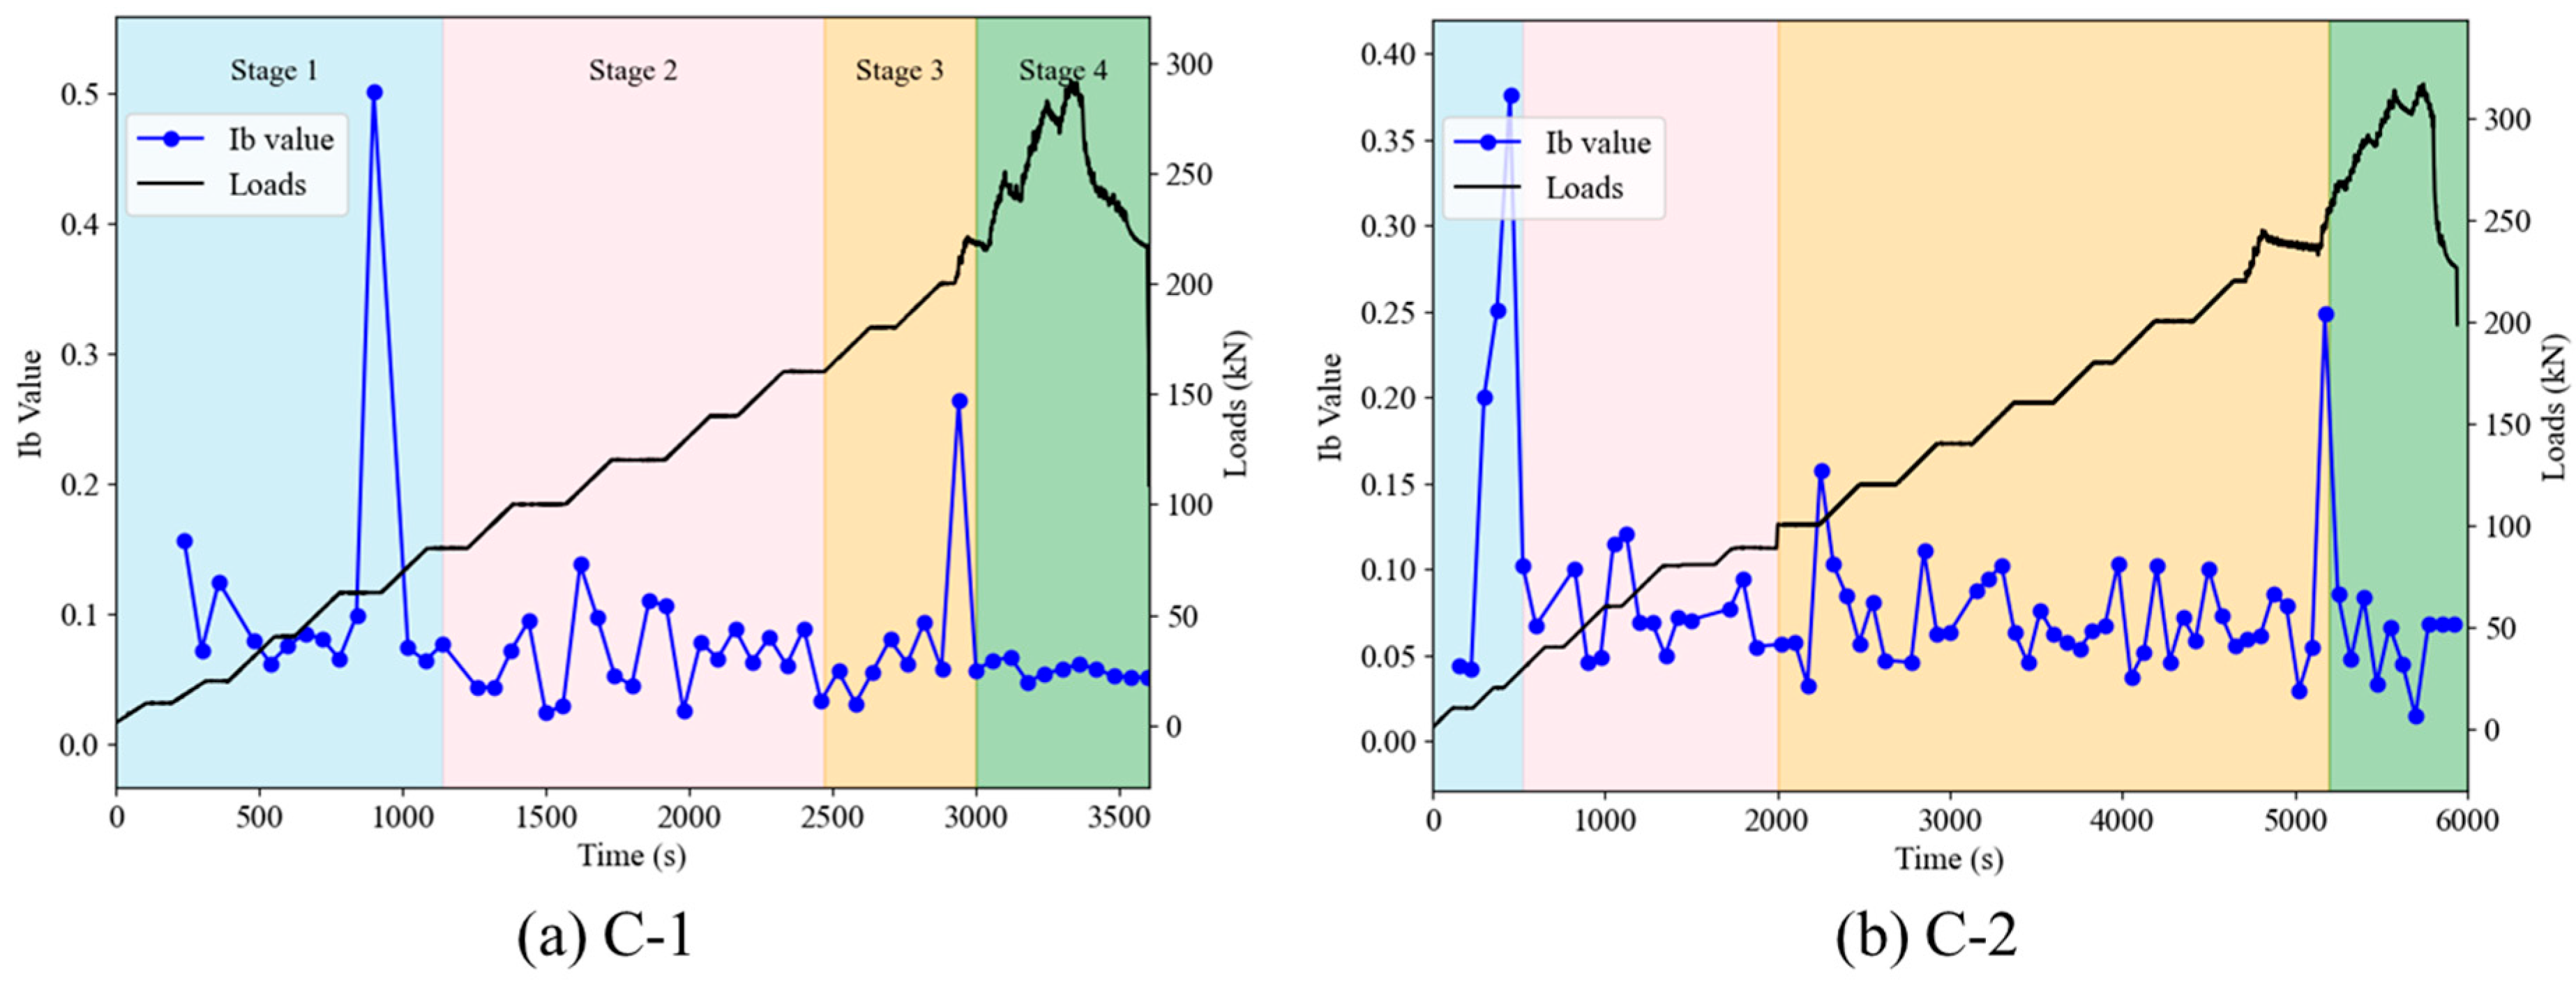
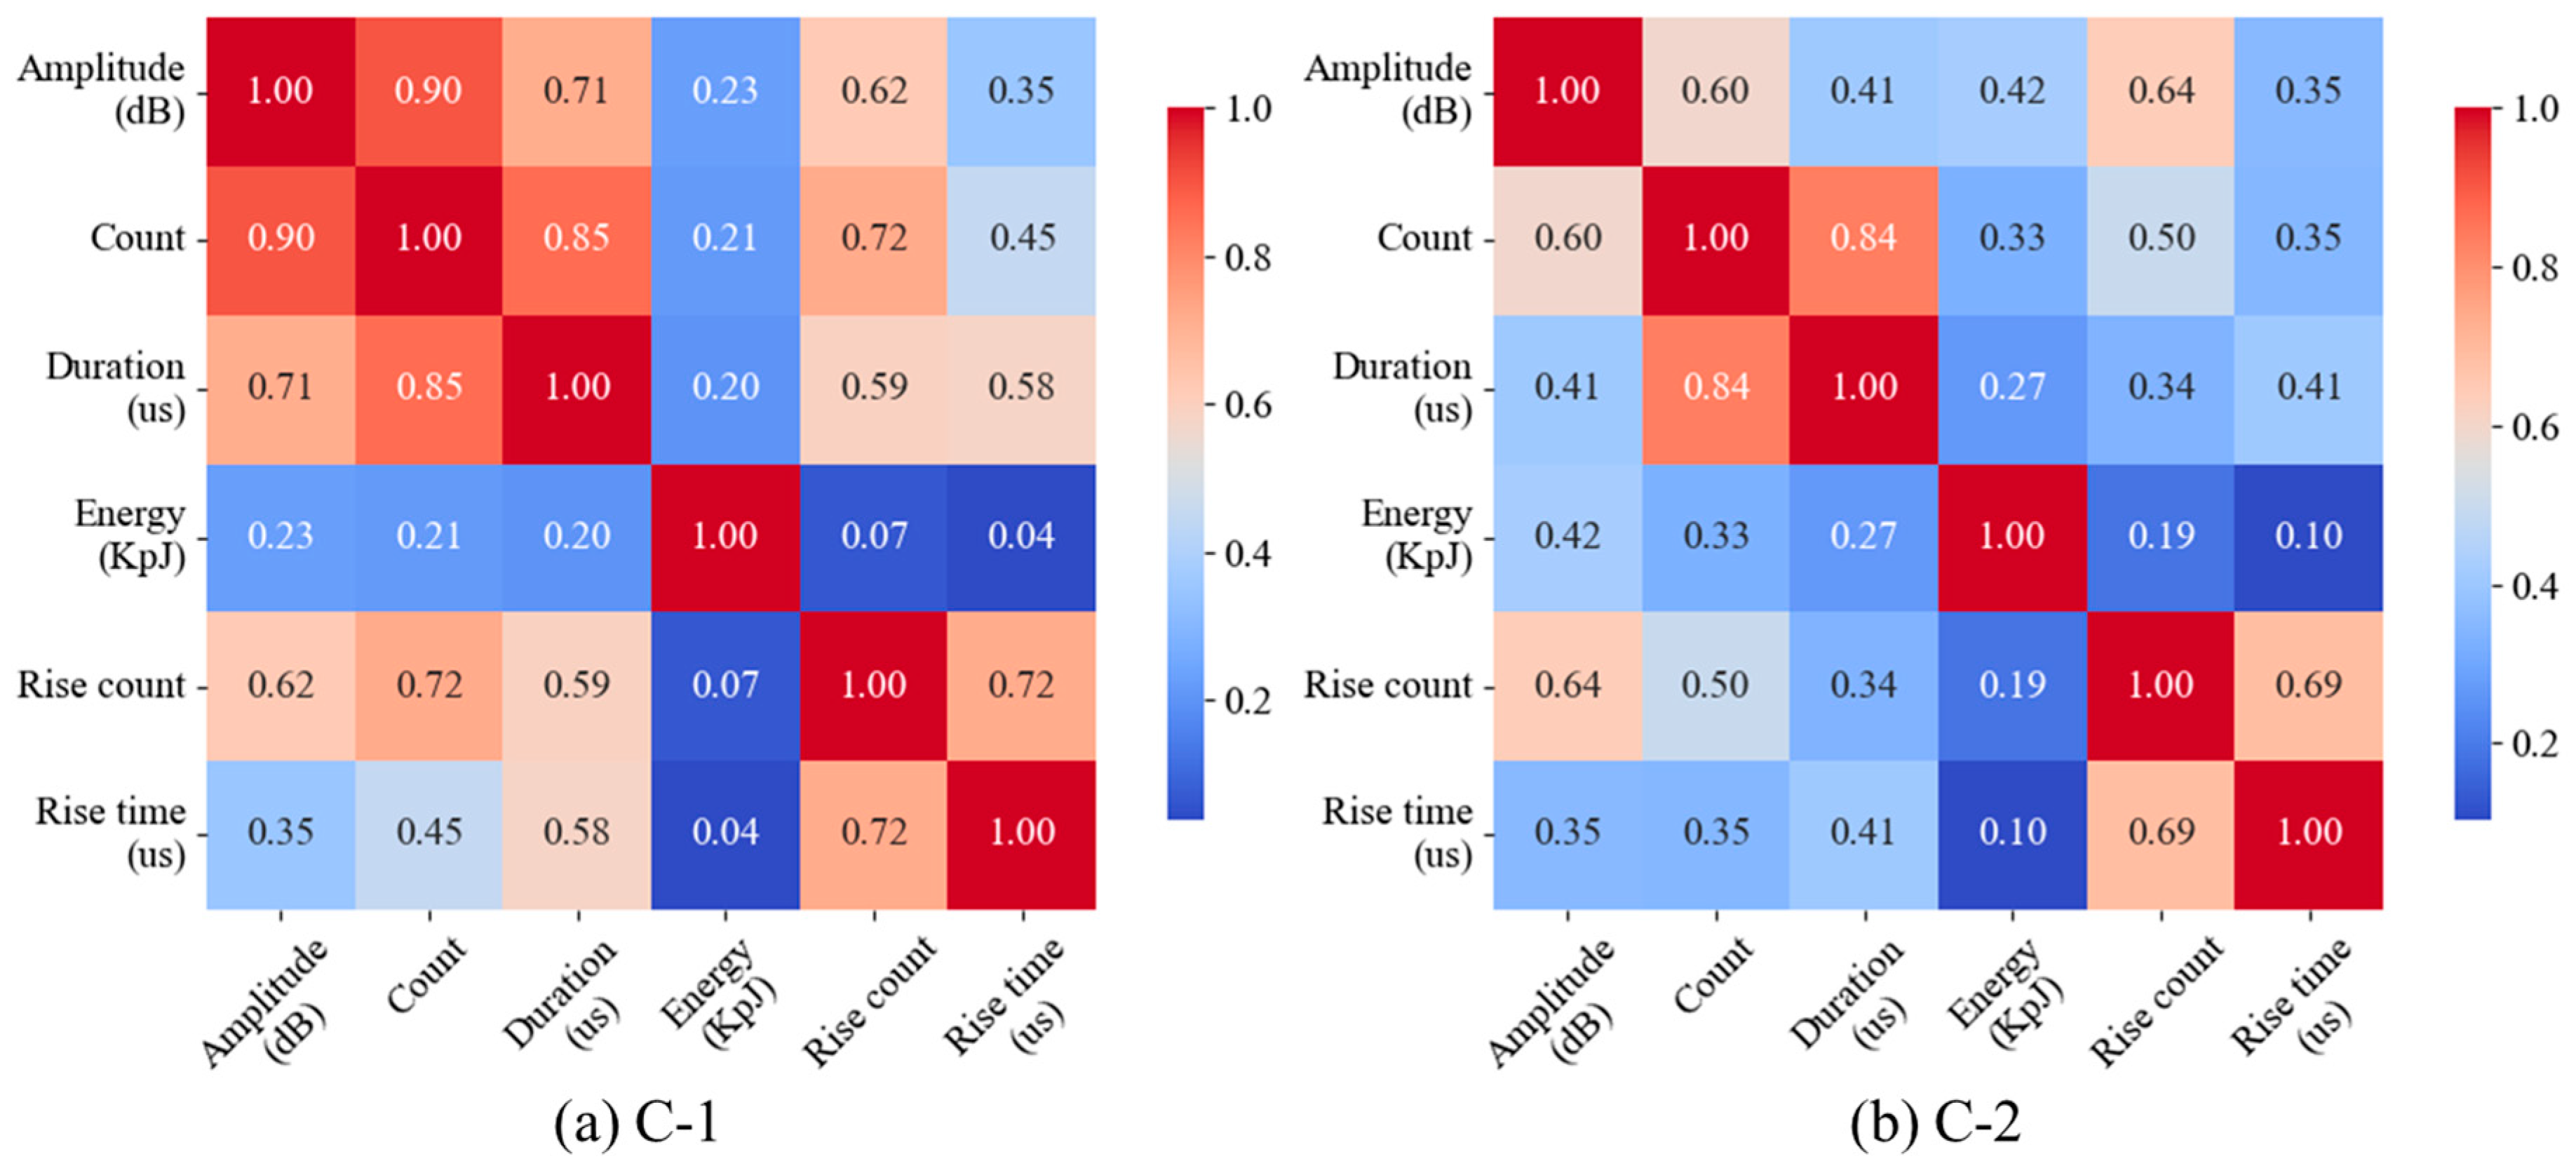
The time points associated with different damage stages and their respective loads are presented in Table 1 to facilitate a comprehensive analysis.
The reinforced concrete (RC) column was connected to the loading apparatus via an articulated support at its top end, while its base was fixed directly onto the ground. During loading, constraint against rotation at the base induced progressive rightward inclination in the mid-height and upper regions of the column under applied load. This deformation mode resulted in maximum displacement at the top, accompanied by slight rightward sliding motion at the base.
As illustrated in Figure 6, negative displacement values correspond to movement toward the dial indicator. Notably, mid-height displacement (P2) exhibited non-linear progression during loading. This occurred due to partial displacement transfer from the central region to the upper section. Furthermore, specimen C-1 demonstrated distinct mid-height displacement behavior during initial loading: displacement initially increased (leftward) followed by subsequent reduction (rightward), culminating in lower final displacement than specimen C-2. This anomaly stems from C-1’s smaller eccentricity, which maintained predominantly compressive stresses throughout most cross-sections during loading. Only regions proximal to the left side experienced tensile stresses. Consequently, crack initiation occurred later in C-2 relative to typical failure progression.

3.2. Results of AE

Figure 7 and Figure 8 detail the temporal evolution of acoustic emission (AE) counts and energy throughout the testing process, respectively. The results demonstrate:
Phase I: Specimen C-1 exhibited elevated AE counts yet lower energy emissions, whereas C-2 showed sparse, infrequent AE activity with signal energy intensities typically approximating 10−1 KpJ.
Phase II: C-1 maintained AE count accumulation rates comparable to Phase I but displayed accelerated energy accumulation. Conversely, C-2 demonstrated rapid increases in cumulative AE counts alongside gradual energy elevation.
Phase III: Both specimens underwent marked transitions characterized by sustained count accumulation rates but abrupt energy surges.
Phase IV: Significantly intensified AE activity occurred in both specimens, featuring prolific high-energy events and substantial count rates.
These findings indicate that differing eccentricities induced divergent AE signatures during initial damage progression. However, convergence in parametric trends emerged during advanced failure stages.
The traditional b-value comes from the Gutenberg Richter formula in seismology, which has been proven effective for AE analysis. Researchers have proposed an improved b-value called the Ib value, which is calculated as follows:
I b = l o g 10 N ( μ α 1 σ ) l o g 10 N ( μ α 2 σ ) ( α 1 α 2 ) σ
where α 1 and α 2 are coefficients, here taking 1; N is the cumulative ring count within the selected time period; and μ and σ are the mean and standard deviation of amplitudes. A high Ib-value characterizes fracture processes dominated by microcracking, whereas a low Ib-value indicates macro-fracture dominance.
Figure 9 illustrates the evolution of the Ib-value (derived from amplitude distributions) across loading stages. Both specimens exhibited elevated Ib-values during initial loading, signifying micro-crack predominance. As loading progressed, Ib-values decreased into a lower range and displayed oscillatory behavior, reflecting concurrent development of macro- and micro-cracks during Phase II. With further load increase, sustained low Ib-values coincided with Phase III macro-crack propagation in the tension zone. However, prior to the conclusion of this phase, a transient Ib-value peak occurred due to micro-cracking initiation in the compression zone concurrent with tension reinforcement yielding. Ultimately, Ib-values stabilized at low magnitudes as macro-scale vertical cracking developed in the compression concrete. This observation confirms that Ib-value analysis provides a reliable framework for delineating damage stages in eccentrically compressed RC columns.

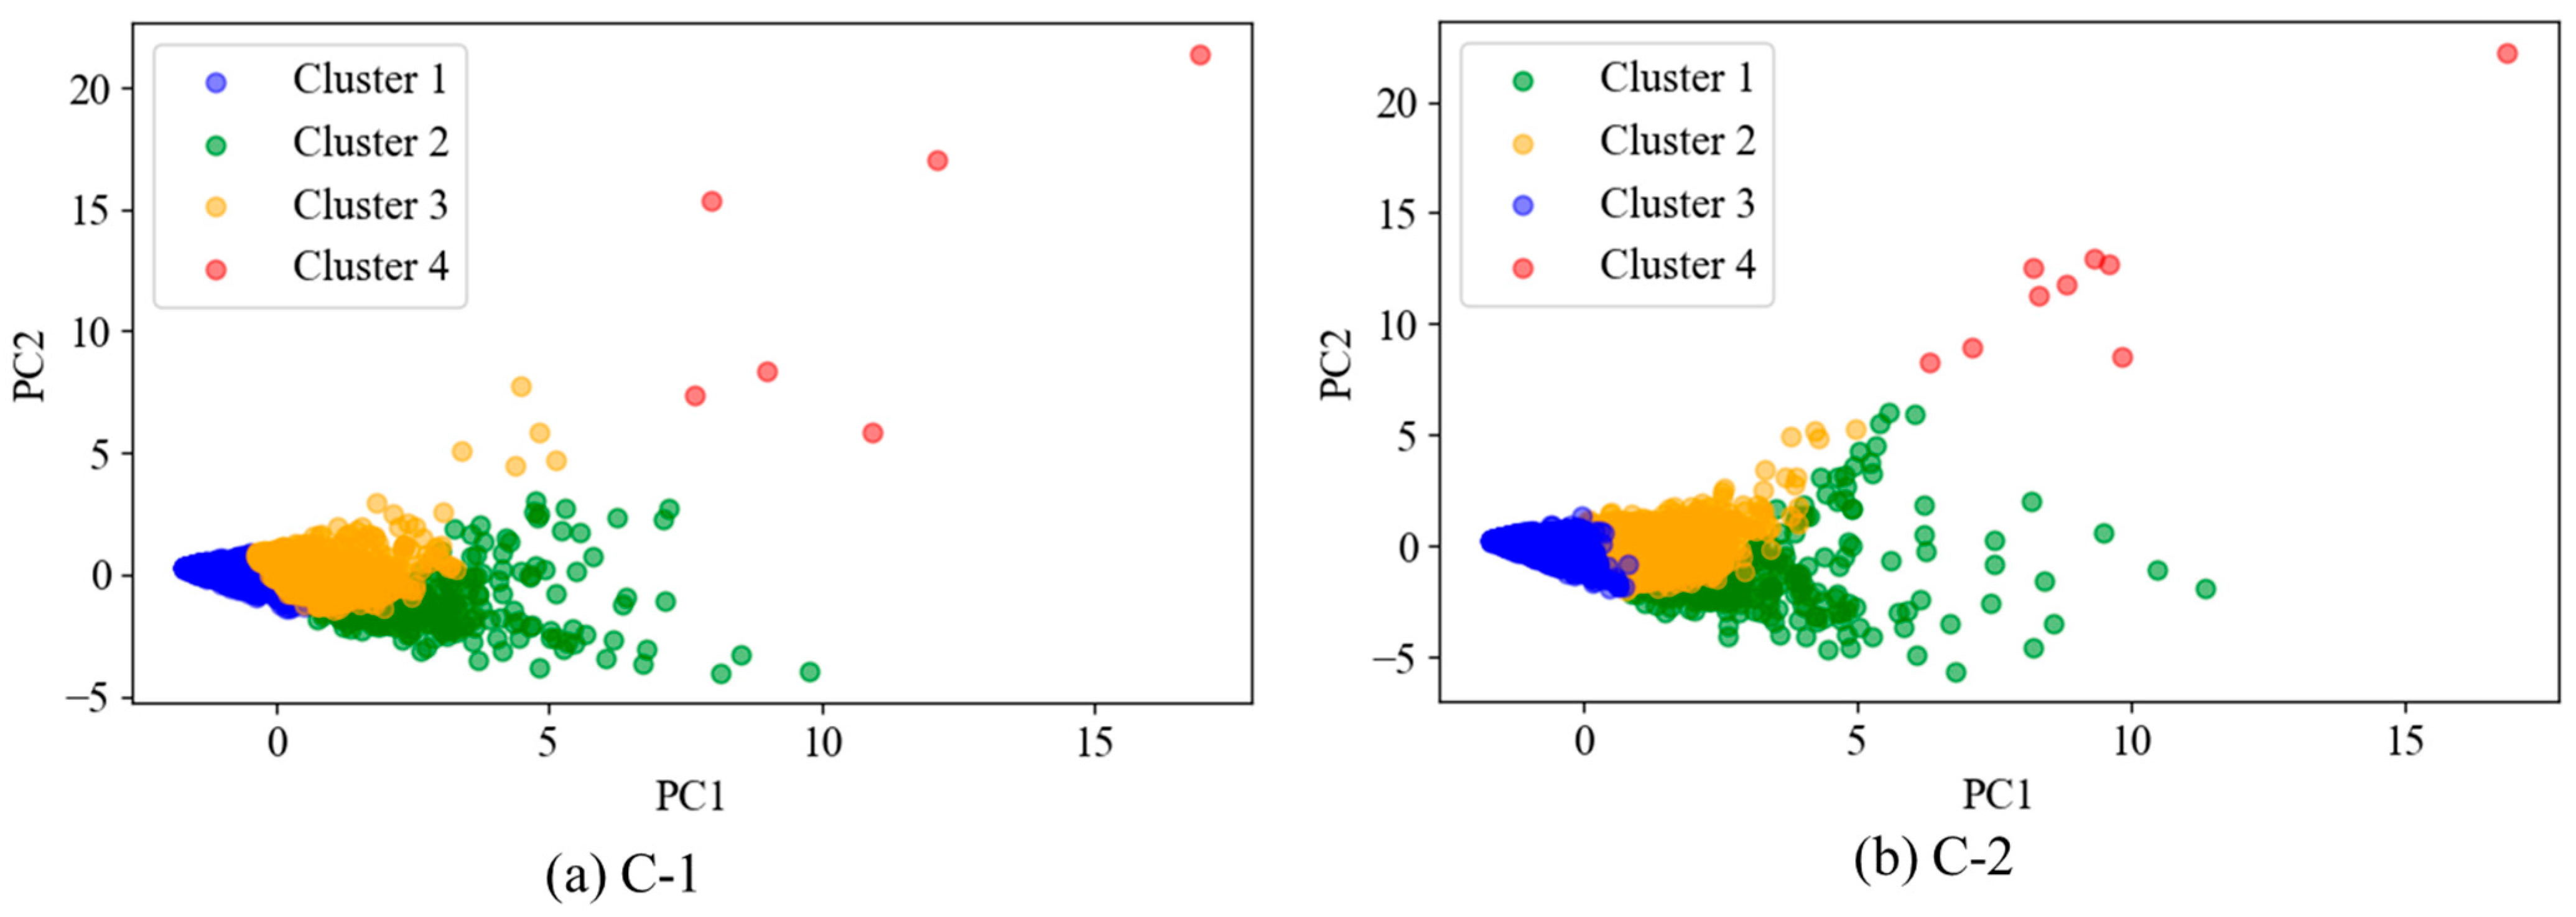
3.3. Results of K-Means Cluster Analysis

Acoustic emission signals constitute high-dimensional datasets where strong parameter correlations may systematically bias analytical outcomes. Specifically, such correlations can distort both the eigenvalue distribution of principal component analysis covariance matrices and the directional orientation of K-means clustering results toward dominant variables. Consequently, the direct application of unprocessed AE data for clustering risks introducing bias into the analysis. This limitation necessitates a preliminary correlation analysis of AE parameters prior to dimensionality reduction or clustering operations.
The Pearson correlation coefficient is commonly used to assess the linear correlation degree in multidimensional data, calculated using the following formula:
r = C o v ( X , Y ) σ X σ Y
where r is the Pearson correlation coefficient, which is bounded between −1 and 1, with values approaching 0 indicating progressively weaker linear associations between the paired datasets. X and Y are two datasets for which the correlation coefficient needs to be calculated. C o v ( X , Y ) denotes the covariance of X and Y , and σ X , σ Y represent the standard deviations of X and Y , respectively.
Figure 10 presents the Pearson correlation matrix; there is a significant correlation between the duration and count of the captured acoustic emission signals for both C-1 and C-2 specimens. This is determined by the calculation method of counting. The difference is that the counting and amplitude of the C-1 sample also exhibit strong correlations, which may be due to the presence of a large number of long duration acoustic emission signals. Given the comprehensive analysis of counts in preceding sections, this section retains duration as a key predictive feature while excluding its collinear counterpart to mitigate multicollinearity risks. Therefore, amplitude, duration, energy, rise count, and rise time are used as feature parameters for PCA for facultative analysis.
Prior to conducting K-means clustering, PCA was employed to mitigate dimensionality while preserving critical feature relationships. As detailed in Table 1, the first four principal components (PC1–PC4) collectively capture 95.5%~96.76% of the total explained variance, with PC1 and PC2 accounting for 69.5%~76.36% of the explained variance. To balance computational efficiency with information retention, we retained these four components that jointly exceed the 90% cumulative variance threshold. Subsequent K-means clustering utilized the component loading matrix (Table 2) derived from PCA, ensuring optimal cluster configuration through dimension-reduced feature space optimization.
To visually demonstrate the inter-cluster distribution characteristics, Figure 11 projects the clustering results into the two-dimensional feature space spanned by principal components PC1 and PC2. The energy and amplitude ranges, along with the mean values for each cluster, were calculated as shown in Table 3. Cluster 1 displays the lowest energy and amplitude levels, which may be related to the formation of microcracks in the cement matrix. Cluster 2 shows lower energy and amplitude values, likely associated with slippage between coarse/fine aggregates and cement mortar. Cluster 3 demonstrates relatively high energy and amplitude, attributed to acoustic emission signals generated by the failure of the interfacial transition zone in the concrete. Cluster 4 exhibits high energy and amplitude characteristics, which correspond to the fracture of coarse aggregates in the reinforced concrete.

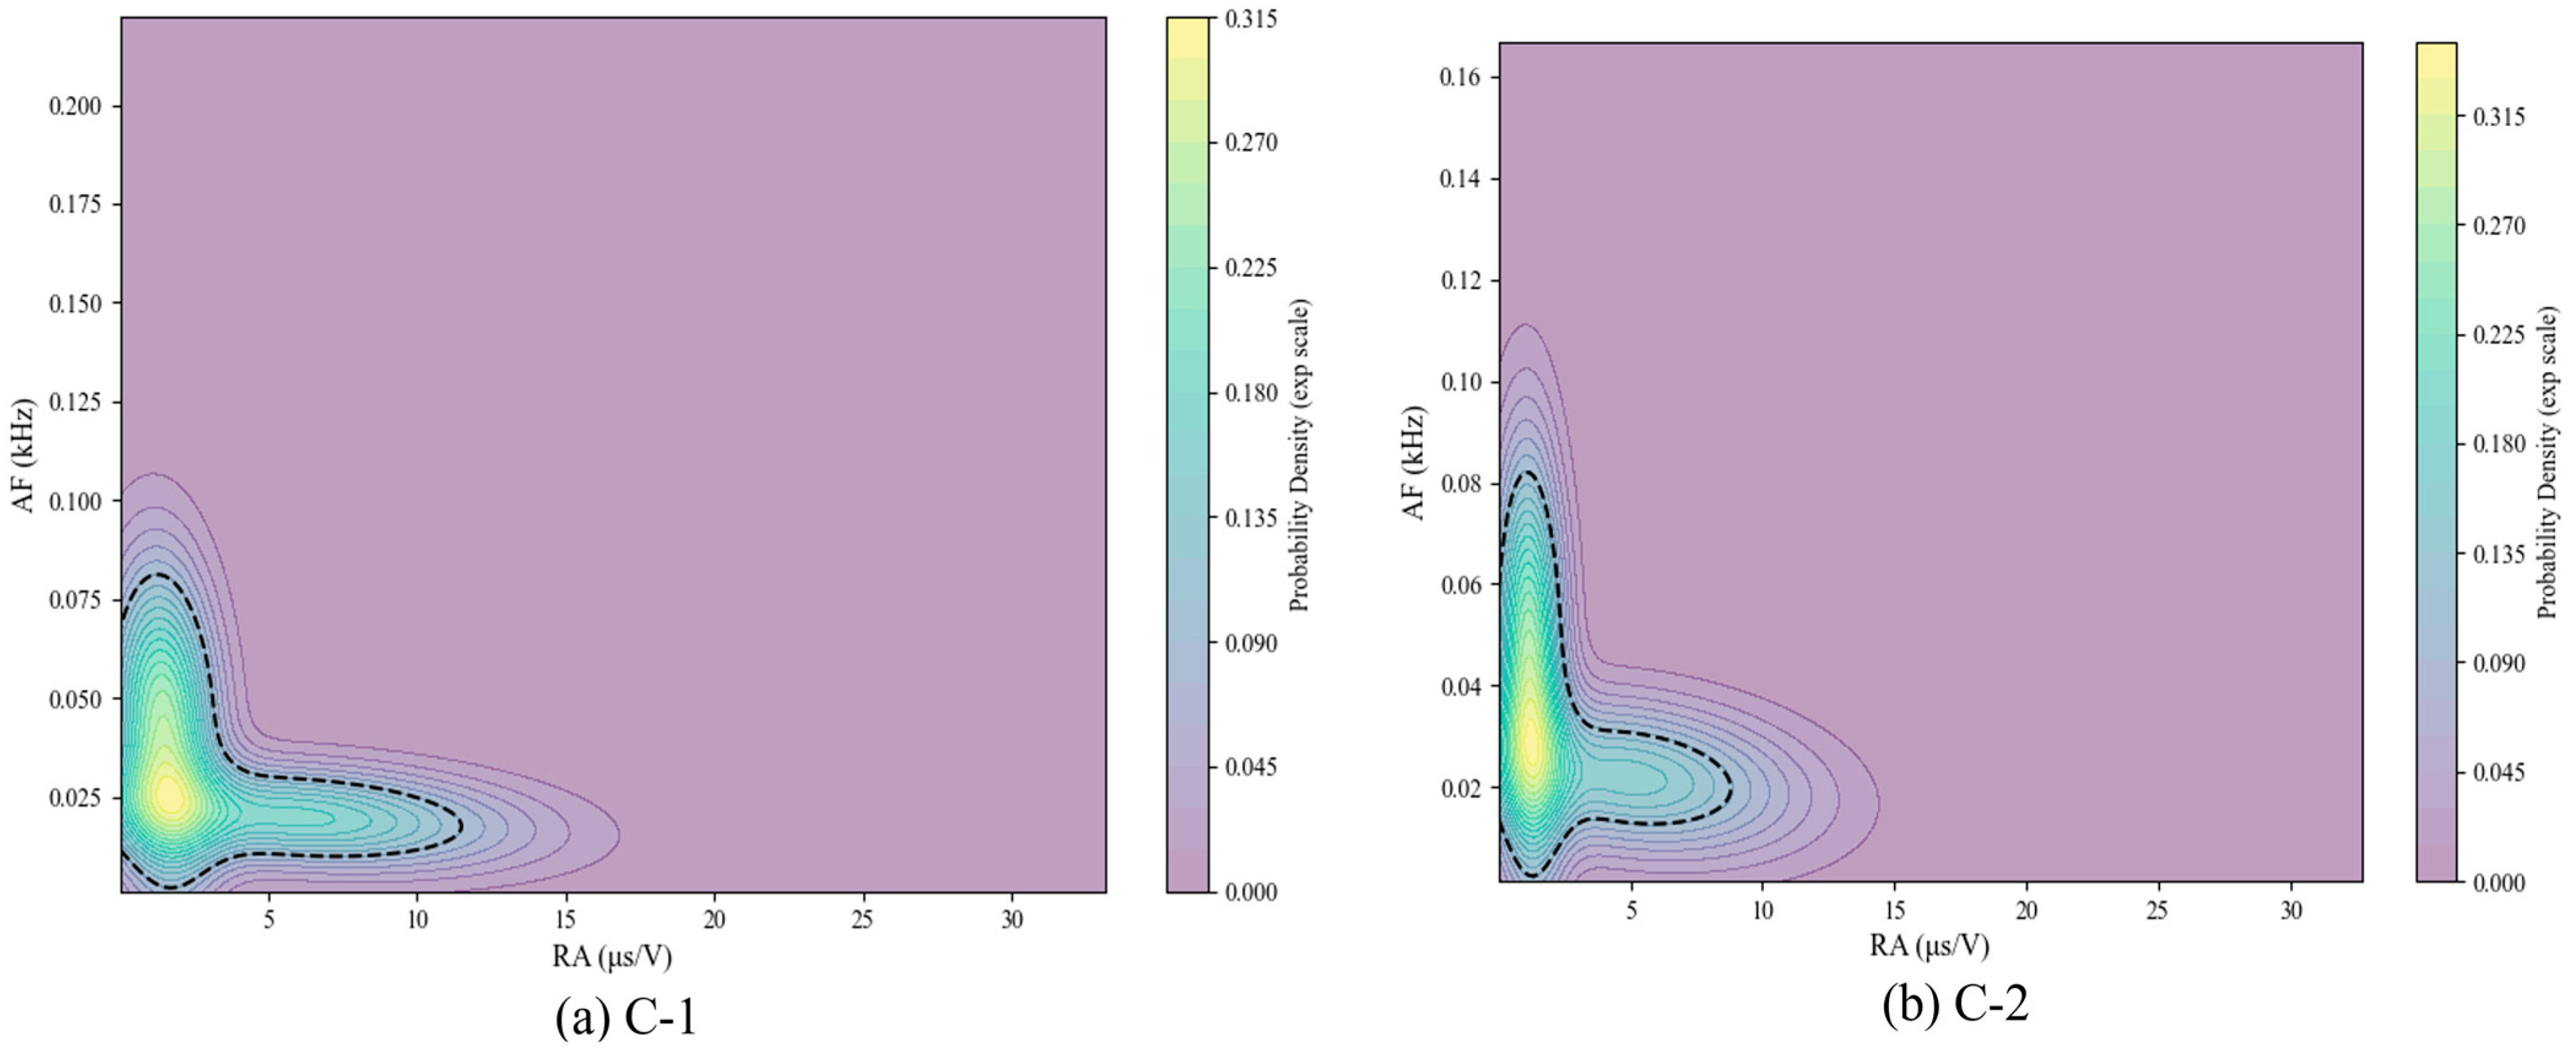
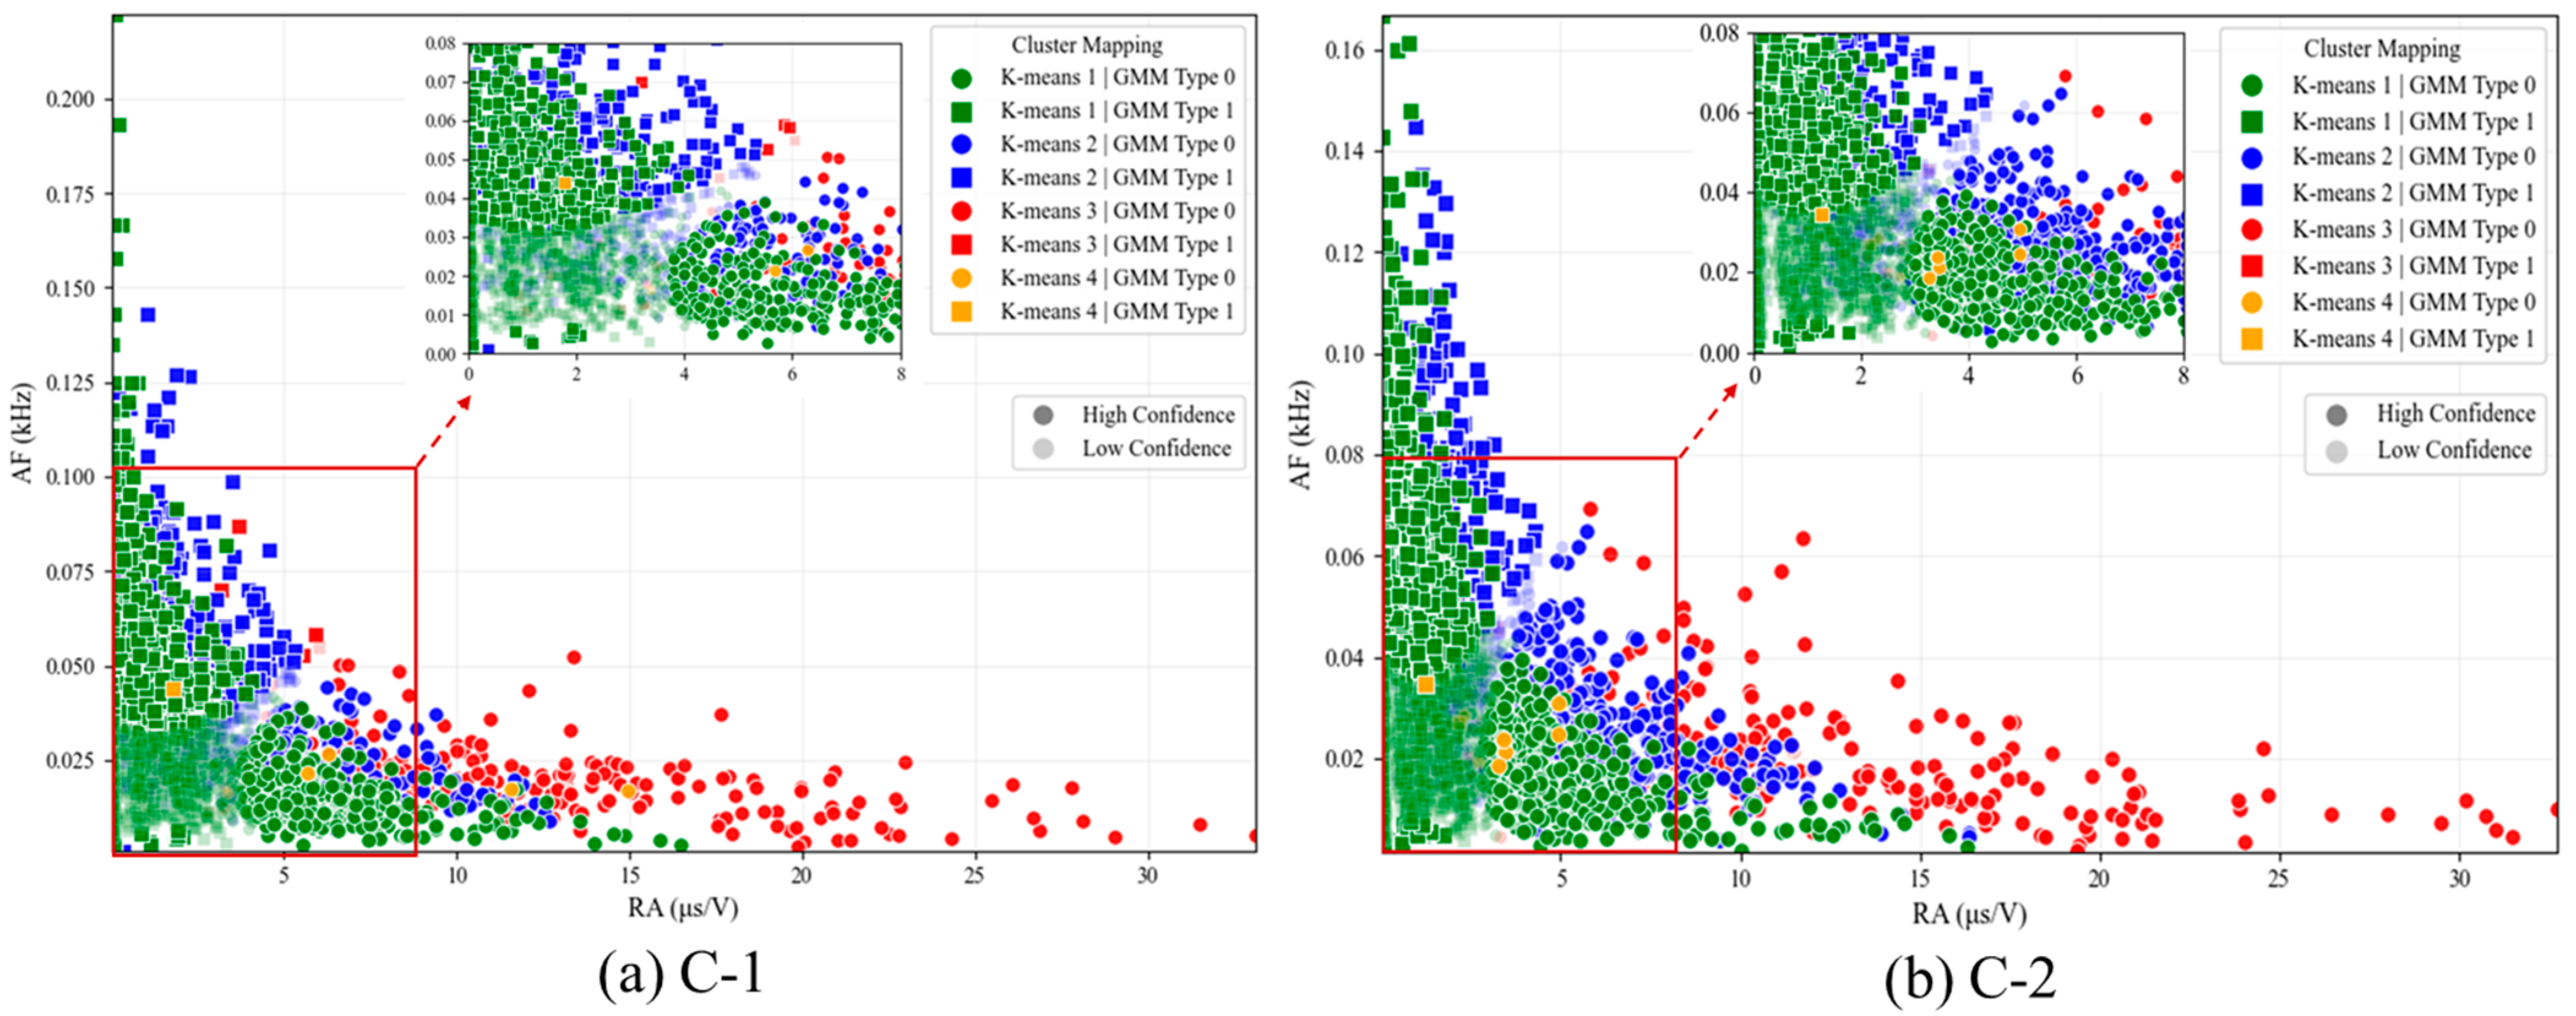
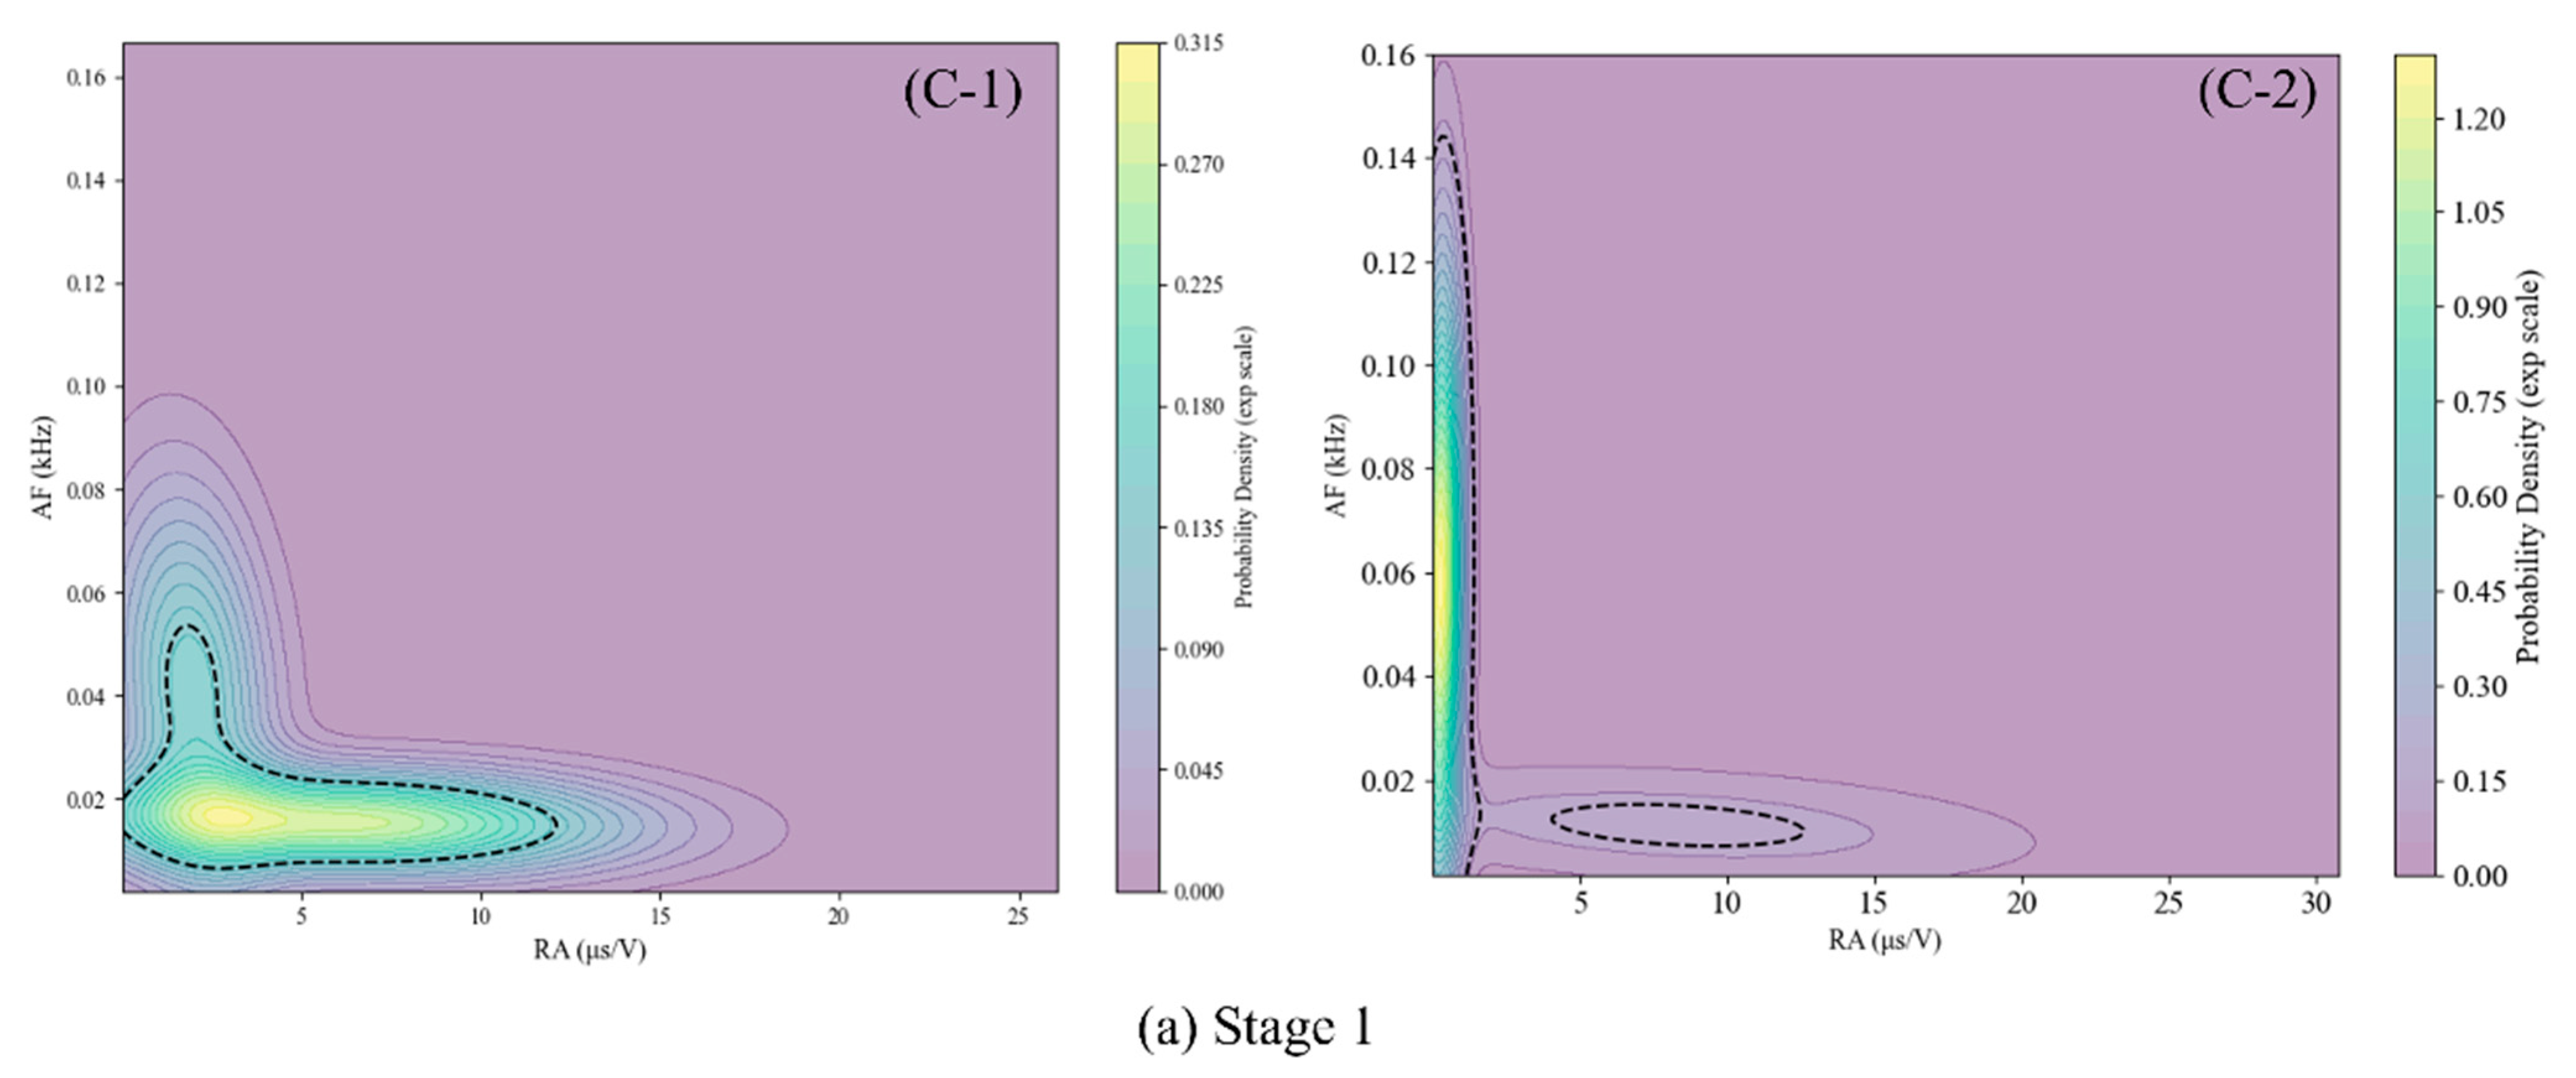
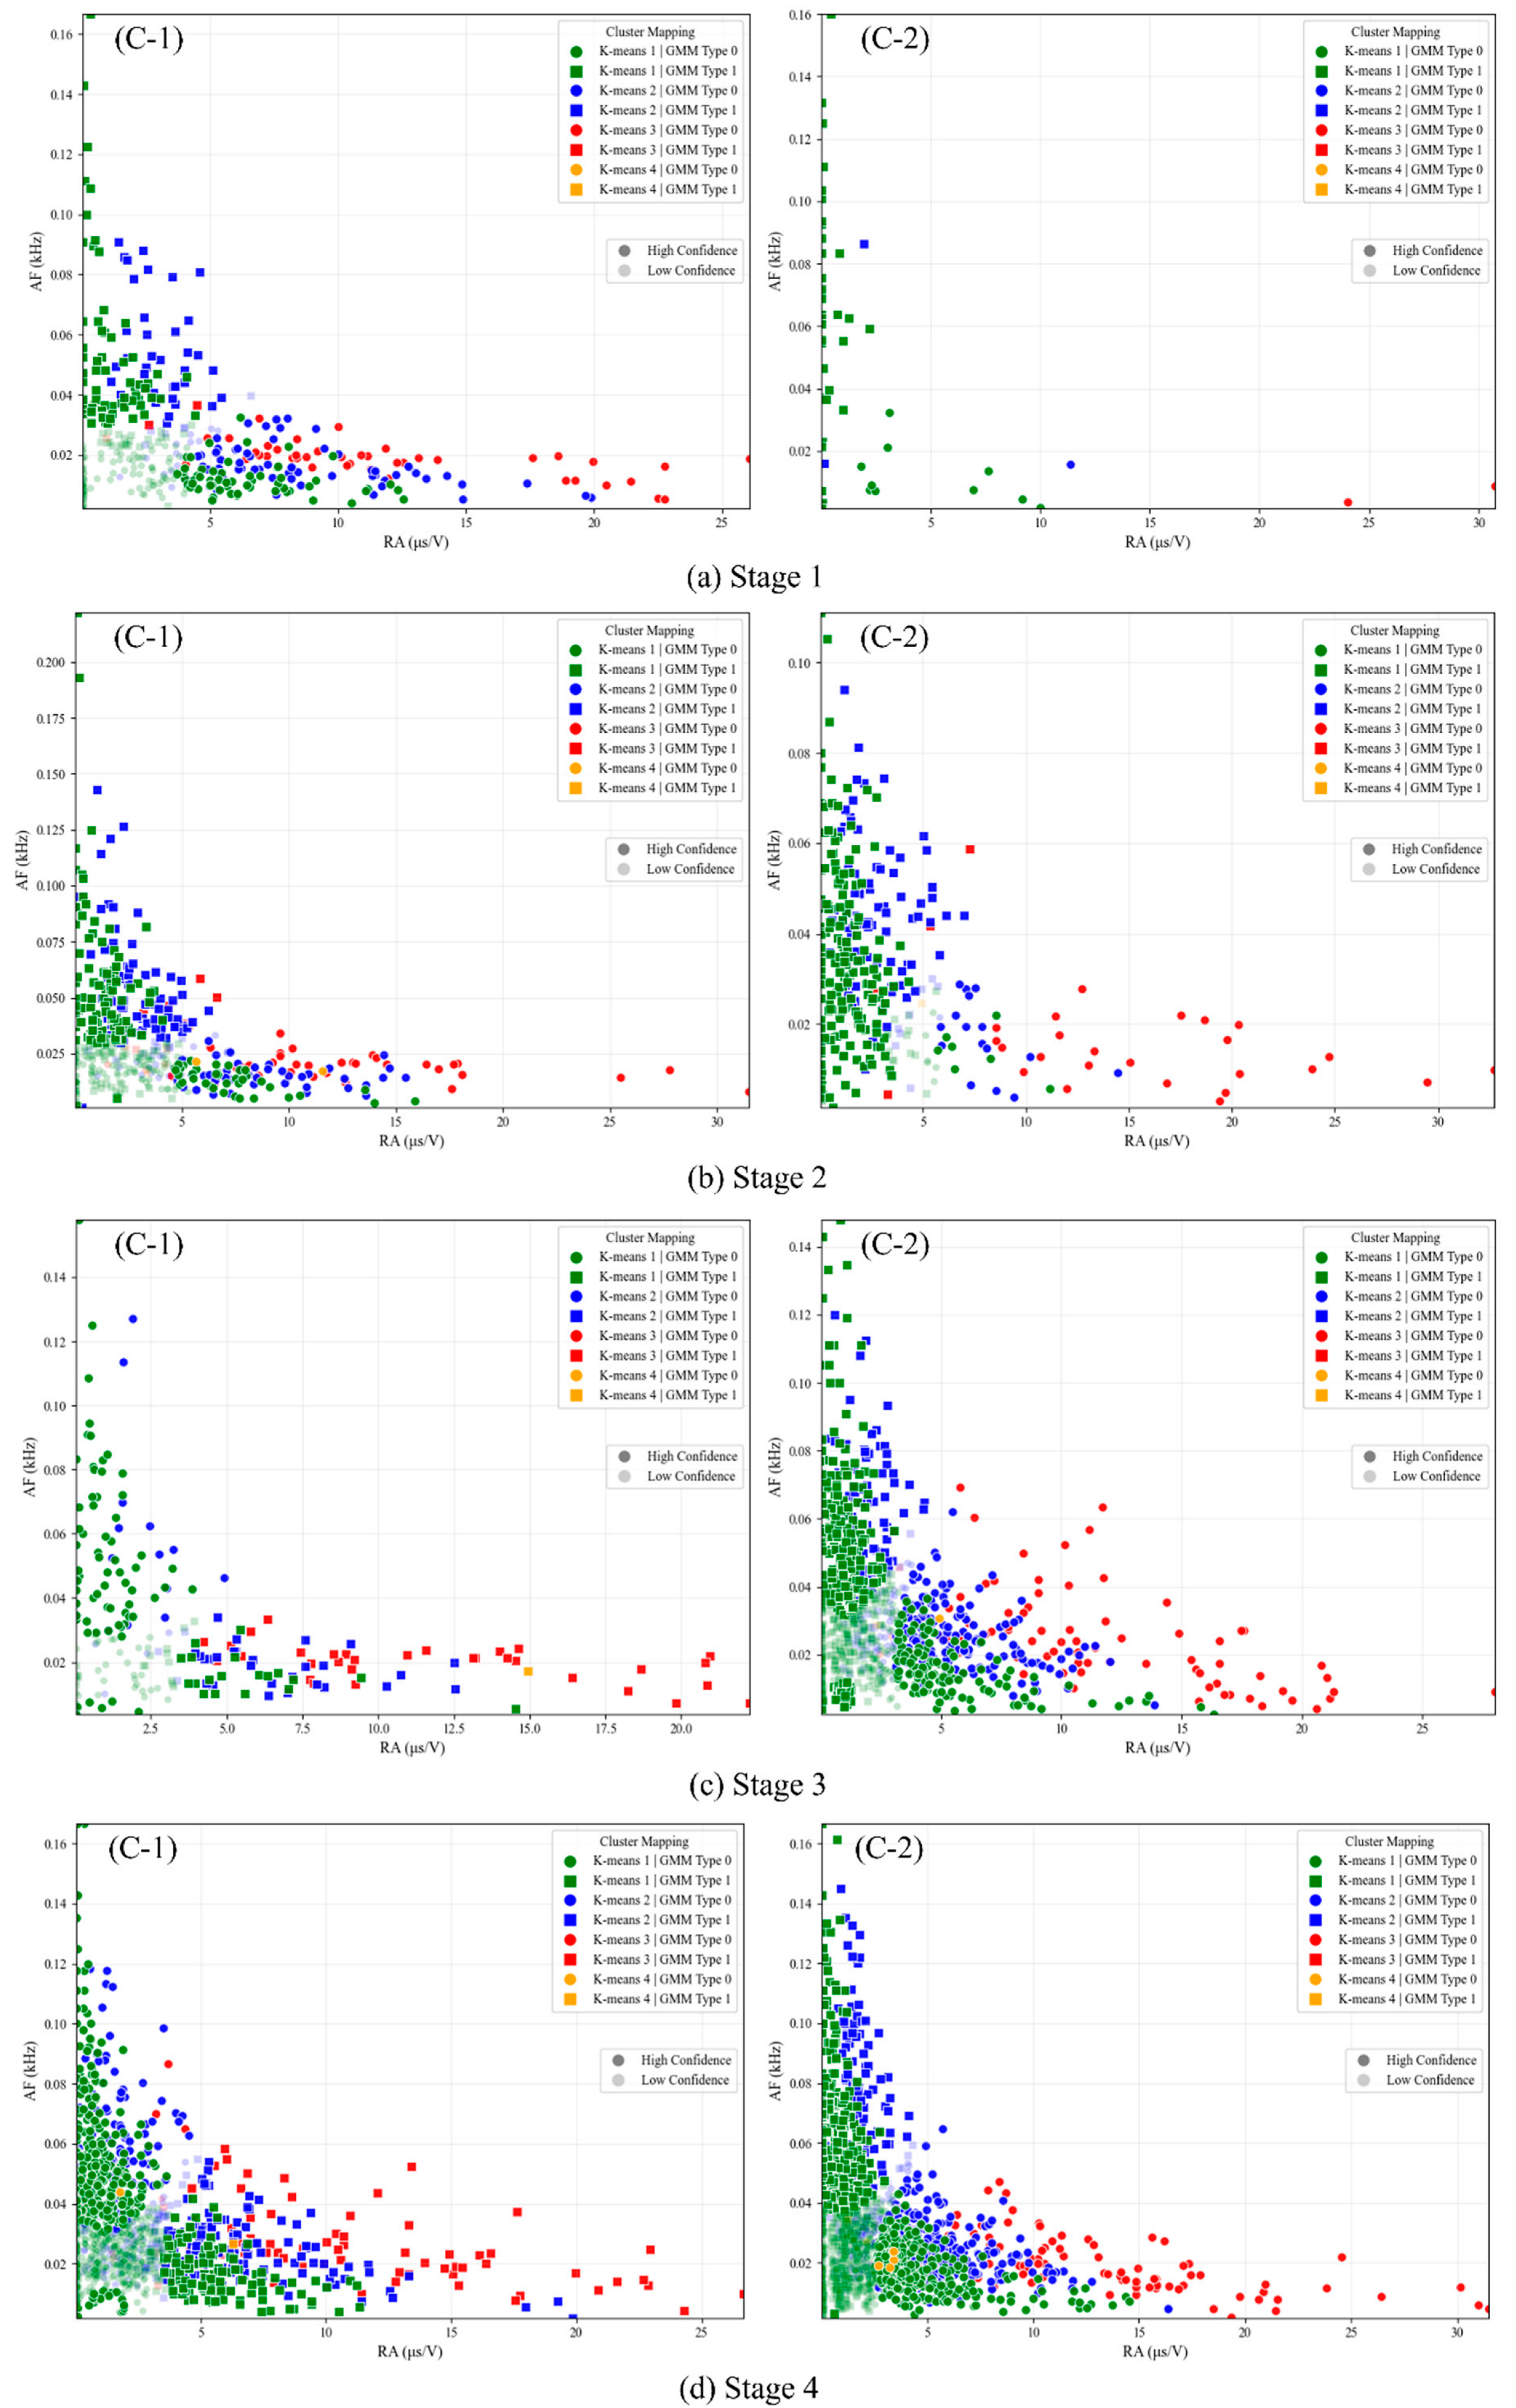
3.4. RA-AF Analysis Results

The K-means analysis results of AE signal features presented in the preceding subsection reveal limitations in cluster separation efficacy. Specifically, inter-cluster data overlap persists across certain feature dimensions, despite prior dimensionality reduction retaining four principal components. This residual multidimensionality likely impedes cluster distinction, as further dimension reduction proves challenging, consequently compromising classification performance. To further investigate the AE signature evolution during eccentric compressive loading, an integrated clustering approach combining Gaussian mixture models (GMMs) and a K-means algorithms was implemented on RA-AF values. The probability density cloud map of RA-AF calculated by GMM is illustrated in Figure 12, and the dashed boundary surrounds the principal data cluster, comprising 95% of the total dataset. The K-means-clustered RA-AF data are presented in Figure 13. In these figures, Geometric markers differentiate fracture types: squares (tensile cracks) and circles (shear cracks). Chromatic coding represents cluster assignments, with point transparency indicating classification confidence (α = 0.2 for low-confidence predictions confidence level < 0.8) in mixed cracks. Lower transparency signifies high confidence (confidence level > 0.8). The results demonstrate that mixed cracks dominated throughout the failure process, followed by tensile cracks, with shear cracks exhibiting the smallest proportion.
As depicted in Figure 14 and Figure 15, the spatiotemporal evolution of RA-AF characteristics under varying loading conditions was quantified through probability density contour maps and distribution matrices. During initial loading, both specimens exhibited predominant AE signal generation from Cluster 1, with minor contributions from Clusters 2 and 3. C-1 demonstrated higher AE counts with increased shear cracking prevalence, contrasting with C-2’s lower AE event frequency. Probability density maps revealed AE event concentration in high-AF and low-RA regions, indicating tensile crack dominance. Minor populations displayed high-RA and low-AF signatures (shear precursors), correlating with cement matrix microcracking and aggregate–cement interfacial slip. Phase II witnessed increased AE events in both specimens while maintaining Cluster 1 predominance. A leftward shift in the probability density centroid was seen in C-1, while migration toward shear-characteristic zones was observed in C-2. This phase marked the micro-to-macro crack transition with intensified interfacial transition zone (ITZ) degradation and aggregate slippage. Phase III showed progressive AE intensification in C-2 but attenuation in C-1. Density distributions reflected increased tensile and mixed-mode fracturing in both specimens. This mechanical response indicates reduced elastic energy release through established fracture pathways during major crack propagation. During post-failure displacement control, AE signals further increased with altered cluster distribution. Probability density maps demonstrated significant RA-AF signature migration toward predominantly mixed-mode and shear cracking. This behavior is attributed to reinforcement yielding, concrete crack widening, and compressive crushing mechanisms.
As demonstrated, the characteristics of acoustic emission (AE) signals vary across different damage stages, and the RA-AF values obtained through clustering analysis exhibit distinct patterns. This enables the systematic classification of damage mechanisms and facilitates the establishment of damage-specific labels for experimental data, which can be utilized to develop predictive models. Based on the aforementioned analysis, AE signals are categorized into seven distinct classes based on their underlying damage mechanisms, as summarized in Table 4.

4. Discussion

To address the problem of damage state identification in reinforced concrete structures, this study proposes a random forest classification method that integrates K-means clustering and Gaussian mixture model. The method processes acoustic emission data downscaled by principal component analysis by K-means algorithm to identify the degree of damage, while the GMM model is used to identify the crack type of normalized processed RA-AF data. As shown in Figure 16, the process is as follows: first, the two types of processed data are input into the K-means and GMMs to obtain the clustering labels; second, the mapping relationship between the clustering labels and the damage factors is established through the experimental calibration; then, the fusion of the damage labels and the clustering data is used to construct the random forest training set; and finally, the reliability of the model is confirmed through the cross-validation experiments.
The acoustic emission data, processed through a hybrid clustering approach combining K-means and Gaussian mixture models, provides critical insights into damage causation mechanisms in reinforced concrete columns. This analytical framework enables the precise identification of damage progression stages during eccentric compression loading. In this study, we integrate the clustering results from both methods into a unified dataset for random forest model training. The resultant hybrid supervised learning model, leveraging the complementary strengths of K-means and GMM clustering, demonstrates the enhanced accuracy and computational efficiency of damage state assessment.
Based on the damage labels and acoustic emission data obtained in Section 3.4, this study constructed a supervised random forest learning model integrated with the K-means and Gaussian mixture model following the workflow outlined in Section 3.4. The model achieved a training accuracy of 95.7% and was validated using new experimental data. As shown in Figure 17a (confusion matrix) and Figure 17b (evaluation curves), the model demonstrated strong recognition capabilities for most damage states (e.g., Type 1/4/6, with F1-scores of > 0.7 and precision–recall differences of < 0.2). However, it failed to effectively classify Type 3 due to insufficient crushed concrete samples. Notably, Types 2 and 7 exhibited relatively low recall rates but stable prediction precision, while Type 5 showed a low missed detection rate yet constrained accuracy. This misclassification is hypothesized to stem primarily from the absence of temporal features in the analysis. Despite limitations in identifying specific damage types, the model achieved an overall prediction accuracy of 85%, proving effective for damage state identification in reinforced concrete columns.

5. Conclusions

This study investigates the acoustic emission characteristics of reinforced concrete columns under eccentric compression. AE data were classified using K-means clustering integrated with GMM. Damage labels were assigned by correlating clustering results with experimentally observed failure stages. A random forest model was subsequently trained on AE feature parameters for damage prediction, yielding the following conclusions:
(1)
AE signal characteristics exhibit strong correlation with damage progression in RC columns. Variations in AE signatures effectively identify damage stages, while eccentricity significantly influences both failure mechanisms and corresponding AE patterns.
(2)
The damage stages of reinforced concrete eccentrically compressed columns are divided into four stages using acoustic emission signals and experiments. Different stages have different acoustic emission signal patterns with varying amplitudes and energy ranges. As the damage stage changes, the amplitude and energy range of the acoustic emission further increases.
(3)
K-means clustering partitioned AE data into four clusters. However, high-dimensional AE parameter space limits cluster differentiation. Therefore, cluster interpretation incorporated GMM-processed RA-AF results and experimental observations, establishing seven distinct damage labels for classification, which provides a more comprehensive and detailed overview of the different types of damage that occur.
(4)
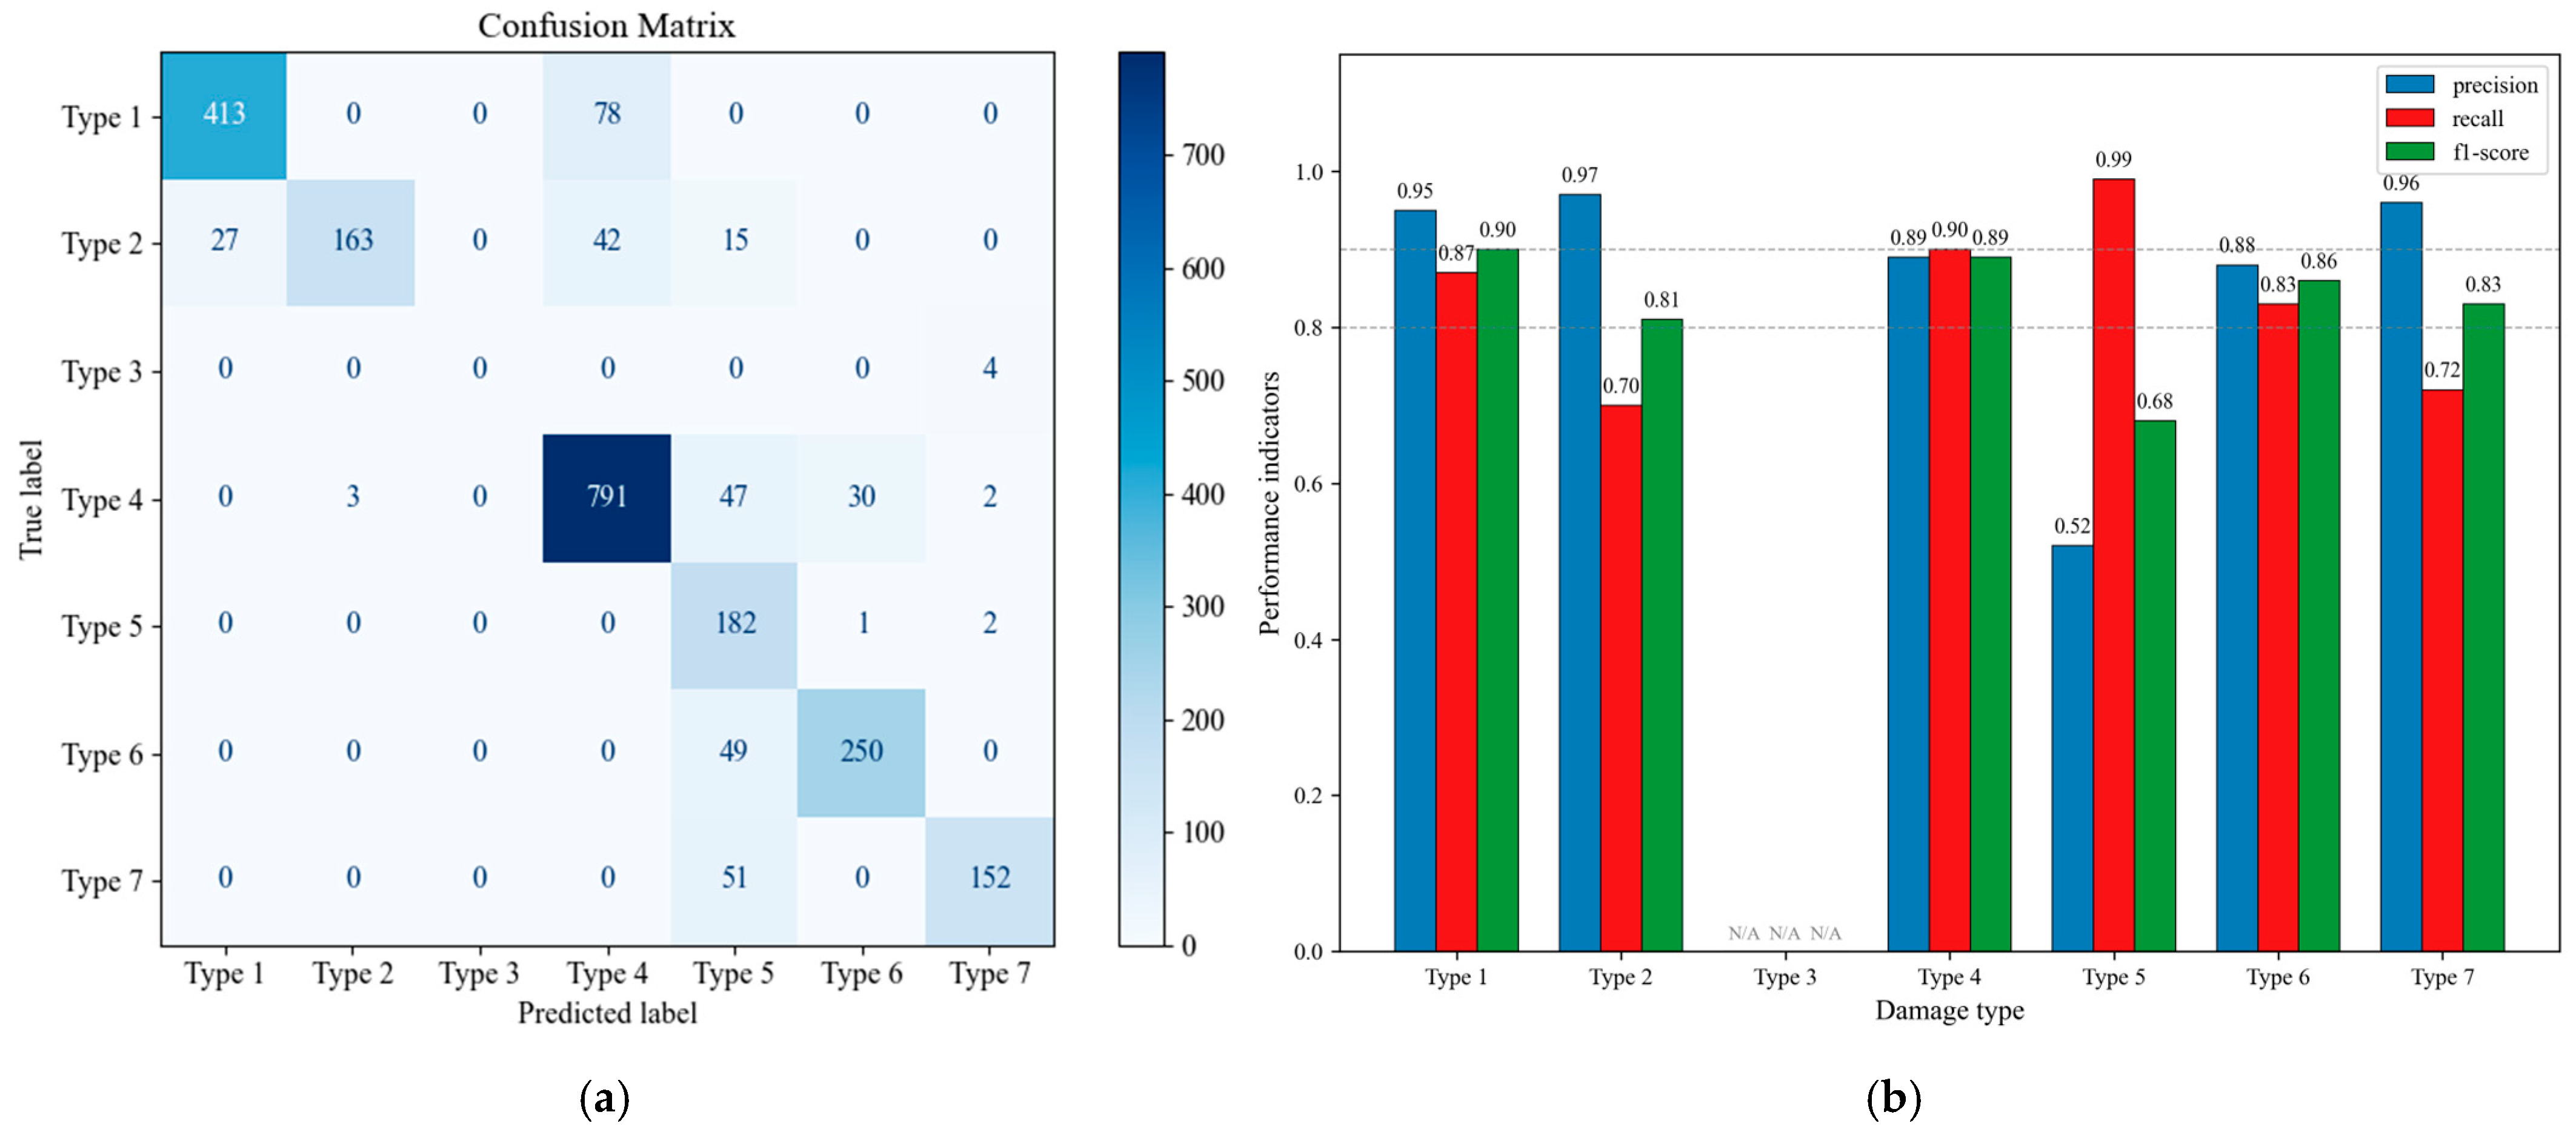
The integrated K-means/GMM supervised learning model achieved an 85% overall accuracy in identifying damage states. Nevertheless, predictive performance warrants further refinement through enhancements such as temporal feature optimization.
These findings demonstrate that AE monitoring combined with machine learning algorithms can quantitatively characterize concrete damage mechanisms under eccentric loading conditions. The classification model proposed in the experiment can be used to judge the damage type of eccentrically compressed concrete columns, such as the structural health monitoring of columns in bridges or frame structures. Due to limitations in experimental conditions and the limited amount of data for Type 3, it was not accurately predicted. In the future, research on the following aspects could be undertaken:
(a)
Temperature, humidity, and other factors should be introduced into the model to improve its applicability;
(b)
Combined with a time series, the classification model should be strengthened to predict the occurrence and location of the structural damage.

Author Contributions

Conceptualization, A.J. and T.-M.O.; methodology, A.J.; software, S.D.; investigation, A.K. and T.H.; resources, A.J.; data curation, S.D. and A.K.; writing—original draft preparation, S.D.; writing—review and editing, A.J.; visualization, S.D.; supervision, A.J.; project administration, A.J.; funding acquisition, A.J. All authors have read and agreed to the published version of the manuscript.

Funding

This research was funded by the Natural Science Foundation of Xinjiang Uygur Autonomous Region (grant no. 2022D01C685), the National Natural Science Foundation of China (grant no. 52368051) and the Postgraduate Research Innovation Project of Xinjiang Uygur Autonomous Region (grant no. 107552301571).

Data Availability Statement

The data presented in this study are available upon request from the corresponding author.

Acknowledgments

The funding sources and support are gratefully acknowledged.

Conflicts of Interest

The authors declare no conflicts of interest.

References

  1. Chen, T.; Luo, Y.; Shen, Y.; Zhang, L. Dynamic behaviors of corroded RC column under low-velocity impact loading. Ocean Eng. 2025, 324, 120679. [Google Scholar] [CrossRef]
  2. Abdallah, M.; Dua, A.; Hajiloo, H.; Braimah, A. Dynamic response of RC and CFFT columns under impact loading caused by vehicle collison: Numerical simulation. Structures 2024, 64, 106575. [Google Scholar] [CrossRef]
  3. Xiao, S.; Fomin, N.I. Development and systematic review of connection techniques for RC Precast structural elements: Beam and Column Connection. Heliyon 2024, 10, e35886. [Google Scholar] [CrossRef] [PubMed]
  4. Li, D.; Zhou, J.; Ou, J. Damage, nondestructive evaluation and rehabilitation of FRP composite-RC structure: A review. Constr. Build. Mater. 2021, 271, 121551. [Google Scholar] [CrossRef]
  5. Verstrynge, E.; Steen, C.V.; Vandecruys, E.; Wevers, M. Steel corrosion damage monitoring in reinforced concrete structures with the acoustic emission technique: A review. Constr. Build. Mater. 2022, 349, 128732. [Google Scholar] [CrossRef]
  6. Behnia, A.; Chai, H.K.; Shiotani, T. Advanced structural health monitoring of concrete structures with the aid of acoustic emission. Constr. Build. Mater. 2014, 65, 282–302. [Google Scholar] [CrossRef]
  7. Wang, X.; Liu, J.; Li, X.; Chen, Y.F. Behavior of eccentrically loaded circular tubed steel-reinforced concrete short columns using high-strength concrete. Structures 2022, 37, 32–43. [Google Scholar] [CrossRef]
  8. Yang, Y.; Chen, Y.; Zhang, W.; Feng, S. Behavior of partially precast steel reinforced concrete columns under eccentric loading. Eng. Struct. 2019, 197, 109429. [Google Scholar] [CrossRef]
  9. Ombres, L.; Verre, S. Structural behaviour of fabric reinforced cementitious matrix (FRCM) strengthened concrete columns under eccentric loading. Compos. Part B Eng. 2015, 75, 235–249. [Google Scholar] [CrossRef]
  10. Gharehbaghi, V.R.; Noroozinejad Farsangi, E.; Noori, M.; Yang, T.Y.; Li, S.; Nguyen, A.; Nguyen, A.; Málaga-Chuquitaype, C.; Gardoni, P.; Mirjalili, S. A Critical Review on Structural Health Monitoring: Definitions, Methods, and Perspectives. Arch. Comput. Methods Eng. 2022, 29, 2209–2235. [Google Scholar] [CrossRef]
  11. Pan, T.; Zhang, Z.; Zheng, Y.; Wang, K. Acoustic emission-based analysis of mechanical behavior and damage evolution in corroded RC square columns. Constr. Build. Mater. 2025, 469, 140458. [Google Scholar] [CrossRef]
  12. Aggelis, D.G. Classification of cracking mode in concrete by acoustic emission parameters. Mech. Res. Commun. 2011, 38, 153–157. [Google Scholar] [CrossRef]
  13. Emmanuel, R.; Thierry, D.; Gaël, C. Clustering acoustic emission data streams with sequentially appearing clusters using mixture models. Mech. Syst. Signal Process. 2022, 181, 109504. [Google Scholar]
  14. de Oliveira, R.; Marques, A.T. Health monitoring of FRP using acoustic emission and artificial neural networks. Comput. Struct. 2008, 86, 367–373. [Google Scholar] [CrossRef]
  15. Arash, E.; Serge, A.K.; Patrice, R.; Ghasem, S. Machine-learning-based crack mode classification in plain concrete considering acoustic emission wave propagation effects. Constr. Build. Mater. 2025, 489, 142188. [Google Scholar]
  16. Yu, B.; Liang, J.; Ju, J.W. Classification method for crack modes in concrete by acoustic emission signals with semi-parametric clustering and support vector machine. Measurement 2025, 244, 116474. [Google Scholar] [CrossRef]
  17. Radhika, V.; Kishen, J.C. A comparative study of crack growth mechanisms in concrete through acoustic emission analysis: Monotonic versus fatigue loading. Constr. Build. Mater. 2024, 432, 136568. [Google Scholar]
  18. Ju, S.; Li, D.; Jia, J. Machine-learning-based methods for crack classification using acoustic emission technique. Mech. Syst. Signal Process. 2022, 178, 109253. [Google Scholar] [CrossRef]
  19. Diez, A.; Khoa, N.L.D.; Makki Alamdari, M.; Wang, Y.; Chen, F.; Runcie, P. A clustering approach for structural health monitoring on bridges. J. Civ. Struct. Health Monit. 2016, 6, 429–445. [Google Scholar] [CrossRef]
  20. Yue, J.G.; Wang, Y.N.; Beskos, D.E. Uniaxial tension damage mechanics of steel fiber reinforced concrete using acoustic emission and machine learning crack mode classification. Cem. Concr. Compos. 2021, 123, 104205. [Google Scholar] [CrossRef]
  21. Yu, X.; Silvio, M.; Mourad, B.; Charfeddine, M. Cluster analysis of acoustic emission signals for the damage pattern recognition of polymer concrete. Appl. Acoust. 2023, 211, 109533. [Google Scholar] [CrossRef]
  22. Wang, X.; Yue, Q.; Liu, X. Crack pattern identification in cementitious materials based on acoustic emission and machine learning. J. Build. Eng. 2024, 87, 109124. [Google Scholar] [CrossRef]
  23. Hamdi, S.E.; Duff, A.L.; Simon, L.; Plantier, G.; Sourice, A.; Feuilloy, M. Acoustic emission pattern recognition approach based on Hilbert–Huang transform for structural health monitoring in polymer-composite materials. Appl. Acoust. 2013, 74, 746–757. [Google Scholar] [CrossRef]
  24. Godin, N.; Huguet, S.; Gaertner, R.; Salmon, L. Clustering of acoustic emission signals collected during tensile tests on unidirectional glass/polyester composite using supervised and unsupervised classifiers. NDT E Int. 2004, 37, 253–264. [Google Scholar] [CrossRef]
  25. Benavent, A.; Castro, E.; Gallego, A. Evaluation of low-cycle fatigue damage in RC exterior beam-column subassemblages by acoustic emission. Constr. Build. Mater. 2010, 24, 1830–1842. [Google Scholar] [CrossRef]
  26. Ganasan, R.; Tan, C.G.; Ibrahim, Z.; Bunnori, N.M.; Nazri, F.M.; Nayaka, R.R. Crack assessment of RC beam–column joints subjected to cyclic lateral loading using acoustic emission (AE): The influence of shear links aspect. Can. J. Civ. Eng. 2021, 48, 1274–1286. [Google Scholar] [CrossRef]
  27. Chen, Z.; Zhang, G.; He, R.; Tian, Z.; Fu, C.; Jin, X. Acoustic emission analysis of crack type identification of corroded concrete columns under eccentric loading: A comparative analysis of RA-AF method and Gaussian mixture model. Case Stud. Constr. Mater. 2023, 18, e02021. [Google Scholar] [CrossRef]
  28. Shen, W.; Bai, H.; Wang, F.; Li, C.; Du, F. Acoustic Emission characteristics and damage evolution of Concrete-Encased CFST columns under compressive load. Eng. Fract. Mech. 2024, 311, 110578. [Google Scholar] [CrossRef]
Figure 1. Reinforcement of specimens.
Applsci 15 07243 g001
Figure 2. (a) Experimental setup and instrument layout: (b) AE monitoring system; (c) strain data acquisition system.
Applsci 15 07243 g002
Figure 3. Acoustic emission waveforms and characteristic parameters.
Applsci 15 07243 g003
Figure 4. RA-AF classification: (a) traditional RA-AF boundary division; (b) optimized RA-AF boundary division.
Applsci 15 07243 g004
Figure 5. Crack initiation process: (a) final crack; (b) cracks at each stage.
Applsci 15 07243 g005
Figure 6. Relationship between each displacement point and load.
Applsci 15 07243 g006
Figure 7. AE ring count versus time for RC columns.
Applsci 15 07243 g007
Figure 8. AE energy versus time for RC columns.
Applsci 15 07243 g008
Figure 9. Lifetime dependency of the Ib-values.
Applsci 15 07243 g009
Figure 10. Pearson correlation matrix.
Applsci 15 07243 g010
Figure 11. Distribution of K-means clustering results.
Applsci 15 07243 g011
Figure 12. Probability density of RA-AF by GMM.
Applsci 15 07243 g012
Figure 13. RA-AF distribution calculated by K-means.
Applsci 15 07243 g013
Figure 14. RA-AF probability density for each loading stage.
Applsci 15 07243 g014aApplsci 15 07243 g014b
Figure 15. RA-AF distribution for each loading stage.
Applsci 15 07243 g015
Figure 16. Training process for predictive modeling of damage causes in RC columns.
Applsci 15 07243 g016
Figure 17. Predicting results by random forest model: (a) confusion matrix for predicting results; (b) evaluation indices for projected results.
Applsci 15 07243 g017
Table 1. Time and load ranges for different stages.
Time (ms)Load (kN)
C-1Phase I0~5000~40
Phase II500~210040~180
Phase III2100~5200180~316
Phase IV5200~5800316~235
C-2Phase I0~11400~60
Phase II1140~247040~160
Phase III2470~3000160~290
Phase IV3000~3600290~220
Table 2. PCA results.
ParametersPC1PC2PC3PC4PC5
C-1Amplitude (dB)0.49580.3195−0.3417−0.5386−0.4952
Duration (μs)0.40790.07430.8507−0.27540.1688
Energy (KpJ)0.32760.6968−0.04120.62380.1276
Rise count0.5289−0.3219−0.3868−0.08240.6784
Rise time (us)0.448−0.55070.09040.488−0.4998
Explained variance ratio (%)0.47830.21640.15150.10950.0443
C-2Amplitude (dB)0.46860.27290.6413−0.11470.5307
Duration (μs)0.52410.12930.0530.7166−0.4385
Energy (KpJ)0.27280.7277−0.557−0.2929−0.0053
Rise count0.4956−0.3623−0.0935−0.6073−0.4955
Rise time (us)0.4309−0.498−0.51670.1370.5297
Explained variance ratio (%)0.5510.21260.1290.0750.0328
Table 3. Energy and amplitude ranges for each cluster.
Energy (KpJ)Amplitude (dB)
C-1Cluster 10.031~125.174, mean = 0.845.3~60.8, mean = 49.5
Cluster 20.329~566.5, mean = 16.246.1~82, mean = 58.2
Cluster 30.246~701.9, mean = 6546.3~78.5, mean = 59
Cluster 4980~3140.5, mean = 1568.474~83.7, mean = 79.9
C-2Cluster 10.031~125.174, mean = 0.845.3~60.8, mean = 49.5
Cluster 20.329~566.5, mean = 16.246.1~82, mean = 58.2
Cluster 30.246~701.9, mean = 6546.3~78.5, mean = 59
Cluster 4980~3140.5, mean = 1568.474~83.7, mean = 79.9
Table 4. Categorization of different models with damage.
Type 1Type 2Type 3Type 4Type 5Type 6Type 7
Microcrack generationMicrocrack developmentConcrete crushingMixed cracksDestruction of ITZAggregate slippageShear crack development
Disclaimer/Publisher’s Note: The statements, opinions and data contained in all publications are solely those of the individual author(s) and contributor(s) and not of MDPI and/or the editor(s). MDPI and/or the editor(s) disclaim responsibility for any injury to people or property resulting from any ideas, methods, instructions or products referred to in the content.

