1. Introduction
Breast cancer is the leading cause of cancer-related deaths among women internationally [
1,
2,
3,
4,
5], making its early detection and correct classification important for developing effective remedies and improving outcomes for people afflicted with this disease [
6,
7,
8,
9,
10]. Traditional diagnostic strategies, including mammography, biopsies, and scientific examinations, although powerful, are not without limitations. These techniques can be time-consuming, invasive, and prone to human error, resulting in delays in diagnosis and treatment. Recent advancements in our understanding of machine learning (ML) and artificial intelligence (AI) have provided promising alternatives to standard diagnostic techniques. ML algorithms can examine massive volumes of clinical records, learn different styles, and provide correct classifications, thereby aiding in the early detection of breast cancer. Among the many machine learning models and techniques, neural networks, decision trees, and autoencoders have demonstrated uniquely significant capabilities in medical diagnostics. Researchers aim to leverage the strengths of these strategies by integrating them into a comprehensive framework for breast cancer classification, as demonstrated in this work.
In this study, we aimed to develop an efficient machine learning (ML) framework that combines a deep multilayer perceptron (Deep MLP) for function extraction, a feature-fused autoencoder for dimensionality reduction, and a weight-tuned cross-validated decision tree for final classification. Each element of the developed framework plays a crucial role in enhancing the framework’s overall performance. The Deep MLP is a sort of synthetic neural network that includes more than one layer of neurons, including input, hidden, and output layers. It is particularly powerful in extracting complex features from information it has been given; some of these features could be crucial for accurate classification. By leveraging its deep knowledge of techniques, Deep MLP can identify challenging patterns within data that may be indicative of malignant or benign breast cancers [
11,
12,
13,
14,
15]. An autoencoder is an unmonitored neural network designed to study the encoding of entered data. This study introduces a feature-fused autoencoder that not only reduces the dimensionality of the input information but also enhances its representation, thereby gaining insight into a given method. The fusion mechanism in the autoencoder integrates characteristic extraction and dimensionality reduction, resulting in a more compact and informative representation of the facts. This step is crucial for reducing computational complexity and enhancing the efficiency of the subsequent classification level. Decision trees are extensively used for classification due to their simplicity and interpretability. However, their overall performance may be substantially enhanced through weight tuning and cross-validation. The Weight-Tuned Cross-Validated Decision Tree in our framework adjusts the weights of various training sets to handle class imbalance. It employs cross-validation to ensure a robust and unbiased evaluation of the model. This method ensures that the final version is accurate and generalizable. To evaluate the effectiveness of the proposed framework, we employed k-fold cross-validation. This robust technique divides a dataset into k subsets, allowing for multiple rounds of training and testing. This method provides a comprehensive assessment of a model’s overall performance across distinct record splits, thereby reducing the likelihood of overfitting and ensuring the reliability of the effects. Performance metrics, including accuracy, precision, F1-rating, and Area Under the Curve (AUC), were used to quantify the model’s effectiveness in classifying breast cancer. The principal contributions of this examination encompass the improvement of a singular ML framework that integrates Deep MLP, a feature-fused autoencoder, and a Weight-Tuned Cross-Validated Decision Tree for breast cancer classification; a comprehensive assessment of the proposed framework via the Wisconsin breast cancer dataset, demonstrating advanced performance across numerous training and testing splits; and an in-depth analysis of the model’s overall performance using more than one metric, highlighting its robustness and accuracy. By integrating current deep MLP techniques into a cohesive and practical framework, this study aims to contribute to ongoing efforts to improve breast cancer prognosis and ultimately enhance patient care and outcomes.
2. Materials and Methods
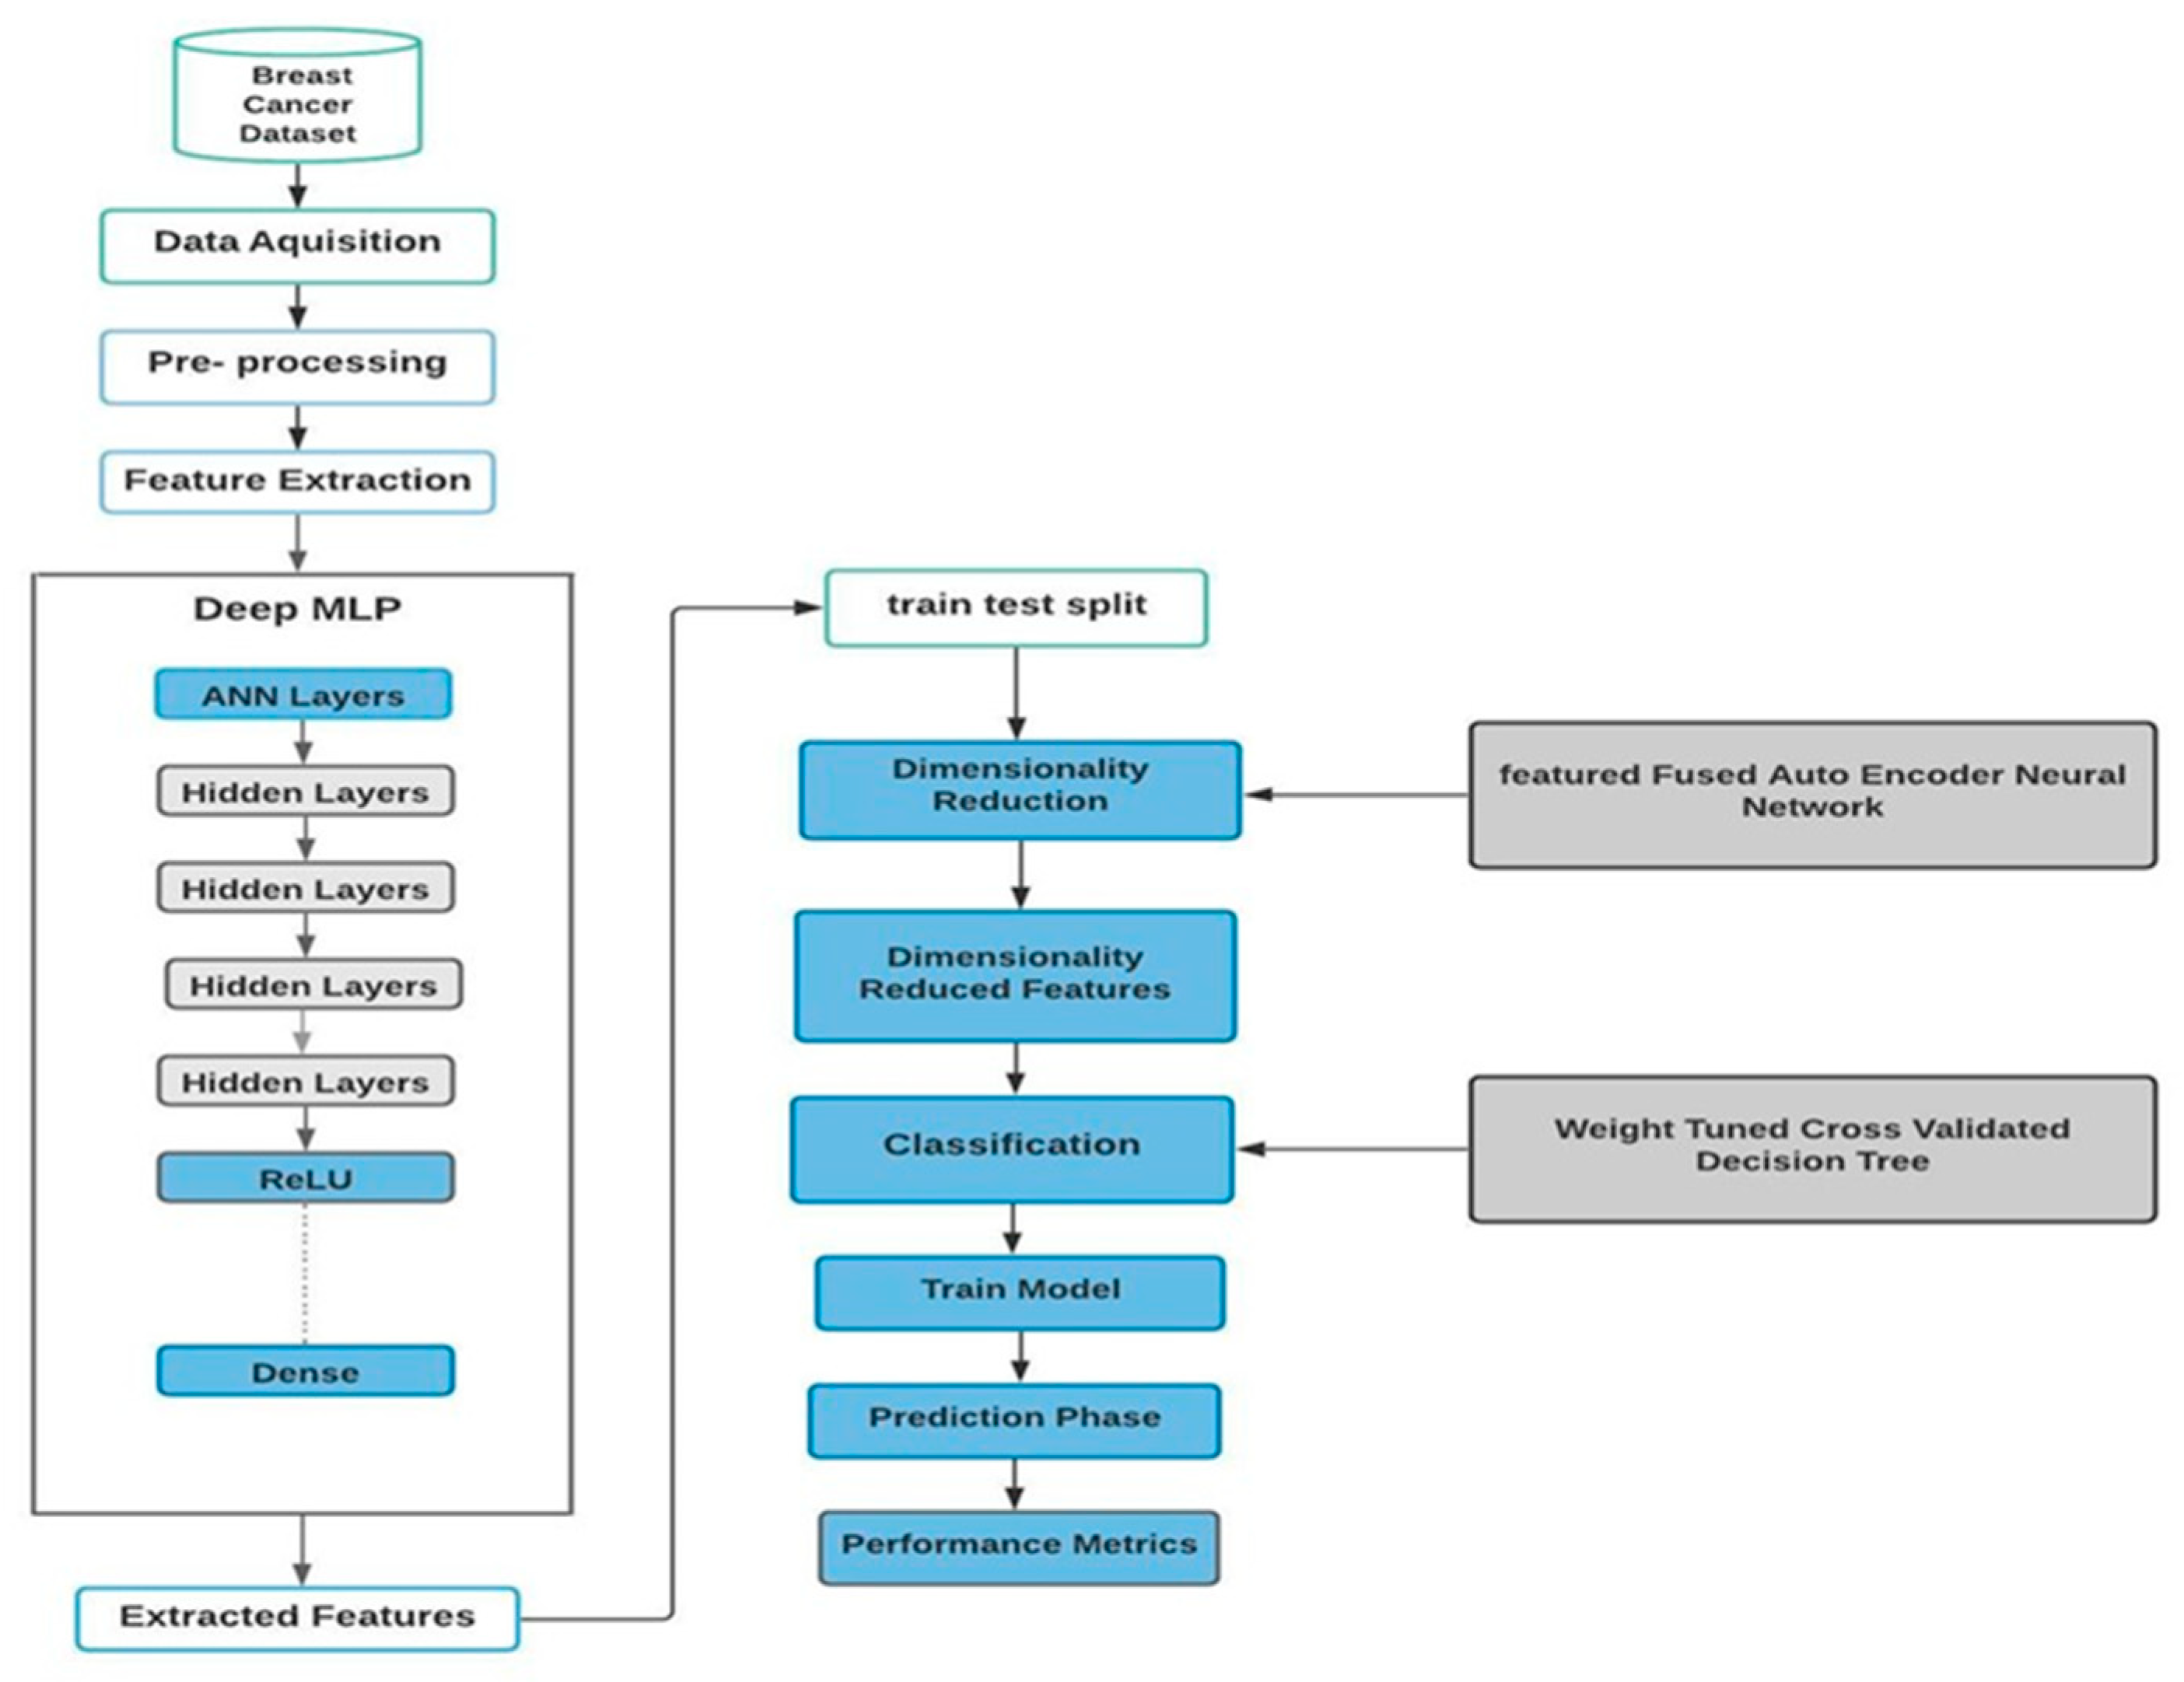
In this study, we used advanced machine learning techniques to classify breast cancer using the Wisconsin Breast Cancer Dataset. Our method involves data preprocessing, feature extraction using a Deep Multi-Layer Perceptron (Deep MLP), dimensionality reduction with a feature-fused autoencoder, and finally classification via a Weight-Tuned Decision Tree.
Figure 1 illustrates the compound algorithm, which consists of these three sub-algorithms. Each step is carefully designed to ensure efficiency and accuracy.
2.1. Data Preprocessing
Data preprocessing is crucial for ensuring data quality and relevance. The Wisconsin Breast Cancer Dataset consists of 569 cases with 32 attributes. Steps in preprocessing include cleaning the data by identifying and removing missing or irrelevant data points, normalizing and scaling features to ensure equal contributions to model training, and partitioning the data, which involves dividing the dataset into training and testing subsets with varying partitions (from 10:90 to 45:55) to assess robustness.
2.2. Feature Extraction with Deep MLP
The Deep Multi-Layer Perceptron (Deep MLP) with feature extraction was used in this work due to its ability to capture complex patterns through multiple hidden layers. The Deep MLP steps and training stages are as follows:
Architecture Design: The network has many hidden layers designed to capture complex data structures.
Starting Weights: Starting weights are used to start the training program.
Activation function: A Rectified Linear Unit (ReLU) is used for nonlinear conversion.
Batch normalization: Layers are added to normalize the data within the network, thereby accelerating training.
Optimization: An adaptive moment estimation (ADAM) optimizer was used for dynamic learning rate variation.
Hyperparameter tuning: The number of layers and neurons, the dropout rate, etc., are changed
Loss functions: Log-loss or squared loss functions are used to measure performance.
Training and Validation: Training losses are monitored over epochs, and measures are implemented to prevent overfitting, such as dropout and early dropout.
Mathematically, the deep MLP for feature extraction can be described as follows [
11]:
Pass each input through a deep MLP:
where
denotes the activation function (e.g., ReLU);
are weights and biases in layer j;
denotes the extracted feature vector.
2.3. Dimensionality Reduction with Feature-Fused Autoencoder
To reduce dimensionality and preserve essential features, a feature-fused autoencoder was employed. This advanced autoencoder differs from traditional ones in that it optimizes the products for better performance:
Compression: The input vector is reduced to a minimum.
Reconstruction: An attempt is made to reconstruct the input from the compressed representation, reducing reconstruction errors.
Feature Fusion: Low-level features are combined to discard redundant data and hide important information.
Mathematically, the feature-fused autoencoder can be described as follows [
16]:
Let the extracted features be
The autoencoder encodes each feature vector into a lower-dimensional fused latent vector:
Fusion Layer (e.g., attention or weighted average of multi-layer features):
(e.g., self-attention, max pooling, etc.)
Decoder (optional, for unsupervised training):
Loss (if unsupervised reconstruction is used):
Now, denotes the dimensionality-reduced features.
2.4. Classification of a Weight-Tuned Decision Tree
To perform the final classification, a Weight-Tuned Decision Tree was used, which provides a definition and efficiently handles imbalanced learning.
Weight adjustment: Weights are assigned to classes to deal with unbalanced datasets.
Tree construction: A decision tree based is constructed based on feature partitioning to maximize information gain.
Cross-validation: K-fold cross-validation is used to ensure the robustness of the model and reduce the effect of data-partitioning randomness.
Performance averaging: The average of the results across the folds is calculated to obtain a reliable performance estimate.
Mathematically, the Weight-Tuned Decision Tree can be described as follows [
11]:
Train a decision tree classifier on reduced features .
Let be the label (e.g., benign/malignant).
The classifier is trained as follows:
where
is a decision tree;
includes split criteria and sample weights tuned via cross-validation:
denotes classification loss (e.g., Gini impurity or entropy);
denotes regularization (e.g., tree depth, number of leaves, etc.);
denotes regularization strength.
The best is selected via cross-validation, optimizing performance metrics like accuracy, F1-score, or AUC.
The final prediction pipeline, including all the algorithms above, is as follows:
2.5. Cross-Validation and Performance Metrics
The model proposed in this work was validated using k-fold cross-validation, wherein the dataset was divided into k subsets. In this process, each subset serves as a test set once, while the others are used as training sets, ensuring unbiased validation of the model’s performance.
2.6. Performance Metrics
The following matrices represent the performance matrices adopted in this work: [
13,
17,
18,
19,
20,
21]
Accuracy: The ratio of correctly classified instances to the total instances.
where
is a true positive,
is a true negative,
is a false positive, and
is a false negative.
Precision: The ratio of true-positive predictions to the total positive predictions.
Recall (Sensitivity): The ratio of true-positive predictions to all actual positive instances.
F1-Score: The harmonic means of precision and recall.
AUC (area under the curve): The area under the receiver operating characteristic (ROC) curve, indicating discriminative ability.
2.7. Implementation and Evaluation
The proposed methodology was implemented and evaluated using the Wisconsin Breast Cancer Dataset. Various training and testing splits were used to test robustness. The results, which include metrics such as accuracy, precision, recall, F1-score, and AUC, demonstrate the high performance and reliability of our proposed model in classifying breast cancer.
2.8. Clinical Deployment Considerations
To evaluate the model’s potential for real-world use, we assessed its suitability for clinical deployment based on three key criteria: real-time performance, computational requirements, and system compatibility.
2.8.1. Real-Time Performance
The proposed system exhibits fast inference times due to its use of an optimized Deep MLP and a lightweight autoencoder structure. On a standard machine (Intel i7 CPU, 16 GB RAM, NVIDIA GTX 1660 GPU), the average prediction time per sample is about 8 milliseconds. This meets real-time diagnostic needs in most clinical workflows. Batch processing can further boost throughput when analyzing multiple patient records.
2.8.2. Computational Resource Requirements
Unlike more resource-intensive deep learning models, such as large convolutional neural networks or transformers, our architecture strikes a balance between accuracy and efficiency. The dimensionality reduction achieved through the autoencoder significantly reduces the feature space, thereby lowering the computational load for the decision tree classifier. This allows our model to be used on mid-range clinical hardware without requiring cloud services or GPU acceleration.
2.8.3. Compatibility with Medical Systems
For integration into clinical systems, the model can be embedded in electronic health record (EHR) platforms or decision support systems. It supports standardized input formats, such as CSV and JSON, making it easy to apply to data from mammography reports or lab results. Additionally, its modular design promotes adaptability to HL7/FHIR standards, enhancing interoperability across hospital information systems.
3. Results
This section presents a detailed evaluation of the results obtained from a complex algorithm for breast cancer diagnoses, which comprises a Deep MLP, a feature-fused autoencoder neural network, and a weight-tuned cross-validation decision tree. The hyperparameters used here were a batch size of 128, 256 hidden units, and a dropout of 0.45. The proposed model was applied to the Wisconsin Breast Cancer Database. Four evaluation measures were utilized to assess the prediction performance of the model: Accuracy (99.47%), Recall (99%), F1 Score (99%), and Precision (99%).
Furthermore, the AUC values (the area under the ROC curve), illustrated in
Figure 2a, were always 0.996, highlighting the model’s ability to discriminate across different thresholds. The confusion matrix shown in
Figure 2b indicates balanced classification performance, which reduces false positives and negatives. Comparison with traditional machine learning techniques, which include Support Vector Machines (SVMs), Random Forests, and k-Nearest Neighbors (KNN), underscores the performance of the proposed model. It outperformed these strategies in terms of accuracy, precision, and overall performance balance. This superiority is attributed to the advanced feature extraction skills of the Deep MLP and the green dimensionality reduction facilitated by using the feature-fused autoencoder. Additionally, the Weight-Tuned Decision Tree classification method contributed to the model’s robustness, mainly in addressing classification imbalances. This can also be attributed to the use of superior technology in gaining knowledge of strategies for enhancing the accuracy of breast cancer classification.
Key factors that contributed to the model’s success included comprehensive validation through K-fold cross-validation, careful hyperparameter optimization, and the use of superior neural network architectures. The study’s findings suggest that the proposed model is a valuable diagnostic tool for clinical experts, and as such, may also facilitate early detection and improved outcomes for individuals affected by this condition. Future endeavors could focus on enhancing this model by exploring alternative neural network architectures and incorporating additional data resources, including genetic statistics and medical imaging records.
Comparison Results
Table 1 presents the performance measures derived from other studies, which are used for comparison with the proposed model’s performance to demonstrate its effectiveness. It also presents the accuracy results obtained using various approaches that incorporate machine learning models, as applied by different authors.
1. Md. Milon Islam et al. [
22] applied five matrices to support vector machines (SVMs): KNN, RF, ANN, and LR. Both studies utilized the WDBC dataset.
Table 1 and
Figure 3 show a comparison between the methods discussed above. The proposed method exhibits enhanced performance parameters.
2. Nirdosh Kumar [
23] used the LR, SVM, KNN, and Naïve Bayes algorithms. The performance parameters regarding the WDBC dataset are presented in
Table 2 and illustrated in
Figure 4. The proposed model achieved higher accuracy and recall compared to LR, KNN, and Naïve Bayes, while it exhibited the same value as SVM.
3. The performance parameters from the study by G. Battineni et al. [
24] and from this work are shown in
Table 3 and
Figure 5. The proposed model exhibited greater accuracy, recall, and AUC compared to SVM, LR, and KNN.
4. P. Karatza et al. [
25] used RF, an NN, and an ENN for the diagnosis of breast cancer based on the WDBC dataset. This study was compared with the proposed work. All the performance parameters of the proposed model are greater.
Table 4 and
Figure 6 show this comparison.
5.
Table 5 and
Figure 7 show the performance parameters from the study presented by A. I. Aishwarja et al. [
26] and those from this work. The proposed model has the highest values for all the parameters.
6. We compared our work with the work of S. Sakib et al. [
27], who applied a SVM, DT, LR, RF, KNN, and an NN to the WDBC dataset. The accuracy, recall, and F1 score are all higher for the proposed model, as shown in
Table 6 and
Figure 8.
7. The performance parameters from the study presented by V. Nemade and V. Fegade [
28] and those from this work are shown in
Table 7 and
Figure 9 and
Figure 10. The model exhibited greater accuracy, precision, recall, and F1 score values than the KNN, SVM, DT, Naïve Bayes, and LR algorithms.
4. Discussion
Individually, each algorithm from previous studies provides performance parameters with some limitations that reduce the ability to diagnose breast cancer.
The diagnosis of breast cancer requires high performance, including in terms of accuracy, precision, and F1 score, among other metrics.
This study presents an integrated method that combines three advanced algorithms, which work together to achieve very high performance and provide precise diagnoses.
Figure 2a illustrates the receiver operating characteristic (ROC) curve with an area under the curve (AUC) of about 0.996, which is exceptionally high, indicating that the model performs extremely well in distinguishing between malignant (dangerous) and benign (typical) cases. The ROC curve hugs the top-left corner, which is ideal, as this shows a very low false-positive rate and a very high true-positive rate. This means the classifier is highly capable of detecting breast cancer with minimal errors. This demonstrates that the classification model used in the breast cancer diagnosis task is highly effective, with near-perfect discriminatory power.
Figure 2b is a Confusion Matrix that consists of 350 true positives (TPs) (correctly identified cancer cases), 7 false negatives (FNs) (cancer cases misclassified as benign instances), 208 true negatives (TNs) (correctly identified benign cases), and 4 false positives (FPs) (normal cases misclassified as cancer).
As shown by this Confusion Matrix, very few misclassifications occurred for false positives and false negatives. The model is powerful in identifying cancer cases (showing high sensitivity) and minimizing false alarms (showing high specificity).
The model’s high sensitivity (recall) of approximately 99.6% ensures that most cancer patients are correctly identified, thereby minimizing missed diagnoses.
A low false-positive rate helps avoid unnecessary stress and treatment for patients without cancer.
The results show that the breast cancer classification model is highly accurate and reliable, making it well-suited for real-world diagnostic use. The combination of an AUC = 0.996 and strong confusion matrix metrics indicates that the model achieves an excellent balance between sensitivity and specificity, a critical aspect in medical diagnosis.
Furthermore, comparisons between the proposed integrated algorithm and other algorithms from previous studies, such as SVM, KNN, RF, ANN, LR, NN, ENN, DT, and Naïve Bayes, showed the superiority of the proposed integrated algorithm for all performance parameters investigated.
5. Limitations and Future Work
Although the proposed framework performs well on the Wisconsin Breast Cancer Dataset, several limitations still exist. The model was trained and tested on just one benchmark dataset. This restricts its applicability to other medical conditions or more diverse data distributions. Future work will focus on testing the model across multiple datasets to evaluate its reliability and potential for use in wider clinical settings.
Another significant limitation is the current lack of explainability features. In clinical settings, understanding how and why a model makes a specific prediction is crucial for gaining trust of healthcare professionals. While our aim in this work was to improve classification accuracy, future updates will incorporate explainable AI techniques, such as SHAP (Shapley Additive Explanations) and LIME (Local Interpretable Model-Agnostic Explanations). These will provide clear insights into model decisions and feature contributions.
6. Conclusions
In this study, we designed a comprehensive method for breast cancer diagnosis by combining a Deep Multilayer Perceptron (MLP), a feature-based autoencoder neural network, and a weighted cross-validation decision tree. The model achieved high performance in key parameters, including 99.47% accuracy, 99% precision, 99% recall, and a 99% F1 score, as well as an AUC-ROC value of 0.996, demonstrating its strong discriminative power. The confusion matrix indicates balanced classification performance with minimal false positives and negatives. Efficient parameter tuning and convergence behavior were also confirmed. In summary, the proposed algorithm is a robust and accurate diagnostic tool for breast cancer.
However, our findings are currently limited to a single dataset. To validate generalizability, future work will involve testing on larger and more diverse datasets, including those concerning other cancer types. The proposed model not only delivers high classification performance but is also lightweight and adaptable for integration into existing clinical infrastructures. It constitutes a promising tool for real-time decision support in breast cancer diagnosis.


