Article

HIEN: A Hybrid Interaction Enhanced Network for Horse Iris Super-Resolution

College of Computer and Information Engineering, Xinjiang Agricultural University, Urumqi 830052, China
*
Author to whom correspondence should be addressed.
Appl. Sci. 2025, 15(13), 7191; https://doi.org/10.3390/app15137191
Submission received: 30 May 2025 / Revised: 21 June 2025 / Accepted: 25 June 2025 / Published: 26 June 2025

Abstract

Horse iris recognition is a non-invasive identification method with great potential for precise management in intelligent horse farms. However, horses’ natural vigilance often leads to stress and resistance when exposed to close-range infrared cameras. This behavior makes it challenging to capture clear iris images, thereby reducing recognition performance. This paper addresses the challenge of generating high-resolution iris images from existing low-resolution counterparts. To this end, we propose a novel hybrid-architecture image super-resolution (SR) network. Central to our approach is the design of Paired Asymmetric Transformer Block (PATB), which incorporates Contextual Query Generator (CQG) to efficiently capture contextual information and model global feature interactions. Furthermore, we introduce an Efficient Residual Dense Block (ERDB), specifically engineered to effectively extract finer-grained local features inherent in the image data. By integrating PATB and ERDB, our network achieves superior fusion of global contextual awareness and local detail information, thereby significantly enhancing the reconstruction quality of horse iris images. Experimental evaluations on our self-constructed dataset of horse irises demonstrate the effectiveness of the proposed method. In terms of standard image quality metrics, it achieves the PSNR of 30.5988 dB and SSIM of 0.8552. Moreover, in terms of identity-recognition performance, the method achieves Precision, Recall, and F1-Score of 81.48%, 74.38%, and 77.77%, respectively. This study provides a useful contribution to digital horse farm management and supports the ongoing development of smart animal husbandry.

1. Introduction

Horses valued as both economic livestock and companion animals play indispensable roles in agriculture, sport, recreation, and scientific research [1,2,3]. As the horse industry grows and demands more refined management, an accurate, efficient, and reliable system for individual horse identification becomes essential [4]. Precise identification underpins effective breeding management, pedigree tracking, health monitoring, and ownership verification, and it is also crucial for ensuring fair competition, deterring theft and fraud, and implementing disease-control and quarantine measures [5,6,7]. Hence, developing advanced horse-identification technologies offers significant advantages [8].
Traditional identification methods such as branding and descriptions based on coat color, hair whorls, or white markings have various limitations [9]. Among biometric traits, the iris is widely recognized as one of the most promising markers due to its unique, highly complex texture and lifelong stability [10]. Horse irises exhibit rich, individually distinctive patterns that mature shortly after birth and remain stable over time [11]. Compared with conventional approaches, iris-based recognition is contact-free, highly resistant to forgery, and welfare-friendly, offering a more precise and secure means of identifying horses.
Despite its promise, capturing high-quality horse iris images poses formidable challenges. As large, sensitive animals, horses rarely remain still during imaging; head and eye movements are pervasive [12]. For safety and convenience, cameras must typically be positioned at some distance, which further degrades resolution and sharpness. The resulting low-resolution, blurred images obscure critical texture details, undermining feature-extraction and -matching accuracy and thus limiting overall system performance.
Recent advances in deep learning and natural image super-resolution reconstruction have opened the door to iris image enhancement. In 2014, Dong et al. [13] introduced SRCNN (Super-Resolution Convolutional Neural Network), the first CNN-based framework for image super-resolution. The SRCNN pipeline begins by upsampling the low-resolution input image via bicubic interpolation to the target high-resolution size, followed by refinement through a three-layer convolutional network for image reconstruction and detail enhancement. In the human iris super-resolution domain, many studies have demonstrated that enhancing resolution can boost recognition accuracy. Eduardo et al. [14] employed transfer learning to show that CNN-learned features improve iris-recognition rates, confirming their efficacy. Kashihara et al. [15] proposed an SRGAN-based approach, using a generator–discriminator adversarial process to produce high-quality iris images and a deep CNN for identity evaluation. Xia et al. [16] developed a deep learning framework integrating wavelet decomposition and attention mechanisms: high-frequency components are predicted via wavelet subbands, and residual attention and convolutional transformer modules extract texture details. More recently, Lu et al. [17] combined Swin Transformer residual blocks with a GAN: progressive sub-pixel upsampling reconstructs high-definition irises, while a VGG-style relative discriminator preserves high-frequency texture.
High-resolution (HR) restoration of iris images, which are characterized by intricate and densely textured patterns, remains challenging because most methods cannot simultaneously maintain fine local details and global consistency. CNN-based approaches, which rely on fixed receptive fields, are inherently limited in modeling dependencies over long spatial ranges [18]. In contrast, Transformer-based models leverage self attention to model global feature interactions, yet they inherently lack an inductive bias towards local structures, making them less effective in reconstructing fine-grained details [19]. To address these shortcomings, we design a tailored image SR network to improve both image quality and identification accuracy in horse iris recognition.
The main contributions of our work are as follows:
We construct a horse iris dataset and propose a Hybrid Interaction Enhanced Network (HIEN) for SR. The proposed network enables effective interaction between local features and global relationships at each stage, thereby capturing both fine textures and global context simultaneously.
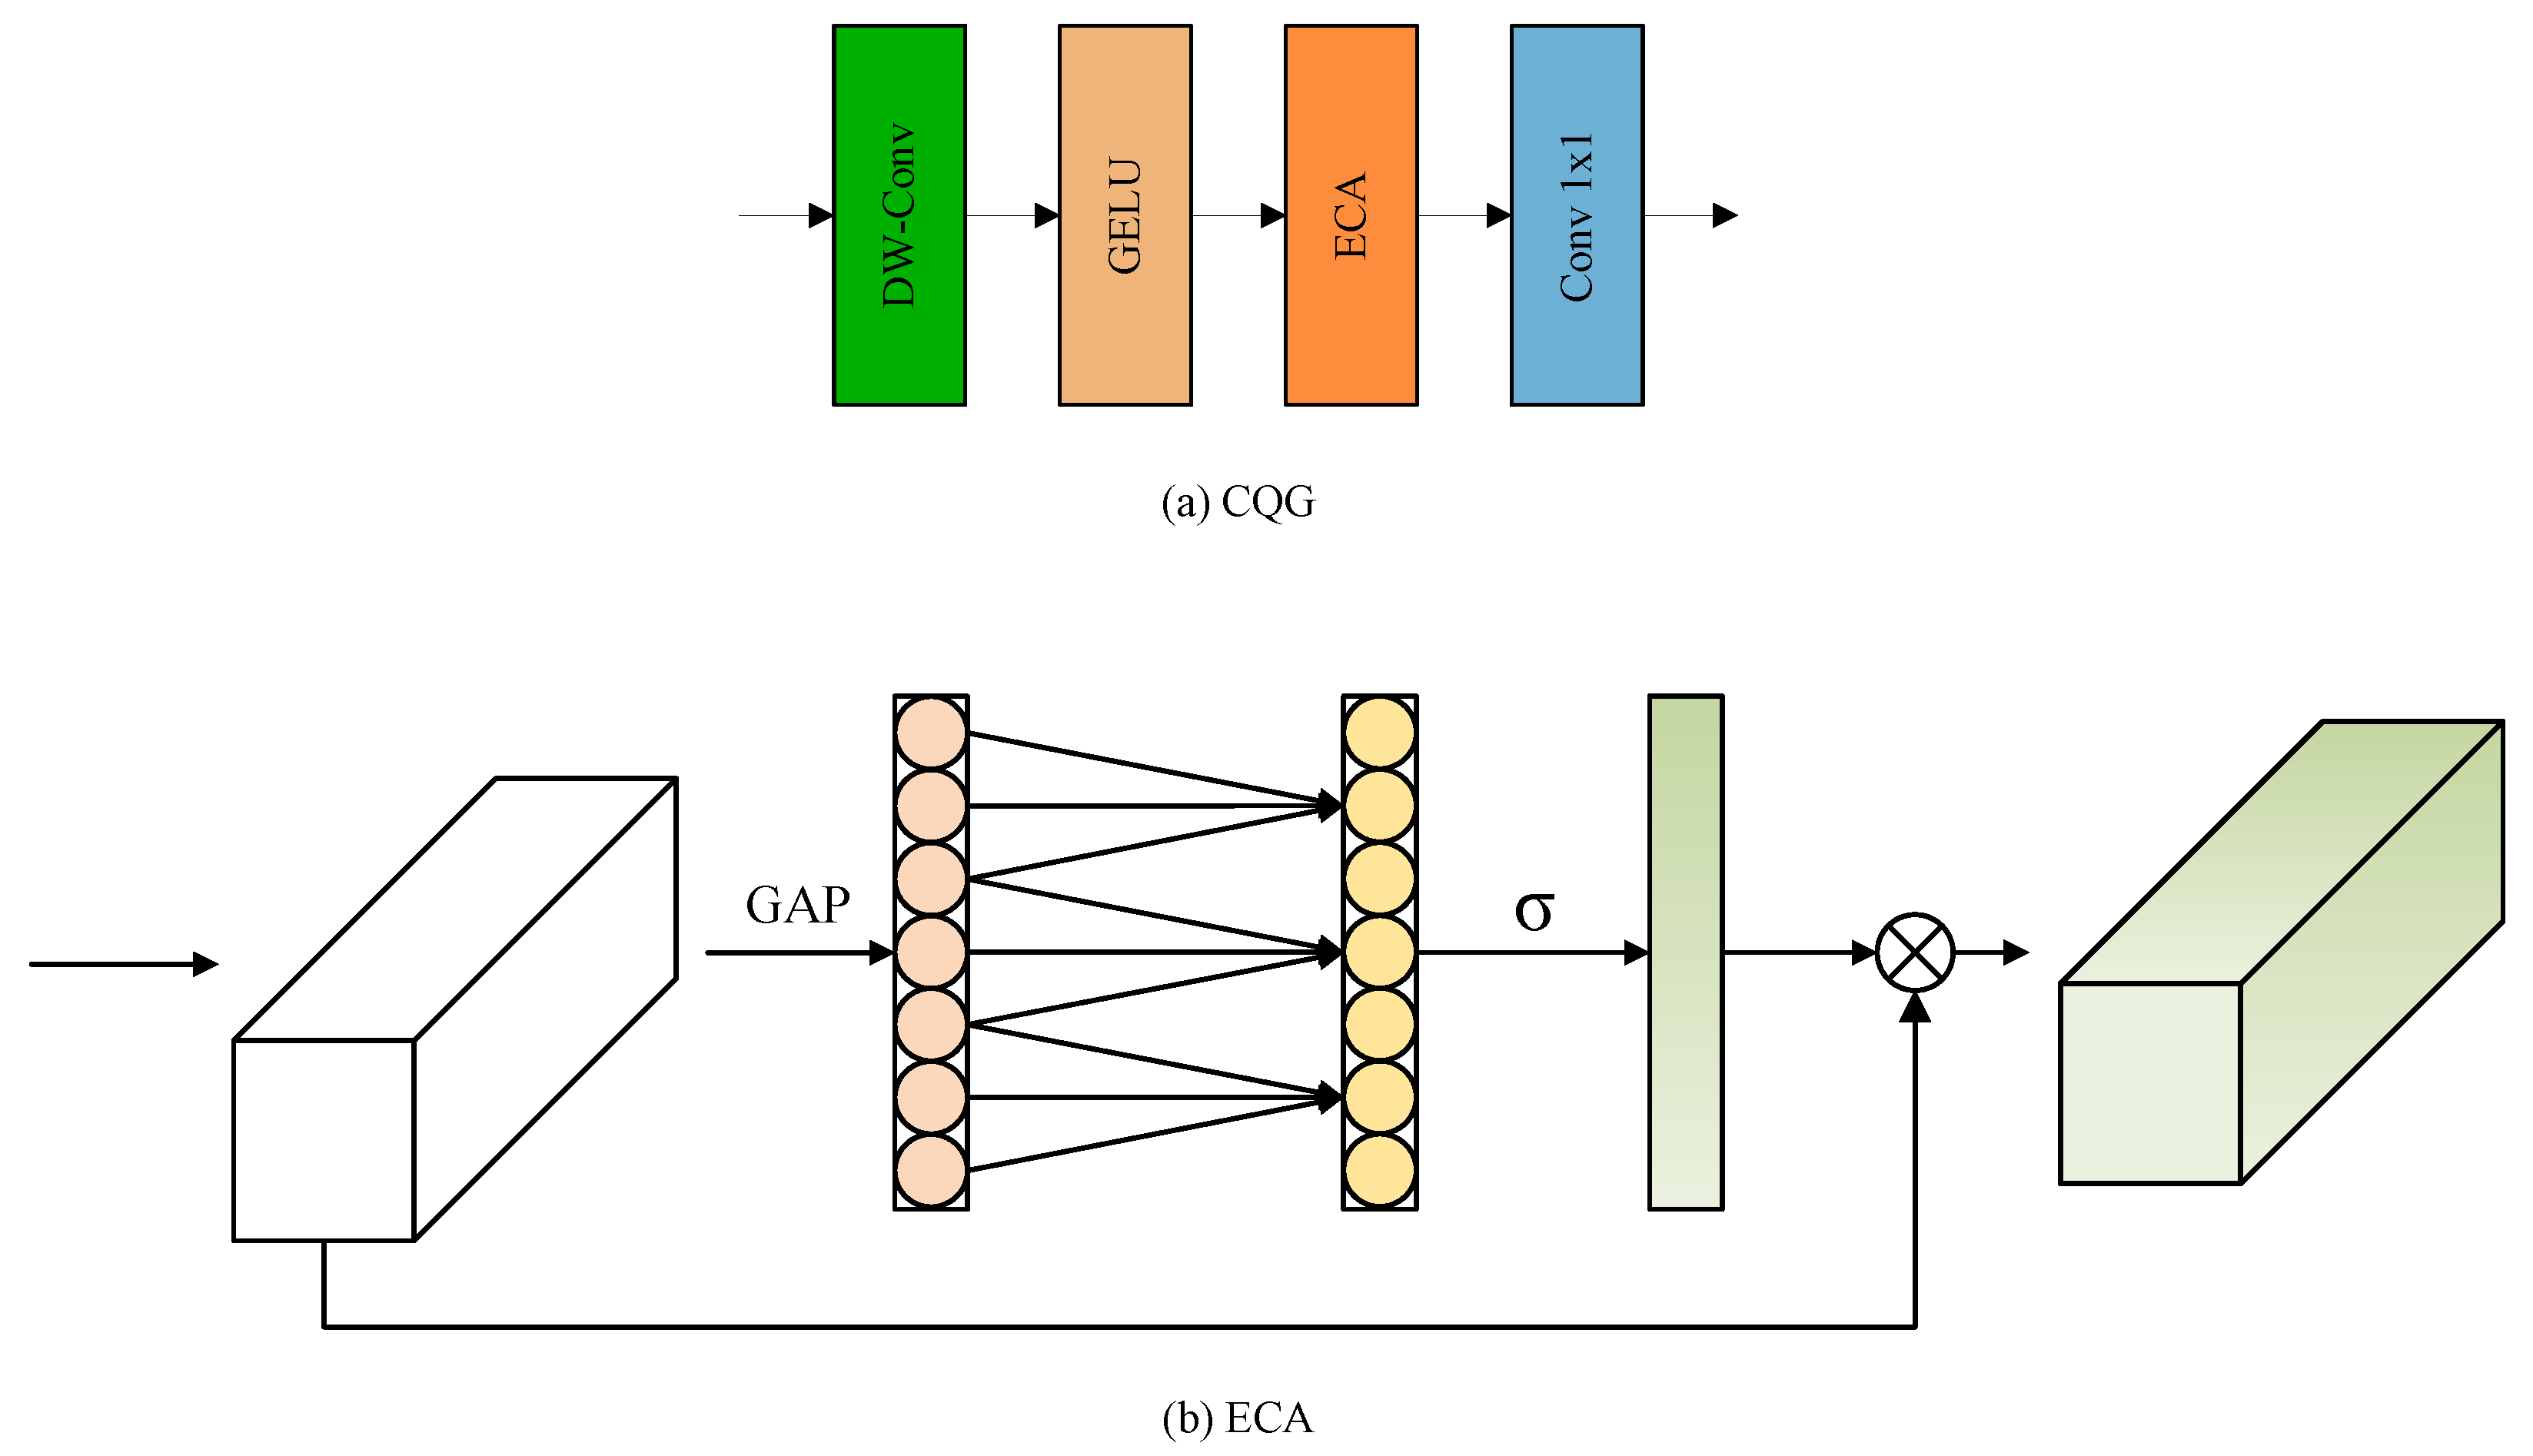
We designed PATB with an integrated CQG, which directly generates query vectors from the initial input features. This enables effective interaction between original context and refined features, enhancing the model’s ability to capture long-range dependencies and refine features contextually.
We designed an ERDB that uses depthwise separable convolutions to reduce both parameter count and FLOPs by about 80% compared to standard Residual Dense Blocks, while maintaining local feature representation and significantly improving network efficiency.
The proposed network effectively restores fine details of horse irises and improves recognition accuracy, which holds great value for advancing the informatization and intelligent management of horse farms.

2. Materials and Methods

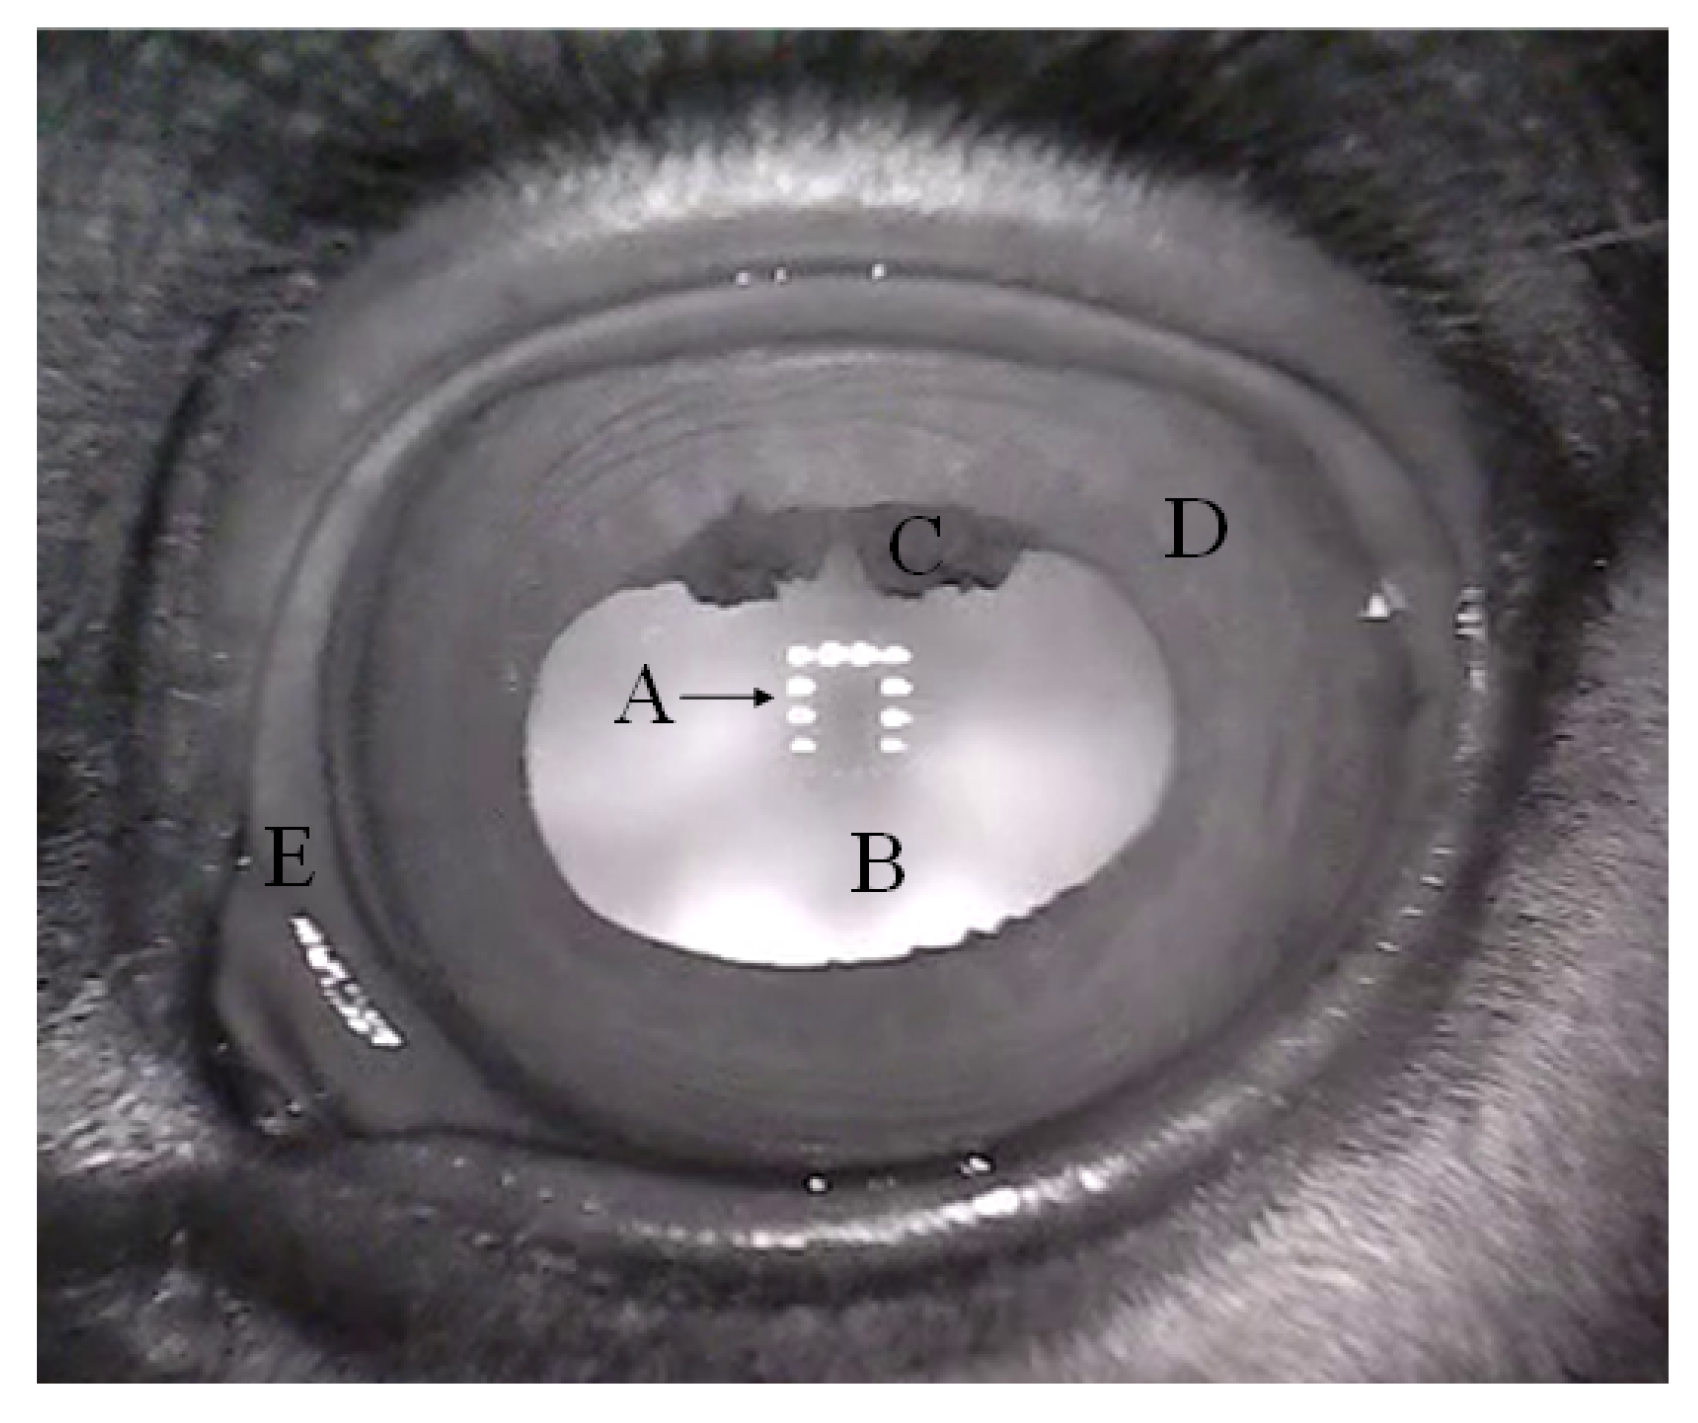
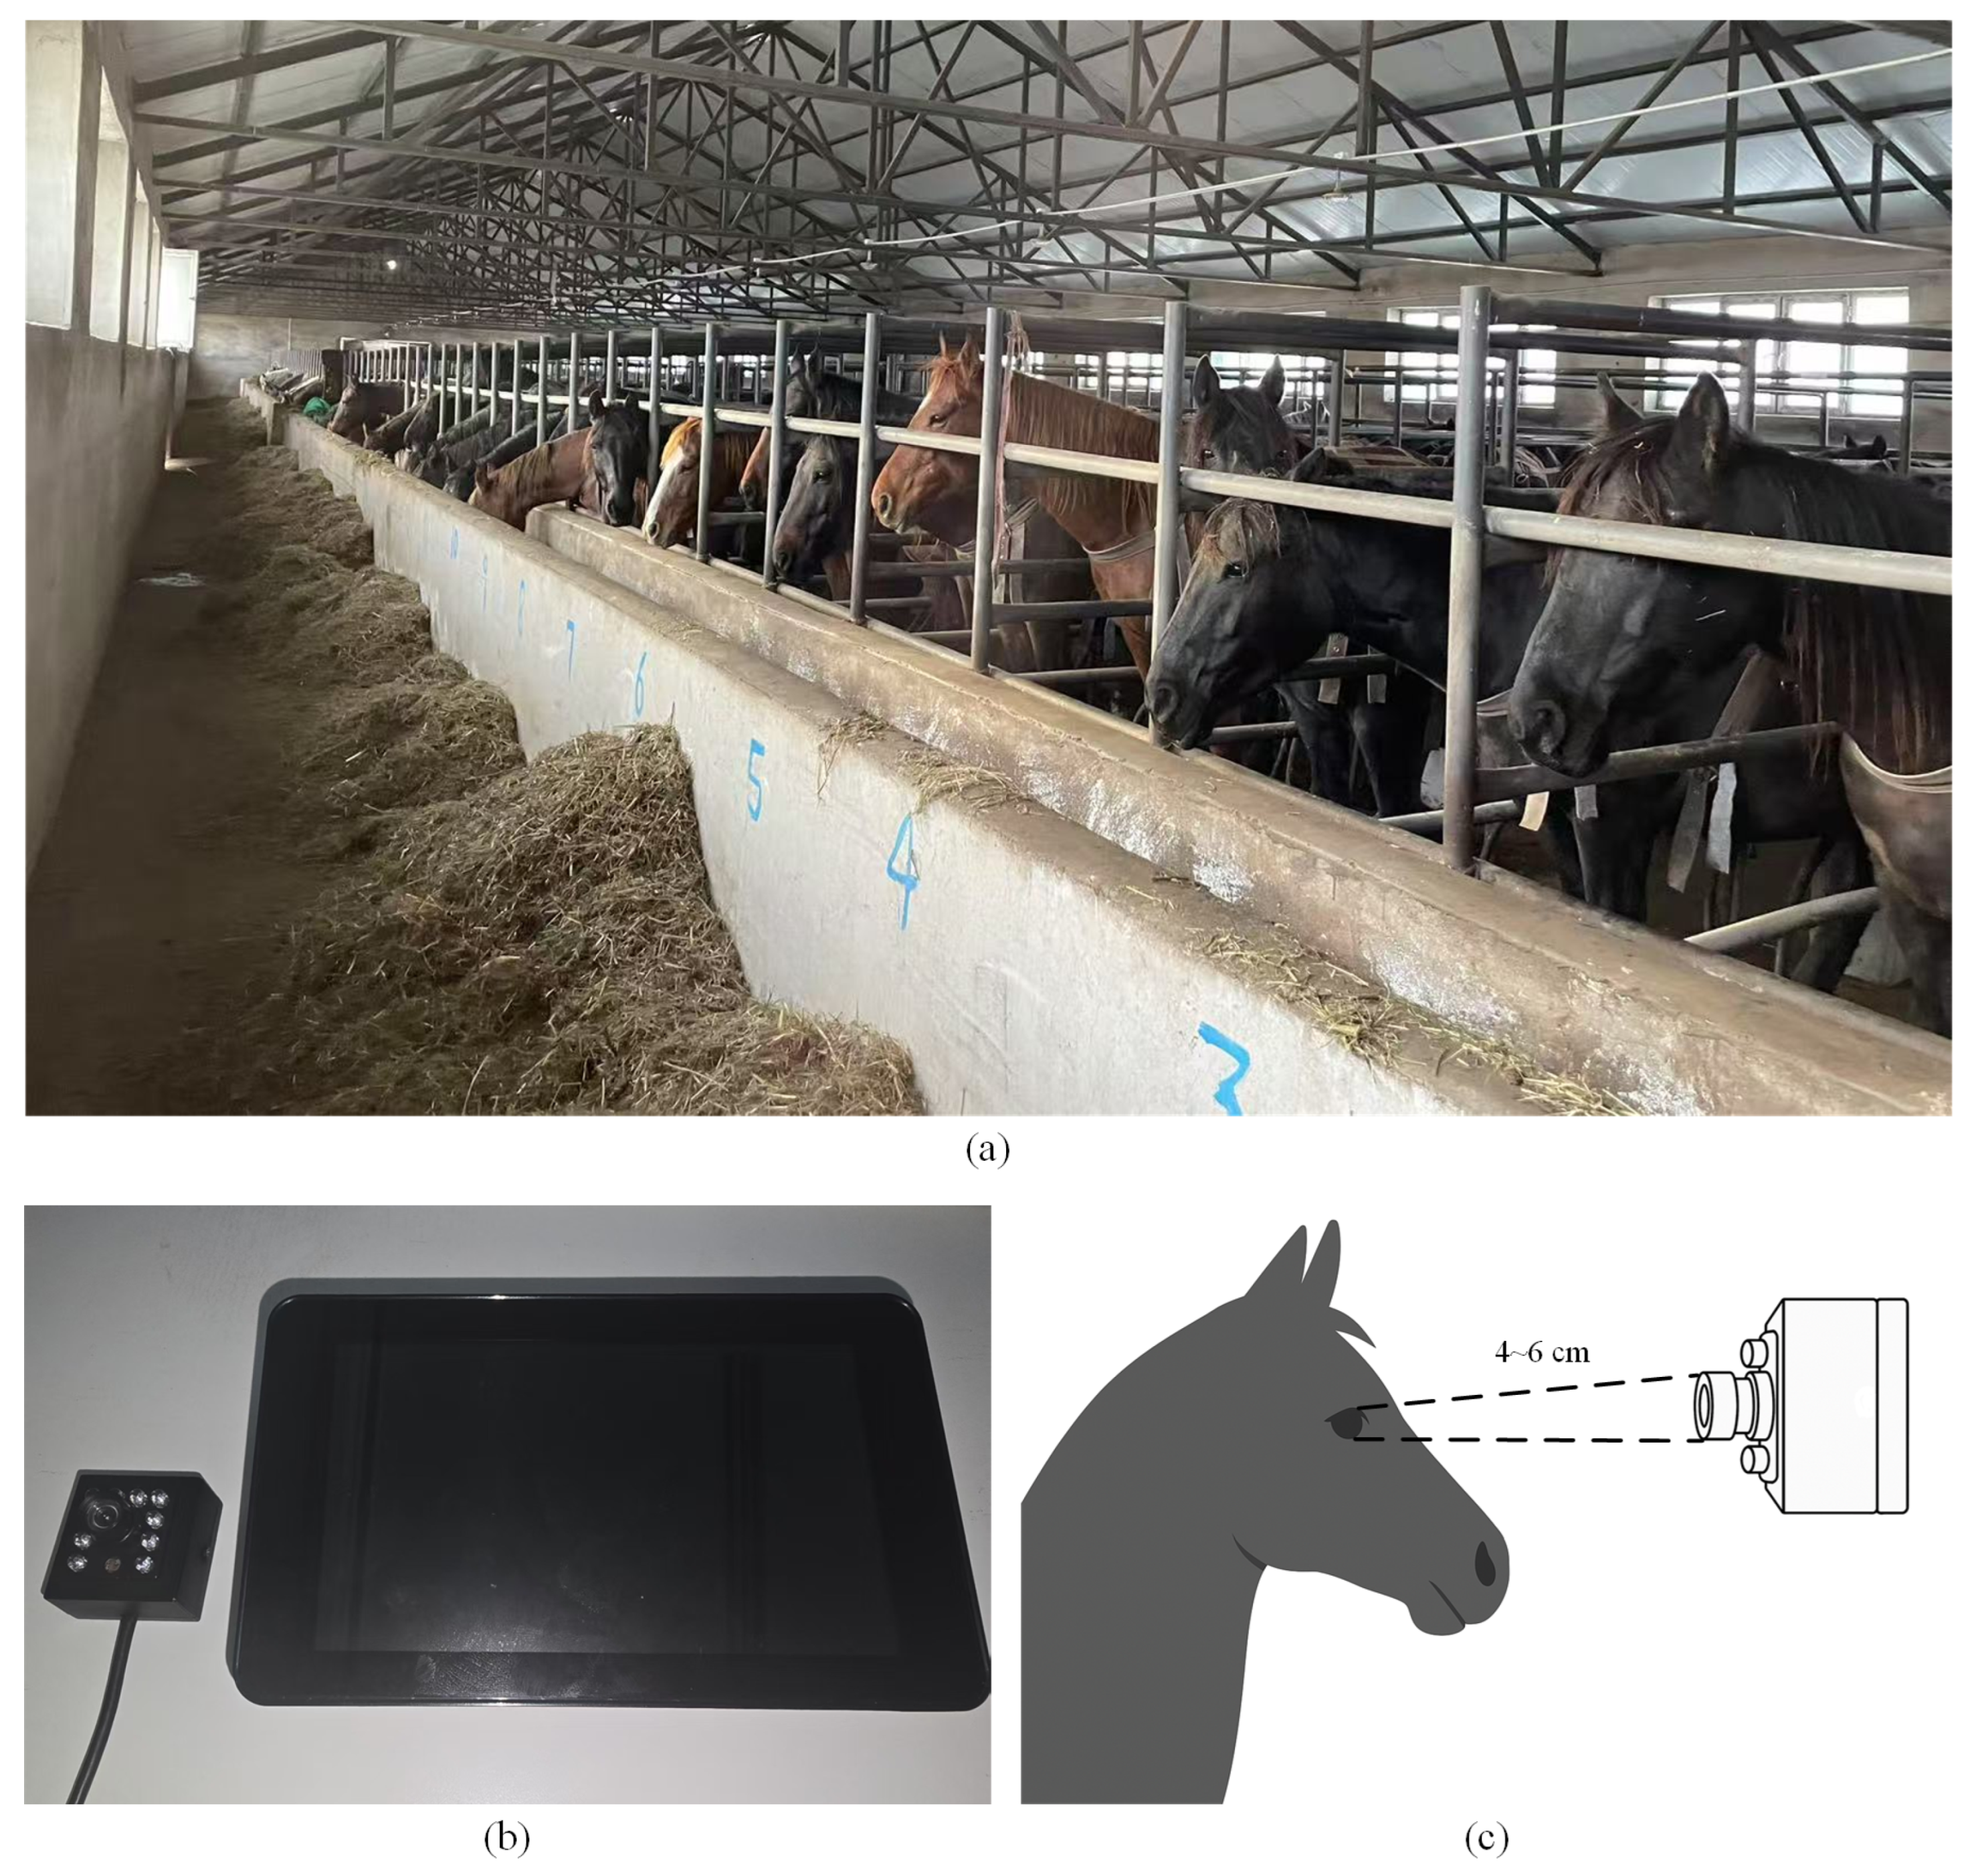
2.1. Horse Iris Dataset

The horse iris dataset used in this study was obtained from Zhaosu Horse Farm in Zhaosu County, Ili Kazakh Autonomous Prefecture, Xinjiang Uygur Autonomous Region, China, in July 2024 (Latitude: 43°07′05″ N, Longitude: 81°00′02″ E). The study cohort comprised 54 horses, from which iris data were collected from both eyes, resulting in a total of 108 distinct eye samples. Data acquisition was conducted using a Raspberry Pi 4B to capture images with a Near-Infrared (NIR) camera operating in video mode from a distance of approximately 4–6 cm from the horse’s eye. For each eye, video sequences of approximately 30 s were recorded at a resolution of 640 × 480 pixels and a frame rate of 30 frames per second (fps). From each resulting video, 10 image frames were subsequently extracted for analysis. To mitigate redundancy and ensure sample diversity, frames were selected with sufficient temporal separation. A schematic diagram of the horse’s eye structure is presented in Figure 1, and the data-collection environment and process are illustrated in Figure 2 [11].
Following the extraction stage, the images were processed. Utilizing the LabelMe annotation tool, the iris region in each image was manually segmented with precision, resulting in 256 × 256 pixel iris patches. These patches served as the ground-truth HR samples for this research. Simultaneously, corresponding iris masks were created to aid the subsequent iris-recognition procedures.
To augment the training dataset and improve the model’s robustness to rotational variance, data augmentation involving rotations of ±15 degrees was applied to each HR iris patch. Given the uniqueness of the iris, we treated the 108 eyes from 54 horses as 108 independent subjects for our dataset partitioning. The samples for each subject were organized into folders labeled ‘000’ to ‘107’. A deterministic allocation strategy was then applied based on the last digit of the folder identifier: samples in folders with identifiers ending in 0, 5, or 9 were assigned to the combined validation and test sets, while the remaining folders were used for training. A detailed breakdown of the dataset distribution is presented in Table 1, and representative examples of the acquired iris samples are depicted in Figure 3.
Low-resolution (LR) iris images were synthesized from their HR counterparts via bicubic downsampling, followed by the application of Gaussian blurring. This process was designed to simulate the image degradation typically encountered under practical acquisition conditions. An ×4 scaling factor was selected for the primary SR task in this study, based on a considered trade-off between the practicalities of image acquisition and the achievable quality of image reconstruction. From a practical standpoint, an x4 scaling factor permits image acquisition from a safer distance, minimizing disturbance and stress to the animals, thereby enhancing the overall efficiency and feasibility of the data-collection process. Conversely, regarding reconstruction quality, the ×4 factor represents a favorable balance compared to higher factors (e.g., ×8). While effectively increasing resolution, it offers a greater likelihood of reliably preserving critical iris details and fine textures, mitigating the risk of information loss or the introduction of artifacts often associated with more extreme magnification levels achievable with current technologies. Consequently, this research focuses specifically on the x4 SR task, conducting detailed experimental analysis and performance evaluation for this scaling factor.

2.2. Method

We propose an efficient image super-resolution network that unites the strengths of convolutional operations and Transformer-based modeling to reconstruct HR horse iris images from LR inputs, thereby improving iris-recognition accuracy. In this section, we first outline the overall architecture of the network and then describe in detail our two core components: the PATB and the ERDB.

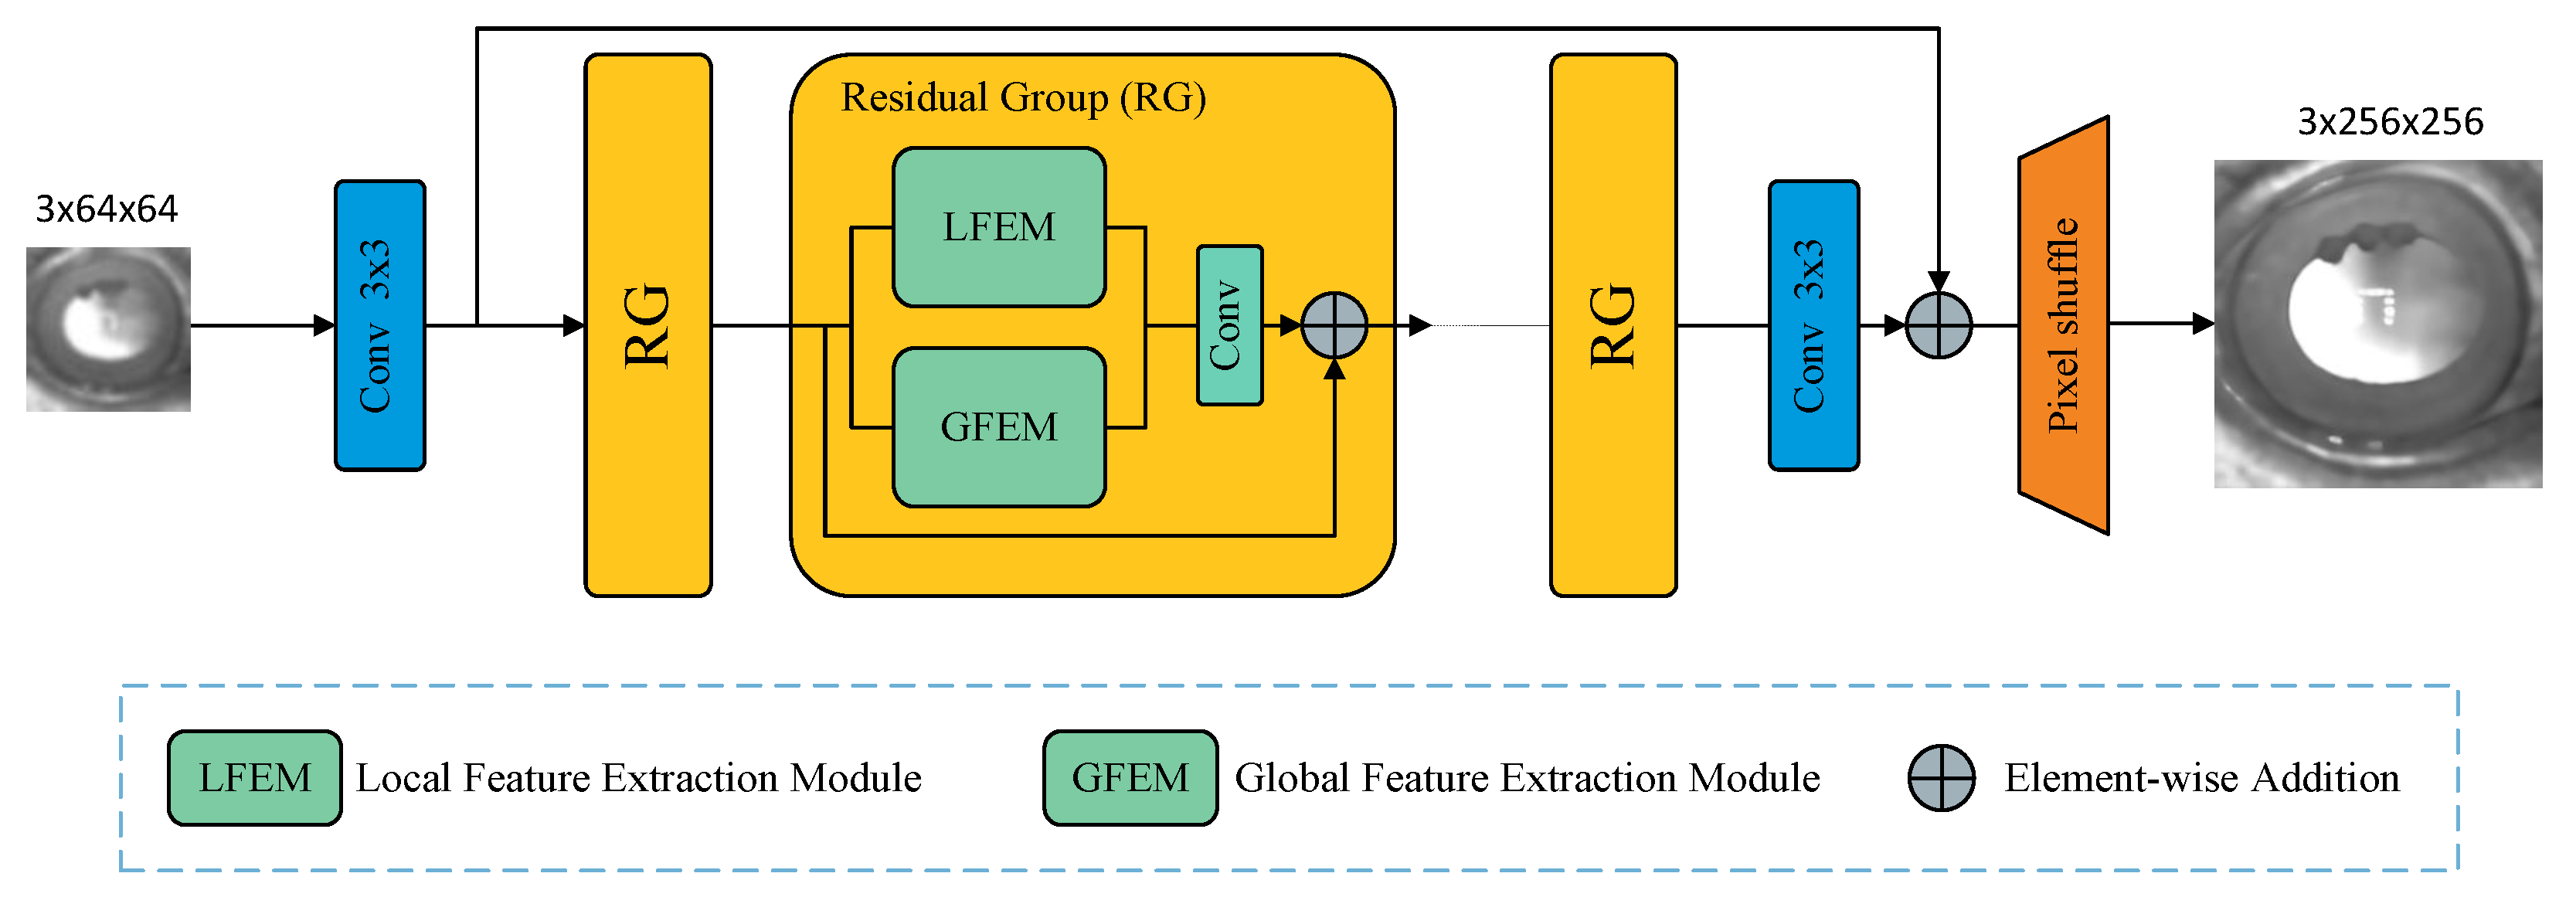
2.2.1. Network Architecture

Our Hybrid Interaction Enhanced Network (HIEN) is structured as a three-stage pipeline designed to progressively transform a LR input into a HR output. To provide a clear overview of the architecture flow, Table 2 details the step-by-step process, showing how the data tensor’s shape evolves as it passes through each main module. The network begins with (1) a shallow feature extractor to capture initial low-level information, followed by (2) a deep feature extractor that concurrently processes local and global features, and concludes with (3) an image-reconstruction module to generate the final HR image. A detailed diagram illustrating the connections between these components is presented in Figure 4.
Shallow Feature-Extraction Module
The shallow feature-extraction module is designed to capture low-level representations from a low-resolution input. Its purpose is to map the input image from the color space into a feature space, enabling deeper layers to focus on higher-level information. Given a low-resolution image I L R R h × w × 3 , we apply a single 3 × 3 convolutional layer to obtain shallow features F s R h × w × c , where h , w and c denote the height, width, and number of feature channels, respectively. This operation is expressed as:
F s = H s f ( I L R )
where H s f ( · ) denotes the shallow feature-extraction process using convolution, and  F s represents the shallow features. The convolutional layer functions to map the input from a low-dimensional space to a higher-dimensional feature space, thereby extracting low-frequency information from the image at the initial stage. By using a 3 × 3 convolution operation, local texture features can be effectively captured to facilitate subsequent deep feature learning.
Deep Feature-Extraction Module
Then, the shallow feature map F s is simultaneously fed into both the local and global deep feature-extraction modules; after fusion, we obtain the deep feature map F d R h × w × c . This process is formalized as:
F l = H l f ( F s )
F g = H g f ( F s )
F d = H e m ( F l + F g )
where H l f ( · ) denotes a residual dense module that captures complex local information, and  H g f ( · ) represents a Transformer block that effectively models contextual dependencies. These two branches are fused via a convolutional operation to form H e m ( · ) . F d denotes the final deep feature map. More details about H l f and H g f are presented in the next section.
Image-Reconstruction Module
The image-reconstruction module aims to enlarge the feature map from a smaller size to the ground truth size. It consists of a pixelshuffle convolution layer and a 3 × 3 convolution layer. The pixelshuffle convolution effectively redistributes pixel values in the spatial domain, reducing checkerboard artifacts, while the 3 × 3 convolution layer maps the feature space to the color space [20]. Finally, the image-reconstruction module generates high-quality images I S R R ( h × s ) × ( w × s ) × 3 , where s represents the upsampling factor. This process can be represented as:
I S R = Conv 3 × 3 ( H up ( F d ) )
where H up ( · ) denotes the subpixel convolution operation, and  I S R represents the super-resolved image.

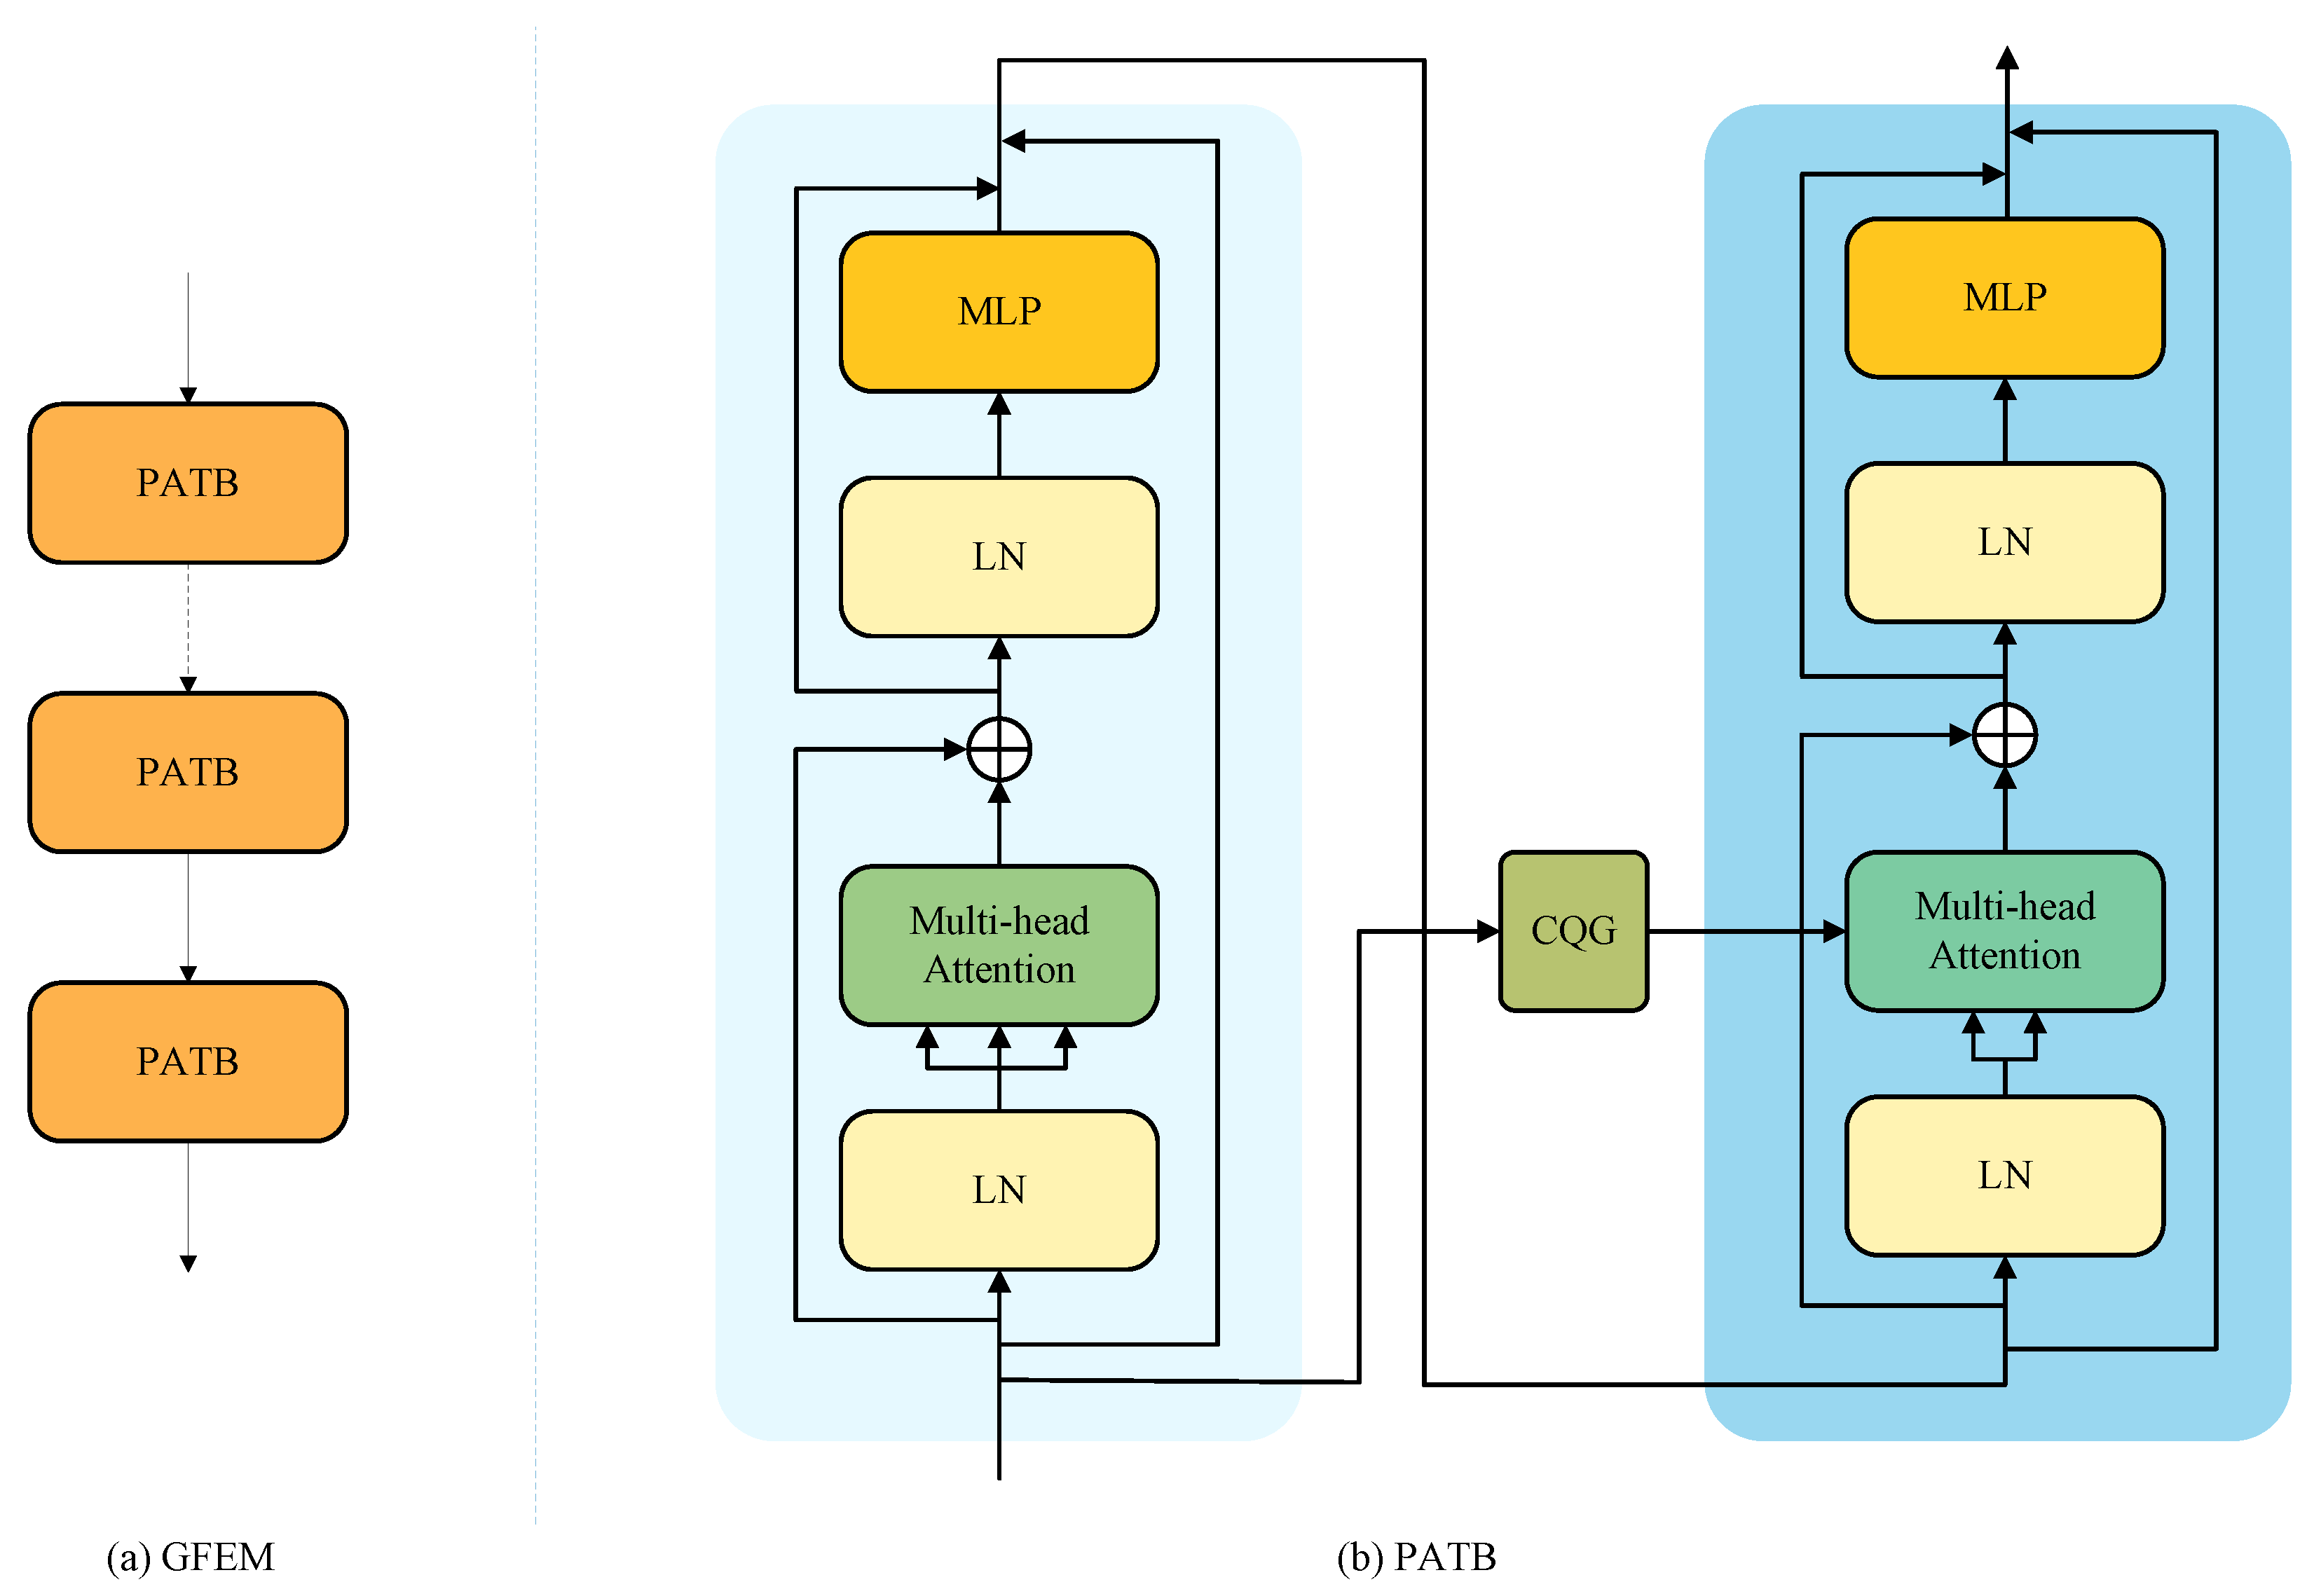
2.2.2. Paired Asymmetric Transformer Block

In recent years, Transformer architectures have achieved remarkable success in computer vision tasks, most notably image super-resolution, thanks to their exceptional ability to model long-range dependencies. Standard Vision Transformers (ViTs) and their variants employ the self attention (SA) mechanism to capture global contextual information, which is essential for reconstructing the intricate textures and structures in HR images [21,22]. This global modeling capability directly addresses the limitations of conventional convolutional neural networks (CNNs), whose restricted receptive fields often struggle with complex details [23].
However, SR simultaneously demands deep feature transformation and precise detail refinement—two objectives that a single Transformer block may find hard to balance. To meet this challenge, we propose a two-stage process-and-refine strategy embodied in our core module, the PATB. As illustrated in Figure 5, each PATB contains two cascaded Transformer submodules. The first submodule focuses on initial, broad-scope context modeling and feature transformation; the second submodule builds on these results to perform targeted, fine-grained refinement. This paired design enables progressive, in-depth feature processing within a single block.
In the conventional SA paradigm, the query, key, and value vectors are all derived from the same input feature map, effectively modeling intra-feature dependencies [24]. However, this homogeneous perspective may suppress or distort important low-level cues that are crucial for fine-grained detail reconstruction. Therefore, in the second submodule we replace self attention with a cross attention mechanism. Specifically, we generate the query vector q c not from the intermediate feature X m i d but via a dedicated context-query generator applied to the block’s original input X i n .
The core motivation of this design is to preserve and leverage original feature cues that might otherwise be degraded by the first submodule’s complex nonlinear transformations. By supplying the second Transformer with a query q c drawn directly from X i n —while still using X m i d to form the keys and values—we guide the attention mechanism to emphasize aspects most relevant to the original image structure and texture, thereby enhancing the recovery of fine details. The cross attention operation is defined as follows:
Attention ( q c , k , v ) = Softmax q c k T d k + b v
where d k denotes the dimensionality of the key vector K, and b is a learnable bias term.

2.2.3. Contextual Query Generator

To enhance our network’s ability to use global information for image super-resolution, we introduce the Contextual Query Generator (CQG), illustrated in Figure 6. The primary role of this module is to transform local feature maps from the input into query vectors that contain global context. These queries then guide the reconstruction process, helping the network focus on long-range dependencies and the overall image structure.
A key challenge in designing the CQG was to balance strong context-capturing ability with computational efficiency. To solve this, we built the CQG using a novel component we call the Modified Fused-MBConv Block. This block is our enhancement of the standard fused inverted-residual MBConv module, a design known for its efficiency [25]. We further improve this block by deeply integrating an efficient channel attention (ECA) mechanism [26].
This combined architecture results in a module that can efficiently generate query vectors rich in global contextual information. The core process of the CQG can be expressed as follows:
x ^ = DW-Conv 3 × 3 ( x ) , x ^ = GELU ( x ^ ) , x ^ = ECA ( x ^ ) , x = Conv 1 × 1 ( x ^ ) + x ,
where DW-Conv 3 × 3 ( · ) , GELU ( · ) , ECA ( · ) , and  Conv 1 × 1 ( · ) represent the 3 × 3 depth-wise convolution, Gaussian Error Linear Unit (GELU) [27], Efficient Channel Attention [26], and point-wise convolution, respectively.

2.2.4. Efficient Residual Dense Block

For powerful local feature extraction, deep and complex modules are effective but often come at a high computational cost. To address this trade-off, we introduce the Efficient Residual Dense Block (ERDB), our primary module for local feature learning, shown in Figure 7.
The design of the ERDB integrates two key principles. First, it uses the proven structure of residual dense connectivity to encourage feature reuse and robust gradient flow. Second, and most critically for efficiency, it replaces standard convolutions with depthwise separable convolutions. This choice is fundamental to creating a lightweight yet powerful feature extractor.
Depthwise separable convolutions work by factorizing a standard convolution into two distinct, simpler steps: a depthwise step and a pointwise step. This factorization drastically reduces both the parameter count and the computational load (FLOPs)  [28]. The key advantage of this efficiency is that it allows us to build a more powerful network overall; we can construct deeper or more complex local modules without incurring prohibitive computational costs. Our approach aligns with a broader, successful trend in the field toward designing lightweight yet effective architectures. For instance, Hayat et al. recently demonstrated this philosophy by combining lightweight Ghost modules with attention mechanisms for efficient medical image segmentation [29], validating the power of this design direction.
The ERDB is built from a basic convolutional unit, denoted ERDB_Conv. Given an input feature map x R h × w × c , this operation can be formulated as:
x ^ = PWConv 1 × 1 ( DWConv 3 × 3 ( x ) ) , F ERDB_Conv = Concat ( GELU ( x ^ ) , x ) ,
where DWConv 3 × 3 ( · ) , PWConv 1 × 1 ( · ) , GELU ( · ) , and Concat ( a , b ) represent the depth-wise convolution, point-wise convolution, GELU activation, and the channel-wise concatenation of tensors a and b, respectively. The ERDB is composed of multiple convolutional units with local feature fusion and residual connections. Given an input feature map x R h × w × c , the process can be expressed as:
x 0 = x , x c = F ERDB_Conv ( c ) ( x c 1 ) , c = 1 , 2 , , C , F ERDB = H LFF ( x c ) + x ,
where C denotes the number of stacked ERDB_Conv blocks, and H LFF ( · ) represents the local feature fusion operation implemented using a 1 × 1 convolution.
The key of the ERDB_Conv unit lies in its residual dense connection pattern. Rather than passing each ERDB_Conv output directly to the next layer, we concatenate its output with its own input feature map. This dense connectivity ensures that every layer can aggregate information from all preceding units, achieving deep feature fusion and reuse.

3. Experiment and Results

3.1. Experimental Setup and Evaluation Metrics

3.1.1. Implementation Details

The architecture of our proposed model was configured as follows: the number of Residual Groups was set to 4. Within the global feature-extraction module, we employed 3 PATB blocks, a configuration determined through our ablation study to strike an optimal balance between capturing long-range dependencies and maintaining computational efficiency. The local feature-extraction module utilized 2 ERDB blocks, each incorporating 8 dense residual connections. Furthermore, the channel dimensionality, number of attention heads, and the MLP expansion ratio were set to 180, 6, and 2, respectively [30,31].
The proposed model was trained for a total of 20,000 iterations. We employed the Adam optimizer with hyperparameters set to ( β 1 = 0.9 , β 2 = 0.99 ) [32]. The initial learning rate was established at 2 × 10⁻⁴. A step decay learning rate schedule was adopted, halving the learning rate after the first 10,000 iterations. Each training mini-batch comprised 2 LR images as input. The model was implemented using PyTorch 1.13.1 and executed on a Windows system equipped with an NVIDIA RTX 2080Ti GPU.

3.1.2. Evaluation Protocols

To assess the efficacy of iris image super-resolution, we computed the peak signal-to-noise ratio (PSNR) and the structural similarity (SSIM), which quantify the fidelity and structural resemblance between the reconstructed and the original HR images [33,34].
PSNR = 10 · log 10 L 2 MSE
SSIM ( x , y ) = ( 2 μ x μ y + C 1 ) ( 2 σ x y + C 2 ) ( μ x 2 + μ y 2 + C 1 ) ( σ x 2 + σ y 2 + C 2 )
where L is the maximum possible pixel value of the image, and MSE represents the mean squared error between the reconstructed image and the reference image. μ x and μ y are the local means, σ x 2 and σ y 2 are the variances, σ x y is the covariance of images x and y, and C 1 and C 2 are small constants for stability.
To evaluate the practical effectiveness of the super-resolved images in recognition applications, we adopted MobileNetV3 [35] as the recognition model, chosen for its efficiency and good performance on classification tasks, and used the standard classification metrics of Precision, Recall and F1-Score to quantify the performance of the iris-recognition system.
Precision = T P T P + F P
Recall = T P T P + F N
F1-Score = 2 · Precision · Recall Precision + Recall
where T P , F P , and F N denote true positives, false positives, and false negatives, respectively.

3.2. Comparison with State-of-the-Arts Models

To validate the effectiveness of the proposed method, we conducted comparative experiments against bicubic interpolation and several state-of-the-art (SOTA) models, including EDSR [36], RDN [28], SRFBN [37], HAN [38], SwinIR [23], ELAN [39], CRAFT [40], SMFAN [41], RGT [31], and CDFormer [42]. All baseline models were evaluated using their default configurations.

3.2.1. Quantitative Results

As shown in Table 3, the comparative results demonstrate that our proposed model achieves competitive performance across multiple metrics. In terms of PSNR, our model achieves a score of 30.5988. Although HAN reports a slightly higher PSNR of 30.7414, our model remains highly competitive and outperforms most other methods, including the recent RGT (30.5905). For the SSIM metric, our method achieves a score of 0.8552, which is slightly lower than CDFormer (0.8631) and HAN (0.8572). However, our method exhibits superior performance in the downstream iris-recognition task.
Where our model particularly excels is in the recognition-based metrics. Our method achieves Precision (0.8148), Recall (0.7438), and F1-Score (0.7777), significantly outperforming all other methods in these categories. These results validate our model’s effectiveness in recovering fine details within iris images while preserving overall structure. The recognition-related metrics show a marked improvement over even the closest competitors, SwinIR (F1-Score: 0.7533) and CDFormer (F1-Score: 0.7506).
While some methods like HAN and CDFormer demonstrate excellent performance in specific traditional image quality metrics (HAN with the highest PSNR and CDFormer with the highest SSIM), our proposed HIEN model offers a better overall balance between perceptual quality and recognition performance. This is particularly important for practical applications where downstream recognition tasks depend on the quality of recovered fine iris details. Our model’s performance in Precision, Recall, and F1-Score demonstrates its enhanced capability in preserving the discriminative features crucial for iris-recognition systems.

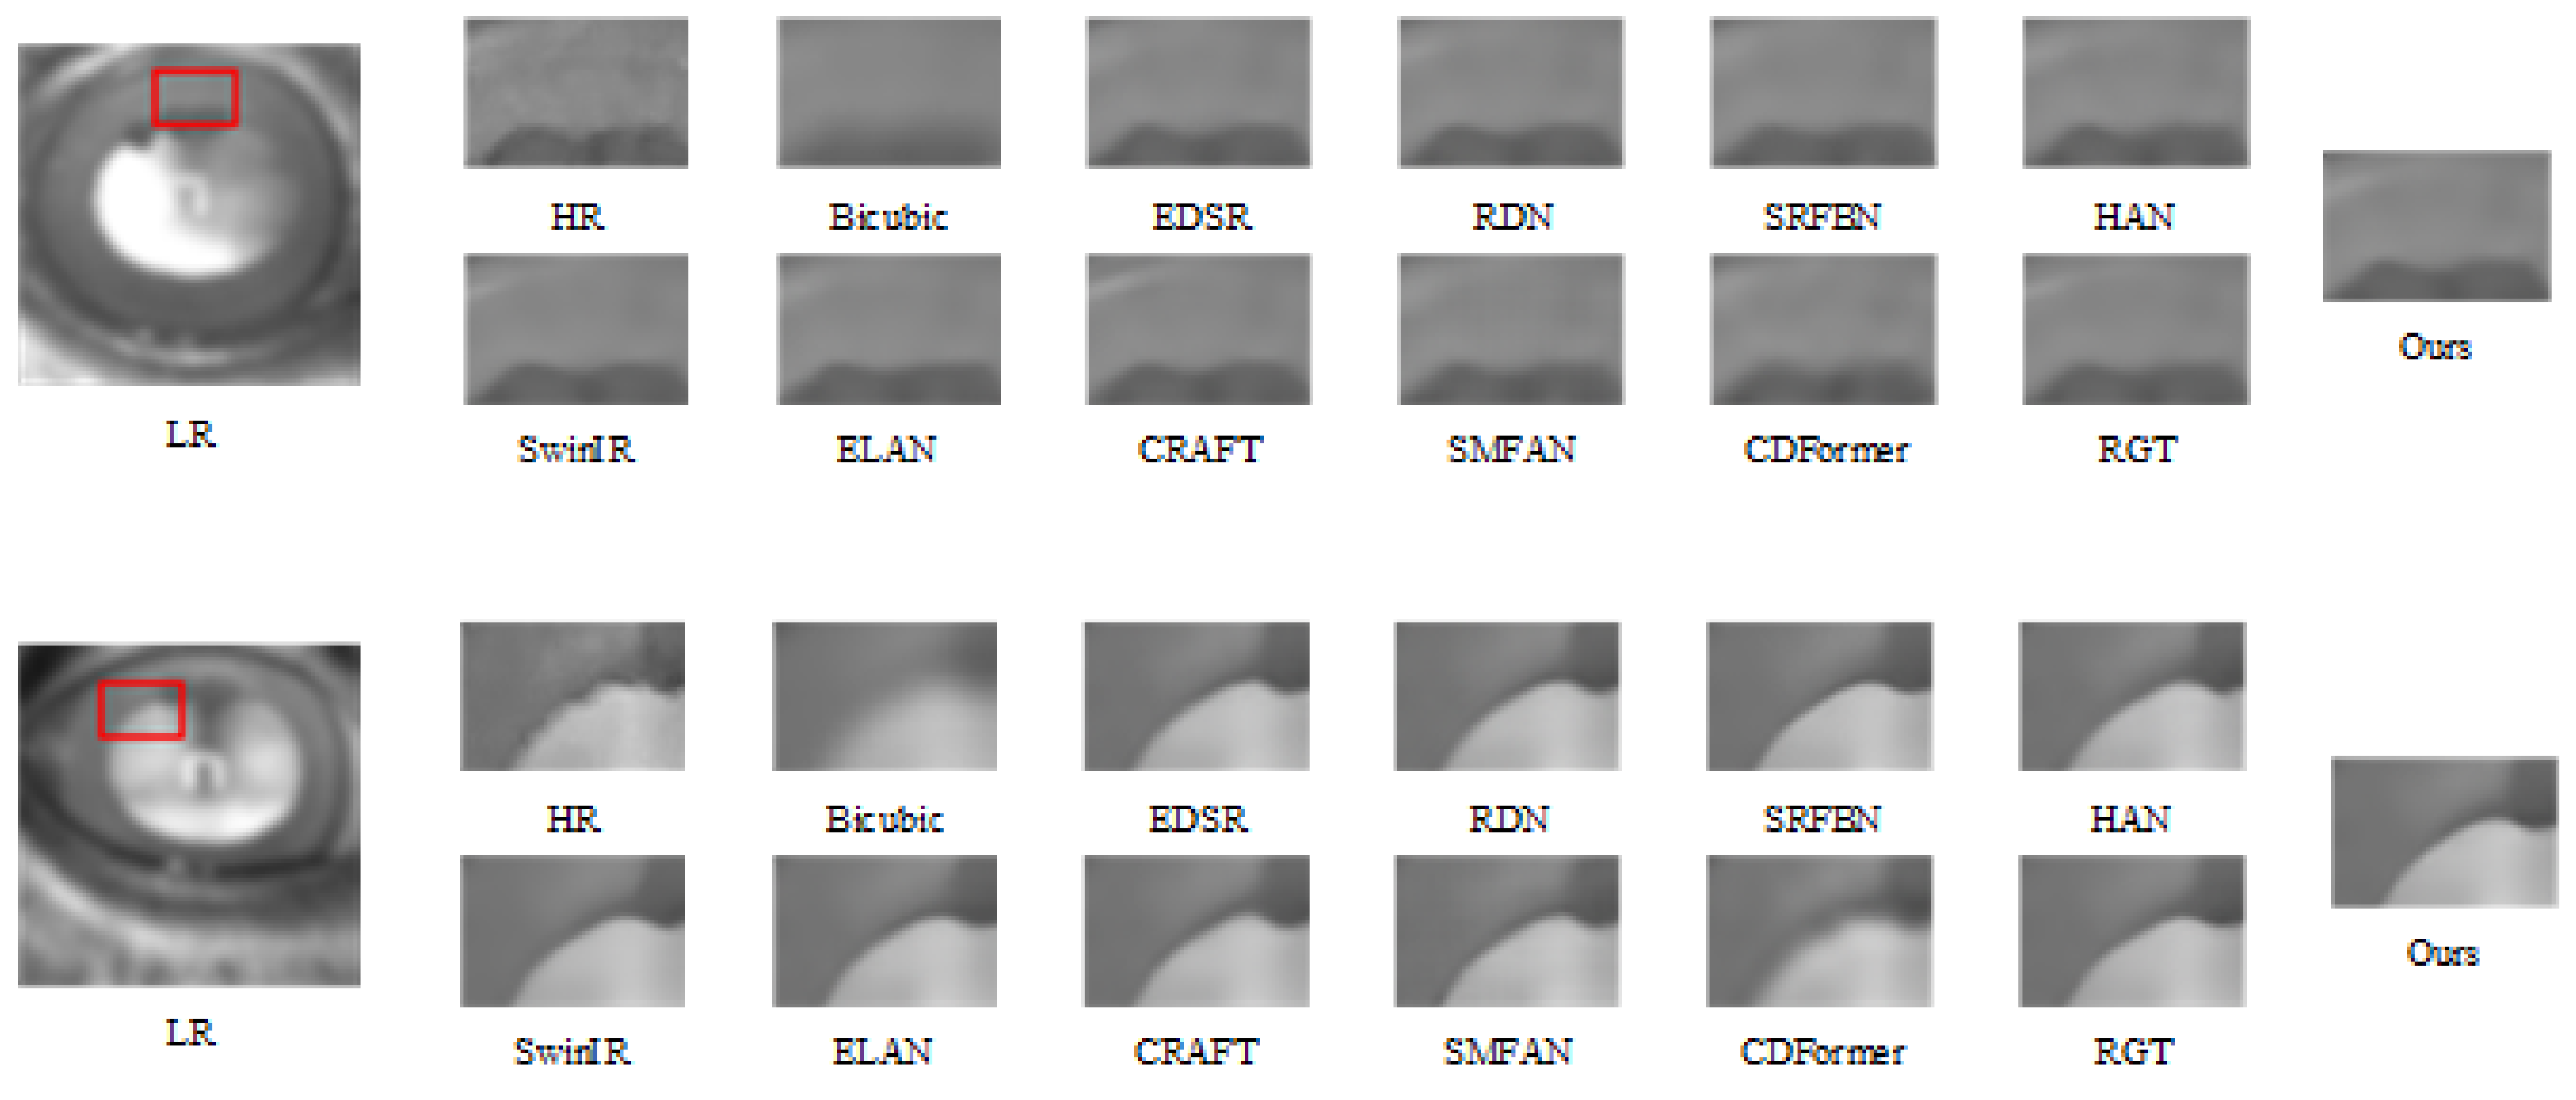
3.2.2. Visual Results

Figure 8 presents a visual comparison of the results generated by different SR methods. As illustrated, the iris images produced by these state-of-the-art techniques generally achieve a high standard of overall visual quality. They successfully recover the primary iris structures and substantial textural details, rendering the visual distinctions between these leading methods subtle and challenging to discern through simple visual inspection.
Despite this limited visual differentiability, the quantitative results previously presented in Table 3 reveal distinct differences in reconstruction fidelity and the preservation of critical biometric information. While the subtle variations in PSNR and SSIM may not translate into definitive visual superiority, the significantly improved performance of our method on recognition metrics (Precision, Recall, F1-Score) reported in Table 3 is particularly noteworthy. Integrating the quantitative benchmarks with these recognition performance advantages suggests that our approach not only effectively enhances image resolution but also exhibits a greater capacity for preserving and recovering the discriminative iris features crucial for identity verification.

3.3. Ablation Experiments

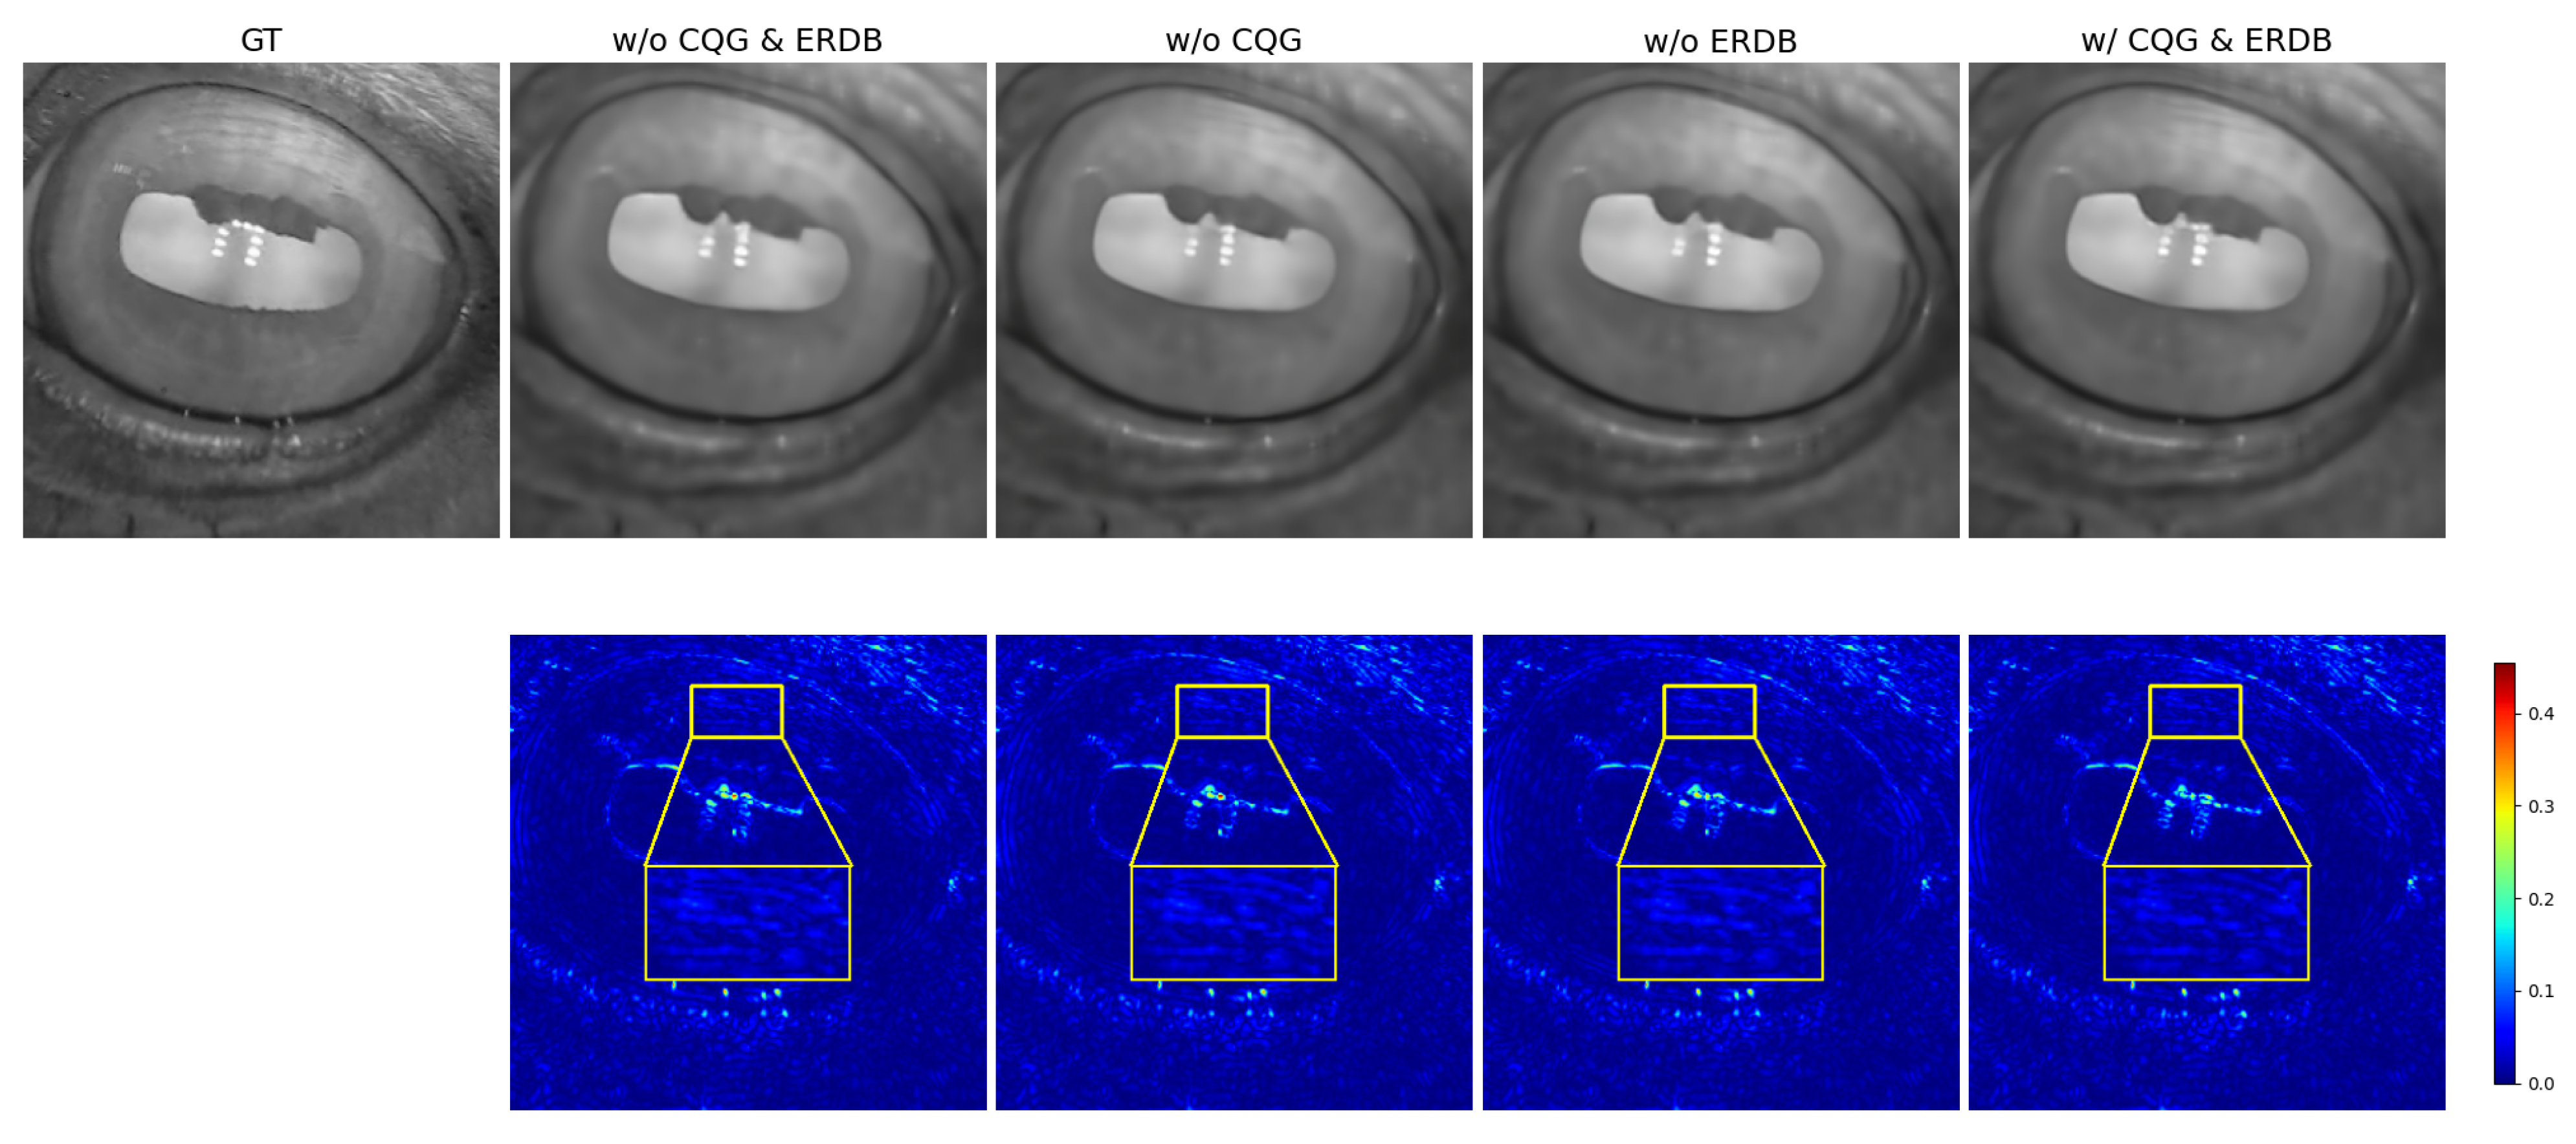
3.3.1. Module Ablation

As presented in Table 4, the results of our ablation study validate the effectiveness of the proposed CQG and ERDB modules. Although the SSIM (0.8552) was marginally lower than that of the ‘w/o CQG’ (SSIM: 0.8553) and ‘w/o ERDB’ (SSIM: 0.8553) variants, the complete model incorporating both CQG and ERDB (w/ CQG & ERDB) achieved the best performance in terms of Precision (0.8148), Recall (0.7438), and F1-Score (0.7777). The synergy between CQG and ERDB is evident, as they not only improve iris SR quality but also, crucially, preserve discriminative recognition features, which is reflected in the recognition metrics.
Notably, we observed that the baseline model (w/o CQG & ERDB) exhibited higher Recall (0.7083) than the ‘w/o ERDB’ variant (Recall: 0.7063) and the ‘w/o CQG’ variant (Recall: 0.7021). However, in terms of F1-Score, the baseline (0.7391) was lower than both the ‘w/o ERDB’ (0.7523) and the ‘w/o CQG’ (0.7479) variants. This nuanced behavior of individual components highlights that while the removal of either module may lead to slight improvements in certain metrics, their joint integration in the full model yields a more balanced and optimal performance overall. We believe this observation reflects a complex interplay in which individual modules, although effective on their own, achieve their full potential primarily through synergy. Figure 9 provides a visual comparison of the different model variants in the module-level ablation study.
Specifically, incorporating ERDB alone significantly enhanced the model’s capacity for discerning local details, leading to a Precision increase of approximately 2.74 percentage points (pp), although this was accompanied by a slight decrease in Recall of approximately 0.62 pp. This potentially indicates that an excessive focus on local details might compromise the identification of certain samples requiring global context for confirmation. Similarly, the isolated introduction of CQG yielded an even more substantial Precision improvement of approximately 3.21 pp, alongside a smaller decrease in Recall of approximately 0.20 pp.
To further substantiate the synergy between the proposed CQG and ERDB modules, we present a qualitative analysis using reconstruction error maps in Figure 10. The visualization reveals that when either CQG or ERDB is employed in isolation, significant residual errors persist in critical iris texture regions. As highlighted by the red boxes, these areas exhibit a light blue color, indicating an incomplete restoration of fine-grained patterns. In stark contrast, the complete model, which integrates both modules, demonstrates a marked reduction in error. The corresponding regions shift to a deep blue, signifying a more faithful and accurate recovery of delicate iris structures.
This qualitative analysis, combined with the preceding quantitative data, provides a comprehensive explanation for our findings. It confirms that optimal performance, particularly for recognition tasks, is achieved only when the global contextual guidance from CQG is synergistically combined with the fine-grained local feature representations from ERDB. This synergy, now visually substantiated by the error maps, directly translates into superior performance. Compared to the variant lacking only CQG (w/o CQG), the full model achieved an increase of approximately 1.48 pp in Precision and a substantial increase of approximately 4.17 pp in Recall. Likewise, compared to the variant lacking only ERDB (w/o ERDB), the improvements were approximately 1.01 pp in Precision and approximately 3.75 pp in Recall. These combined improvements culminated in the highest overall performance, as indicated by the F1-Score (0.7777), clearly demonstrating that the synergy between CQG and ERDB is essential for achieving the optimal balance between Precision and Recall.

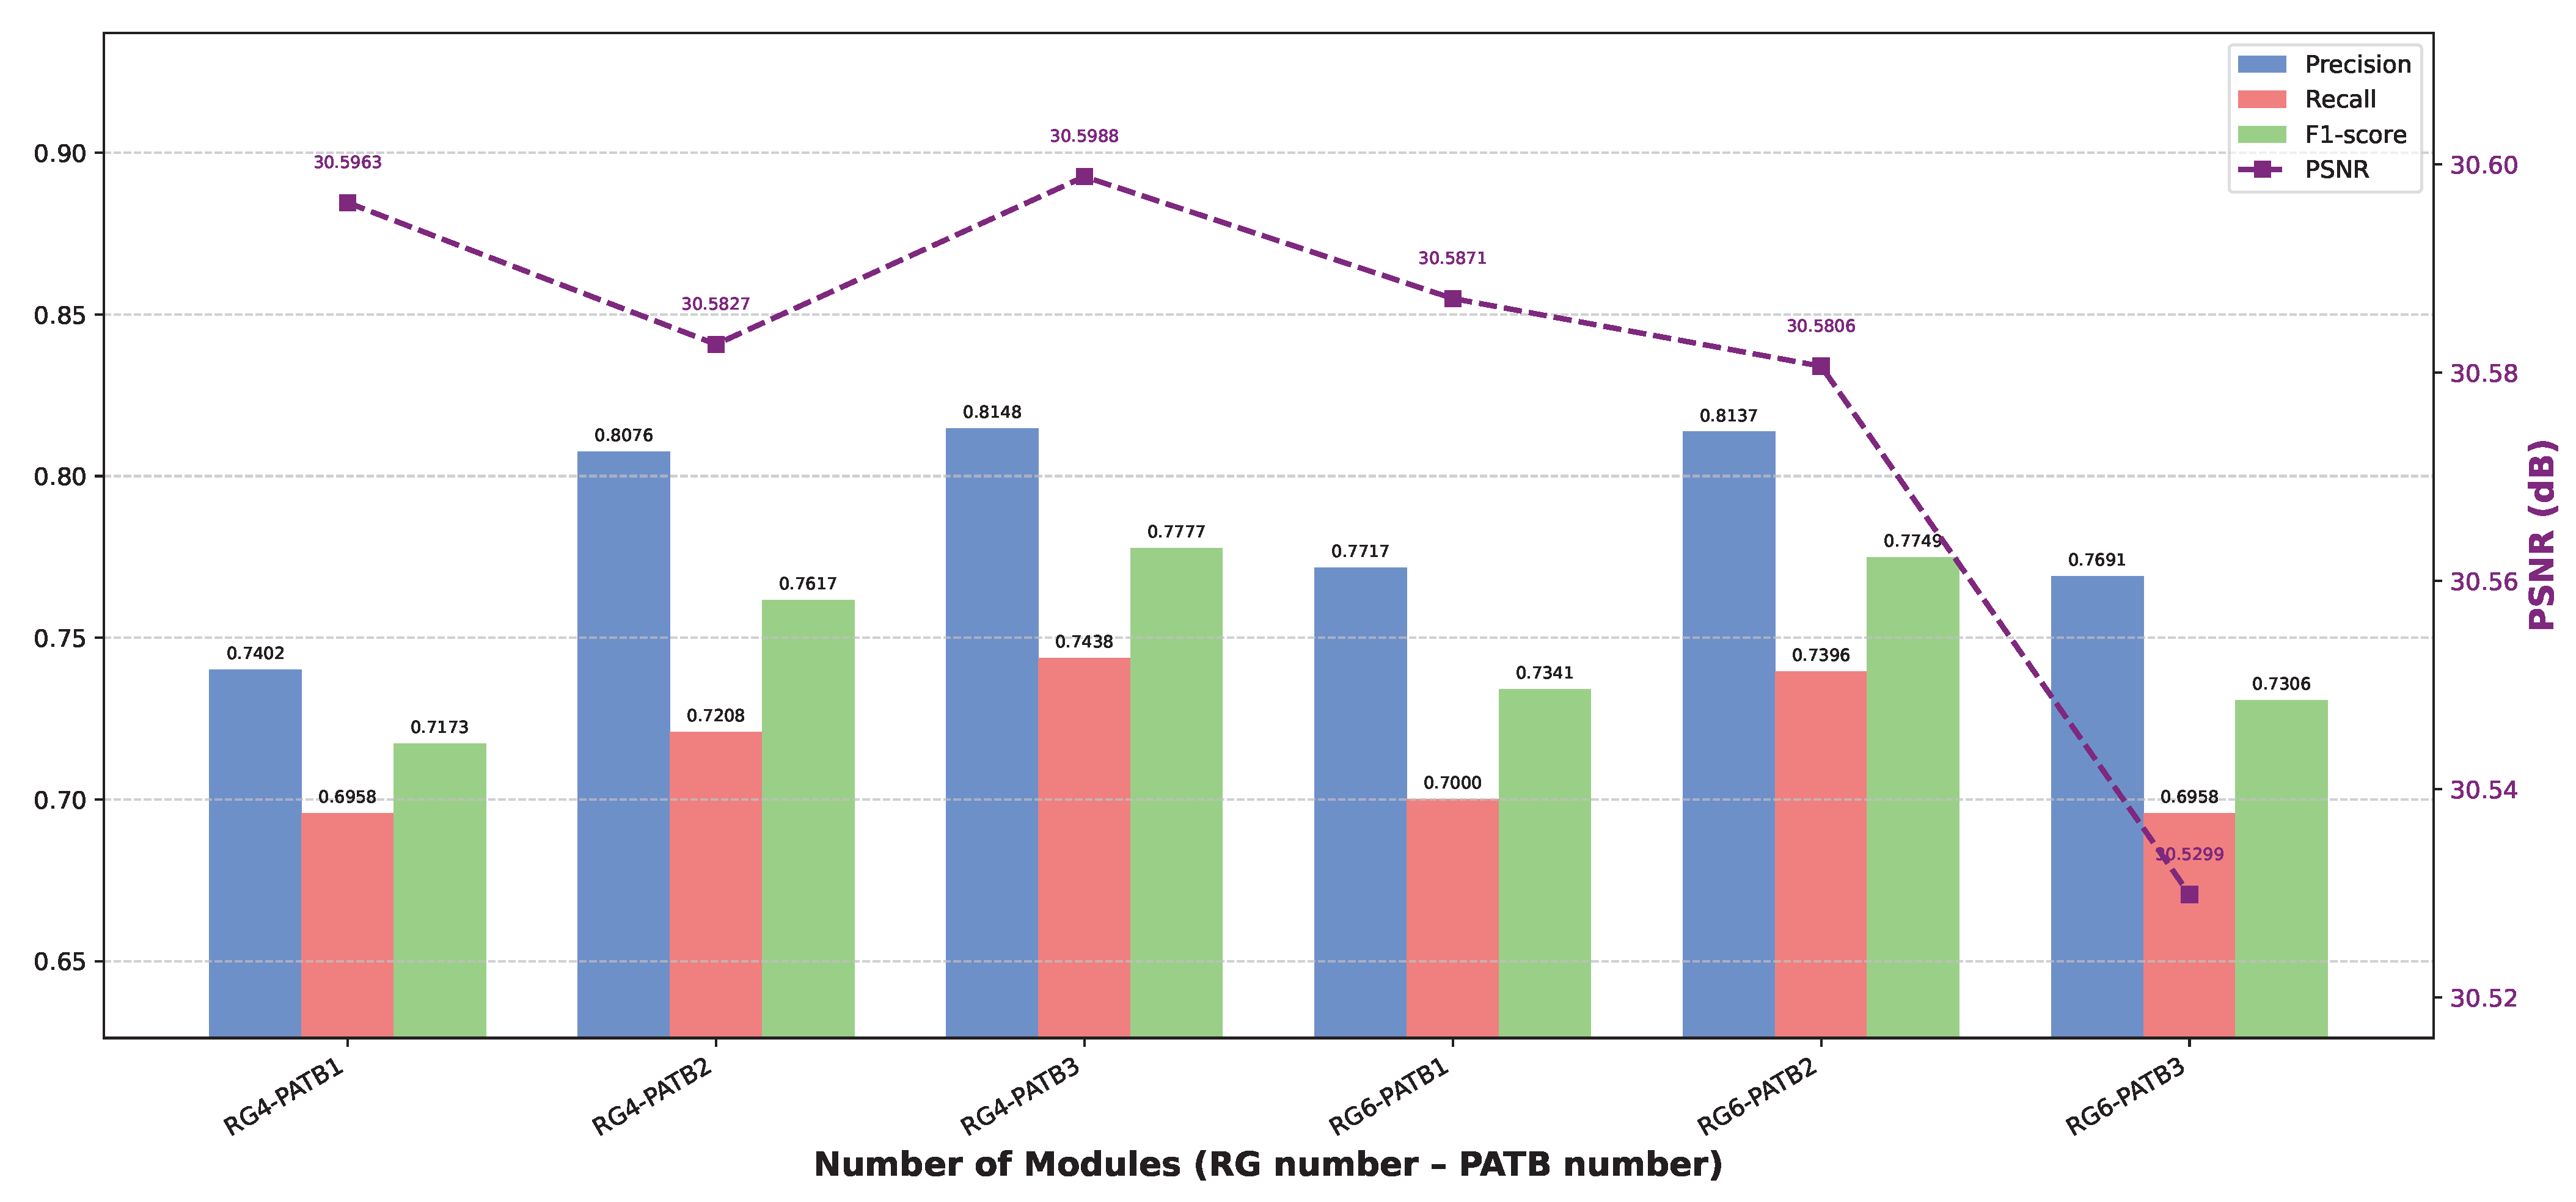
3.3.2. Ablation on Number of Modules

In order to establish the optimal network depth, an evaluation was performed across six distinct configurations, characterized by varying the number of Residual Group (RG) within the set 4, 6 and the number of PATB within the set 1, 2, 3. The results are detailed in Table 5 and visualized in Figure 11.
Impact of PATB Module Count. When the number of RG was fixed at 4, increasing the PATB count from 1 to 2 resulted in mixed changes: PSNR decreased slightly from 30.5963 dB to 30.5827 dB. However, SSIM saw a marginal increase from 0.8548 to 0.8553, and the recognition-focused metrics improved notably: Precision rose from 0.7402 to 0.8076, Recall from 0.6958 to 0.7208, and F1-Score from 0.7173 to 0.7617. This suggests that two PATB modules enhance recognition performance despite a slight drop in PSNR. Further increasing the PATB count to 3 led to improvements across nearly all metrics compared to PATB = 2: PSNR increased to 30.5988 dB, Precision to 0.8148, Recall to 0.7438, and F1-Score to 0.7777, while SSIM slightly decreased to 0.8552. This configuration (PATB = 3) also outperformed PATB = 1 across all metrics, indicating that three PATB modules achieve the most effective balance of contextual modeling and detail preservation under RG = 4.
Conversely, when RG was set to 6, increasing PATB from 1 to 2 yielded improvements similar to the RG = 4 setting. PSNR decreased slightly (from 30.5871 dB to 30.5806 dB), SSIM increased marginally (from 0.8546 to 0.8547), and all recognition-related metrics improved significantly, with the F1-Score increasing from 0.7341 to 0.7749. This suggests that with deeper residual structures, a moderate increase in PATB count enhances performance. However, further increasing PATB to 3 led to a decline in all metrics compared to PATB = 2: PSNR dropped to 30.5299 dB, SSIM to 0.8531, Precision to 0.7691, Recall to 0.6958, and F1-Score to 0.7306. This implies that three PATB modules may introduce over-parameterization or optimization difficulties when paired with 6 residual groups.
Impact of Residual Group Count. For a fixed PATB count of 1, increasing RG from 4 to 6 slightly decreased PSNR (30.5963 dB to 30.5871 dB) and SSIM (0.8548 to 0.8546), while improving Precision (0.7402 to 0.7717), Recall (0.6958 to 0.7000), and F1-Score (0.7173 to 0.7341). With PATB fixed at 2, increasing RG from 4 to 6 also led to a small drop in PSNR (30.5827 to 30.5806) and SSIM (0.8553 to 0.8547), but boosted Precision (0.8076 to 0.8137), Recall (0.7208 to 0.7396), and F1-Score (0.7617 to 0.7749). However, when PATB was fixed at 3, increasing RG from 4 to 6 resulted in a consistent performance drop across all metrics. For instance, comparing RG = 4 and PATB = 3 with RG = 6 and PATB = 3, PSNR declined from 30.5988 dB to 30.5299 dB, SSIM from 0.8552 to 0.8531, Precision from 0.8148 to 0.7691, Recall from 0.7438 to 0.6958, and F1-Score from 0.7777 to 0.7306. This suggests diminishing returns or even overfitting when both RG and PATB are large.
Based on a comprehensive assessment considering all evaluation metrics across the tested configurations, the architecture employing four residual groups and three PATB modules demonstrated the most favorable overall performance (PSNR: 30.5988, SSIM: 0.8552, Precision: 0.8148, Recall: 0.7438, F1-Score: 0.7777). This configuration provides an optimal trade-off between depth and expressiveness, ensuring both image fidelity and recognition accuracy.

3.4. Efficiency and Complexity Analysis

As shown in Table 6, our proposed model demonstrates a favorable trade-off between performance and computational cost. The architecture comprises 8.42 M parameters, corresponding to a model size of 43.55 MB. For a 64 × 64 input, the computational demand is 47.71 GFLOPs. During inference, the model achieves an average latency of 120.83 ms per image, with a peak GPU memory usage of 514 MB on an NVIDIA RTX 2080Ti, demonstrating its feasibility for deployment in horse farm environments.

4. Conclusions

This paper addresses the significant challenge of horse iris recognition stemming from LR images, often captured due to the sensitive nature of horses and the constraints of remote imaging. To overcome this limitation, we proposed HIEN for horse iris SR. This network is specifically designed to generate HR horse iris images from their LR counterparts by effectively balancing the capture of long-range contextual dependencies across the image with the efficient and detailed reconstruction of intricate local iris textures.
By significantly improving the quality of horse iris images captured under challenging conditions, our work provides a valuable advancement for non-invasive biometric identification in horses. This technology holds considerable promise for enhancing information-management systems within equestrian facilities, optimizing breeding-management protocols, and potentially contributing to improved animal health monitoring and welfare. Future research could explore the model’s adaptation for real-time applications or deployment on resource-constrained devices, investigate its generalizability across different breeds and environmental conditions, and potentially extend the framework to other challenging animal biometric identification scenarios.

Author Contributions

Conceptualization, A.Z. and B.G.; methodology, A.Z.; software, A.Z.; validation, A.Z., B.G. and X.L.; formal analysis, A.Z.; investigation, A.Z. and W.L.; resources, B.G.; data curation, X.L. and W.L.; writing—original draft preparation, A.Z.; writing—review and editing, A.Z. and B.G.; visualization, X.L. and W.L.; supervision, B.G.; project administration, B.G.; funding acquisition, B.G. All authors have read and agreed to the published version of the manuscript.

Funding

This research was sponsored by the Natural Science Foundation of Xinjiang Uygur Autonomous Region: Research and Application of Individual Identity Recognition Technology for Yili Horses Based on Multi-modal Biometric Fusion (Grant No. 2022D01A203).

Institutional Review Board Statement

Not applicable.

Informed Consent Statement

Not applicable.

Data Availability Statement

The data presented in this study are available on request from the corresponding author.

Conflicts of Interest

The authors declare no conflicts of interest.

References

  1. Monterrubio, C.; Pérez, J. Horses in leisure events: A posthumanist exploration of commercial and cultural values. J. Policy Res. Tour. Leis. Events 2020, 13, 147–171. [Google Scholar] [CrossRef]
  2. Górecka-Bruzda, A.; Jaworska, J.; Stanley, C.R. The Social and Reproductive Challenges Faced by Free-Roaming Horse (Equus caballus) Stallions. Animals 2023, 13, 1151. [Google Scholar] [CrossRef] [PubMed]
  3. Rozi, P.; Mattohti, W.; Ababakri, G.; Li, P.; Chen, Y.; Yuan, L. Isolation, structure identification, and antioxidant activity of collagen peptides from horse bone marrow. J. Food Meas. Charact. 2024, 18, 4074–4087. [Google Scholar] [CrossRef]
  4. Jarraya, I.; Said, F.B.; Hamdani, T.M.; Neji, B.; Beyrouthy, T.; Alimi, A.M. Biometric-Based Security System for Smart Riding Clubs. IEEE Access 2022, 10, 132012–132030. [Google Scholar] [CrossRef]
  5. Borisova, A.V.; Shemarykin, A.E.; Datsyshin, A.A.; Koroleva, G.V. Geometric morphometry as a new method of differentiation of intrabreed types in horse breeding. BIO Web Conf. 2024, 108, 01013. [Google Scholar] [CrossRef]
  6. Bussiman, F.; Alves, A.A.C.; Richter, J.; Hidalgo, J.; Veroneze, R.; Oliveira, T. Supervised Machine Learning Techniques for Breeding Value Prediction in Horses: An Example Using Gait Visual Scores. Animals 2024, 14, 2723. [Google Scholar] [CrossRef]
  7. Miller, M.; Byfield, R.; Crosby, M.; Lin, J. Networked Wearable Sensors for Monitoring Health and Activities of an Equine Herd: An IoT Approach to Improve Horse Welfare. IEEE Sensors J. 2024, 24, 29211–29218. [Google Scholar] [CrossRef]
  8. Santos, R.D.; Moutinho, F.; Prazeres, J.; Leithardt, V.R.Q.; Matos-Carvalho, J.P. Horses Identification Through Deep Learning Algorithms. In Proceedings of the 2024 8th International Young Engineers Forum on Electrical and Computer Engineering (YEF-ECE), Caparica/Lisbon, Portugal, 5 July 2024; pp. 14–19. [Google Scholar] [CrossRef]
  9. Godoi, T.L.O.S.; de Souza, R.N.; de Godói, F.N.; de Almeida, F.Q.; de Medeiros, M.A. Physiological and behavioral response of foals to hot iron or freeze branding. J. Vet. Behav. 2021, 48, 41–48. [Google Scholar] [CrossRef]
  10. Awad, A. From classical methods to animal biometrics: A review on cattle identification and tracking. Comput. Electron. Agric. 2016, 123, 423–435. [Google Scholar] [CrossRef]
  11. Suzaki, M.; Yamakita, O.; Horikawa, S.; Kuno, Y.; Aida, H.; Sasaki, N.; Kusunose, R. A horse identification system using biometrics. Syst. Comput. Jpn. 2001, 32, 12–23. [Google Scholar] [CrossRef]
  12. Graf, P.; König von Borstel, U.; Gauly, M. Importance of personality traits in horses to breeders and riders. J. Vet. Behav. 2013, 8, 316–325. [Google Scholar] [CrossRef]
  13. Dong, C.; Loy, C.C.; He, K.; Tang, X. Image Super-Resolution Using Deep Convolutional Networks. IEEE Trans. Pattern Anal. Mach. Intell. 2016, 38, 295–307. [Google Scholar] [CrossRef]
  14. Ribeiro, E.; Uhl, A. Exploring Texture Transfer Learning via Convolutional Neural Networks for Iris Super Resolution. In Proceedings of the 2017 International Conference of the Biometrics Special Interest Group (BIOSIG), Darmstadt, Germany, 20–22 September 2017; pp. 1–5. [Google Scholar] [CrossRef]
  15. Kashihara, K. Iris Recognition for Biometrics Based on CNN with Super-resolution GAN. In Proceedings of the 2020 IEEE Conference on Evolving and Adaptive Intelligent Systems (EAIS), Bari, Italy, 27–29 May 2020; pp. 1–6. [Google Scholar] [CrossRef]
  16. XIA, Y.; LI, P.; WANG, J.; ZHANG, Z.; LI, D.; HE, Z. Hierarchical Iris Image Super Resolution based on Wavelet Transform. In Proceedings of the 2022 4th International Conference on Image Processing and Machine Vision (IPMV), Hong Kong, China, 25–27 March 2022; pp. 37–43. [Google Scholar] [CrossRef]
  17. Lu, H.; Zhu, X.; Cui, J.; Jiang, H. An Iris Image Super-Resolution Model Based on Swin Transformer and Generative Adversarial Network. Algorithms 2024, 17, 92. [Google Scholar] [CrossRef]
  18. Wang, X.; Girshick, R.; Gupta, A.; He, K. Non-local Neural Networks. arXiv 2017, arXiv:1711.07971v3. [Google Scholar]
  19. Liu, Z.; Lin, Y.; Cao, Y.; Hu, H.; Wei, Y.; Zhang, Z.; Lin, S.; Guo, B. Swin Transformer: Hierarchical Vision Transformer using Shifted Windows. arXiv 2021, arXiv:2103.14030. [Google Scholar] [CrossRef]
  20. Shi, W.; Caballero, J.; Huszár, F.; Totz, J.; Aitken, A.P.; Bishop, R.; Rueckert, D.; Wang, Z. Real-Time Single Image and Video Super-Resolution Using an Efficient Sub-Pixel Convolutional Neural Network. arXiv 2016, arXiv:1609.05158. [Google Scholar] [CrossRef]
  21. Dosovitskiy, A.; Beyer, L.; Kolesnikov, A.; Weissenborn, D.; Zhai, X.; Unterthiner, T.; Dehghani, M.; Minderer, M.; Heigold, G.; Gelly, S.; et al. An Image is Worth 16x16 Words: Transformers for Image Recognition at Scale. arXiv 2020, arXiv:2010.11929. [Google Scholar] [CrossRef]
  22. Zamir, S.W.; Arora, A.; Khan, S.; Hayat, M.; Khan, F.S.; Yang, M.H. Restormer: Efficient Transformer for High-Resolution Image Restoration. arXiv 2021, arXiv:2111.09881. [Google Scholar] [CrossRef]
  23. Liang, J.; Cao, J.; Sun, G.; Zhang, K.; Gool, L.V.; Timofte, R. SwinIR: Image Restoration Using Swin Transformer. arXiv 2021, arXiv:2108.10257. [Google Scholar] [CrossRef]
  24. Vaswani, A.; Shazeer, N.; Parmar, N.; Uszkoreit, J.; Jones, L.; Gomez, A.N.; Kaiser, L.; Polosukhin, I. Attention Is All You Need. arXiv 2017, arXiv:1706.03762. [Google Scholar] [CrossRef]
  25. Tan, M.; Le, Q. EfficientNetV2: Smaller Models and Faster Training. In Proceedings of the Proceedings of the 38th International Conference on Machine Learning, PMLR, Virtual, 18–24 July 2021; Volume 139, pp. 10096–10106. [Google Scholar]
  26. Wang, Q.; Wu, B.; Zhu, P.; Li, P.; Zuo, W.; Hu, Q. ECA-Net: Efficient Channel Attention for Deep Convolutional Neural Networks. arXiv 2019, arXiv:1910.03151. [Google Scholar] [CrossRef]
  27. Hendrycks, D.; Gimpel, K. Gaussian Error Linear Units (GELUs). arXiv 2016, arXiv:1606.08415. [Google Scholar]
  28. Zhang, Y.; Tian, Y.; Kong, Y.; Zhong, B.; Fu, Y. Residual Dense Network for Image Super-Resolution. arXiv 2018, arXiv:1802.08797v2. [Google Scholar]
  29. Hayat, M.; Aramvith, S.; Bhattacharjee, S.; Ahmad, N. Attention GhostUNet++: Enhanced Segmentation of Adipose Tissue and Liver in CT Images. arXiv 2025, arXiv:2504.11491. [Google Scholar] [CrossRef]
  30. Raghu, M.; Unterthiner, T.; Kornblith, S.; Zhang, C.; Dosovitskiy, A. Do Vision Transformers See Like Convolutional Neural Networks. Adv. Neural Inf. Process. Syst. 2021, 34, 12116–12128. [Google Scholar]
  31. Chen, Z.; Zhang, Y.; Gu, J.; Kong, L.; Yang, X. Recursive Generalization Transformer for Image Super-Resolution. arXiv 2023, arXiv:2303.06373. [Google Scholar]
  32. Kingma, D.; Ba, J. Adam: A Method for Stochastic Optimization. arXiv 2014, arXiv:1412.6980. [Google Scholar]
  33. Gonzalez, R.C.; Woods, R.E. Digital Image Processing, 2nd ed.; Prentice Hall: Upper Saddle River, NJ, USA, 2002. [Google Scholar]
  34. Wang, Z.; Bovik, A.; Sheikh, H.; Simoncelli, E. Image quality assessment: From error visibility to structural similarity. IEEE Trans. Image Process. 2004, 13, 600–612. [Google Scholar] [CrossRef]
  35. Howard, A.; Sandler, M.; Chu, G.; Chen, L.C.; Chen, B.; Tan, M.; Wang, W.; Zhu, Y.; Pang, R.; Vasudevan, V.; et al. Searching for MobileNetV3. arXiv 2019, arXiv:1905.02244. [Google Scholar] [CrossRef]
  36. Lim, B.; Son, S.; Kim, H.; Nah, S.; Lee, K.M. Enhanced Deep Residual Networks for Single Image Super-Resolution. arXiv 2017, arXiv:1707.02921. [Google Scholar] [CrossRef]
  37. Li, Z.; Yang, J.; Liu, Z.; Yang, X.; Jeon, G.; Wu, W. Feedback Network for Image Super-Resolution. arXiv 2019, arXiv:1903.09814. [Google Scholar] [CrossRef]
  38. Niu, B.; Wen, W.; Ren, W.; Zhang, X.; Yang, L.; Wang, S.; Zhang, K.; Cao, X.; Shen, H. Single Image Super-Resolution via a Holistic Attention Network. arXiv 2020, arXiv:2008.08767. [Google Scholar] [CrossRef]
  39. Zhang, X.; Zeng, H.; Guo, S.; Zhang, L. Efficient Long-Range Attention Network for Image Super-resolution. arXiv 2022, arXiv:2203.06697. [Google Scholar] [CrossRef]
  40. Li, A.; Zhang, L.; Liu, Y.; Zhu, C. Feature Modulation Transformer: Cross-Refinement of Global Representation via High-Frequency Prior for Image Super-Resolution. In Proceedings of the 2023 IEEE/CVF International Conference on Computer Vision (ICCV), Paris, France, 1–6 October 2023; pp. 12480–12490. [Google Scholar] [CrossRef]
  41. Zheng, M.; Sun, L.; Dong, J.; Pan, J. SMFANet: A lightweight self-modulation feature aggregation network for efficient image super-resolution. In Proceedings of the European Conference on Computer Vision, Milan, Italy, 29 September 2024; pp. 359–375. [Google Scholar]
  42. Liu, Q.; Zhuang, C.; Gao, P.; Qin, J. CDFormer:When Degradation Prediction Embraces Diffusion Model for Blind Image Super-Resolution. arXiv 2024, arXiv:2405.07648v1. [Google Scholar]
Figure 1. Surface anatomy of the horse eye and adnexa revealed by near-infrared illumination: (A) infrared light source reflection, (B) pupil, (C) granulae iridica, (D) iris, (E) sclera.
Applsci 15 07191 g001
Figure 2. (a) Data-collection environment. (b) Data-collection device (left: near-infrared camera; right: Raspberry Pi 4B). (c) Data collection process.
Applsci 15 07191 g002
Figure 3. Example of horse iris images. The first row shows high-resolution images, and the second row shows the corresponding low-resolution images.
Applsci 15 07191 g003
Figure 4. The overall framework of the proposed Hybrid Interaction Enhanced Network (HIEN) for horse iris super-resolution, which integrates CNN and Transformer modules to capture both local and global contextual information, effectively enhancing the quality of image reconstruction.
Applsci 15 07191 g004
Figure 5. Illustration of the Global Feature-Extraction Module (GFEM). (a) The structure of GFEM. (b) The Paired Asymmetric Transformer Block (PATB), which consists of two cascaded Transformer submodules. The Contextual Query Generator (CQG) generates the query for the second submodule based on the original input features of the PATB.
Applsci 15 07191 g005
Figure 6. (a) Illustration of the CQG. (b) Architecture of the Efficient Channel Attention (ECA) module.
Applsci 15 07191 g006
Figure 7. The illustration of the LFEM. (a) Local Feature-Extraction Module. (b) The Efficient Residual Dense Block (ERDB) is used to extract local features from the image.
Applsci 15 07191 g007
Figure 8. Visual comparison between HIEN and several classical and state-of-the-art methods.
Applsci 15 07191 g008
Figure 9. Visualization of the ablation results of different modules.
Applsci 15 07191 g009
Figure 10. Qualitative comparison of different ablation modules. The top row displays the super-resolved results, and the second row shows their corresponding reconstruction error maps. The yellow boxes highlight critical iris texture regions.
Applsci 15 07191 g010
Figure 11. Visualization of the ablation results for different RG and PATB block numbers.
Applsci 15 07191 g011
Table 1. Dataset distribution.
TypeTraining SetTest SetValidation Set
Number of Horses761616
Number of Images2280480480
Table 2. Data flow and tensor shape transformation within HIEN. The shapes are presented in the format (Channels × Height × Width).
StageModule / Key OperationOutput Tensor Shape
InputLow-Resolution Image3 × 64 × 64
1. Shallow Feature Extraction3 × 3 Convolution180 × 64 × 64
2. Deep Feature Extraction
   2a. Local PathLFEM with ERDBs180 × 64 × 64
   2b. Global PathGFEM with PATBs180 × 64 × 64
   2c. Feature FusionAddition + Convolution180 × 64 × 64
3. Image ReconstructionPixelShuffle + Convolution3 × 256 × 256
OutputSuper-Resolved Image3 × 256 × 256
Table 3. Quantitative comparison between our proposed method and several state-of-the-art super-resolution methods. The best and second best results are bold and underlined, respectively.
MethodYearPSNRSSIMPrecisionRecallF1-Score
Bicubic-26.59490.76310.57130.46460.5125
EDSR201730.34180.85020.73880.69380.7156
RDN201830.53610.85330.73940.69790.7181
SRFBN201930.50820.85410.73810.69170.7141
HAN202030.74140.85720.73890.69580.7167
SwinIR202130.54120.85420.80440.70830.7533
ELAN202230.33530.85070.73370.69790.7154
CRAFT202330.24760.85010.73860.69580.7166
SMFAN202430.44310.84970.73710.69790.7170
CDFormer202430.48090.86310.78040.72290.7506
RGT202430.59050.85510.76880.69380.7294
HIENOurs30.59880.85520.81480.74380.7777
Table 4. Ablation study evaluating the effectiveness of the proposed CQG and ERDB modules. The best result is bold.
BlockPSNRSSIMPrecisionRecallF1-Score
w/o CQG & ERDB30.54500.85500.77260.70830.7391
w/o CQG30.59740.85530.80000.70210.7479
w/o ERDB30.58600.85530.80470.70630.7523
w/ CQG & ERDB30.59880.85520.81480.74380.7777
Table 5. Quantitative analysis of the influence of PATB and ERDB block numbers in the proposed network.
RG NumberPATB NumberPSNRSSIMPrecisionRecallF1-Score
4130.59630.85480.74020.69580.7173
4230.58270.85530.80760.72080.7617
4330.59880.85520.81480.74380.7777
6130.58710.85460.77170.70000.7341
6230.58060.85470.81370.73960.7749
6330.52990.85310.76910.69580.7306
Table 6. Model efficiency and runtime performance metrics.
MetricValueDescription
Number of Parameters (M)8.42Total trainable parameters of the model
Model Size (MB)43.55Total size of trainable parameters
FLOPs (G)47.71Computation cost for a 64 × 64 input
Peak Training VRAM (GB)5.06Maximum GPU memory usage during training
Peak Inference VRAM (MB)514Maximum GPU memory usage during inference
Inference Latency (ms)120.83Average runtime per image
Disclaimer/Publisher’s Note: The statements, opinions and data contained in all publications are solely those of the individual author(s) and contributor(s) and not of MDPI and/or the editor(s). MDPI and/or the editor(s) disclaim responsibility for any injury to people or property resulting from any ideas, methods, instructions or products referred to in the content.

