1. Introduction
Digitalization has become a buzzword in the business world as companies seek to improve their efficiency, productivity, and profitability by adopting the latest available technologies. In particular, Industry 4.0 technologies have proved to be useful for the optimization of production processes through the use of interconnected devices and systems, resulting in the improved agility and flexibility of the organization when it comes to changes in demand, reducing downtime, and increasing the overall productivity. The integration of data analytics and machine learning algorithms in production processes has also been shown to provide valuable insights into operational inefficiencies, enabling companies to identify areas for improvement and optimize their processes for maximum efficiency. Furthermore, Industry 4.0 technologies have the potential to significantly reduce costs by automating repetitive tasks and minimizing the need for manual labor. This not only reduces labor costs but also increases production rates and quality while reducing the risk of errors. While the benefits of digitalization are well known and understood, the costs and challenges of implementing these technologies are often underestimated. In particular, identifying the optimal route towards transformation involves a careful analysis of various factors, including the level of integration necessary at each stage of the transformation, encompassing the convergence of new digital processes with existing legacy and physical elements [
1].
One of the main challenges is the need to customize the technologies to fit existing processes, final product specifications, and environmental conditions of the company. This requires a significant amount of time, resources, and expertise from system integrators, technicians, and engineers involved in technology transfer. The integration of new technologies is not a straightforward plug-and-play process. Instead, it requires modifications and adaptations to align with the company’s requirements. The need for customization may stem from several factors, such as the company size, the type of industry, the complexity of the workflow, and the automation level already in place. For example, a large manufacturing company may have different needs and requirements than a small service-based business. Similarly, a company in the pharmaceutical industry may require more stringent quality control measures than a company in the fashion industry. The process of customizing Industry 4.0 technologies to a company’s specific needs can be complex and time-consuming and may require significant financial investments. It may involve several steps, such as data analysis, process mapping, and technology selection. In this context, research and development activities become an essential part of the digitalization process, as data collected and analyzed during the process can be used to design and implement solutions that optimize the integration of new technologies.
Given these challenges, this paper seeks to answer the following research question: How can companies effectively evaluate and align the maturity of Industry 4.0 technologies with their internal readiness levels to optimize digital transformation efforts, particularly in resource-constrained environments?
To address this, we propose a framework that combines the Technology Readiness Level (TRL) with the Industry 4.0 Maturity Index (MI), offering a structured tool to guide technology adoption based on both technological and organizational readiness.
In this paper, we explore the emerging challenges when customizing technologies for digitalization and the role of research and development activities in supporting technology integration. We also provide insights and recommendations for companies seeking to embark on a digitalization journey based on our analysis of real-life case studies. This paper is structured as follows: Firstly, a literature review is carried out to better understand both the social impact that digitalization processes can bring and the methodologies that could support technology management and planning. Secondly, the methodology adopted in this work is deeply described. At the end, some examples of the adoption of the developed tool are shown, followed by a discussion on the limitations of the results and future work and the conclusions.
2. State of the Art
A digital transformation initiative encompasses the integration of digital capabilities aimed at facilitating changes to a business model, which can have a profound impact on entire organizations, particularly their operational procedures, assets, and both internal and external stakeholders [
2]. For this reason, digital transformation, especially in small- and medium-sized enterprises (SMEs), faces challenges in adapting processes and redesigning them to accommodate the customization of tools and other research and development (R&D) activities. As a result, projects often involve a combination of digital and R&D elements (idea generation and testing, experimentation, etc.). Such a digitalization journey has an incredible potential impact on the enterprise and on the people working there, so potentially on the society they belong to as well.
The potential negative impacts—drawbacks—on personnel, the company, and the entrepreneur/owner of these digital transformation projects, which also entail transformations of processes and people, are shown in
Table 1.
Assuming a successful adaptation to the digital transformation and R&D projects, we can have several potential positive impacts—i.e., advantages—as shown in
Table 2.
By focusing on these positive outcomes and benefits, both individuals and organizations can better understand the potential rewards of embracing digital transformation and R&D initiatives.
In light of this, the adoption of Industry 4.0 technologies and digitalization strategies in the business world offers significant opportunities for improving efficiency, productivity, and profitability. The integration of interconnected devices and data analytics, coupled with machine learning algorithms, enhances organizational agility and flexibility, reduces downtime, and boosts overall productivity. However, it is crucial to acknowledge the challenges that come with customizing these technologies to fit specific company needs, such as size, industry, and workflow. This process can be complex and time-consuming and require substantial financial investments, making research and development activities an essential component of successful technology integration. As we delve into the various facets of digital transformation, it is evident that the impacts are not limited to companies alone; they extend to the people working within these organizations and the society to which they belong. By understanding both the potential drawbacks and advantages of digital transformation, individuals and organizations can better prepare themselves to navigate the changing landscape of business model innovations, ultimately influencing the dynamics of society as a whole.
Technology roadmapping stands out as a vital methodology for supporting technology management and planning. It facilitates the systematic execution and communication of activities related to technology innovation within an organization. While technology roadmapping provides a comprehensive framework for addressing the evolution of a technology within a specific sector in broad terms, a more nuanced analysis becomes essential when applying technology roadmapping (TRM) to monitor the evolution of technology within a particular company.
At a finer level of granularity, technology roadmapping is executed by scrutinizing how different technologies align with a company’s organizational, productive, and IT structure. This necessitates a thorough understanding of the specific Technology Readiness Level (TRL) of each technology when applied in the context of each company. Examining the introduction of digital technologies in companies requires a proactive assessment of the unique aspects of each organization, measuring not only the compatibility of the technology but also the readiness of the company itself.
To gauge the readiness of a company, especially when incorporating digital technologies, predictive measures can be employed. In this regard, indicators such as the Industry 4.0 Maturity Index (MI) or similar metrics play a crucial role in assessing the current stage of a company within the digital transformation process. Our focus in this analysis centers on the Acatech Industry 4.0 Maturity Index [
22], which serves as a valuable tool for evaluating a company’s maturity in navigating the complexities of digital transformation.
2.1. Technology Roadmapping
Technology roadmapping, or the technology roadmap (TRM) approach, is one of the many known methodologies available to support technology management and planning, enabling activities concerning technology innovation to be systematically carried out and communicated within the organization.
The TRM approach immediately attracted the growing attention of both academic and industrial communities and it spread rapidly within companies, industries and even governments [
23,
24,
25].
A technology roadmap can be described as a “time-based chart, comprising a number of layers that typically include both commercial and technological perspectives”, depicting a set of structured relationships between markets, products and technologies over the time [
26]. Moreover, a TRM is a document that results from the technology roadmapping process [
23].
The definition and the objectives of the TRM tool may be different according to the different organizational purposes that it can address. A company often chooses the definition that better suits its objectives. A TRM is most widely utilized as an alignment tool for planning decisions or as a tool for technological foresight. Its timeframe usually varies from 3 to 5 years.
To understand the focus of a TRM, it is necessary to clarify the importance of technology management. Taking into account different definitions of technology present in the literature, [
26] define technology as applied knowledge embodied within a physical artifact. Managing technologies involves both the hard part, linked to science and engineering, and the soft part, linked to the processes that enable its effective application. Only the perfect balance between these two aspects could ensure the stream of products and services to the market.
Technology roadmapping is a “flexible technique (…) to support strategic and long- range planning (…) providing a structured (and often graphical) means for exploring and communicating the relationships between evolving and developing markets, products and technologies over time” [
26]. While it might be easy to describe the technology roadmapping process using what is available in literature, the process of building a TRM in practical terms is surely more difficult. Therefore, several authors decided to develop methods to facilitate the implementation of this process (e.g., the ‘fast-start’ approach named ‘T-Plan’, developed by [
27].
Nevertheless, before starting to build a TRM, a clear overview of all the technologies that are under control of a certain function or organization is mandatory and it is functional to create a map of said technologies. The T-plan approach proposes a series of activities to achieve a TRM:
Initially, after building the roadmapping team, a planning phase allows the participants to define the scope, the boundaries and the purpose of the process. Moreover, in this planning phase, the outcomes of the literature research are presented.
Subsequently, with the support of a facilitator, the participants are involved in a brainstorm session aiming at identifying possible technologies likely to be developed over the following five years.
In the third phase, the TRM tool is charted (using computer-based tools) as a two-dimensional technology roadmap, consisting of a timeline and one layer on the vertical axis, reporting the identified technology clusters.
Finally, the TRM is presented to the participants, in order to be validated and stored, and follow-up activities are identified and scheduled.
Prompted by the interest arising from this first implementation, a review was carried out in order to improve the outcome and to add a second layer, introducing a market perspective. This is due to the fact that said preliminary TRM focused only on technological aspects. Moving from these considerations and following a step-by-step approach, the second attempt to develop a TRM tool was carried out, again following an approach that resembled the T-plan. This time, the roadmapping team was built, convening a greater number of technology experts belonging to the different functions involved in the innovation process in scope with this implementation attempt.
2.2. Technology Roadmapping Approaches
Nevertheless, the flexibility of a TRM leads to ambiguity and the specific tool often gets confused with other tools and approaches. Several different approaches for a TRM are available in the scientific literature. In fact, the TRM approach is very flexible in terms of objectives, graphical forms, and potential uses. For what concerns the objectives, [
26] identify eight purposes: (i) product planning, (ii) service/capability planning, (iii) strategic planning, (iv) long-range planning, (v) knowledge asset planning, (vi) program planning, (vii) process planning, and (viii) integration planning. For what concerns the graphical forms, they identify heterogeneous formats, including the following: bars, single and multiple layers, tables, and flowcharts. For what concerns the potential uses, [
28] indicates that about 10% of big organizations applied a TRM at least once but encountered different barriers such as reiterating the TRM in the life cycle, initiating the mapping process and ensuring its robustness. This is mainly due to the fact that companies cannot orient themselves among the different existing roadmaps, tailor-made on the basis of specific needs [
26]. Moreover, according to [
29], two different application levels exist: (1) the organizational level for defining and communicating the relationships between markets, products and technologies and (2) the industry level for understanding the common needs of multiple organizations. Chakraborty et al. [
30] investigated the evolution at the industry level, concluding that even if the most common architecture consists of multiple layers, one linked to the market, product and technology, there are many customized and flexible architectures across industries, consisting of additional layers based on specific topics relevant to a particular industry. The literature review presented in [
31] confirms the complexity of a TRM, resulting from the requirements and constraints of the business environment, and therefore structures the TRM into three generations with different focuses: (1) the first one focusing on roadmapping product technologies, (2) the second one focusing on roadmapping emerging technologies, and (3) the third one focusing on roadmapping innovation.
Building upon the intricate considerations of TRMs in the preceding discussion, our exploration now extends to the critical aspect of gauging technology maturity, particularly through the lens of the Technology Readiness Level (TRL). The adaptability and broad objectives of TRMs necessitate a more nuanced analysis when applied to monitor the evolution of technology within a specific company. This granular analysis involves a thorough evaluation of the specific TRL of each technology within the context of each company. As highlighted in the Technology Readiness Level Section, the TRL serves as a pivotal method for estimating the technical maturity of technology across different domains.
Technology Readiness Level
The maturity of technologies is a key factor used to predict the implementation risk and the risk of adoption of a specific technology to name two cases. The technology Readiness Level (TRL) is an established method (first developed at NASA in 1974 and formally defined in 1989) [
32] for estimating the technical maturity of technology across different domains. The TRL is generally determined during a technology readiness assessment (TRA) that investigates the application, its technological requirements, and the demonstrated technology capabilities. TRLs are based on a scale from 1 to 9 with increasing values for the most mature technologies. In 2010, the European Commission started using the TRL scale for research and innovation projects and then from 2014 in the EU Horizon 2020 program. In 2013, with the publication of ISO 16290:2013 [
33], the scale reached high visibility. The European Union refers to the TRL scale (slightly different from NASA’s but clearly inspired by it) as presented in
Table 3.
The introduction of digital technologies necessitates a proactive evaluation, considering both technological compatibility and the readiness of the company itself. To gauge this readiness, predictive measures, including indicators, are considered. This leads us to focus on the Acatech Industry 4.0 Maturity Index in
Section 2.3, which serves as a key tool for evaluating the company’s maturity in navigating digital transformation.
2.3. Acatech Industry 4.0 Maturity Index
The goal of the “Acatech STUDY”, conducted by the German Academy of Science and Engineering, is to successfully guide companies through their digital transformation. A key feature of the study is the Acatech Industry 4.0 Maturity Index (MI), which is used to indicate the current stage within the digital transformation process. The model consists of six successive maturity stages, each indicated by MI 1–6:
The first stage in the development path is COMPUTERIZATION (MI 1). Computerization is the basis for digitalization. It is often used to perform repetitive tasks more efficiently and allows cheaper manufacturing to higher standards with higher precision. But manually operated machines without digital interfaces can still be found in factories;
The second stage is CONNECTIVITY (MI 2). The isolation of information technology in computerized machinery can be broken through connecting these components with each other. The internet protocol (IP) is widely used on the shop floor.
The third stage is VISIBILITY (MI 3). Installed sensors allow us to collect a vast amount of data from production machinery, logistics, etc. Processing these data with microchips and network technology such as the Internet of Things (IoT) allows the creation of a digital shadow (DS).
The fourth stage is TRANSPARENCY (MI 4). Stage four is based on the previously created DS. The aim of transparency is to understand why something is happening by analyzing the data with engineering knowledge.
The fifth stage is PREDICTIVE CAPACITY (MI 5). The fifth stage builds on the knowledge created in the transparency stage. Conducting various future scenario simulations and identifying the most likely outcomes allows us to project the DS into the future. Developments can be anticipated in advance, which ensures a robust operation.
The sixth stage is ADAPTABILITY (MI 6). The five previous stages eventually enable the automation of actions and decision making in the sixth stage. Instead of executing them manually, they can be delegated to IT systems that can react to an evolving environment as fast as possible.
2.4. Addressing the Gaps in Technology Roadmapping
Despite the many methods and tools for TRMs that have been developed and adopted over the years and that we have briefly outlined, there is limited evidence about tools able to capture the influence of key variables such as industrial sector, firm size, and other important moderator variables and a literature gap in building the interface between TRMs and strategic alignment [
34]. Confirming the still existing need to map and include organizational elements as well when approaching technology roadmapping, [
35] developed a framework for a TRM that embeds both the technology readiness levels (TRLs) and several socio-technical elements.
Applying technology roadmapping (TRM) at high level of detail is fundamental to foreseeing the evolution of technology within a specific company. This involves progressing from comprehending and evaluating its potential impact, to the stages of acquisition, integration with the existing systems, rollout, utilization, and deployment/exploitation (without overlooking considerations of its substitution).
We argue that the digitalization of an enterprise and especially the digitalization of its physical assets require taking care of activities of customization and additionally sometimes of research and development. Although all the Industry 4.0 enabling technologies have a long history and are available “off the shelf”, such technologies must be adapted to the actual industrial scenario that could show peculiarities and force small or important interventions. Therefore, sometimes the effort of research and development is a precondition to make the enabling technology really applicable and exploitable.
In the realm of digitalization, large enterprises commonly undertake preparatory activities, including customization and research and development, as an inherent part of their expansive operations. However, the narrative takes a distinct turn for SMEs, where the onus of these propaedeutic activities often falls squarely on their shoulders. Unlike their larger counterparts, SMEs may lack the dedicated resources and specialized expertise to navigate the intricacies of digitalization initiatives. In fact, SMEs often struggle with limited financial resources, skill shortages, fragmented IT infrastructures, and an unclear strategic direction [
36,
37]. These constraints hinder their ability to invest in advanced technologies or fully capitalize on digital initiatives. To address these barriers, several studies propose accessible frameworks and low-cost strategies tailored to the needs of resource-constrained companies. For instance, ref. [
38] suggests phased implementation approaches, while [
39] emphasizes the importance of organizational readiness and employee engagement in overcoming adoption inertia. Moreover, public support programs, digital maturity audits, and collaborative innovation ecosystems have been identified as enablers that help SMEs navigate the complexity of digital transformation in a more structured and manageable way [
40,
41]. This stream of the literature provides important context for designing robust tools that can offer steadfast support in the development of various digitalization projects.
3. Method
Due to the need of companies to be engaged in customization activities and be involved in research and development, we develop a tool able to measure both the Industry 4.0 readiness level of the company and the readiness of the technology to be applied in a specific environment. The analysis of the two levels allows us to plan the best strategy to implement, particularly as follows: (i) if the Industry 4.0 preconditions are missing, the process phase should be digitalized and connected to the IT system, (ii) if there are not specific peculiarities, an enabling technology can be integrated to improve the digitalization level of the company, and (iii) if the process or the environment to be digitalized are peculiar, a research and development activity or deep integration should be planned.
To support this approach, we combine the Technology Readiness Level (TRL) framework with the Acatech Industrie 4.0 Maturity Index (MI) to capture both technological and organizational maturity. While the TRL evaluates the maturity of the technology itself (“technology push”), the MI reflects the organization’s readiness to implement and capitalize on that technology (“organization pull”).
Theoretical complementarity arises from their differing yet synergistic scopes: a piece of technology may be highly mature (a high TRL), but if the organization lacks the capabilities to integrate it effectively (a low MI), implementation success is unlikely. Similarly, a highly mature organization (a high MI) may struggle if the technology is not yet developed for its context. By integrating these two assessments, we enable a more comprehensive planning process that aligns R&D efforts, process innovation, and technology adoption within the firm’s strategic capabilities. This dual-level framework is aligned with recent academic work advocating for holistic maturity assessments in digital transformation. Salazar and Russi-Vigoya [
42] highlight the limitations of TRL in capturing socio-organizational readiness, advocating for complementary frameworks. Furthermore, the concept of System Readiness Levels (SRLs), which combines TRLs with organizational and integration dimensions, supports this integrated approach [
43].
Since we are going to measure two different indicators, a reflection on their independence and/or orthogonality is necessary. The two readiness dimensions, the Industry 4.0 level and technology level, are theoretically independent since they assess the readiness of the company with respect to the Industry 4.0 paradigm and the readiness of the specific technology to be applied in the specific context. To check the orthogonality of the two dimensions, we perform a comparative analysis based on text mining.
We apply a Natural Language Processing algorithm on textual descriptions from the Wikipedia page on a technology roadmap (
https://en.wikipedia.org/wiki/Technology_roadmap, accessed on 25 May 2025) and the section of the official Acatech study [
44] describing the maturity levels. To discern the similarities and differences between the two texts, we extract keywords by tokenizing the content, eliminating stop words and numbers, and retaining words with occurrences equal to or greater than 4—a threshold considered relevant for both texts. The resulting normalized vectors of word occurrences, shown in
Appendix A, were then subjected to a cosine similarity analysis. Computing the scalar product of the two normalized vectors yielded a value of 0.077 that corresponds to an arccosine of 85.55 degrees, which shows how the two-unit vectors are almost perpendicular. The angle of about 90 degrees indicates that the two vectors of keywords’ occurrences are orthogonal and thus suggests that the two domains are almost independent. This quantitative approach sheds light on the distinct thematic focuses of the technology roadmap and the Industrie 4.0 Maturity Index. Almost the same can be said when comparing, following the same method, the original description of TRLs by [
32] to the Acatech study.
Appendix B shows the normalized vectors of word occurrences, and the resulting scalar product is 0.048 that corresponds to an arccosine of 87.27 degrees. Also, in this case, the two vectors are almost perpendicular, and thus, the two domains are almost orthogonal (i.e., independent). This demonstrates that not only is the TRM orthogonal to the digital domain, but also that the TRL measures aspects that differ from what Acatech does. To evaluate whether this low similarity could have occurred by chance, we conducted a non-parametric permutation test with 1000 iterations. In each iteration, the combined token pool from both documents was randomly shuffled and split into two new pseudo-documents preserving the original token counts of the TRM and Acatech texts. For each pair, we constructed term–frequency vectors using the same fixed vocabulary, applied normalization, and computed the cosine similarity. Across all 1000 permutations, none produced a similarity rate as low as the observed value of 0.048, resulting in an empirical
p-value of 0.000. This strongly indicates that the similarity between the original texts is significantly lower than what would be expected by chance. Hence, the result statistically corroborates the interpretation that the TRM and Acatech documents are thematically independent, providing robust support for their conceptual orthogonality. Therefore, the two perspectives based on the 6 levels of Acatech study and on the 9 TRLs could help to properly map digitalization and innovation projects, taking into account the two distinct but interconnected perspectives.
In real practice, we can imagine these two dimensions are not totally orthogonal since the higher the level of Industry 4.0, the higher the probability the company is well structured, with proper skilled resources, with a wide knowledge and experience base. Thus, we can imagine the implementation can be easier, the exploitation can be higher, and the transformation can be deeper where a more mature environment exists.
Although digital transformation must be chosen today as a path by each and every company, the lower maturity levels (computerization and connectivity) are almost preconditions for every R&D activity in the 4.0 era. In fact, working with analogical processes and in a totally disconnected environment could prevent the real and full exploitation of any (even well-implemented) technology. Therefore, we should imagine that processes are controlled with PC/PLC and an IT infrastructure (even simple) is available.
On the technology side, we affirmed that enabling technologies belong to commercially available off-the-shelf (COTS) products. Therefore, we can expect that their maturity is high. Unfortunately, specific requirements due to customized processes or specific environmental situations could reduce the level of applicability and adaptation, redesign, integration, and testing are necessary before introducing such technology into real operations.
This way, we can introduce two thresholds for reducing the risk of R&D activities. On the Acatech maturity level, we propose a threshold at level 2 (connectivity), as it represents the foundational stage where systems and assets are at least digitally connected. This avoids the scenario of a highly innovative solution being deployed in a context with no digital infrastructure—a situation metaphorically described as ‘technological oases surrounded by the desert’. In such low-maturity environments, even the most advanced solutions struggle due to a lack of integration, data availability, or operator readiness.
Similarly, on the TRL scale, we suggest a minimum threshold at level 2 (the technology concept formulated), which implies that the technology is no longer a mere idea but has taken shape in a conceptual form and is likely to have been tested in principle. This helps avoid engaging in projects that rely on unproven or purely theoretical technologies, thus mitigating the risk of technical failure or infeasibility. Setting both thresholds at level 2 ensures that innovation efforts focus on initiatives with a minimal level of technological viability and environmental readiness.
Based on the methodology, we designed a tool consisting of a matrix with rows representing the Technology Readiness Level (TRL) levels and columns representing the Acatech maturity levels. Each cell in the matrix represents the intersection of a TRL and an Acatech maturity level, providing a clear indication of the R&D activity’s positioning. This matrix facilitates strategic planning for implementing the activity effectively. The tool is shown in
Figure 1, and it is composed of three areas:
Red area (corresponding to TRL 1 and Acatech MI 1), representative of: (i) immature technology and organization; (ii) technology not ready for implementation or integration, likely in early research, prototype, or conceptual stage; (iii) technology carrying high risk, i.e., not actionable yet.
Green area (corresponding to TRL 2–5 and Acatech MI 2–6), representative of: (i) technology in development or validation stages; (ii) technology with basic components proven that may be integrated in a laboratory or pilot setting; (iii) technology with potential for application, but still requiring testing, refinement, and scale-up; (iv) promising technologies that could be implemented in controlled environments or pilot projects; (v) technologies representing a bridge between R&D and practical deployment—a critical zone for innovation managers. In these stages the organization may start planning for future integration, especially if Acatech maturity is high.
Light blue area (corresponding to TRL 6–9 and Acatech MI 2–6), representative of: (i) mature and validated technology, proven in operational environments; (ii) technology that has been tested successfully in real-world conditions and is ready for scaling or deployment; (iii) feasible immediate implementation, especially if the organization’s Acatech maturity is also high; (iv) technologies considered for strategic rollout, competitive advantage, or digital transformation efforts; (v) strategic focus shifting from technical validation to business integration, training, and change management.
For each axis of the matrix, we assign Key Performance Indicators (KPIs) based on widely accepted frameworks:
We adopt a standardized interpretation of TRLs as defined by the European Commission and NASA. TRLs are assessed using a checklist of criteria (e.g., prototype development, validation in operational environments). Each level is defined by observable milestones, making it possible to assign a discrete score (TRLs 1 to 9).
The Acatech MI is broken down into six stages (computerization, connectivity, visibility, transparency, predictive capacity, and adaptability). Each stage is defined by observable criteria such as IT infrastructure coverage, the data integration level (e.g., ERP/MES interoperability), and the use of predictive analytics. Each of these is rated on a 1–6 scale.
The data for both dimensions are gathered using a mixed-method approach:
Surveys and interviews with technical leads, innovation managers, and digital transformation officers.
Document reviews of R&D roadmaps, technology development milestones, and IT integration reports.
System data extracted from enterprise software (ERP, MES, and PLM) to validate the current state of digitalization and process automation.
Workshops or maturity audits conducted using structured templates aligned with TRL and MI criteria.
From a procedural point of view, TRLs and the MI are evaluated based on the current development status. The activity is plotted in the matrix at the intersection of the corresponding TRL and MI scores. Based on its current position, the most appropriate progression strategy is selected (as described in the next paragraph).
This structured process enables organizations to use the matrix as more than a conceptual tool—it becomes a diagnostic and planning framework grounded in empirical data and repeatable assessment methods.
By applying the tool, we could hypothesize two different behaviors in the path of an R&D activity:
Vertical model, from top to bottom: this behavior represents a common scenario in the development of, e.g., electromechanical technologies, where the focus lies in bridging the gap between technological advancements and market introduction;
Horizontal model, from left to right: this behavior is frequently observed in the context of digital transformation, encompassing the shift from physical systems to digital realms, culminating in the use of simulation technologies such as, e.g., digital twin (DT).
However, what we expect is not to have exclusively vertical or horizontal models. In fact, the desired outcome is to attain flexible and predictive behaviors, which are typically achieved by a combination of both vertical and horizontal approaches. The attractor for such outcomes, to which applications tend, lies in the lower right quadrant of the matrix.
Effectively adopting the proposed roadmap tool necessitates a strategic approach, and several key tips can enhance its implementation. First and foremost, it is advisable to define clear Key Performance Indicators (KPIs) tailored to the specific objectives of the digital transformation initiative. These KPIs act as vital metrics, enabling organizations to monitor and assess progress at each step of the process. Additionally, careful consideration should be given to aligning the chosen digitalization path with the unique characteristics of the case at hand. By customizing the approach, companies can ensure a more seamless integration of new technologies into existing workflows. Furthermore, the tool is designed to allow movements only in vertical and horizontal directions on the roadmap. This intentional restriction discourages diagonal movements, which would represent a simultaneous horizontal and vertical shift, i.e., both in the Maturity Index and technology readiness level. The practice of moving one step at a time, either horizontally or vertically, emerges as a valuable strategy. This incremental approach promotes thorough and focused progression, minimizing the risk of overlooking critical aspects and increasing the likelihood of a successful digital transformation process.
4. Discussion
Since 2013, the term Industry 4.0 made its appearance and spread across industries worldwide. “Industrie 4.0” is the name formally adopted by the German Federal Ministry of Education and Research to identify a strategy aimed at enabling industries to transition towards future ways of production [
45]. It refers to a set of recent innovations with the potential to disrupt value chains, with a substantial impact particularly on the manufacturing sector. Industry 4.0 gravitates around one core rationale: recent progress in a variety of digital technologies has created unprecedented possibilities that result in huge improvements in operational effectiveness for manufacturing industries. The magnitude of this paradigm shift justified referring to Industry 4.0 as being the “Fourth Industrial Revolution”. There is a widespread consensus among the different stakeholders in the industry, at research institutions and in academia, that Industry 4.0 consists of essentially nine clusters of key enabling digital technologies that can radically innovate and disrupt the current manufacturing paradigms: big data and analytics; autonomous robots; simulation; horizontal and vertical system integration; the industrial internet of things; cybersecurity; the cloud; additive manufacturing; and augmented reality [
46].
Industry 4.0 enables several synergies among different elements of current production and new digital technologies. These synergies can be translated into initiatives and levers with the potential to result in considerable improvements in manufacturing processes. Industry examples have shown that real-time process optimization can lead to yield improvements (output/input) of up to 10–15%; predictive maintenance can decrease total machine downtime by 30 to 50% and increase machine life-time by 20 to 40%; human–robot collaboration can increase throughput by up to 40% while maintaining the same employee base; supply chain innovations and optimization can reduce costs for holding inventory and time to market by 20 to 50%; real-time data analytics and advanced process control for real-time error corrections can minimize rework and scrap, decreasing costs related to suboptimal quality by 10 to 20%; crowd forecasting based on advanced analytics can increase the accuracy of demand forecasting by more than 85%; concurrent engineering, simulation, digital manufacturing, and additive manufacturing can reduce the new product development cycle and lead time, resulting in a 30 to 50% reduction in time to market; and remote and predictive maintenance can reduce maintenance costs by 10 to 40%. These figures represent measured gains from the real-world implementation of Industry 4.0-related innovation [
47].
Therefore, the main trends that capture the digitization of the manufacturing systems are the inevitable evolution of the way goods are produced and the services that are offered. Small, medium, and large organizations are continuously researching how to control and develop their processes, services, and operations. They strive to optimize efficiency, improve quality, and reduce scrap and waste, ultimately to increase their agility in creating, executing, and adjusting strategy. This unveils the need to digitalize, interconnect and link the production processes. Regardless of their size, many companies are already looking towards the integration of products, machines and people using digital technologies.
The present paper focuses on how different business functions apply data analytics and intelligence to enable the next industrial advancement in production engineering and particularly in precision manufacturing. This research work presents different case studies on how to integrate digital technologies within existing manufacturing realities rather than what technology or tools to use. In this respect, the Acatech model is applied to highlight examples of products capable of being constantly monitored across the different phases of their process chain and their process life cycle. Products and processes that continuously produce data that will be processed using new statistical and control models enable new digital step change for performance changes.
This work’s outcome leads to a final data-driven and decision-making solution for the different case studies presented. The case studies not only illustrate potential outcomes in different scenarios but also provide insights into the preparatory steps organizations must undertake, such as activating new systems, modifying skill sets, and securing resources, before embarking on technological introductions. Initiating a digitalization process demands a nuanced understanding within organizations, recognizing that the actions to be taken can vary based on the nature of what is being analyzed. Whether they are products, processes, or systems, a tailored approach is crucial.
The approach will firstly be applied to the development of a tender’s analysis tool in a railway company [
48].
Figure 2 shows the roadmap.
In the starting position, the tenders were already collected in the enterprise information system that integrates the company’s process and thus makes the documents available throughout the company (Acatech level 2). However, tenders’ textual data are not processed and analyzed. The starting scenario is evaluated with TRL 9 since everything works in an operational environment. To reach visibility (Acatech level 3), the available tenders’ data should be processed, and this implies the need to make a step back to TRL 2, where several technological solutions were conceptualized. One concept was chosen and the proof of concept defined (TRL 3), and the results of the tender’s analysis are interpreted in the light of the knowledge of experts (Acatech level 4), internal to the firm, that usually manually process the tenders. Then, the tool was tested in the sandbox environment of the enterprise information system (TRL 4). Once the tool validation in the sandbox was completed successfully, the test of the system was moved to the real information system’s environment (TRLs 5–6). The tool was demonstrated in everyday operations (TRL 7), completed and qualified (TRL 8) and finally proven in operations (TRL 9). The present case study demonstrated a quite mature approach where data, already present and structured, are gathered and analyzed and different algorithms compared. The one chosen was evolved by a series of continuous improvements and tests until it reached operational maturity in a progressive improvement of the tool TRL.
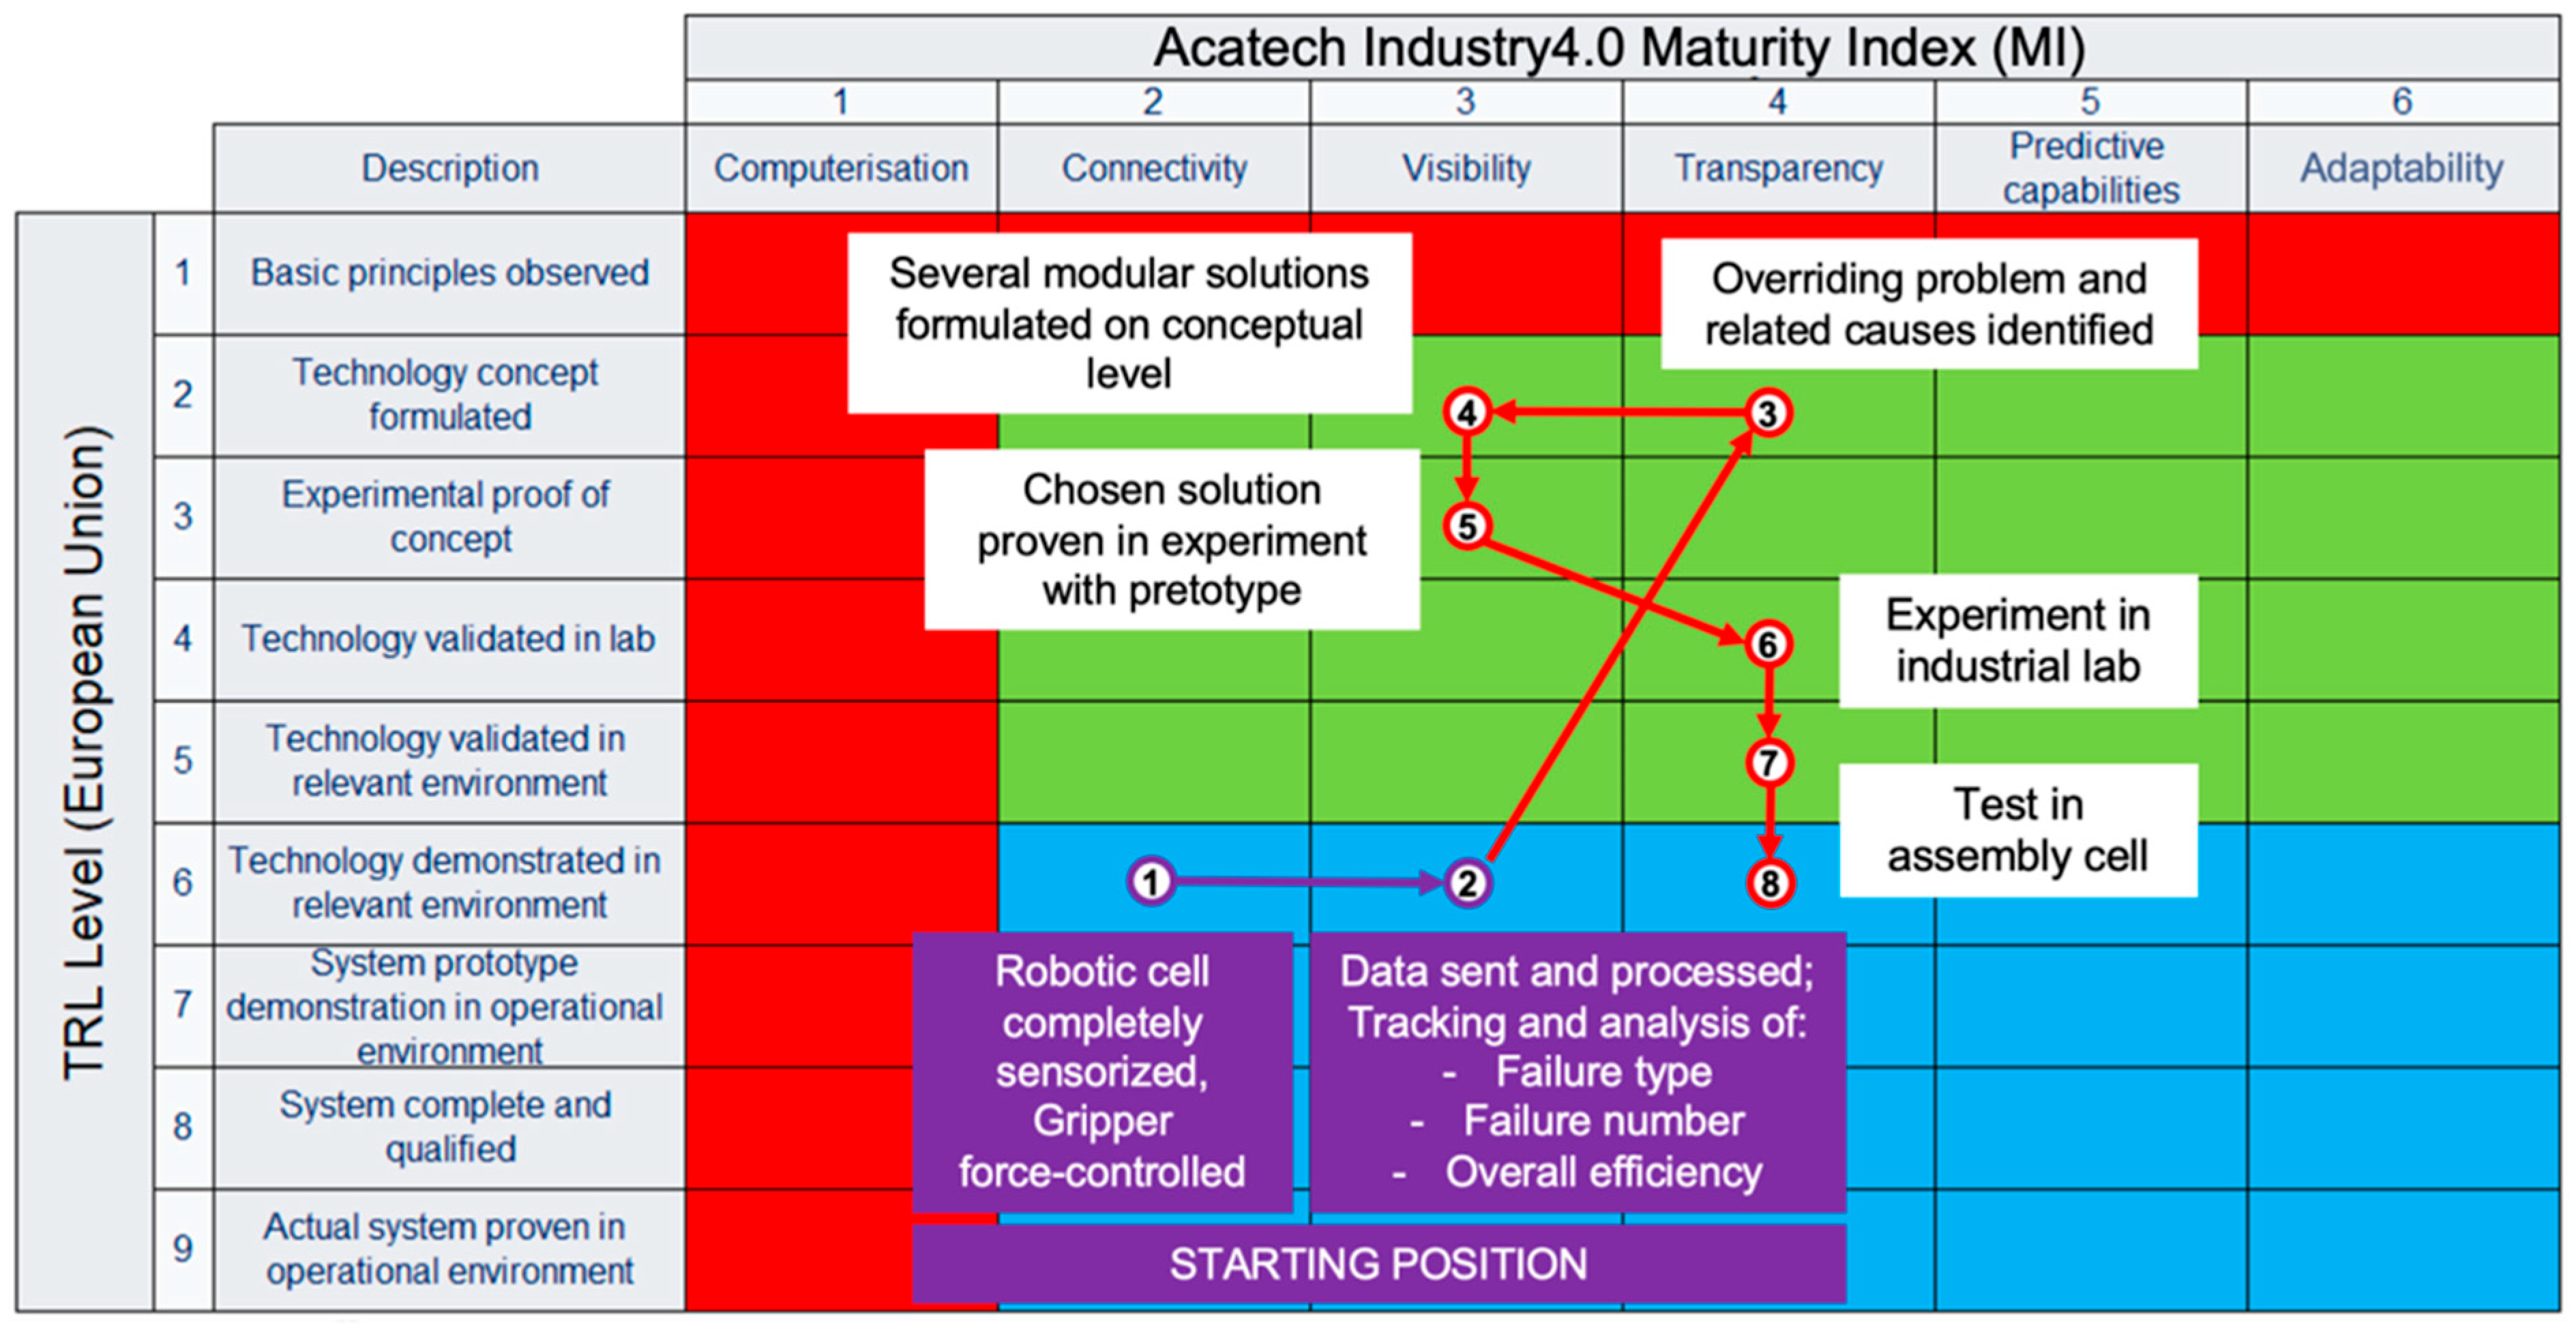
To test the ability of the approach to also deal with physical objects, it was applied to the digitalization of a robotic cell in an automotive firm [
49].
Figure 3 shows the roadmap.
The robotic cell uses UR5 robots and the robotic hand Hand-E from ROBOTIQ. The cell is already fully sensorized and the gripper is force-controlled (Acatech level 2). The data are sent and processed and can be analyzed (Acatech level 3) since connectivity and visibility are fulfilled. However, many failures are measured in the pick and placement process of the component, which forces the company to stop operations several times a day. This scenario does not fulfil the Zero-Defect Manufacturing goal of Zodiac, and therefore, the starting position is evaluated with TRL 6 where everything works in a relevant environment but does not fully reach the performance expected in the industrial scenario it is designed for. The available data on failure types, occurrence and overall efficiency allow the development team to identify the root cause of the failures. Based on that analysis, several modular solutions were developed on a conceptual level. One solution was chosen and has been tested and proven feasible with the help of a Pretotype [
50,
51]. The solution was further developed by the design of a prototype in CAD, which was eventually manufactured. This prototype was tested in the laboratory of the industrial partner, where the scenario of the assembly cell was reproduced with the same equipment. Once the technology validation in the lab was completed successfully, the test of the system was moved to a real assembly cell. The evolution trajectory can be continued in the future towards even higher maturity indices on the Acatech scale: the technology can be transferred to other cells in the company, and the acquired knowledge can be used to adapt the system to new requirements and to predict its performance. Two transitions need to be explained carefully since they are not self-explanatory. The structured way to acquire data (the control system put into the system) made the robotic cell pass from point 2 (Acatech MI 3 and TRL 6) to point 3 (MI 4-TRL 2) where the data are captured in the cell, structured and stored. The maturity index is higher, but a new grasping system must be developed. A series of small modifications of the initial grippers were been proposed and tested a few alternative grippers evaluated in the cell with low performance (MI 3-TRL 2). Such grippers were unable to fully gather the data and integrate them with the others, thus reducing the Maturity Index back to 3. Also, the diagonal movement from point 5 (Acatech MI 3 and TRL 3) to point 6 (MI 4-TRL 4) is a shortcut since it is explainable by saying that the gripper (and with it, the data acquisition system) was natively designed to be integrated with the sensorized robotic cell, thus resulting in a simultaneous improvement of both the TRL and MI. The authors suggest always choosing vertical or horizontal movements instead of diagonal ones. The case being examined, however, can be clearly explained in the design phase as well.
As the last case study, the approach is applied to the development of an innovative material handling system [
52].
Figure 4 shows the roadmap.
The project began with the study of existing technology for handling material flows, first within the specific operating environment and then in the scientific and patent literature. Thanks to this analysis, several possibilities for improvement for this class of systems were identified, such as increasing flexibility and simplifying design and actuation. In this regard, the next step was dedicated to the development of a new smart modular material handling surface that implements the proposed improvements (MI 3-TRL 2). The next step was the construction of a prototype (TRL 3) and the use of this in several tests to test its functioning (MI 4). Meanwhile, three main classes of simulations were conducted: The first involved dynamic simulations of both the individual module and the entire surface (MI 3-TRL 4), which were used to verify the analytical models proposed in the study and the system’s functioning when several modules were placed together. The second class of simulations concerned the magneto-static analysis of the actuation system (MI 4 -TRL 4). This was taken into account to gain a deeper understanding of the physical principles behind the system’s functioning with a view to optimization. The last class of simulations, on the other hand, consisted of implementing the analytical surface model in MATLAB (R2024b, version 24.2) and was designed to quickly predict the motion of the transported materials as the application changed (MI 5-TRL 4). At this point, the surface was integrated with a computer vision system for object recognition (MI 2-TRL 4) and a prototype of the “surface + computer vision” system was realized (MI 3-TRL 4) and tested (MI 4-TRL 4). Once this had been achieved, further tests were arranged to verify the functioning of the combined systems, first, in the laboratory with data from the real environment (MI 4-TRL 5) and, finally, by realizing a prototype in the operational environment (MI 4-TRL 6).
The peculiarity of the present map is based on the following:
The bifurcation of the POC that evolved both digitally (via simulation) and physically.
The later integration where three systems merged into one—point 10—namely an artificial vision system tailored for the specific application—point 9—and the handling surface (successfully tested both virtually—point 7—and physically—point 4).
Finally, we decided to present the case of developing a multimodal system [
53] capable of analyzing sketches, technical drawings, and patent images—visual inputs that are predominantly black and white, low in texture, and structured around lines. This case differs significantly from the previously discussed tenders, where general-purpose NLP technologies were applied to specific domains. Here, the starting point was general-purpose technology that required substantial adaptation to a highly specific and visually constrained input space. As such, this approach reflects a more exploratory and incremental trajectory—advancing both the system’s TRL and its ability to handle diverse tasks and use cases over time.
The company had a structured database of 1.5 million patents, with aligned images and textual components (titles, metadata, abstracts, descriptions, and claims). The initial plan was to use Meta AI’s Segment Anything Model (SAM) [
54], assuming the project would involve straightforward development with little need for research. However, early experiments revealed that the SAM, despite its high TRL (8/9) in natural RGB image contexts, was ineffective on black-and-white technical drawings and low-texture sketches, performing closer to TRL 2 in this domain. Similarly, while the system conceptually aligned with high Industrie 4.0 maturity (due to multimodal data integration), it began at a low operational level (MI 2) with limited system visibility and data transparency (see
Figure 5). This gap between expected and actual maturity led to a reframing of the project—from integrating a pre-trained model to developing a new domain-specific approach for linking visual and textual patent data, progressively improving both technological readiness and system capability.
The first phase was oriented to connect separated information and move from TRL 2 to TRL 3. At this early stage, information extracted from patents (black-and-white technical images and textual descriptions) was unstructured and unlinked at a fine grain. Due to the poor performance of generalist models like the SAM on B/W sketches, a custom linking system (algorithmic) was developed to associate image segments with relevant textual components. This enabled rudimentary semantic anchoring across modalities, forming the technological and conceptual base (MI 2 and TRL 3).
Once cross-modal connections were established, the system evolved to build structured digital representations of each patent. These included image components with spatial coordinates and text labels. The improvement in data modeling and internal representation allowed users to “see” the internal structure of the documents, and the algorithms could operate consistently across test cases. This increased technical maturity (TRL 5) and this transition also enabled the visibility of information relationships (MI 3).
A similar evolution can be observed when the system evolves, reaching the ability of providing engineering insights.
Subsequent developments integrated improved image segmentation techniques (including the partial use of the SAM where effective) and complementary algorithms for post-processing, component validation, and text anchoring. Basic machine learning modules were introduced to correct errors and refine component classification.
The system, at this point, was able to support engineering-level understanding, not only retrieving components but offering contextualized interpretations and insights. This transition marked the passage to MI 4 and TRL 7, as the system reached high reliability in structured vertical domains (e.g., eyewear, face masks) (MI 4 and TRL 7).
At this stage, the goal was increasing the TRL to reach the market by an operational deployment in vertical domains. Through collaboration with companies in specific manufacturing domains, the system was adapted and fine-tuned for operational use. The full pipeline—from document ingestion to interactive querying (textual, visual, or hybrid)—was tested in realistic industrial environments. The human-in-the-loop approach allowed users to operate in both analytical and creative modes, exploring patent knowledge interactively. This phase solidified the technology as a near-ready solution for real-world deployment (TRL 8) while remaining within MI 4, since no predictive capabilities were yet introduced (MI 4 and TRL 8).
Then, the project moves towards prediction and autonomy. The current system lays a solid foundation for future extensions into predictive reasoning (suggesting missing components, alternative designs, or engineering constraints) and eventually adaptive learning (continuous improvement through user interaction). These capabilities will mark the transition to the upper levels of the Acatech scale (MIs 5 and 6 and TRL 8). The system does not seem able to be generalized soon but its integration with future versions of SAM could help in generalization reaching the system able to deal with generic drawings belonging to different domains (TRL 9).
5. Discussion: Limitations and Future Works
The presented approach has proven to be valuable both in the design phase and during discussions with companies, irrespective of their size or sector. It is adept at handling various products/systems, ranging from purely software-based to more mechanical ones, encompassing all the nuances between the two. The roadmap serves as a useful tool for informing the development or digitalization team about the project’s status and evolution, its need for innovation, and/or the necessary steps for system digitalization. Furthermore, it has demonstrated its efficacy as a tool for consensus-building and fostering agreement around a plan. Initially drafted at the project’s outset, the roadmap is continuously updated throughout development, serving as a blueprint for both the project and the organization championing it.
Despite its utility, the approach does exhibit certain limitations (outlined in
Section 5.1) and will benefit from further developments (introduced in
Section 5.2).
5.1. Limitations
There are a few limitations to consider in this work. Firstly, the concept of the time perspective is less complex compared to more traditional roadmaps that heavily rely on temporal factors. Instead, the focus is placed on the logical evolutionary states of an artifact, system, or product. To incorporate temporal aspects, more intricate solutions can be devised, such as representing duration through arrow thickness or labels.
Secondly, both pillars of the matrix (the Acatech level and TRL) are non-mainstream, requiring the alignment and clarification of terminology, especially when introducing them to stakeholders, particularly SMEs. While this may initially pose a challenge to immediate comprehension, it serves the purpose of fostering a shared understanding and establishing a common language. It also helps in setting expectations for deliverables, products, and prototypes, thus avoiding misalignments between different stakeholders’ expectations.
Then, in its initial design, our tool focuses on SMEs, particularly those facing resource constraints and operating with a fragmented digital infrastructure. As a result, the methodology may not directly capture the full complexity of digital transformation processes in larger or more diversified organizations. However, the tool is inherently modular and can be adapted to broader contexts. Organizations may calibrate the matrix by adjusting TRL benchmarks to align with industry-specific technology cycles and defining KPIs that reflect the strategic objectives and operational realities of the organization. At the same time, while the proposed tool offers a structured approach to aligning technological and organizational readiness, its application across diverse industrial sectors requires careful contextualization. The Technology Readiness Level (TRL) framework, originally developed for aerospace and defense, assumes a linear and well-documented progression of technological development. In sectors with more iterative or emergent innovation cycles—such as creative industries, agriculture, or low-tech manufacturing—some TRL stages may be less distinct or harder to quantify. Similarly, the Acatech study provides a generic model of digital transformation that may not fully capture sector-specific dynamics, such as the regulatory rigidity in pharmaceuticals, high customization in job shop manufacturing, or the prevalence of legacy systems in traditional industries. The interpretation of readiness thresholds (e.g., minimum levels of connectivity or concept formulation) may therefore need to be adjusted depending on the baseline digital infrastructure, workforce capabilities, and innovation culture of the specific sector. Furthermore, the KPIs associated with each axis of the matrix should be tailored to reflect industry-relevant metrics and benchmarks to ensure a meaningful assessment. However, we believe that these limitations do not undermine the framework’s value. Instead, they highlight the importance of adapting it thoughtfully to the specific size and operational context of each domain.
Moreover, while our matrix provides structured guidance for evaluating technological maturity and digital readiness, we recognize that its successful implementation also depends on external organizational factors. These include the level of employee engagement, resistance to change, the adaptability of existing business processes, and the presence of leadership support. Although these variables fall outside the immediate scope of the matrix, they can significantly influence outcomes.
Lastly, the diagrams used in roadmapping activities may appear nested or complex, which may seem illogical upon first examination. However, this complexity is necessary because it is often revealed that the initial assumptions that push a company to work on a specific block of the matrix are not entirely accurate. This awareness necessitates a re-evaluation by either adjusting the TRL (in the case of immature technology) or revising the Acatech level of the initial solution, for example, if the available data are insufficient, unstructured, etc.
5.2. Future Work
The methodology applied and successfully validated in the current study, through engagement with various companies, promptly identified emerging needs that these companies requested us to integrate. Among the most noteworthy requests are those related to expanding the existing tool by incorporating elements aligned with the principles of the new Industry 5.0 paradigm. Despite the seemingly natural and linear nature of such integration, the twin transition introduces a new axis that is nearly orthogonal to the previous ones, thereby complicating both the mapping and explanation processes. While acknowledging the importance of considering this perspective, the authors are not inclined towards a three-dimensional roadmap. Instead, they are contemplating presenting distinct two-dimensional projections derived from a comprehensive 3D roadmap. This approach aims to focus independently on separate pairs within the three aspects of technology, digitalization, and sustainability.
6. Conclusions
The digitalization of the enterprise operations, processes, and physical assets is a complex undertaking that needs the specific deployment of resources and application of a dedicated methodology. Based on the European Commission’s Technology Readiness Level (TRL) and the Acatech Maturity Index (MI), a method is proposed in this work that includes technology roadmapping, research, and innovation within the company. The orthogonality of the TRL and MI dimensions was demonstrated by text mining analysis, indicating that a successful implementation entails incremental steps either in one direction (e.g., an increase in the TRL) or the other (e.g., an increase in digital maturity). The use of both frameworks and their integrated application across the entire organization is key in order to set a common direction for all employees, create a common innovation and digitalization strategy, and facilitate communication among different teams in different departments. When the company digitalization needs research-intensive activities and projects carried out in the context of public–private partnerships (PPPs), the presented TRL-MI framework facilitates communication between universities, research centers and enterprises. Despite the challenges and inherent complexity of a thorough application of the methodology, the presented case studies indicates that the framework brings substantial advantages in terms of effectively increasing the technology readiness and digital maturity of the company as a whole.


