Article

Formation of a Freezing Wall Around a Vertical Shaft Under Localized Freezing

1
School of Mechanics and Civil Engineering, China University of Mining and Technology, Xuzhou 221116, China
2
State Key Laboratory of Intelligent Construction and Healthy Operation and Maintenance in Deep Undergroud Engineering, China University of Mining and Technology, Xuzhou 221116, China
3
Nanjing Jianye Civicism Construction Co., Ltd., Nanjing 210000, China
4
YunLong Lake Laboratory of Deep Underground Science and Engineering, Xuzhou 221116, China
5
Zhejiang Huadong Geotechnical Investigation & Design Institute Co., Ltd., Hangzhou 310023, China
*
Author to whom correspondence should be addressed.
Appl. Sci. 2025, 15(13), 7144; https://doi.org/10.3390/app15137144
Submission received: 6 May 2025 / Revised: 14 June 2025 / Accepted: 19 June 2025 / Published: 25 June 2025
(This article belongs to the Section Civil Engineering)
Editorial Note: Due to an editorial processing error, this article was incorrectly included within the Special Issue Effects of Temperature on Geotechnical Engineering upon publication. This article was removed from this Special Issue’s webpage on 14 July 2025 but remains within the regular issue in which it was originally published. The editorial office confirms that this article adhered to MDPI's standard editorial process (https://www.mdpi.com/editorial_process).

Abstract

A localized freezing technique was proposed as an auxiliary method for retrofitting the lining of a vertical shaft. The influence of the freezing temperature, lining thickness, slot height, and slot duration on the evolution of the freezing wall in the clay layer was analyzed using a hydro-thermal numerical model. Under the baseline conditions (stratum temperature of 24 °C, shaft lining thickness of 2 m, and freezing temperature of −30 °C), the freezing wall behind the slotting zone was 0.74 m at 90 d, 1.89 m at 180 d, 2.78 m at 270 d, and 3.48 m at 360 d. The average growth rate of the freezing wall during one year was negatively linearly correlated with the freezing temperature and the shaft lining thickness, with change rates of −0.00033 m/(d∙°C) and −0.00262 m/(d∙m), respectively. Using the thickness of the freezing wall behind the slotting zone to reach 1.2 m as the slotting criterion, a freezing duration of 123 days is required under typical operational parameters. The evolution of the freezing wall was simulated for a slotting duration of 15 d with a slot height of 0.5–2.0 m and for a slot height of 1.5 m with a slotting duration of 5–20 d. The freezing walls did not melt in both schemes and expanded outward. The research findings are significant for improving freezing methods for shaft linings.

1. Introduction

Since 1987, nearly 150 shafts constructed by using the freezing method in coal, metal, and chemical mines across eastern, central, northeastern, and northwestern China have suffered from shaft lining cracks due to soil settlement [1,2]. The main manifestations include horizontal circular compression cracks in the soil layer and the underlying weathered rock layer [3], large-scale spalling of concrete, and inward bending of longitudinal reinforcing steel, often accompanied by water leakage (Figure 1a) [4,5]. In severe cases, sand inrushes and mud bursts have occurred at the cracked sections of the shaft lining (Figure 1b), posing significant safety hazards [6].
The vertical shaft serves as a critical pathway for deep resource extraction [7,8], and the disaster of shaft lining cracks has not only resulted in significant economic losses but also significantly weakened the load-bearing and water-sealing capabilities of the shaft lining [9,10,11]. For operational shafts constructed by using artificial ground freezing (AGF), the method of structure retrofitting is usually used to prevent and treat shaft lining disasters [11,12]. And the freezing method is primarily used as an auxiliary construction technique for treating shaft lining disasters in vertical shafts [13,14,15]. In recent years, research on the freezing method has mainly focused on the application of freezing holes to circulate cold liquid to obtain freezing curtains and the derived studies on the formation laws of the frozen wall [16,17]. Sanger and Sayles pointed out that the cooling loss caused by the temperature drop in the unfrozen soil outside the frozen soil accounts for approximately 20–30% of the total cooling capacity, which should be considered when calculating the total required cooling capacity [18,19]. Their study divided the temperature field development process of a single-row freezing pipe into two stages: the first stage involves the freezing wall expanding around individual freezing pipes, during which the freezing temperature develops logarithmically; the second stage occurs after the freezing wall intersection, where the temperature in the frozen zone develops linearly, while that in the unfrozen zone continues to follow a logarithmic curve. Yang and Huang conducted extensive numerical calculations and obtained the relationship between the dimensionless heat flux density and parameters such as the Fourier number, the ratio of thermal conductivity between frozen and unfrozen soil, the Kosovich number, and the dimensionless saline water temperature [20]. It was found that the ratio of specific heat between frozen and unfrozen soil is almost irrelevant to the heat flux density. A dimensionless criterion equation for the single-pipe heat flux density was derived. Hu and Jiang et al. [21] used numerical analysis to study the development and distribution patterns of frozen walls under different spacing backgrounds. The research results showed that the temperature of frozen walls decreased with the decrease in spacing between frozen pipes, and the frozen walls became more uniform. As the distance between the freezing pipes increases, the time for the freezing walls to intersect increases linearly; the temperature of the freezing walls decreases with the decrease in the distance between the freezing pipes, and the strength of the freezing walls becomes more uniform. Despite decades of significant advancements in AGF technology, the freezing method employed for shaft lining retrofitting has seen little innovation, and the conventional approach of drilling freeze pipes around the shaft to establish frozen walls remains the standard practice.
Due to the principal limitation of the freezing method by circulating freezing fluid through buried freezing pipes around the vertical shaft, it is difficult for the freezing wall to fully adhere to the shaft lining under external freezing conditions [22]. Therefore, the external freezing method typically employs full-depth freezing to eliminate the risk of water-conducting channels persistently existing between the shaft lining and the freezing wall [23]. However, the external full-depth freezing method has numerous drawbacks. Firstly, it is expensive. To protect the shaft lining, the distance between the freezing holes and the shaft must be increased, leading to an enlargement of the freezing circle’s diameter and a surge in the number of freezing holes/pipes [24,25]. Coupled with full-depth freezing, the construction cost of the external freezing method is extremely high. Taking the shaft lining failure remediation project at the main shaft of Chensilou Coal Mine in China as an example, the freezing cost alone exceeded RMB 36 million [22]. Secondly, the construction process is cumbersome. Before active freezing, steps such as “hole selection, drilling, pipe insertion, and pipe fixation” need to be carried out for external full-depth freezing [26,27]. Additionally, selecting the locations for external freezing holes is challenging. The cracked shafts in deep overburden are often old or existing shafts with complete surrounding facilities, leading to conflicts between the designed positions of the freezing holes and existing structures [28]. To address this issue, buildings may have to be demolished, freezing holes might need to be expanded, the number of freezing holes could have to be increased, or even “S”-shaped directional holes may need to be drilled [29], further causing a sharp rise in project costs.
In response to the cumbersome construction process and high costs associated with the external full-depth freezing method for creating a freezing curtain during vertical shaft repair, this paper innovatively proposes a localized freezing technique on the inner periphery of vertical shafts, and the influence of freezing temperature, lining thickness, slot height, and slot duration on the evolution of freezing walls in clay layers is analyzed based on a hydro-thermal coupled numerical model in COMSOL 6.0. The research findings hold significant scientific and engineering importance for the innovation of manufacturing methods for artificial freezing curtains around deep vertical shafts.

2. Technology of Shaft Lining Localized Freezing

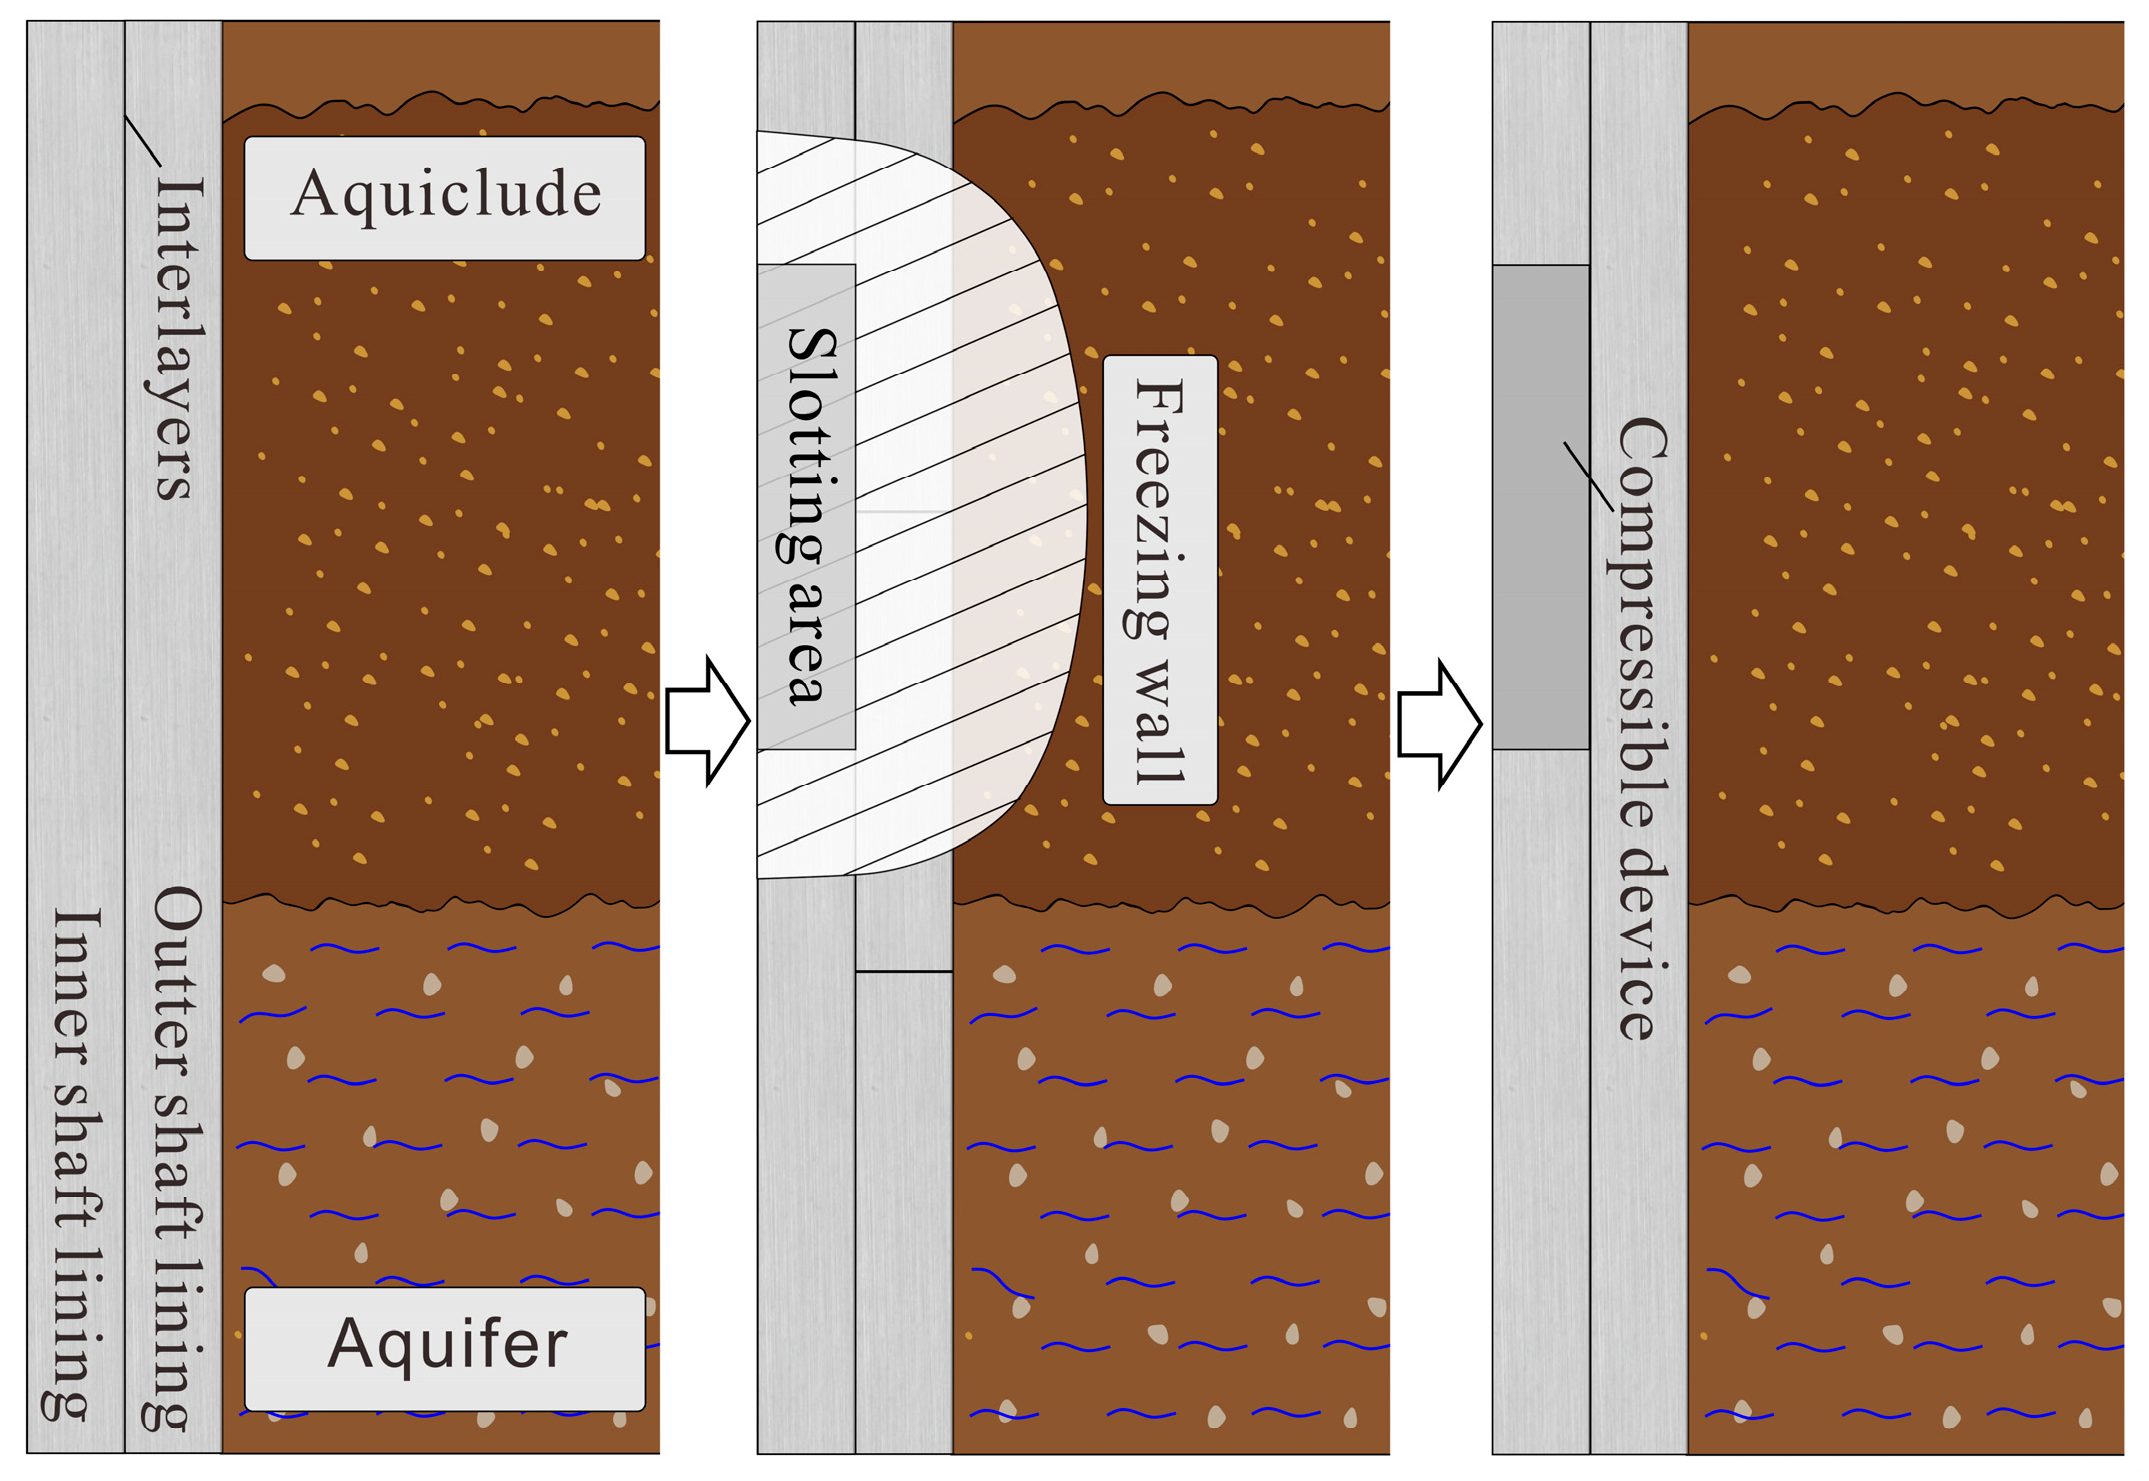
At present, freezing shafts in the deep soil layer are mainly double-layer composite shafts constructed with cast in situ reinforced concrete, and the shafts are mainly composed of the outer lining, the inner lining, and plastic plate interlayers between the inner and outer linings [25,27]. The inner lining serves as a permanent water-sealing and load-bearing structure [30], while the outer lining primarily functions as a temporary support and is not required to seal water. Therefore, ensuring the safety of the inner lining is of utmost importance. For the double-layer composite shaft lining, the method of retrofitting the structure is usually used to manage shaft lining disasters [31]. Firstly, it is necessary to determine the location of the compressible devices based on geological data and place it as much as possible in the aquitard represented by the clay layer (Figure 2) [32]. Then, proceed with the three steps of “slotting the inner shaft lining, installing the compressible devices, and repouring the concrete around the compressible devices”. Although the clay layer has a good waterproof effect, previous practical experience has shown that there are still risks of water inrush and sand collapse during the process of breaking the inner shaft lining and installing the compressible devices. In order to minimize risks during construction, it is necessary to use the freezing method to freeze and seal the cracks in the shaft linings and the strata near the slotting area.
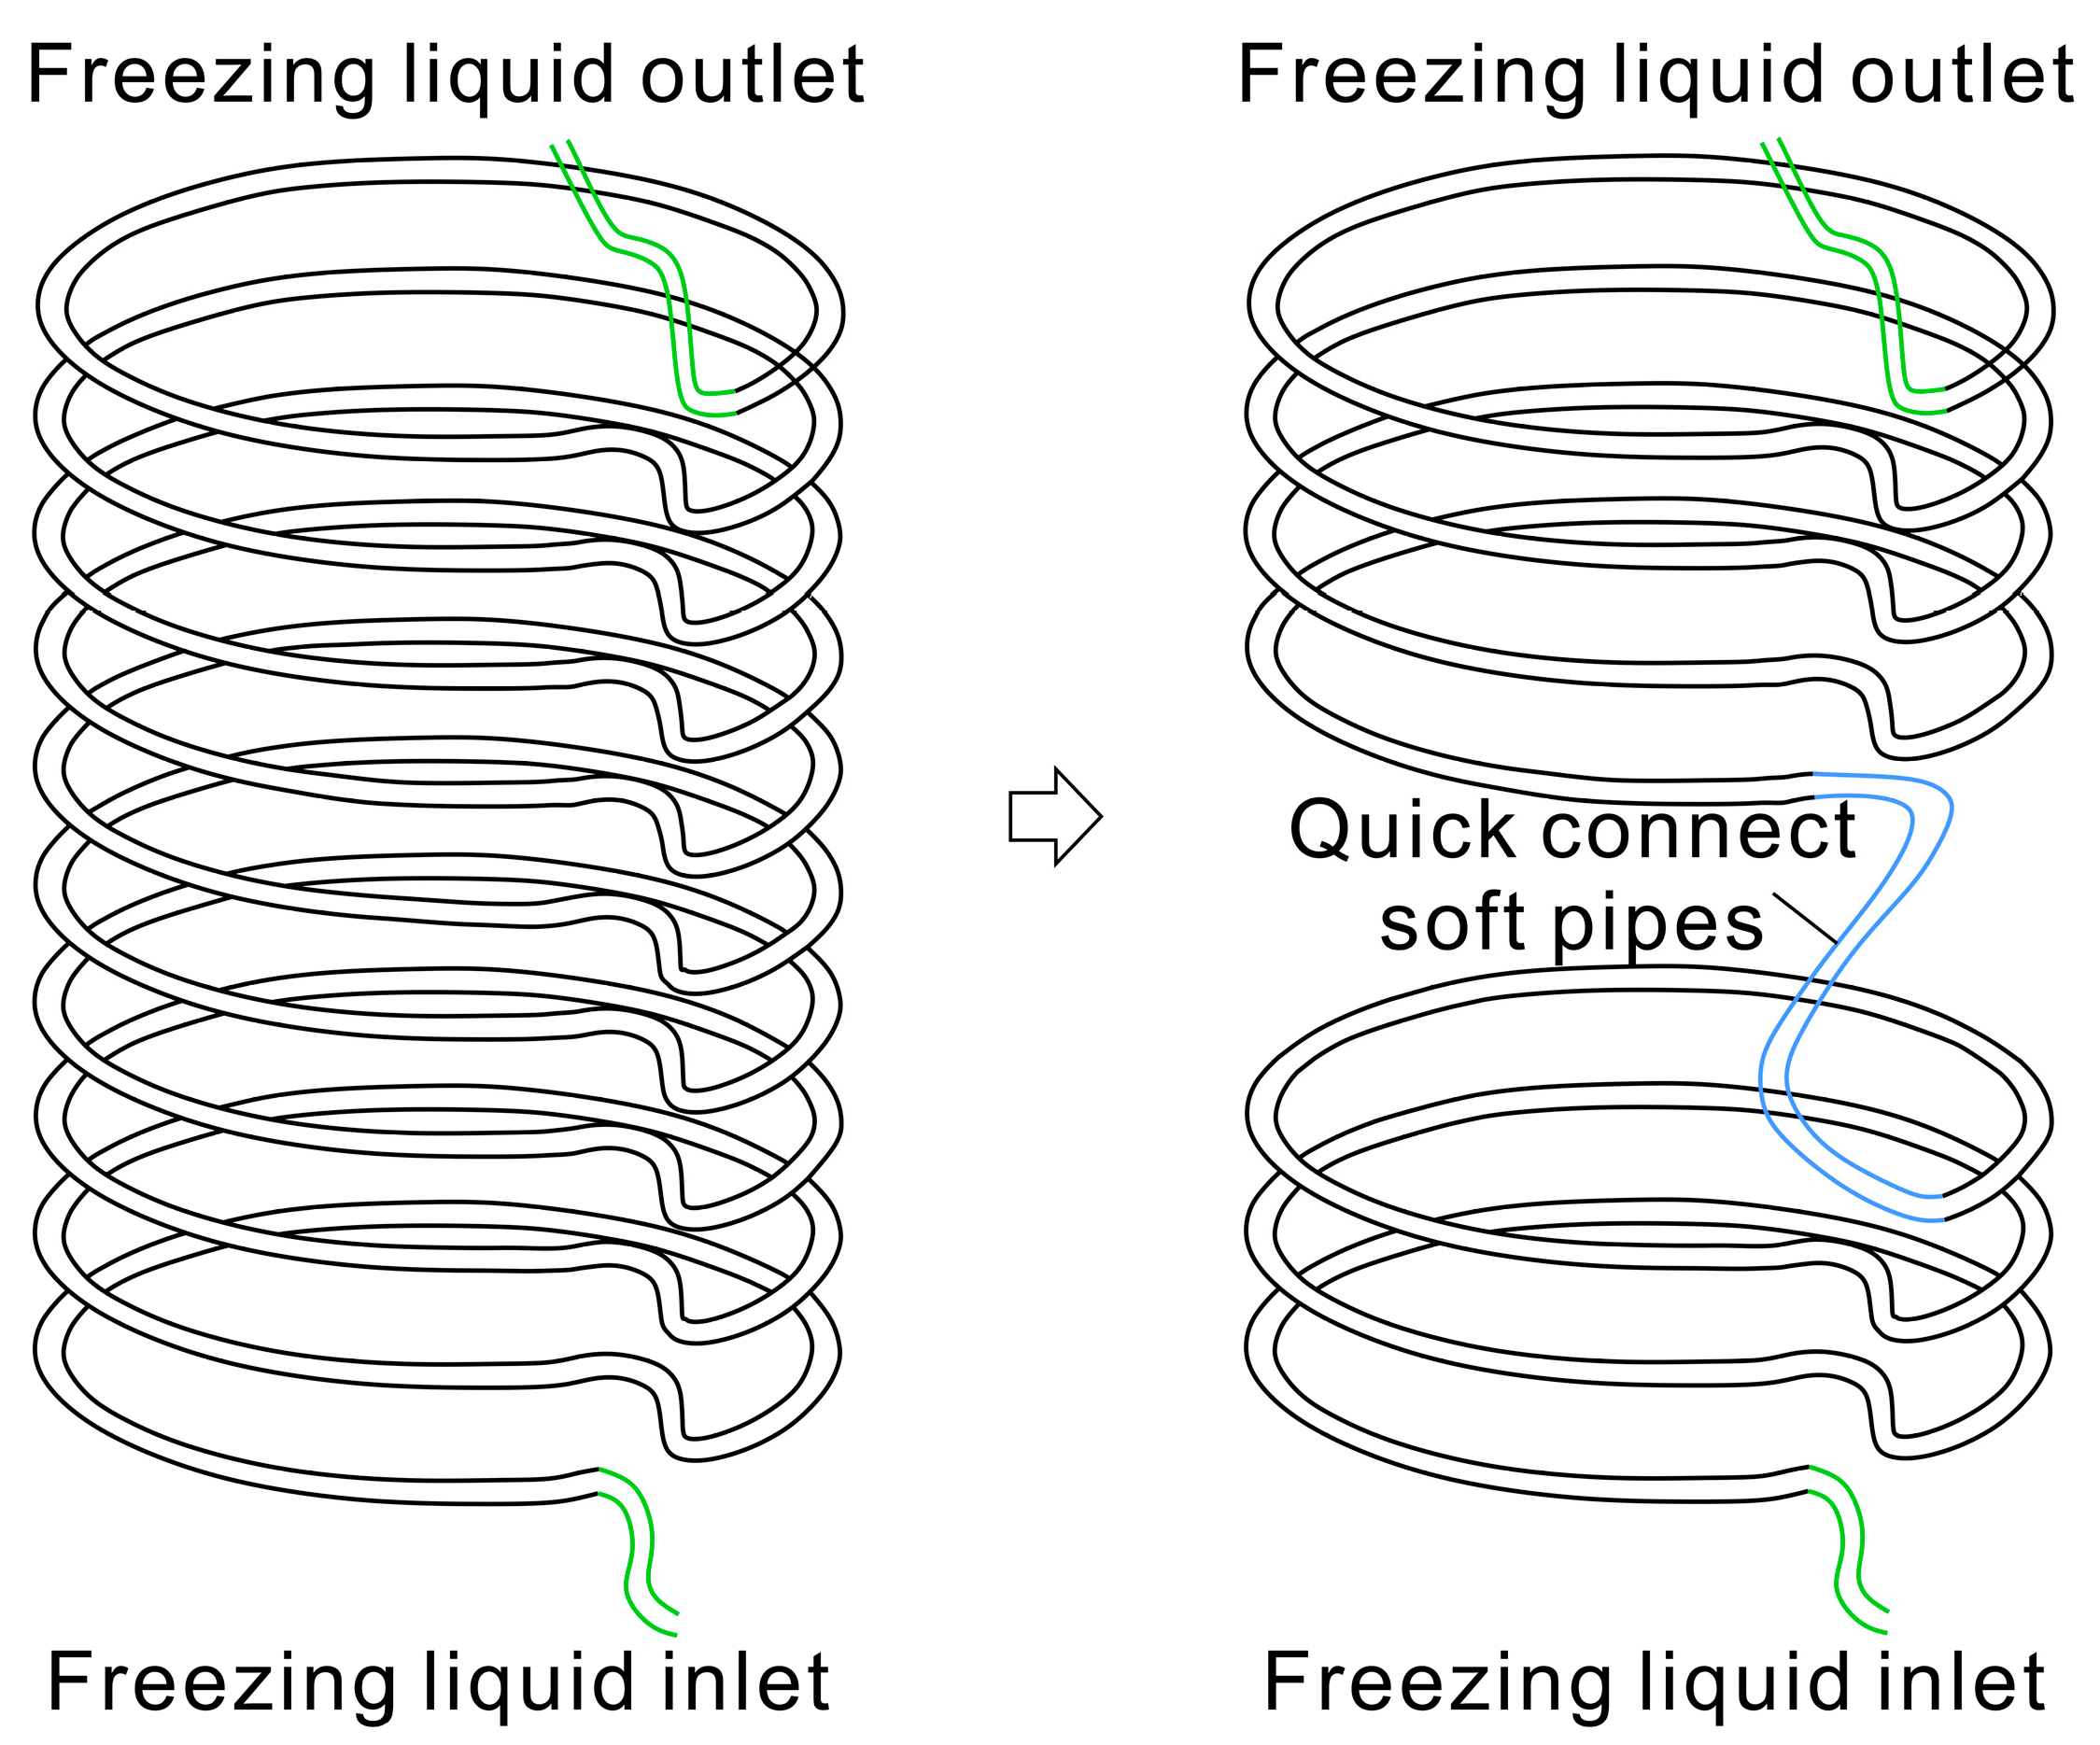
The shaft lining localized freezing method refers to the freezing process carried out by arranging layered and detachable circumferential freezing pipes at the inner periphery of the inner shaft lining, and the freezing area covers the proposed slotted area and a certain range above and below it. Vertical block detachable freezing pipes can also be selected according to the actual situation on site. Subsequently, thermal conductive adhesive is evenly laid between the freezing pipe and the shaft lining. Through low-temperature freezing pipes, highly thermally conductive adhesive, and insulation layers, the cold gradually transfers to the shaft lining and the outer strata, thereby blocking the water channel inside the concrete shaft lining and forming a freezing curtain in the target clay layer, as shown in Figure 2. As shown in Figure 3, during the structure retrofitting of shaft lining, the freezing pipes and other devices in the proposed slotting zone are removed, and the inner shaft lining is slotted and equipped with compressible devices. The rest of the freezing pipes remain in an active freezing state to prevent the melting of the freezing curtain.
In this study, the thickness of the freezing wall behind the slotting zone reaching 1.2 m was used as the slotting criterion, and it was assumed that the shaft safety crisis can be completely resolved after installing the compressible device. Conservatively, the installation period of the compressible device is uniformly attributed to the shaft lining slotting period, during which it is assumed that the slotting position is completely exposed to the air. In summary, this study focuses on the formation and evolution of freezing walls in clay layers during the “active freezing period” and “slotting period” under the shaft lining localized freezing method.

3. Numerical Methodology

In the freezing model, it is assumed that the strata are uniform, continuous, and isotropic. COMSOL 6.0 is used as a solver to solve the control equations for transient heat transfer and ice–water phase transition.

3.1. Governing Equation

In the numerical calculation of the temperature field, the radiation heat transfer on the soil surface is ignored. Based on the law of energy conservation, the heat conduction process involving the ice–water phase transition is described by the following equations.
C e q T t · K e q T + ρ L θ w t = Q t
θ w = ε p S w
By substituting Equation (2) into Equation (1), the temperature field equation is derived as a function of temperature, as shown in Equation (3).
C e q ρ L ε p S w T T t · K e q T + ρ L S w ε p t = Q t
where the ρ is the density of liquid water (kg·m−3); θ w is the volume fraction of the fluid (-); ε p is the porosity of porous media (-); L is the heat of phase transition between ice and water (kJ·m−3); T is the temperature (°C); Q t is the heat source or sink (W·m−3); C e q is the equivalent volumetric heat capacity (J·m−3·°C−1); K e q is the equivalent thermal conductivity (W·m−1·°C−1); S w is the fluid saturation (-).
S w = S r + ( 1 S r ) F p h t r
F p h t r = e ( T T 0 W ) 2                 ( T < T 0 )         1                                               ( T T 0 )  
where the S r is residual saturation (-); T 0 is the initial temperature (°C); F p h t r is the phase transition function (-); w is the phase transition function parameter (°C).

3.2. Initial and Boundary Conditions

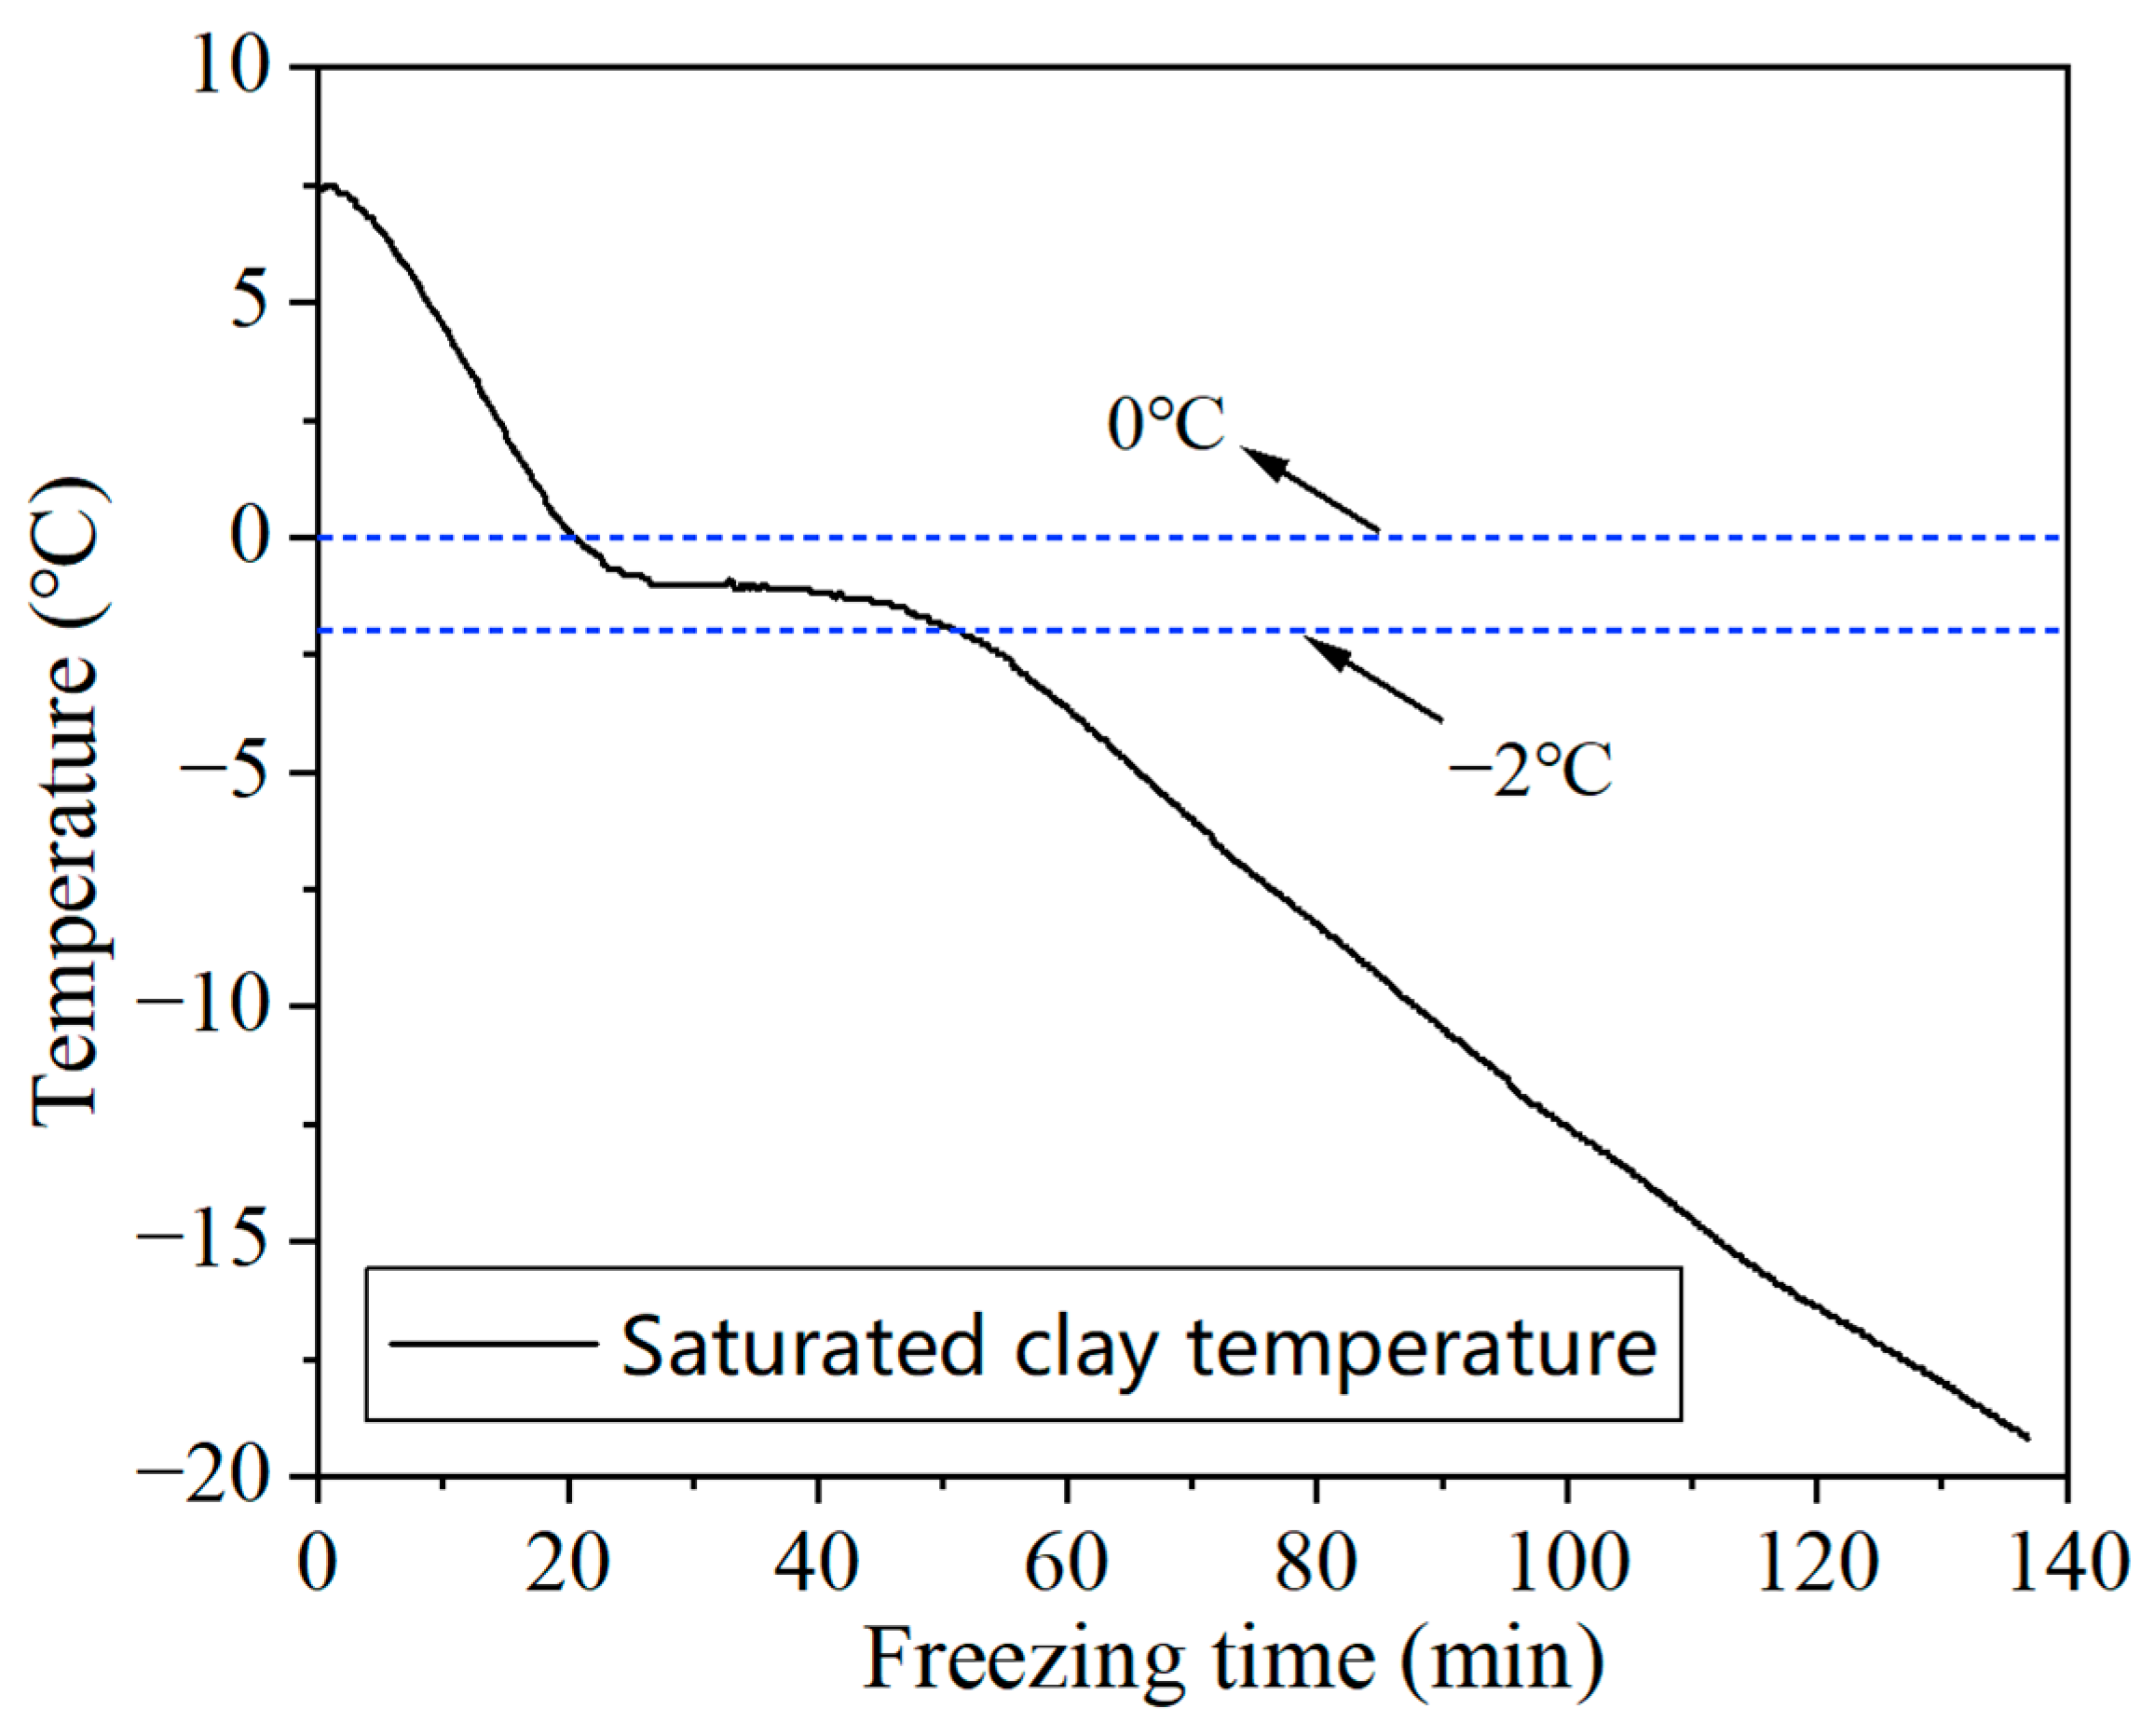
In the model, it assumes that the water in the saturated clay layer is completely static. And during the time period when the shaft lining is slotted but not refilled with concrete, it is assumed that the slotted position is completely exposed to the air. The materials included concrete, polyethylene plastic sheets, clay, air, water, and ice. Typical values of the thermal and physical properties of air, ice, and water were used. The parameters of the remaining materials were obtained from field measurements during the shaft’s construction at depths of 200 m to 600 m in the Longgu coal mine in the Juye mining area, Shandong, China. The parameters are listed in Table 1. The average porosity of the clay was 42.4%. Figure 4 shows the temperature of the saturated clay during freezing obtained from indoor experiments. A conservative value of −2 °C was used as the model’s freezing temperature, and strata with temperatures below −2 °C were considered completely frozen. The value of the phase transition parameter w was 0.4 °C, and the latent heat of the ice–water phase transition was 335 kJ/m−3. The airflow inside the vertical shaft was considered laminar flow, with a velocity of 0.5 m/s.
The thickness of the polyethylene plastic sheet between the inner and outer shaft lining is typically 2 mm. According to the series resistance principle (Equation (6)), the total thermal resistances were calculated for both scenarios with and without a plastic sheet interlayer, and the difference between the total thermal resistances under these two conditions was found to be less than 0.5%. Therefore, the influence of the plastic sheet interlayer on the temperature field has been neglected in subsequent studies.
R = 1 2 π λ c ln d 2 d 1 + 1 2 π λ s ln d 3 d 2 + 1 2 π λ c ln d 4 d 3
where the d 1 is the inner edge radius of the inner shaft lining (m); d 2 is the radius of the outer edge of the inner shaft lining (m); d 3 is the radius of the inner edge of the outer shaft lining (m); d 4 is the outer radius of the outer shaft lining (m); λ c and λ s are the thermal conductivity coefficients of the concrete shaft lining and plastic plate (W·m−1·°C−1), respectively.

3.3. Numerical Simulation Scheme

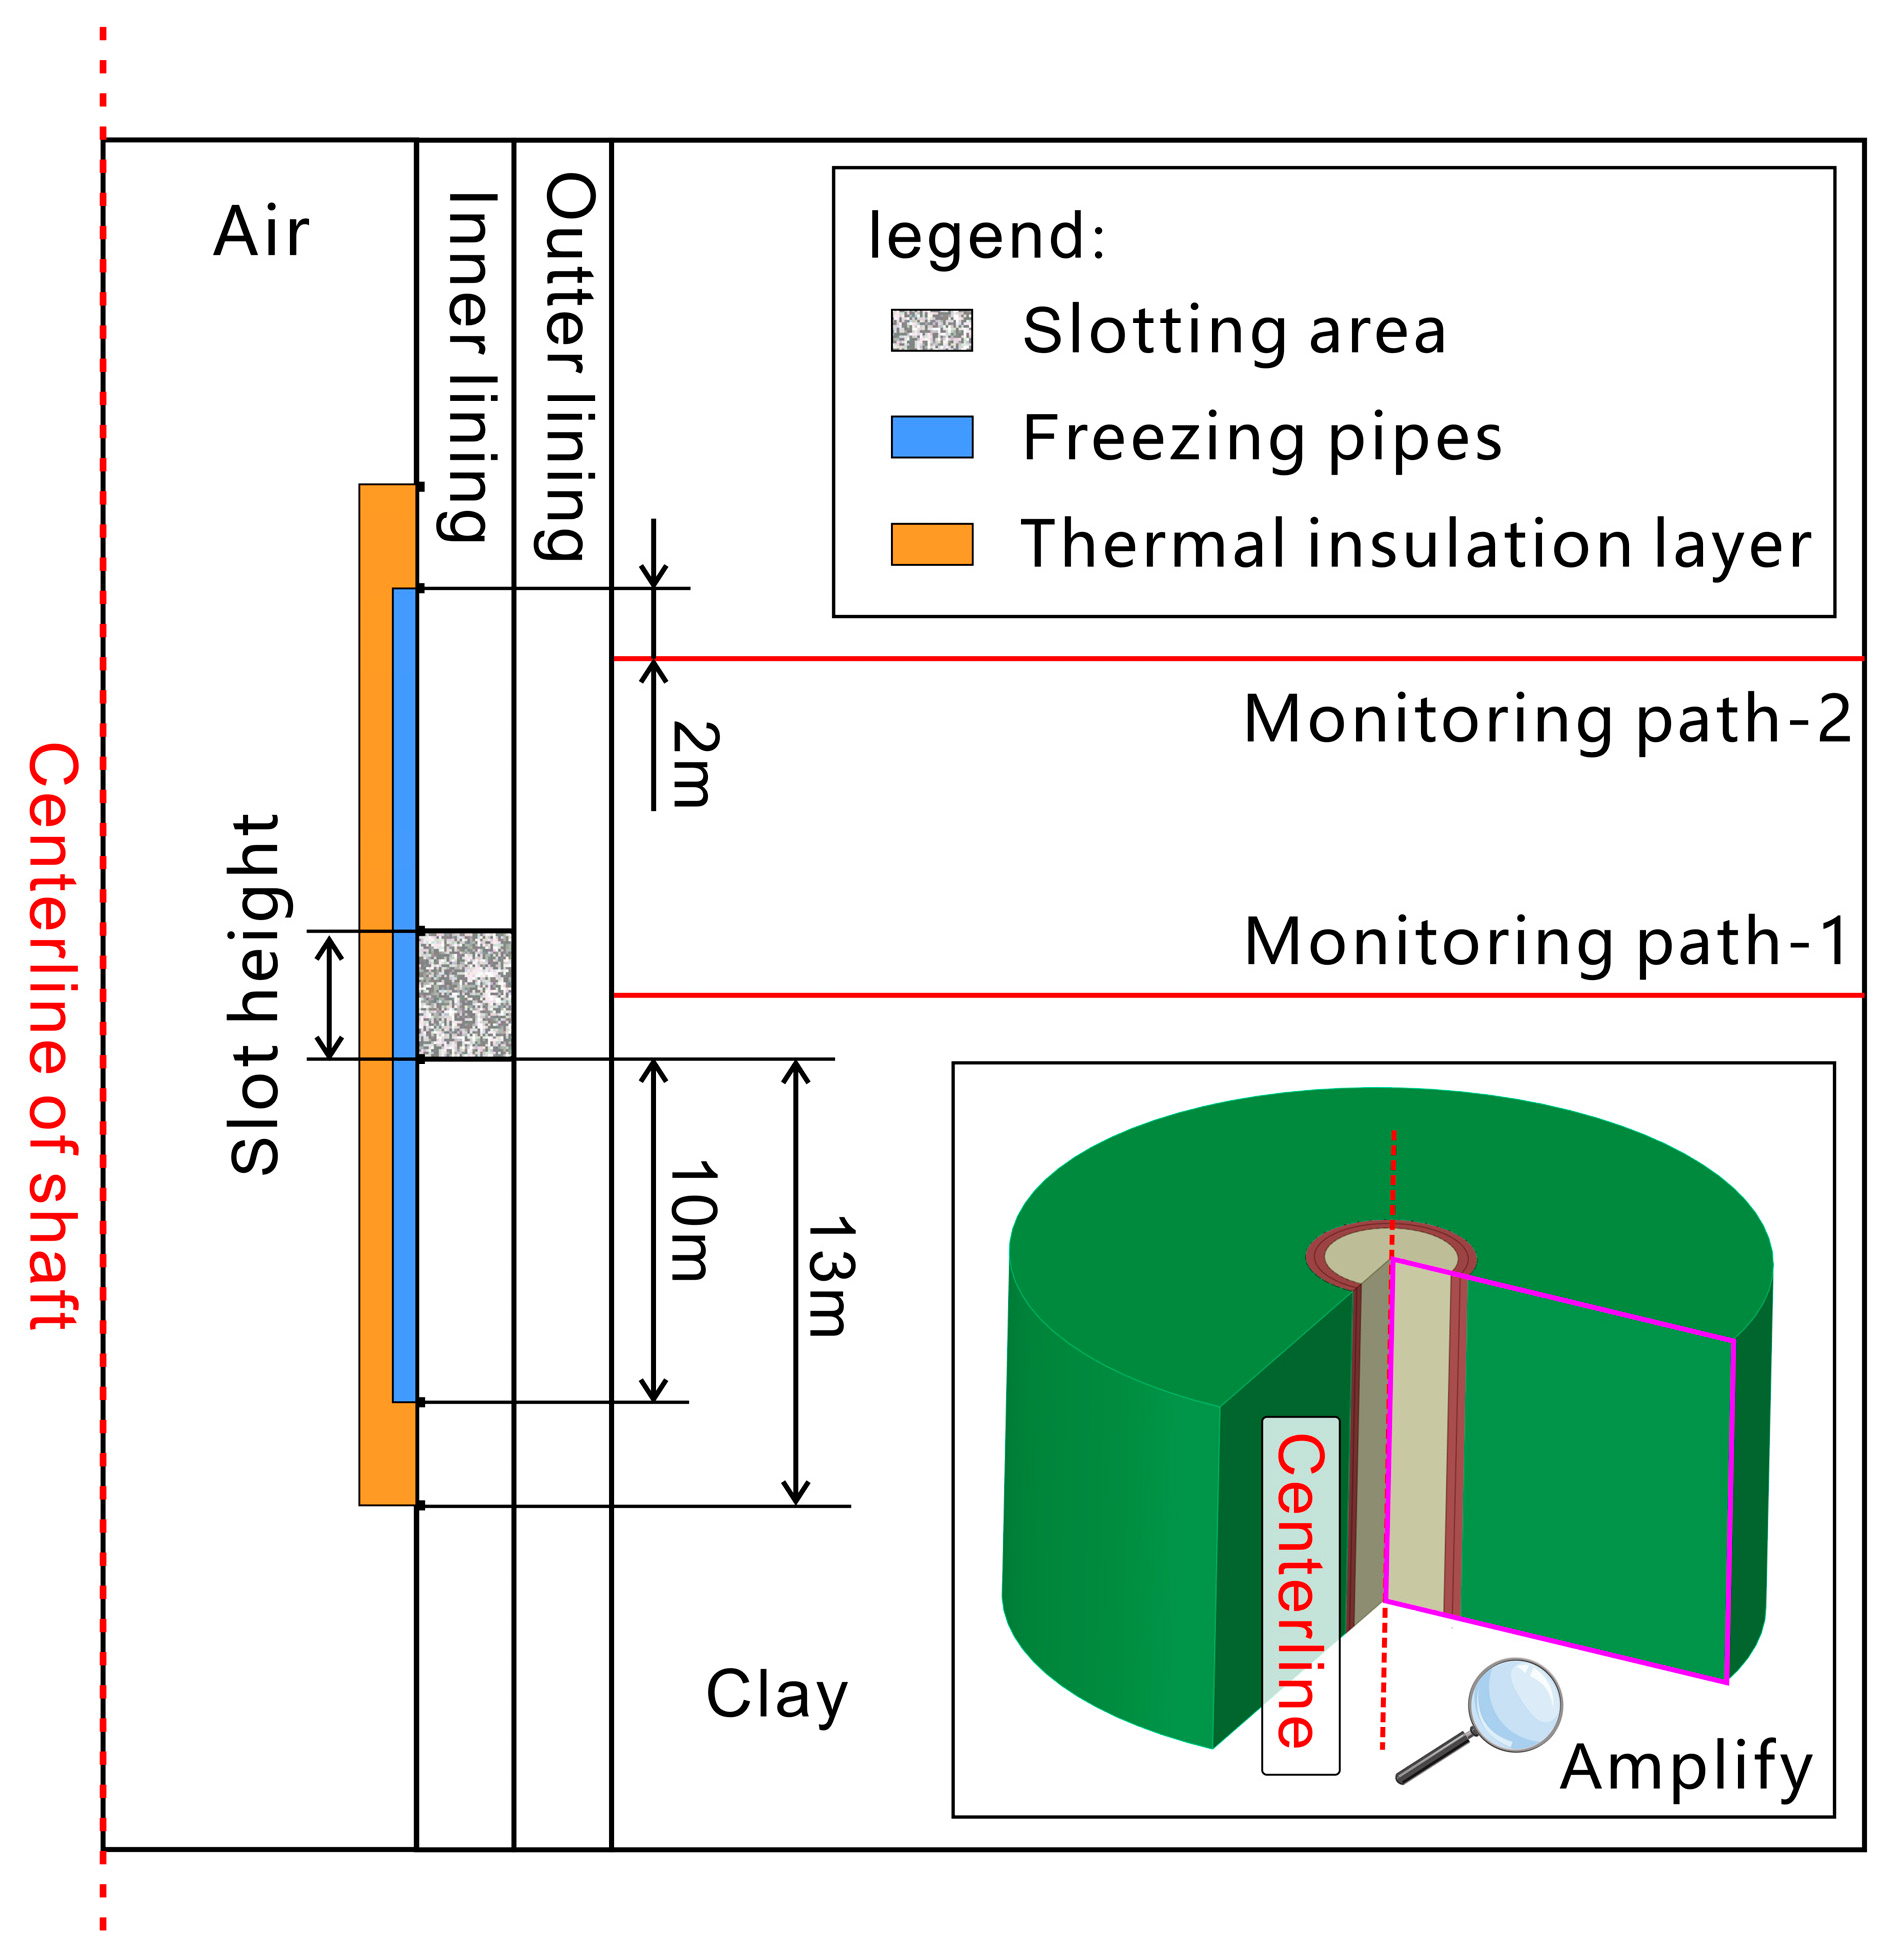
A 3D numerical model was used to calculate the heat transfer in the slotting zone. The model’s dimensions were Φ 100 m × 50 m, and the diameter of the outer edge of the shaft was 9 m. The dimensional parameters of the freezing zone and insulation layer are shown in Figure 5. The boundary between the strata was a constant temperature boundary. MATLAB R2023b and LiveLink [33] were used to simulate the slotting of the shaft lining by replacing the physical properties of concrete in the COMSOL 6.0 numerical model with those of air. The parameter values and ranges were extracted from representative coal mine shafts crossing deep soil layers, such as Longgu and Wanfu [28,29,34] (Table 2). We used representative values to ensure the generalizability of the research results.

3.4. Model Validation

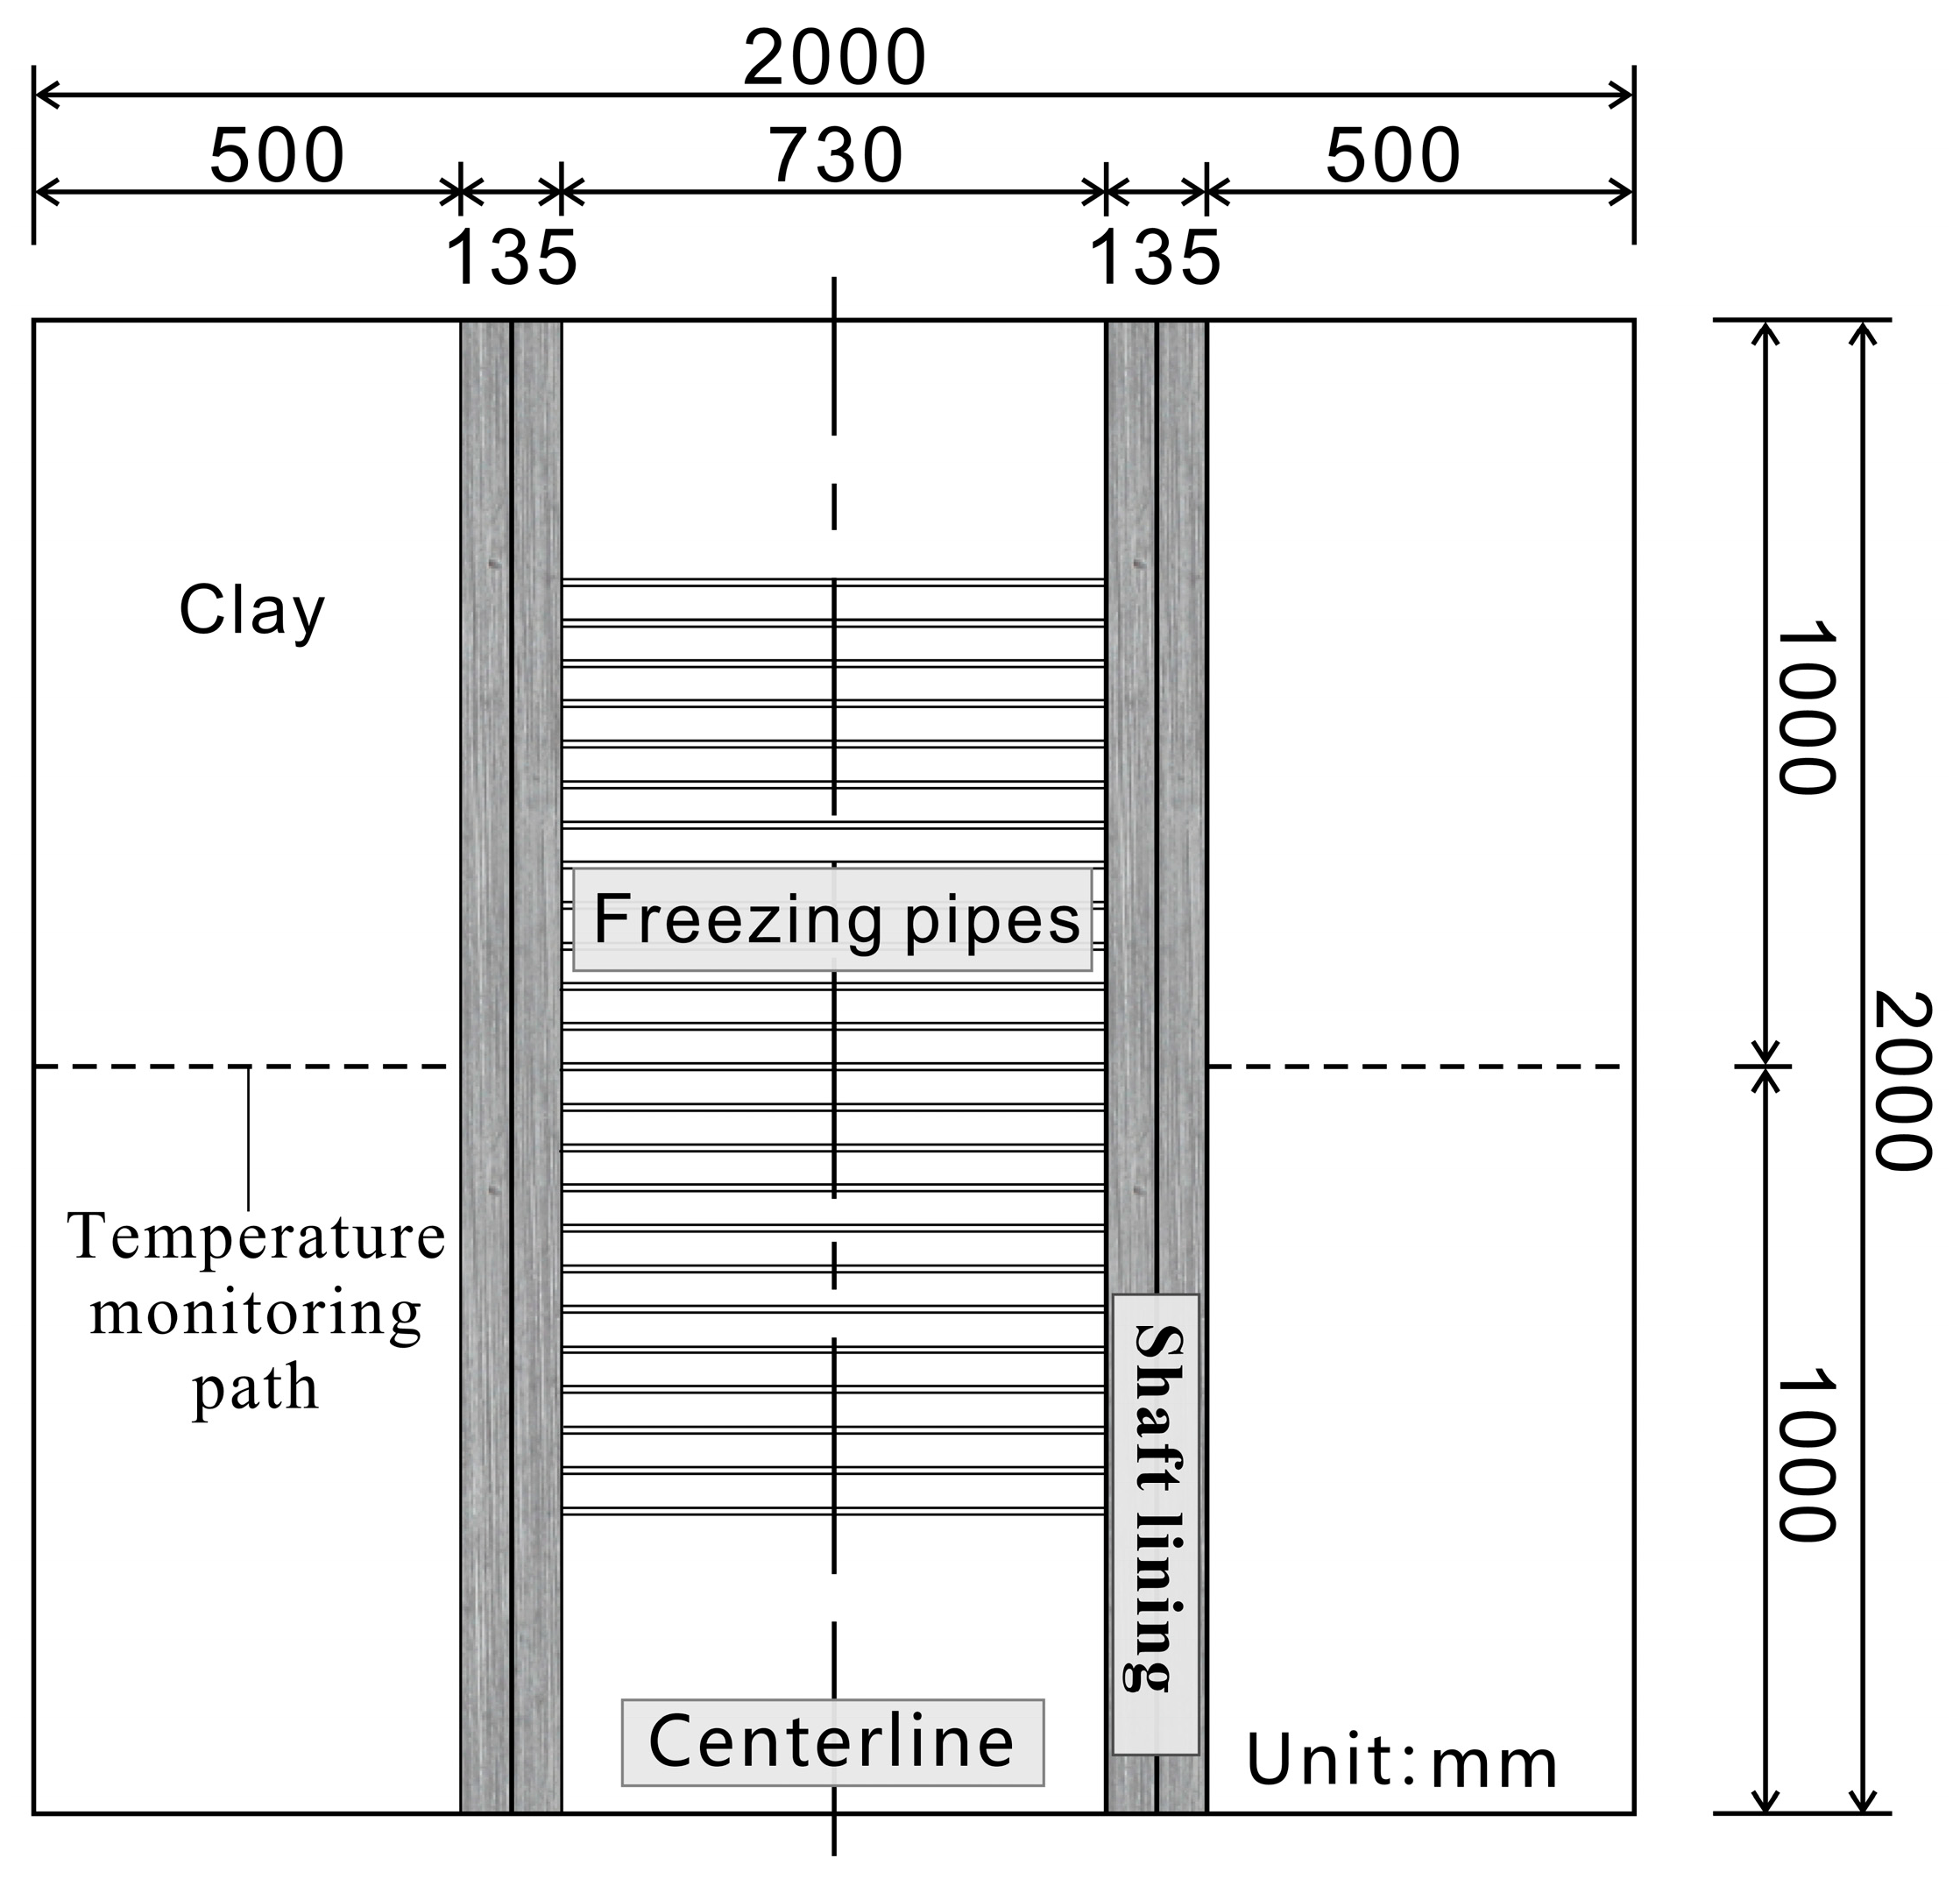
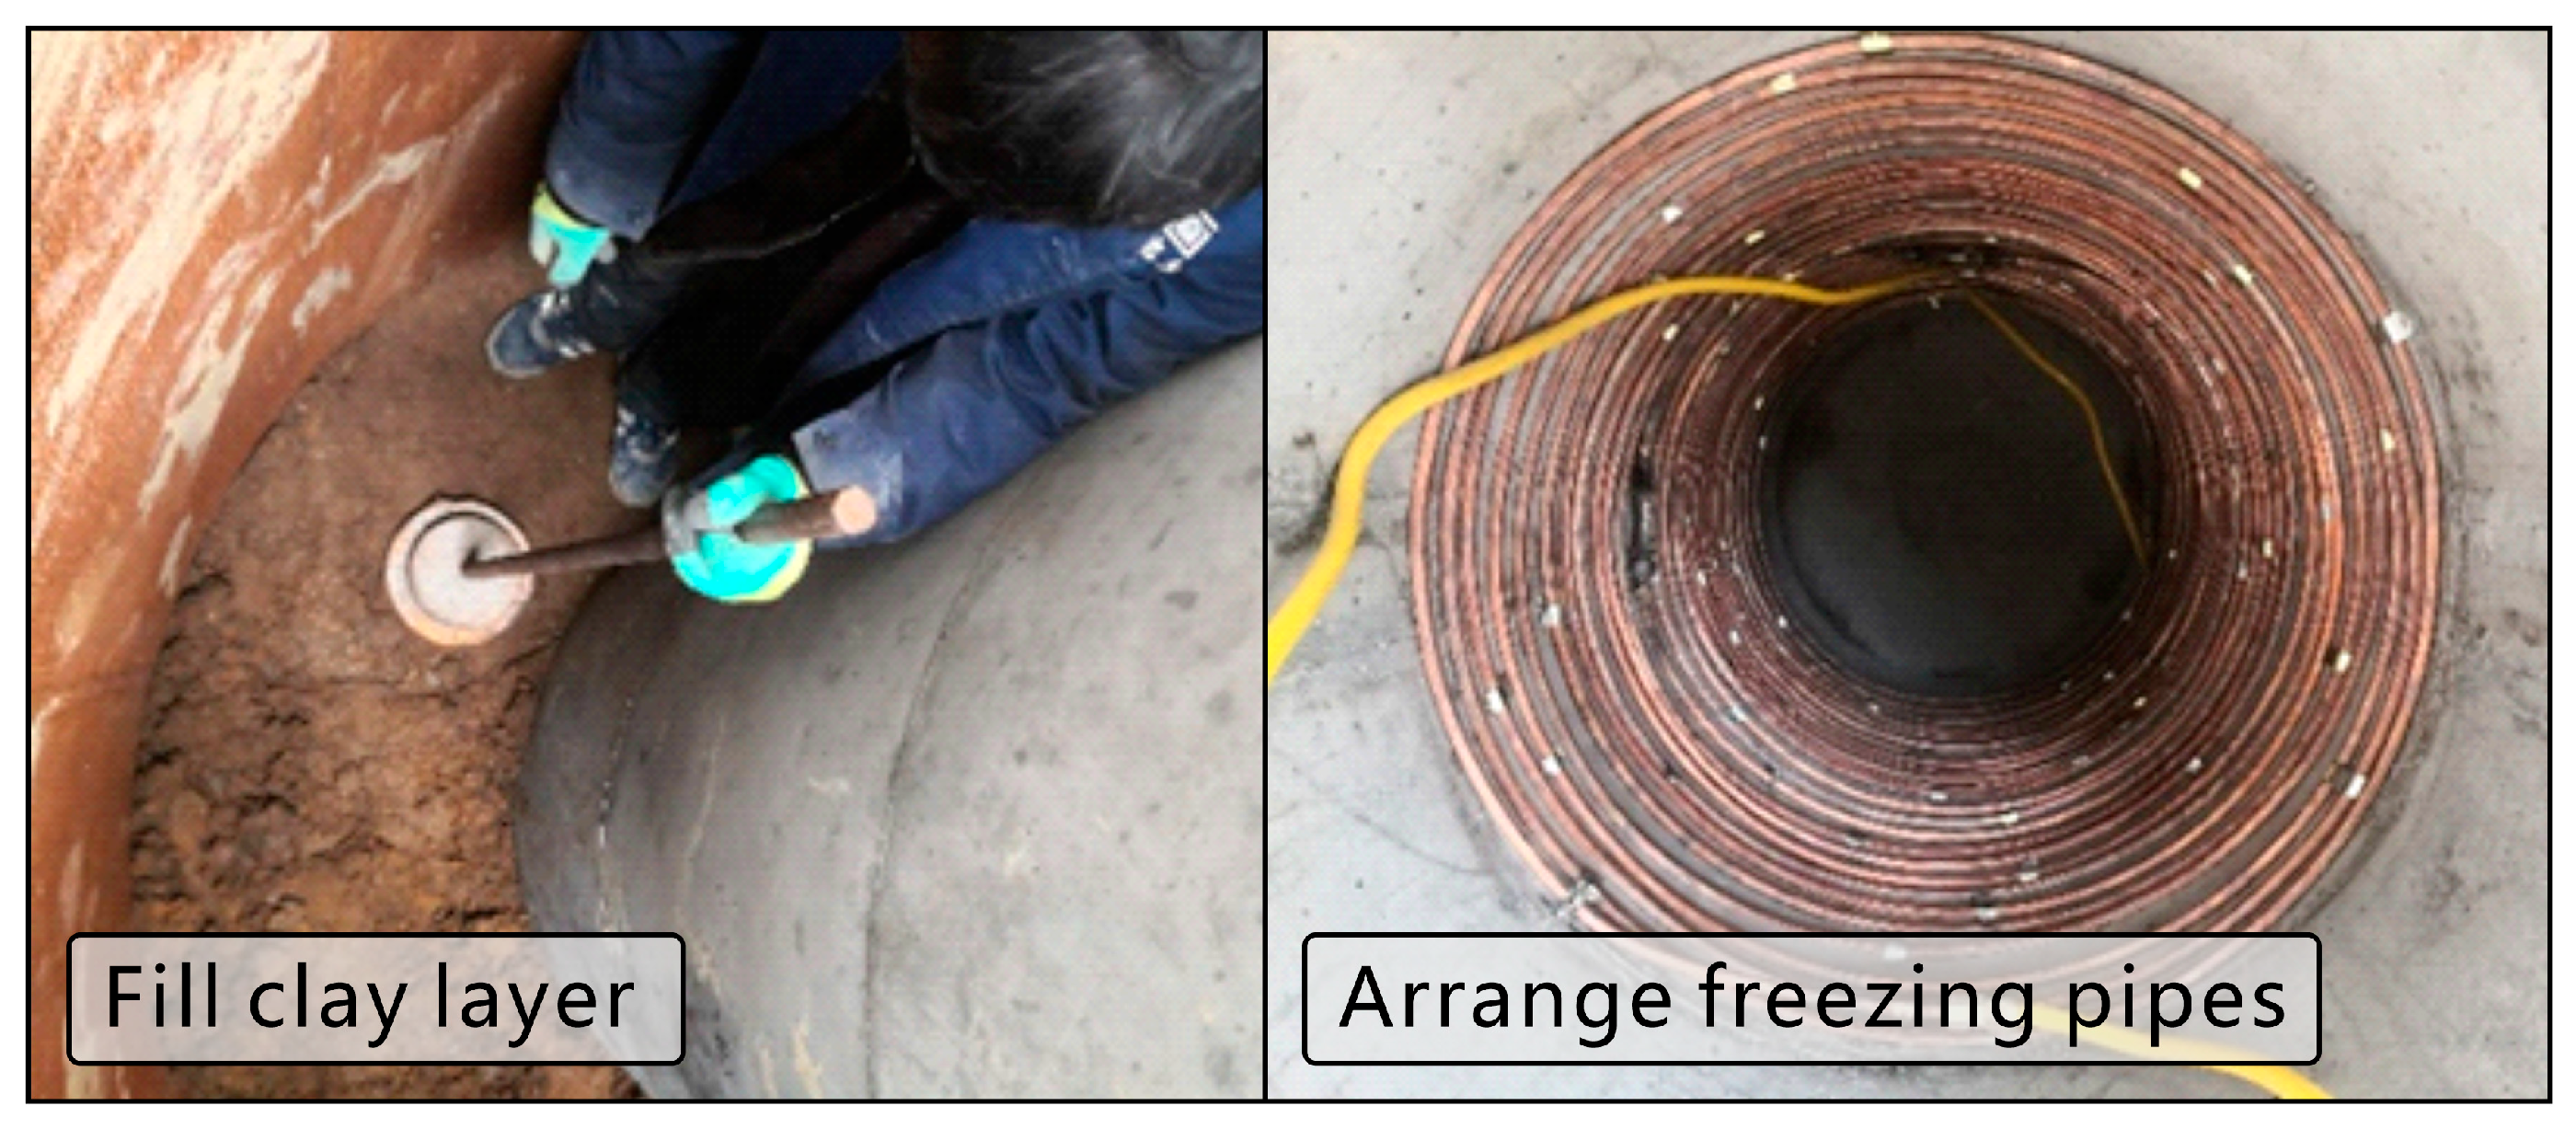
The model and computational method was validated by performing physical simulation experiments before conducting numerical simulations. Due to the size constraints of experimental equipment and the installation requirements of thermal insulation layers within the model, this study adopted a geometric scaling ratio of 9 for the physical model. Consequently, the shaft has an inner diameter of 730 mm, an outer diameter of 1000 mm, and a lining thickness of 135 mm, as shown in Figure 6. In the physical model, the initial ground temperature was 20 °C, and localized freezing was achieved by circulating low-temperature alcohol through square copper tubes with an inlet temperature of −50 °C. A thermally conductive adhesive (WH-800) was utilized to improve heat conduction efficiency, and the ventilation conditions within the shaft were simulated using a blower system. The inner and outer boundaries of the physical model are set as adiabatic boundaries by arranging insulation layers. Photos of the experiments are shown in Figure 7.
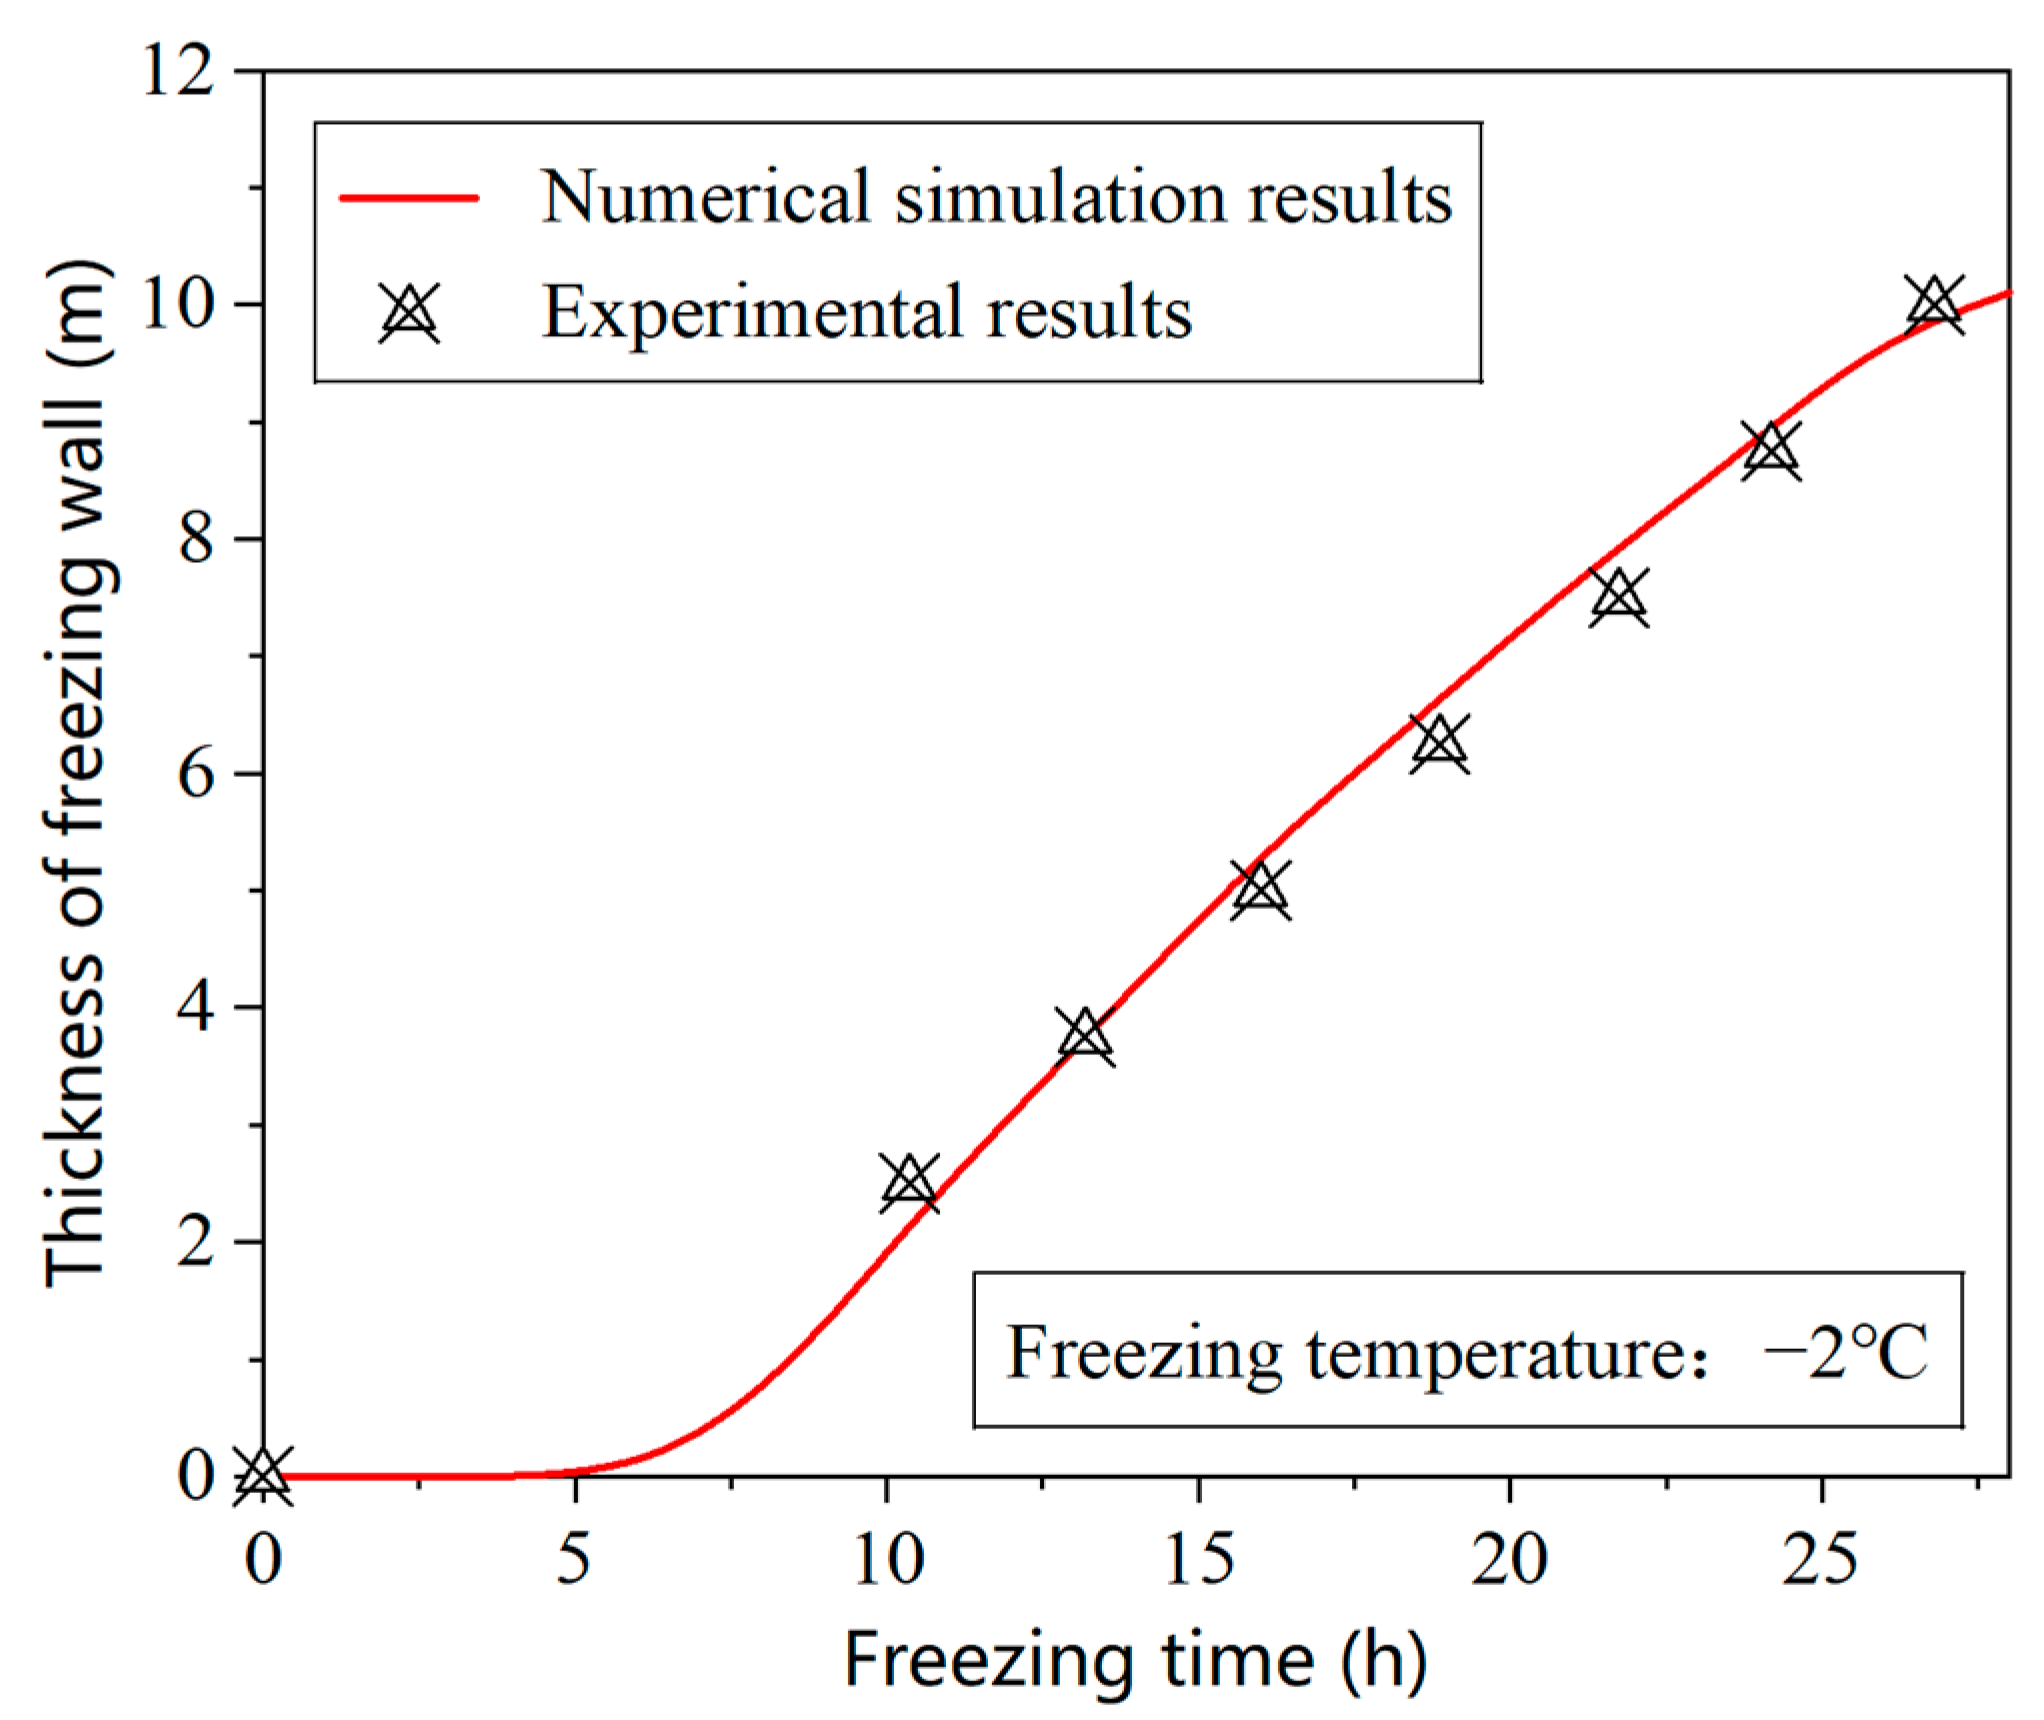
Figure 8 presents the thickness of the freezing wall in the monitoring path behind the slotting zone in the experiment and the numerical simulation. The average relative error is 2.68%, which is below 3%. Therefore, the numerical model and computational methodology are reliable for simulating the evolution of the freezing wall in the clay layer under the shaft lining localized freezing method.

4. Results and Discussion

4.1. Evolution of the Freezing Wall During the Active Freezing Period

4.1.1. Morphology of the Freezing Wall Under Typical Parameters

The temperature field evolution under typical parameters (freezing temperature T f = −30 °C, initial stratum temperature T 0 = 24 °C, and shaft lining thickness H = 2 m) is illustrated in Figure 9. As localized freezing occurs around the shaft lining, a low-temperature zone is formed, and the thermally conductive adhesive extracts heat from the concrete shaft lining and the surrounding strata. Due to the thermal transfer, a freezing front forms and expands into the clay stratum, forming a freezing curtain covering the outer periphery of the shaft lining. The thickness of the freezing wall reaches 1.2 m on the 123rd day, meeting the slotting criteria. The freezing wall expands gradually from the inner to the outer part. This growth pattern provides ample drainage pathways for unfrozen water, preventing the formation of unfrozen water pockets between the freezing wall in the clay and the shaft lining and significantly reducing the risk of frost-heave-induced damage.
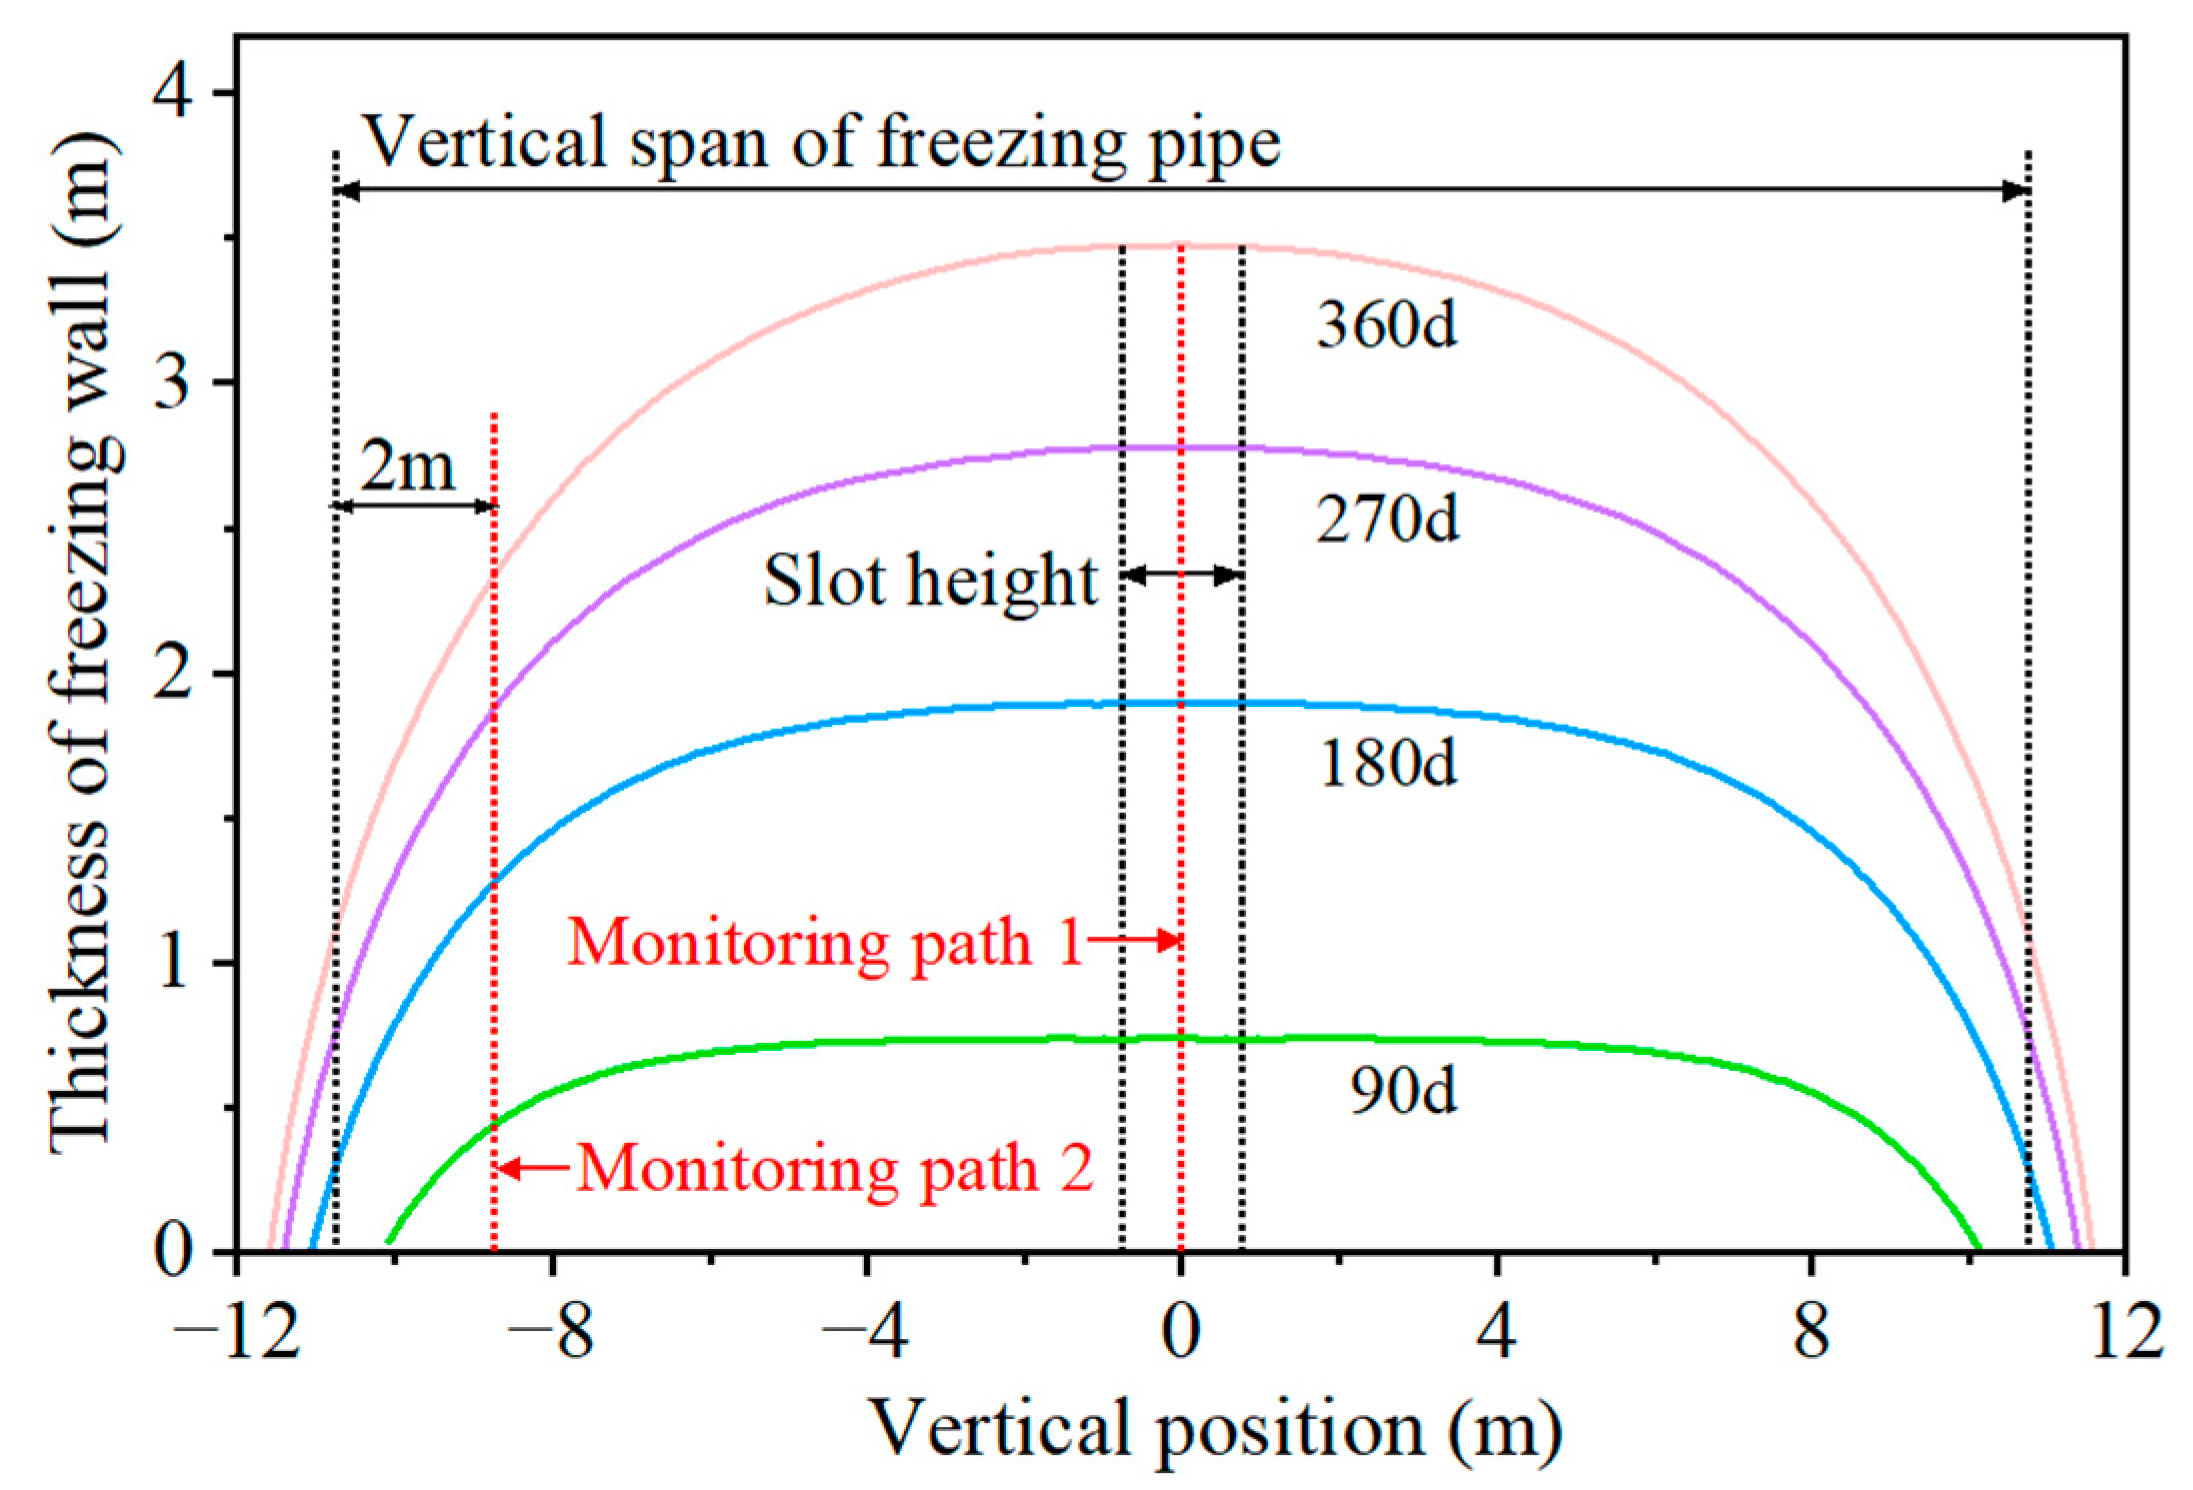
A 90-day (d) monitoring period was adopted in the numerical study. The evolution of the freezing wall thickness is illustrated in Figure 10. During the initial freezing period, the freezing wall had a rounded semi-rectangle shape, with a flat central section and rounded transitions at both ends. As the freezing duration increased, the freezing wall expanded radially. The flat central portion gradually diminished, and the shape changed to an arch. Notably, the vertical span of the freezing wall exceeded the vertical dimension of the freezing pipes after 180 days of freezing when an external thermal insulation layer was applied. Subsequently, we used two monitoring paths to analyze the thickness and temperature distributions of the freezing wall and compare its evolution under different influencing factors. Monitoring Path 1 was positioned at the geometric center of the slotting zone, and Monitoring Path 2 was located 2 m inward from the upper boundary of the freezing pipe array (Figure 5 and Figure 10).
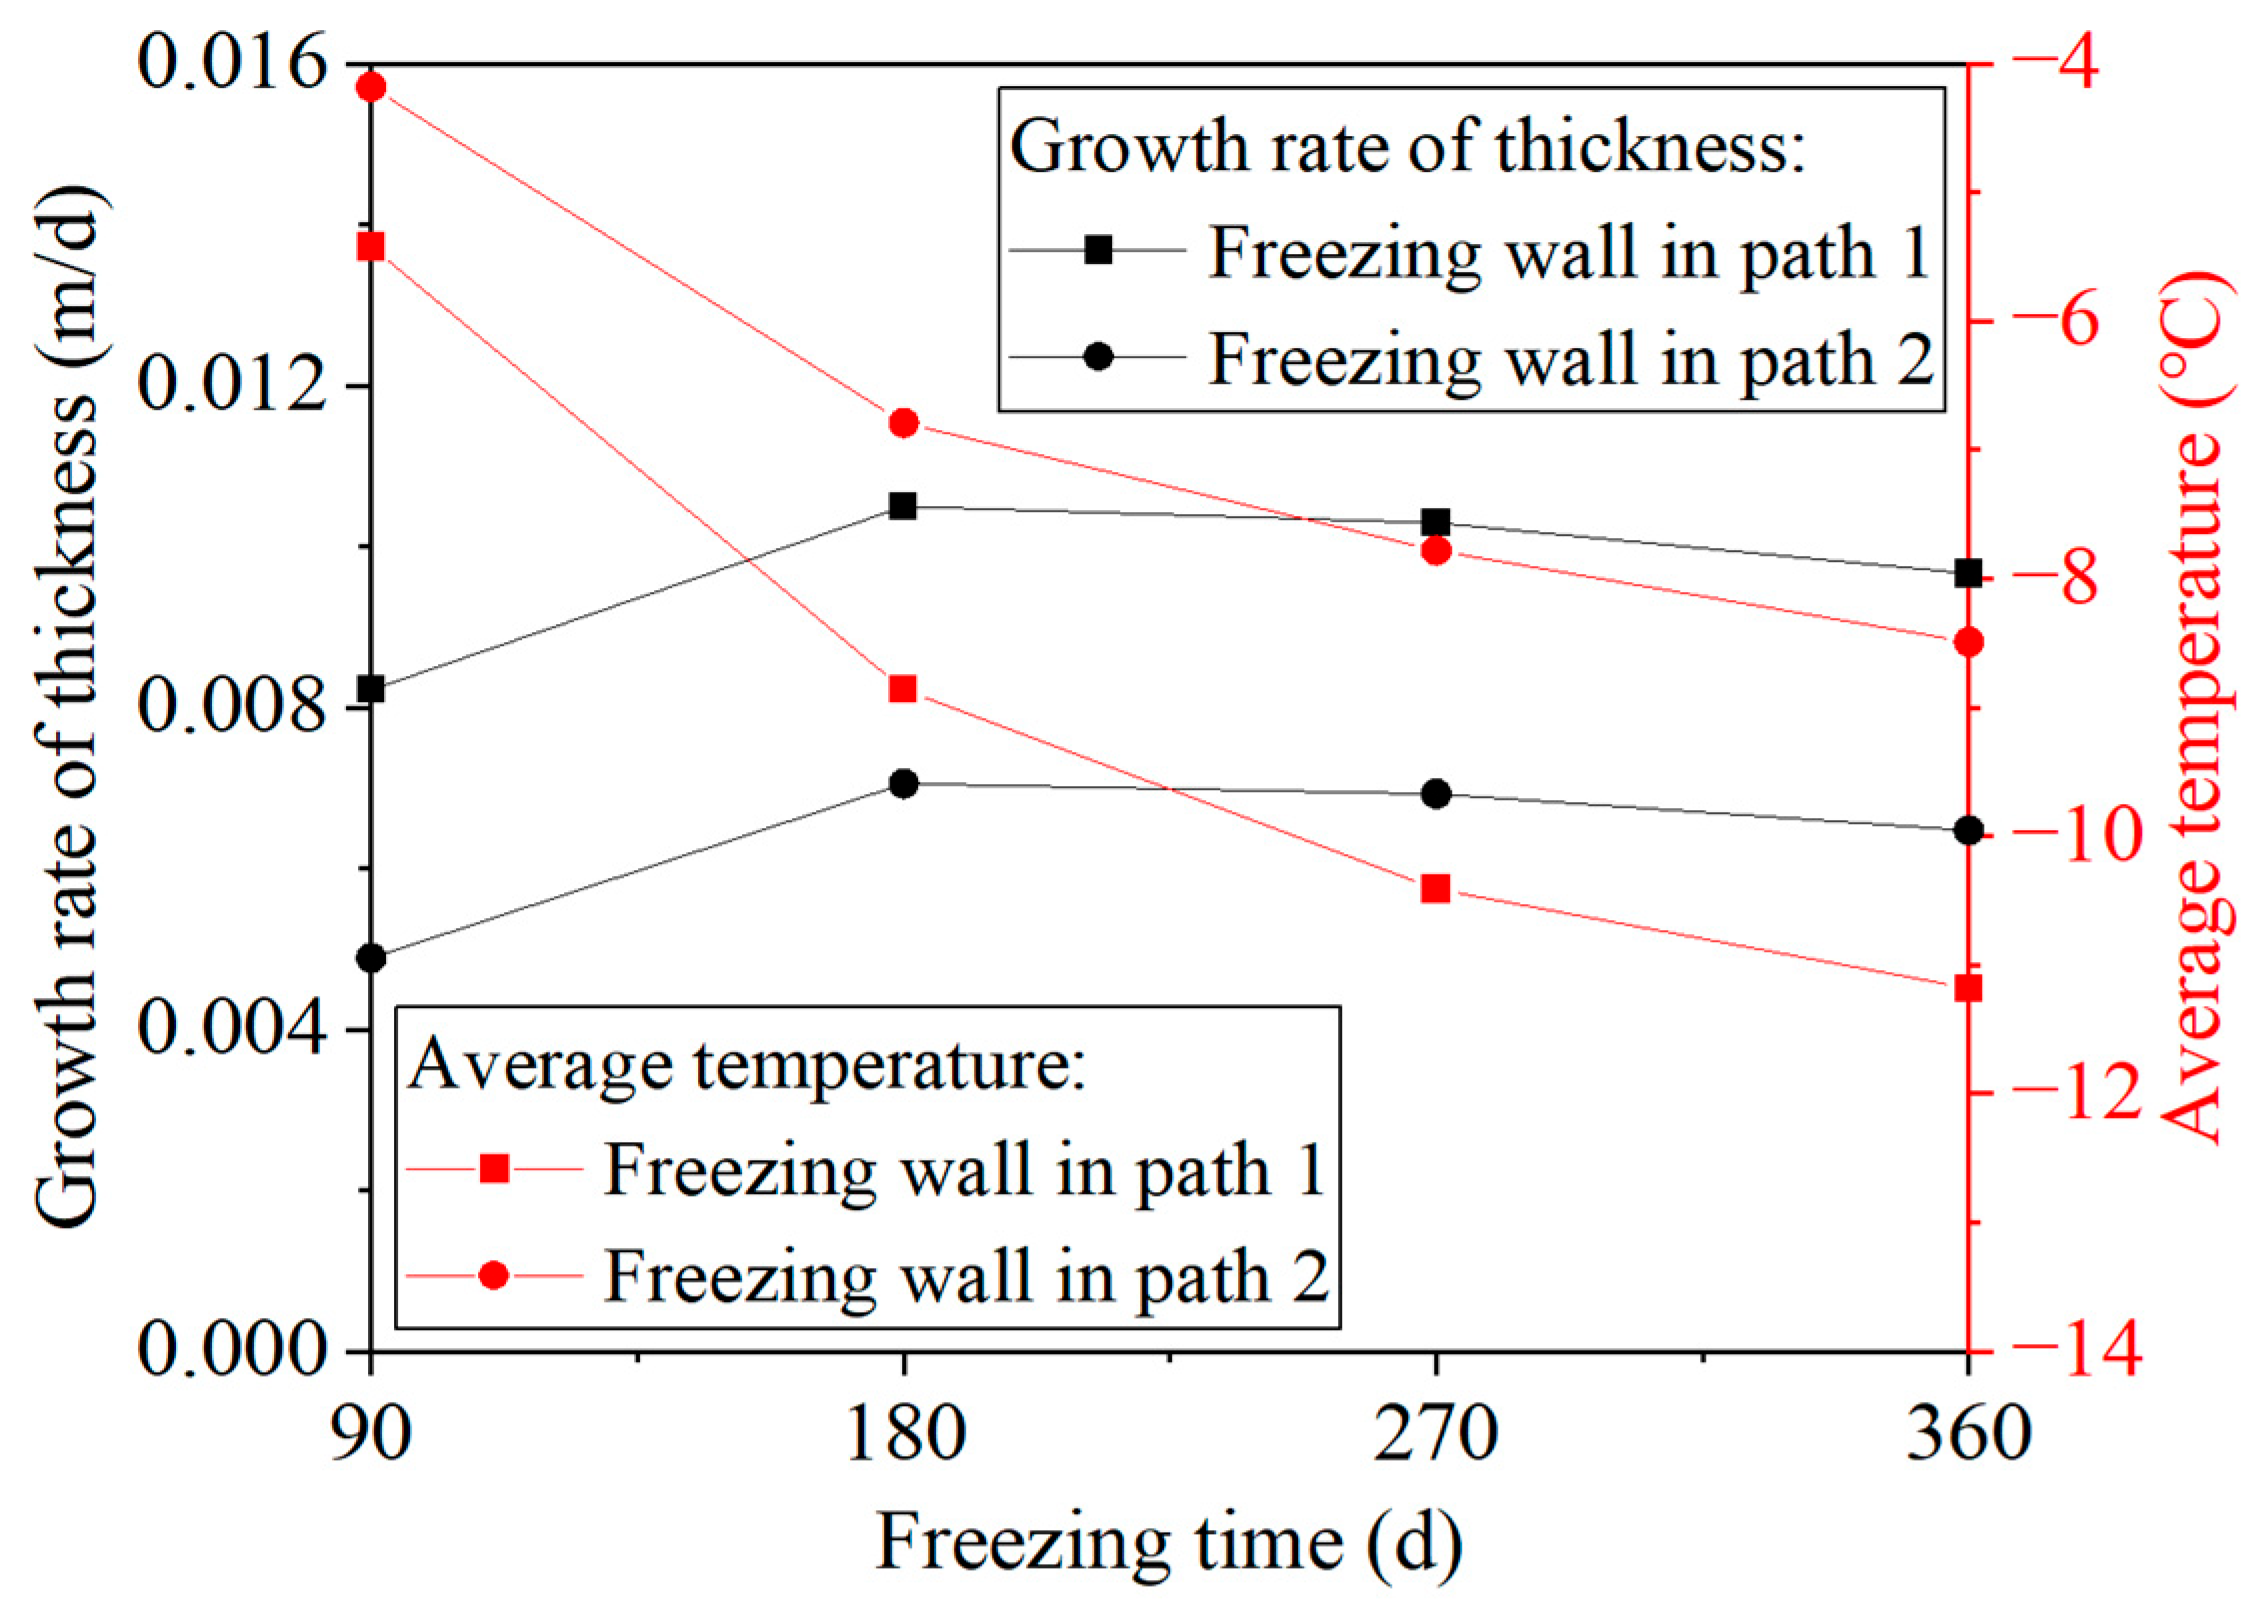
As illustrated in Table 3, the freezing wall thickness along Monitoring Path 1 was 0.74 m, 1.89 m, 2.78 m, and 3.48 m at 90, 180, 270, and 360 days after freezing, respectively. The corresponding thicknesses along Monitoring Path 2 were 0.44 m, 1.27 m, 1.87 m, and 2.33 m. The growth rates and average temperatures of the freezing wall for both monitoring paths are presented in Figure 11. The growth rate of the thickness increased and decreased during the freezing period. The average daily growth rates were 0.0082 m/d, 0.0105 m/d, 0.0103 m/d, and 0.0097 m/d for Monitoring Path 1 and 0.0049 m/d, 0.0071 m/d, 0.0069 m/d, and 0.0065 m/d for Monitoring Path 2 after 90, 180, 270, and 360 days, respectively. The average temperature of the freezing wall declined continuously, with temperatures of −5.42 °C, −8.86 °C, −10.41 °C, and −11.18 °C for Monitoring Path 1 and −4.18 °C, −6.79 °C, −7.78 °C, and −8.49 °C for Monitoring Path 2 in the same time intervals.

4.1.2. Influence of Engineering Factors on the Evolution of the Freezing Wall

Freezing Temperature
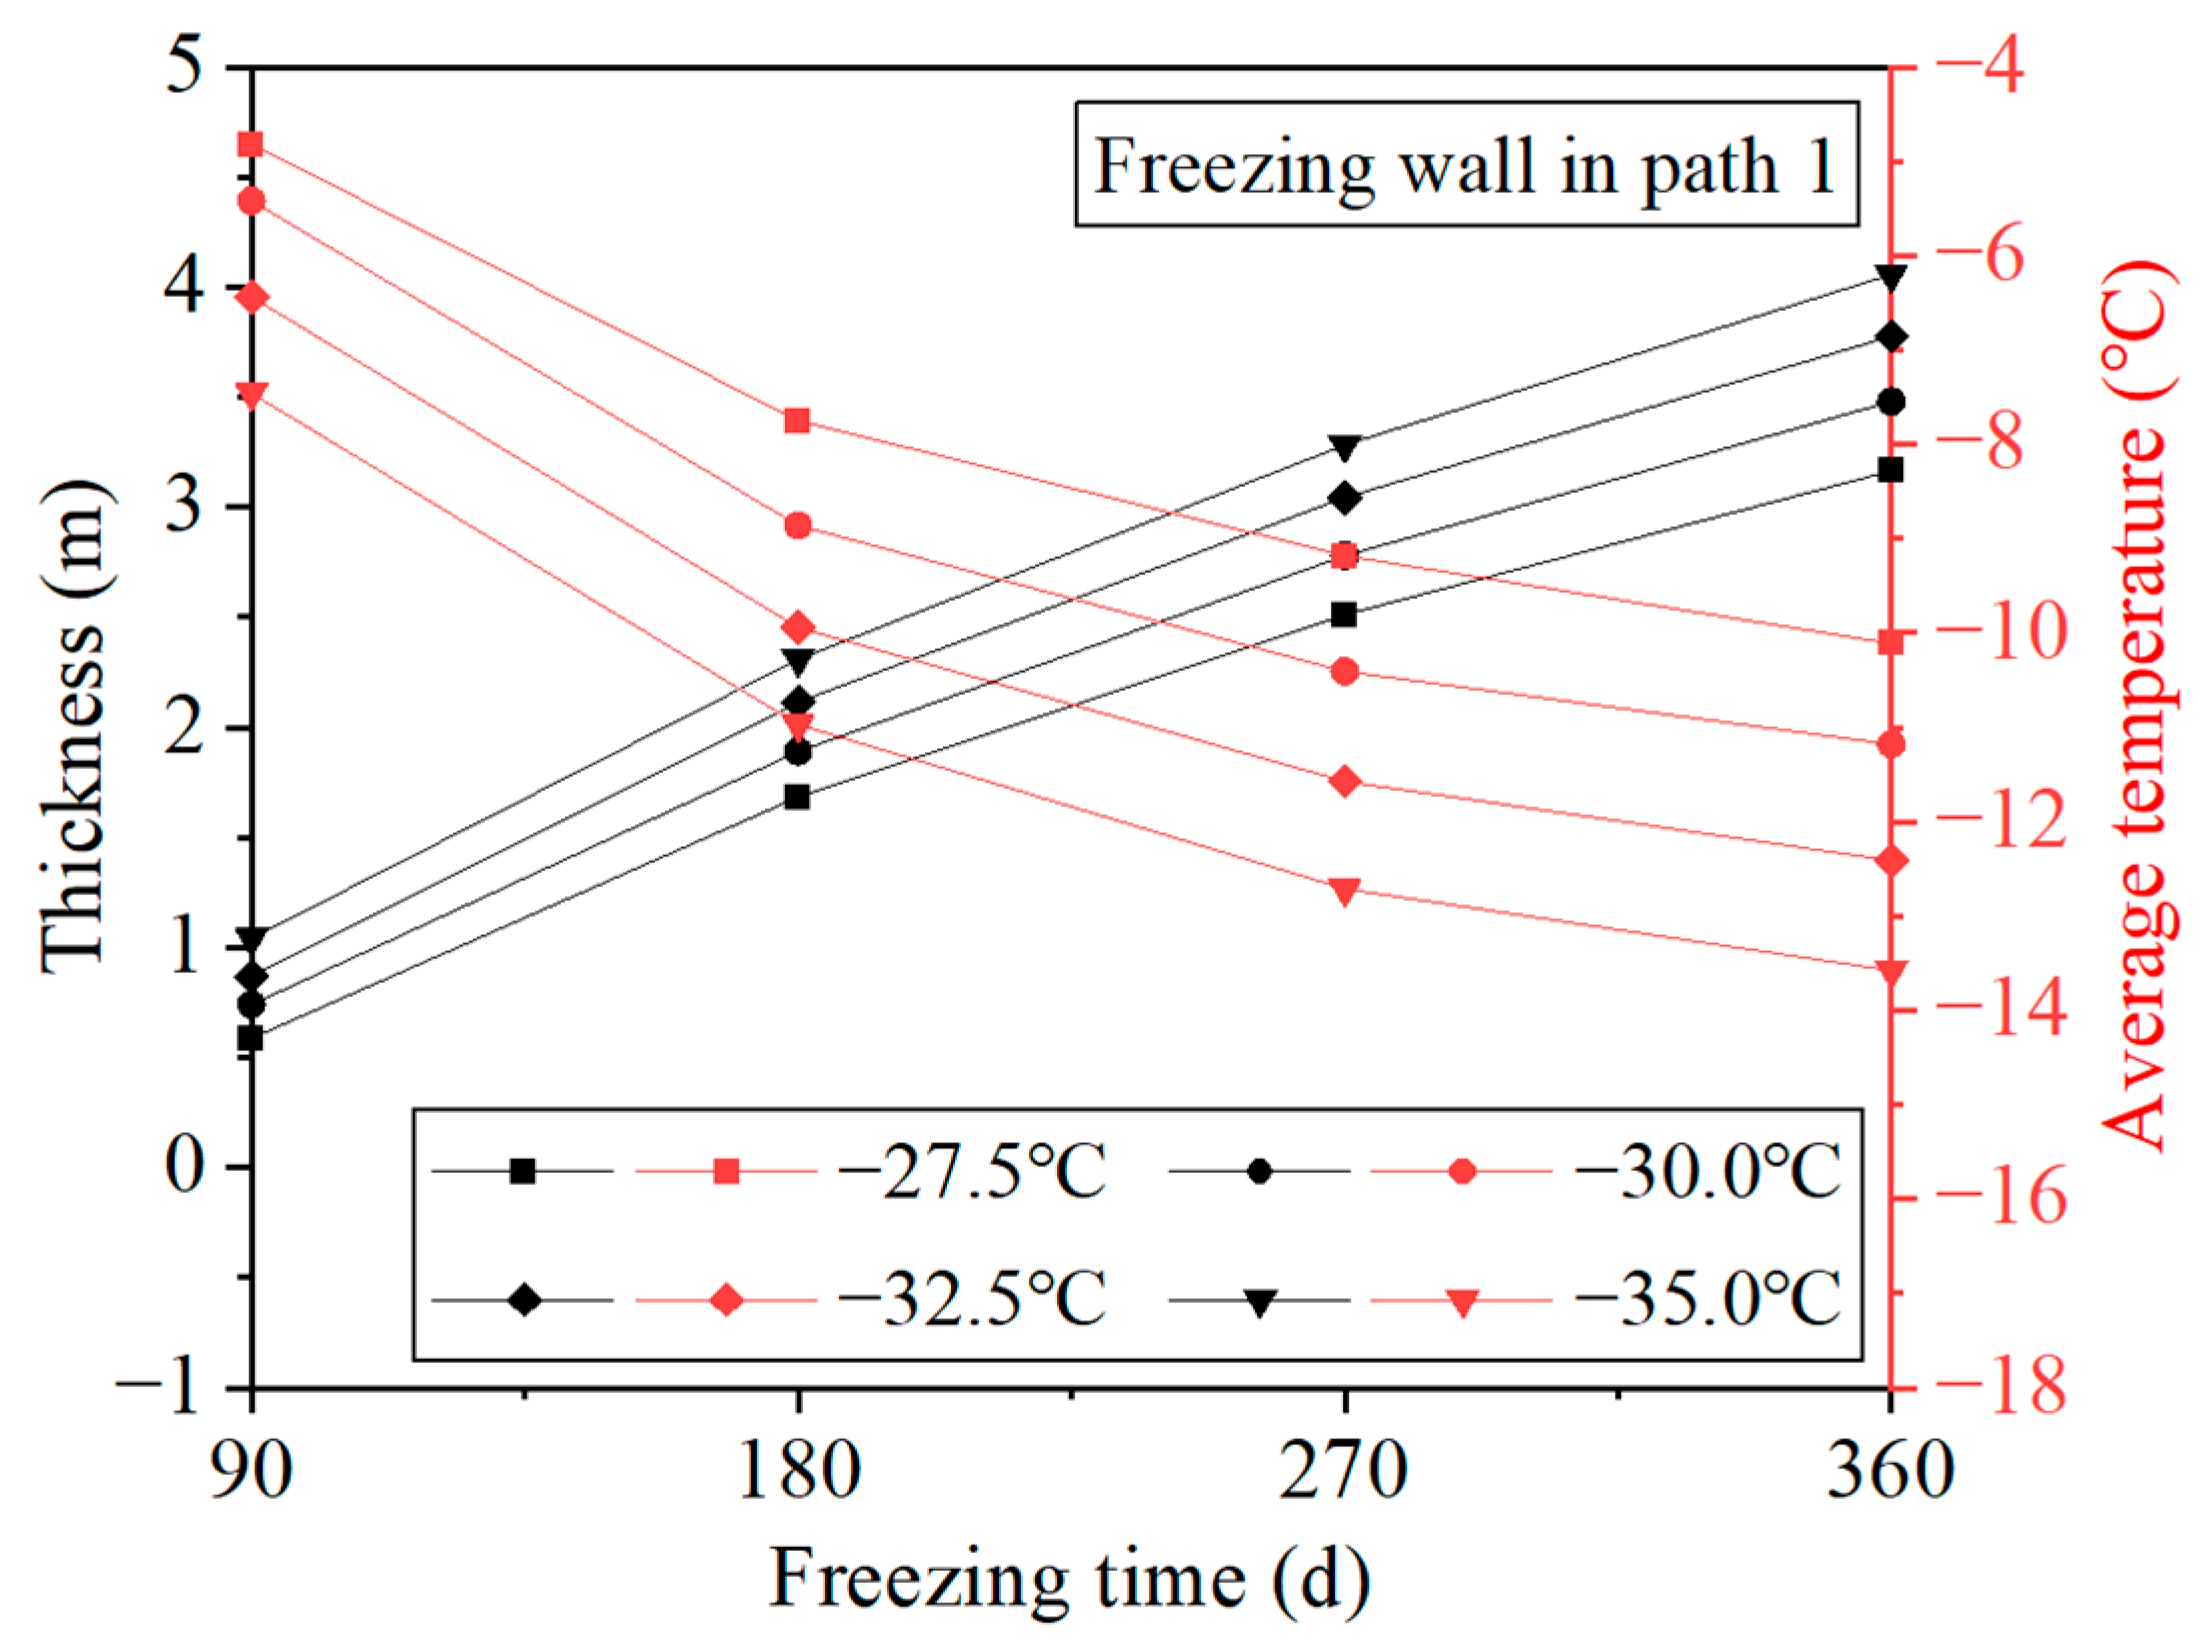
The influence of the freezing temperature on the freezing wall’s evolution was simulated, with the other parameters maintained at typical values (Table 2). The evolution of the freezing wall’s thickness and average temperature in Monitoring Path 1 for different freezing temperatures is shown in Figure 12. The freezing wall’s thickness was 1.68–2.31 m, and the average temperature was −7.75 °C to −10.97 °C after 180 days of freezing for freezing temperatures of −27.5 °C to −35 °C. After 360 days, the thickness was 3.16–4.06 m, and the average temperature was −10.11 °C to −13.58 °C. As the freezing duration increased, the differences in the thickness and average temperature between adjacent freezing temperature conditions increased. At 180 days, the thickness difference ranged from 0.19 m to 0.22 m, and the average temperature difference was 1.03 °C to 1.11 °C. At 360 days, the differences were 0.27–0.32 m for the thickness and 1.07 °C–1.23 °C for the average temperature.
The evolution of the freezing wall’s thickness and average temperature in Monitoring Path 2 for different freezing temperatures is shown in Figure 13. The freezing wall’s thickness was 1.08–1.65 m, and the average temperature was −5.83 °C to −8.62 °C after 180 days of freezing for freezing temperatures of −27.5 °C to −35 °C. After 360 days, the thickness was 2.04–2.86 m, and the average temperature was −7.58 °C to −10.33 °C. As the freezing duration increased, the differences in the thickness and average temperature between adjacent freezing temperature conditions increased. At 180 days, the thickness difference ranged from 0.17 to 0.19 m, and the average temperature difference was 0.88 °C to 0.96 °C. At 360 days, the differences were 0.26–0.29 m for the thickness and 0.77 °C–1.07 °C for the average temperature.
The average growth rate of the freezing wall for different freezing temperatures during the 360-day freezing period is shown in Figure 14. The growth rate was 0.0088–0.0113 m/d in Monitoring Path 1 and 10.0057–0.0079 m/d in Monitoring Path 2. The average change rate of the growth rate was −0.00033 m/(d·°C) in Monitoring Path 1 and −0.00031 m/(d·°C) in Monitoring Path 2.
Shaft Lining Thickness
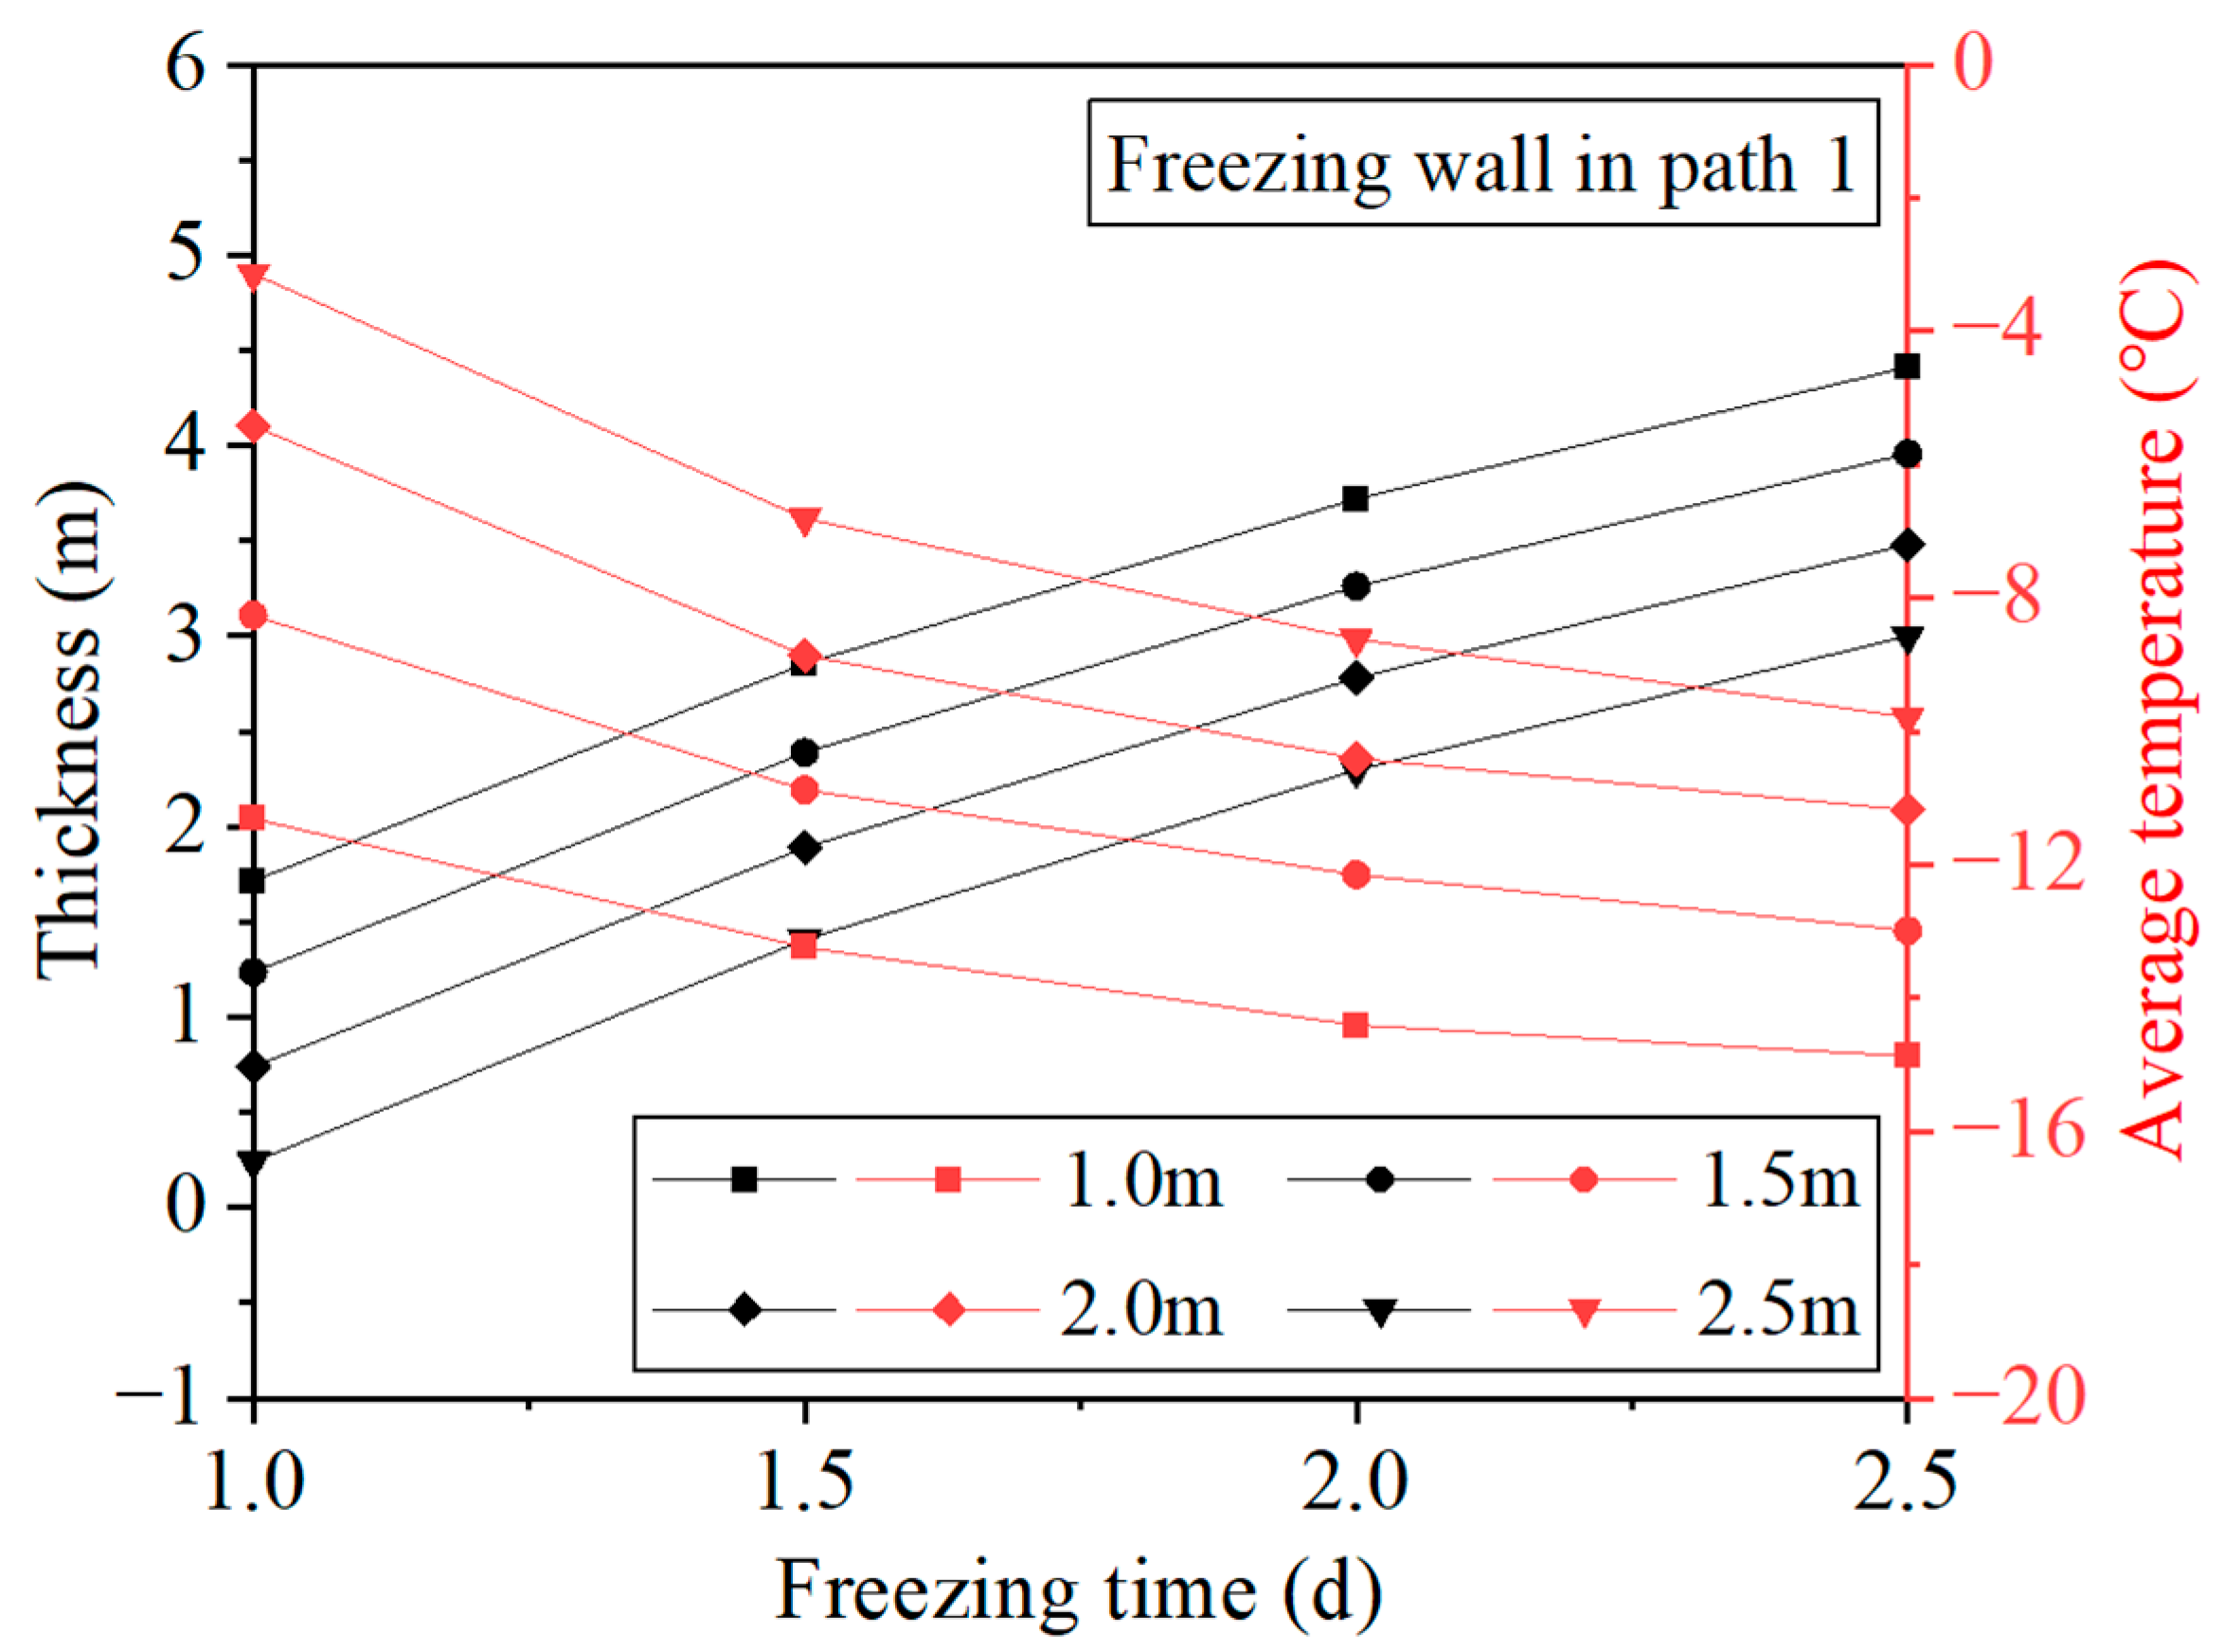
The influence of the shaft lining thickness on the freezing wall evolution was analyzed using simulations, with the other parameters maintained at typical values (Table 2). The evolution of the freezing wall thickness and average temperature in Monitoring Path 1 for different shaft lining thicknesses is shown in Figure 15. The freezing wall thickness was 1.41–2.85 m, and the average temperature was −6.81 °C to −13.24 °C after 180 days of freezing for shaft lining thickness values of 1.0–2.5 m. After 360 days, the thickness was 2.99–4.41 m, and the average temperature was −9.79 °C to –14.87 °C. As the freezing duration increased, the difference in the freezing wall thickness between adjacent shaft lining thickness values did not change significantly, whereas the difference in average temperature decreased. After 180 days of freezing, the thickness differences of the freezing wall ranged from 0.46 m to 0.49 m, and the average temperature difference was 2.02 °C to 2.36 °C. After 360 days of freezing, the thickness difference was 0.45 m to 0.48 m, and the average temperature difference was 1.39 °C to 1.88 °C.
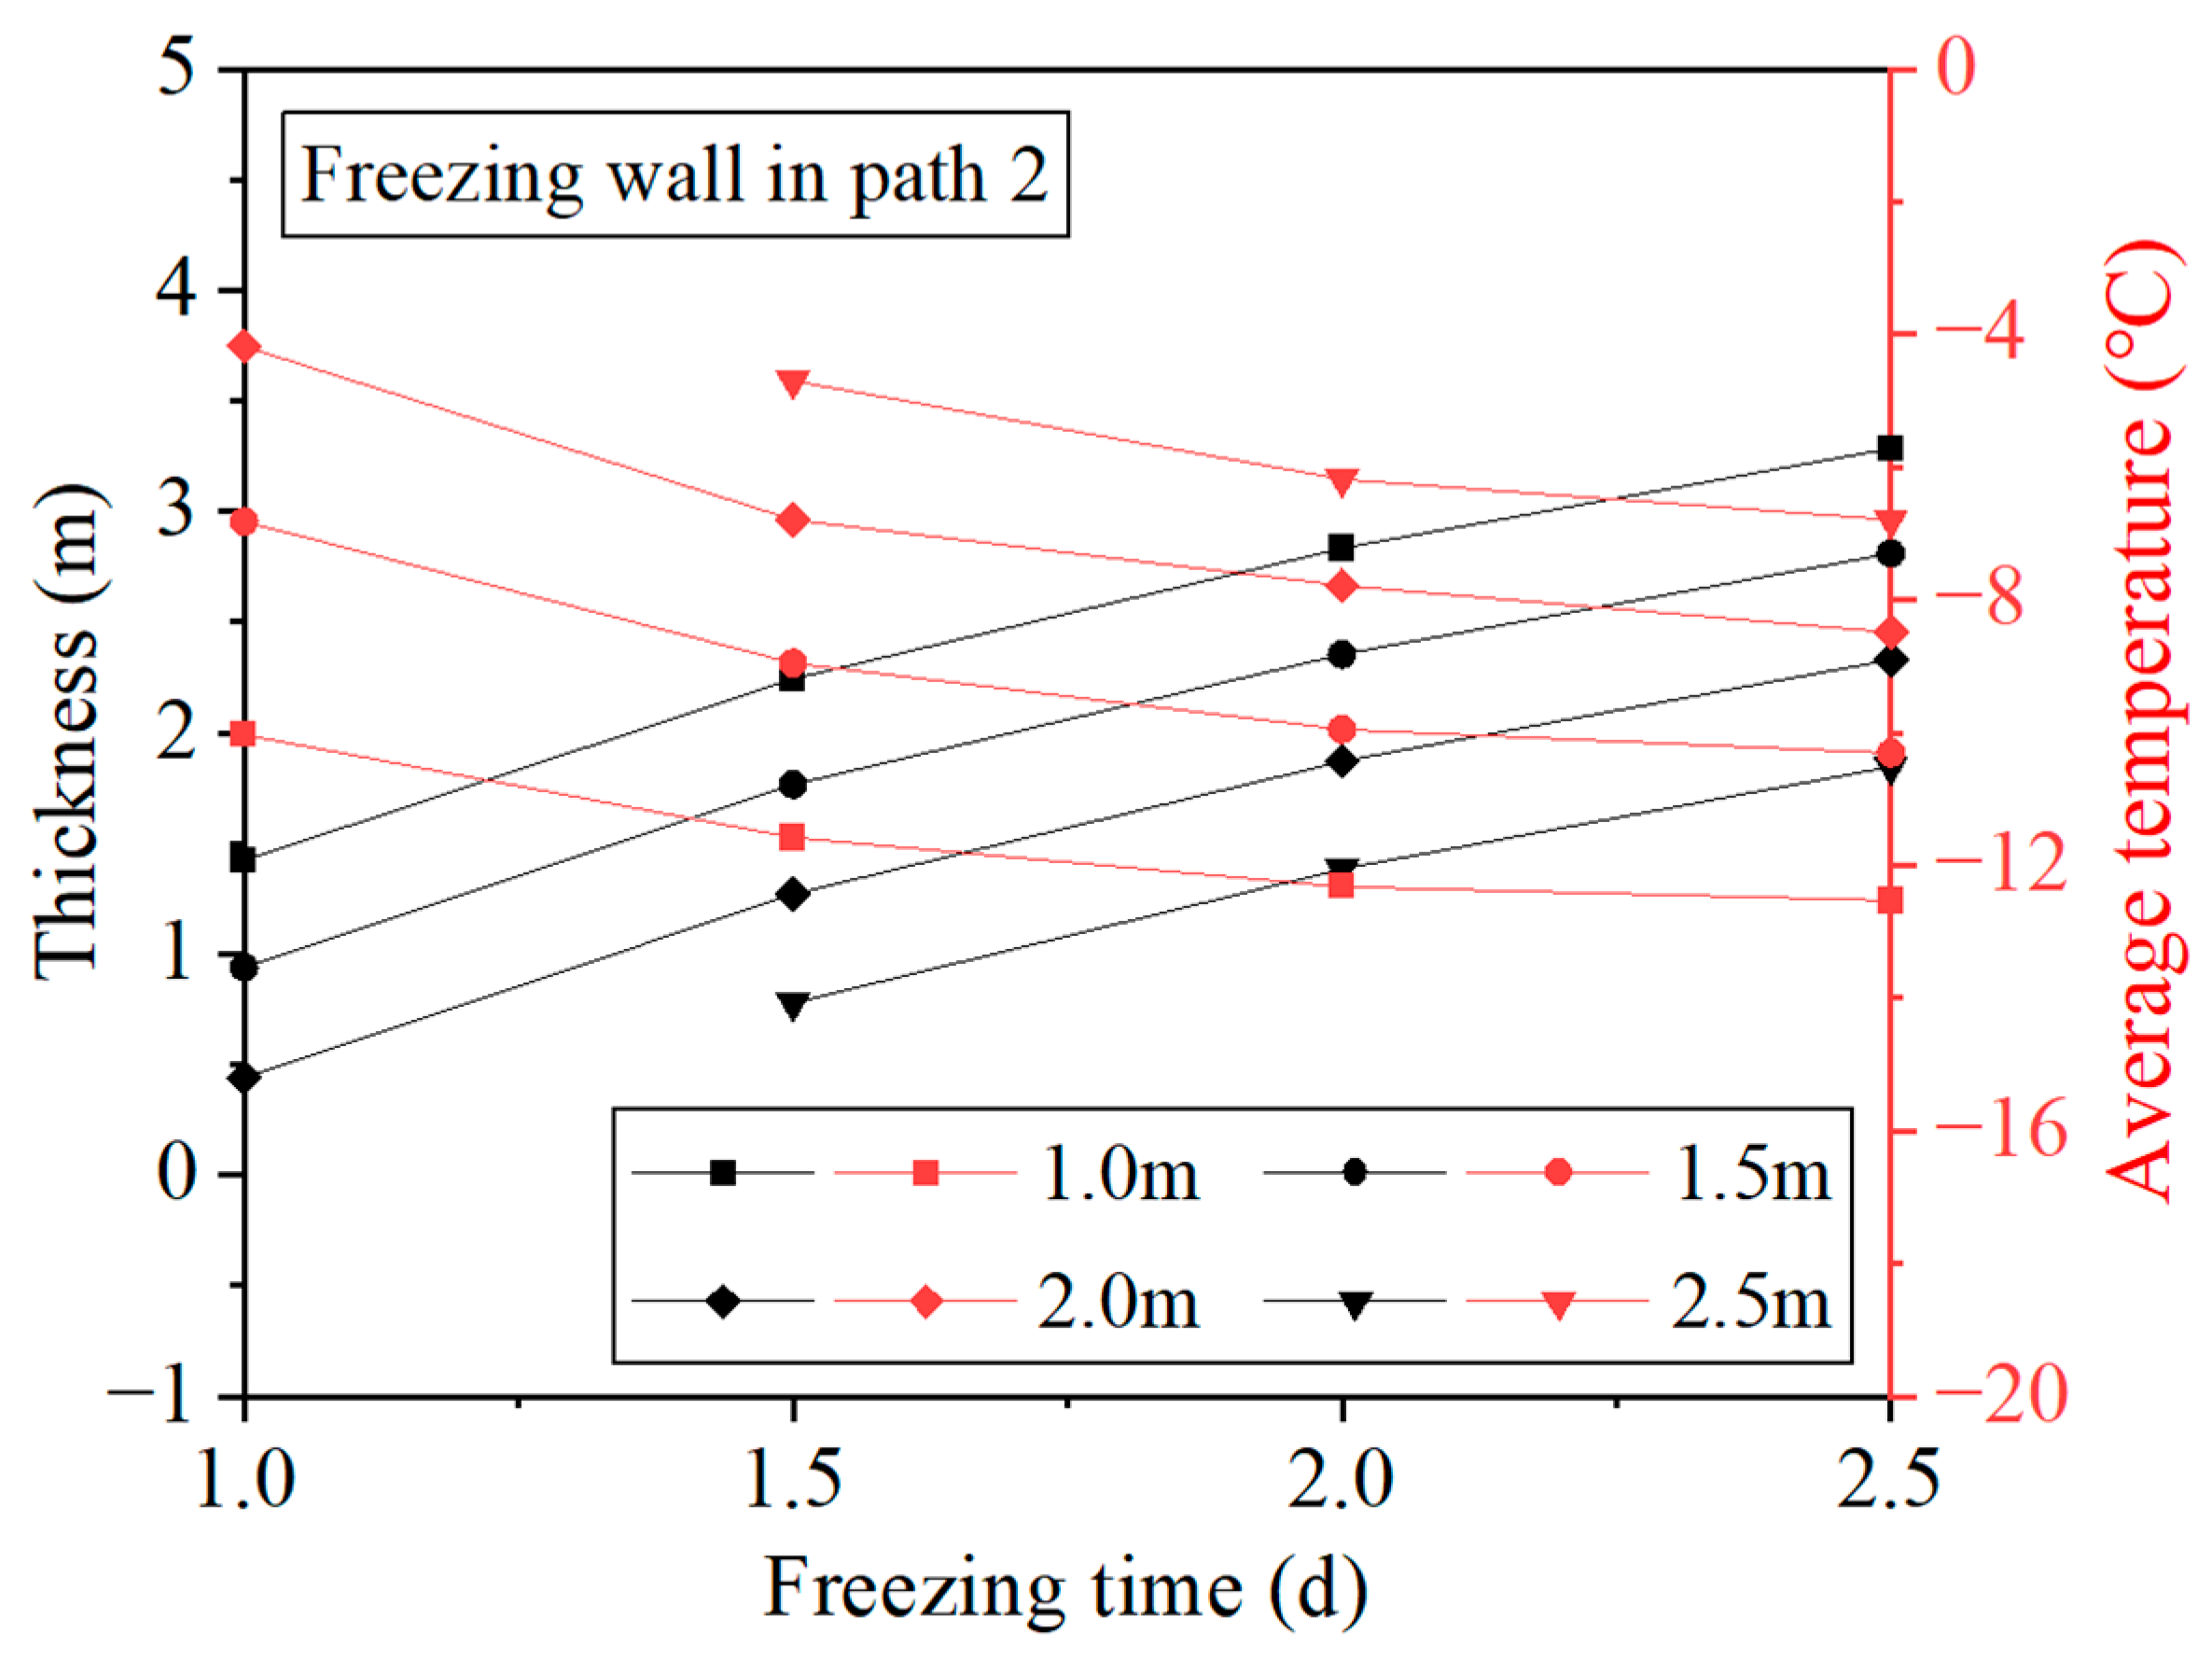
The evolution of the freezing wall thickness and average temperature in Monitoring Path 2 for different shaft lining thicknesses is shown in Figure 16. The freezing wall thickness in Monitoring Path 2 was 0.78–2.24 m, and the average temperature was −4.71 °C to −11.58 °C after 180 days of freezing for shaft lining thickness values of 1.0–2.5 m. After 360 days, the thickness was 1.85–3.28 m, and the average temperature was −6.79 °C to −12.53 °C. As the freezing duration increased, the difference in the freezing wall thickness between adjacent shaft lining thickness values did not change significantly, whereas the difference in average temperature decreased. After 180 days of freezing, the thickness difference of the freezing wall ranged from 0.47 m to 0.5 m, and the average temperature difference was 2.09 °C to 2.63 °C. After 360 days of freezing, the thickness difference was 0.47 m to 0.48 m, and the average temperature difference was 1.71 °C to 2.22 °C.
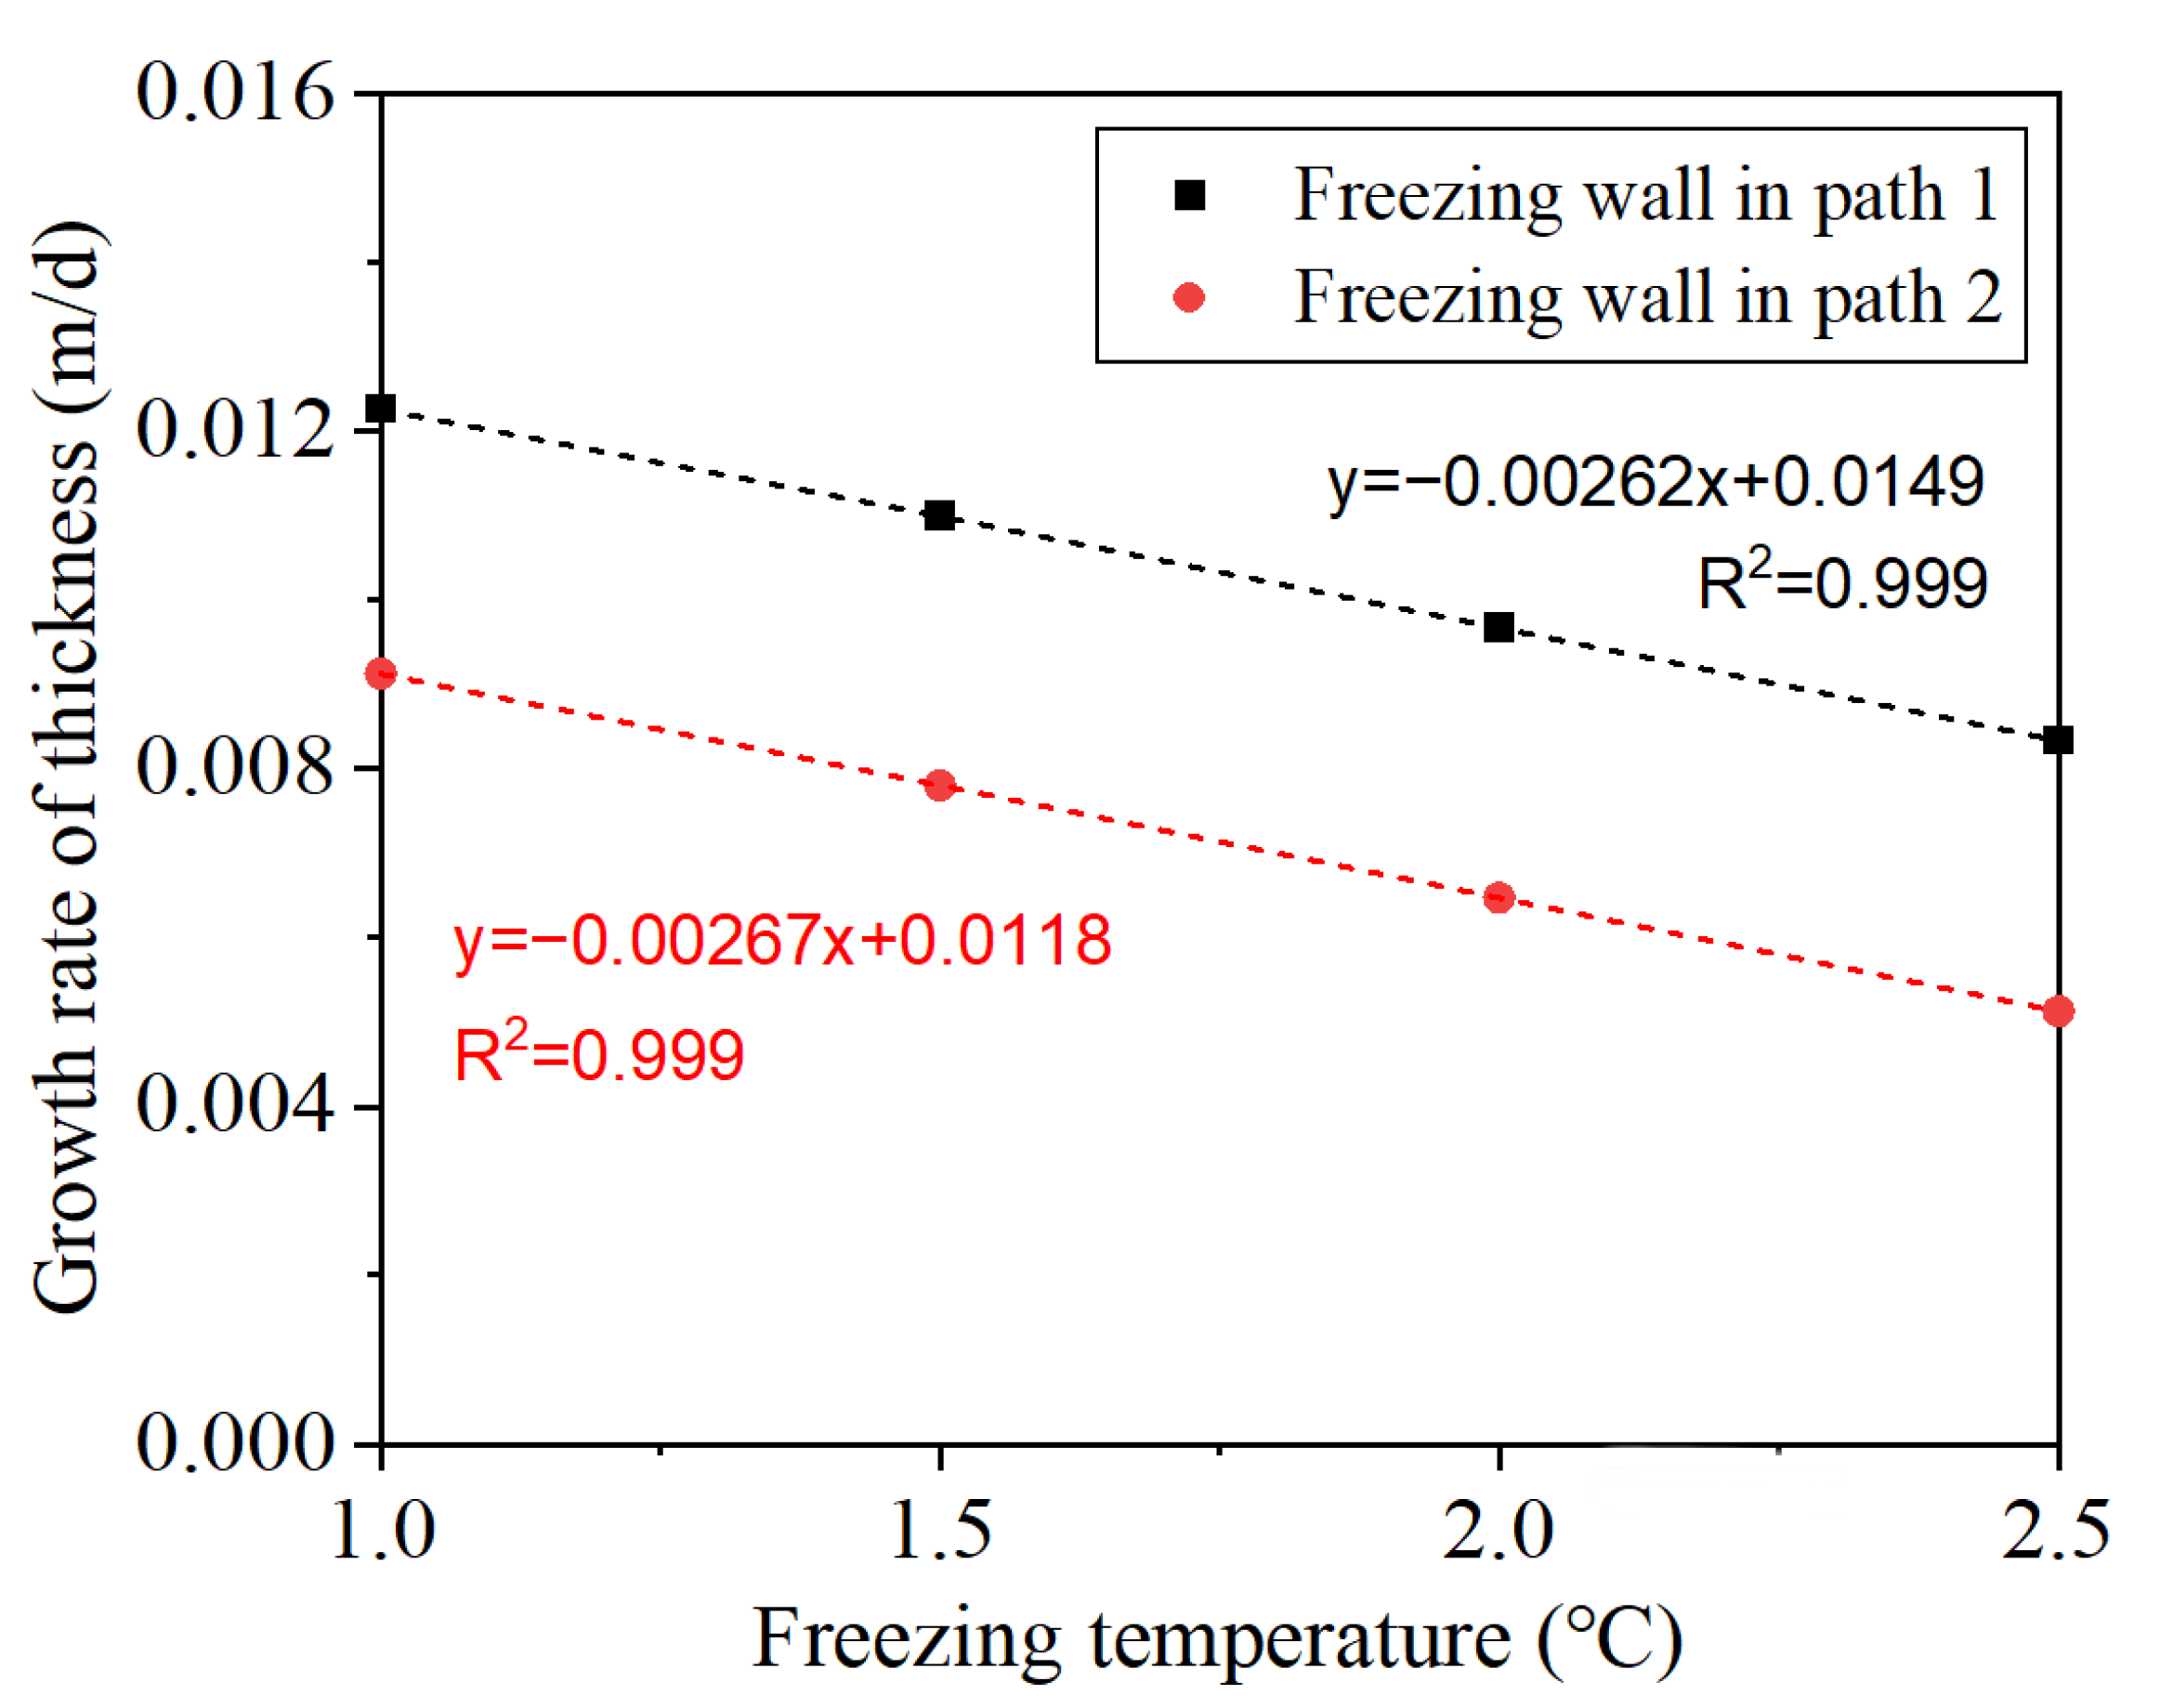
The average growth rate of the freezing wall for different shaft lining thicknesses is shown in Figure 17. The growth rate was 0.0083–0.0123 m/d in Monitoring Path 1 and 0.0051–0.0091 m/d in Monitoring Path 2. It was linearly negatively correlated with the freezing temperature. The average change rate of the growth rate was −0.00262 m/(d·m) in Monitoring Path 1 and −0.00267 m/(d·m) in Monitoring Path 2.

4.2. Evolution of the Freezing Wall During the Slotting Period

It required 123 days of freezing to reach the threshold of 1.2 m thickness of the freezing wall in Monitoring Path 1 for the typical parameters (Table 2). We conducted simulations to investigate the influence of slot height and slotting duration on the freezing wall thickness and average temperature.

4.2.1. Influence of Slot Height on the Evolution of the Freezing Wall

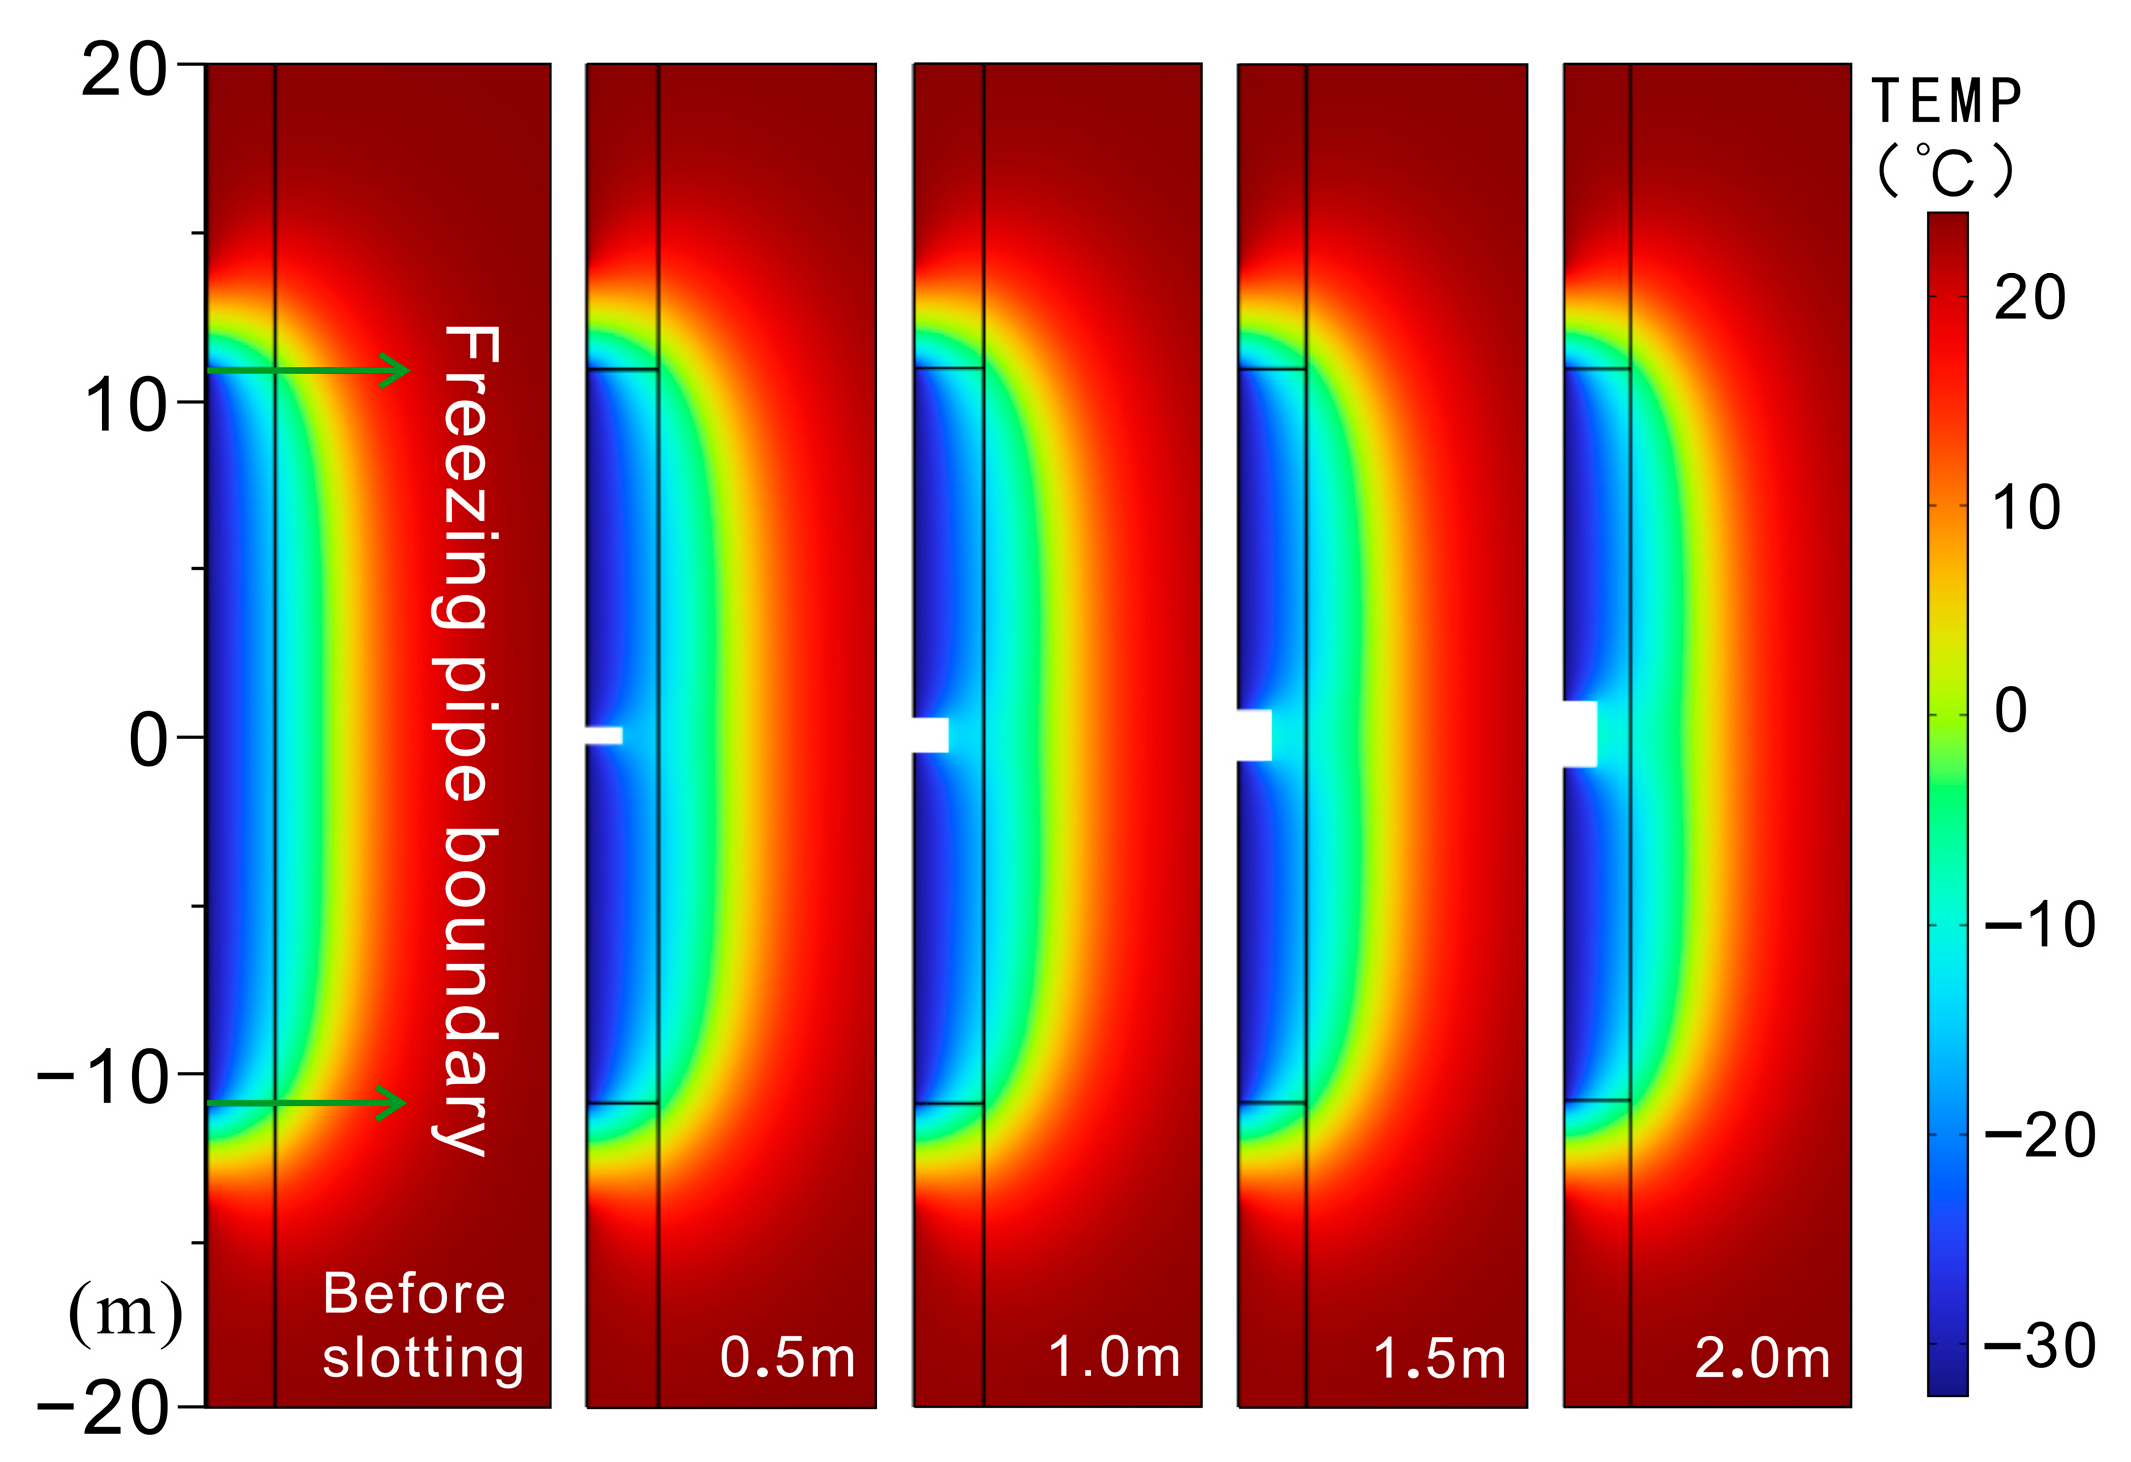
The nephogram of the temperature field for different slot heights after 15 days is shown in Figure 18. Convective heat transfer occurred between the air inside the shaft and the exposed concrete shaft lining in the slotting zone, forming a warming zone. As the upper and lower freezing pipes operated normally during slotting, few temperature changes occurred in the concrete above and below the slotting zone. Thus, the warming zone expanded horizontally. As the height of the slotting zone increased, the exposed area increased, expanding the horizontal influence range of the warming zone. The upper and lower freezing pipes transferred the cooling capacity to the freezing wall in the stratum through the low-temperature shaft wall, and the temperature field at the outer edge of the freezing wall was unaffected by the slotting operation.
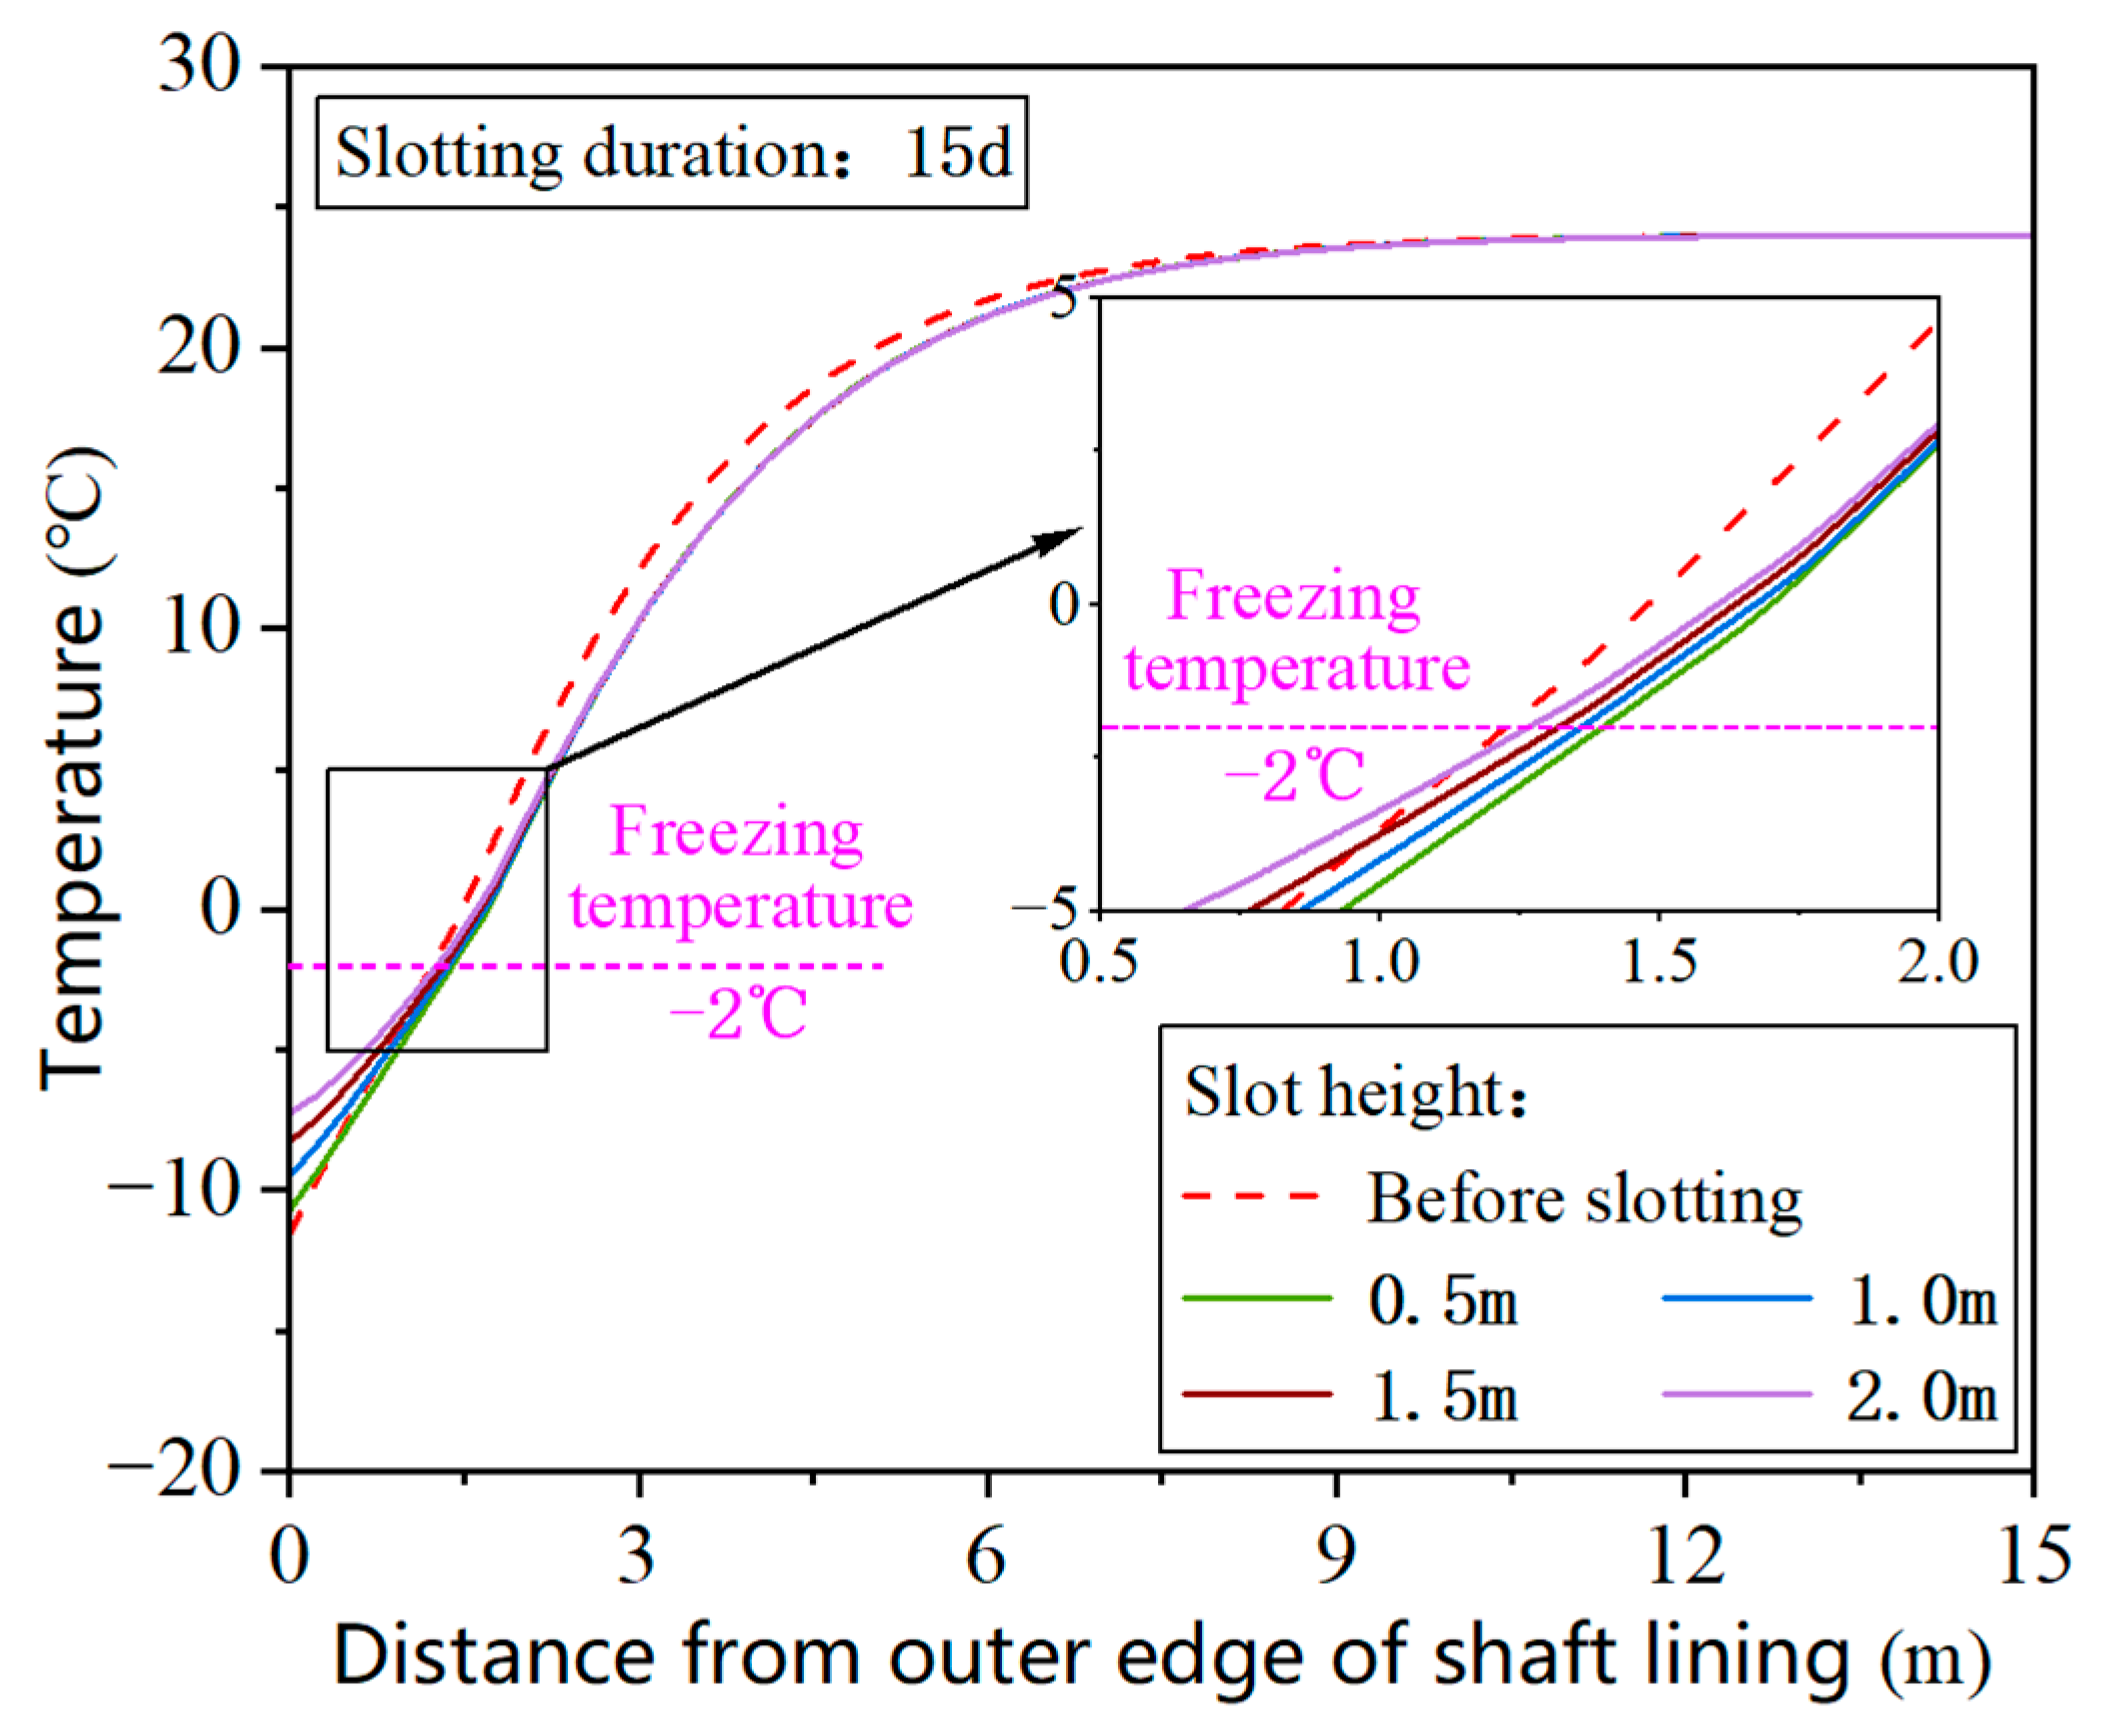
The temperature evolution in Monitoring Path 1 for different slot heights is illustrated in Figure 19. As the slot height increased, the horizontal range of the warming zone adjacent to the slotting zone increased. The horizontal ranges of the warming zone were 0.38 m, 0.75 m, 0.97 m, and 1.32 m at slot heights of 0.5 m, 1.0 m, 1.5 m, and 2.0 m, respectively. The final temperatures in the regions where temperatures increased were below −2.5 °C (<−2 °C), indicating no melting of the freezing wall.
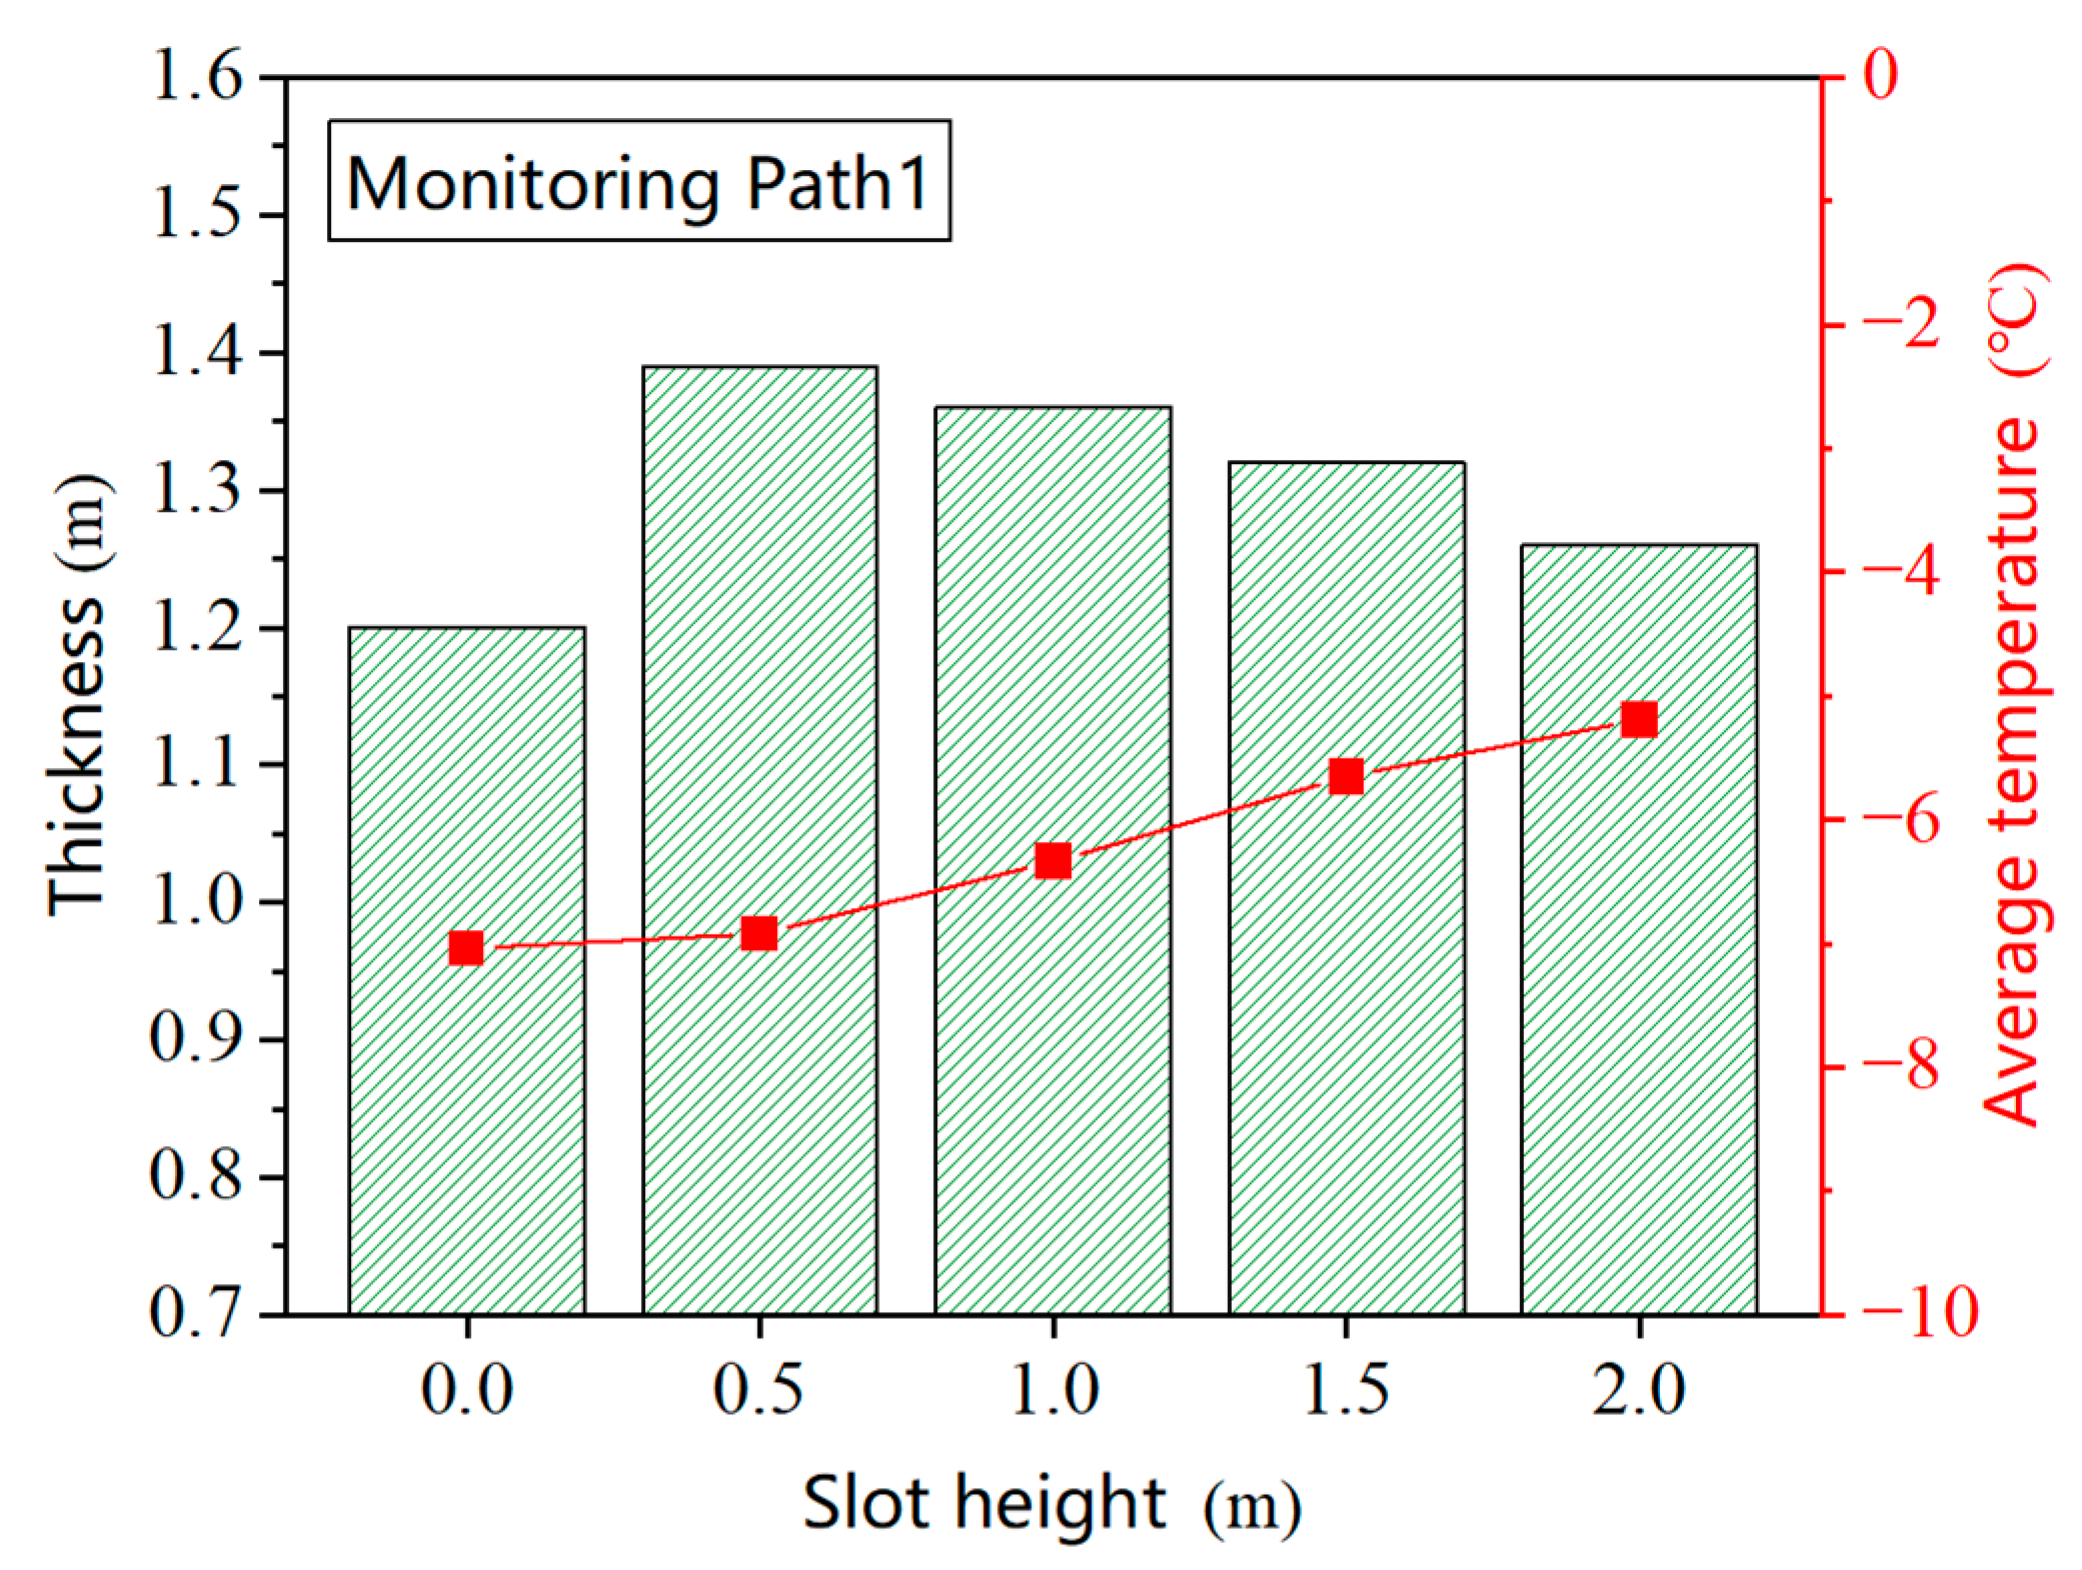
As depicted in Figure 19 and Figure 20, the outer boundary of the freezing wall expanded outward during slotting at a freezing temperature of −2 °C. The rate of increase in the thickness of the freezing wall slowed, and the average temperature of the freezing wall increased as the height of the excavated slot section increased. The freezing wall thicknesses were 1.39, 1.36, 1.32, and 1.26 m at slot heights of 0.5, 1.0, 1.5, and 2.0 m, and the average temperatures were −6.92, −6.34, −5.65, and −5.19 °C, respectively, on the 15th day. The thickness of the freezing wall was 0.19, 0.16, 0.12, and 0.06 m larger, and the average temperature was 0.12, 0.71, 1.39, and 1.85 °C higher after slotting than before slotting.

4.2.2. Influence of Slotting Duration on the Evolution of the Freezing Wall

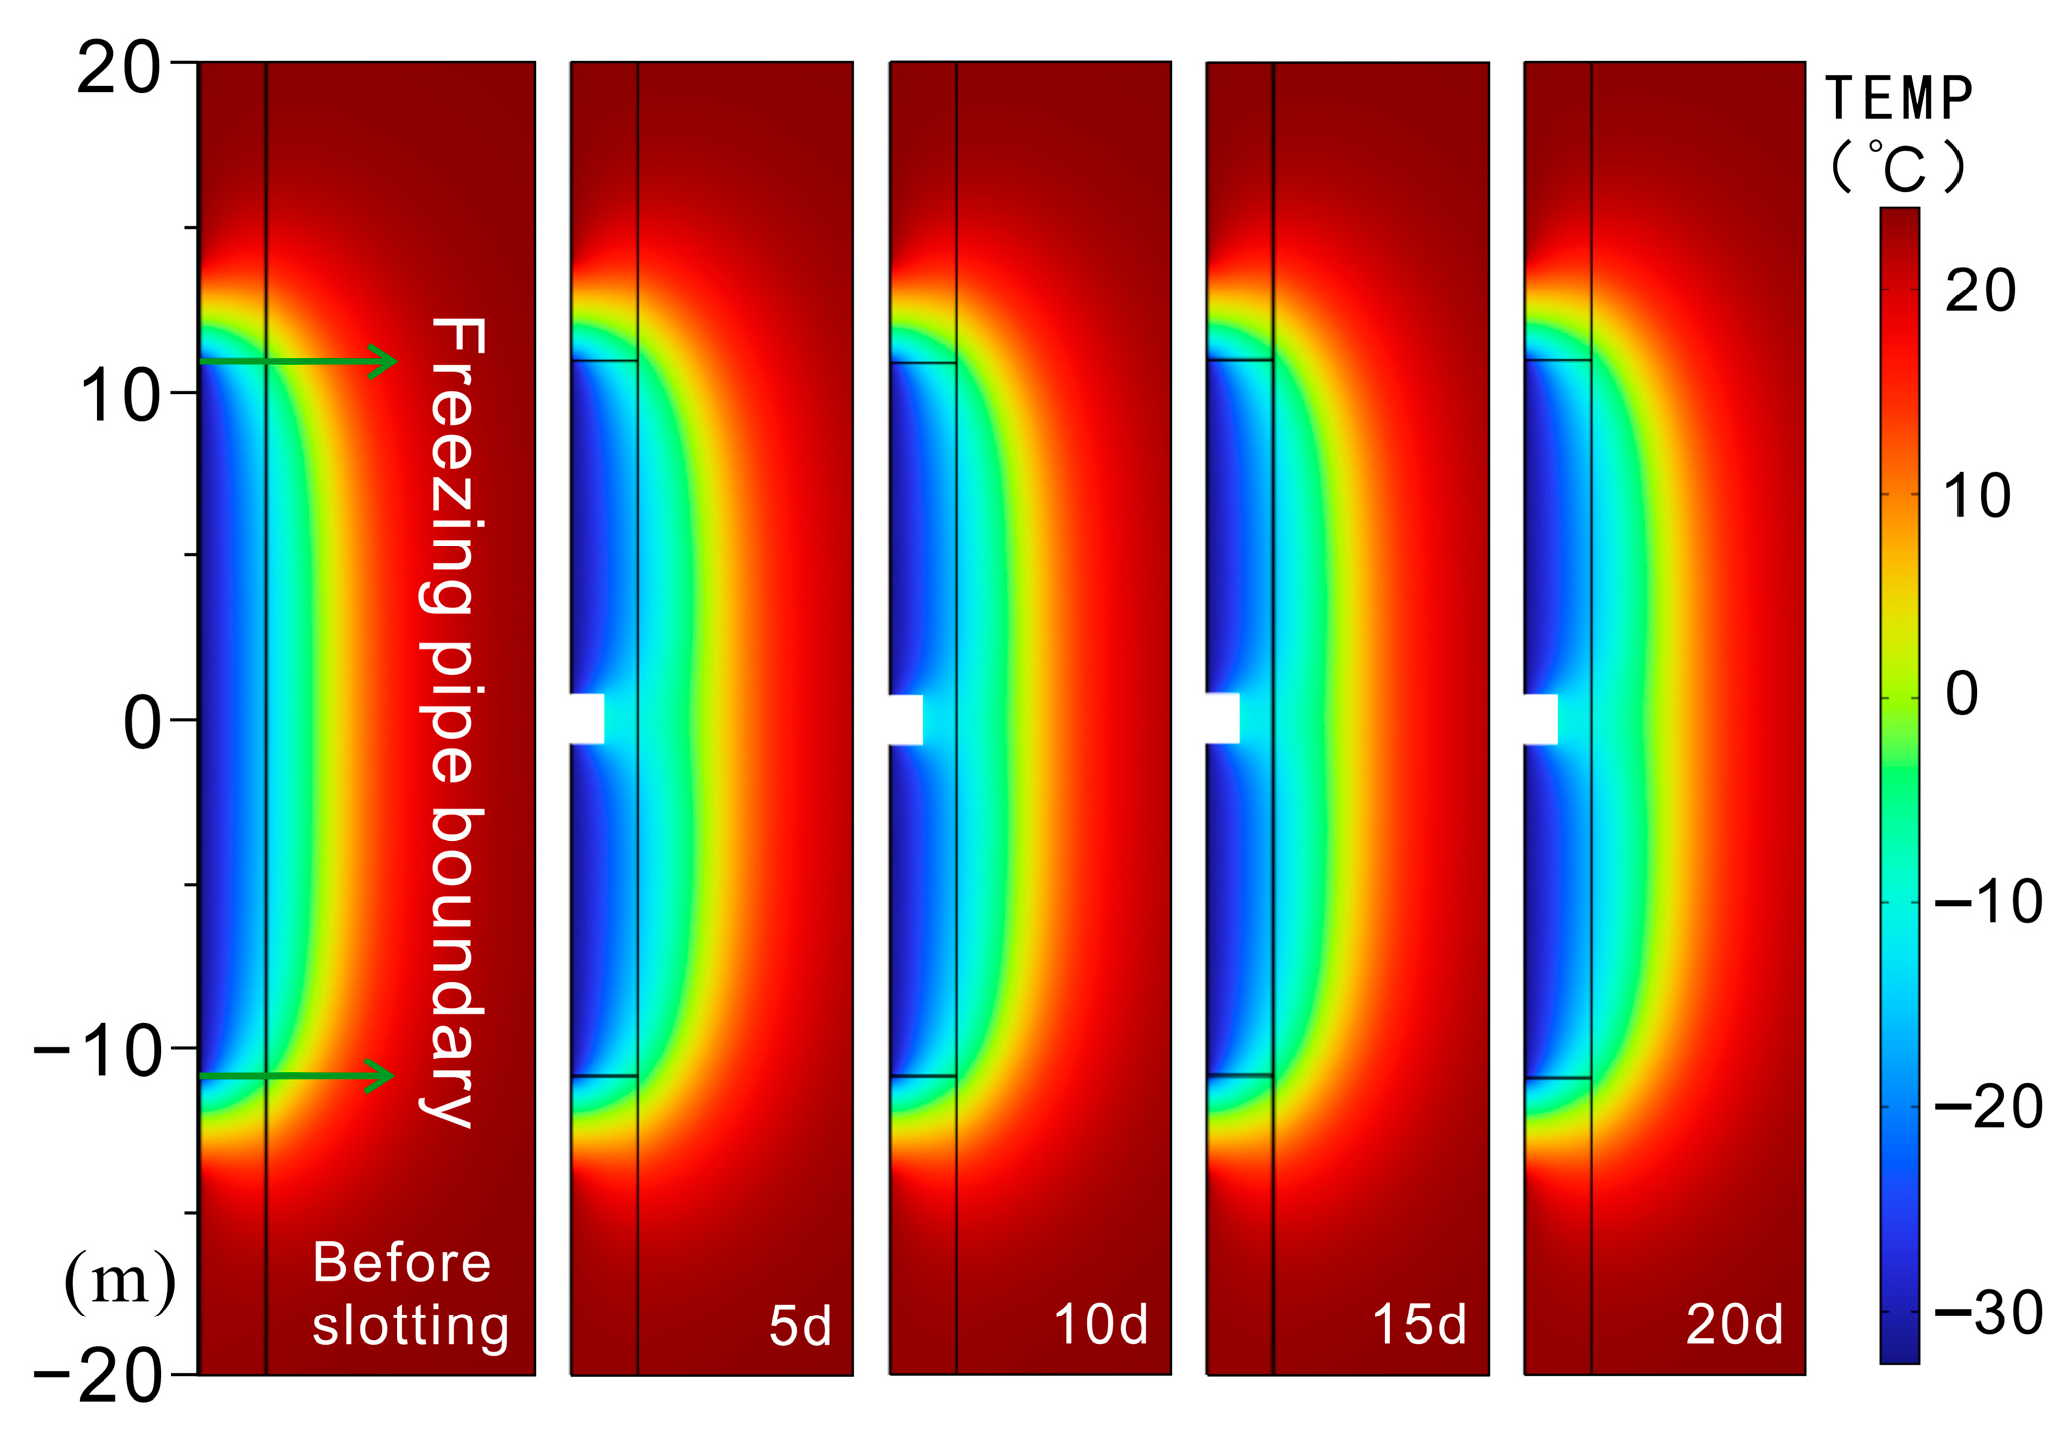
The temperature field nephogram for different slotting durations and a slot height of 1.5 m is illustrated in Figure 21. As the slotting duration increased, the exposed concrete shaft lining in the slotting zone warmed due to convective heat transfer. The affected area expanded toward the adjacent freezing wall near the shaft lining. The upper and lower freezing pipes transferred the cooling capacity to the freezing wall through the low-temperature shaft lining. The excavation did not affect the temperature field at the outer periphery of the freezing wall, and the freezing wall expanded outward.
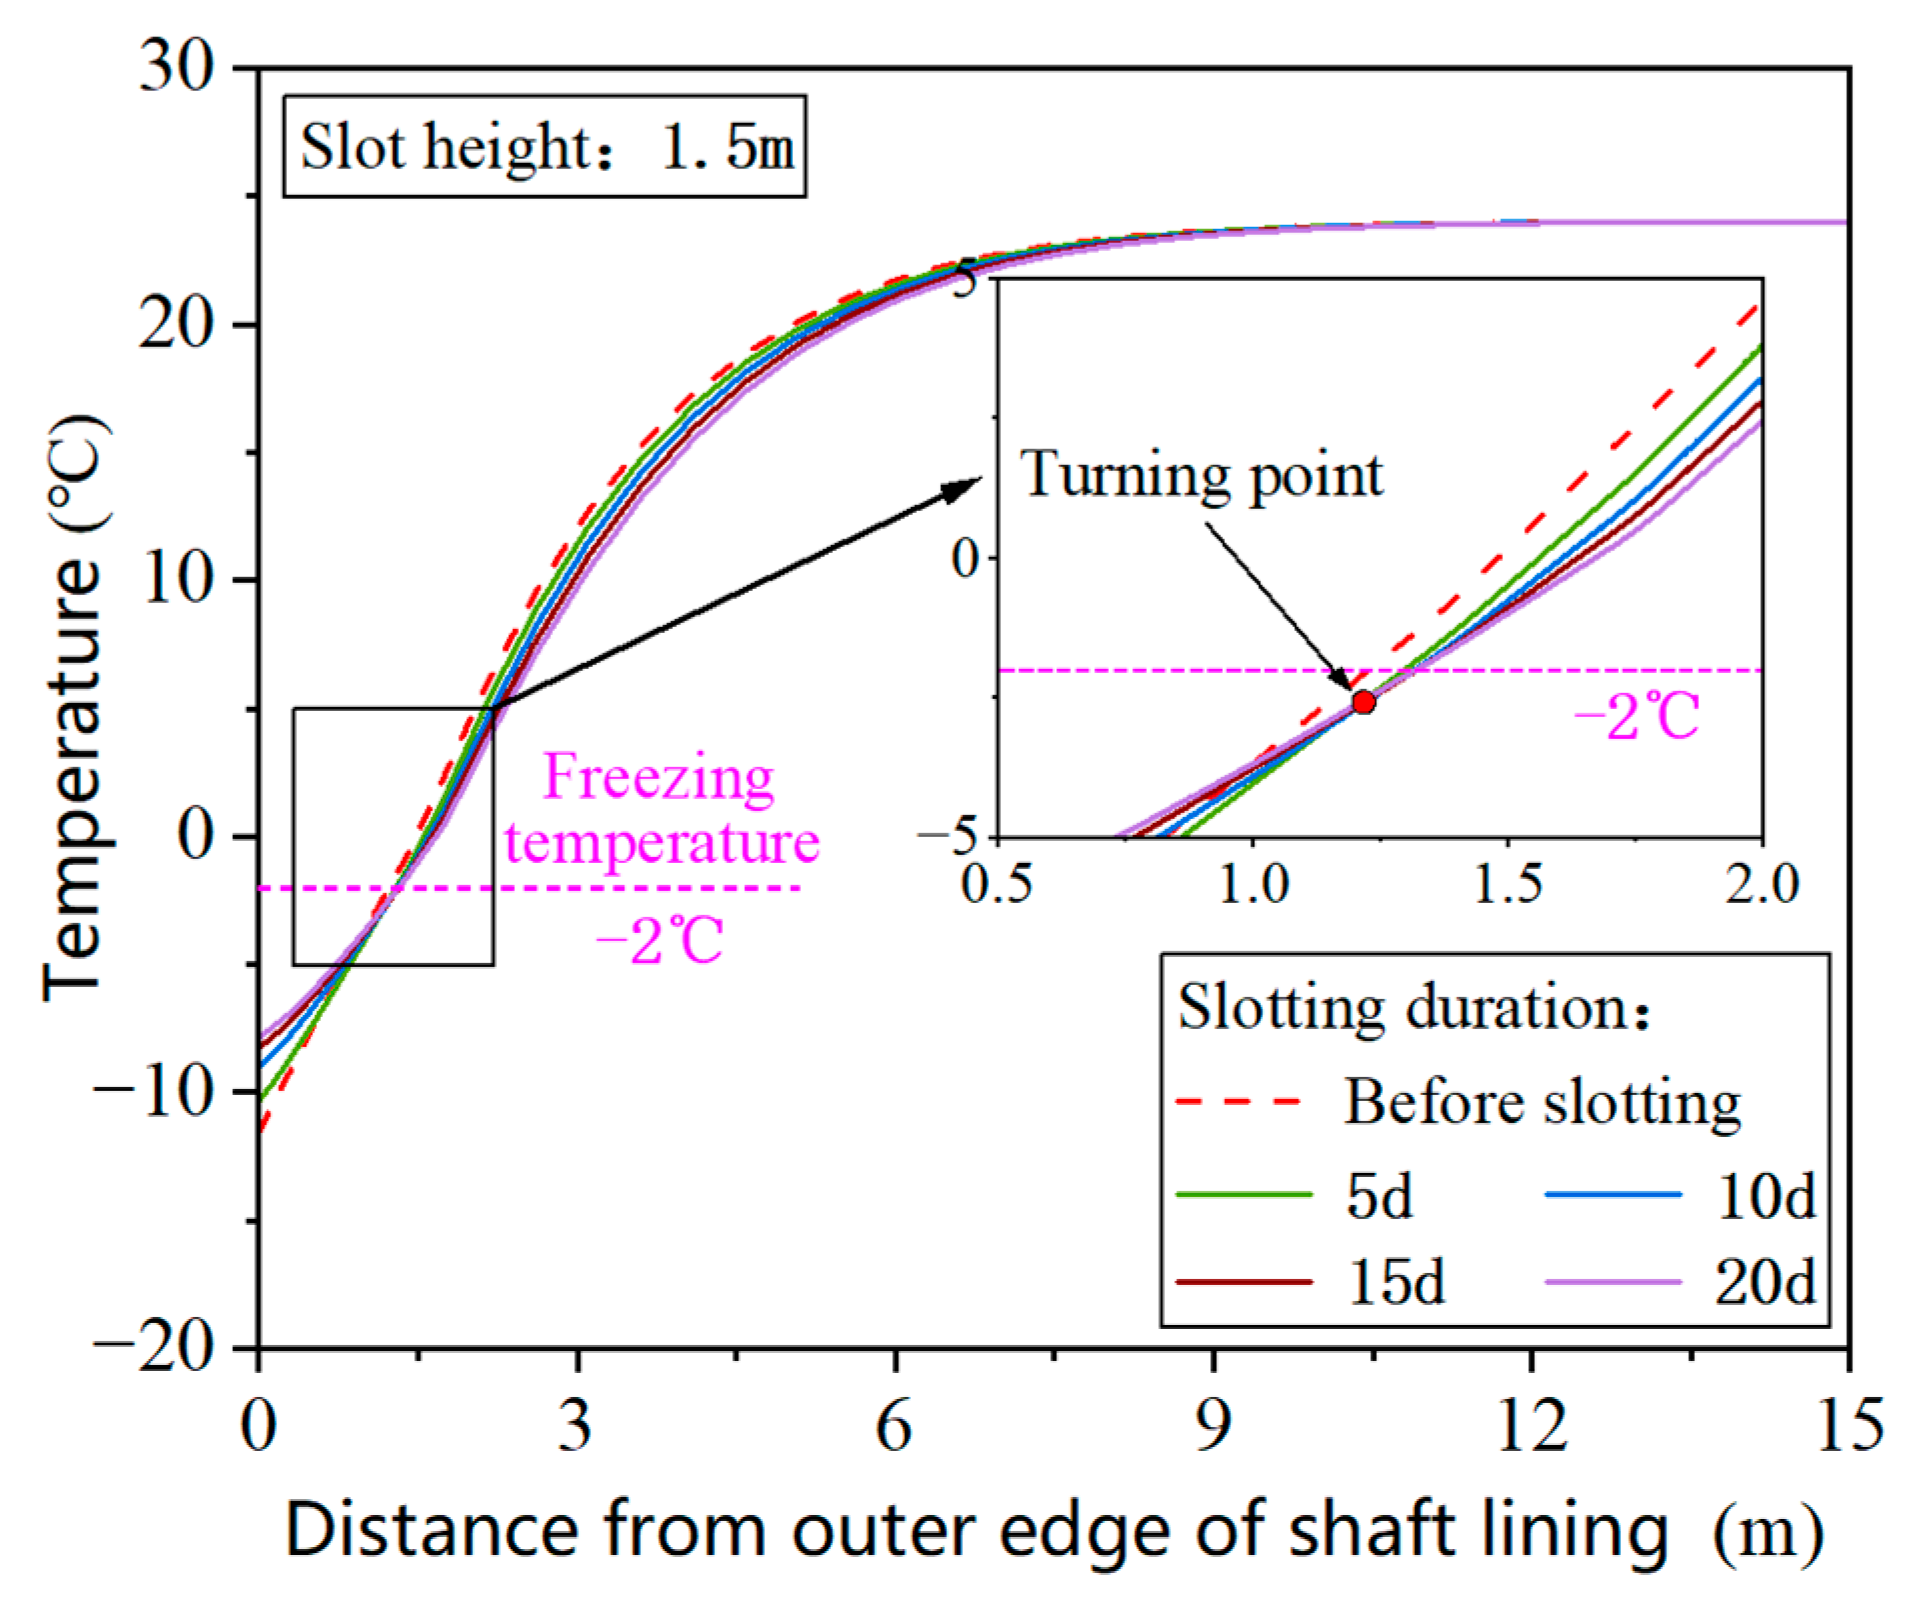
The temperature evolution in Monitoring Path 1 for different slotting durations is illustrated in Figure 22. As the slotting duration increased, the horizontal range of the warming zone adjacent to the slotting zone increased. The upper and lower freezing pipes near the slotting zone extracted heat from the concrete shaft lining and the surrounding clay stratum. Due to the combined effects of convective heat transfer in the slotting zone and the cooling caused by the freezing pipes, a turning point (Figure 22) occurred on the temperature curve at 1.21–1.22 m from the outer edge of the outer shaft lining. When the distance from the outer edge of the outer shaft lining was less than the value of the turning point, the temperatures increased with the slotting duration. In contrast, the temperature decreased at positions larger than this value.
As the slotting duration increased, the horizontal range of the temperature rise adjacent to the slotting zone increased. The horizontal ranges of the warming zone were 0.61 m, 0.81 m, 0.97 m, and 1.04 m for slotting durations of 5 d, 10 d, 15 d, and 20 d, respectively. The final temperatures in the regions of temperature increase were below −4 °C (<−2 °C). Although a temperature increase was observed in the freezing wall adjacent to the shaft lining during slotting, the freezing wall never thawed, and the frozen zone expanded outward.
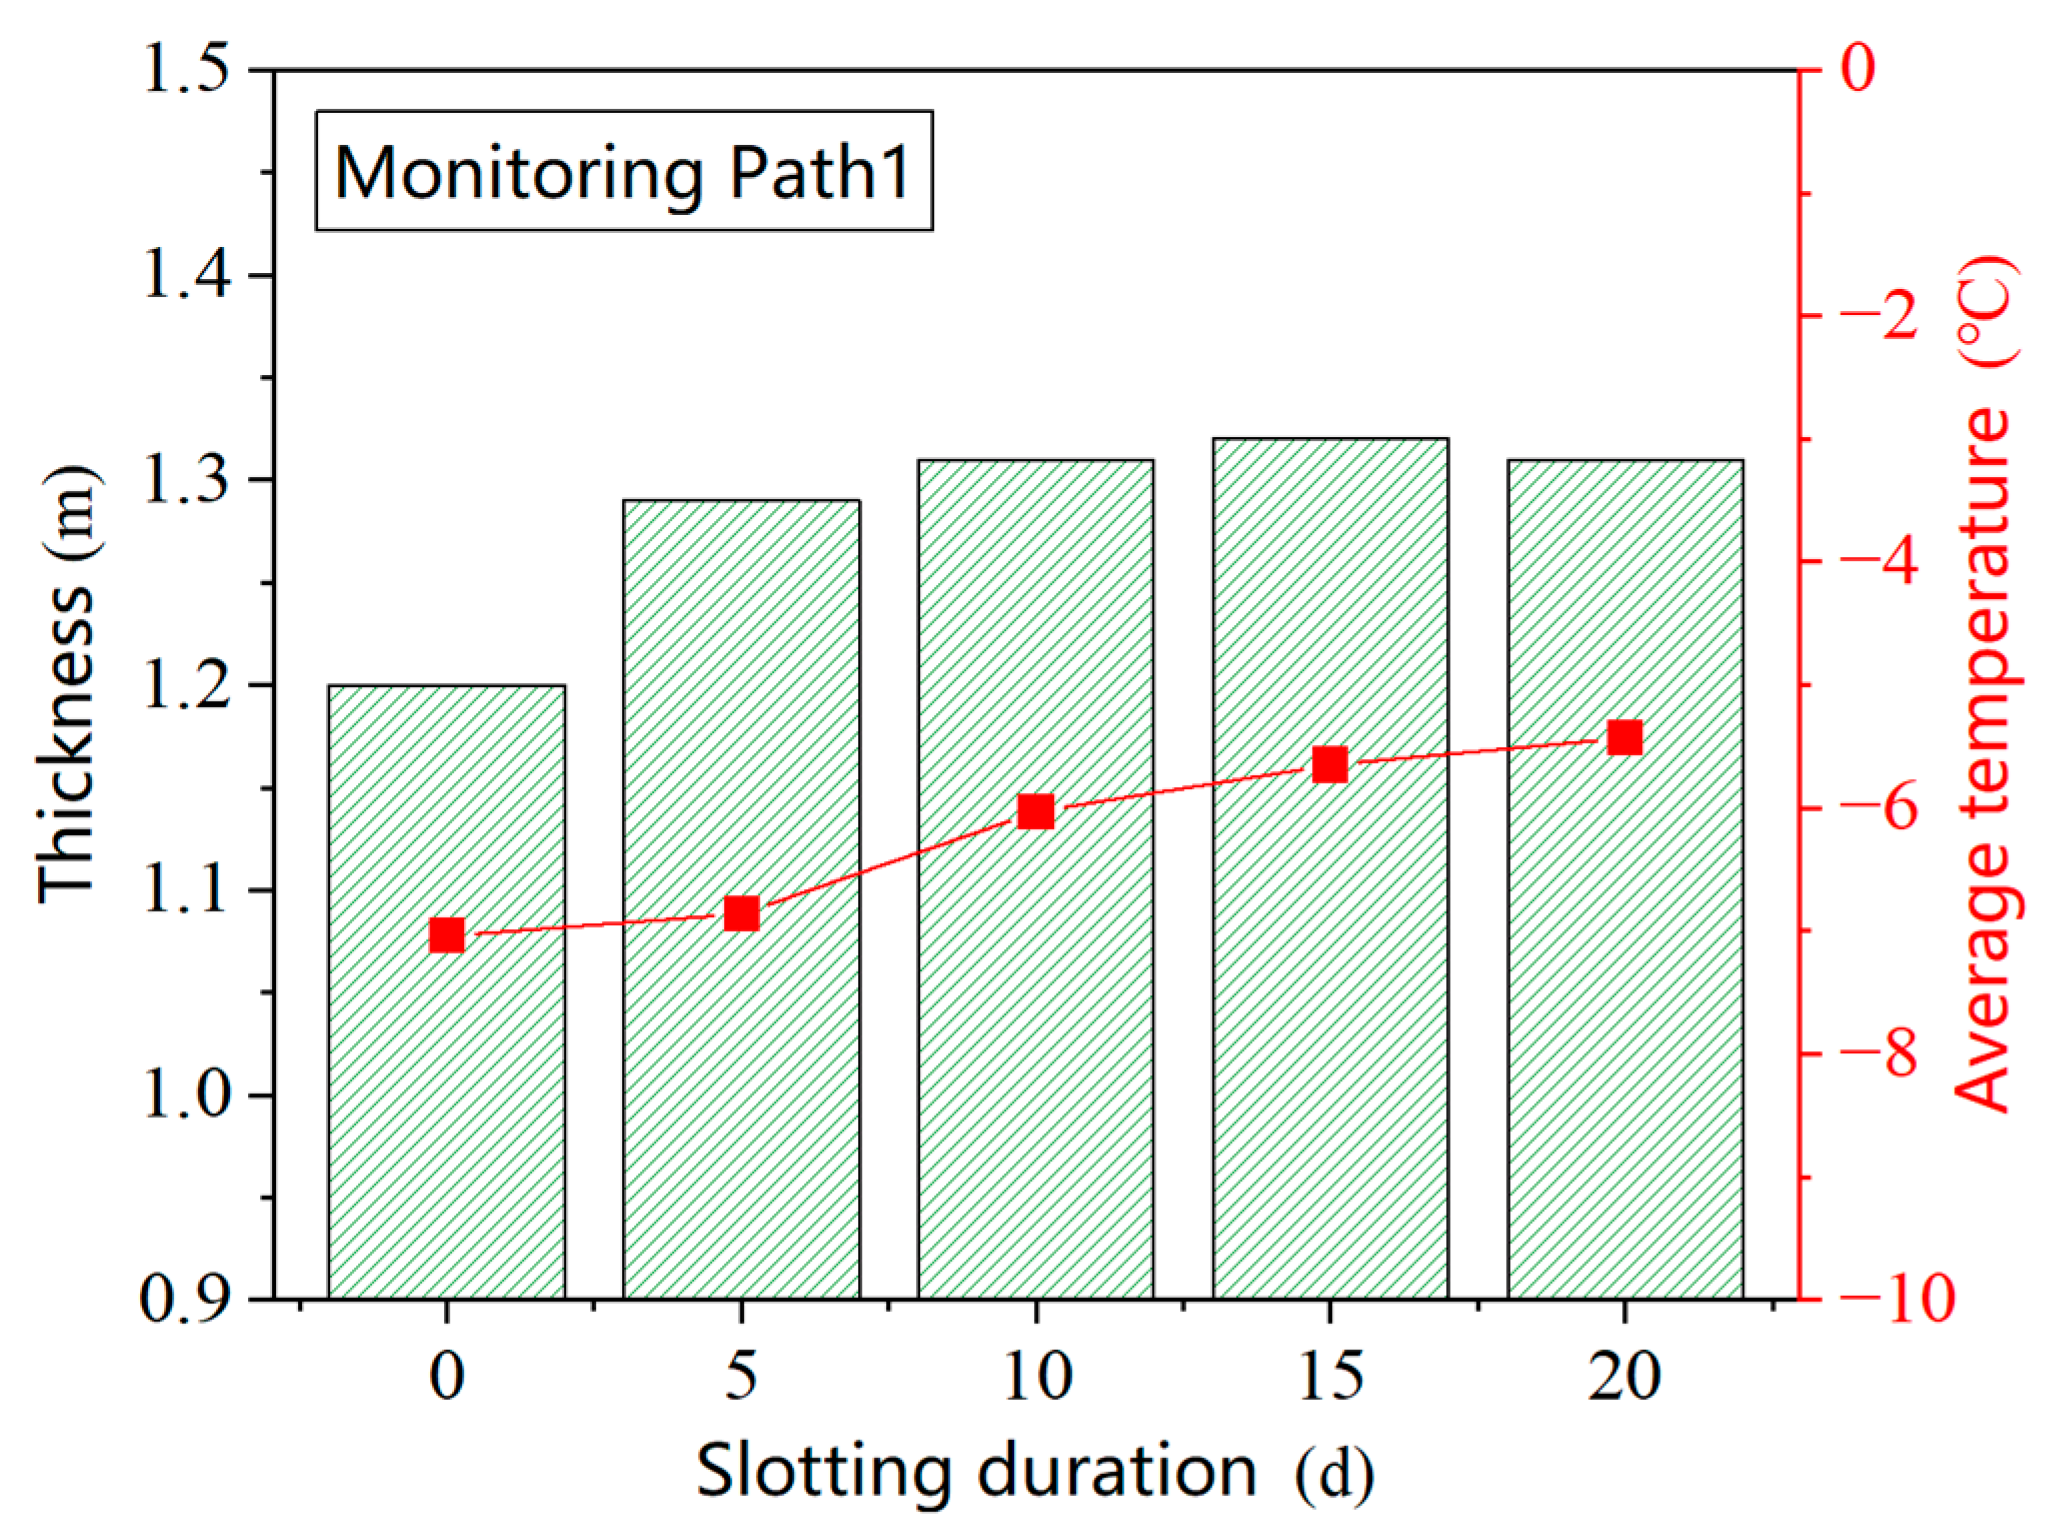
As depicted in Figure 22 and Figure 23, the freezing wall expanded outward during slotting at a freezing temperature of −2 °C. The rate of increase in the thickness of the freezing wall increased and decreased with the slotting duration, reaching the maximum value on the 15th day of slotting. Conversely, the average temperature increased during the slotting period. The freezing wall thicknesses were 1.29 m, 1.31 m, 1.32 m, and 1.31 m after 5 days, 10 days, 15 days, and 20 days, respectively, at a slot height of 1.5 m, and the average temperatures were −6.86 °C, −6.03 °C, −5.65 °C, and −5.43 °C. The thickness of the freezing wall was 0.09 m, 0.11 m, 0.12 m, and 0.11 m larger, and the average temperature was 0.18 °C, 1.01 °C, 1.39 °C, and 1.61 °C higher after slotting than before slotting.

5. Conclusions

In this study, we proposed a localized freezing method on the inside of a vertical shaft. At freezing temperatures of −27.5 °C to −35 °C, the daily average growth rate of the freezing wall behind the slotting zone during one year was linearly negatively correlated with the freezing temperature, and the average growth rate was −0.00033 m/(d∙°C). The same trend was observed between the shaft lining thickness (0.5 to 2.5 m) and the freezing temperature, with an average growth rate of −0.00262 m/(d∙m). Using the thickness of the freezing wall behind the slotting zone reaching 1.2 m as the slotting criterion, a freezing duration of 123 days is required under typical operational parameters. During the slotting process, with a slot height ranging from 0.5 to 2.0 m, the freezing wall remained intact without thawing over a 15-day continuous excavation period and exhibited ongoing outward expansion.
Due to the assumption in the numerical model that the formation is uniform, continuous, and isotropic, the parameters are idealized compared to the actual situation. Therefore, the simulation results have certain limitations and cannot accurately characterize freezing factors such as uneven cracks in the actual strata. In the next phase of study, we will expand the scope of physical model experiments and incorporate field practice to identify and analyze the scientific and engineering problems associated with implementing the localized freezing method.

Author Contributions

Conceptualization, W.Y.; methodology, Y.Z. and Y.W.; formal analysis, Z.Y. and C.Z. (Chi Zhang); Software, Y.Z. and Y.M.; investigation, T.H. and T.L.; project administration, W.Y.; supervision, C.Z. (Cheng Zou); writing—original draft, Y.Z. and Y.W.; writing—review and editing, Y.Z. and C.Z. (Chi Zhang). All authors have read and agreed to the published version of the manuscript.

Funding

This research was funded by the National Natural Science Foundation of China (No. 42302273), Natural Science Foundation of Jiangsu Province (No. BK20231080), China Postdoctoral Science Foundation (No. 2022M713367), the Foundation Research Project of Xuzhou (No. KC22061), and Fundamental Research Funds for the Central Universities (No. 2022QN1025).

Institutional Review Board Statement

Not applicable.

Informed Consent Statement

Not applicable.

Data Availability Statement

The original contributions presented in the study are included in the article. Further inquiries can be directed to the corresponding author.

Conflicts of Interest

Author Yuhang Wang was employed by the company Nanjing Jianye Civicism Construction Co., Ltd. Author Yongjie Ma was employed by the company Zhejiang Huadong Geotechnical Investigation & Design Institute Co., Ltd. The remaining authors declare that the research was conducted in the absence of any commercial or financial relationships that could be construed as a potential conflict of interest.

References

  1. Yang, W.H.; Huang, S.X.; Wang, Y.S.; Li, W.; Yang, Z.J.; Ren, Y.L.; Han, T.; Zhang, C.; Zhang, T.; Luo, T.T.; et al. Development and prospect of freezing shaft lining technology for vertical mine shafts in China. J. China Coal Soc. 2025, 50, 92–114. (In Chinese) [Google Scholar]
  2. Qing, Y.; Ikuta, S.; Shimada, H.; Sasaoka, T.; Matsui, K. Application of Underground Continuous Impervious Curtain to Shaft Lining Rupture Treatment in Eastern Chinese Coal Mines. Mem. Fac. Eng. Kyushu Univ. 2012, 72, 39–53. [Google Scholar]
  3. Wu, Y.; Zhu, S.Y.; Li, X.Z.; Zhang, H.; Huang, Z. Distribution characteristics of the additional vertical stress on a shaft wall in thick and deep alluvium: A simulation analysis. Nat. Hazards 2019, 96, 353–368. [Google Scholar] [CrossRef]
  4. Yu, G.C. The prevention of cracking and water leakage in the concrete inner lining of frozen shafts. Int. J. Min. Geol. Eng. 1986, 4, 247–251. [Google Scholar]
  5. Zhang, J.; Zhang, X.; Guo, X.; Jiang, J.; Wu, L. Water in rush Analysis and Manage Measures of Shaft Sinking by Freezing Method. Disaster Adv. 2012, 5, 452–456. [Google Scholar]
  6. Zhang, L.; Cong, Y.; Jiang, H.; Erdi, A.; Wang, Z. Failure criterion for concrete shafts in deep alluvium zones based on plastic ultimate strain and its application. Environ. Earth Sci. 2021, 80, 207. [Google Scholar] [CrossRef]
  7. Chen, C.; Zhou, J.; Zhou, T.; Yong, W.X. Evaluation of vertical shaft stability in underground mines: Comparison of three weight methods with uncertainty theory. Nat. Hazards 2021, 109, 1457–1479. [Google Scholar] [CrossRef]
  8. Yu, Q.; Miao, H.; He, X.; Lin, M.; Guo, R.; Zhang, K. Experimental study on influence of additional stress induced by hydrophobic drainage on vertical shaft-lining. Min. Metall. Explor. 2023, 40, 667–689. [Google Scholar] [CrossRef]
  9. Ma, F.S.; Deng, Q.H.; Cunningham, D.; Yuan, R.M.; Zhao, H.J. Vertical shaft collapse at the Jinchuan Nickel Mine, Gansu Province, China: Analysis of contributing factors and causal mechanisms. Environ. Earth Sci. 2013, 69, 21–28. [Google Scholar] [CrossRef]
  10. Sun, Q.H.; Ma, F.S.; Guo, J.; Li, G.; Feng, X.L. Deformation Failure Mechanism of Deep Vertical Shaft in Jinchuan Mining Area. Sustainability 2020, 12, 2226. [Google Scholar] [CrossRef]
  11. Li, W.P.; Li, X.Q. Mechanism of rupture of shaft linings in coal mine areas buried by thick over-soils in East China. Géotechnique 2005, 55, 237–244. [Google Scholar] [CrossRef]
  12. Wang, Z.H.; Zhang, L.; Han, Y.W. Study on the Mechanism and Repair Technology of Vertical Shaft Wall Rupture in Huayuan Coal Mine. Shandong Coal Sci. Technol. 2023, 41, 192–198. (In Chinese) [Google Scholar]
  13. Wu, Z.; Wang, X.D.; Wu, G.H.; Zhu, M.C. Mechanism and control technology of water inrush from shaft freezing holes after thawing. Coal Geol. Explor. 2015, 43, 35–42. (In Chinese) [Google Scholar]
  14. Zhelnin, M.; Kostina, A.; Plekhov, O.; Levin, L. Numerical simulation of soil stability during artificial freezing. Procedia Struct. Integr. 2019, 17, 316–323. [Google Scholar] [CrossRef]
  15. Chen, W.; Wan, W.; He, H.; Liao, D.X.; Liu, J. Temperature Field Distribution and Numerical Simulation of Improved Freezing Scheme for Shafts in Loose and Soft Stratum. Rock Mech. Rock Eng. 2024, 57, 2695–2725. [Google Scholar] [CrossRef]
  16. Yao, Z.S.; Cai, H.B.; Xue, W.P.; Wang, X.J.; Wang, Z.J. Numerical simulation and measurement analysis of the temperature field of artificial freezing shaft sinking in Cretaceous strata. API Adv. 2019, 9, 025209. [Google Scholar] [CrossRef]
  17. Pilecki, Z.; Krawiec, K.; Pilecka, E.; Nagy, S.; Latka, T. Temperature anomaly as an indicator of groundwater flow prior to the shaft sinking with the use of artificial ground freezing. Eng. Geol. 2025, 347, 107916. [Google Scholar] [CrossRef]
  18. Sanger, F.J. Ground freezing in construction. J. Soil Mech. Found. Div. 1968, 94, 131–158. [Google Scholar] [CrossRef]
  19. Sanger, F.J.; Sayles, F.H. Thermal and Rheological Computations for Artificially Frozen Ground Construction. Dev. Geotech. Eng. 1979, 26, 311–337. [Google Scholar]
  20. Yang, W.H.; Huang, J.H. Numerical Analysis on the Heat Flux Density of a Freezing Pipe with Constant Outer Surface Temperature. J. Glaciol. Geocryol. 2006, 3, 401–405. (In Chinese) [Google Scholar]
  21. Hu, J.; Wang, X.B.; Jiang, B.R. Numerical Analysis of Temperature Field of Vertical Frozen Soil Wall Reinforcement at Shield Shaft. Adv. Mater. Res. 2014, 918, 218–223. [Google Scholar] [CrossRef]
  22. Li, H. Analysis of the Mechanical Characteristics of the Existing and Newly Built Shaft Wall During the Freezing Repair of the Damaged Shaft. Master’s Thesis, Anhui University of Science and Technology, Huainan, China, 2021. (In Chinese). [Google Scholar]
  23. Cheng, H.; Zhou, R.H.; Yao, Z.S.; Ju, X.B.; Wang, X.J. Study on shaft damage control technology of water inrush and sand burst in drilling process with thick topsoil and thin bedrock. Coal Sci. Technol. 2021, 49, 176–185. (In Chinese) [Google Scholar]
  24. Zhelnin, M.; Kostina, A.; Prokhorov, A.; Plekhov, O.; Semin, M.; Levin, L. Coupled thermo-hydro-mechanical modeling of frost heave and water migration during artificial freezing of soils for mineshaft sinking. J. Rock Mech. Geotech. Eng. 2022, 14, 537–559. [Google Scholar] [CrossRef]
  25. Wang, Y.S.; Yang, R. Monitoring and analysis of the stress and deformation of shaft lining and the influence of freezing tube fracture in deep topsoil. Cold Reg. Sci. Technol. 2022, 193, 103420. [Google Scholar] [CrossRef]
  26. Levin, L.; Golovatyi, I.; Zaitsev, A.; Pugin, A.; Semin, M. Thermal monitoring of frozen wall thawing after artificial ground freezing: Case study of Petrikov Potash Mine. Tunn. Undergr. Space Technol. 2021, 107, 103685. [Google Scholar] [CrossRef]
  27. Liu, Y.; Li, K.Q.; Li, D.Q.; Tang, X.S.; Gu, S.X. Coupled thermal–hydraulic modeling of artificial ground freezing with uncertainties in pipe inclination and thermal conductivity. Acta Geotech. 2022, 17, 257–274. [Google Scholar] [CrossRef]
  28. Han, C.; Xu, J.; Zhang, W.; Wei, J.; Yang, F.; Yin, H.; Xie, D. Assessment and grouting of water inrush induced by shaft-freezing holes in the Yingpanhao coal mine, Inner Mongolia, China. Mine Water Environ. 2022, 41, 16–29. [Google Scholar] [CrossRef]
  29. Li, W.N.; Yang, X.; Lu, C.D.; Li, Q.X.; Fang, P.; Wu, X.; Huang, H.Y.; Fan, H.P.; Yao, N.P.; Tian, H.L.; et al. Modeling and optimization of trajectory deviation for compound directional drilling in coal mines. Neurocomputing 2025, 618, 129029. [Google Scholar] [CrossRef]
  30. Zhang, J.; Li, F.; Liu, S.; Wu, W.D.; Yu, X. Early age cracking potential of inner lining of coal mine frozen shaft. Energy Rep. 2022, 8, 16–24. [Google Scholar] [CrossRef]
  31. Song, C.Y. Research and Application of Slotting and Directional Blasting Technology for the Shrinkable Layer of Vertical Well Wall. Shandong Coal Sci. Technol. 2024, 42, 41–51. (In Chinese) [Google Scholar]
  32. Wang, X.J.; Yao, Z.S.; Rong, C.X.; Cai, H.B.; Cheng, H. Design and model test of shaft lining compressible connector in deep hydrophobic alluvium. Procedia Environ. Sci. 2012, 12, 864–870. [Google Scholar]
  33. COMSOL Co., Ltd. LiveLink for MATLAB User’s Guide COMSOL Multiphysics® V.6.0. COMSOL AB; COMSOL Co., Ltd.: Stockholm, Sweden, 2021. [Google Scholar]
  34. Ren, Y.L. Study on bearing capacity of cylindraceous double-concrete shaft lining. Adv. Mater. Res. 2012, 368, 3022–3027. [Google Scholar] [CrossRef]
Figure 1. Onsite photo of shaft lining disaster: (a) concrete spalling and inward bending of longitudinal steel bars; (b) spray water and sand at ruptured shaft lining in soil layer section [1].
Applsci 15 07144 g001
Figure 2. Schematic diagram of the double-layer composite shaft structure and the process of adding a collapsible device with the assistance of localized freezing.
Applsci 15 07144 g002
Figure 3. Schematic diagram of layered detachable freezing pipes.
Applsci 15 07144 g003
Figure 4. Evolution curve of temperature with freezing time in saturated clay freezing test.
Applsci 15 07144 g004
Figure 5. The schematic diagram of three-dimensional numerical model and detailed dimensions.
Applsci 15 07144 g005
Figure 6. Schematic diagram of the structure and dimensions of the physical simulation experiment.
Applsci 15 07144 g006
Figure 7. Photos of physical simulation experiment process.
Applsci 15 07144 g007
Figure 8. Comparison of freezing wall thickness data between physical simulation and numerical simulation.
Applsci 15 07144 g008
Figure 9. Nephogram of the temperature field evolution for typical parameters.
Applsci 15 07144 g009
Figure 10. Evolution of freezing wall thickness in vertical direction for typical parameters.
Applsci 15 07144 g010
Figure 11. Growth rate and average temperature of freezing wall for two monitoring paths.
Applsci 15 07144 g011
Figure 12. Evolution of freezing wall thickness and average temperature in Monitoring Path 1 for different freezing temperatures.
Applsci 15 07144 g012
Figure 13. Evolution of freezing wall thickness and average temperature in Monitoring Path 2 for different freezing temperatures.
Applsci 15 07144 g013
Figure 14. Average growth rate of freezing wall thickness and fitted curves for different freezing temperatures.
Applsci 15 07144 g014
Figure 15. Evolution of freezing wall thickness and average temperature in Monitoring Path 1 for different shaft lining thicknesses.
Applsci 15 07144 g015
Figure 16. Evolution of freezing wall thickness and average temperature in Monitoring Path 2 for different shaft lining thicknesses.
Applsci 15 07144 g016
Figure 17. Average growth rate of freezing wall thickness and fitted curves for different shaft lining thicknesses.
Applsci 15 07144 g017
Figure 18. Nephogram of the temperature field for different slot heights after 15 days.
Applsci 15 07144 g018
Figure 19. Temperature evolution in Monitoring Path 1 for different slot heights.
Applsci 15 07144 g019
Figure 20. Thickness and average temperature of the freezing wall at different slot heights after 15 days.
Applsci 15 07144 g020
Figure 21. Nephogram of the temperature field for different slotting durations after 15 days.
Applsci 15 07144 g021
Figure 22. Temperature evolution in Monitoring Path 1 for different slotting durations.
Applsci 15 07144 g022
Figure 23. Thickness and average temperature of freezing wall for different slotting durations at 1.5 m slot height.
Applsci 15 07144 g023
Table 1. Summary of material parameters.
PropertiesConcreteDry ClayAirWaterIce
Density
(kg/m3)
252415711.2251000920
Capacity
(J/(kg·°C))
921472100641822060
Thermal conductivity
(W/(m·°C))
2.651.740.02420.602.14
Table 2. Summary of simulation schemes.
ParameterSymbolTypical ValueVariable Values
Freezing temperature
(°C)
T f −30−27.5, −32.5, −35
Total thickness of shaft lining
(m)
H21, 1.5, 2.5
Height of slotting zone
(m)
h1.50.5, 1, 2
Duration of slotting
(d)
S155, 10, 20
Table 3. Summary of evolution data of frozen wall thickness over time under two monitoring paths.
Thickness (m)90 d180 d270 d360 d
Path 10.741.892.783.48
Path 20.441.271.872.33
Disclaimer/Publisher’s Note: The statements, opinions and data contained in all publications are solely those of the individual author(s) and contributor(s) and not of MDPI and/or the editor(s). MDPI and/or the editor(s) disclaim responsibility for any injury to people or property resulting from any ideas, methods, instructions or products referred to in the content.