Abstract
This paper presents our own design of a research station and exemplary experimental analyses of the iontophoresis process, i.e., a method of electrotransporting substances using direct current. This technique has a wide application in medicine, especially in controlled drug delivery. The first part of this paper discusses the theoretical foundations of iontophoresis, mechanisms of action and its current applications. Then, the design of the research station is described in detail, taking into account its key structural elements, including electrodes made of 316L surgical steel and electrical parameters of work and the adopted research methodology. For the analyzed group of solutions, a power supply with adjustable voltage in the range of 1 to 10 V and current protection up to 400 mA should be used. Additionally, the operation of the constructed setup requires a direct current power source. The tests also showed that the temperature of the solutions, ranging from 26 °C to 40 °C, does not significantly affect the selection of the appropriate power supply for the iontophoresis device. The conducted experimental research clearly demonstrated the usefulness of the setup for identifying the parameters of the iontophoresis process.
1. Introduction
Physiotherapy, especially electrotherapy, is one of the key elements of the modern rehabilitation process, which supports the treatment of various human health disorders, such as musculoskeletal diseases, neuropathic pain or inflammations [1]. Modern rehabilitation techniques such as iontophoresis offer effective methods of treatment that use electric current to transport active substances deep into the patient’s body [2]. This treatment is gaining popularity thanks to its effectiveness in treating many diseases, in particular in cases where traditional methods of treatment fail or are insufficient. Iontophoresis consists of using electric current to transport ions of medicinal substances through the patient’s skin and biological membranes [3]. These substances can be used for treating inflammation, infections, pain and problems associated with the musculoskeletal system [4]. However, the effectiveness of this process depends largely on the electrical properties of the water solutions used in the treatment [5]. There exist a number of parameters that influence the effectiveness of iontophoresis therapy, and the key one is a thorough analysis of the electrical conductivity, resistivity and dielectricity of these solutions. These terms are defined as follows [6,7,8,9,10]:
- -
- Electrical conductivity is a measure of a solution’s ability to conduct electrical current. In iontophoresis, this indicates how well the solution will be able to carry the electrical charge needed to transport medicinal substances into the body. High conductivity is important because it ensures an adequate volume of energy to transport the ions, which contributes to the effective introduction of the preparations into the deeper tissue layers. Too low conductivity can lead to a weaker therapeutic effect because not all of the ions can be transported to the required locations.
- -
- Resistivity, also known as the inverse of conductivity, is a parameter that characterizes the resistance of a solution in relation to the current flowing through it. The higher the resistivity, the greater the resistance of the solution during the iontophoresis process. This is important because the resistance affects the distribution of the electric field in the tissues and also the depth of penetration of the active substances into the body. Depending on the type of disease, a precise adjustment of the solution’s resistivity can have a crucial impact on the effectiveness of the therapy. If the resistivity is too high, the medicinal substance may not penetrate deeply enough, and the iontophoresis process will become less effective.
- -
- On the other hand, dielectricity refers to the ability of a material to store electrical energy in the form of electrical charges. In the context of iontophoresis, the dielectricity of a solution affects the interaction of particles with an electrical field, as well as the processes of ion transport within the skin and other tissues. Different active substances are characterized by different dielectric properties, which influence the way they flow during the iontophoresis treatment.
Understanding these relationships makes it possible to better adjust the solution parameters to specific therapeutic needs. In the context of modern rehabilitation devices that are used in iontophoresis, the analysis of these parameters is essential to ensure optimal therapy conditions. Modern technologies for generating currents in electrotherapy require a precise selection of materials and electrical parameters that enable the effective and safe performance of the treatment [11]. Modern devices must be designed in such a way that they supply the right amount of energy to the solution, while not exceeding safe voltage and current values that could damage the patient’s tissues [12,13]. Furthermore, these devices must be equipped with systems for monitoring and controlling treatment parameters to ensure maximum effectiveness and minimize the risk of any undesirable effects. The optimization of the electrical parameters of water solutions and devices used in electrotherapy is also of great importance in view of the diversity of patients and types of disorders. Each patient is different and the selection of the appropriate voltage and current depends on individual needs as well as the type of disorder that requires treatment [14]. A correctly selected iontophoresis treatment, based on a detailed analysis of the solution parameters, can contribute to a significant improvement in the patient’s health and the effectiveness of rehabilitation. Understanding the physicochemical processes that occur during iontophoresis is essential for the further development of rehabilitation technologies. This allows for the design of more efficient devices and also increases the safety of patients [15,16]. Therefore, the research on the electrical properties of solutions used in electrotherapy constitutes the basis for the improvement of iontophoresis therapy and other physical therapy methods. Such an approach not only allows for optimization of the treatment process itself but also for the creation of new devices that will be more tailored to the needs of modern medicine and rehabilitation [17,18,19]. Contactless conductivity sensors are an important tool in modern analytical chemistry. They enable fast and convenient measurement of solution conductivity without the need for direct contact with the sample. Thanks to their versatility, they are used in a wide range of measurement and analytical techniques. Their development has opened up new possibilities in scientific research and industrial applications [20,21].
2. Purpose and Scope
The aim of this work is to construct a device and conduct experimental studies on it in order to identify the electrical properties of the iontophoresis process. This paper attempts to determine the electrolytic conductivity of selected solutions of substances used in the iontophoresis process. Experimental research on the device will enable the selection of its correct operating parameters. For the experiment, solutions used in the iontophoresis process and a control sample were selected: tap water (1), 1% potassium iodide (2), 1% zinc sulphate solution (3), 1,4% ephedrine hydrochloride (4), 2% sodium chloride (5), water solution 2% lidocaine hydrochloride (6), 2% calcium chloride hexahydrate (7).
3. Research Plan and Program
The following were adopted as independent variables of the experiment:
- -
- Electric current voltage , which was applied to the sample by the positive electrode using a laboratory power supply and monitored with a voltmeter;
- -
- Solution temperature , regulated by a water bath heater; the water temperature was monitored with a built-in thermometer, and the temperature T of the solution was monitored with a thermal imaging camera.
The following were assumed as dependent variables:
- -
- Current , tested on the basis of the readings from an ampere meter connected serially with the negative electrode of the solution to the laboratory power supply;
- -
- Electrical resistance , calculated based on the relationship between the results of the current Ip of the solutions and the selected voltage U on the power supply.
For the purpose of carrying out the tasks related to the main objective of the work, an experiment was planned. For this purpose, 50 mL of each solution was taken. A control sample with tap water was also determined. The samples were placed in glass beakers. To avoid contaminating and disturbing the composition of the sample being tested, a separate container of water was used in which the beakers were immersed. The water was heated to the appropriate temperatures. The parameters of the solutions were controlled with a thermal imaging thermometer, and a specially prepared heater maintained the set water temperature. After determining the appropriate liquid temperature, a waiting period of 2 min was observed before the sample was tested. The DC resistance was calculated using the formula:
where
—electrical resistance ;
—current voltage ;
—electric current .
Figure 1 shows experimental test diagram.
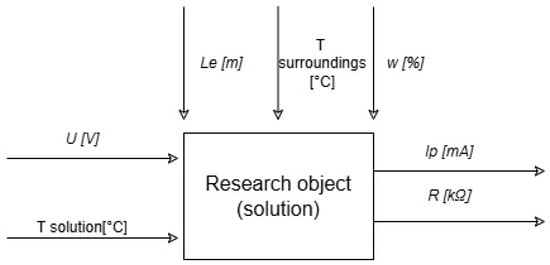
Figure 1.
Experimental tests diagram.
In the Figure 1:
—distance between the electrodes ;
—electric current voltage ;
—electric current ;
electrical resistance
;
—temperature ;
—humidity .
In the course of the conducted tests, the temperature in the laboratory was 21 °C with a relative air humidity of 55%. However, the distance between the electrodes was 0.06 m.
The values of the independent variables were adopted based on the literature [22,23] and preliminary studies conducted by the authors of this work. For the purposes of the experiment, the values of the independent variables were determined:
- -
- For the solution’s voltage ;
- -
- For the solution temperature .
4. Test Stand and Testing Methodology
For the purpose of conducting research on the iontophoresis process, a custom-made test bed was designed and constructed. The test bed consists of the following devices:
- -
- Ampere meter YFE YF-3503;
- -
- Thermal imaging camera PEAKTECH 5605;
- -
- Water bath AJL electronic MLL 147/6/A/50;
- -
- Voltmeter METEX M-3850;
- -
- Laboratory power supply unit KORAD KA3005DS;
- -
- Laboratory beaker.
Figure 2 presents a block diagram of the test bed.
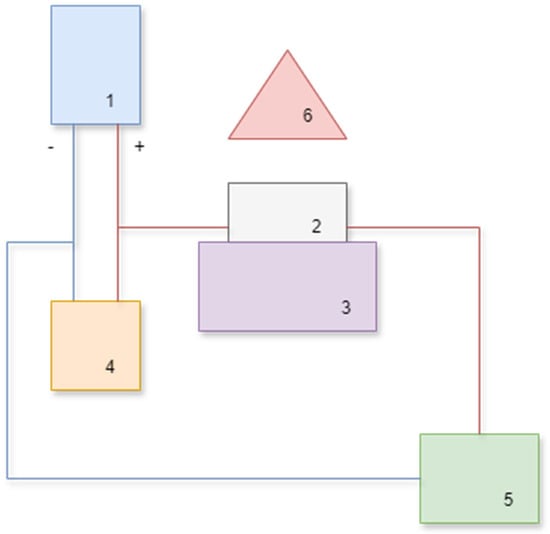
Figure 2.
Block diagram of the test bed: 1—laboratory power supply unit, 2—beaker with tested solution, 3—water bath, 4—voltmeter, 5—ampere meter, 6—thermal imaging camera.
The experiment was repeated five times for each tested sample in order to ensure the reliability and repeatability of the obtained results. After completing all five measurements, the arithmetic mean was calculated to minimize the impact of random errors and improve the accuracy of the data. The electric current, referred to as Ip, was measured at four different voltage levels: U = 1, 3, 5 and 10 V. These specific values were selected to observe the effect of increasing voltage on the current flowing through the electrolyte. For the temperature conditions during testing, the following values were used: T = 26, 30, 35, 38 and 40 °C. These temperatures were chosen intentionally, as they are within or close to the normal range of human body temperature, making the experiment relevant to potential biomedical or physiological applications. All measurements were taken only after the readings on the ammeter had stabilized to ensure that the data represented steady-state values and were not affected by momentary fluctuations. The accuracy of the conducted measurements was determined separately for each of the recorded parameters. The current Ip of the electrolyte was measured with an accuracy of ±0.8% of the reading, plus an additional uncertainty of ±1 unit. The voltage U applied to the electrolyte supply was measured with an accuracy of ±0.3% of the reading, also with an additional ±1 unit added to the uncertainty. Temperature measurements of the electrolyte T were characterized by two methods: using a thermal imaging camera with a relative accuracy of ±2%, and a water bath method with a fixed accuracy of ±1.5 °C. This approach ensured reliable and cross-verified temperature control.
Furthermore, the environmental humidity w was measured with a high precision of ±0.1% to account for any potential effects of moisture in the surroundings on the experimental results.
Figure 3 presents view of the stand.
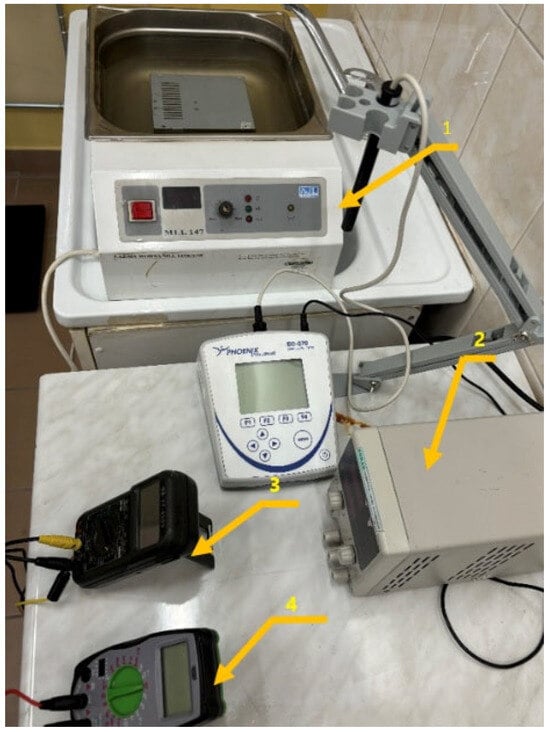
Figure 3.
View of the test stand: 1—water bath, 2—laboratory power supply unit, 3—ampere meter, 4—voltmeter.
Figure 4 presents thermal imaging of the temperature T.
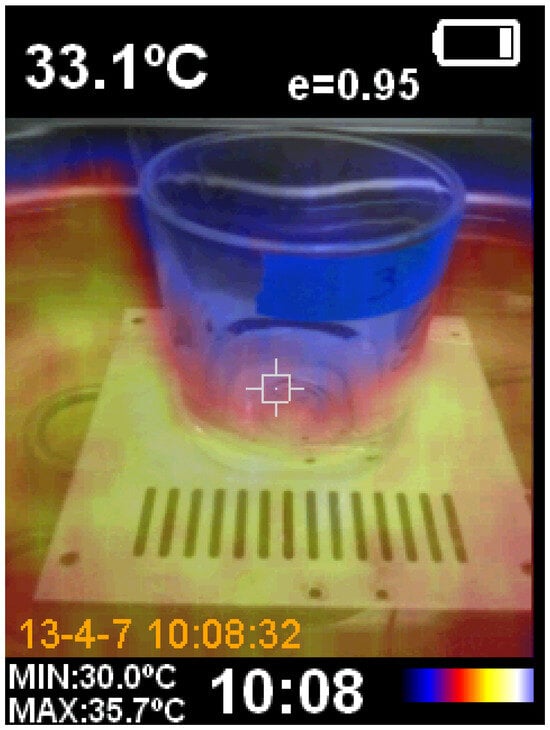
Figure 4.
Thermal imaging of the temperature T of the tested solution sample.
Figure 5 presents stainless steel electrodes that were placed in the housing using 3D printing.
Figure 5.
316L stainless steel electrodes.
The electrodes used in the experimental setup were fabricated from 316L stainless steel, a corrosion-resistant alloy classified within the Type 300 series of austenitic stainless steels. This material was selected due to its excellent resistance to chemical corrosion and its biocompatibility, making it suitable for use in electrochemical environments. To maintain the integrity and consistency of the measurements, the electrodes underwent a standardized cleaning procedure following each experimental trial. Specifically, the electrode surfaces were gently wiped with sterile gauze to remove any visible deposits or residues that may have formed during electrolysis. They were then thoroughly rinsed with demineralized water to eliminate any remaining contaminants and to restore surface cleanliness, thereby ensuring repeatability and reliability in subsequent measurements. The electrodes were positioned within a custom-designed housing, which was manufactured using modern 3D printing technology. This housing not only provided a secure structural framework but also ensured precise and repeatable placement of the electrodes inside the experimental vessel. A designated opening in the housing allowed for the insertion of hooks, which acted as stabilizing elements to prevent any movement of the electrodes during the tests. The electrodes were installed vertically and symmetrically in the central region of the beaker, maintaining a fixed interelectrode distance of 0.06 m. The experimental vessel, a cylindrical beaker, had a diameter of 0.053 m and a height of 0.072 m, corresponding to a total volume capacity of 100 mL. Throughout the testing procedures, careful attention was given to fully immersing the electrodes in the electrolyte solution to maintain consistent operating conditions. Each electrode was characterized by a height of 0.015 m and a diameter of 0.006 m, resulting in an active surface area of 0.00034 m2. This geometric configuration was selected to balance physical compactness with adequate exposure of the electrode surface to the ionic environment, thereby promoting uniform current distribution during electrochemical measurements.
5. Analysis of Test Results
The power consumption Ip changed depending on the voltage U at the power supply output and the temperature T of the solution. Chemical reactions such as sediment precipitation and tarnishing on the electrodes were observed, suggesting the movement of electrons towards the cathode and anode. The resistance R of the solutions was highest at the lowest voltage U. The program Statistica version 14.1.0.4 was used to statistically evaluate the results. For the purposes of data analysis, for the current intensity Ip of the solutions, the test results were rounded to the thousandth.
Table 1 shows the results of the research.

Table 1.
Results of the current tests Ip [mA] of the tested solutions.
The graphs presented in Figure 5 were developed on the basis of a regression analysis. The conducted analysis clearly showed a relationship between the temperature T of the solution and the current Ip. This relationship is described by quadratic dependencies. It was found that, for case (a), an increase in the temperature T of the solution causes a decrease in the current Ip of the electrolyte in the range of 26–30 °C. However, as the temperature T of the solution increases within the range of 34–40 °C, the current Ip increases. Thus, there is an extreme minimum at a temperature of about 32 °C. Therefore, there is an extreme minimum at a temperature of around 32 °C. However, for cases (b), (c) and (d), it was observed that when the temperature T of the solution increases in the range from 26 to 32 °C, the value of the electrolyte current Ip increases, reaching an extreme for the electrolyte temperature T of about 32 °C, and then the current value Ip decreases. The maximum value of current Ip of the electrolyte was approximately Ip = 120 mA and the minimum Ip = 0.3 mA. From the conducted study, it is clear that a voltage U on the electrolyte supply of more than 1 V causes a significantly higher movement of electrons. The increased movement of electrons contributes to an increase in the absorption of medicinal substances.
Figure 6 presents the influence of the temperature T of solution no. 2 on the current Ip in the electrolyte.
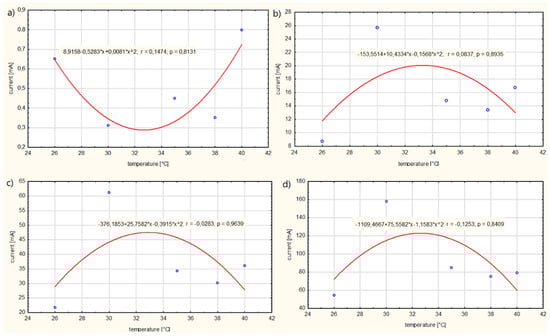
Figure 6.
Influence of the temperature T of solution no. 2 on the current Ip in the electrolyte for: (a) power supply voltage U = 1 V, (b) power supply voltage U = 3 V, (c) power supply voltage U = 5 V, (d) power supply voltage U = 10 V.
Figure 7 presents the influence of the temperature T of solution no. 3 on the current Ip in the electrolyte:
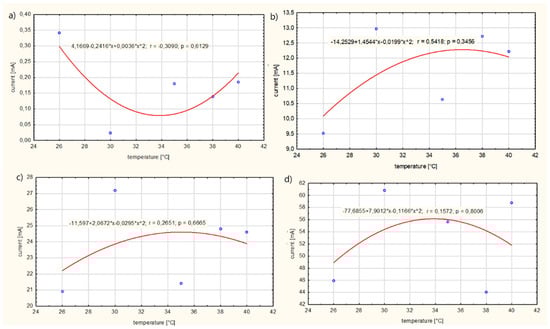
Figure 7.
Influence of the temperature T of solution no. 3 on the current Ip in the electrolyte for: (a) power supply voltage U = 1 V, (b) power supply voltage, (c) power supply voltage U = 5 V, (d) power supply voltage U = 10 V.
The regression analysis showed a correlation between the temperature T of the solution and the current consumption Ip by the electrolyte. This relationship is described by the quadratic function shown in Figure 6. It was found that, for case (a), an increase in the temperature T of the solution results in an electrolyte current density Ip decreasing in the range of 26–32 °C. However, as the temperature T of the solution increases within the range of 34–40 °C, the current intensity Ip increases. Therefore, there is an extreme minimum at a temperature of approximately 34 °C. It has been observed that, for case (b), in the temperature range T of 26–30 °C for the electrolyte, the current intensity Ip of the electrolyte increases, while, in the range of 36–40 °C, the value of the current intensity Ip of the electrolyte decreases. The extreme maximum for variant (b) was reached at a temperature of 36 °C. However, in cases (c) and (d), it was observed that, with an increase in the temperature T of the solution in the range from 26 to 34 °C, the value of the electrolyte current intensity Ip increases, reaching an extreme for the electrolyte temperature T of about 34 °C, and then the current value Ip decreases. The maximum value of the current intensity Ip of the electrolyte was reached at approximately Ip = 56 mA and the minimum at Ip = 0.06 mA. From the conducted research, it appears that a voltage U on the electrolyte supply above 1 V only causes an increased movement of electrons in the solution. Increased movement of electrons contributes to an increase in the penetration of medicinal products through the skin.
Figure 8 presents the influence of the temperature T of solution no. 6 on the current Ip in the electrolyte.
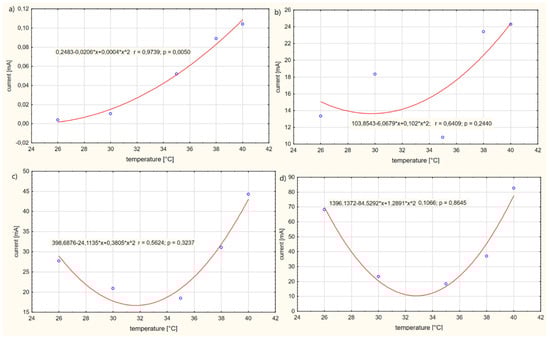
Figure 8.
Influence of the temperature T of solution no. 6 on the current Ip in the electrolyte for: (a) power supply voltage U = 1 V, (b) power supply voltage U = 3 V, (c) power supply voltage U = 5 V, (d) power supply voltage U = 10 V.
The tested influence of the temperature T of the solution on the current intensity Ip of the electrolyte can be represented by the quadratic functions shown in Figure 7. In the tested case (a), it was observed that, in the temperature range T of 26 °C to 40 °C, the current intensity Ip of the electrolyte increases, reaching a maximum value for the temperature T of the solution of 40 °C. It has been observed that, for case (b), in the temperature range T of 26–30 °C for the electrolyte, the current intensity Ip of the electrolyte decreases, while, in the range 30–40 °C, the current intensity Ip of the electrolyte increases. The maximum value of the current density Ip of the electrolyte was reached at a temperature of 40 °C. However, in cases (c) and (d), it was observed that, as the temperature T of the solution increased in the range of 26–32 °C, the value of the current intensity Ip of the electrolyte decreased, reaching a minimum extreme for the temperature T of the electrolyte of about 32 °C, and then the value of the current Ip decreased. The maximum current intensity Ip of the electrolyte was found to be approximately equal to Ip = 80 mA and the minimum Ip = 0.01 mA. From the conducted study, it results that voltage U when the electrolyte is supplied with more than 1 V causes only an increased movement of electrons in the solution. Increased movement of electrons contributes to an increase in the penetration of medicinal products through the skin.
Table 2 shows the results of the research.
Table 2.
Results of the resistance R calculations for the tested solutions.
The results of calculations of the electrolyte resistance R have been rounded to the nearest thousandth. Based on the calculations, it can be observed that, as the voltage on the power supply U increases, the electrolyte resistance R gradually decreases. At low voltages U, the current resistance R is relatively high. The resistance values R change disproportionately depending on the temperature T of the solution. The higher the voltage U, the closer the values are to each other and the minimum increase in resistance R is observed. Figure 8, Figure 9 and Figure 10 show the resistance graphs R for selected solutions.
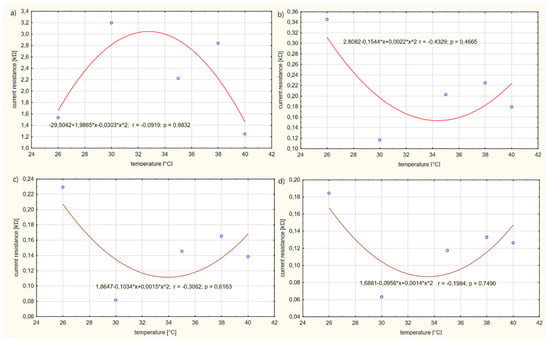
Figure 9.
Influence of the temperature T of solution no. 2 on the current resistance R of the electrolyte for: (a) power supply voltage U = 1 V, (b) power supply voltage U = 3 V, (c) power supply voltage U = 5 V, (d) power supply voltage U = 10 V.
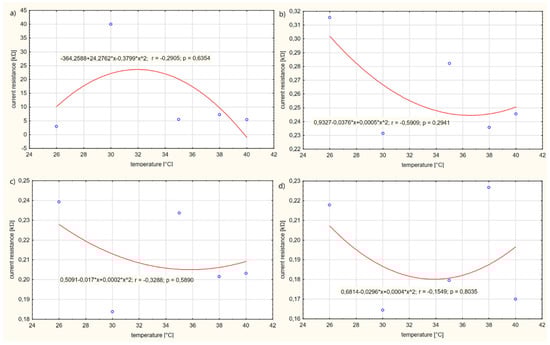
Figure 10.
Influence of the temperature T of solution no. 4 on the current resistance R of the electrolyte for: (a) power supply voltage U = 1 V, (b) power supply voltage U = 3 V, (c) power supply voltage U = 5 V, (d) power supply voltage U = 10 V.
Figure 9 presents the influence of the temperature T of solution no. 2 on the current resistance R of the electrolyte.
The functional dependencies between the resistance values R of the solutions and the temperature T of the electrolyte are best described by the second-degree curves shown in the diagrams. Certain similarities can be observed for graphs (b), (c) and (d) (Figure 8); the resistance R of the electrolyte in the temperature range T of 26–34 °C decreases, reaching a minimum extreme of about 34 °C, then increases. The course of the graph (a) differs from the other graphs in terms of temperature T of the solution at 26–33 °C; the resistance R of the solution increases, reaching a maximum extreme of about 33 °C T of the solution, then decreases. The maximum value of the electrolyte resistance R is approximately equal to R = 3 kΩ and the minimum R = 0.08 kΩ. From the conducted test, it appears that a voltage U on the electrolyte supply above 1 V only causes an increased movement of electrons in the solution. The increased movement of electrons contributes to an increase in the intensity Ip of the solution, enabling increased permeability of medicinal substances through the skin.
Figure 10 presents the influence of the temperature T of solution no. 4 on the current resistance R of the electrolyte.
The regression analysis showed a dependency between the resistance R and the temperature T of the solution. This dependency is described by a quadratic function, which is shown in the graphs. It was found that, for case (a) in the temperature range T of the solution 26–32 °C, the resistance R of the electrolyte increases, reaching a maximal extreme for the temperature T of the solution. However, as the temperature T of the solution increases in the range of values 32–40 °C, the resistance R of the solution decreases. It has been observed that, for cases (b) and (c) in the temperature range T of the electrolyte 26–36 °C, the resistance R of the electrolyte decreases. In the temperature range T of the solution, 36–40 °C, the resistance R of the electrolyte increases. Therefore, there is an extreme minimum at a solution temperature T of approx. 36 °C. In contrast, in case (d), it was observed that, with an increase in solution temperature T in the range from 26 to 34 °C, the electrolyte resistance R decreases, reaching an extreme minimum at an electrolyte temperature T of approx. 34 °C, and then the resistance R increases. The maximum value of the electrolyte resistance was shown to be approximately equal to R = 24 kΩ and the minimum R = 0.18 kΩ. From the conducted test, it appears that a voltage U on the electrolyte supply above 1 V only causes increased movement of electrons in the solution. Increased movement of electrons contributes to an increase in the electrical conductivity of the electrolyte.
Figure 11 presents the influence of the temperature T of solution no. 6 on the current resistance R of the electrolyte.
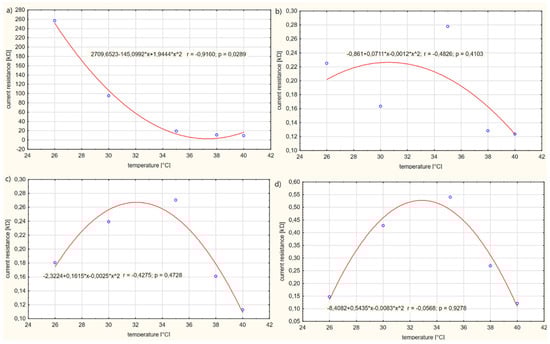
Figure 11.
Influence of the temperature T of solution no. 6 on the current resistance R of the electrolyte for: (a) power supply voltage U = 1 V, (b) power supply voltage U = 3 V, (c) power supply voltage U = 5 V, (d) power supply voltage U = 10 V.
The increase in the resistance R of electrolytes in relation to the temperature T of the solution is not proportional. The relationship between the values of resistance R and the temperature T of the solution can be described by a quadratic function. The graph for case (a) shows that, within the temperature T of the solution of 26–32 °C, the electrolyte resistance R increases, reaching a maximal extreme at a temperature of T = 32 °C of the solution. On the other hand, as the temperature T of the solution increases in the range of values from 32 to 40 °C, the resistance R of the solution decreases. It has been observed that, for cases (b) and (c), in the temperature T range for the electrolyte 26–36 °C, the resistance R of the electrolyte decreases. In the range of 36–40 °C, the resistance R of the electrolyte increases. Therefore, there is an extreme minimum at a temperature T of the solution of about 36 °C. On the other hand, in case (d), it was observed that, as the temperature T of the solution increases in the range from 26–34 °C, the value of the electrolyte resistance R decreases, reaching a minimum extreme for the electrolyte temperature T of about 34 °C, and then the resistance value R increases. The maximum value of the electrolyte resistance was shown to be approximately equal to R = 24 kΩ and the minimum R = 0.18 kΩ. The conducted study shows that a voltage U on the electrolyte supply above 1 V only causes increased movement of electrons in the solution. Increased electron movement contributes to an increase in the electrical conductivity of the electrolyte.
6. Summary
- -
- Within the investigated temperature range of the T solutions, it was shown that this factor does not significantly affect the selection of an appropriate power supply device for iontophoresis.
- -
- Electrolytes subjected to direct current exhibit electrochemical properties. During the test, a deposit formed on the electrodes, which indicates the chemical reactions taking place and electrical conductivity through selected solutions.
- -
- It was observed that the solutions stored an electrical charge. After disconnecting the power supply, the voltmeter showed a decreasing voltage U reading, which indicated that the stored electrical charge was being discharged by the electrolytes.
- -
- The factor influencing the choice of power supply for the device is the voltage U supplied to the solution. Together with the increase of voltage U on the supply of the preparation, the intensity Ip taken by electrolytes also increases, and the resistance R of the electrolyte decreases.
Author Contributions
Conceptualization, M.G. and A.B.; methodology, M.G.; software, M.G.; validation, M.G.; formal analysis, M.G.; investigation, M.G.; resources, M.G.; data curation, M.G.; writing—original draft preparation, M.G.; writing—review and editing, A.B. All authors have read and agreed to the published version of the manuscript.
Funding
This research received no external funding.
Data Availability Statement
All obtained research data are presented in the manuscript.
Conflicts of Interest
The authors declare no conflict of interest.
References
- Hosseini, S.M.; Ghandali, E.; Moghimi, H.R.; Khademi-Kalantari, K.; Moghaddam, S.T.; Baghban, A.A.; Mortazavi, S.M. A comparative evaluation of aluminum chloride hexahydrate gel iontophoresis versus tap water iontophoresis in people with primary palmar hyperhidrosis: A randomised clinical trial. Indian J. Dermatol. Venereol. Leprol. 2023, 90, 52–58. [Google Scholar] [CrossRef] [PubMed]
- Karpiński, T.M. Selected medicines used in iontophoresis. Pharmaceutics 2018, 10, 204. [Google Scholar] [CrossRef] [PubMed]
- Liatsopoulou, A.; Varvaresou, A.; Mellou, F.; Protopapa, E. Iontophoresis in dermal delivery: A review of applications in dermato-cosmetic and aesthetic sciences. Int. J. Cosmet. Sci. 2023, 45, 117–132. [Google Scholar] [CrossRef]
- Dakowicz, A.; Dzięcioł-Anikiej, Z.; Hryniewicz, A.; Judycka, M.; Ciołkiewicz, M.; Moskal-Jasińska, D.; Kuryliszyn-Moskal, A. Evaluation of the Effectiveness of Iontophoresis with Perskindol Gel in Patients with Osteoarthritis of the Knee Joints. Int. J. Environ. Res. Public Health 2022, 19, 8489. [Google Scholar] [CrossRef] [PubMed]
- Wei, D.; Pu, N.; Li, S.-Y.; Wang, Y.-G.; Tao, Y. Application of iontophoresis in ophthalmic practice: An innovative strategy to deliver drugs into the eye. Drug Deliv. 2023, 30, 2165736. [Google Scholar] [CrossRef]
- Wan Hassan, W.M.S.; Tamuri, A.R.; Zainal, R. Current and resistance. In Physics—Problems, Solutions, and Computer Calculations; Springer: Berlin/Heidelberg, Germany, 2023. [Google Scholar]
- Gała, M.; Jagieła, K.; Jąderko, A.; Rak, J. Integrated Multimotor Electrical DC Drive for Metallurgical Rolling Table. Acta Mech. Autom. 2015, 9, 93–98. [Google Scholar] [CrossRef]
- Qasem, N.A.; Generous, M.M.; Qureshi, B.A.; Zubair, S.M. Electrical conductivity. In Thermodynamic and Thermophysical Properties of Saline Water: Models, Correlations and Data for Desalination and Relevant Applications; Springer: Cham, Switzerland, 2023. [Google Scholar]
- Coetzee, D.; Venkataraman, M.; Militky, J.; Petru, M. Influence of Nanoparticles on Thermal and Electrical Conductivity of Composites. Polymers 2020, 12, 742. [Google Scholar] [CrossRef]
- Cosoli, G.; Mobili, A.; Tittarelli, F.; Revel, G.M.; Chiariotti, P. Electrical Resistivity and Electrical Impedance Measurement in Mortar and Concrete Elements: A Systematic Review. Appl. Sci. 2020, 10, 9152. [Google Scholar] [CrossRef]
- Zhou, Y.; Jia, X.; Pang, D.; Jiang, S.; Zhu, M.; Lu, G.; Tian, Y.; Wang, C.; Chao, D.; Wallace, G. An integrated Mg battery-powered iontophoresis patch for efficient and controllable transdermal drug delivery. Nat. Commun. 2023, 14, 297. [Google Scholar] [CrossRef]
- Hasan, M.; Khatun, A.; Kogure, K. Iontophoresis of Biological Macromolecular Drugs. Pharmaceutics 2022, 14, 525. [Google Scholar] [CrossRef]
- Moura, R.B.P.; Andrade, L.M.; Alonso, L.; Alonso, A.; Marreto, R.N.; Taveira, S.F. Combination of lipid nanoparticles and iontophoresis for enhanced lopinavir skin permeation: Impact of electric current on lipid dynamics. Eur. J. Pharm. Sci. 2022, 168, 106048. [Google Scholar] [CrossRef] [PubMed]
- Li, Y.; Yang, J.; Zheng, Y.; Ye, R.; Liu, B.; Huang, Y.; Zhou, W.; Jiang, L. Iontophoresis-driven porous microneedle array patch for active transdermal drug delivery. Acta Biomater. 2021, 121, 349–358. [Google Scholar] [CrossRef]
- Wang, Y.; Zeng, L.; Song, W.; Liu, J. Influencing factors and drug application of iontophoresis in transdermal drug delivery: An overview of recent progress. Drug Deliv. Transl. Res. 2022, 12, 15–26. [Google Scholar] [CrossRef]
- Dhote, V.; Bhatnagar, P.; Mishra, P.K.; Mahajan, S.C.; Mishra, D.K. Iontophoresis: A potential emergence of a transdermal drug delivery system. Sci. Pharm. 2012, 80, 1. [Google Scholar] [CrossRef] [PubMed]
- Bok, M.; Kwon, Y.I.; Huang, Z.M.; Lim, E. Portable Iontophoresis Device for Efficient Drug Delivery. Bioengineering 2023, 10, 88. [Google Scholar] [CrossRef] [PubMed]
- Tari, K.; Khamoushian, S.; Madrakian, T.; Afkhami, A.; Łos, M.J.; Ghoorchian, A.; Samarghandi, M.R.; Ghavami, S. Controlled Transdermal Iontophoresis of Insulin from Water-Soluble Polypyrrole Nanoparticles: An In Vitro Study. Int. J. Mol. Sci. 2021, 22, 12479. [Google Scholar] [CrossRef]
- Ragit, R.; Fulzele, P.; Rathi, N.V.; Thosar, N.R.; Khubchandani, M.; Malviya, N.S.; Das, S. Iontophoresis as an Effective Drug Delivery System in Dentistry: A Review. Cureus 2022, 14, e30658. [Google Scholar] [CrossRef]
- Tůma, P. Advances in the design and application of contactless conductivity detectors for separation, flow-through, microfluidic and sensing techniques: A review. Anal. Chim. Acta 2025, 1337, 343325. [Google Scholar] [CrossRef]
- Peter, C.H.; Pavel, K. Contactless Conductivity Detection for Capillary Electrophoresis—Developments From 2020 to 2024. Electrophoresis 2024. [Google Scholar] [CrossRef]
- Dumańska-Kulpa, J.; Grzybowska, I. Pomiary przewodności elektrycznej właściwej elektrolitów metodą podstawową. Metrol. Biul. Głównego Urzędu Miar 2011, 6, 31–37. [Google Scholar]
- Gromnicki, M.; Wirwicki, M. A new design of iontophoresis device designed on the basis of educational platform teams. Dev. Mech. Eng. 2023, 11, 5–14. [Google Scholar] [CrossRef]
Disclaimer/Publisher’s Note: The statements, opinions and data contained in all publications are solely those of the individual author(s) and contributor(s) and not of MDPI and/or the editor(s). MDPI and/or the editor(s) disclaim responsibility for any injury to people or property resulting from any ideas, methods, instructions or products referred to in the content. |
© 2025 by the authors. Licensee MDPI, Basel, Switzerland. This article is an open access article distributed under the terms and conditions of the Creative Commons Attribution (CC BY) license (https://creativecommons.org/licenses/by/4.0/).