1. Introduction
1.1. Terminology and Definitions
This study uses a range of symbols and parameters related to water level dynamics, ship draught, and navigational safety. The following table summarizes the key terms (
Table 1):
1.2. Strategic Role of the Fairway in Maritime Transport
The Świnoujście–Szczecin fairway is of significant importance for navigation and maritime trade. It is an important route connecting these two ports with the supply chain on land [
1,
2,
3]. These ports are an important part of this chain and allow for the optimization of goods transport to the European market. To ensure the continuity of the transport chain, ships must navigate this fairway safely and efficiently, which requires providing appropriate navigation conditions, such as fairway depth [
4,
5] and adequate water levels. Variable water levels are one of the main factors that can affect the movement of vessels [
6], directly impacting the ability of deep-draught commercial ships to pass through the fairway without the risk of downtime [
7].
The Świnoujście–Szczecin fairway constitutes one of the key inland–sea waterway connections in the southern Baltic region, linking industrial and logistic hubs in western Poland with global maritime routes. Its dual function—as a deepwater access route for ocean-going vessels and as a transit corridor for inland navigation—places it in a strategic position alongside other estuarine systems such as the Elbe (Germany), Danube (Romania), or Ems (Germany–Netherlands) rivers.
Compared to the Elbe, which faces periodic navigation restrictions due to sedimentation and tidal fluctuations in the Port of Hamburg, the Świnoujście–Szczecin route benefits from predominantly wind-driven variations, though it remains vulnerable to temporary draught limitations during low water events.
The results presented in this study contribute to the broader scientific discourse on fairway management by providing a quantifiable method for determining under-keel clearance thresholds based on historical hydrodata. While previous studies have addressed similar challenges in other estuaries, the present approach introduces a simplified yet practical framework applicable to data-rich yet morphologically dynamic waterway systems.
There is a wealth of literature on the impact of hydrometeorological conditions on navigation, but few focus on the Świnoujście–Szczecin fairway, where wind direction and speed, as well as current water levels, are significant factors affecting safe passage. The increasing demand for maritime cargo transport means that larger ships with greater draughts are appearing on the fairway, and planning their passage requires careful management of the fairway and continuous monitoring of water levels.
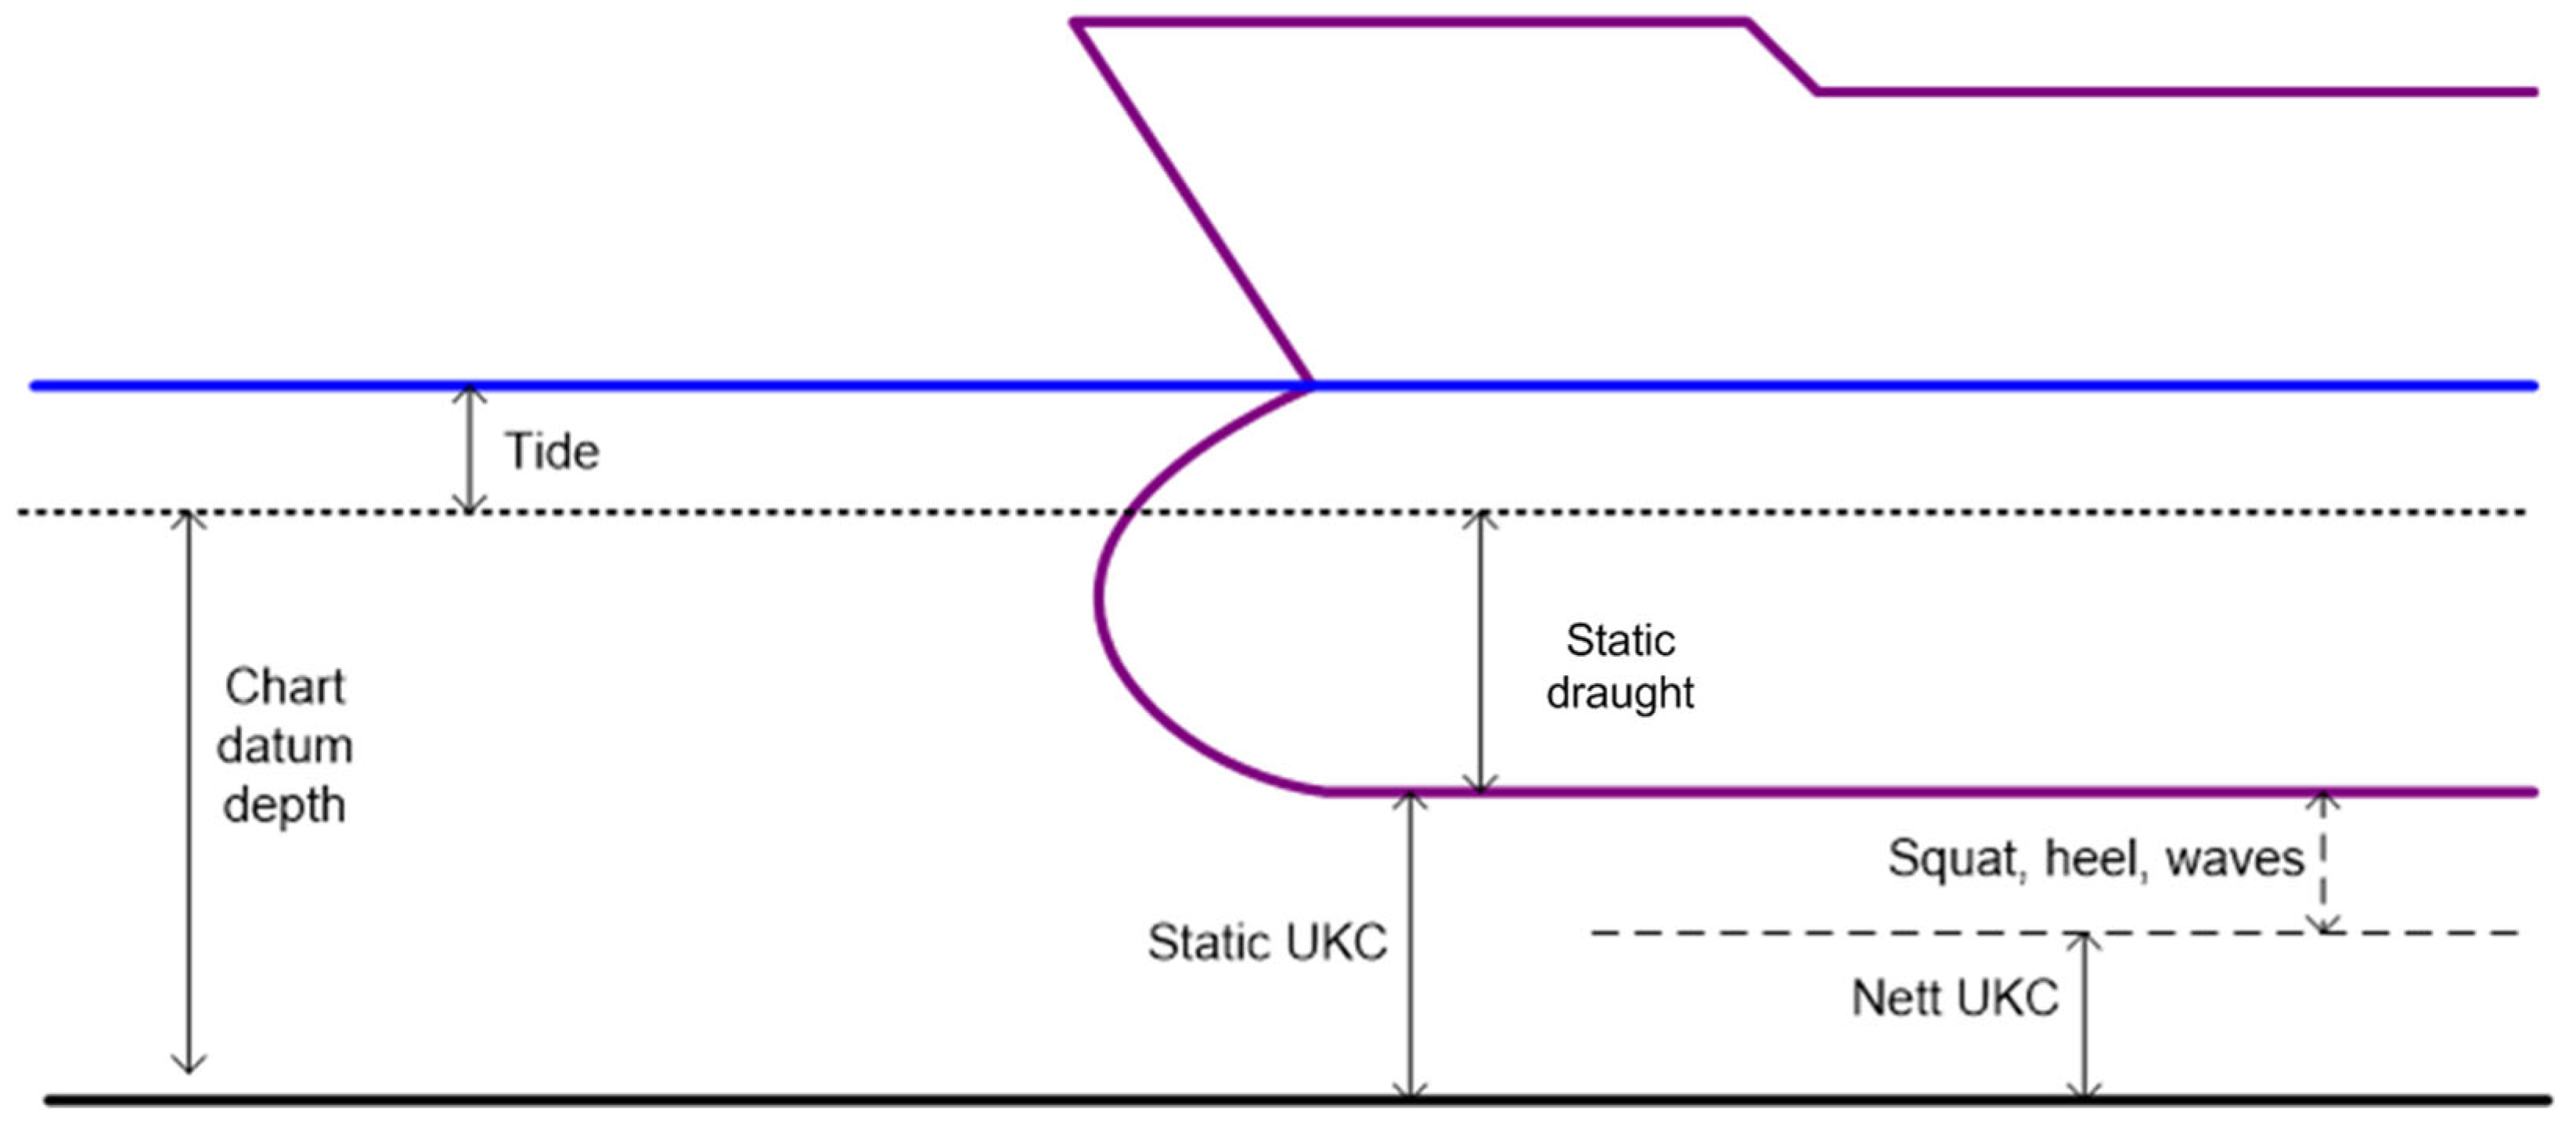
The depth of harbour water and the under-keel clearance of a vessel is a major obstacle in the management of vessels. Their safe passage through the fairway depends on the value of the under-keel clearance (UKC), which is the maximum draught of the vessel during voyages and manoeuvres. In ports, it is the maritime administration, port authorities, and ship masters who determine the required level of UKC and their objectives and needs may vary, influencing the decision to choose the appropriate UKC. The value of the UKC depends on a number of factors, including provisions for fluctuations in water level, waves, and heeling and settling of the vessel as it moves [
8]. When all these factors are of a constant value, the UKC is greater, which can lead to a vessel’s draught being reduced more than necessary. As a result, ships carry less cargo, which reduces the economic benefits for ports and shippers.
The permissible draught of a ship depends on the available amount of water under the keel (
Figure 1) and is determined by the ship’s speed on a waterway with certain parameters [
9]. The study determines the permissible draught of the “maximum ship” on the basis of the parameters of the upgraded Świnoujście–Szczecin fairway with a depth of 12.5 m [
10], using the assumptions of the dynamic keel water reserve determination system on this track [
11].
The permissible draught of the ”maximum ship” will be determined based on the parameters of the upgraded Świnoujście–Szczecin fairway dredged to 12.5 m using assumptions for a system for the dynamic determination of the water reserve under the keel in this fairway using the component method and the three-factor method.
The component method involves summing individual safety margins associated with key navigational and environmental factors, such as: dynamic under-keel clearance reduction due to vessel movement (squat) [
12,
13,
14], wave-induced motions [
14,
15], heel and trim [
12], uncertainties in water level measurements [
16], and a static safety allowance [
17,
18]. This approach enables a detailed and conservative assessment of the required water depth along a fairway.
In contrast, the three-factor method is a simplified approach in which the total UKC margin is determined based on three aggregated groups of factors: vessel characteristics [
12,
17], environmental conditions (e.g., wind, waves) [
14,
15], and the geometry of the waterway [
17,
18].
Both methods are applied in engineering practice and are recommended in international guidelines (e.g., PIANC - Permanent International Association of Navigation Congresses) [
17]. The component method offers a more precise analytical assessment, while the three-factor method is useful for quick operational evaluations.
2. Study Area
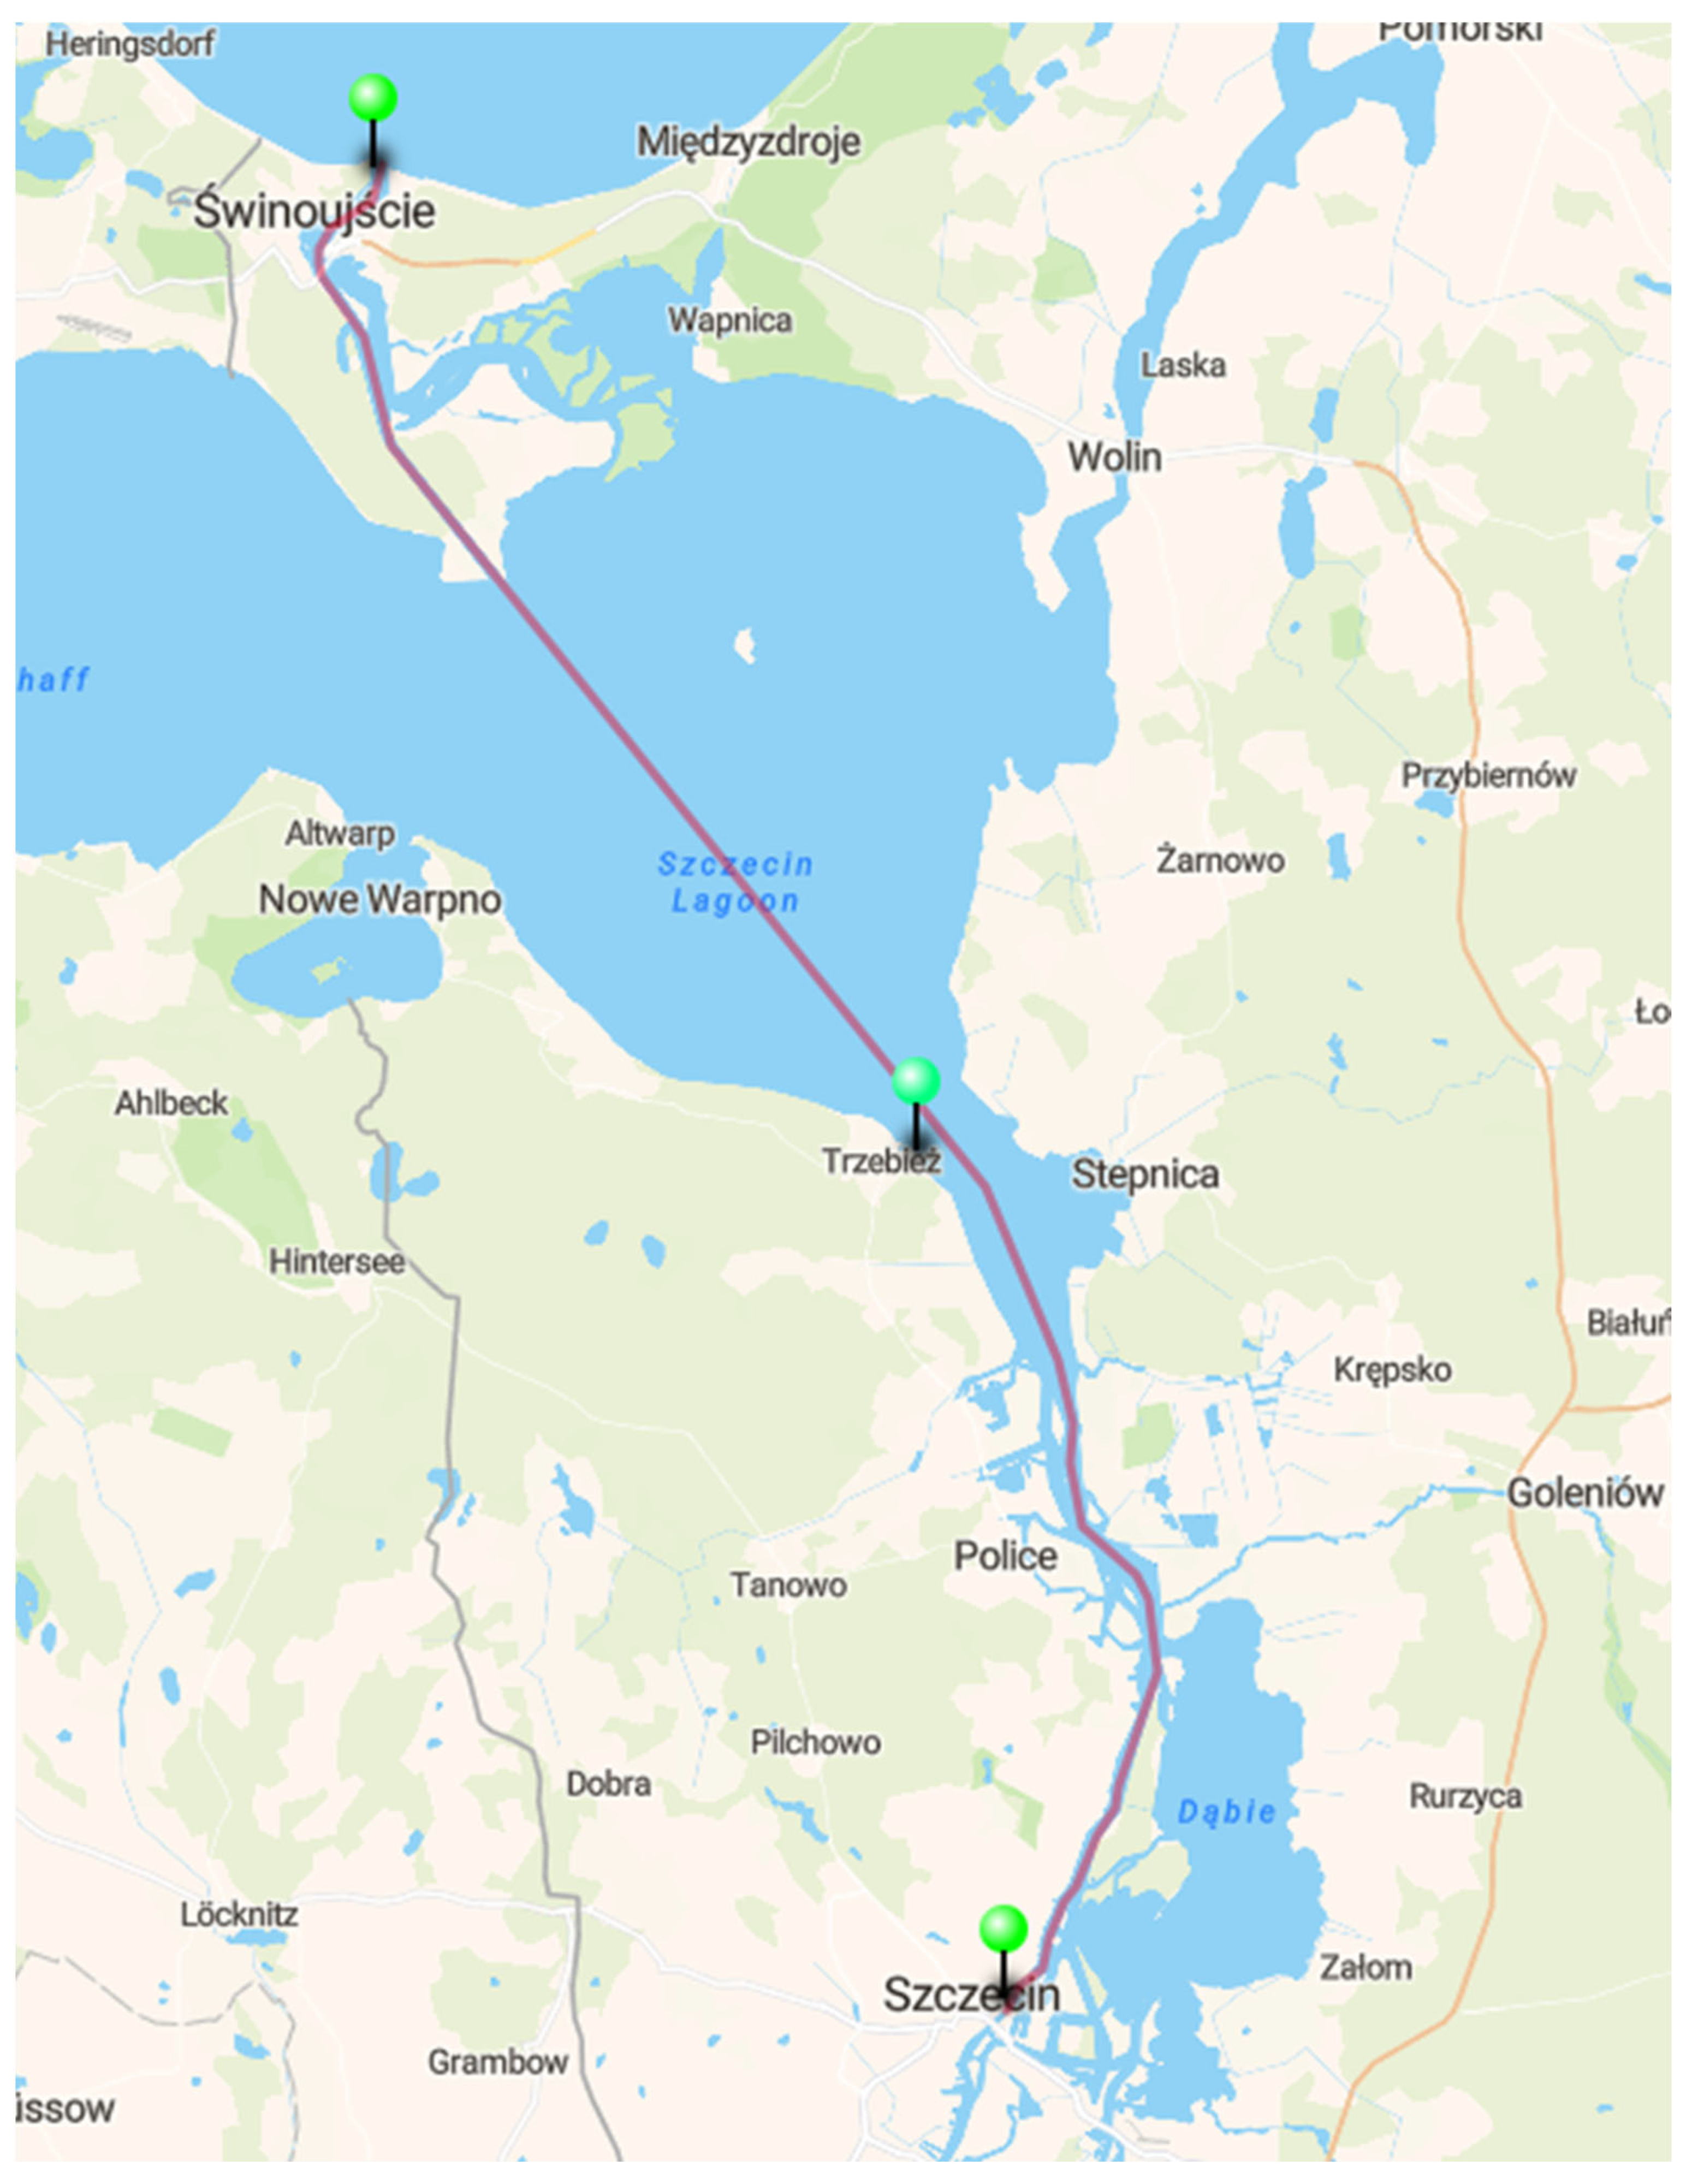
The Szczecin-Świnoujście fairway (
Figure 2) is a strategic waterway of approximately 67 km that connects the ports of Szczecin and Świnoujście with the open Baltic Sea. It is the most important shipping route serving the port of Szczecin, located approximately 70 km inland from the coastline. The waterway is routed through the Szczecin Lagoon and the River Oder, making it a key transport route for the entire region. Its depth is currently around 12.5 metres [
10,
19,
20], which allows the passage of large vessels with a maximum draught of up to approximately 10.5 metres, but its usefulness is dependent on fluctuating water levels, which are influenced by natural hydrological and meteorological factors.
2.1. Hydrological Characteristics
The fairway is located within the influence zone of both the Baltic Sea and the Oder River, which results in specific hydrological conditions [
21]. The water level in this section may be subject to large fluctuations due to factors such as inflows from the Baltic Sea, backwaters caused by strong winds from northerly directions, and fluctuations associated with inflows from the Oder River [
22]. Variable water levels are also affected by seasonal precipitation, as well as tides, although the Baltic Sea has a low tidal amplitude compared to the oceans.
The greatest changes in water levels in the fairway occur as a result of so-called surges, when strong winds from the north and north-west cause water from the Baltic Sea to flow into the Szczecin Lagoon and the Oder River. In such cases, the water level can rise sharply, causing the draught of the ships to rise and increasing their ability to pass. The opposite effect is exerted by southerly and south-westerly winds, which can lower the water level, hindering the movement of ships, especially those with large draughts.
2.1.1. Water Levels in the Fairway
Changes in water levels change the water reserve under the keel of a ship [
23,
24]. This causes a change in sailing conditions (different manoeuvring properties of the ship, change in settlement). There may be various reasons for the change in water levels. There are no tidal movements in the Oder–Szczecin Lagoon–Baltic Sea system. Tidal changes in the Baltic are too small to cause significant tidal movements throughout the system. Instead, significant changes in water levels are observed, which are to be attributed to the influence of the wind and the piling up and pushing away of water by the wind. Northerly winds pile up water from the seaward side towards the coast, also pushing water on the leeward side of the Szczecin Lagoon. As a result, significant currents appear in the estuaries.
Świnoujście
The mean sea level in Świnoujście, calculated on the basis of measurements carried out between 1811 and 1985, was 491.1 cm ± 0.3 cm [
25]. Over the same period, a gradual rise in sea level was observed, which was estimated at 0.7 mm per year ± 0.1 mm [
26]. A similar upward trend was also recorded at other locations along the Polish Baltic coast, from 1.1 mm per year in Kołobrzeg to 1.2 mm per year in Gdańsk Nowy Port.
Data from subsequent decades shows that the rate of sea level rise increased to about 4.2 mm per year between 1971 and 1990 [
27]. Analysing the thirty-year period 1961–1990, the average sea level in Świnoujście was 499.0 cm. Both mean and extreme values recorded during this period were related to the NAP (Normaal Amsterdams Peil) zero level in Amsterdam.
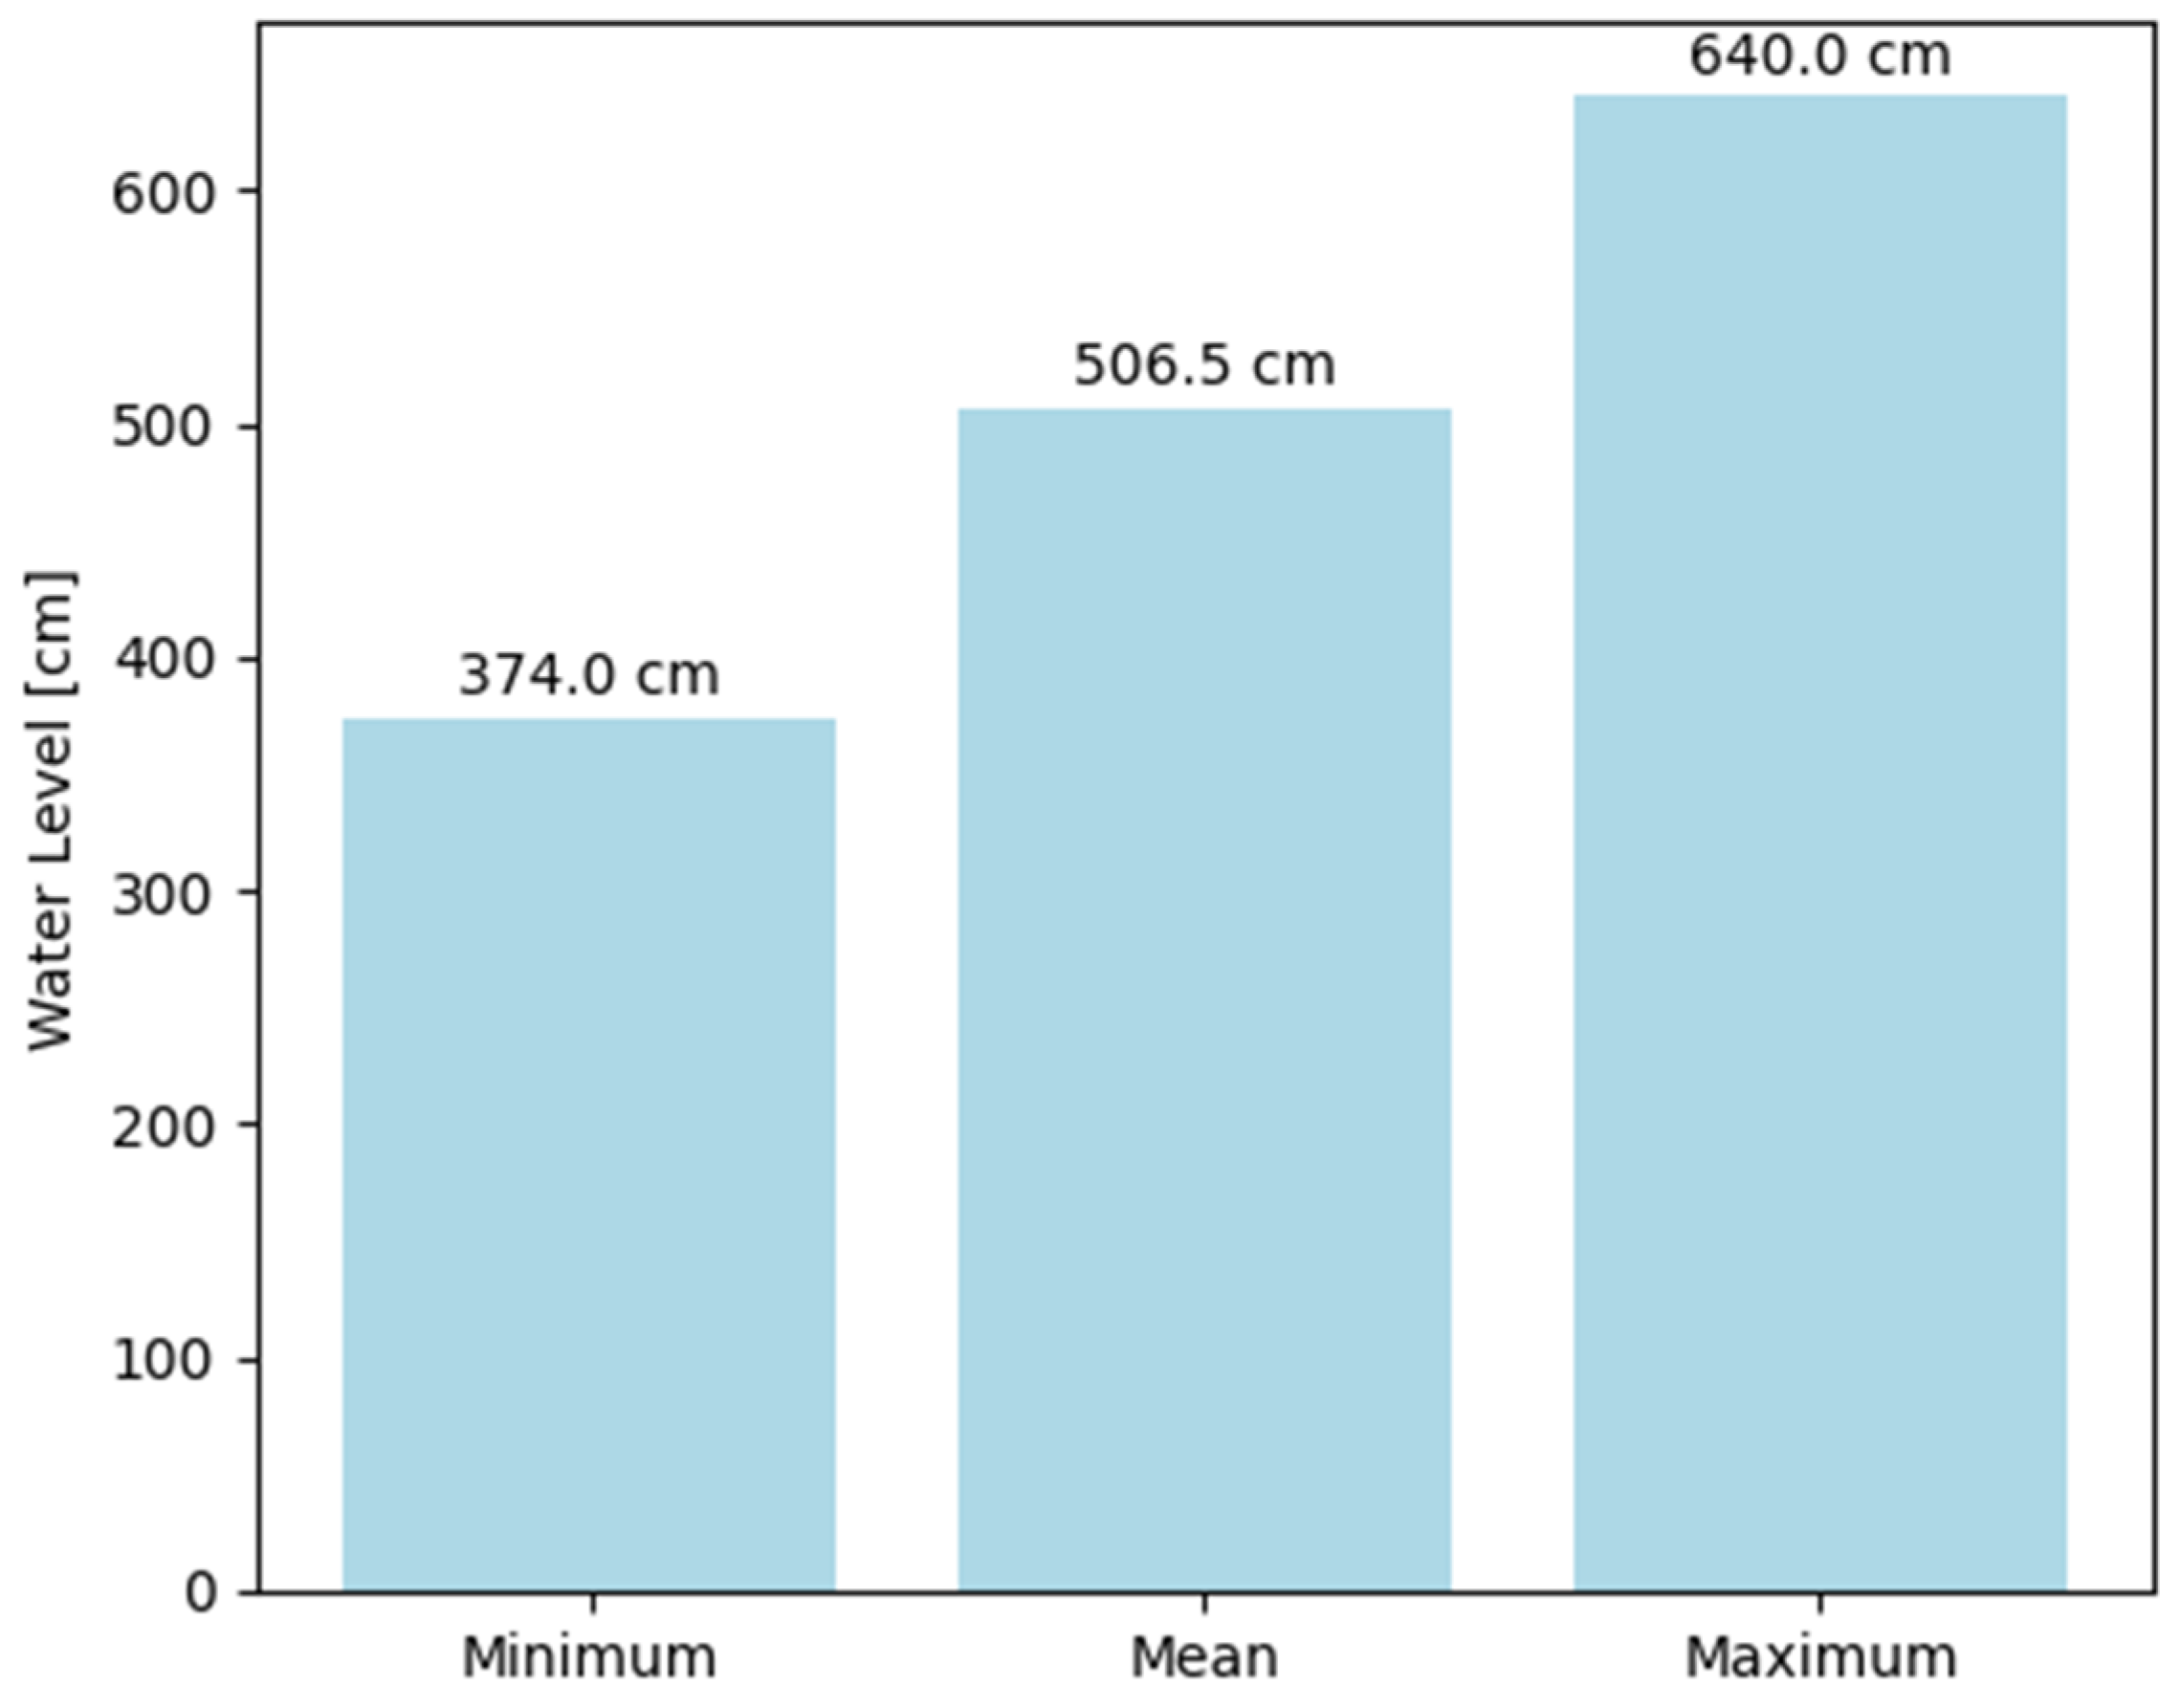
In the period 2008–2022, the average sea level in Świnoujście was 506.5 cm (the study was conducted on the basis of IMGW data), which confirms the observed upward trend. Compared to earlier decades, the values are higher—for the period 1961–1990 the average sea level was 499.0 cm, while for the period 1811–1985 it was estimated at 491.1 cm. The variability of the water level between 2008 and 2022 was significant, ranging from a minimum value of 374.0 cm to a maximum value reaching 640.0 cm, indicating periodic rises associated with dynamic meteorological phenomena. The increase in mean sea level is consistent with previous studies, according to which, in the second half of the 20th century, the rate of Baltic Sea level rise in Świnoujście was about 4.2 mm/year.
Strong currents in the estuaries overpower the normal, moderate water flow in the system, which, apart from the outflow of river water, is regulated by a difference between the density of the fresh water of the Szczecin Lagoon and the seawater of the Baltic Sea. In addition, the flow in the Lagoon is subject to the influence of strong winds above the water surface, causing local rise and fall of the water level and consequently recirculation of water. During strong winds the flow in the Szczecinski Lagoon is largely three-dimensional, where surface currents and bottom currents can strongly oppose each other.
As the data on extreme water levels is derived from measurements, it can be considered to include all natural phenomena that could potentially affect changes in hydrostatic pressure levels. Complementing the issue of water levels, differences in water levels are also important in the Kiel Canal and the Piast Canal, as they contribute to strong currents in both canals. The verification of water levels in the port of Świnoujście was also carried out based on IMGW data for the period 2008–2022. Similar methods of multi-source remote sensing, including radar altimetry and optical imagery, have been successfully used to monitor long-term water level changes in wetlands. Zhang et al. [
28] demonstrated that integrated satellite-based observations can accurately detect hydrological fluctuations even in remote or data-sparse regions, supporting adaptive water management under changing environmental and climatic pressures.
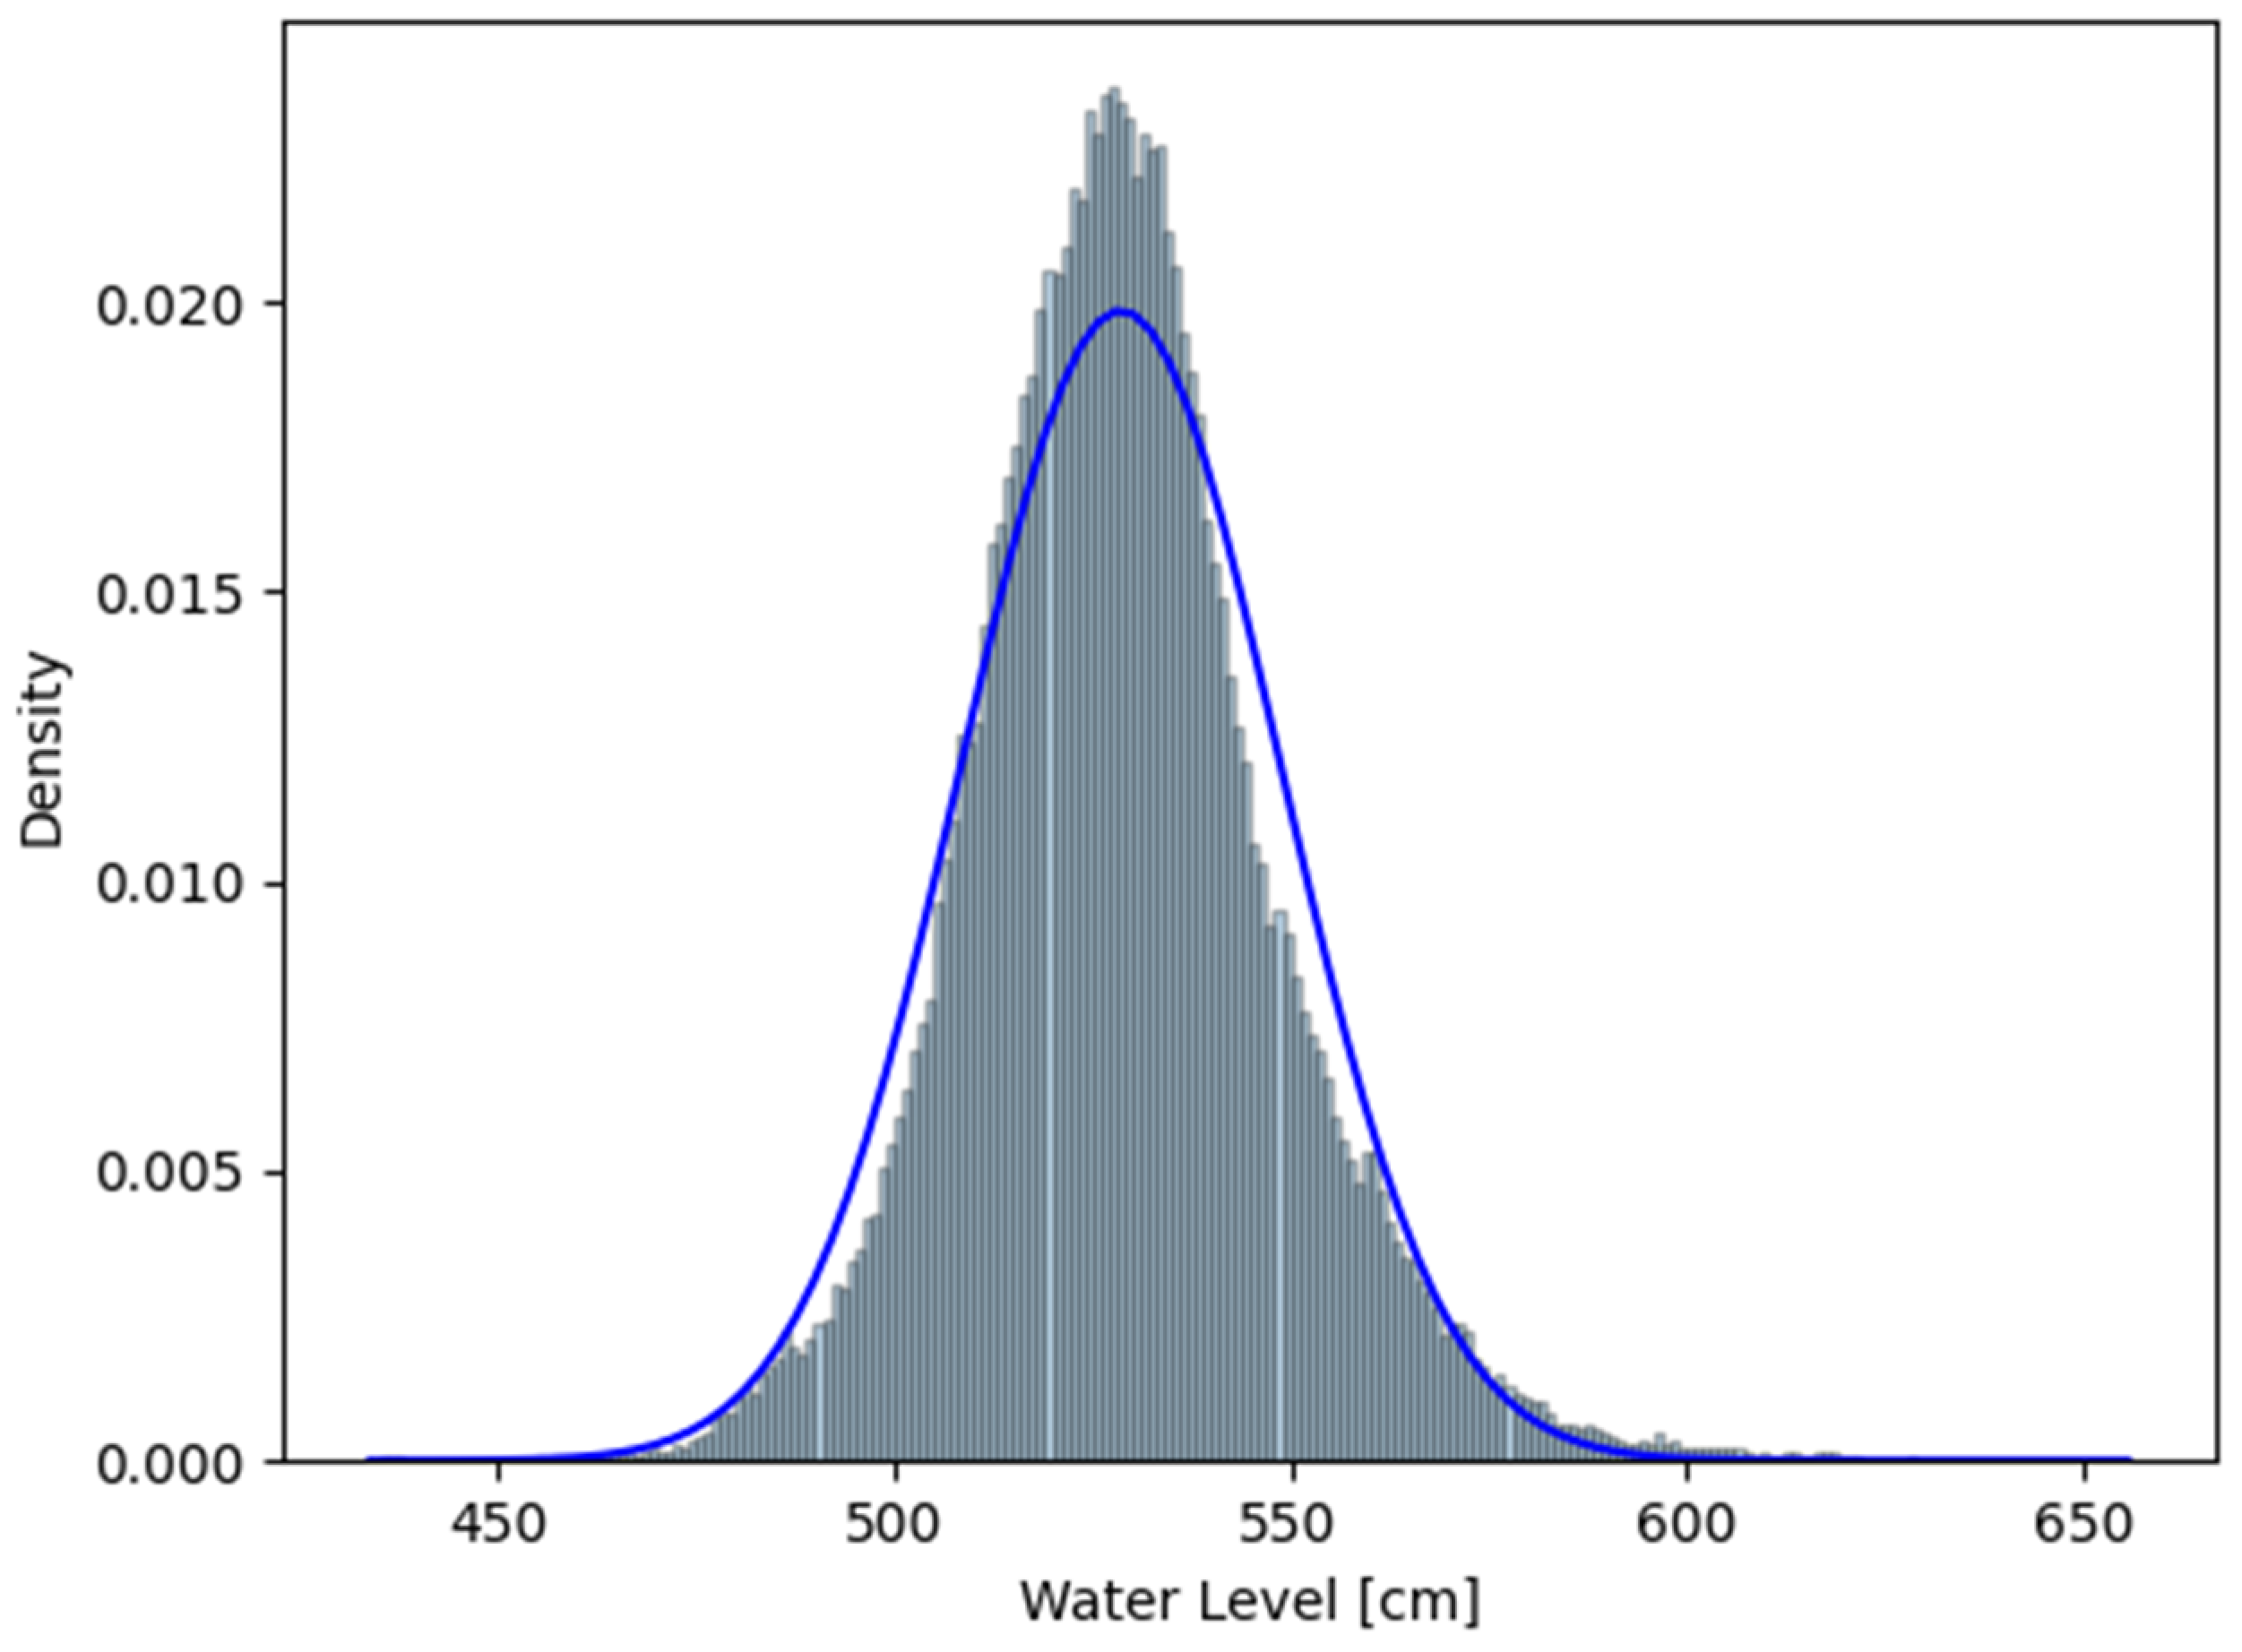
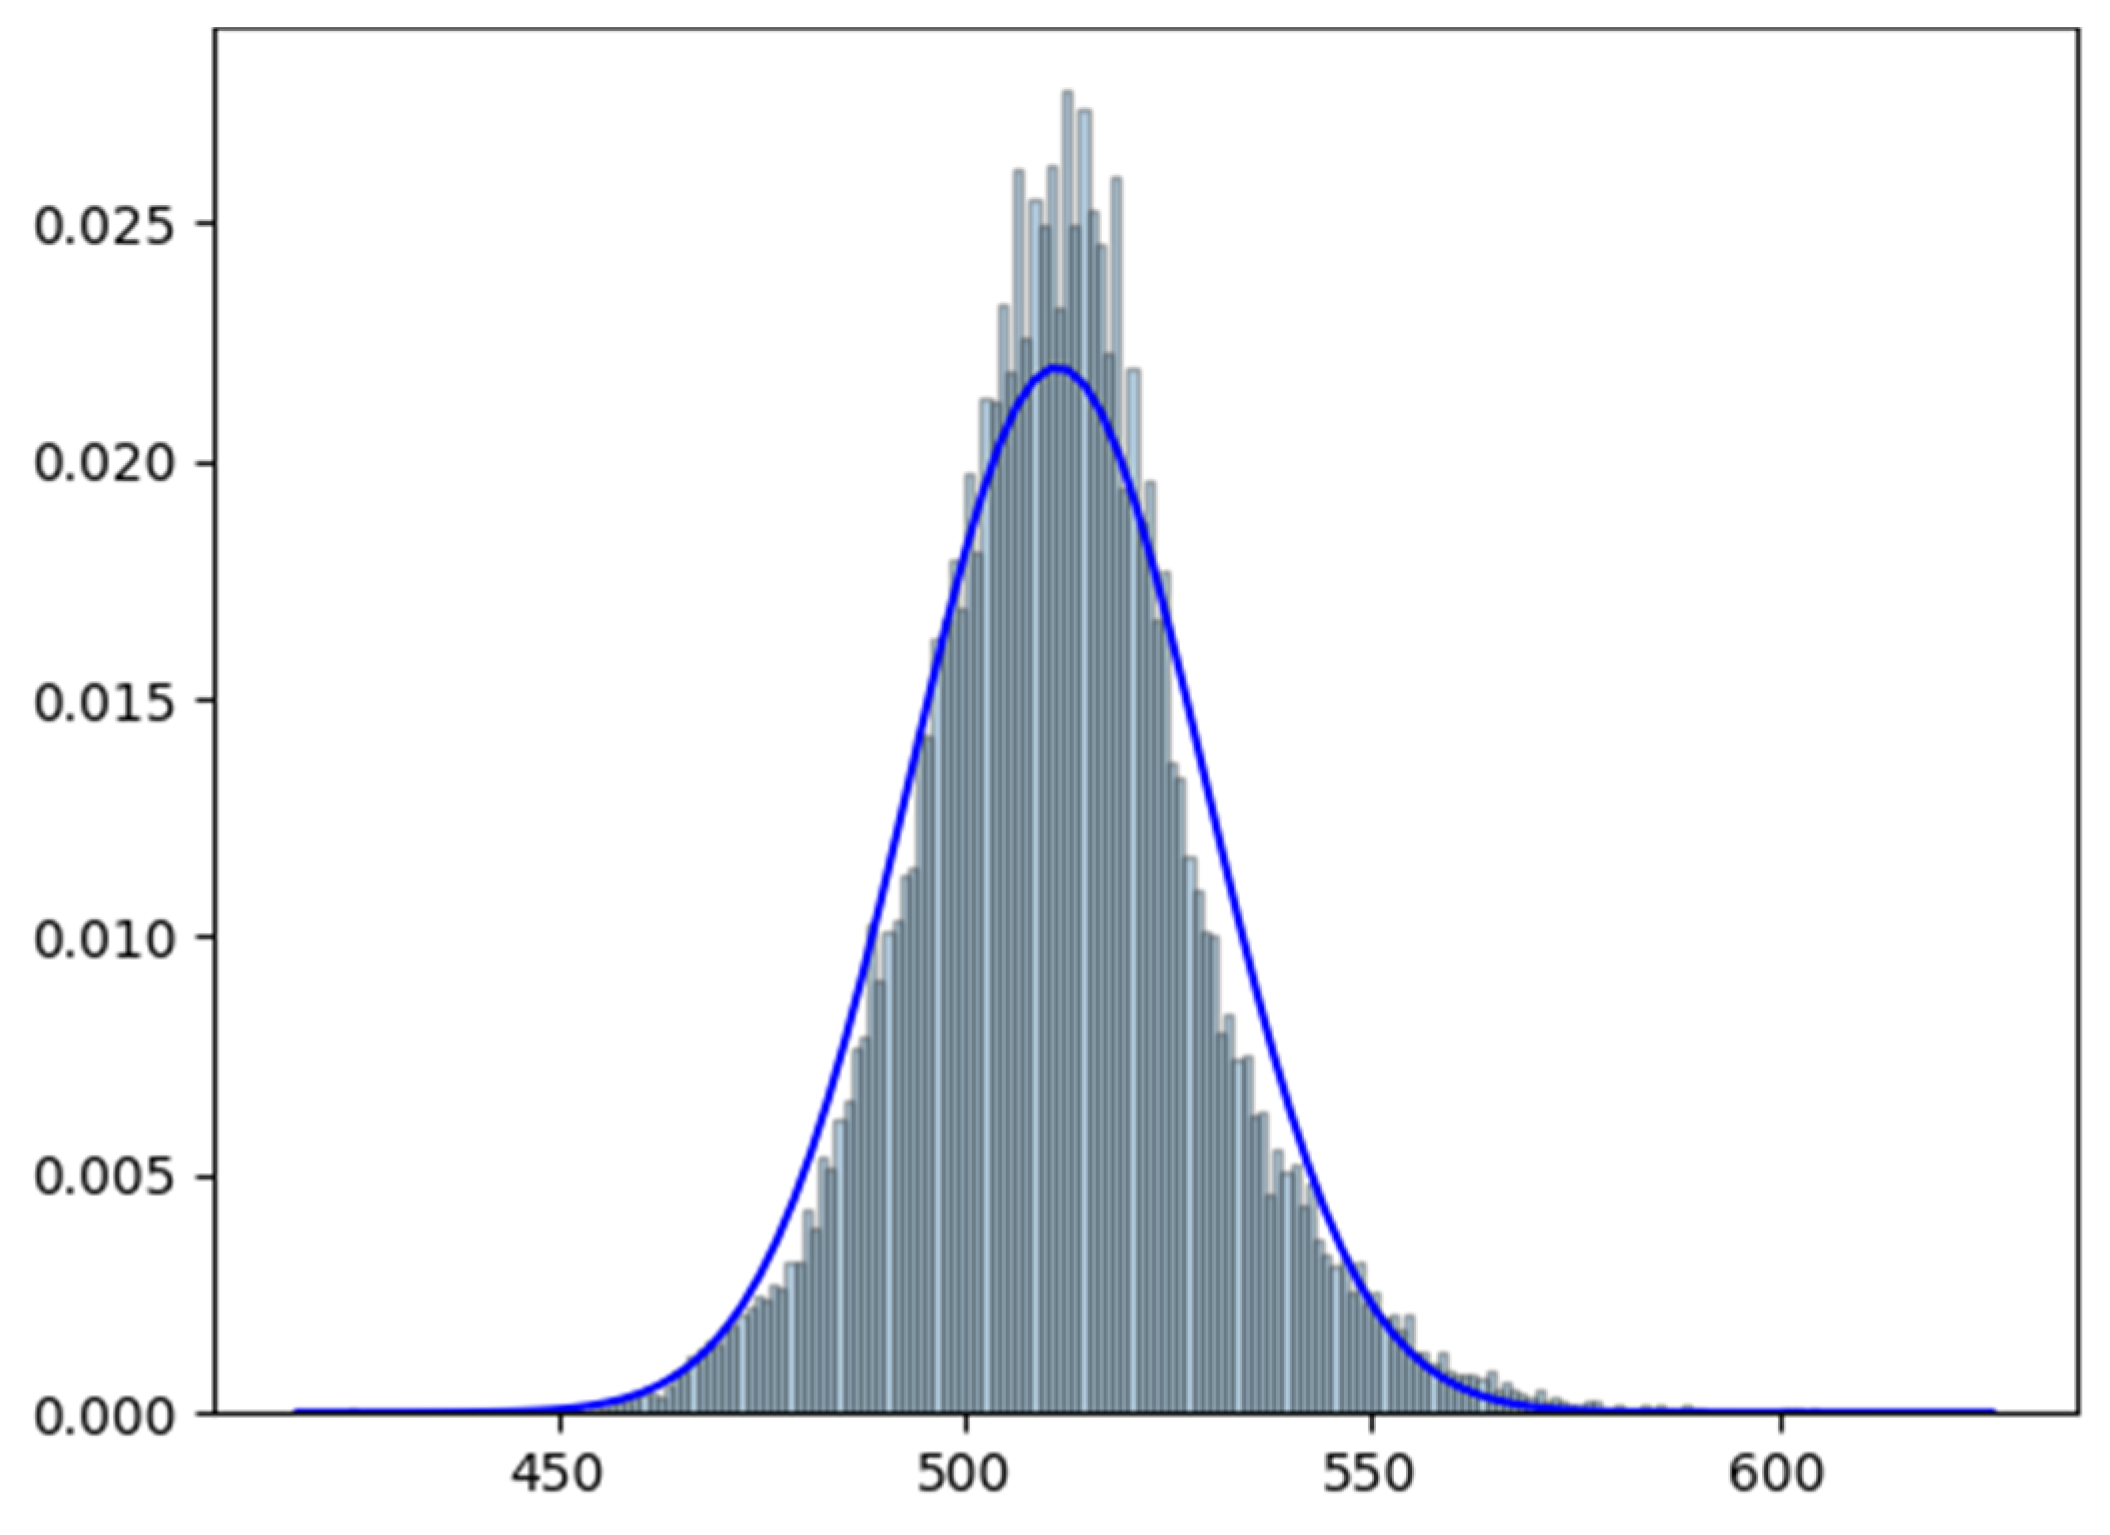
The mean and extreme values of the water level are shown in
Figure 3, while the frequencies of occurrence of individual water levels are presented in
Figure 4—this shows a histogram of the water level over the period in question with a fitted normal distribution curve. As can be seen, the distribution of water levels in this period is close to a normal distribution and extreme water levels occur very rarely.
Between 2008 and 2022, the water level in Świnoujście fluctuated between 374 and 640 cm.
Figure 5 presents the empirical distribution and its inverse. This graph allows assessing the probability of occurrence of particular water levels during the study period. The graph shows that approximately 50% of the observations were below the mean value of the water level (506.5 cm).
Figure 6 shows the cumulative empirical water level distribution (ECDF) for Świnoujście. This curve illustrates the probability with which the water level does not exceed a certain value. Analysis of the graph indicates that the distribution of water levels shows a typical sigmoidal shape, suggesting a dominance of values close to the mean water level and a relatively low incidence of extreme values.
Table 2 shows the frequency and average duration of water levels below mean sea level in Świnoujście from 2008 to 2022 by ΔD. As the amplitude of water levels increased, the frequency of their occurrence decreased (from 188 occurrences for a decrease of 10 cm to 5.8 for a decrease of 60 cm) as well as their duration (from 13 h for a decrease of 10 cm to 5.6 h for a decrease of 60 cm).
Trzebież
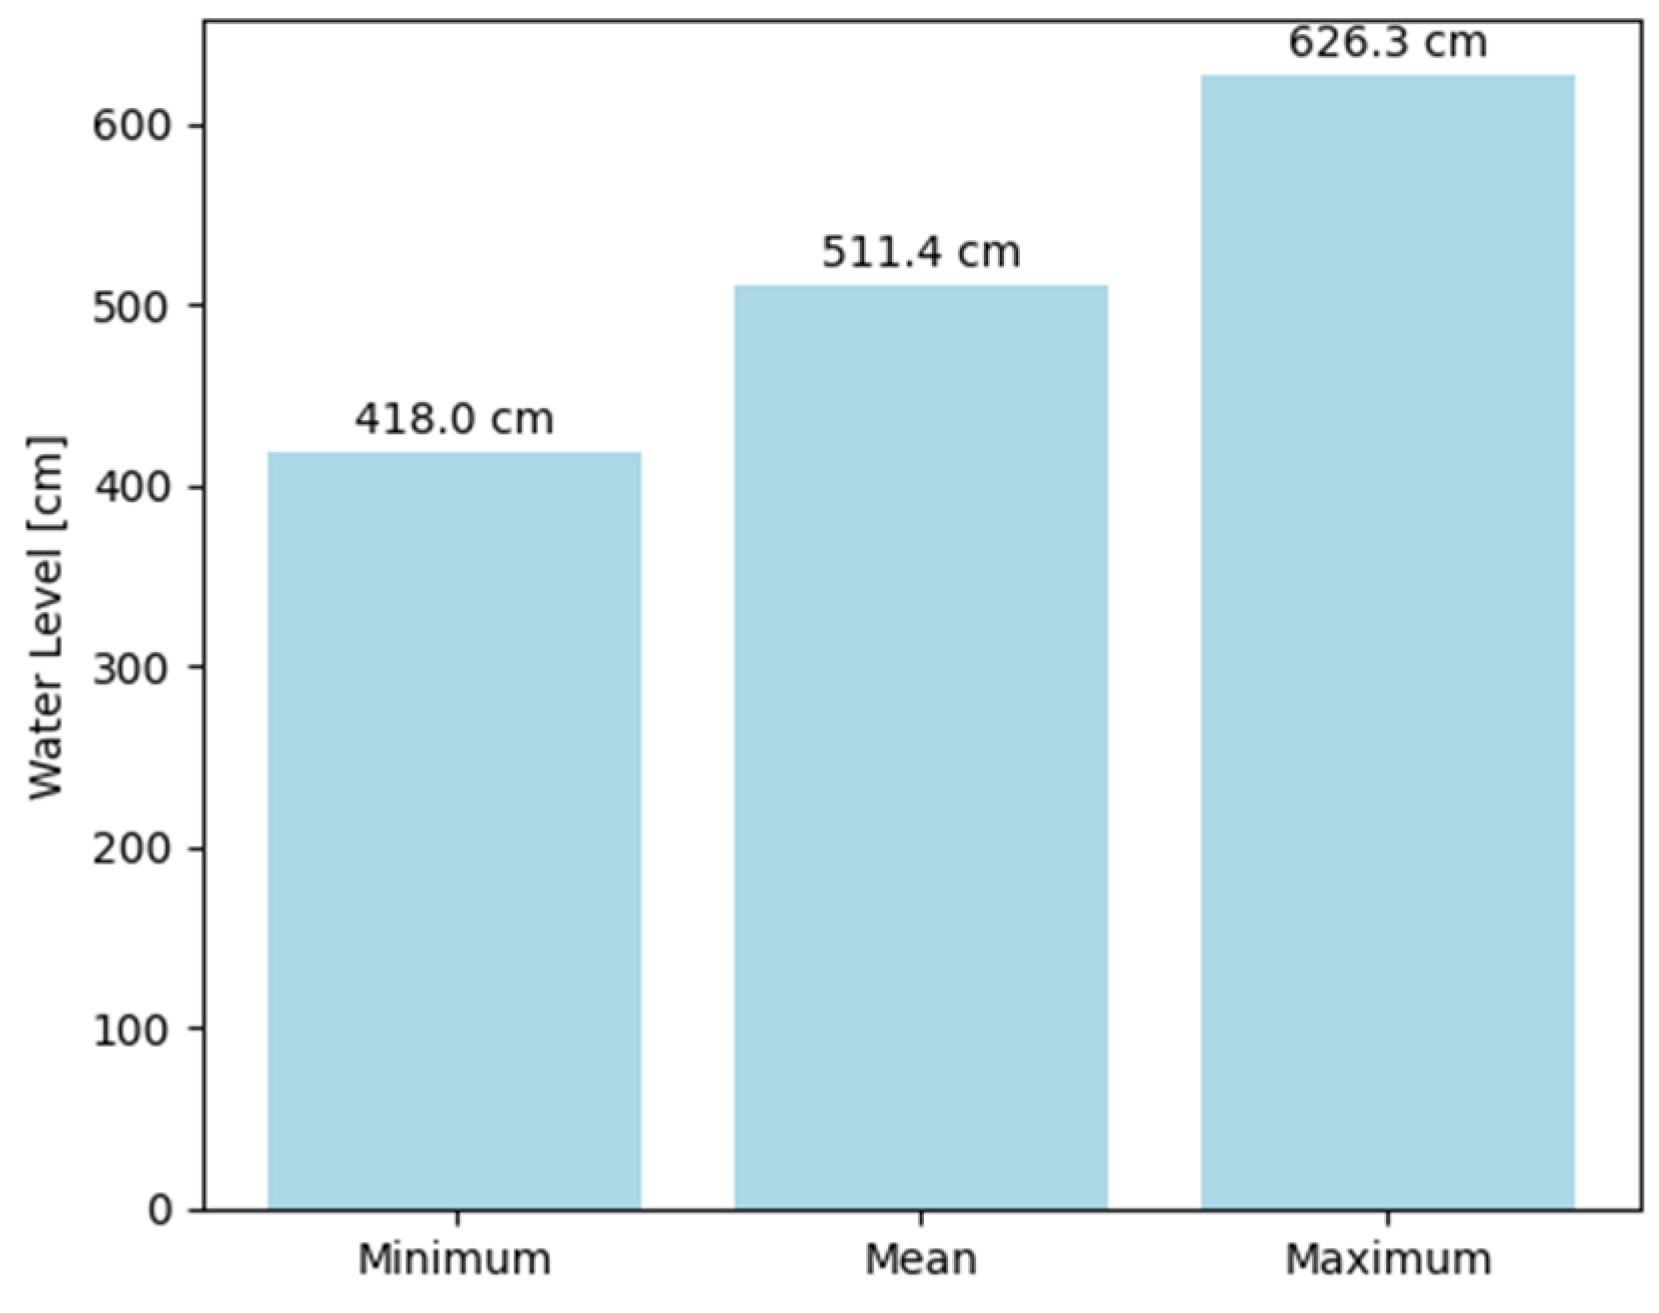
Water level analyses for thinning were carried out in a manner analogous to Świnoujście. The graph (
Figure 7) shows the minimum, average, and maximum water levels in Trzebież in the years 2008–2022. During this period, the minimum water level was 418 cm, the average level was 511.4 cm, and the maximum level was 626.3 cm.
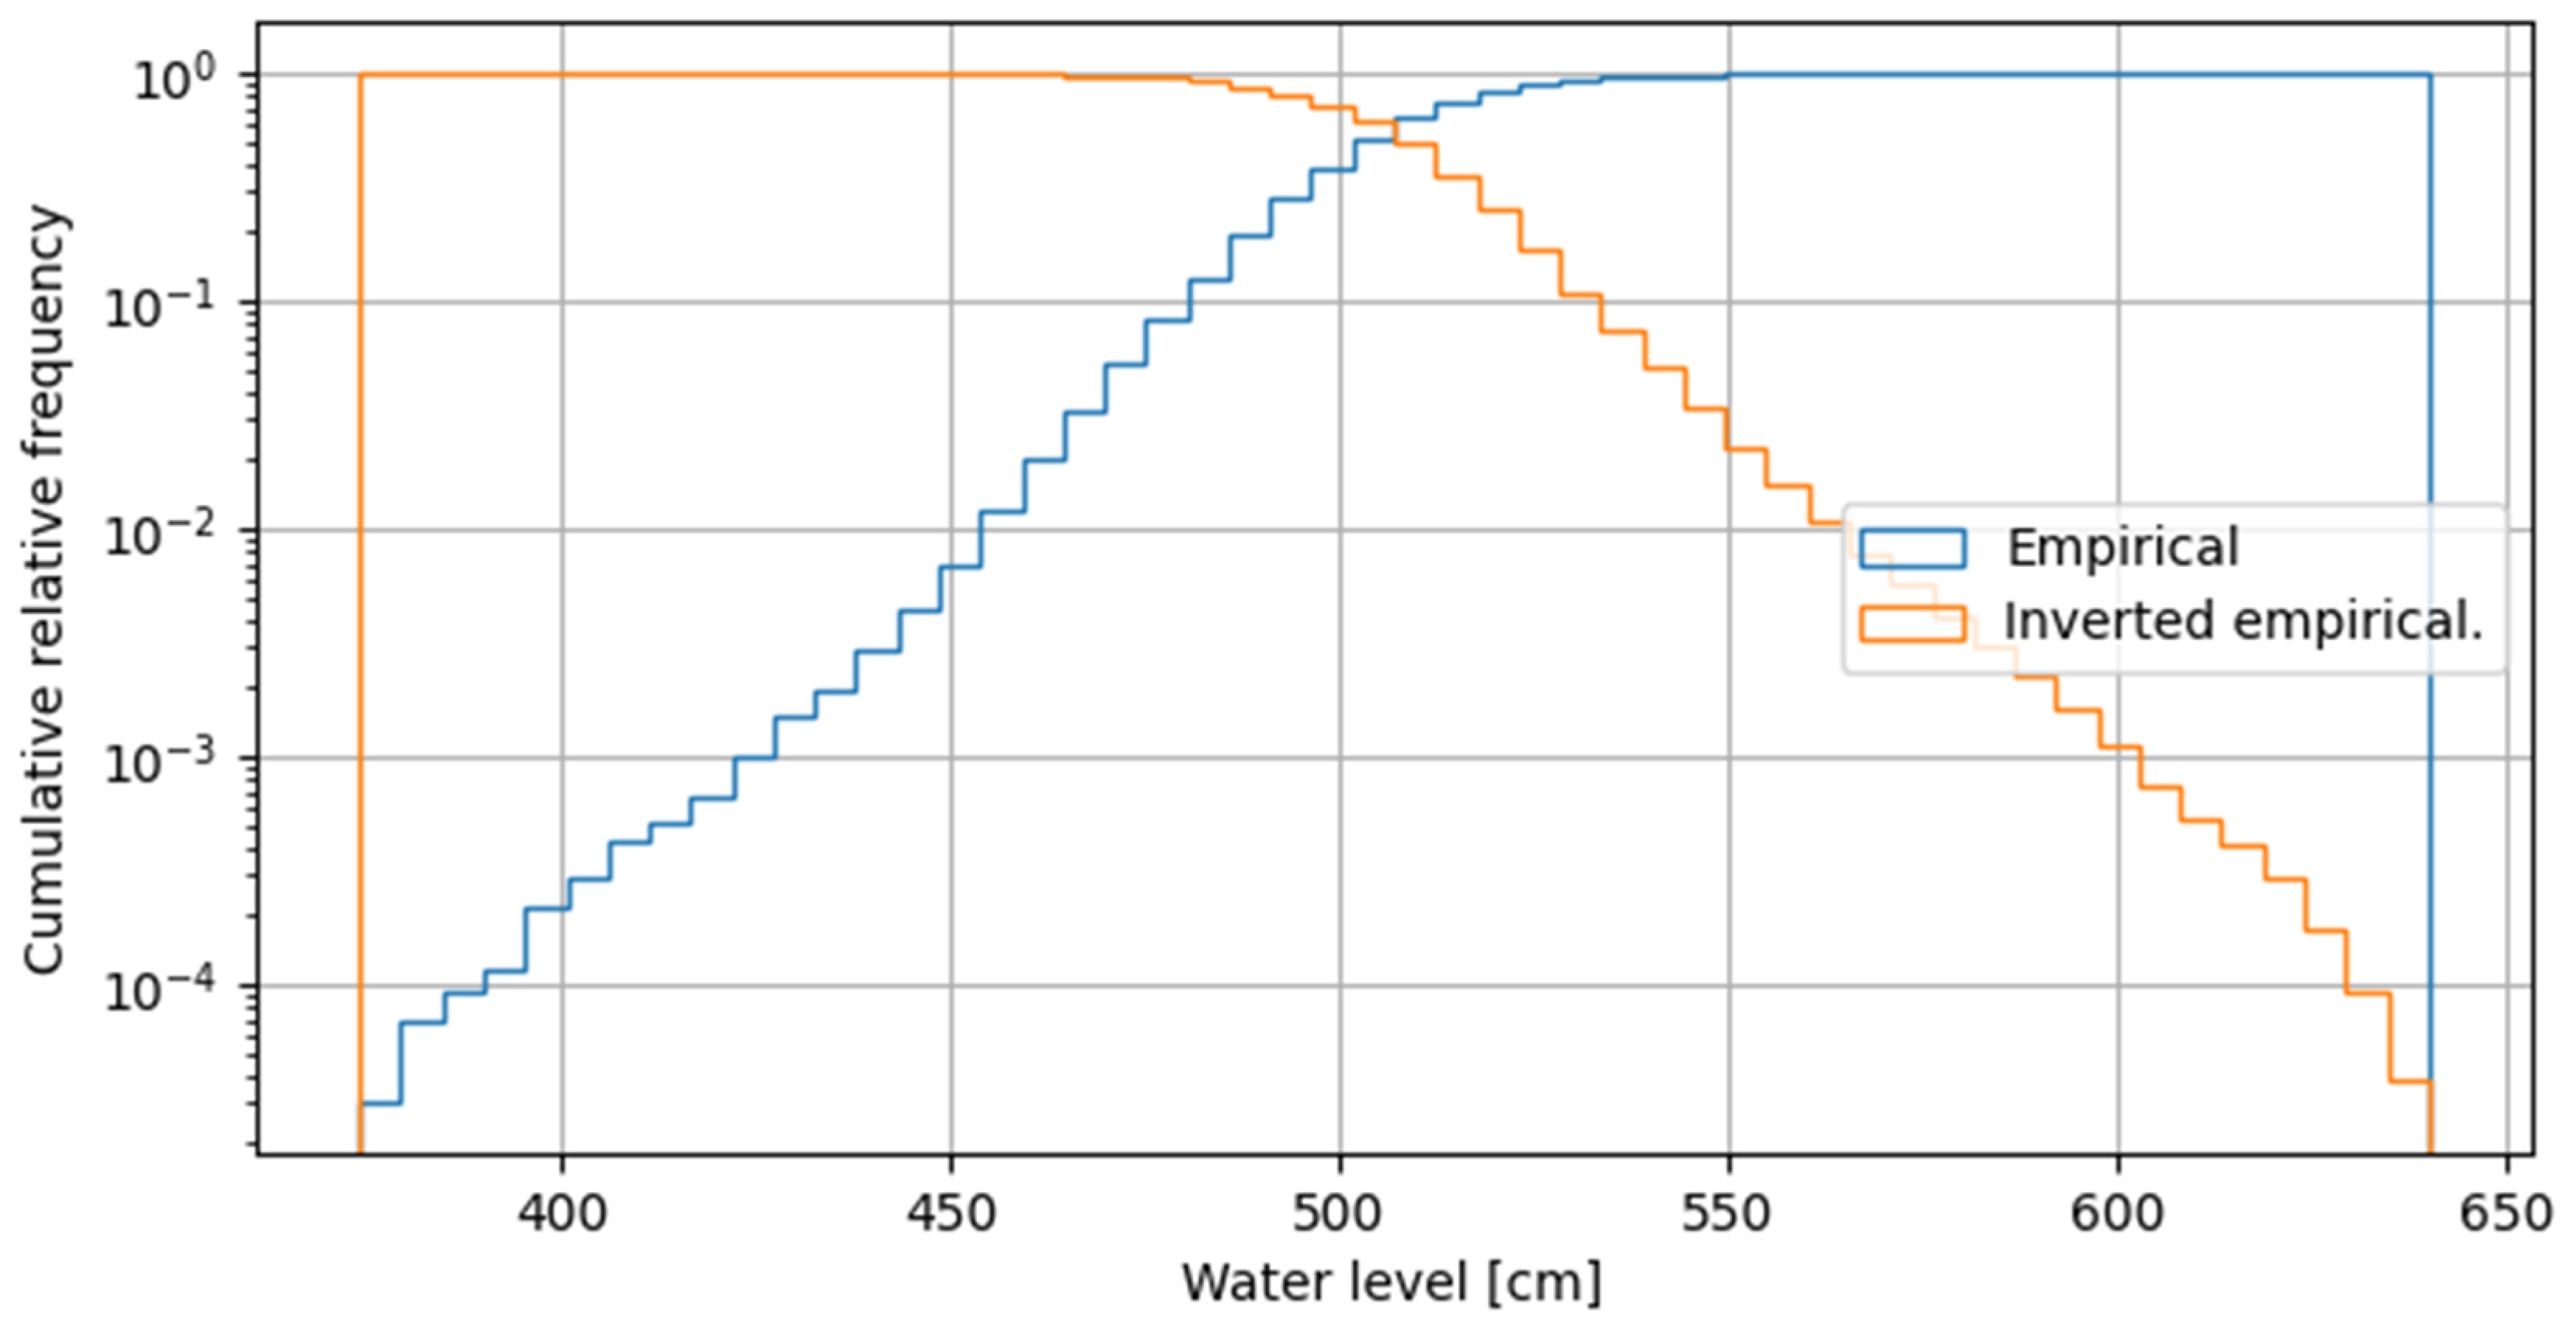
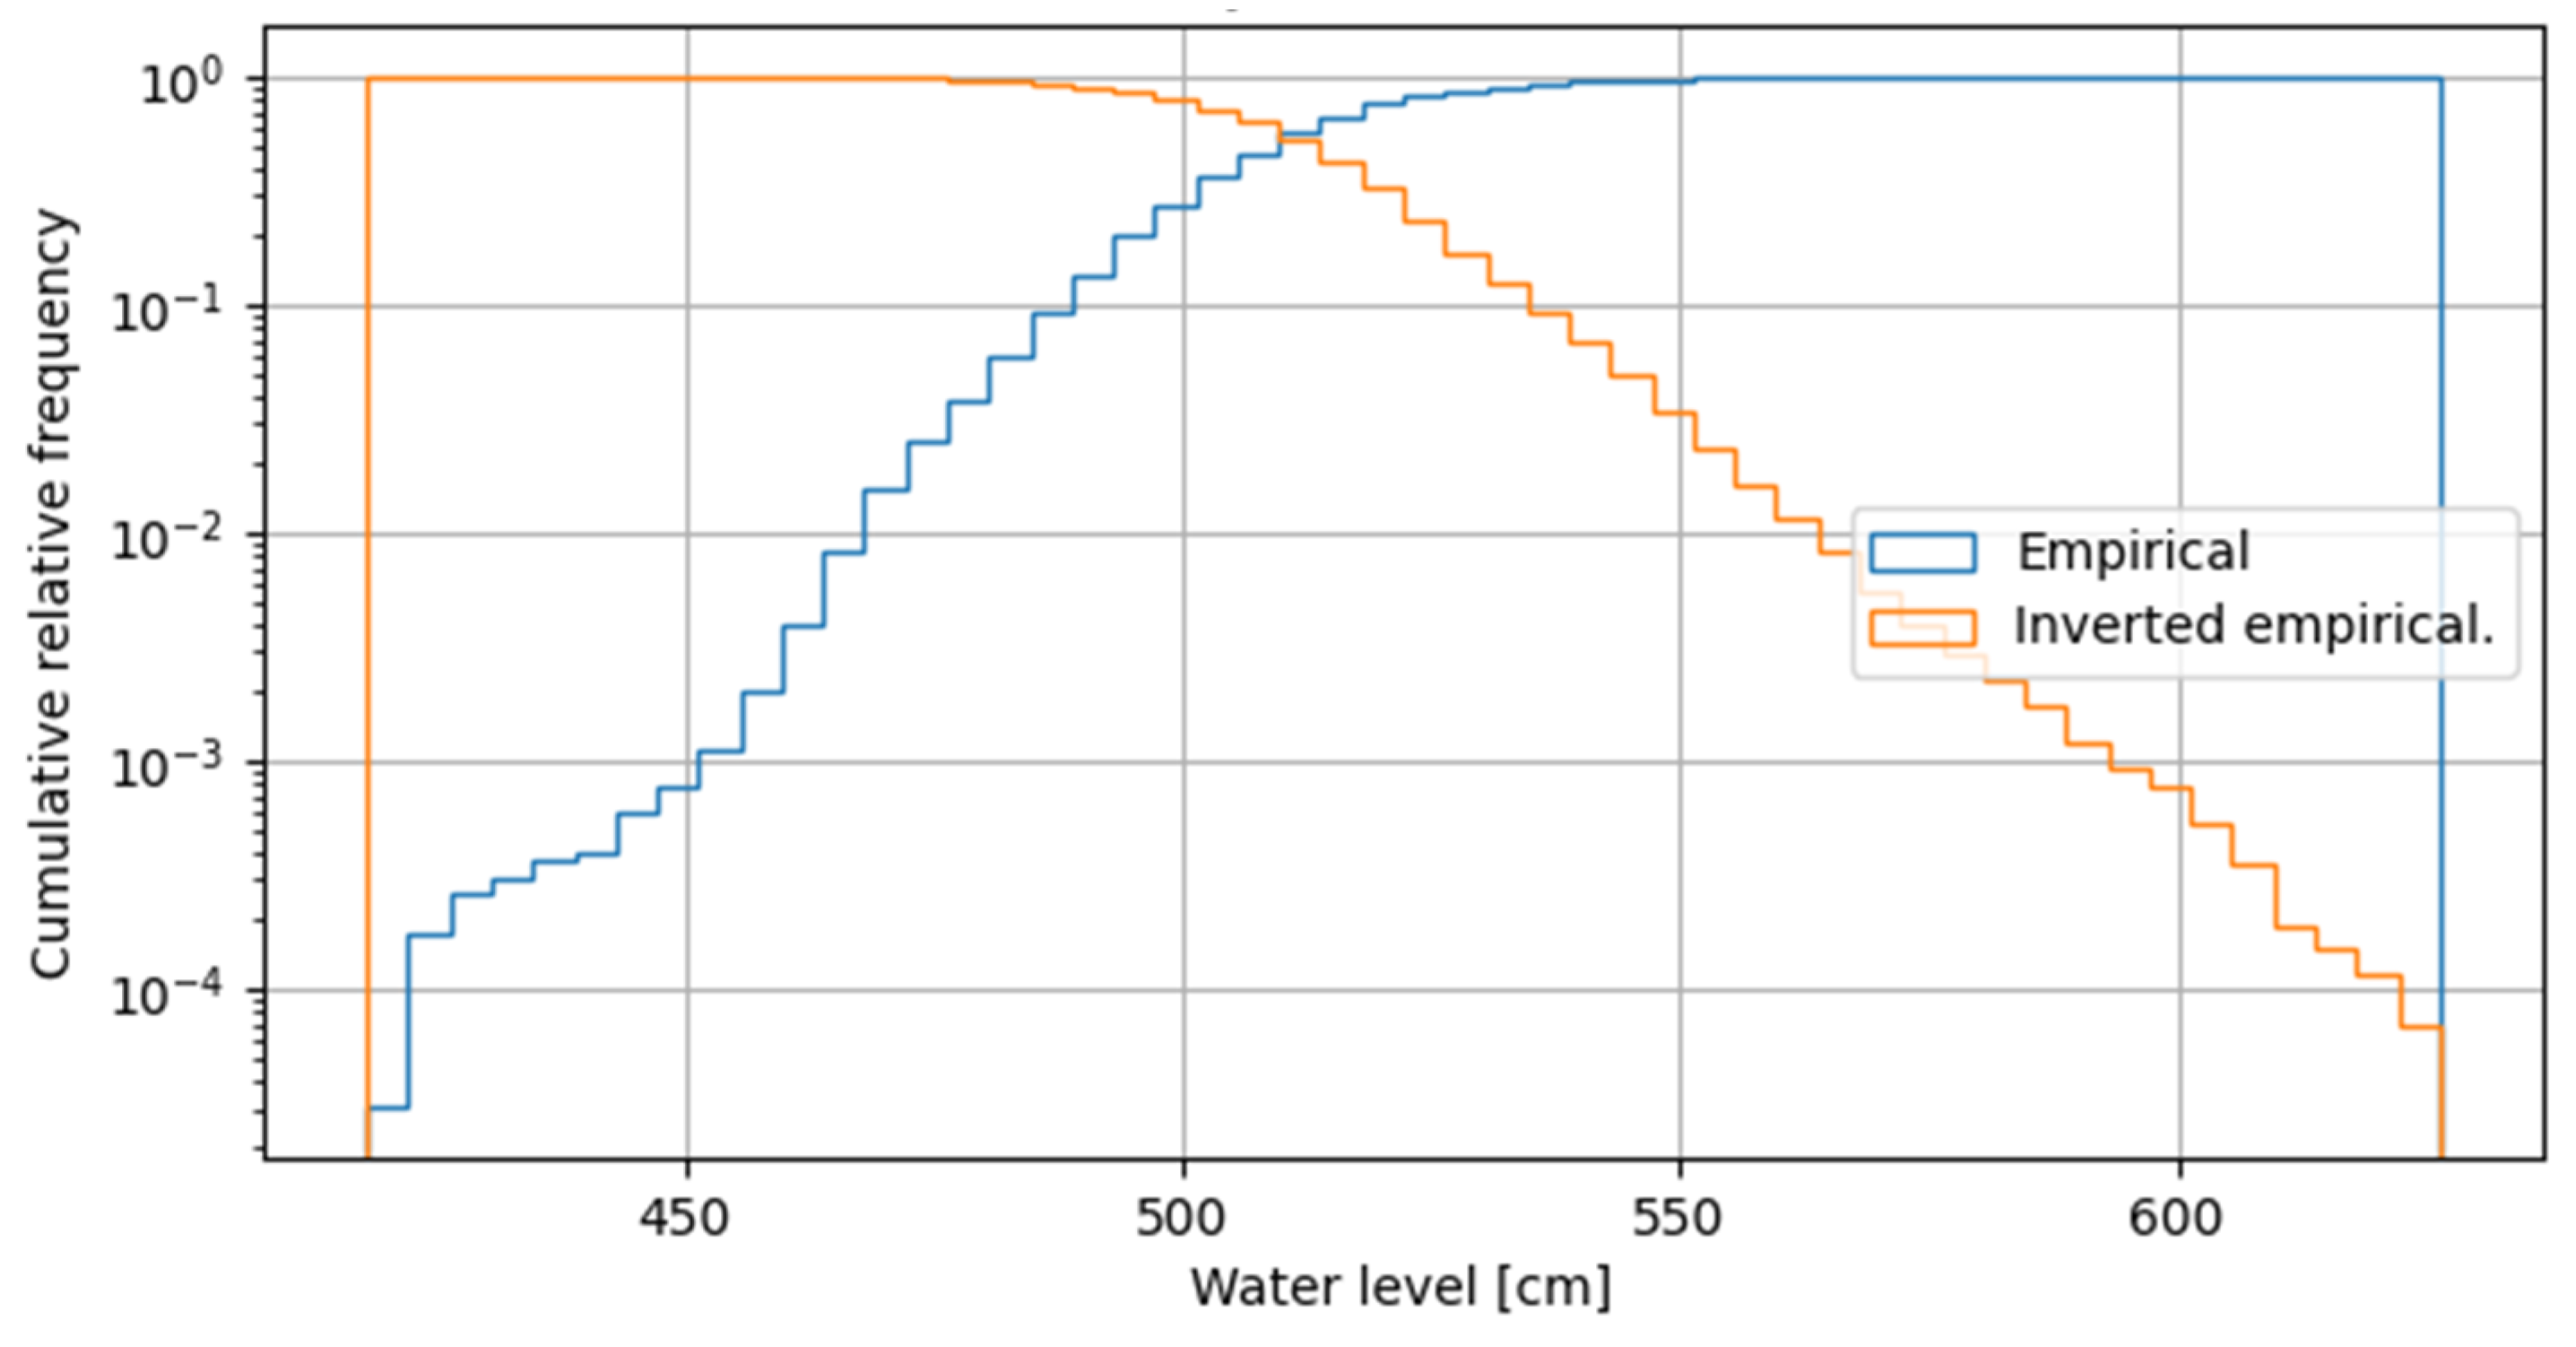
The frequency of occurrence of individual water levels in the vicinity of Trzebież is shown in
Figure 8. The probability of occurrence of specific water levels is presented in
Figure 9 and
Figure 10.
Table 3 shows the frequency and duration of occurrence of water levels lower than the mean water level by 10, 20, 30, 40, 50, and 60 cm.
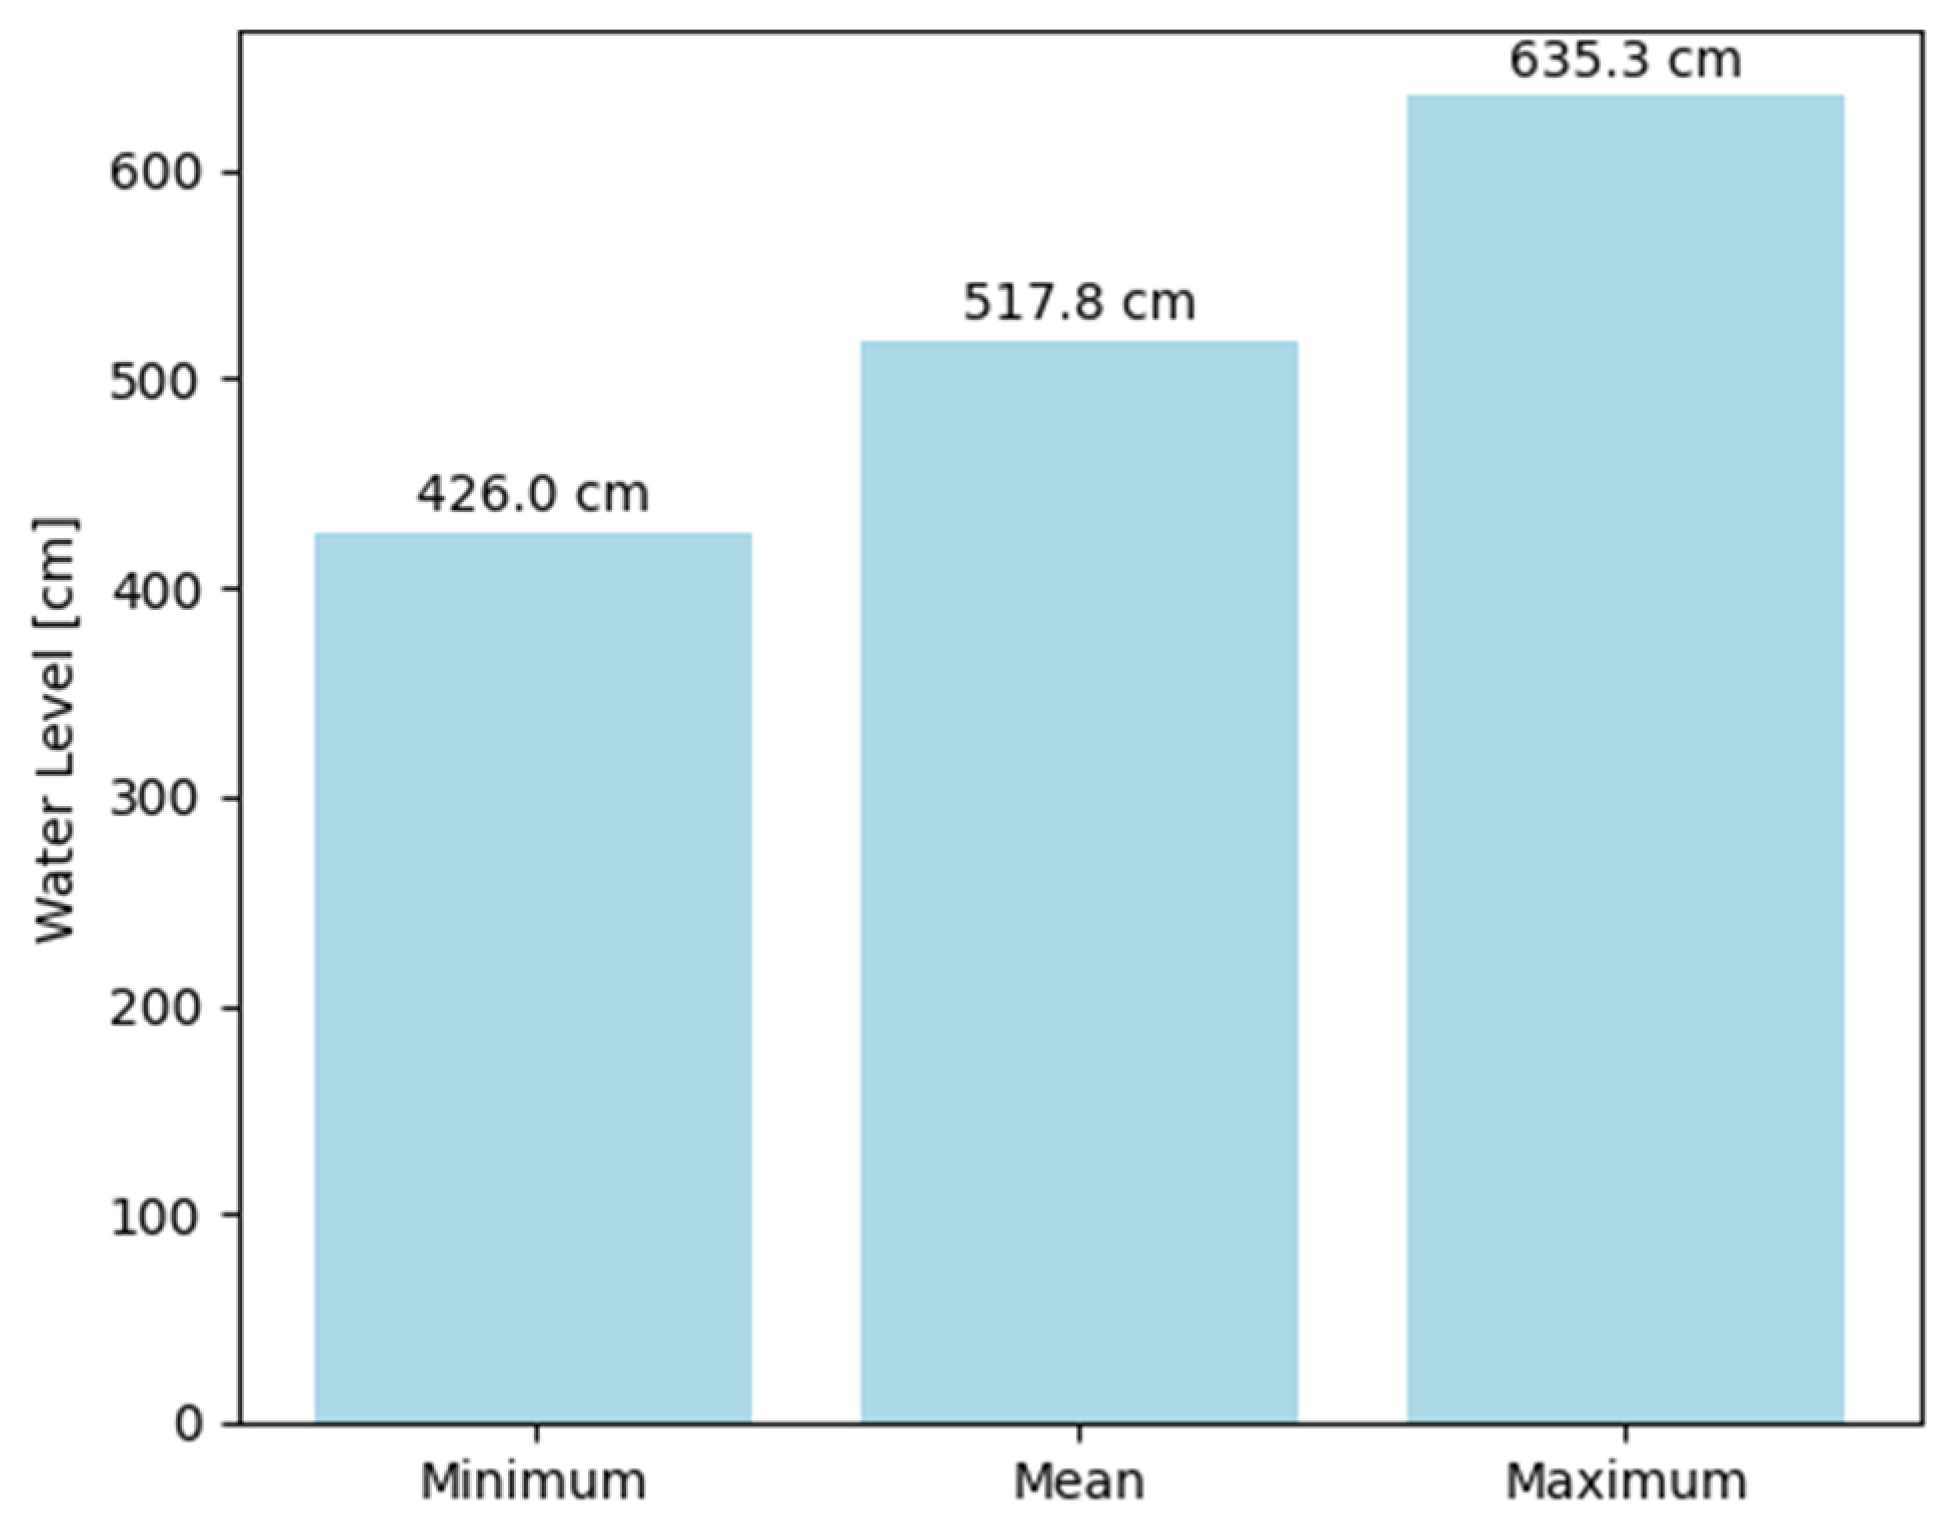
Szczecin Most Długi
The study was also carried out for the measurement point in Szczecin (located in the vicinity of the Długi Bridge). Similarly to the previous measurement points, the minimum, average, and maximum water levels in Szczecin were examined (
Figure 11). The average water level was 517.8 cm, the minimum water level was 426 cm, and the maximum level reached 635.3 cm, which indicates sporadic but extreme changes in water level during this period.
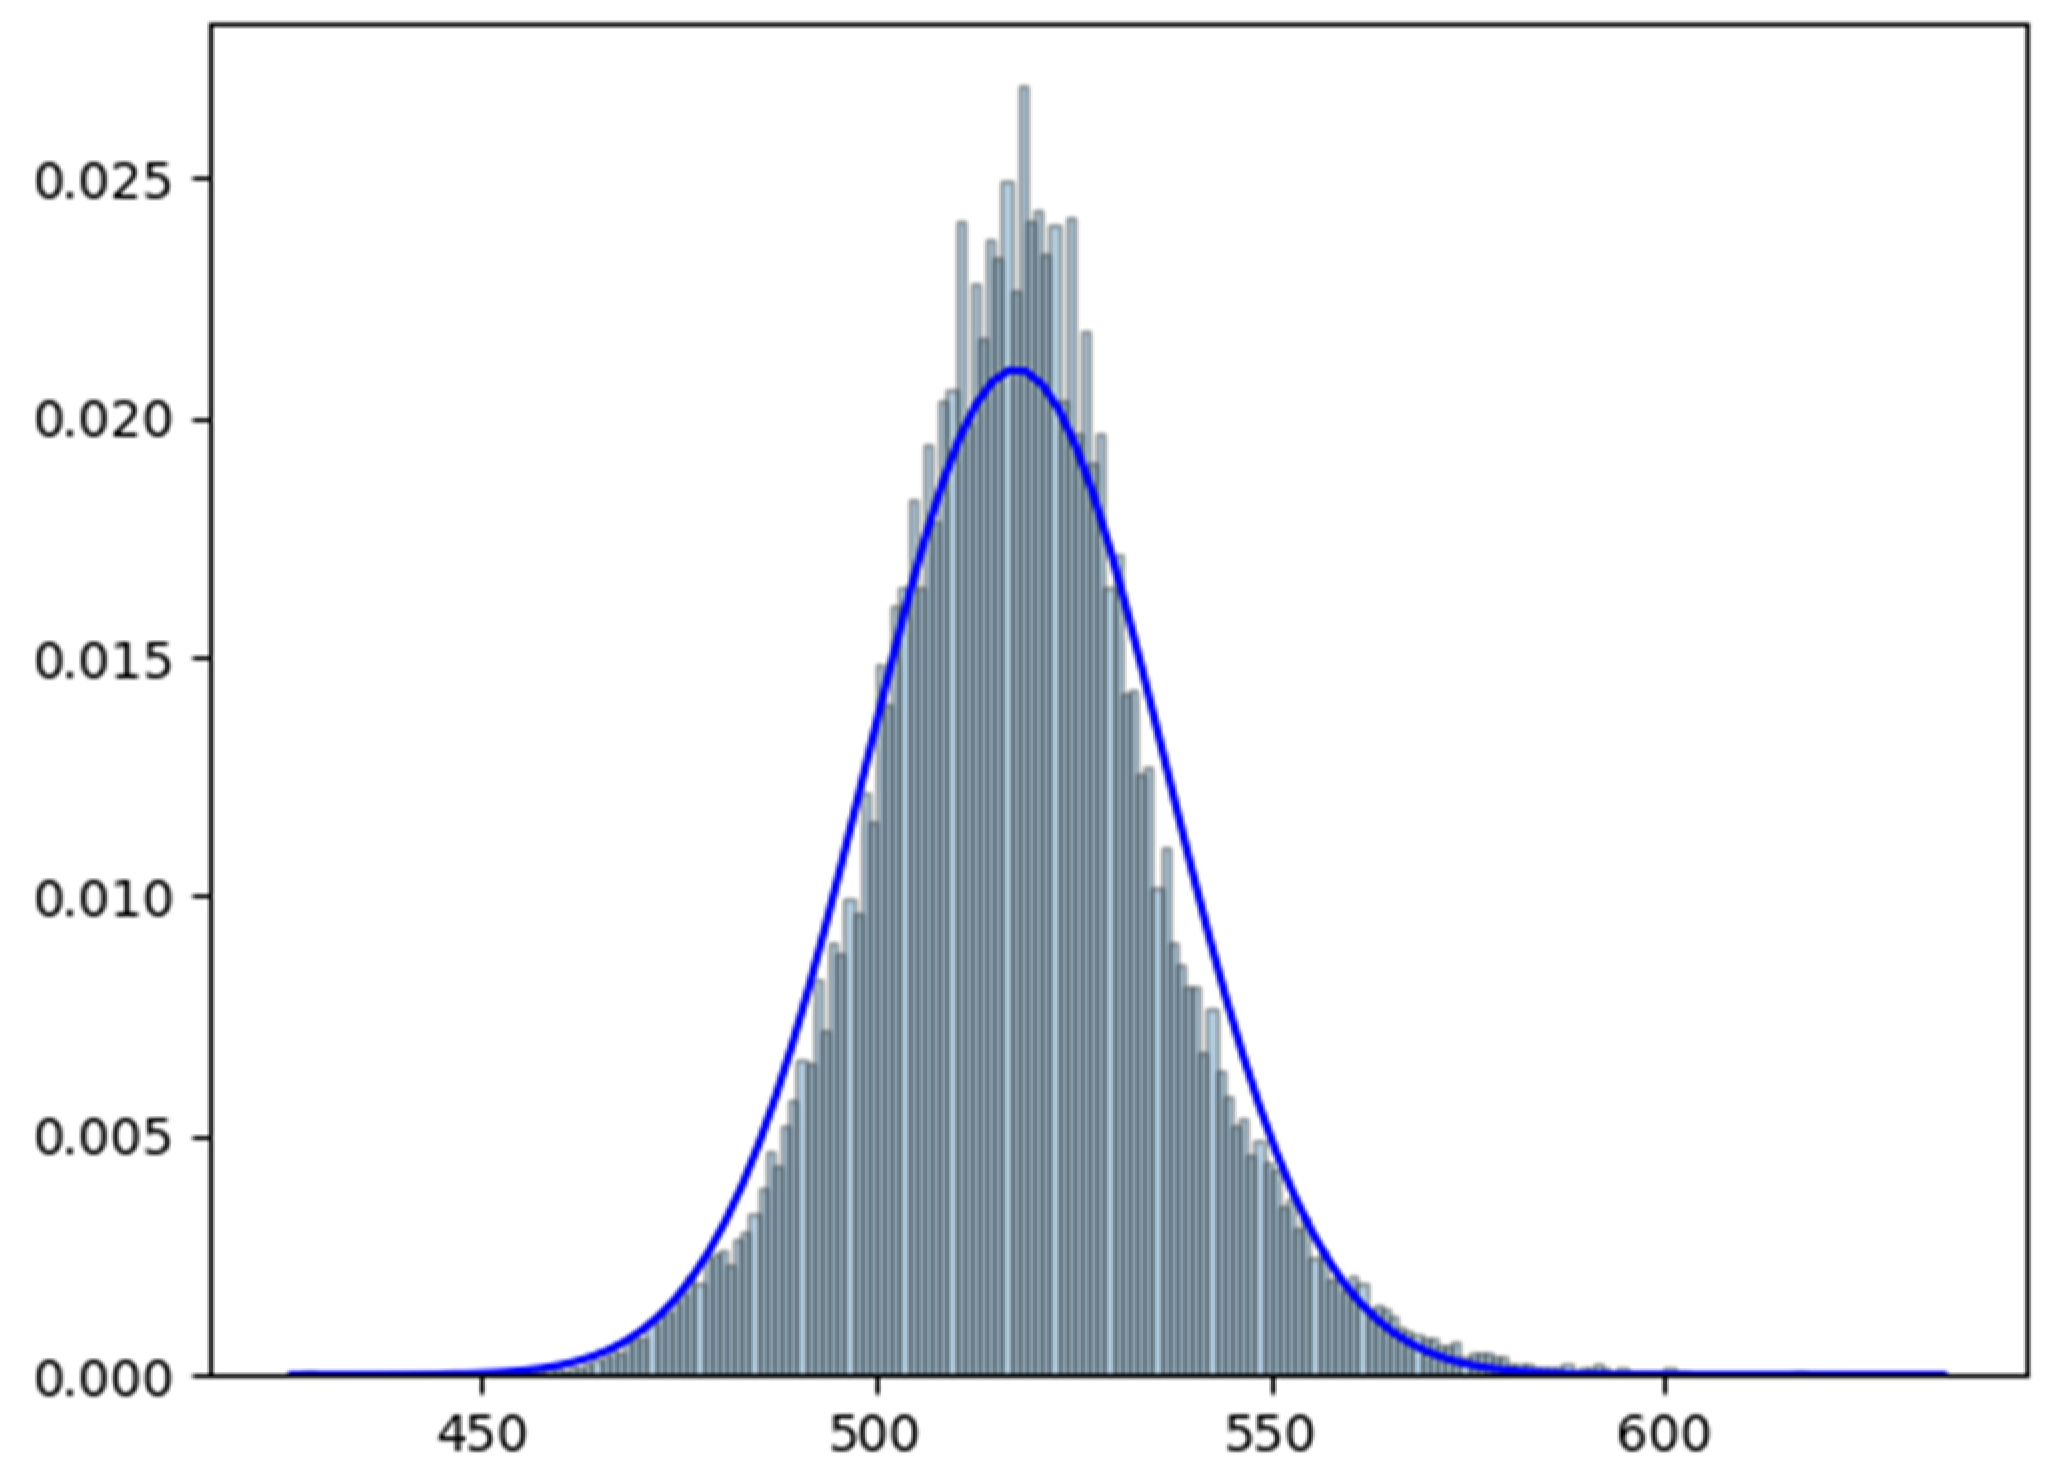
The frequency of occurrence of particular water levels in the Szczecin area is shown in
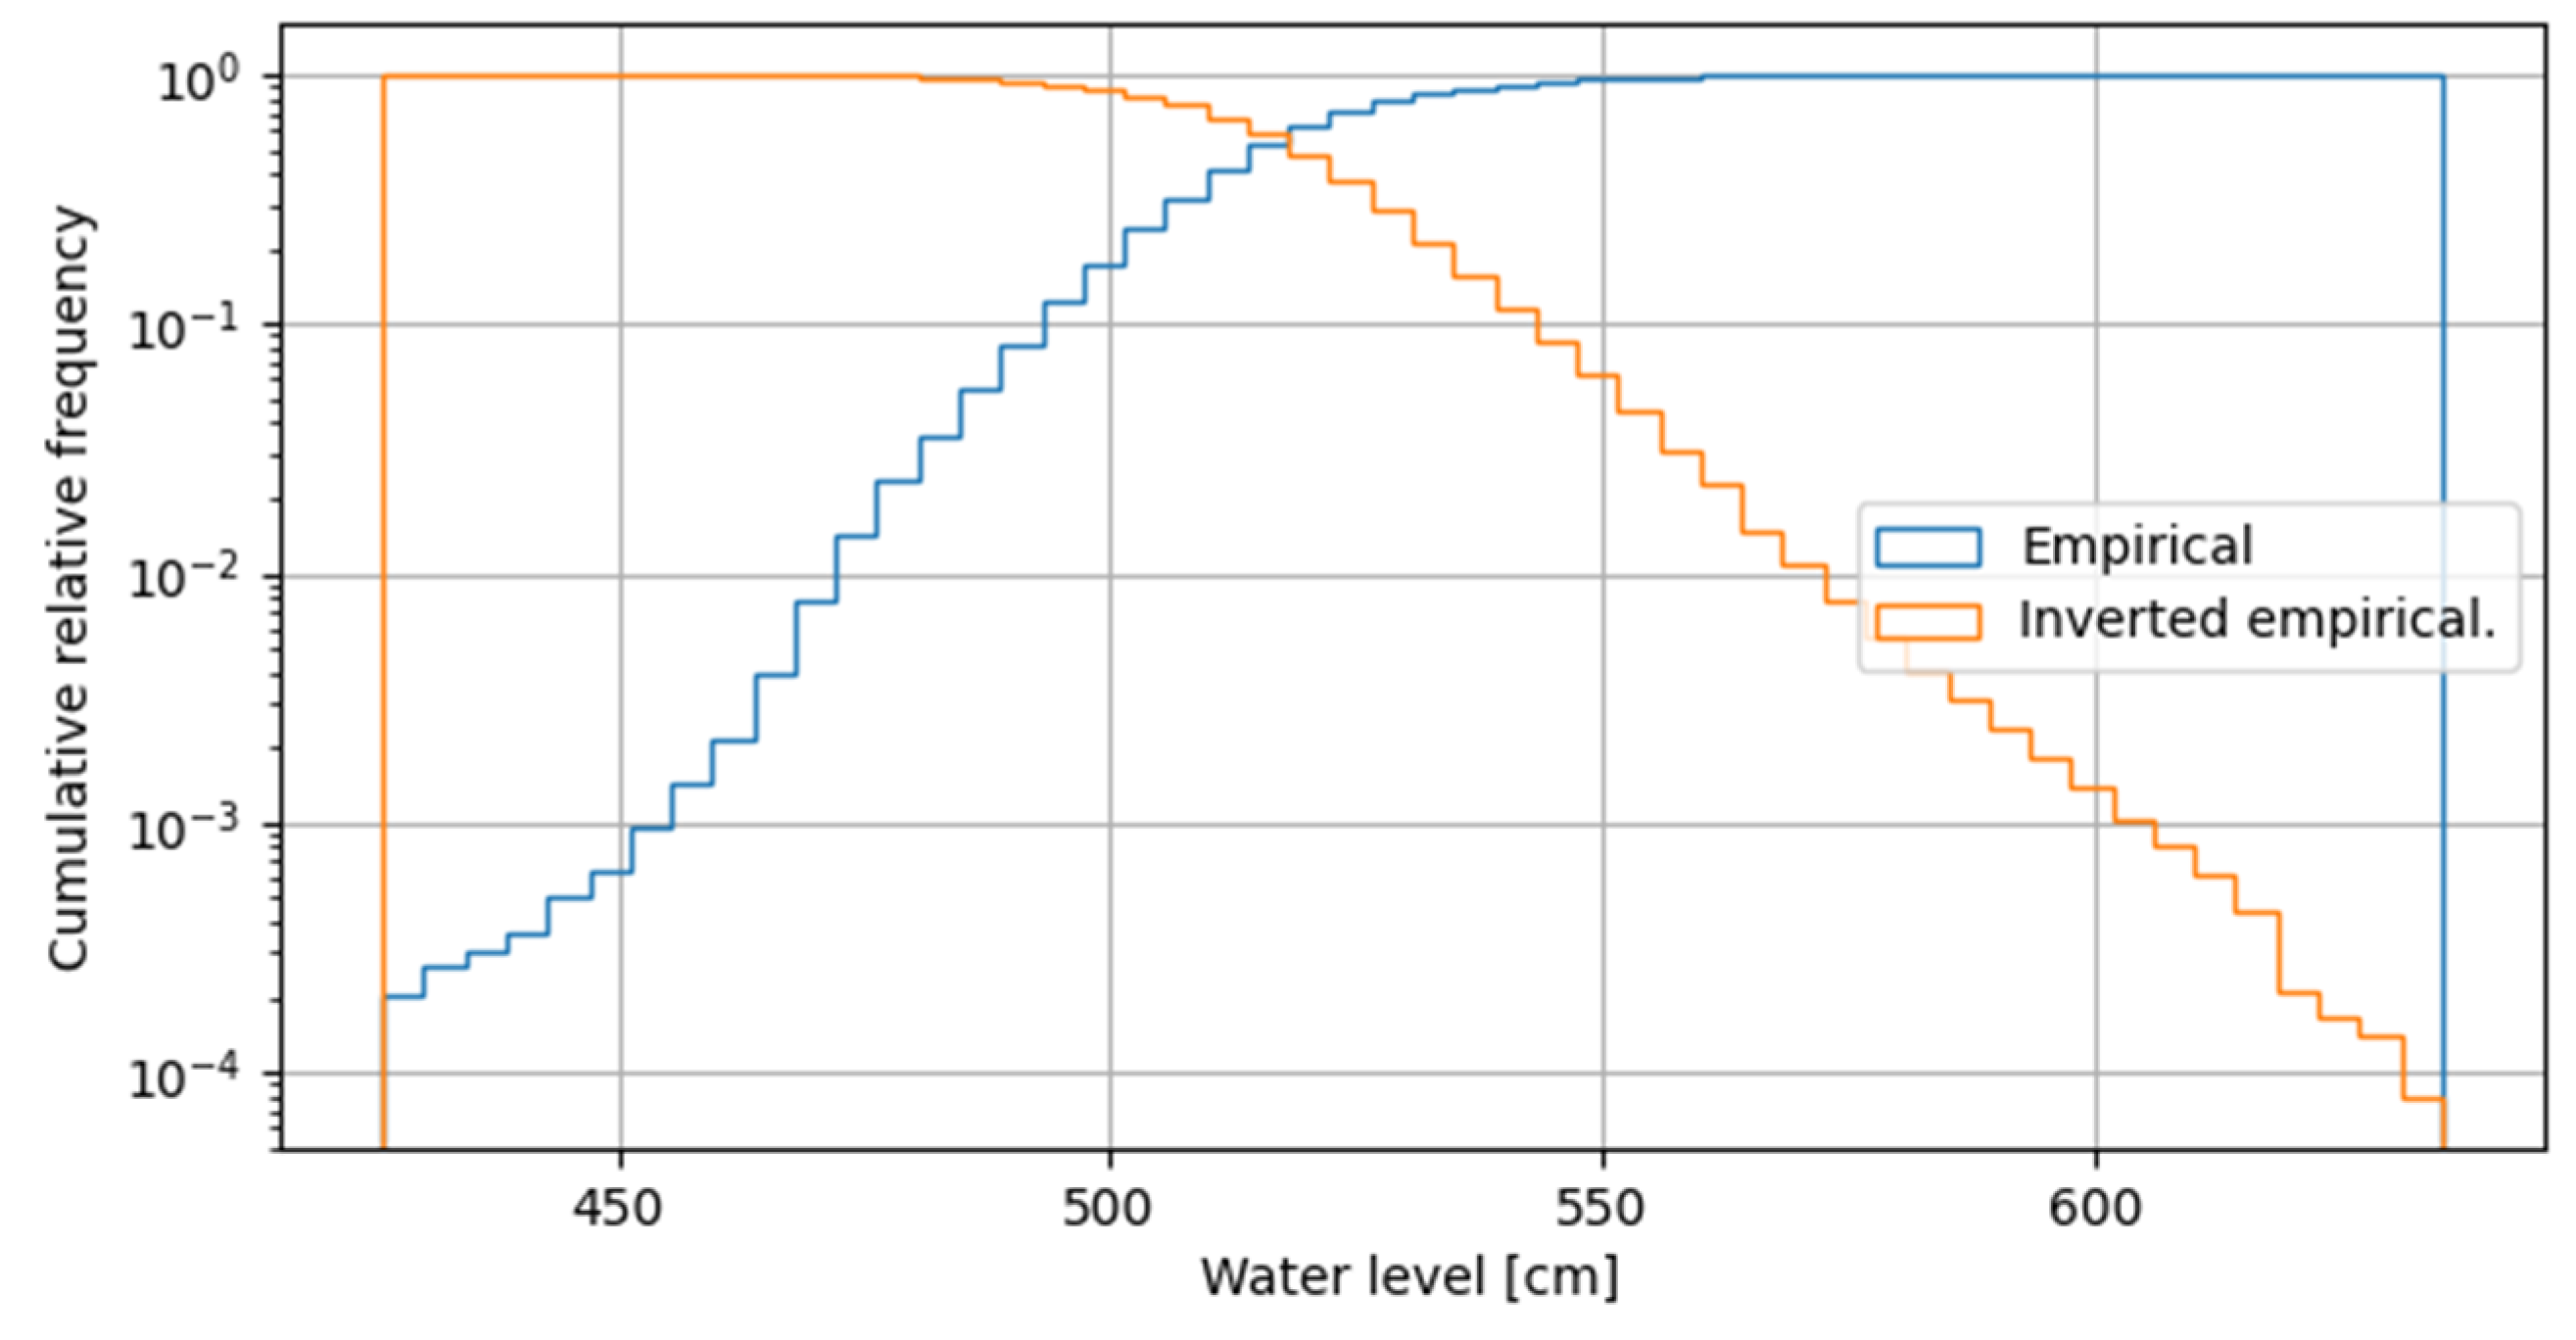
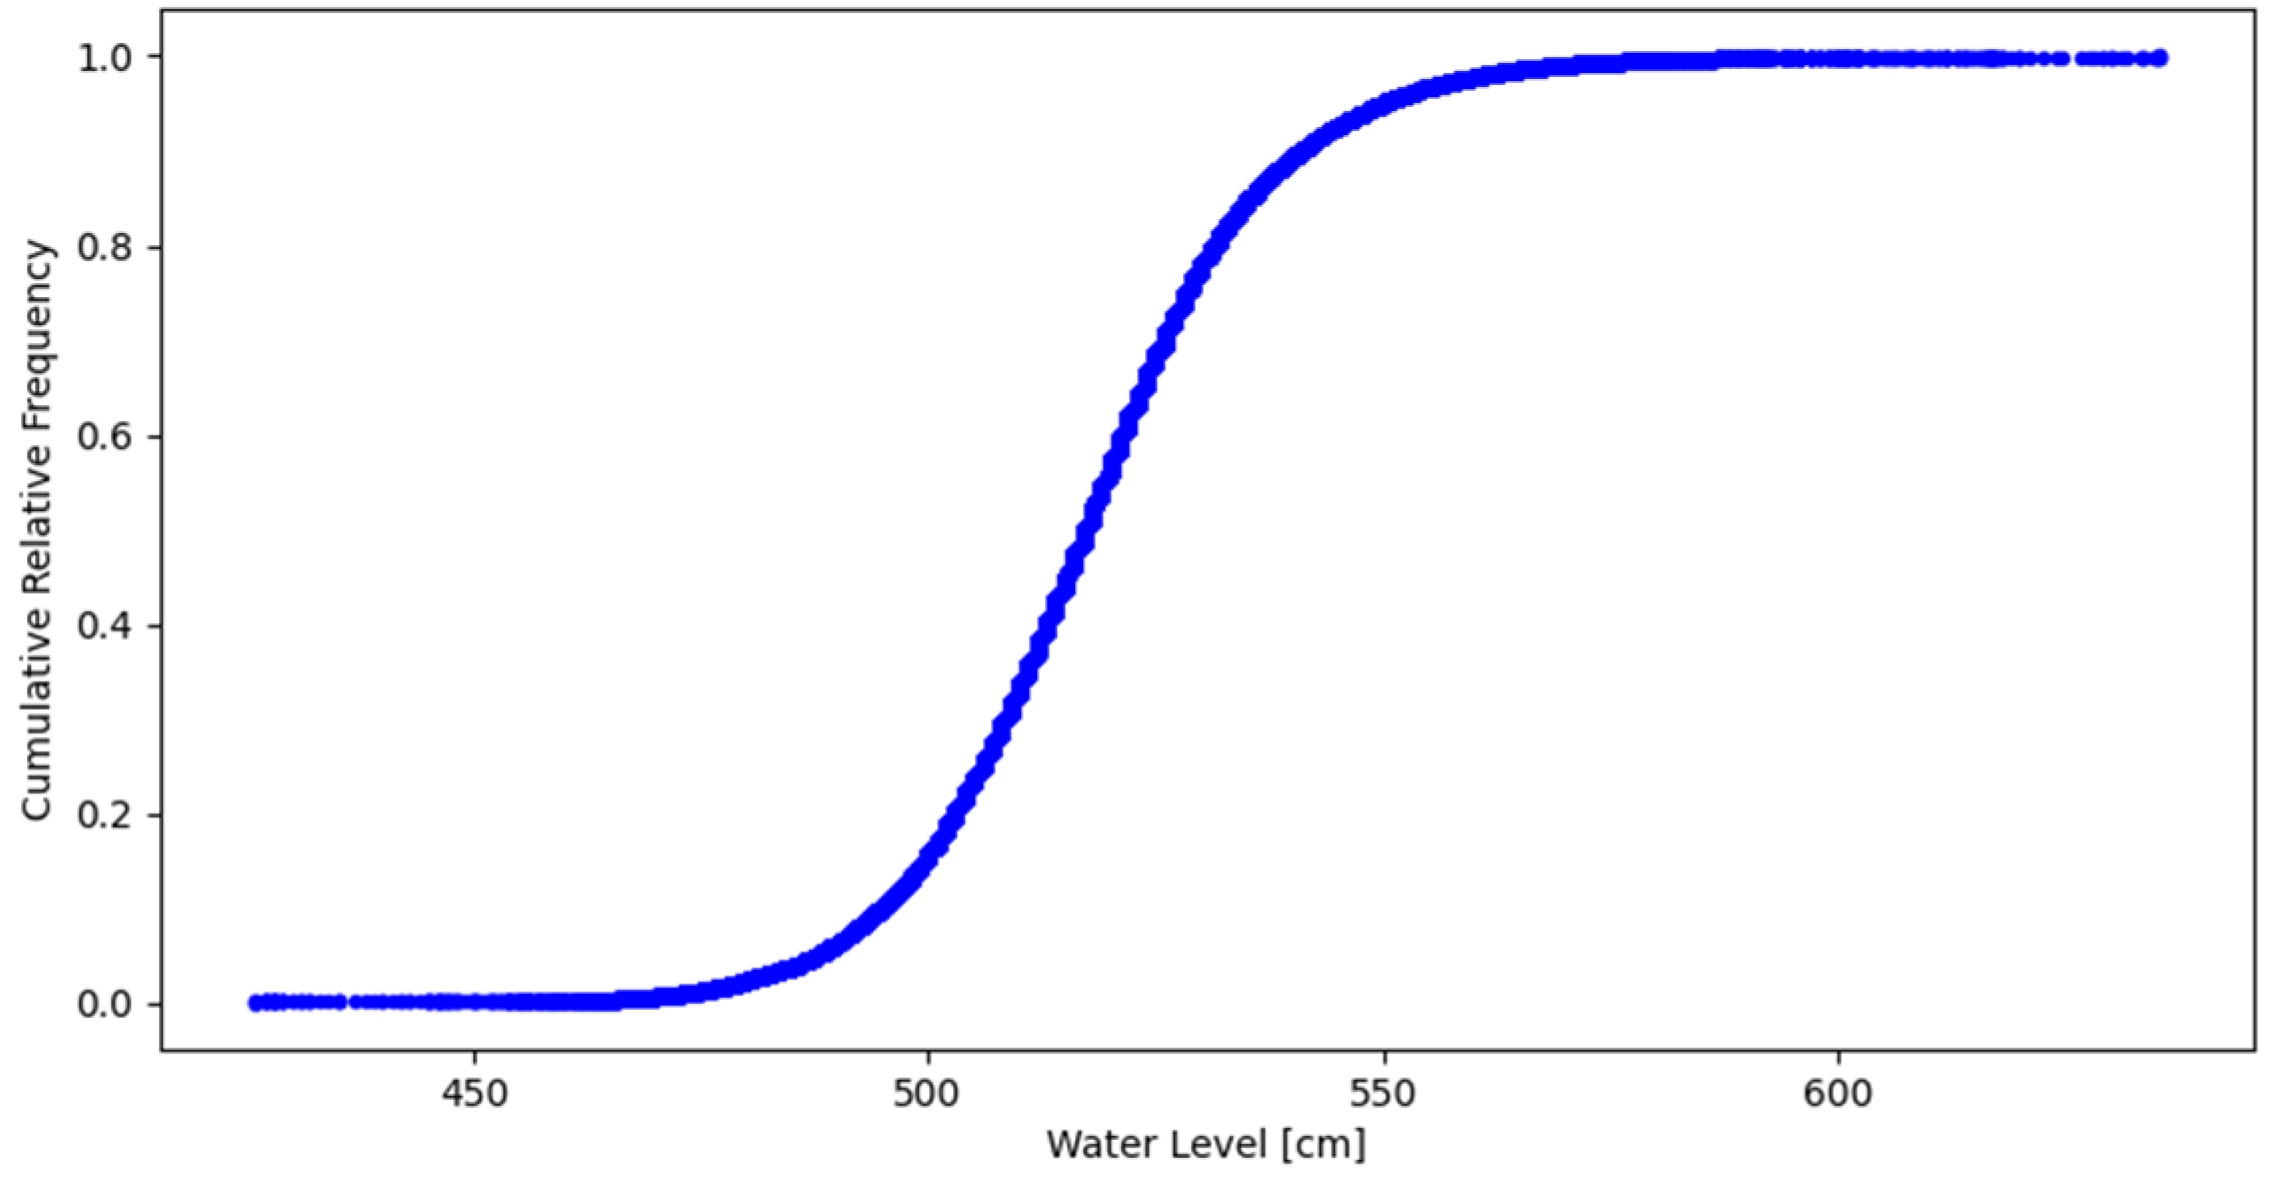
Figure 12. The probability of occurrence of particular water levels is shown in
Figure 13 and
Figure 14.
Table 4 shows the frequency and duration of occurrence of water levels lower than the mean water level by 10, 20, 30, 40, 50, and 60 cm.
2.2. Navigational Constraints and Accessibility of the Fairway
The Świnoujście–Szczecin waterway supports large commercial vessels, including container ships, bulk carriers, and tankers, which carry cargo to the ports of Szczecin and Świnoujście. Constraints due to the depth of the fairway and the variability of water levels pose a key challenge to the movement of deep-draught vessels, particularly during periods of low water levels.
The fairway is also undergoing constant modernisation, including dredging and expansion, to meet the growing demands of maritime transport. In recent years, a number of works have been carried out to improve its accessibility for vessels with greater draught, which is particularly important given the increasing traffic of container vessels and specialised transport vessels.
2.3. Meteorological Conditions
Meteorological conditions such as wind direction and speed [
20] play an important role in shaping water levels in the Świnoujście–Szczecin fairway. Winds from a north-westerly and northerly direction favour an increase in water levels through inflow from the Baltic Sea, which increases the depth of the fairway. On the other hand, winds from the south and south-west may lower the water level, which poses a challenge to ships with greater draught, which may be forced to reduce their cargo or delay their voyage.
Cyclical changes in water levels due to weather conditions have a direct impact on vessel traffic management, route planning, and navigational safety. Therefore, port authorities regularly monitor weather and water level forecasts in order to respond appropriately to changing hydrological conditions.
Recent technological advancements also offer new tools for real-time monitoring of vessel position and water levels. For instance, Chen et al. [
29] proposed a 3D point cloud-based system that enables simultaneous ship detection and high-accuracy water level measurement regardless of lighting or weather conditions. Their improved PointRCNN model demonstrated increased precision in detecting distant vessels and robust riverbank extraction for water level estimation, suggesting promising applications in navigational safety and traffic management on inland waterways.
2.4. Impacts of Water Levels on Navigation
The study area therefore encompasses the entire Świnoujście– Szczecin fairway, whose hydrological conditions are strongly influenced by water level fluctuations and meteorological conditions. This is one of the most important waterways in Poland; therefore, a thorough understanding of the influence of water levels on ship traffic and draught is crucial to optimise maritime traffic and ensure the safety of shipping in this region.
Similar navigational challenges related to water level variability and under-keel clearance management are observed in other major European waterways. For example, the Kiel Canal (Nord-Ostsee-Kanal) [
30,
31], which connects the North Sea and the Baltic Sea, experiences restricted depths and requires precise UKC management due to the volume of commercial traffic and narrow channel geometry. Similarly, the Elbe River [
32] near Hamburg is affected by tidal dynamics, sedimentation, and draught restrictions, requiring constant monitoring and fairway maintenance.
These examples show that managing the accessibility of fairways under variable water levels is a challenge for many important waterways. They indicate that hydrological analysis plays a significant role in navigational decision-making.
3. Reserve of Water Under the Keel of “Maximum Vessels” Passing the Upgraded Świnoujście–Szczecin Fairway
The permissible draught of “maximum vessels” passing the modernised Świnoujście–Szczecin fairway has been determined taking into account the operation of the dynamic system for determining the under the keel clearance. Complementary approaches for relating hydrological data to navigational constraints have been explored in large inland water bodies such as Dongting Lake. Zhang et al. [
28] developed machine learning and polynomial regression models to predict water surface area based on historical water levels, demonstrating high reliability in hydrodynamic analysis over decades. Such coupling models may offer further utility in dynamic fairway access assessments, especially under evolving hydro-climatic conditions.
Analysing the individual components of the under the keel clearance on the Świnoujście–Szczecin waterway, it can be concluded that the highest values are reached by the following components:
a reserve for lowering the water level due to fluctuations in the water table level in relation to the map zero (taken as ∆h, which is the permissible lowering of the water table level);
settling allowance for the ship in motion depending on the ship’s speed and draught and fairway parameters.
Reserve for Water Level Reduction
The reserve for water level reduction represents the permissible drop in water level (∆h) at which a “maximum vessel” of a given type may safely pass through the Świnoujście–Szczecin fairway, without violating the required under-keel clearance (UKC).
In this context, UKC is defined as the minimum vertical distance between the ship’s keel and the seabed, ensuring that the vessel does not touch the bottom even during motion or squat. It is a safety margin that depends on vessel speed, squat, waves, heeling, and water level fluctuations.
The permissible draught (T) of a vessel on a fairway with a given depth (D) and under current water level conditions (h(t)) is governed by the inequality:
where
h0 is the reference water level (assumed as 500 cm), and ∆h is the allowable water level drop, ensuring the required UKC is maintained.
If the actual water level drop at any given time, ∆h(t), exceeds this permissible value:
The vessel must wait before entering the fairway until the water level rises to within the acceptable threshold:
This condition defines the fairway’s availability for deep-draught ships and affects traffic planning. The value of ∆h is chosen depending on the vessel type and its operational flexibility.
Two types of vessels are distinguished:
vessels that should not experience delays, such as container ships and other liner services. For these, a higher safety reserve ∆h is assumed;
vessels for which waiting is acceptable, such as bulk carriers, tankers, and tramp shipping. For these, a lower ∆h value may be selected, depending on the acceptable average waiting time.
The expected number of waiting events per year for vessels with maximum draught is determined based on two parameters:
Assuming a uniform distribution of water level drops throughout the year and the frequency of surveyed vessels entering the port, it is possible to determine the probable number of expectations per year of vessels with maximum draught for the permitted water level:
where:
P∆h—probable number of maximum draught vessels expected per year for the permitted water level [year
−1];
Ir—annual frequency of entries of ”maximum vessels” (having maximum draught) [rok
−1];
nr—annual average number of occurrences of water levels below the admissible level;
tr—average duration of water levels below the admissible level [h];
Gr—number of hours per year (8760 h).
Based on the results of verification studies of water levels in the Świnoujście–Szczecin fairway in the years 2011–2019, the following was determined:
average annual number of occurrences of water levels lower than 465 cm, 470 cm, or 475 cm, respectively;
average durations of water levels lower than 465 cm, 470 cm, or 475 cm, respectively.
The expected number of vessel arrivals was determined based on forecasted port traffic data and operational profiles of ships calling at the ports of Szczecin, Police, and Skolwin. Two distinct categories of maritime traffic are considered:
Liner vessels (e.g., container ships), which operate on fixed schedules and for which waiting time at the fairway is generally not acceptable. For these vessels, a more conservative under-keel clearance and higher water level reserve ∆h is applied to minimize disruptions;
Tramp vessels (e.g., bulk carriers, tankers, LPG carriers), which operate flexibly and may be allowed to wait for favourable conditions. In this case, ∆h may be optimized based on acceptable waiting time thresholds.
In this study, the annual number of arrivals of “maximum vessels” for which waiting is operationally acceptable was assumed to be 100 per year (Ir = 100 [year−1]). This value reflects the projected frequency of deep-draught vessels that may be affected by temporary water level reductions and is used in the calculation of expected waiting events (P∆h).
The assumptions are aligned with historical traffic data and development plans for bulk and liquid cargo terminals in the Port of Szczecin region. The probable number of waiting times of these vessels with maximum draught for the permissible water level was determined for 465 cm, 470 cm, and 475 cm, respectively (
Table 5).
4. Impact of ∆h on Vessel Waiting—Analysis in Świnoujście
In this study, two modelling approaches were used to assess vessel accessibility: deterministic and probabilistic.
The deterministic model evaluates each situation based on fixed parameters: vessel draught, dynamic vertical margin (∆h), and observed water level. A vessel is considered to experience a delay if the water level drop ∆h(t) exceeds the allowable threshold ∆h.
The probabilistic model applies a Monte Carlo simulation to estimate the probability of delays under variable hydrological conditions. The simulation involves:
Random sampling of vessel entry times from a uniform distribution;
Use of hourly water level data to calculate ∆h(t) for each vessel;
Comparing each sampled ∆h(t) with the fixed threshold ∆h;
Repeating the process for 1000 vessels (n = 1000);
Computing the proportion of vessels that must wait as the estimated probability of delay.
This approach allows for quantification of navigational risk due to water level variability.
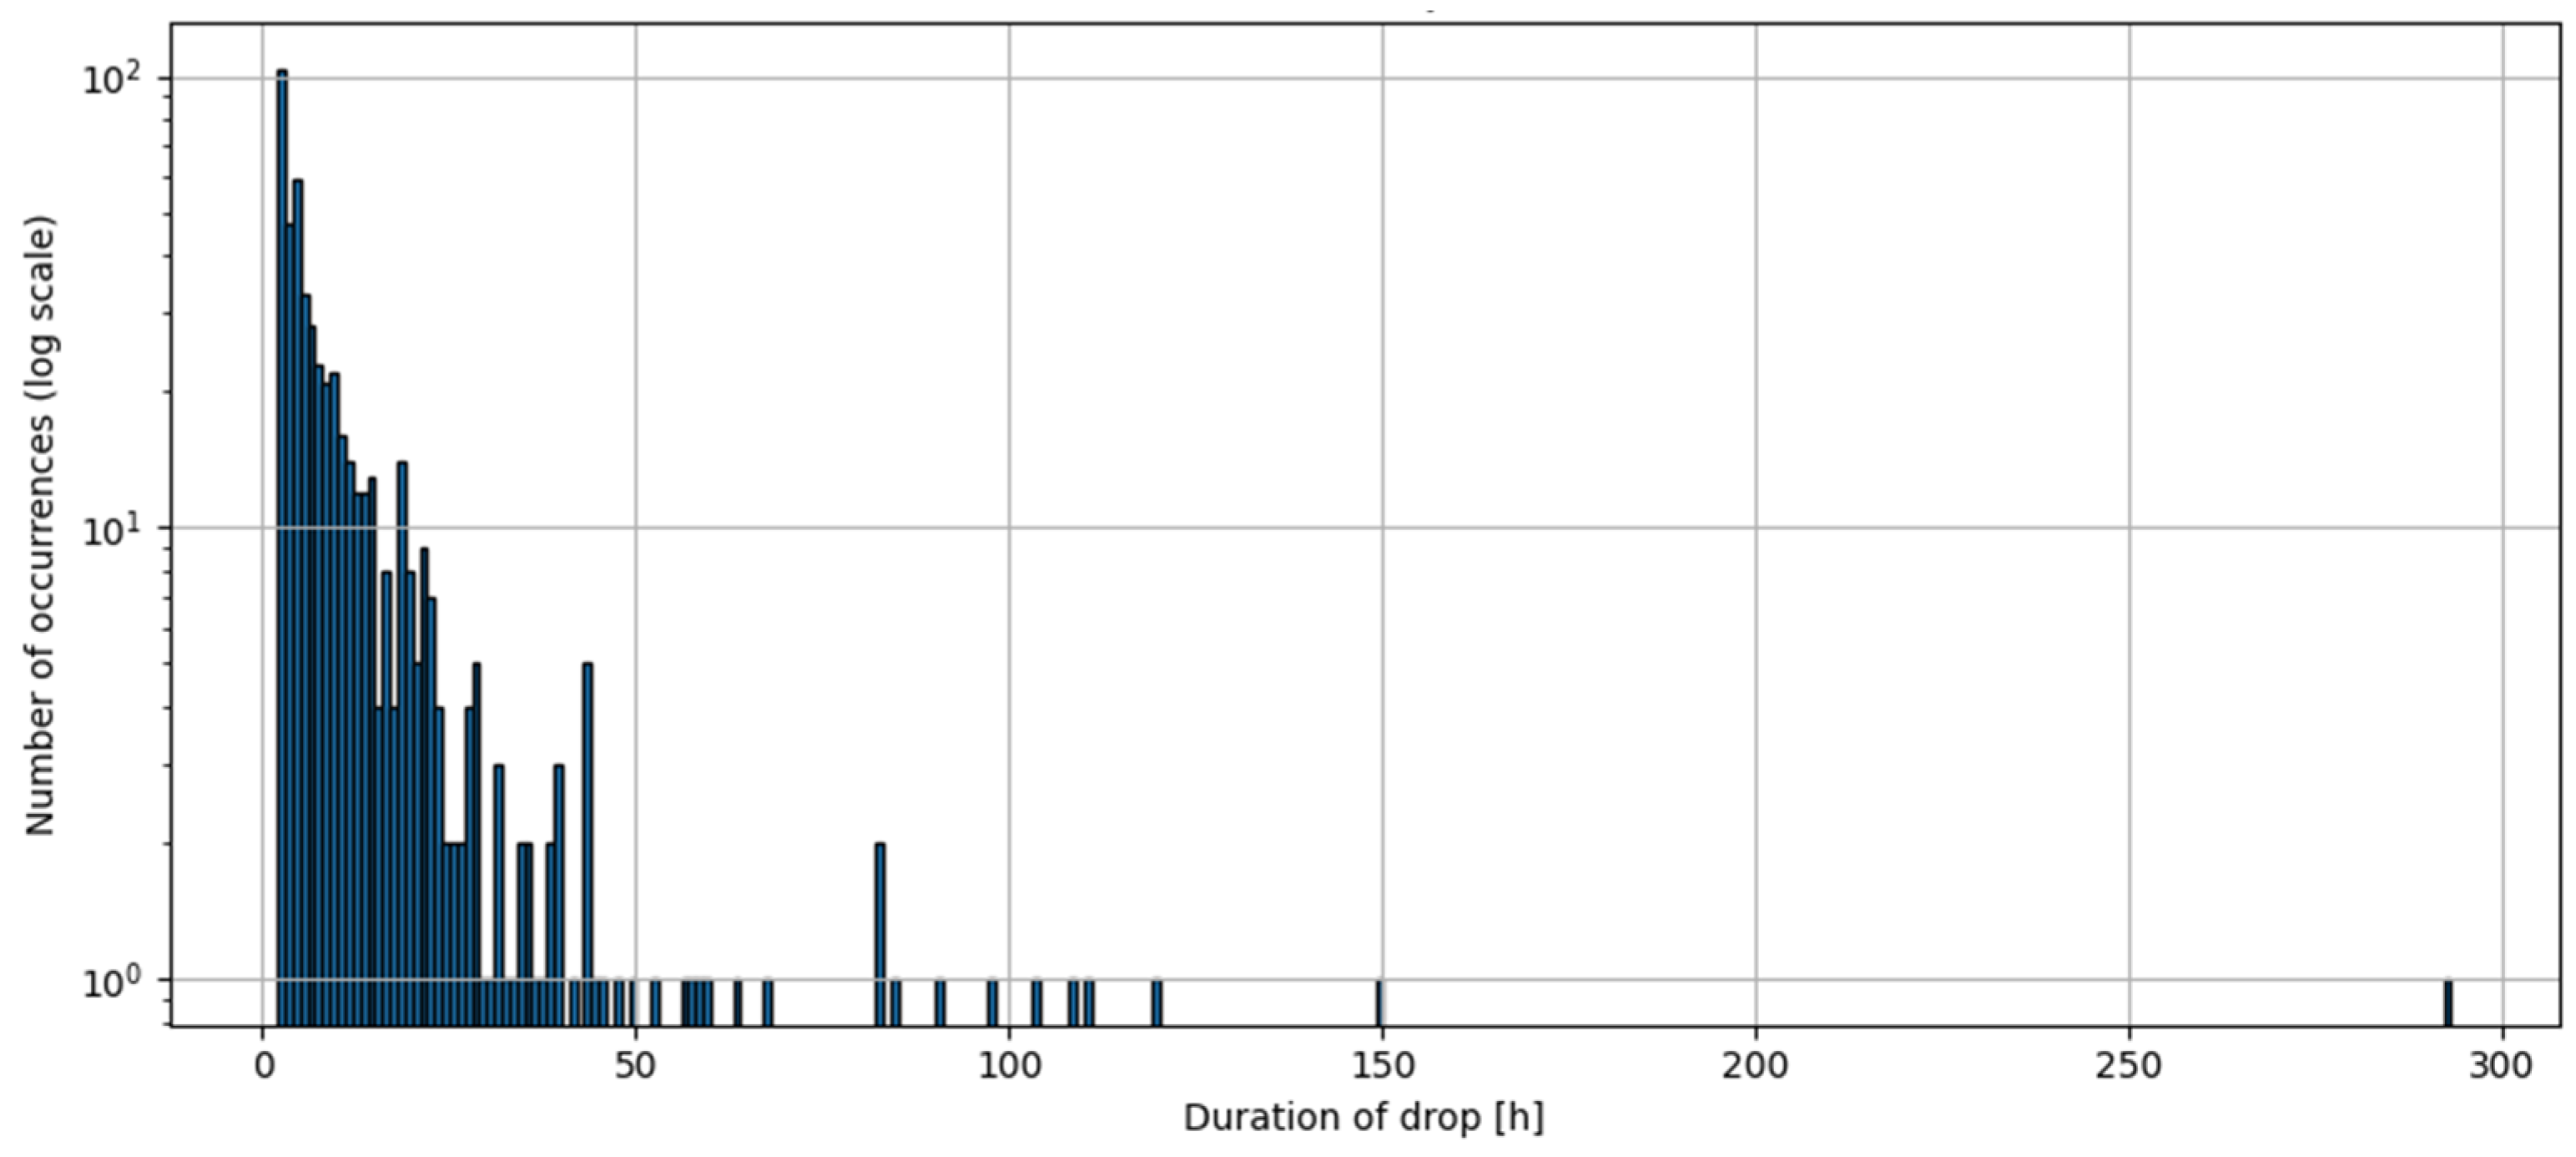
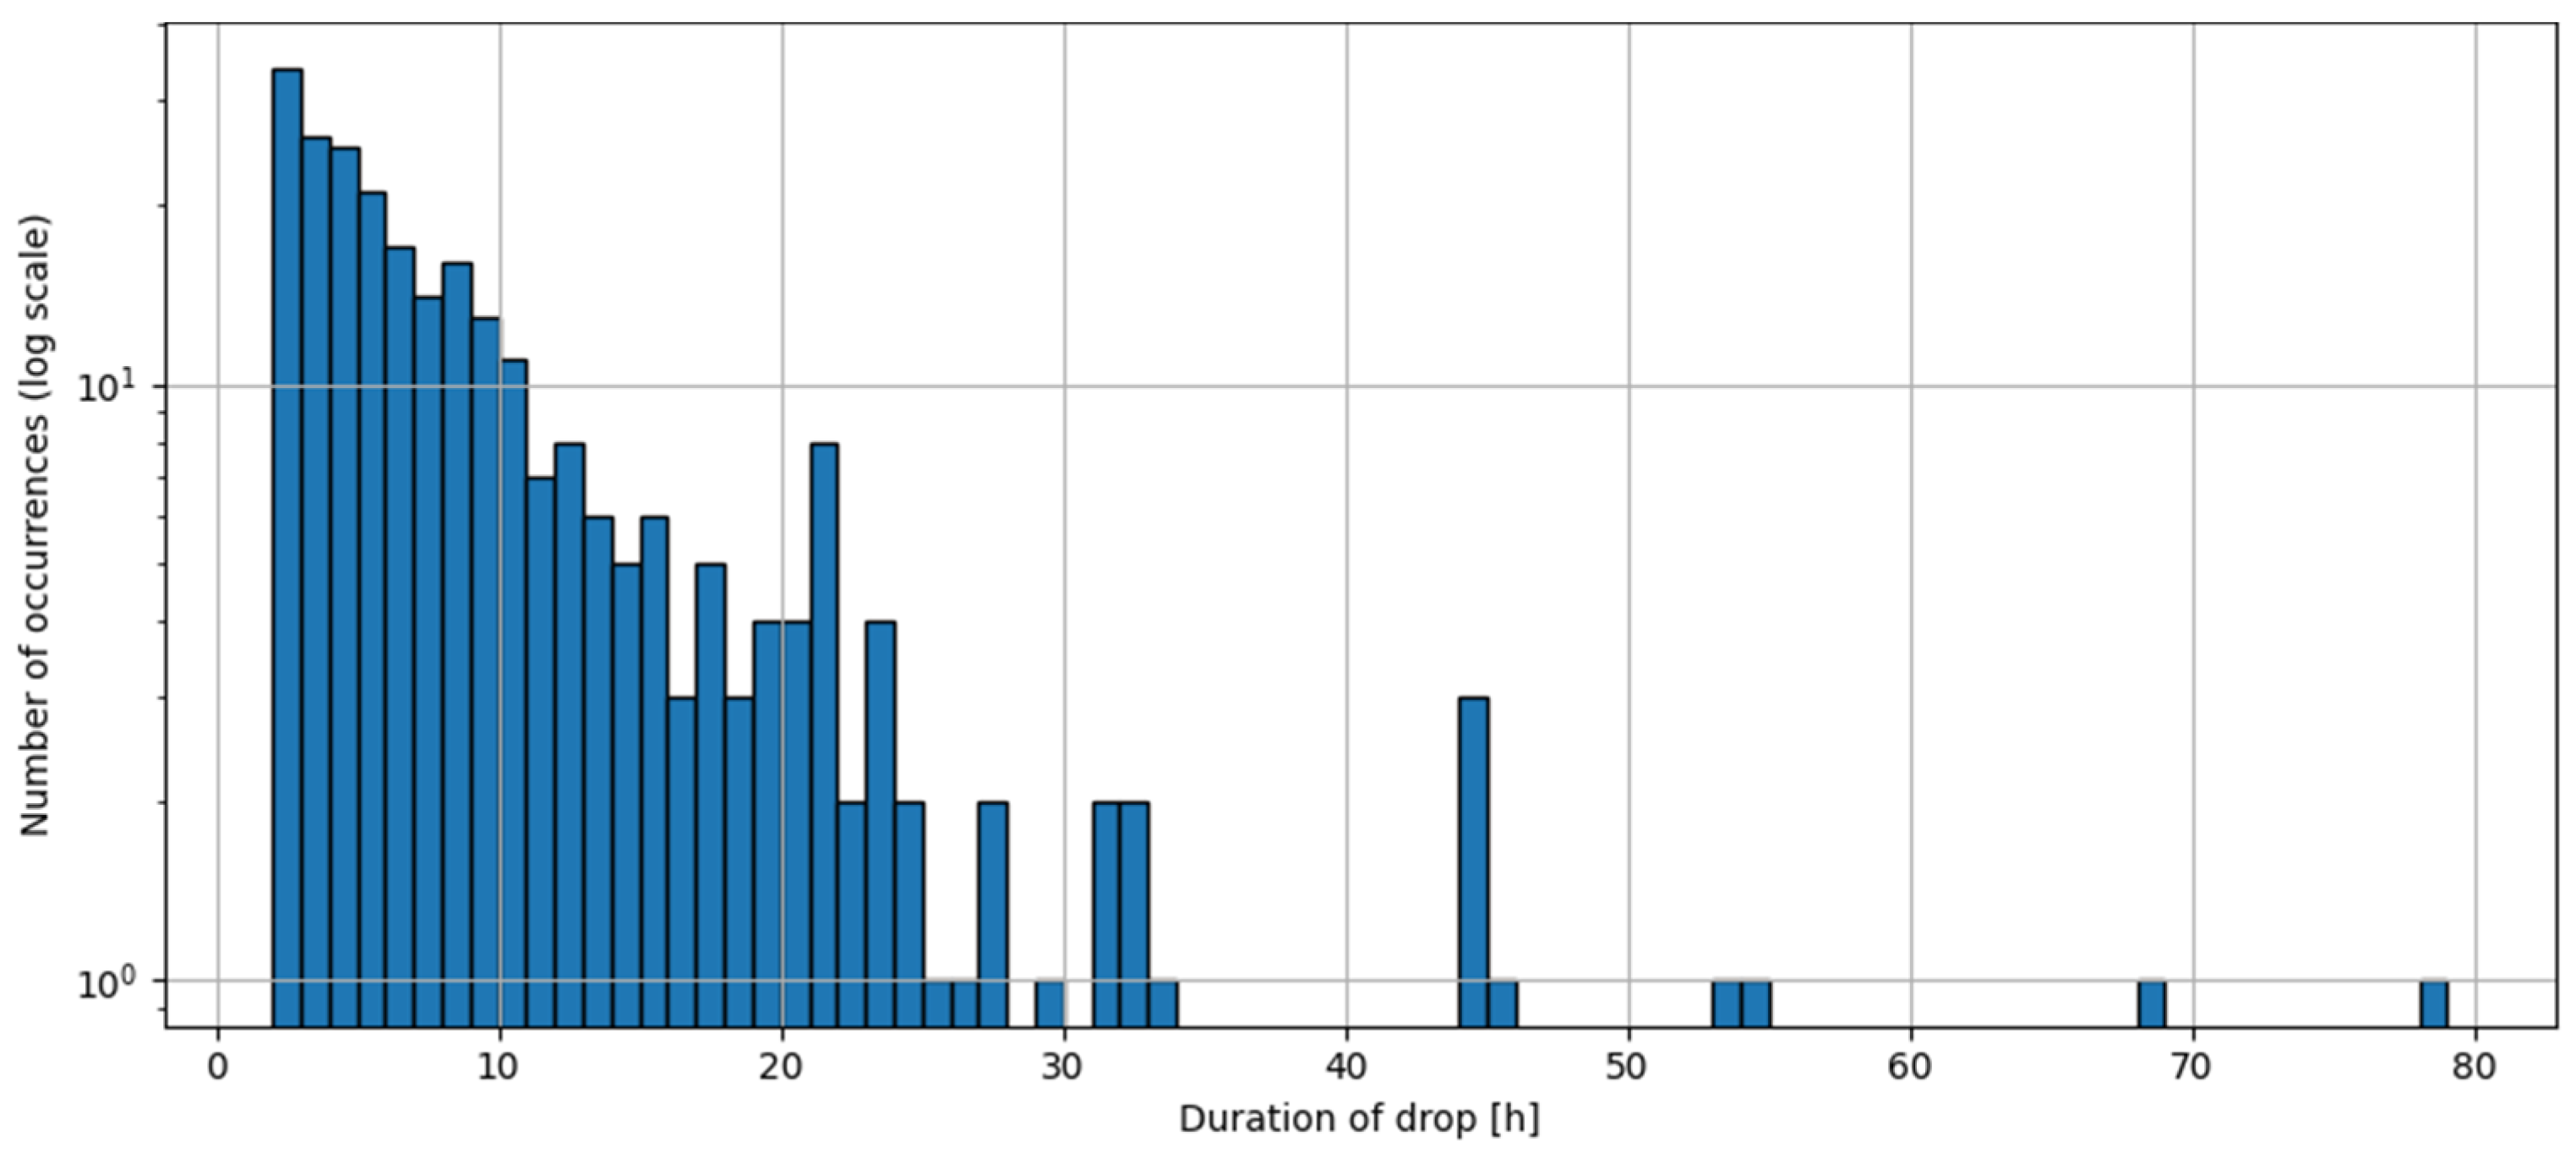
To assess the impact of the permissible reduction in water level (∆h) on the accessibility of the Świnoujście–Szczecin fairway for deep-draught ships, an analysis was conducted based on hourly data from the water gauge station in Świnoujście from 2008 to 2022. The fairway depth was assumed to be 12.5 m, the ship’s draught 11.5 m, and the reference level in Amsterdam 500 cm. Variable ∆h values of 15, 20, 25, 30, and 35 cm were used in the calculations. The critical water level was considered to be the level at which the under-keel clearance (UKC) falls below the permissible ∆h value—in such cases, the ship cannot continue its movement along the fairway and must wait for conditions to improve.
Figure 15,
Figure 16 and
Figure 17 show the frequency and duration of water level drops below 475, 470, and 465 cm.
Deterministic calculations showed that the average number of waiting events per year (PdH) increases non-linearly with increasing ∆h—from about 0.05 for ∆h = 15 cm to 0.16 for ∆h = 35 cm. Although these values are low, the trend confirms that a reduction in the reserve under the keel results in a higher risk of reduced track availability.
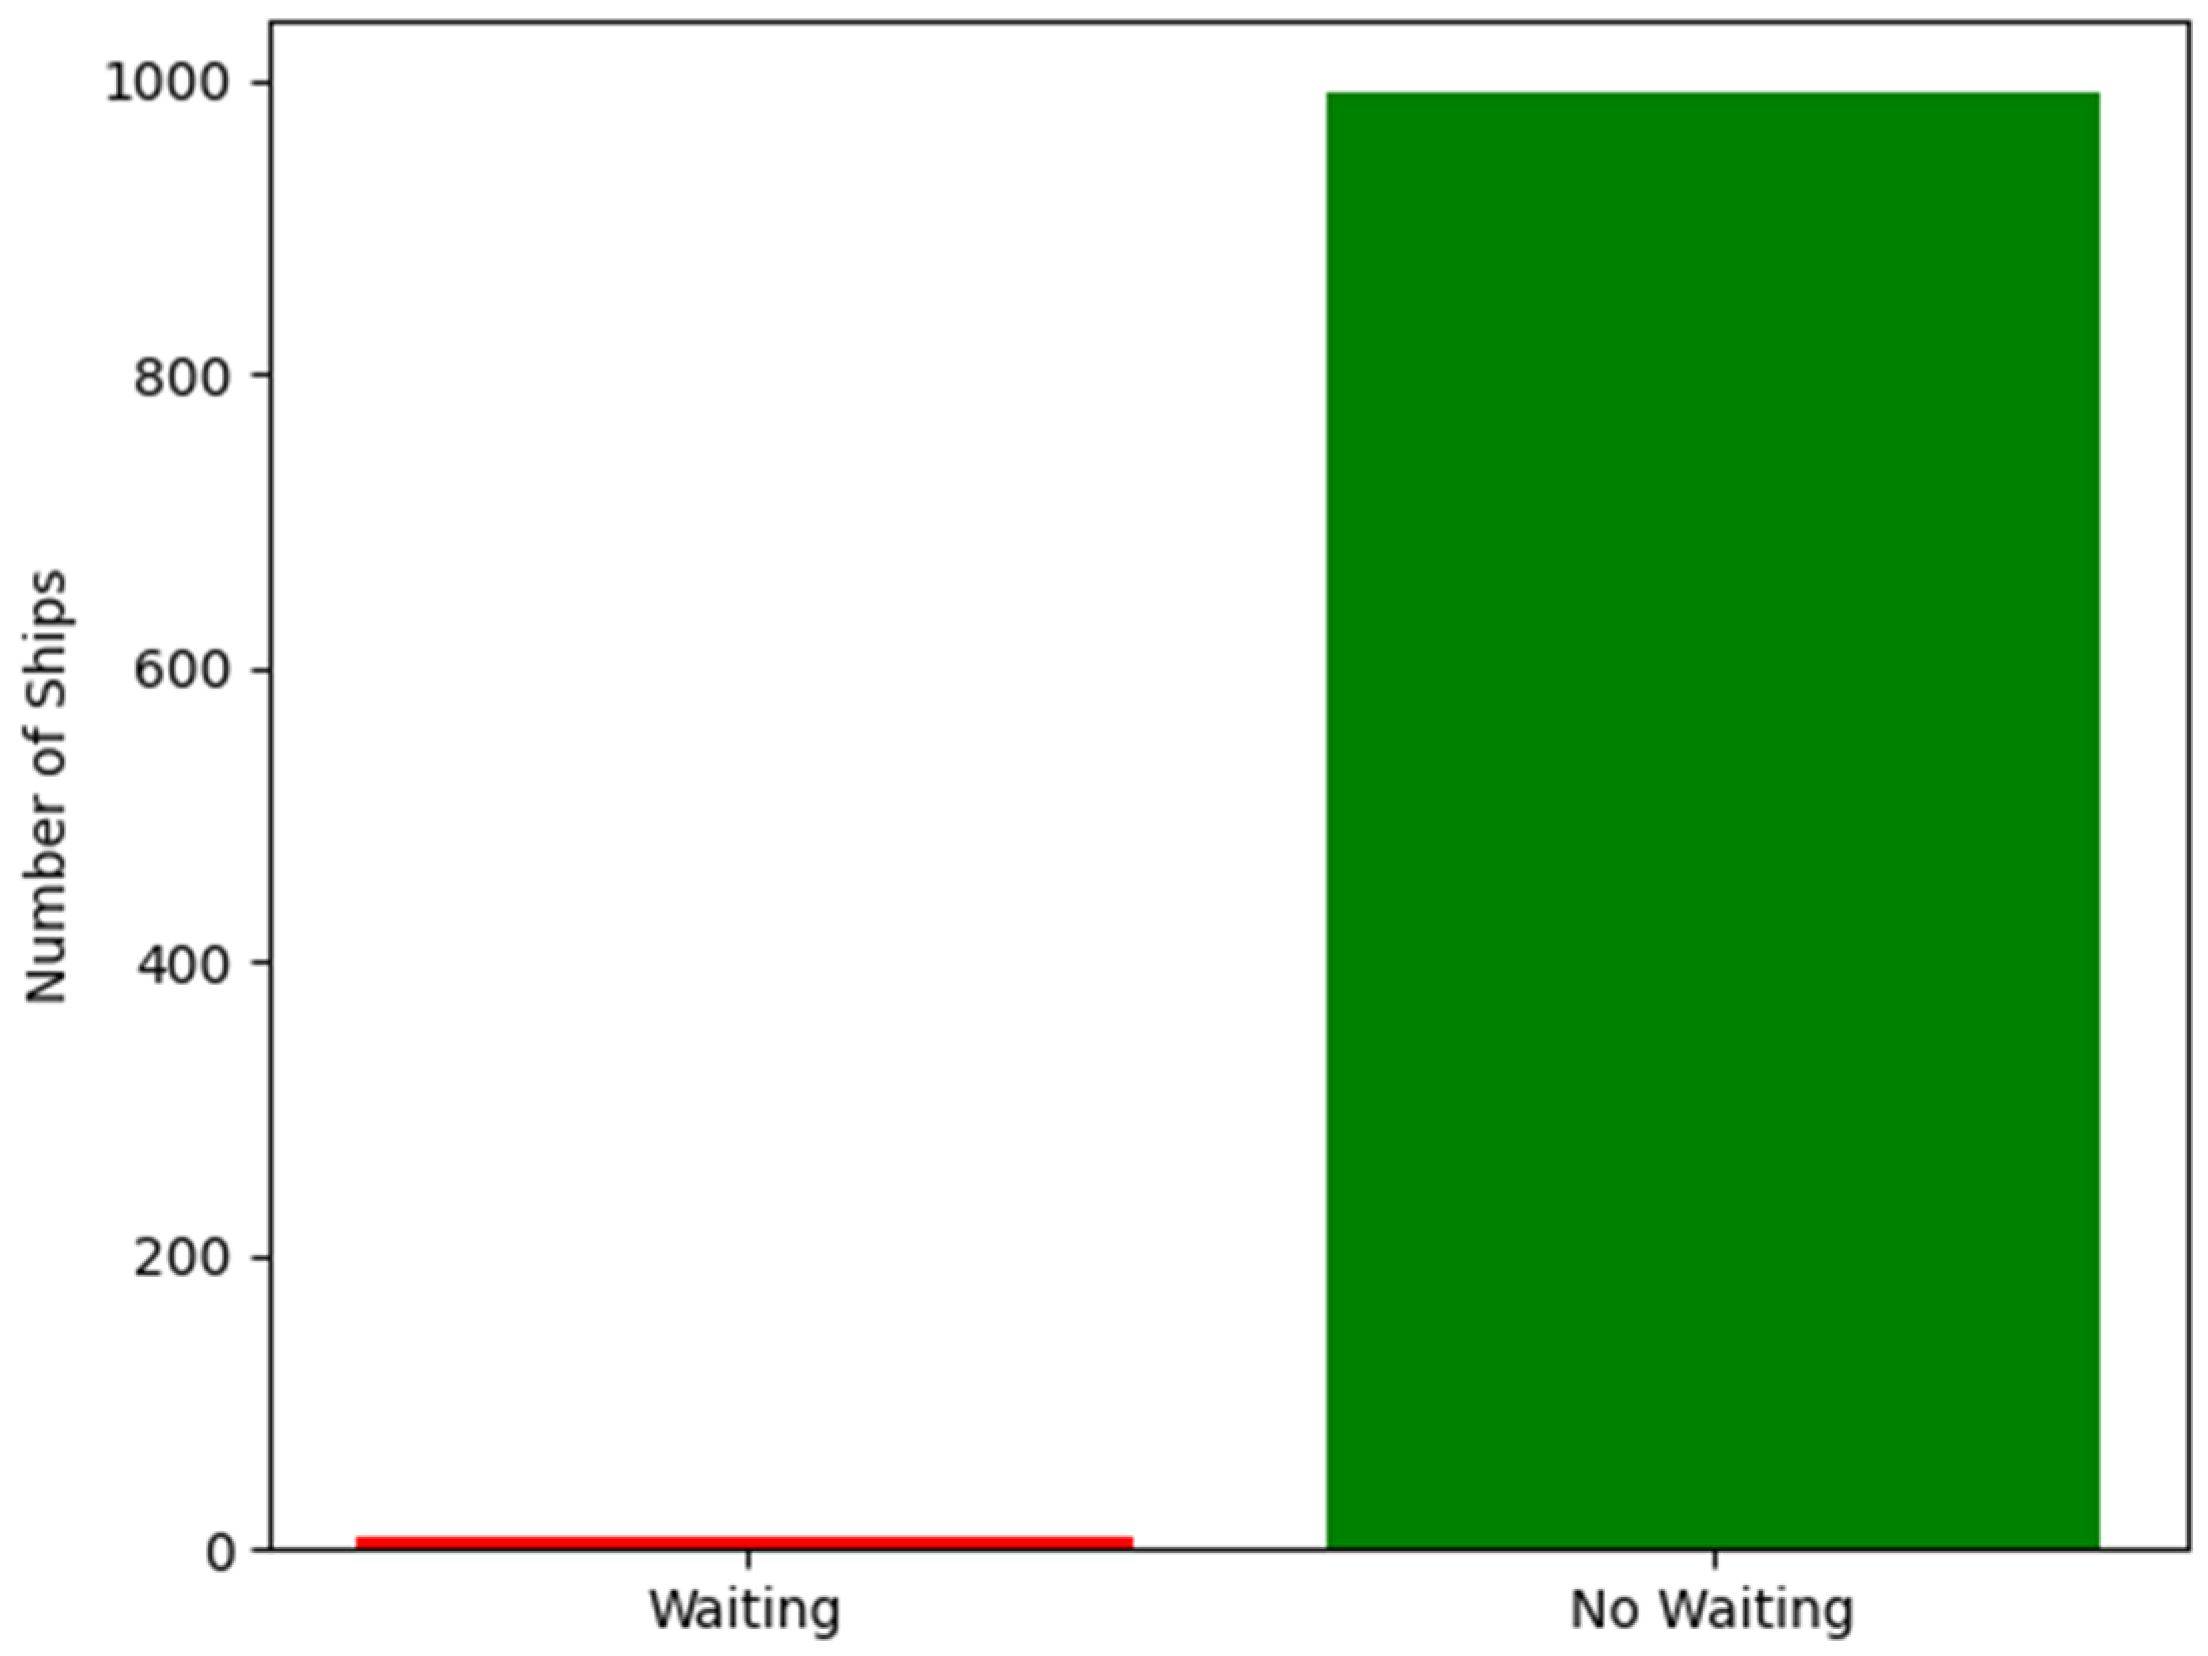
A complementary Monte Carlo simulation was carried out, generating 1000 vessels with a random draught between 11.00 and 12.00 m and random moments of entry into the track during the study period. The results showed that, at ∆h = 25 cm, only single vessels (e.g., 1–2 out of 1000) encountered water levels that prevented passage. This is consistent with the histogram of water levels, which shows that values below the critical threshold (e.g., 425 cm) are relatively rare, confirming the correctness of selecting ∆h = 25 cm as a compromise value.
The reliability of model-based estimation of water levels in data-sparse or uncertain measurement conditions is crucial for robust planning of fairway accessibility. A similar approach was proposed by Lesmes et al. [
33], who developed the DWLT (Discharge-to-Water Level Transformation) method using monthly duration curves, effectively transforming global discharge model outputs into reliable water level estimates. Their study emphasizes that even in the absence of dense ground data, water level estimations from hydrological models (e.g., GEOGLOWS ECMWF) can maintain high correlation with actual observations, enhancing the resilience of navigational planning in hydrologically variable regions.
A Monte Carlo simulation was carried out to probabilistically assess the accessibility of the fairway under conditions of varying water levels and variable draught of vessels. For each vessel generated in the experiment, the following were drawn at random:
Ti ∼ U (11.00, 12.00)—draught of the craft (in metres);
ti ∼ U (1, N)—moment of vessel entry, a randomly drawn hour from the data interval [1, N], where N is the number of hours in the study period (2008–2022).
For each implementation, the condition was checked:
where:
h(ti)—water level at the time
ti; h
kr(T
i)—critical water level;
h0 = 500 cm—benchmark (Amsterdam);
D = 1250 cm—fairway depth;
Δh—adopted minimum under the keel clearance;
Ti—drawn draught of the vessel.
If the condition was not met, a waiting case was recorded. The simulation was repeated for n = 1000 units to estimate the probability of encountering insufficient fairway depth conditions under given assumptions (
Figure 18).
The threshold value of ∆h = 25 cm was selected as a compromise between navigational safety and the accessibility of the fairway [
23,
34,
35]. It reflects a realistic minimum under-keel clearance (UKC) that aligns with hydrological variability and operational practice. The adopted under-keel clearance (UKC) safety margins are consistent with international guidelines, such as PIANC WG 121 (2014),
Harbour Approach Channels—Design Guidelines, which recommend appropriate UKC allowances based on navigational conditions and fairway characteristics [
36]. Additionally, IALA Guideline No. 1089 (2012) [
37] emphasizes the role of Vessel Traffic Services (VTS) in supporting safe navigation in constrained waterways, including UKC monitoring and advisory functions.
The number of simulated vessels (n = 1000) was chosen to ensure statistical robustness of the Monte Carlo analysis [
38]. A uniform distribution of vessel entry times was assumed to provide a neutral baseline scenario without introducing seasonal or temporal traffic bias.
The analysis confirms that the value of ∆h has a significant, albeit moderate, impact on fairway availability, and that the use of a value of 25 cm minimises the risk of downtime while maintaining the required water reserve under the keel.
5. Summary
An analysis of the results for Świnoujście, I Tor Gate, Chełminek, and Szczecin shows:
the highest probable numbers of expectations per year for vessels with maximum draught occur in Świnoujście ranging from 2.18 for the permitted water level of 465 to 5.28 for the permitted water level of 475;
the average waiting (duration) times for admissible water levels are comparable for the examined water levels from 465÷475 and are, respectively, for Świnoujście from 7.31 h to 8.30 h, for Trzebież from 10.15 h to 14.65 h, and for Szczecin from 13.79 h to 17.96 h.
Taking into account the possibility of a daily waiting time of four ships per year with draught T = 11.2 m caused by low water levels, it is possible to assume that the permissible lowering of the water table level in the Świnoujście–Szczecin fairway for bulk carriers, tankers, and LPG carriers with maximum draught entering the ports of Szczecin, Police, and Skolwin (designed) is equal to:
In the long term, the accessibility of the Świnoujście–Szczecin fairway may be influenced by ongoing environmental changes. Sea-level rise could gradually increase the average water depth, potentially improving access for deep-draught vessels. However, extreme weather events, such as storm surges or prolonged low-pressure systems, may lead to more frequent or severe fluctuations in water levels, temporarily reducing navigability. Additionally, sedimentation processes in the Szczecin Lagoon and river sections may require more frequent dredging to maintain the designed depth. These factors underscore the importance of ongoing hydrological monitoring and adaptive management of fairway parameters in the context of climate change.
The outcomes of this study may assist in operational decisions at the port level, especially during periods of low water. The presented modelling approach can be integrated into decision-support tools to assess whether incoming vessels with specific draughts should proceed or wait. By incorporating real-time water level data, the method may contribute to dynamic traffic scheduling, reducing delays and optimizing port throughput. Furthermore, the identification of critical ∆h thresholds can inform policy decisions regarding acceptable risk levels, dredging priorities, and investment in fairway monitoring infrastructure.
The methodology adopted in this study relies primarily on the statistical analysis of historical water level records and the application of a deterministic threshold-based model to evaluate fairway accessibility. While this approach provides a clear framework for assessing ∆h-based entry conditions for “maximum vessels”, it has certain limitations.
The model does not account for interannual hydrological variability, potential long-term changes in bathymetry, or sediment dynamics that may alter the under-keel clearance (UKC) and affect fairway depth over time. Additionally, meteorological extremes (e.g., storm surges, droughts) and climate-induced trends are not explicitly included. These factors could be integrated into future analyses through the use of probabilistic models, real-time bathymetric monitoring, or hydrodynamic simulations.
Expanding the methodology to incorporate such variables would allow for a more comprehensive and realistic assessment of the long-term navigability of the Świnoujście–Szczecin waterway, particularly under scenarios of climate change and increased maritime traffic.
Comparative Estuarine Case Studies
To provide broader context for the analysis of fairway accessibility, selected European river estuaries with similar operational characteristics were reviewed.
In the case of the Sulina Channel in the Danube Delta, which connects Romanian inland ports (e.g., Galați, Brăila) with the Black Sea, access is limited by fluctuating water levels, sedimentation, and river discharge dynamics [
39]. As in the Świnoujście–Szczecin fairway, permissible draught varies depending on hydrological conditions, and under-keel clearance must be reassessed regularly. Similar modernization efforts, including dredging and navigation system updates, have been undertaken to improve access [
40].
Another example is the Ems estuary (Germany–Netherlands), where navigational constraints are mainly driven by tidal variability and sediment accumulation [
41]. In this system, extensive sediment management strategies, including tidal pumping and dredging, have been implemented to maintain access for large vessels.
Despite differing in scale and hydrodynamics, all these estuarine systems face common challenges in ensuring reliable navigation for deep-draught vessels. The comparison confirms that managing UKC, forecasting water level variations, and optimizing vessel traffic remain crucial for safety and efficiency in inland–coastal shipping corridors.


