
Backward Locomotion as a Novel Strategy for Enhancing Obesity Management

 , , ,
, , ,
Abstract
Featured Application
Abstract
1. Introduction
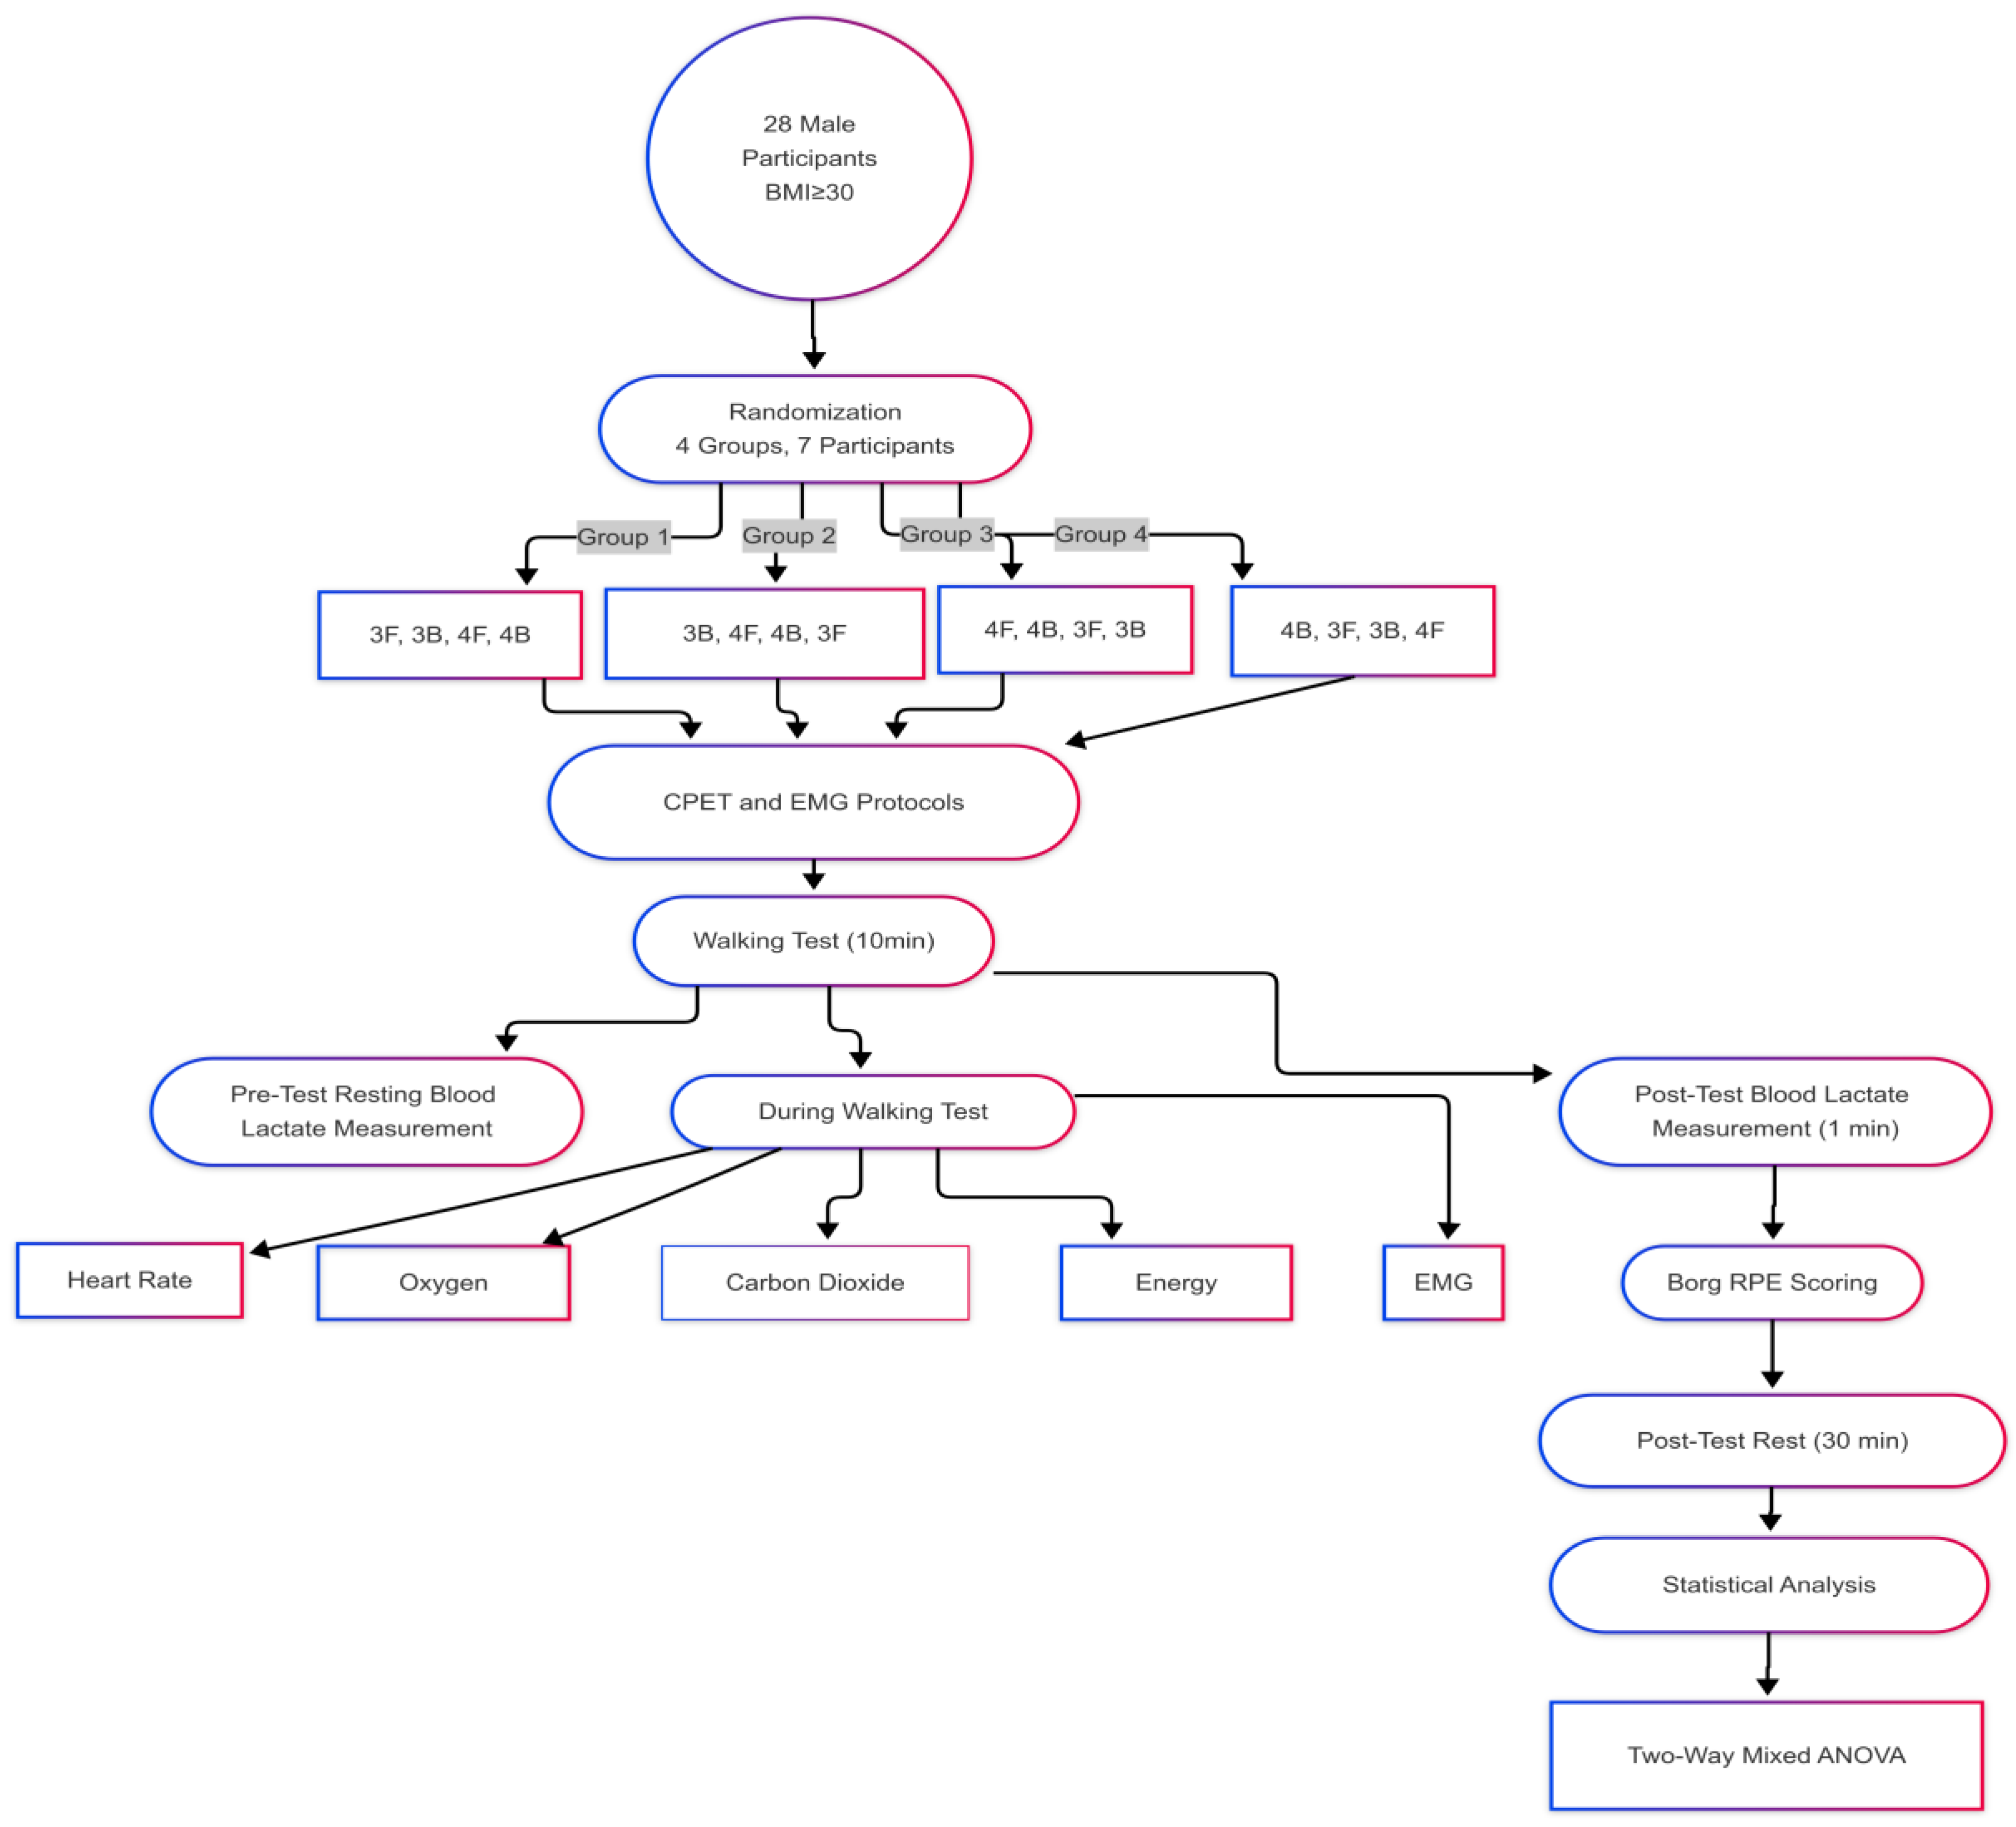
2. Materials and Methods
2.1. Study Design
2.2. Determination of Sample Size
- −
- Participants should not have any health problems that prevent them from exercising, and should not have an addiction to substances such as cigarettes, alcohol, or drugs;
- −
- A body mass index of at least 30;
- −
- A waist circumference of at least 94 cm.
2.3. Measurements
2.3.1. Height Measurement
2.3.2. Body Composition Measurement
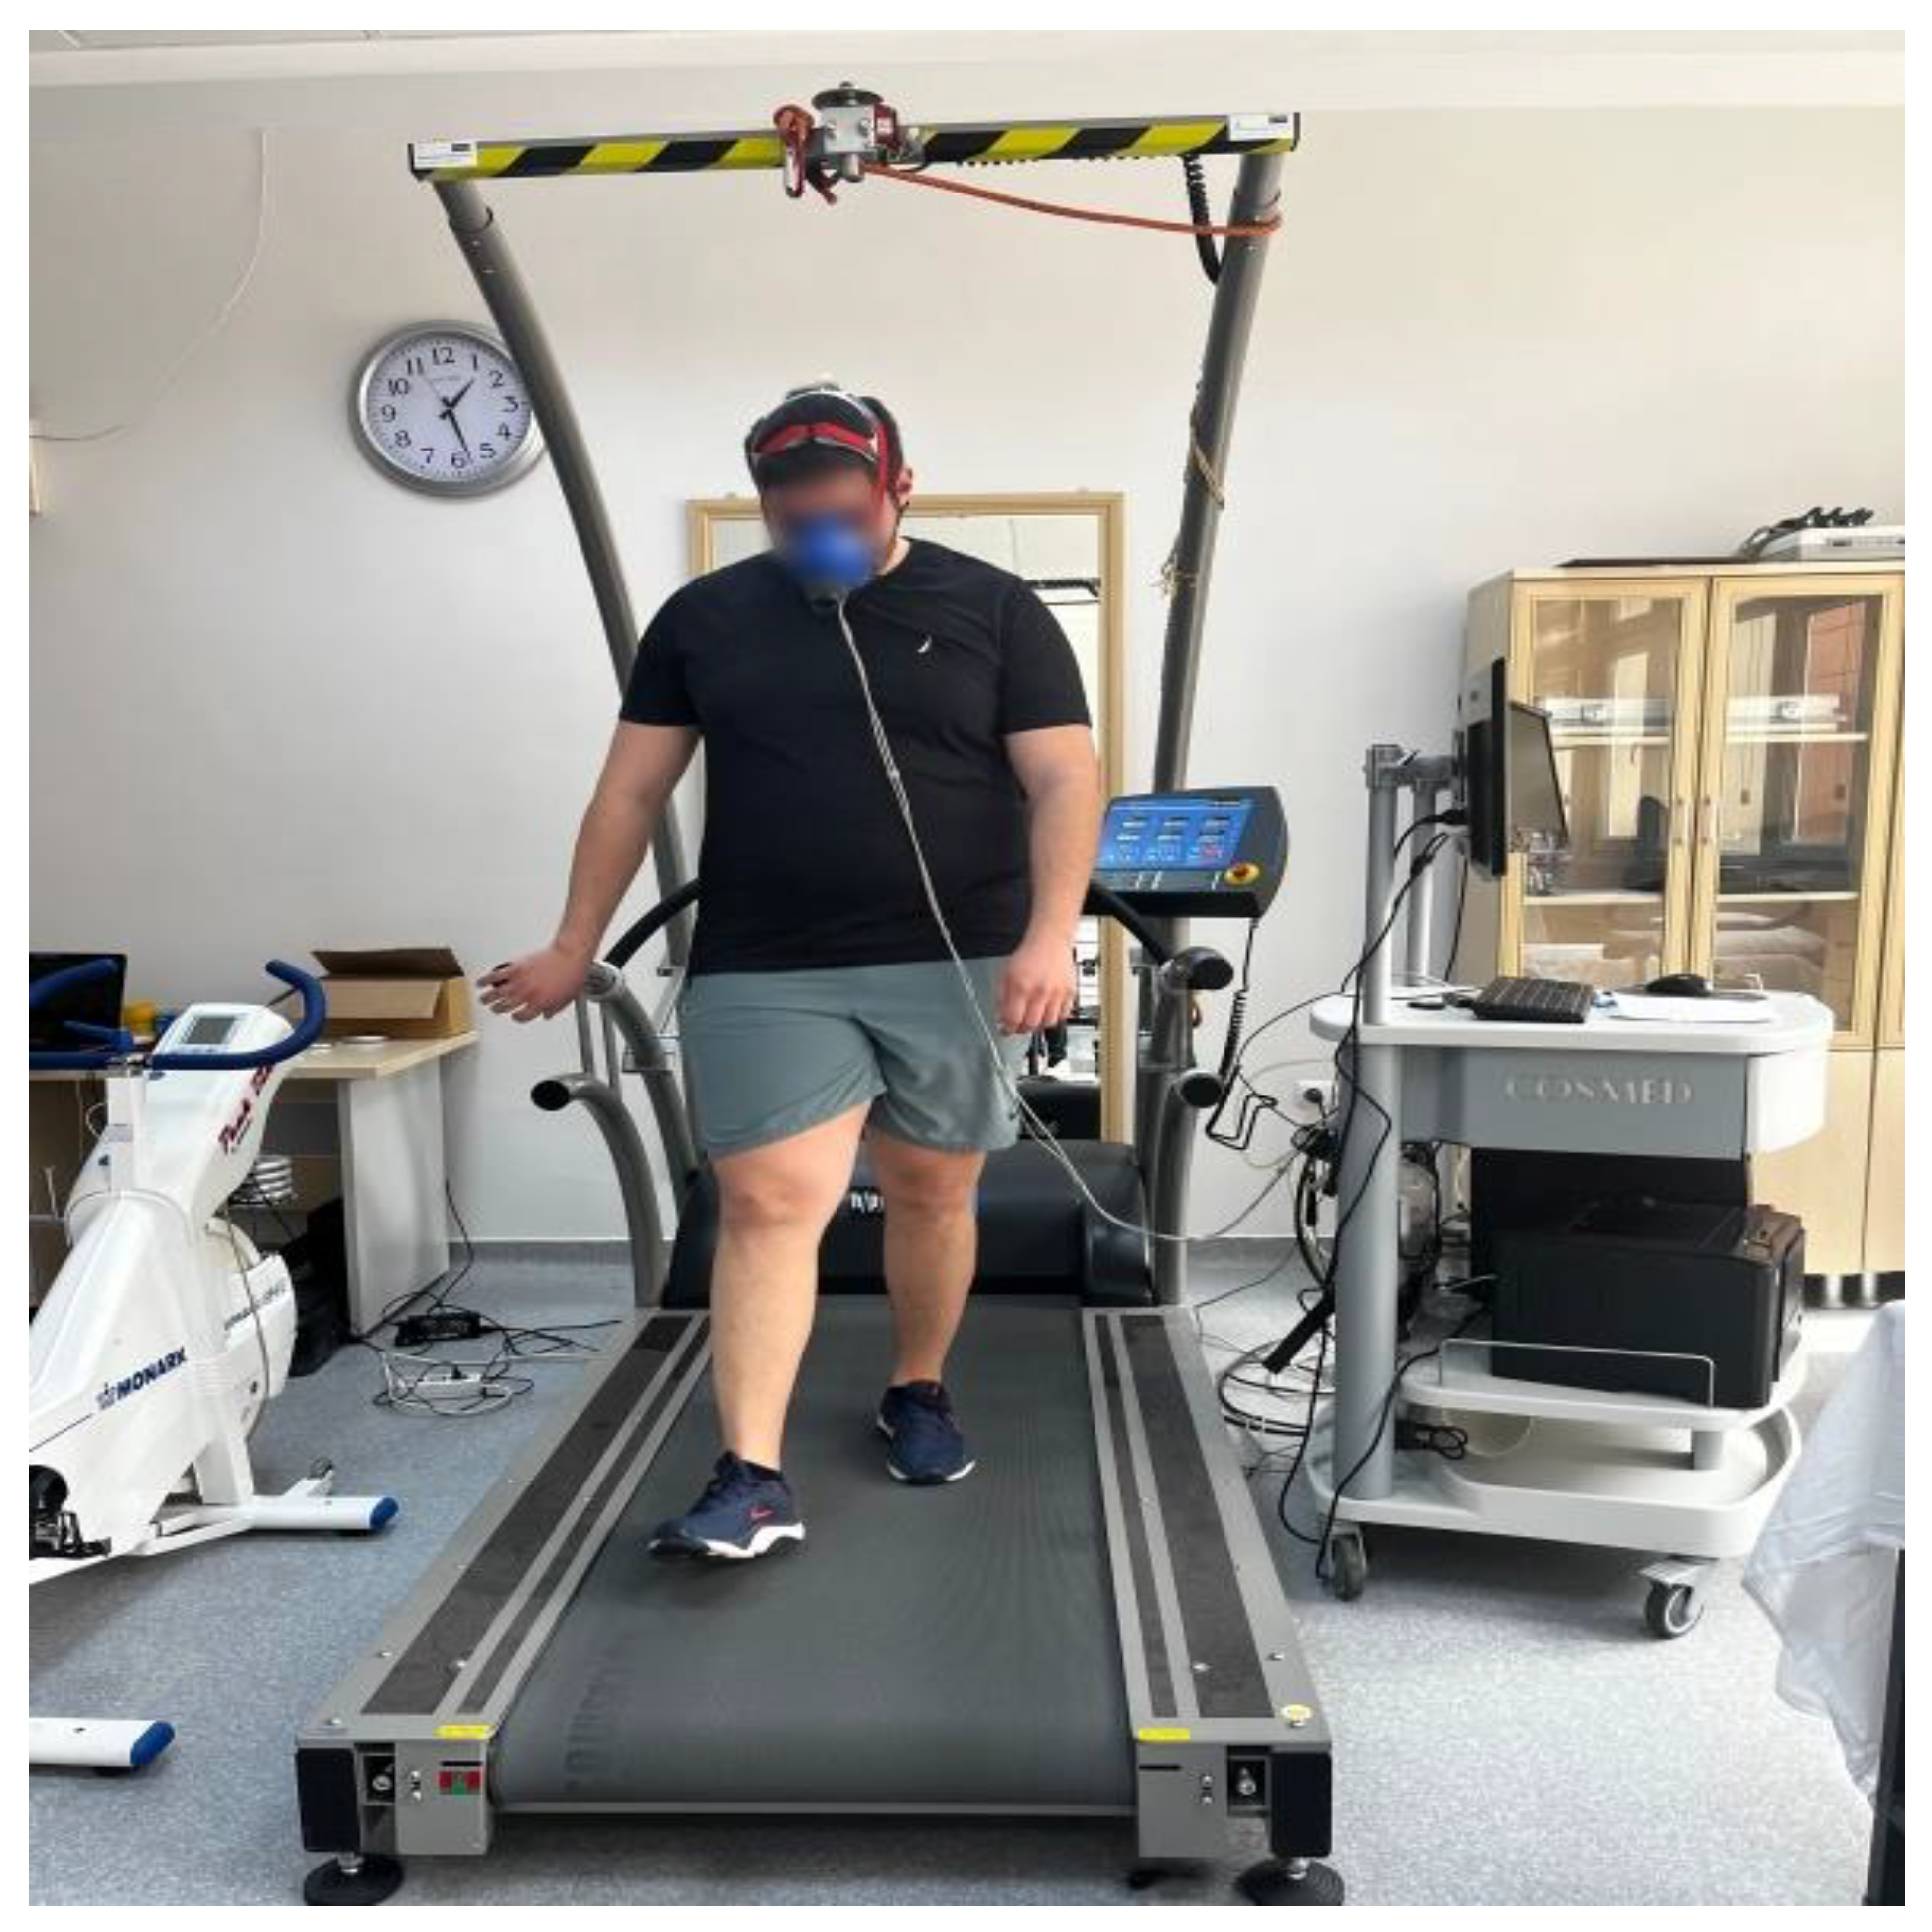
2.3.3. Cardiopulmonary Exercise Test
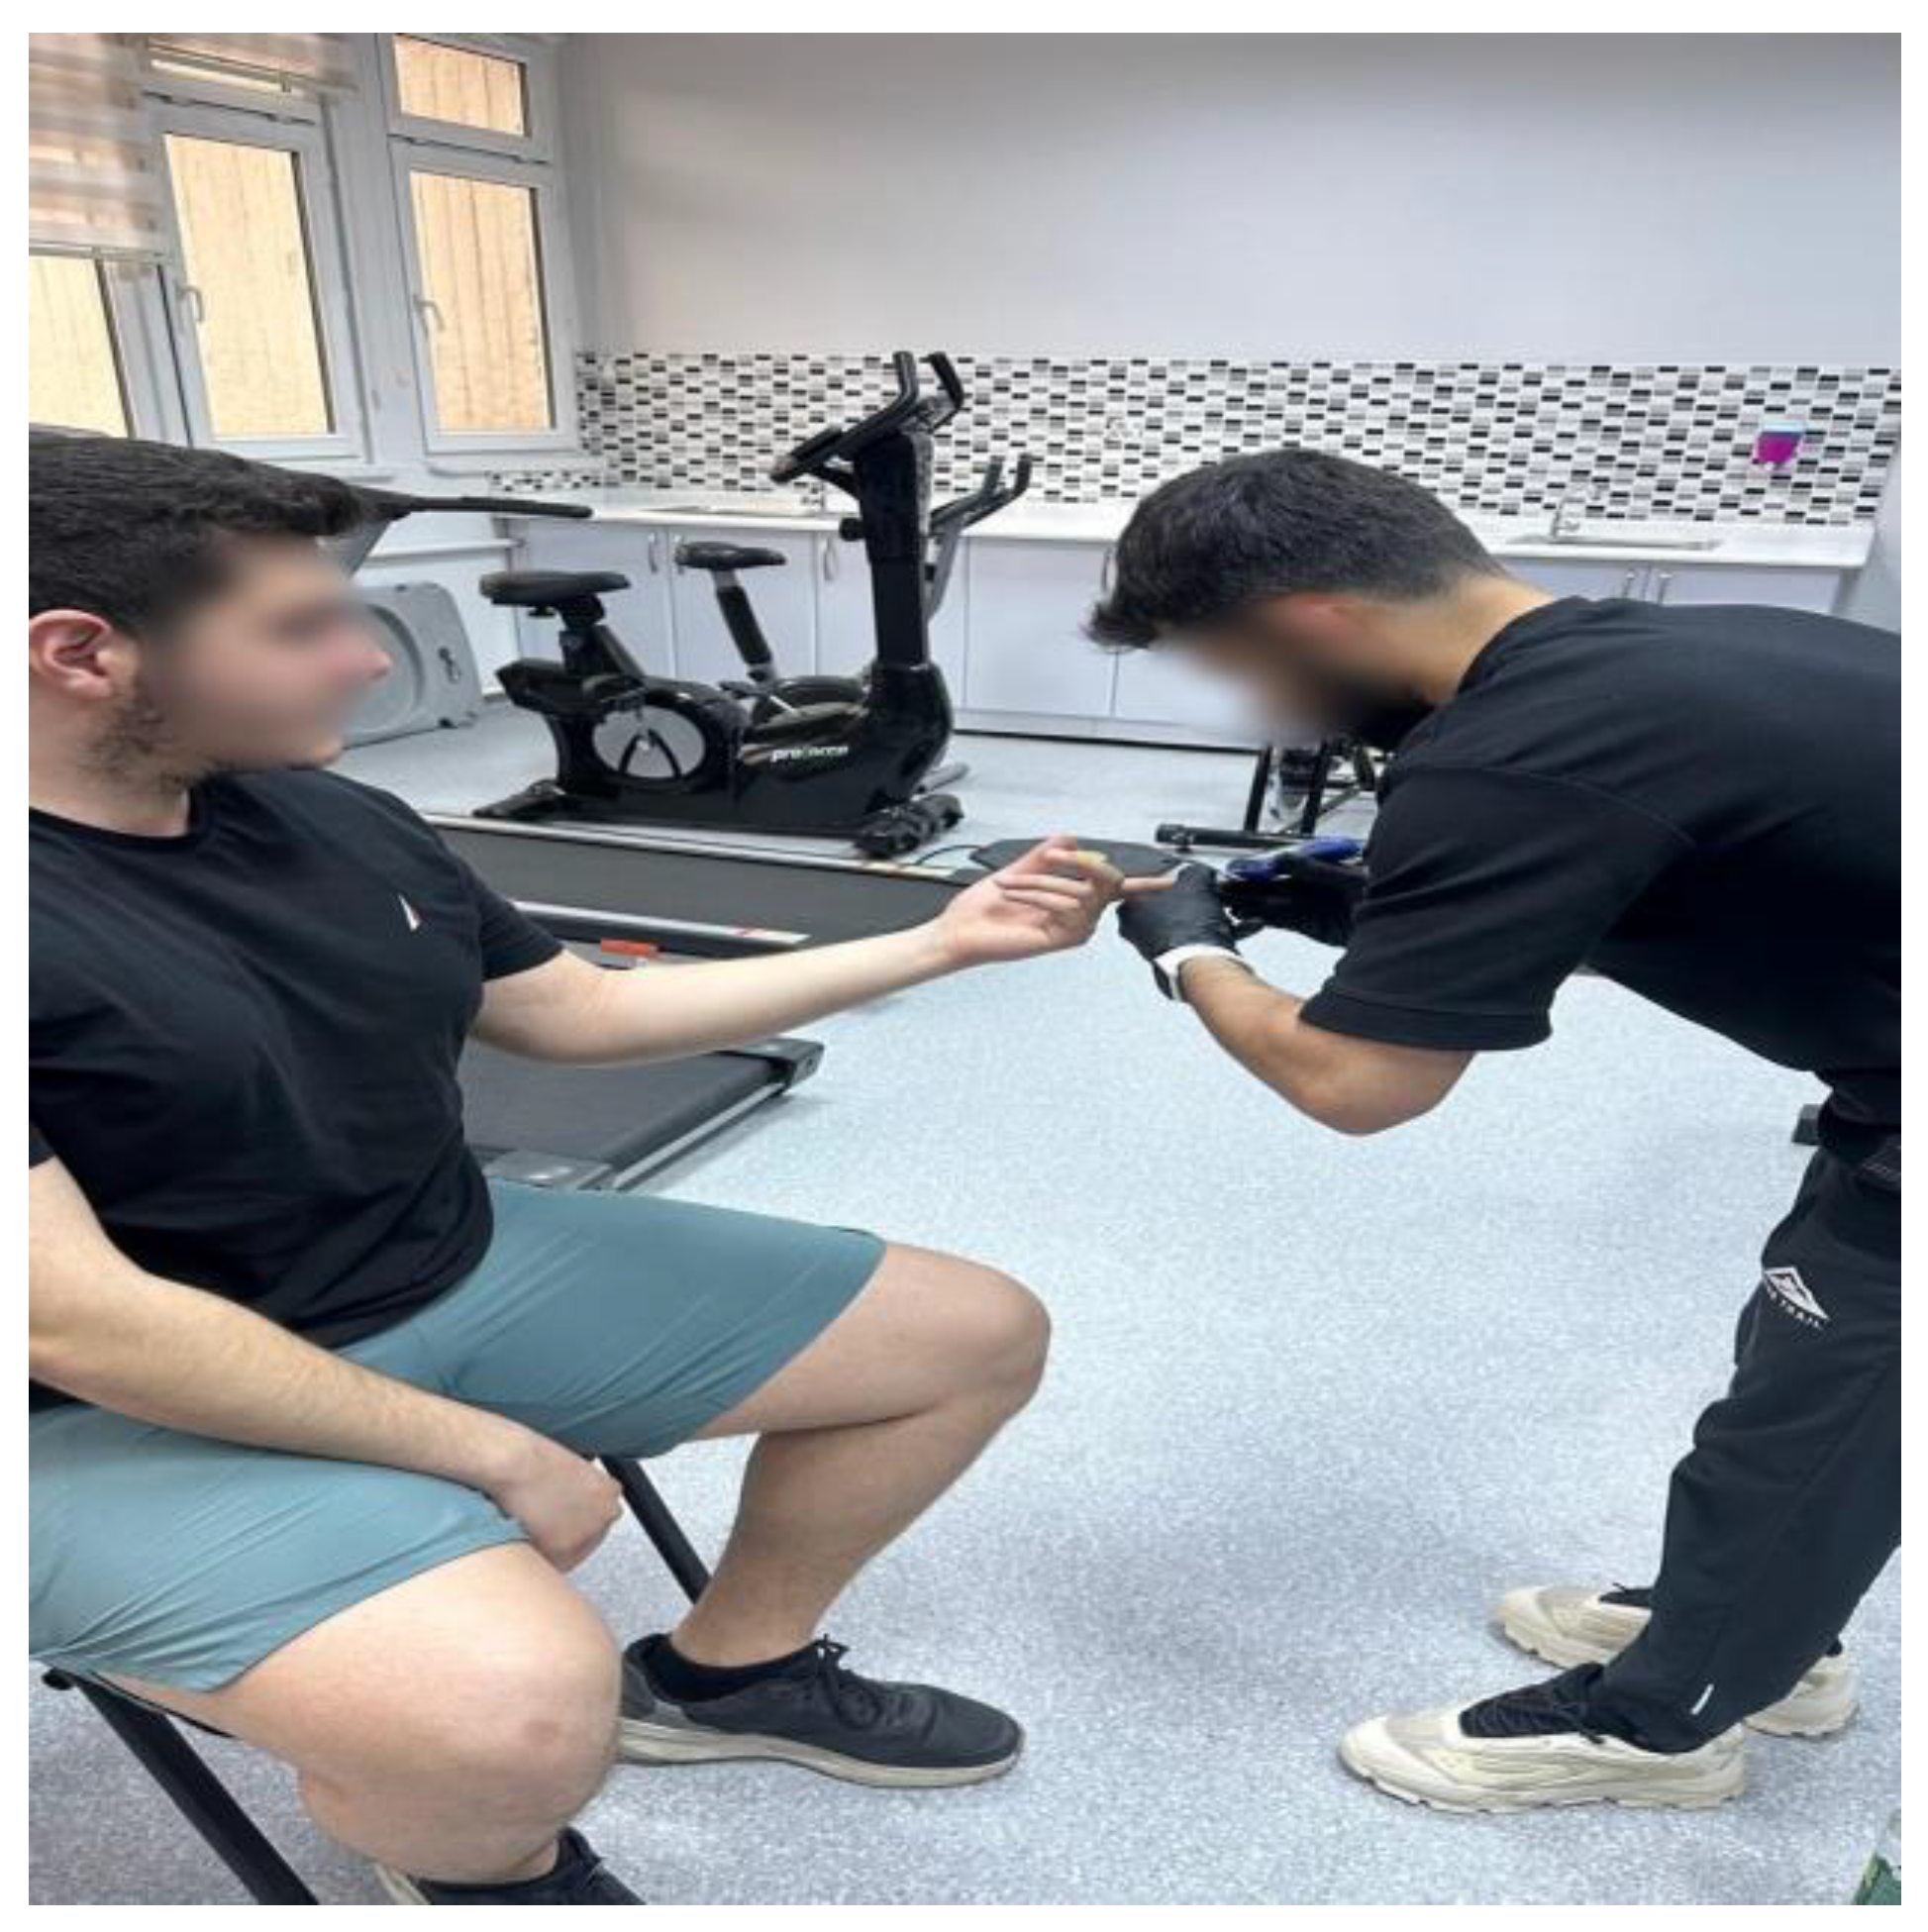
2.3.4. Blood Lactate Measurement
2.3.5. Perceived Exertion Rating
2.3.6. Anthropometric Measurement
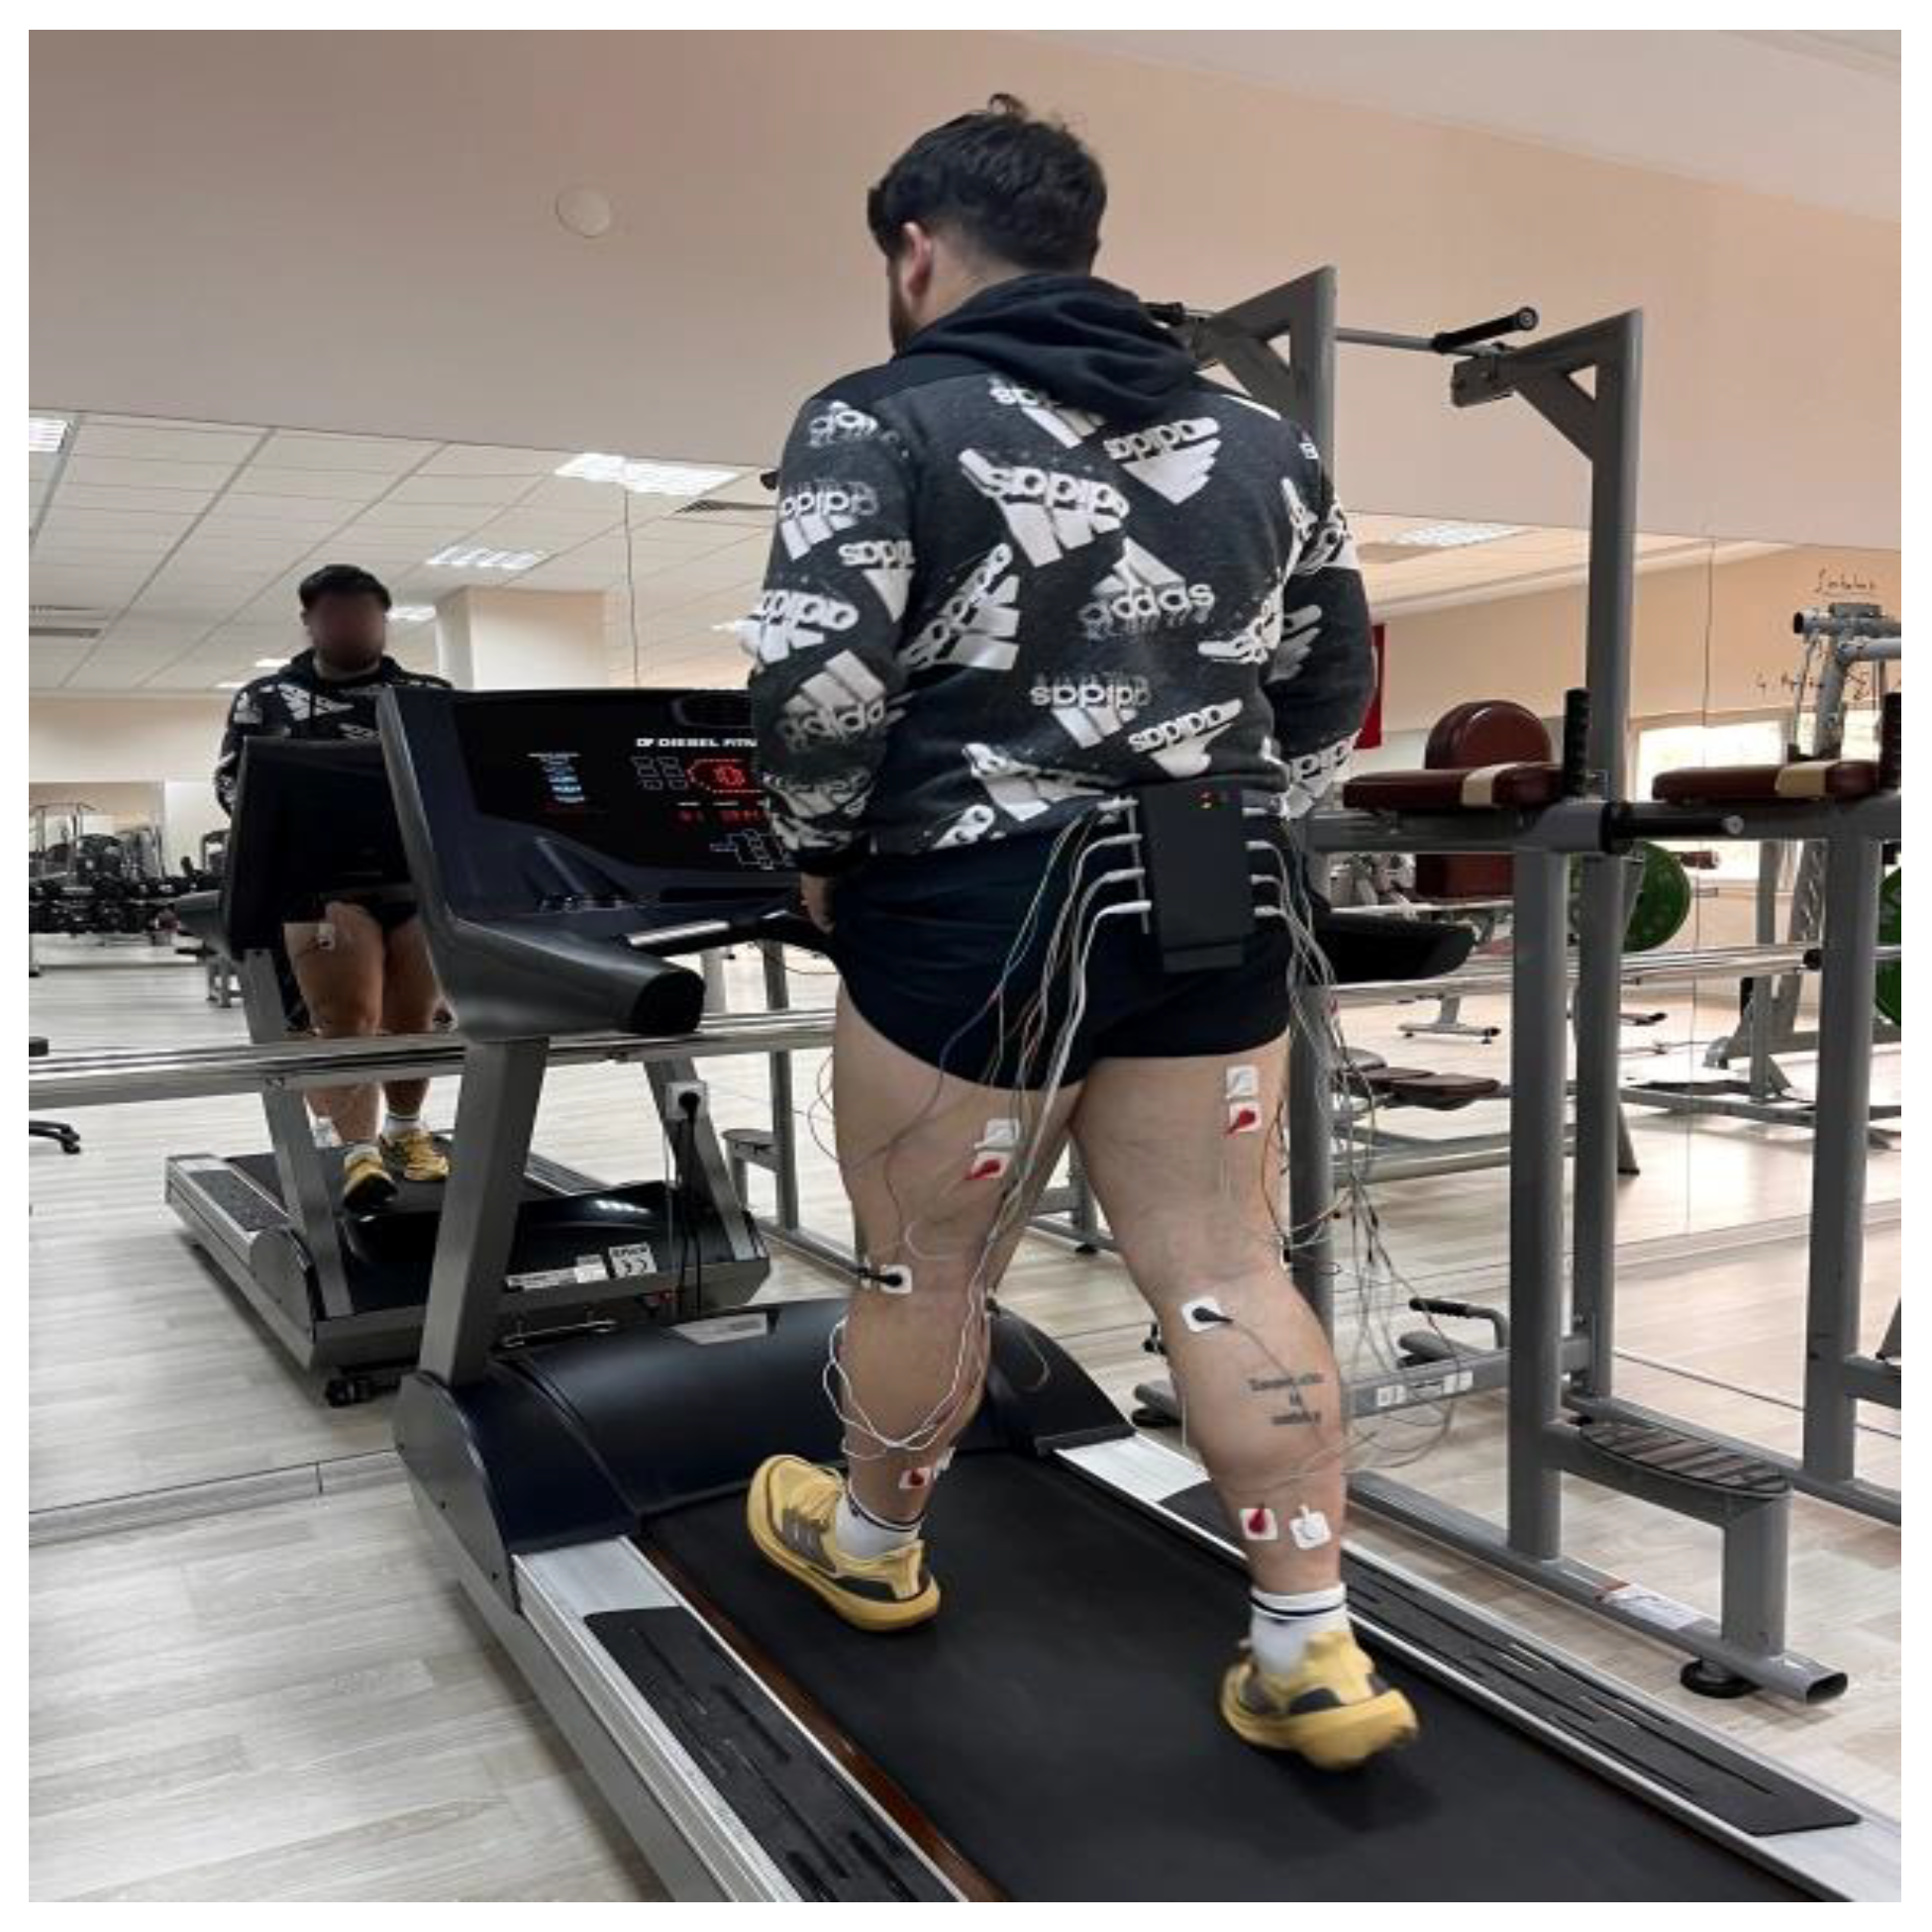
2.3.7. Surface Electromyography Measurement
2.3.8. Par-Q Questionnaire
2.3.9. Statistical Analysis
3. Results
4. Discussion
5. Conclusions
Author Contributions
Funding
Institutional Review Board Statement
Informed Consent Statement
Data Availability Statement
Acknowledgments
Conflicts of Interest
References
- Panuganti, K.K.; Nguyen, M.; Kshirsagar, R.K. Obesity. In StatPearls; StatPearls Publishing: Treasure Island, FL, USA, 2023. Available online: https://www.ncbi.nlm.nih.gov/books/NBK459357/ (accessed on 20 April 2025).
- World Health Organization. WHO European Regional Obesity Report; WHO Regional Office for Europe: Copenhagen, Denmark, 2022; Available online: https://apps.who.int/iris/bitstream/handle/10665/353747/9789289057738-eng.pdf (accessed on 22 April 2025).
- Türkiye Cumhuriyeti Sağlık Bakanlığı. Yetişkin ve Çocukluk Çağı Obezitesinin Önlenmesi ve Fiziksel Aktivite Eylem Planı 2019–2023; T.C. Sağlık Bakanlığı: Ankara, Turkey, 2019. Available online: https://hsgm.saglik.gov.tr/depo/birimler/saglikli-beslenme-ve-hareketli-hayat-db/Dokumanlar/Programlar/Eylem_Plani_.pdf (accessed on 6 April 2025).
- Sandalcı, U.; Tuncer, G. Obezite vergisinin kabul edilebilirliğini belirleyen faktörlerin analizine yönelik bir uygulama. Manas Sos. Araştırmalar Derg. 2019, 8, 2594–2634. [Google Scholar] [CrossRef]
- Akkurt, S. Obezite ve egzersiz tedavisi. Spor Hekimleri Derg. 2012, 47, 123–130. [Google Scholar]
- Uthoff, A.; Oliver, J.; Cronin, J.; Harrison, C.; Winwood, P. A new direction to athletic performance: Understanding the acute and longitudinal responses to backward running. Sports Med. 2018, 48, 1083–1096. [Google Scholar] [CrossRef] [PubMed]
- Mehdizadeh, S.; Arshi, A.R.; Davids, K. Quantifying coordination and coordination variability in backward versus forward running: Implications for control of motion. Gait Posture 2015, 42, 172–177. [Google Scholar] [CrossRef]
- Terblanche, E.; Page, C.; Kroff, J.; Venter, R.E. The effect of backward locomotion training on the body composition and cardiorespiratory fitness of young women. Int. J. Sports Med. 2005, 26, 214–219. [Google Scholar] [CrossRef]
- Soman, A.; Kallidukkil, M.N.; Scaria, B.; Alkhathami, K. Effectiveness of retro walking and forward locomotion treadmill training on abdominal adiposity in untrained young adults: A quasi-experimental study. J. Clin. Diagn. Res. 2021, 15, YC07–YC10. [Google Scholar]
- Faul, F.; Erdfelder, E.; Lang, A.-G.; Buchner, A. G*Power 3: A flexible statistical power analysis program for the social, behavioral, and biomedical sciences. Behav. Res. Methods 2007, 39, 175–191. [Google Scholar] [CrossRef]
- World Medical Association. World Medical Association Declaration of Helsinki: Ethical principles for medical research involving human subjects. J. Am. Med. Assoc. 2013, 310, 2191–2194. [Google Scholar] [CrossRef]
- Hislop, H.J.; Montgomery, J. Daniels and Worthingham’s Muscle Testing: Techniques of Manual Examination, 8th ed.; W.B. Saunders: Philadelphia, PA, USA, 2007. [Google Scholar]
- Ulupınar, S.; İnce, İ. Spor bilimlerinde etki büyüklüğü ve alternatif istatistik yaklaşımları. Spormetre Beden Eğitimi ve Spor Bilimleri Dergisi 2021, 19, 1–17. [Google Scholar]
- Flynn, T.W.; Connery, S.M.; Smutok, M.A.; Zeballos, R.J.; Weisman, I.M. Comparison of cardiopulmonary responses to forward and backward locomotion and running. Med. Sci. Sports Exerc. 1994, 26, 89–94. [Google Scholar] [CrossRef]
- Wright, S.; Weyand, P.G. The application of ground force explains the energetic cost of running backward and forward. J. Exp. Biol. 2001, 204 Pt 10, 1805–1815. [Google Scholar] [CrossRef] [PubMed]
- Thomas, K.S.; Hammond, M.; Magal, M. Graded forward and backward locomotion at a matched intensity on cardiorespiratory responses and postural control. Gait Posture 2018, 65, 20–25. [Google Scholar] [CrossRef] [PubMed]
- Minetti, A.E. The biomechanics of skipping gaits: A third locomotion paradigm? Proc. R. Soc. B Biol. Sci. 2004, 271, 1229–1235. [Google Scholar] [CrossRef]
- Browning, R.C.; Kram, R. Energetic cost and preferred speed of walking in obese vs. normal weight women. Obes. Res. 2005, 13, 891–899. [Google Scholar] [CrossRef]
- Hooper, T.L.; Dunn, D.M.; Props, J.E.; Bruce, B.A.; Sawyer, S.F.; Daniel, J.A. The effects of graded forward and backward locomotion on heart rate and oxygen consumption. J. Orthop. Sports Phys. Ther. 2004, 34, 65–71. [Google Scholar] [CrossRef]
- Winter, D.A. Biomechanics and Motor Control of Human Movement, 4th ed.; Wiley: Hoboken, NJ, USA, 2009. [Google Scholar]
- Cavagna, G.A.; Legramandi, M.A.; Peyré-Tartaruga, L.A. The landing-takeoff asymmetry in human running. J. Exp. Biol. 2008, 211, 2011–2018. [Google Scholar] [CrossRef]
- Flynn, T.W.; Soutas-Little, R.W. Patellofemoral joint compressive forces in forward and backward running. J. Orthop. Sports Phys. Ther. 1995, 21, 277–282. [Google Scholar] [CrossRef]
- DeVita, P.; Stribling, J. Lower extremity joint Kinetics and energetics during backward running. Med. Sci. Sports Exerc. 1991, 23, 602–610. [Google Scholar] [CrossRef]
- Masumoto, K.; Hamada, A.; Tomonaga, H.O.; Kodama, K.; Amamoto, Y.; Nishizaki, Y.; Hotta, N. Physiological and perceptual responses to backward and forward treadmill walking in water. Gait Posture 2009, 29, 199–203. [Google Scholar] [CrossRef]
- Brooks, G.A. The science and translation of lactate shuttle theory. Cell Metab. 2018, 27, 757–785. [Google Scholar] [CrossRef]
- Rasica, L.; Porcelli, S.; Minetti, A.E.; Pavei, G. Biomechanical and metabolic aspects of backward (and forward) running on uphill gradients: Another clue towards an almost inelastic rebound. Eur. J. Appl. Physiol. 2020, 120, 2507–2515. [Google Scholar] [CrossRef] [PubMed]
- Sylvester, B.D.; Standage, M.; Ark, T.K.; Sweet, S.N.; Crocker, P.R.E.; Zumbo, B.D.; Beauchamp, M.R. Is variety a spice of (an active) life? Perceived variety and exercise behavior. J. Sport Exerc. Psychol. 2018, 40, 243–251. [Google Scholar]
- Sterzing, T.; Frommhold, C.; Rosenbaum, D. In-shoe plantar pressure distribution and lower extremity muscle activity patterns of backward compared to forward running on a treadmill. Gait Posture 2016, 46, 135–141. [Google Scholar] [CrossRef] [PubMed]


| Age (y) | Height (kg) | Weight (cm) | BMI | Waist (cm) |
|---|---|---|---|---|
| 21.93 ± 2.31 | 100.35 ± 8.64 | 176.54 ± 4.87 | 31.88 ± 1.16 | 105.00 ± 6.13 |
| Direction | Speed | Direction * Speed | |||||||||||
|---|---|---|---|---|---|---|---|---|---|---|---|---|---|
| Parameters | 3 km/h Forward | 3 km/h Backward | 4 km/h Forward | 4 km/h Backward | F | p | ηp2 | F | p | ηp2 | F | p | ηp2 |
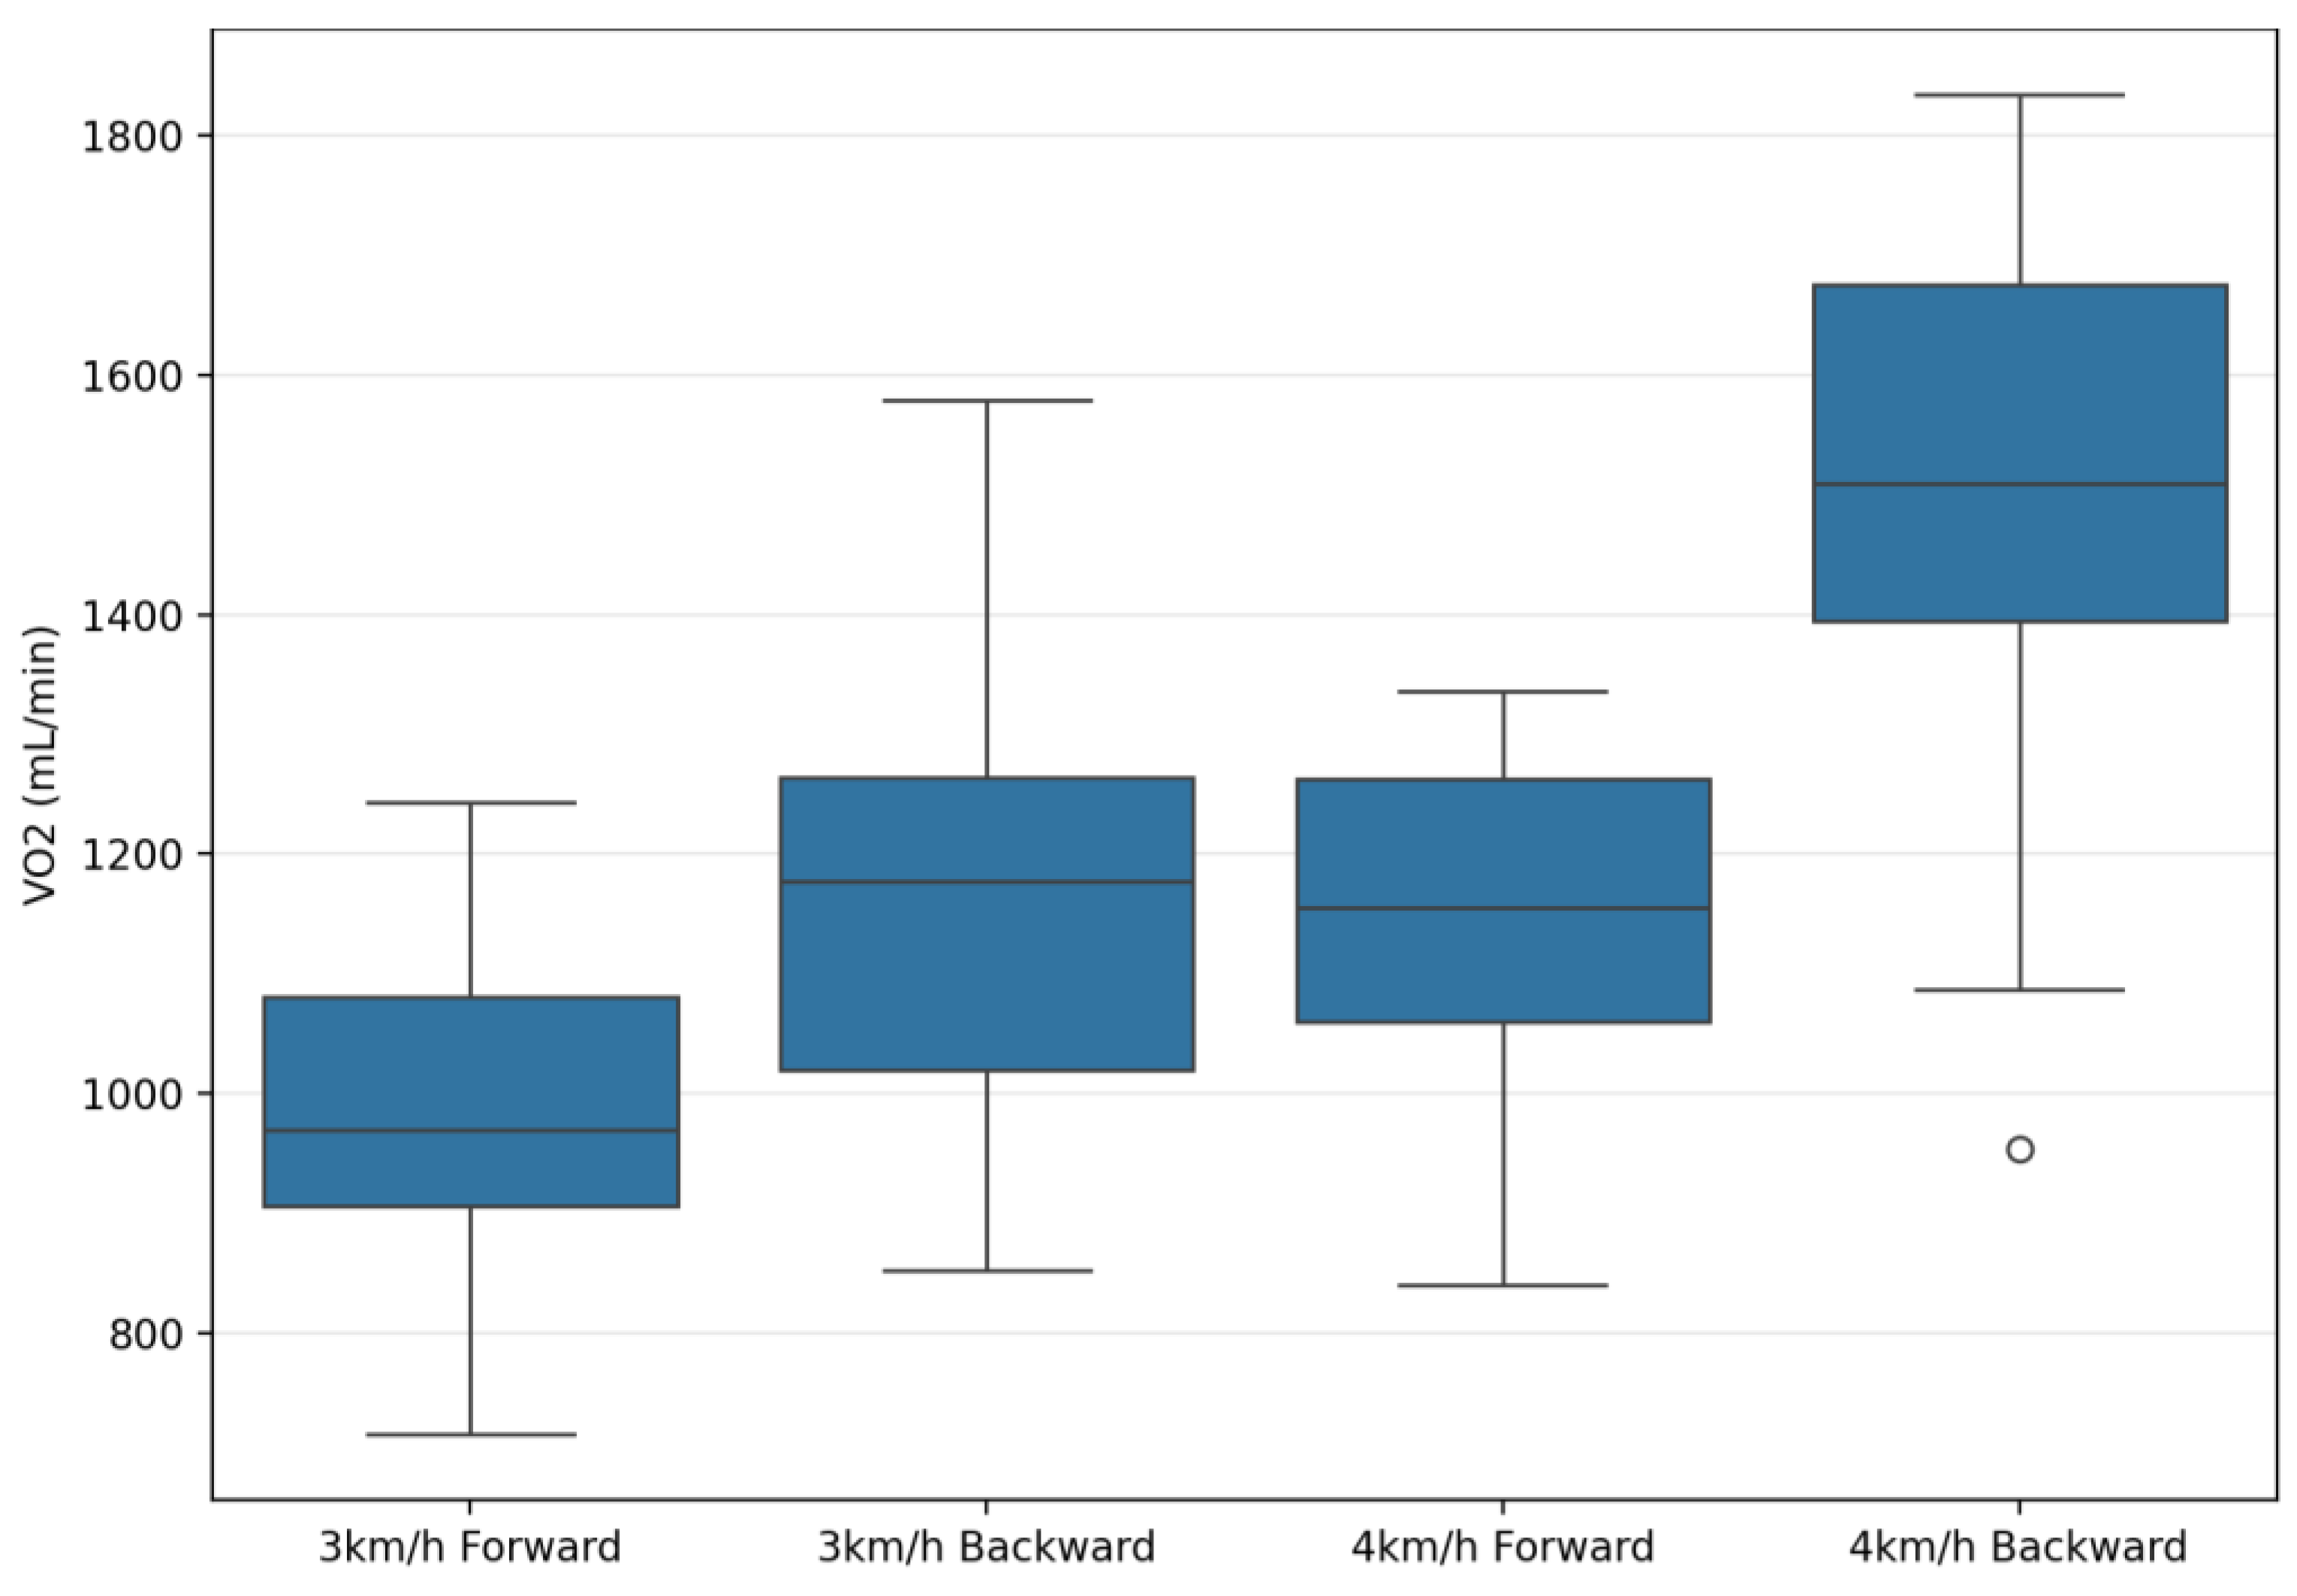
| VO2 (mL/min) | 1004.56 ± 150.85 | 1226.53 ± 190.76 | 1150.04 ± 175.52 | 1504.74 ± 210.48 | 398.4 | 0.001 ** | 0.94 | 120.74 | 0.001 ** | 0.82 | 49.62 | 0.001 ** | 0.65 |
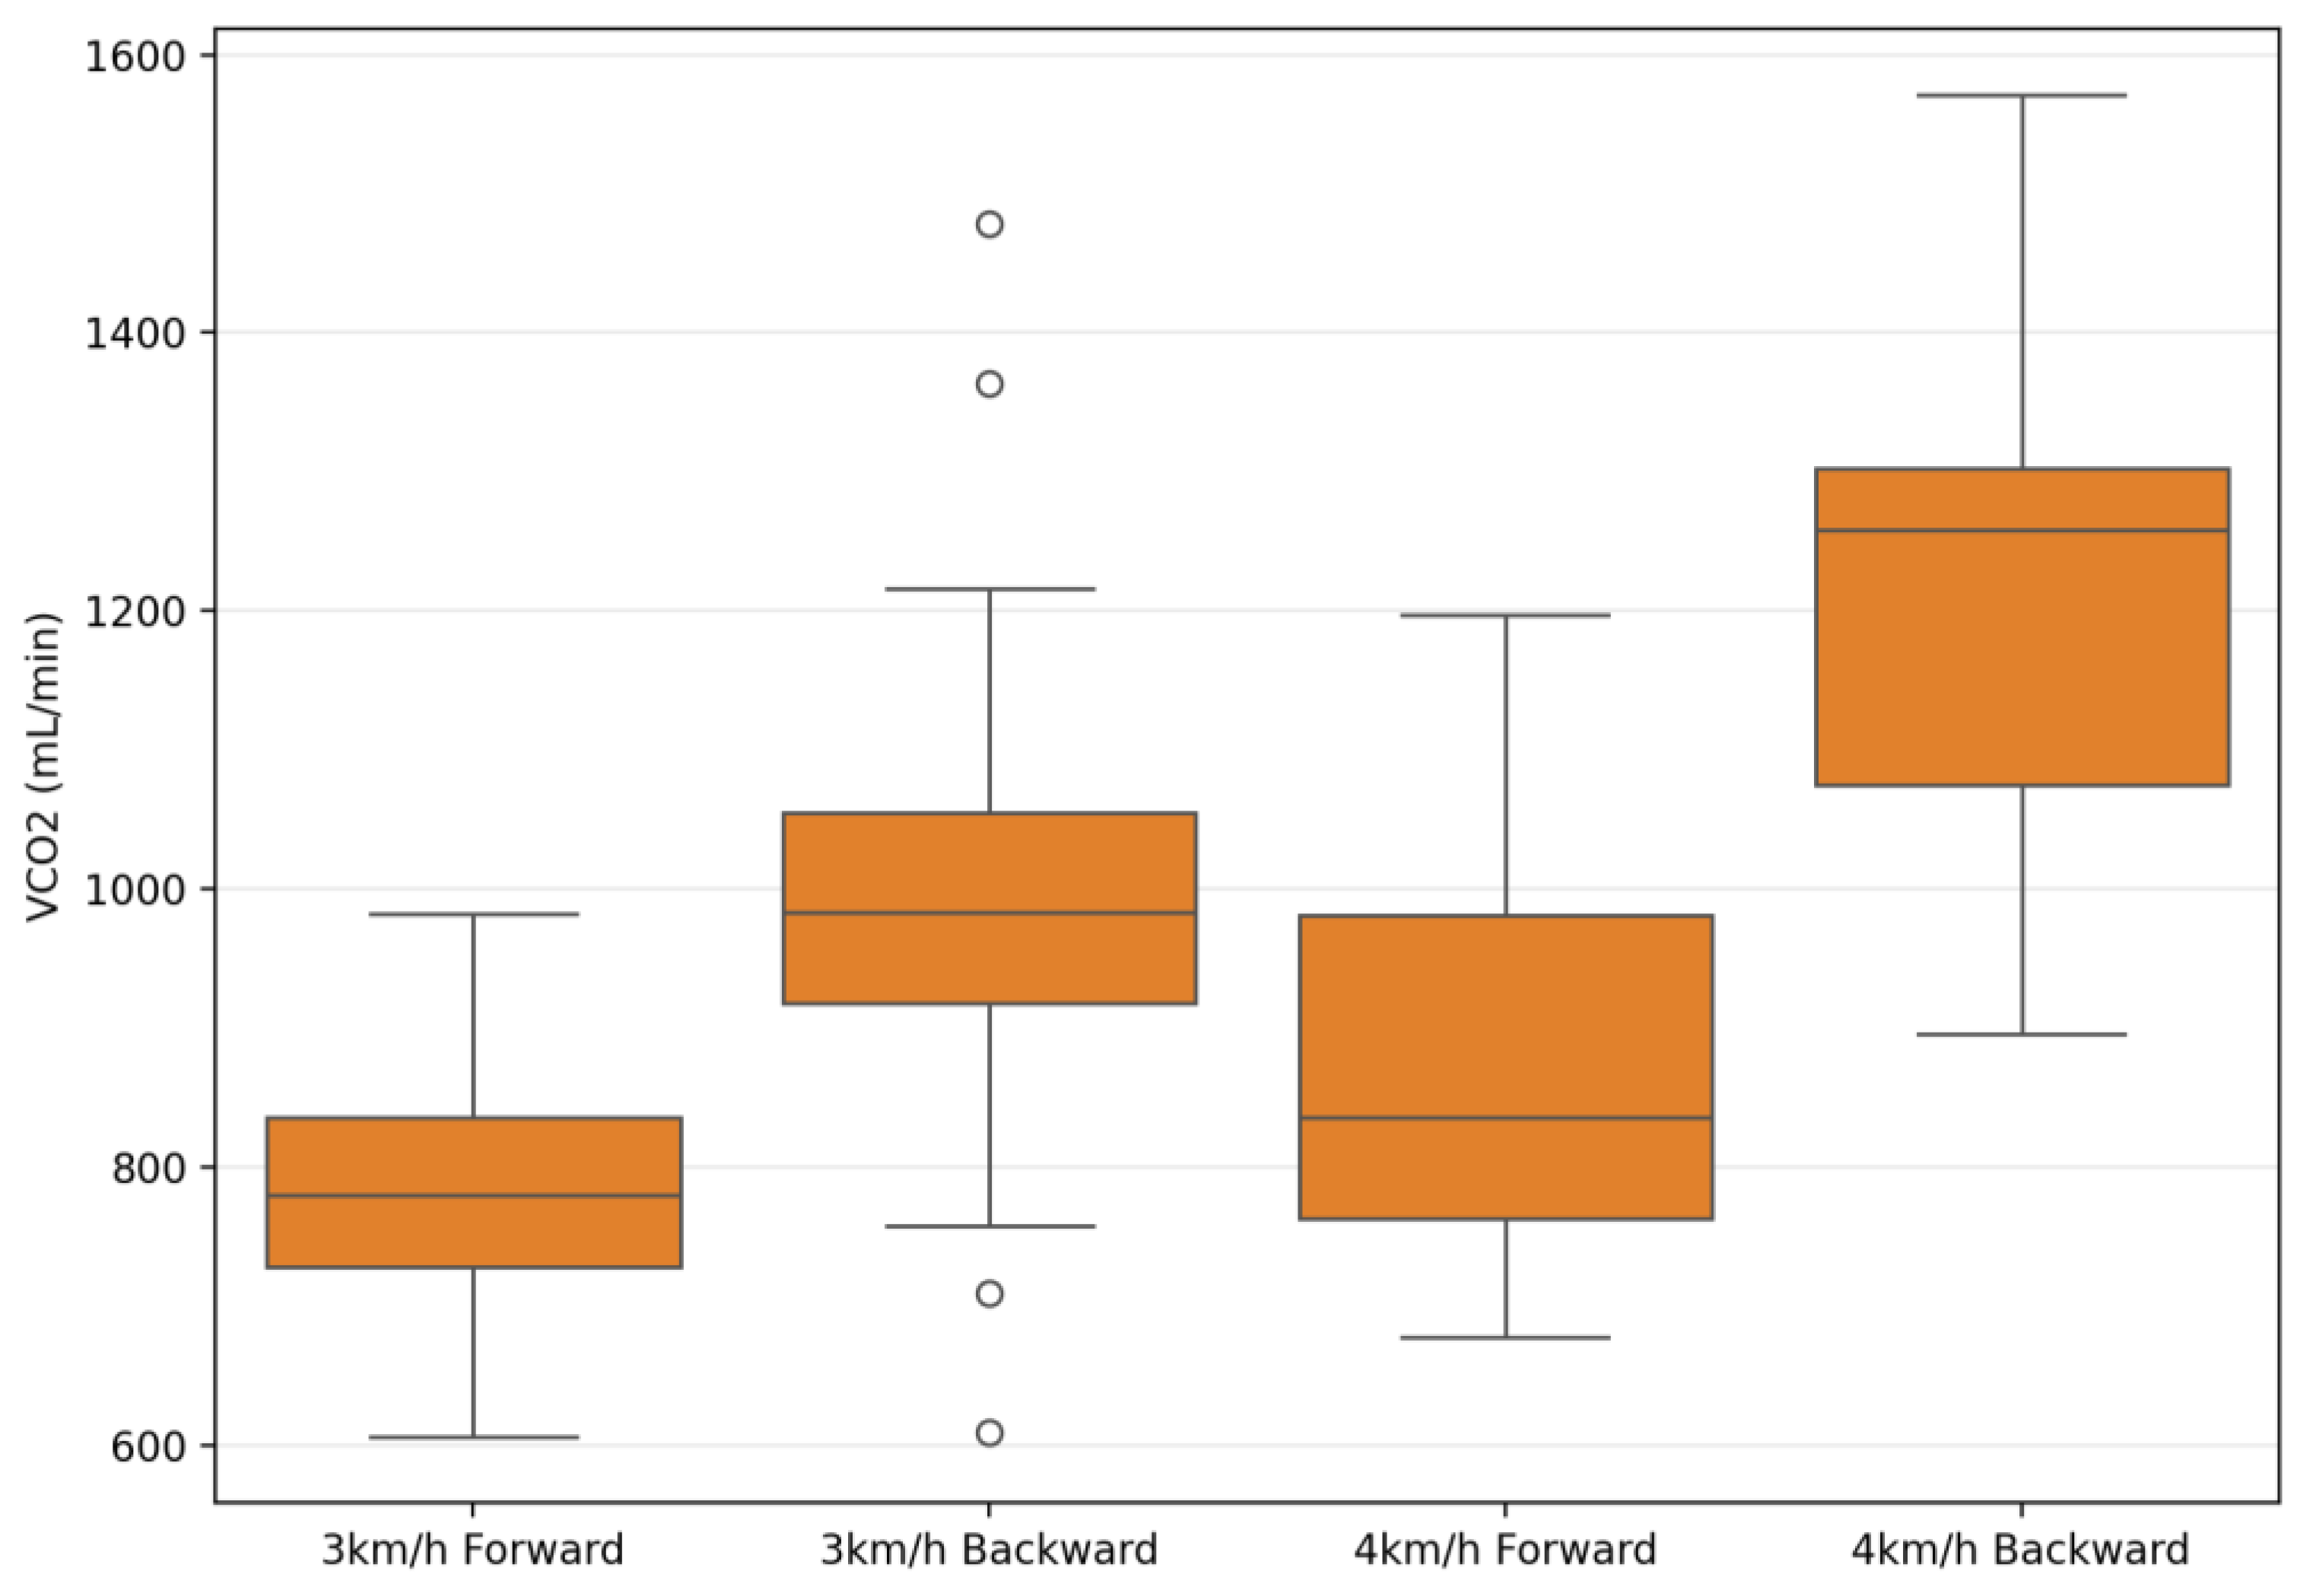
| VCO2 (mL/min) | 793.09 ± 127.7 | 989.57 ± 198.48 | 893.02 ± 138.71 | 1208.27 ± 194.2 | 243.02 | 0.001 ** | 0.90 | 82.48 | 0.001 ** | 0.75 | 22.56 | 0.001 ** | 0.45 |
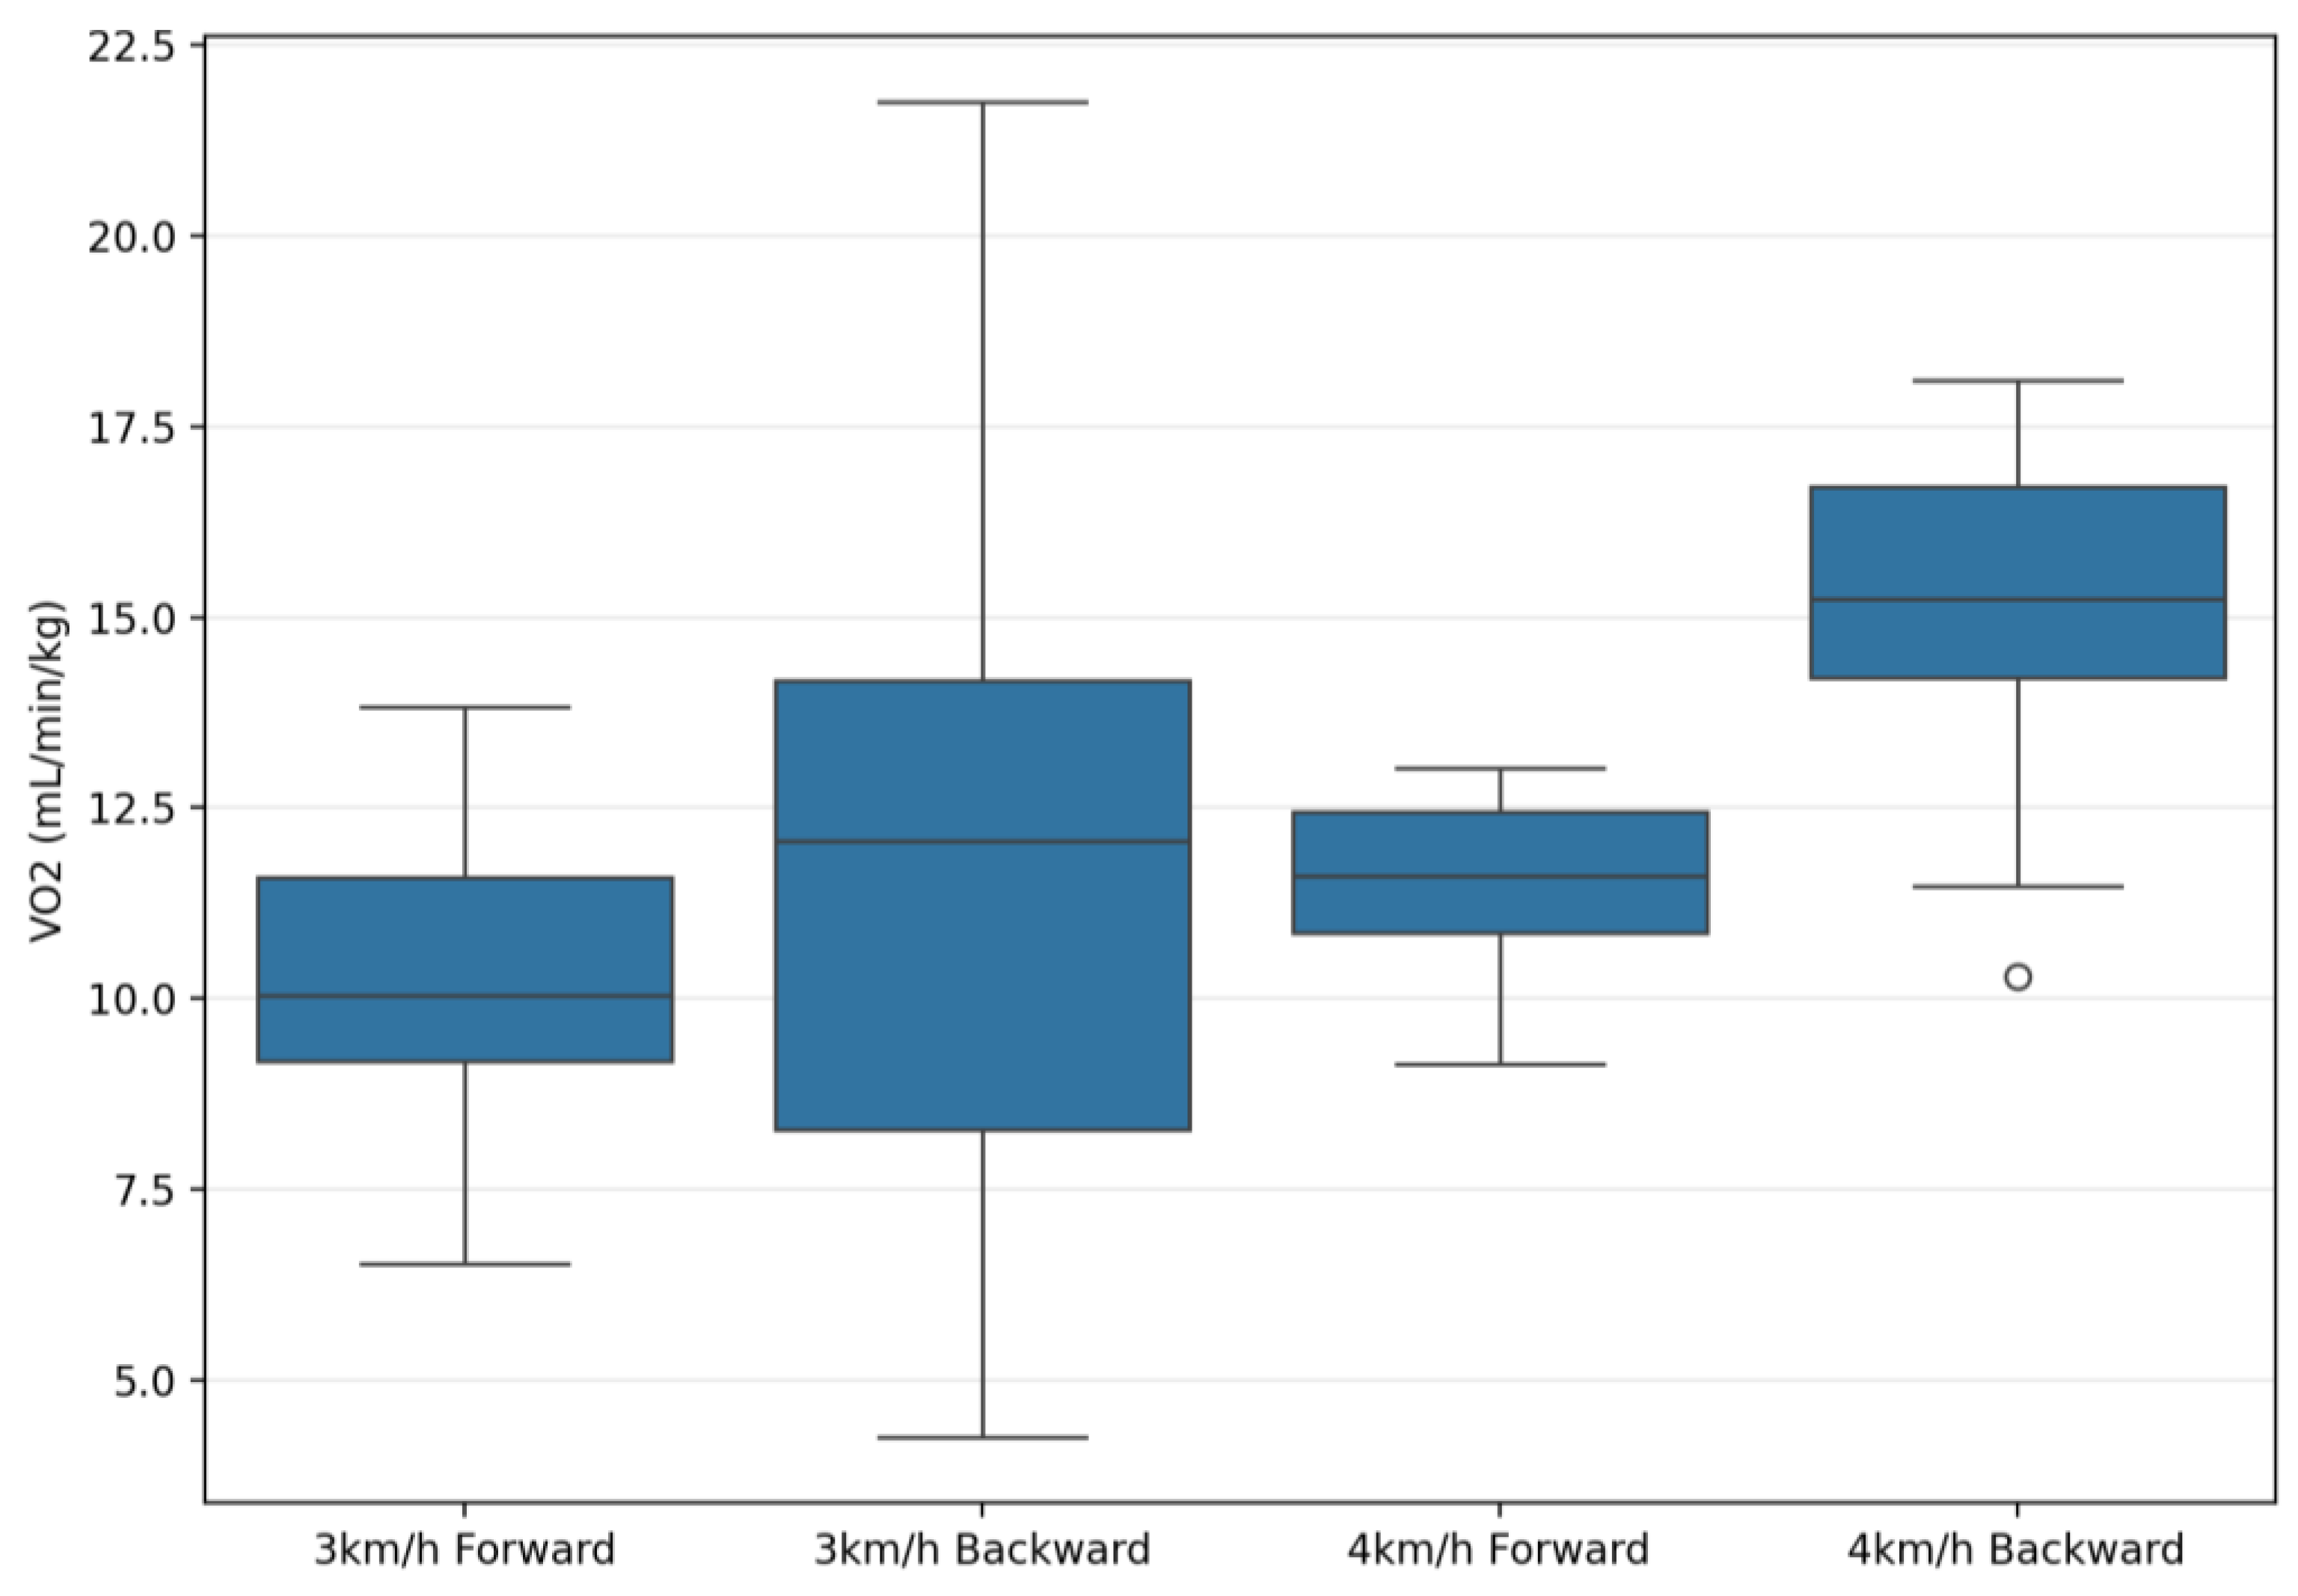
| VO2 (mL/min/kg) | 10.53 ± 2.09 | 13.25 ± 4.59 | 11.57 ± 1.38 | 15.19 ± 1.87 | 50.99 | 0.001 ** | 0.65 | 8.74 | 0.006 ** | 0.24 | 1.00 | 0.32 | 0.03 |
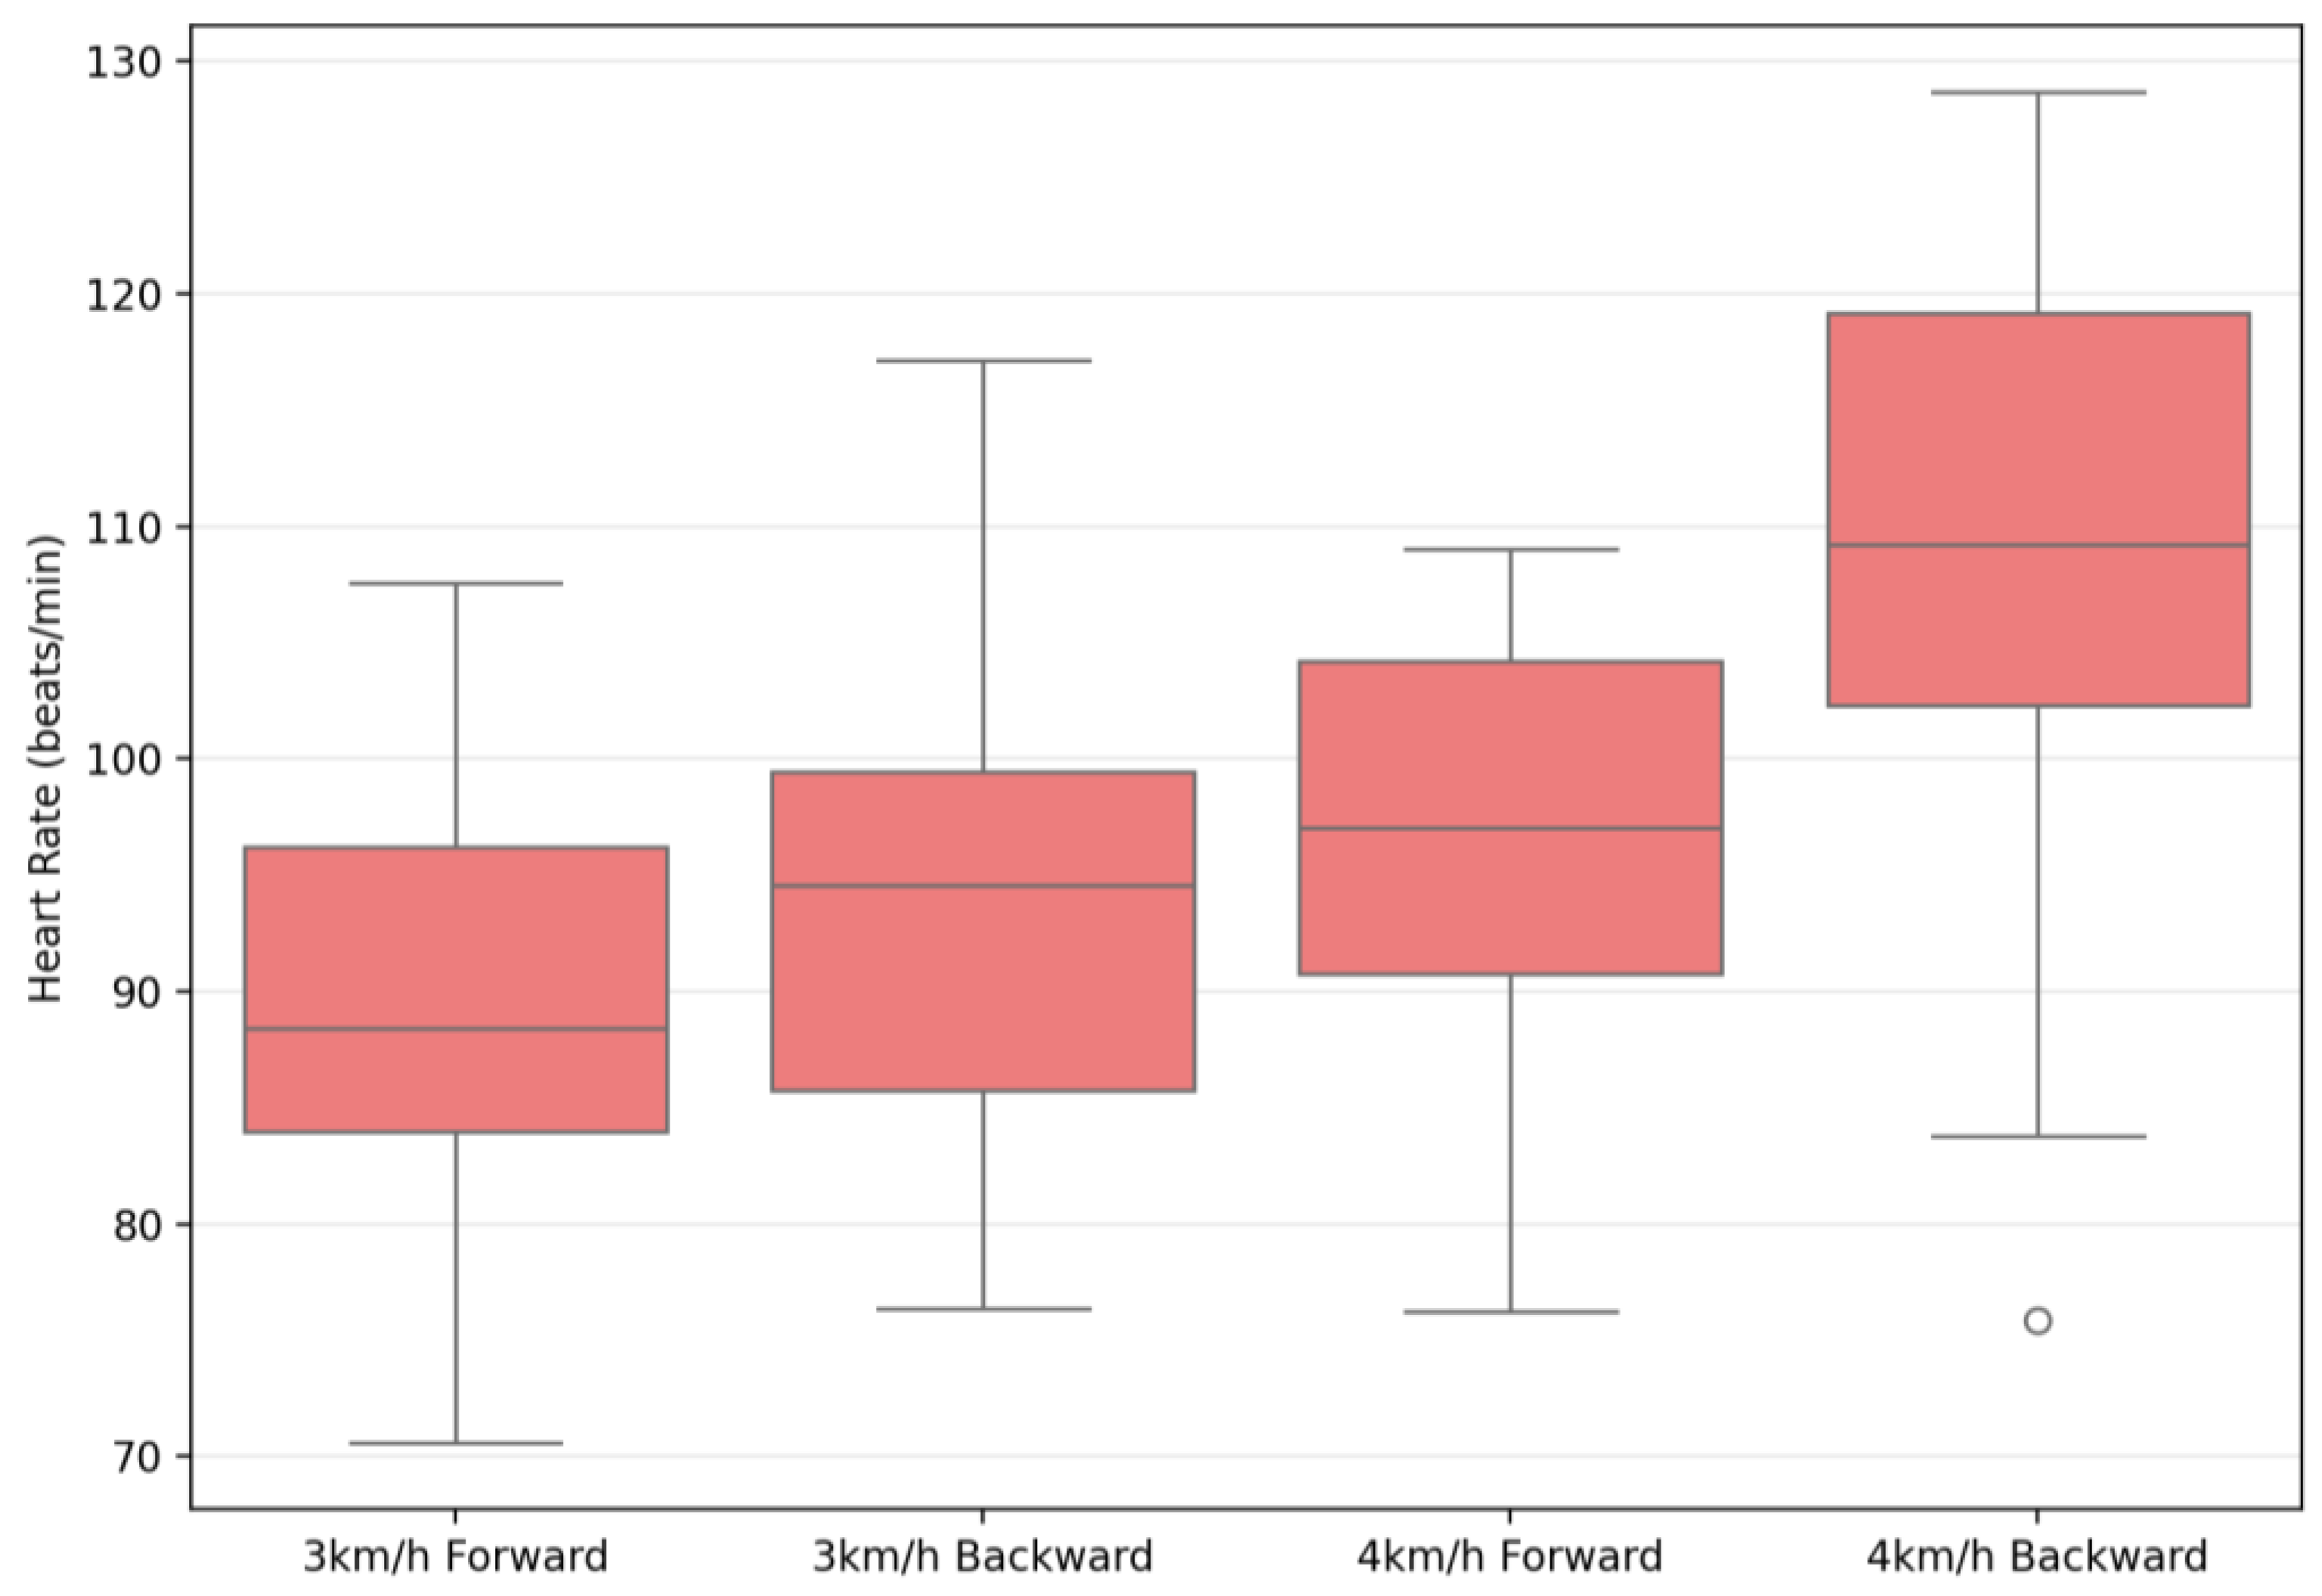
| Heart Rate (beats/min) | 90.86 ± 10.59 | 97.33 ± 10.71 | 96.74 ± 11.65 | 108.91 ± 12.63 | 181.79 | 0.001 ** | 0.87 | 50.41 | 0.001 ** | 0.65 | 16.22 | 0.001 ** | 0.37 |
| Energy Expenditure (kcal/min) | 4.71 ± 0.66 | 5.86 ± 0.91 | 5.51 ± 0.9 | 7.17 ± 1.03 | 331.07 | 0.001 ** | 0.92 | 141.74 | 0.001 ** | 0.84 | 23.05 | 0.001 ** | 0.46 |
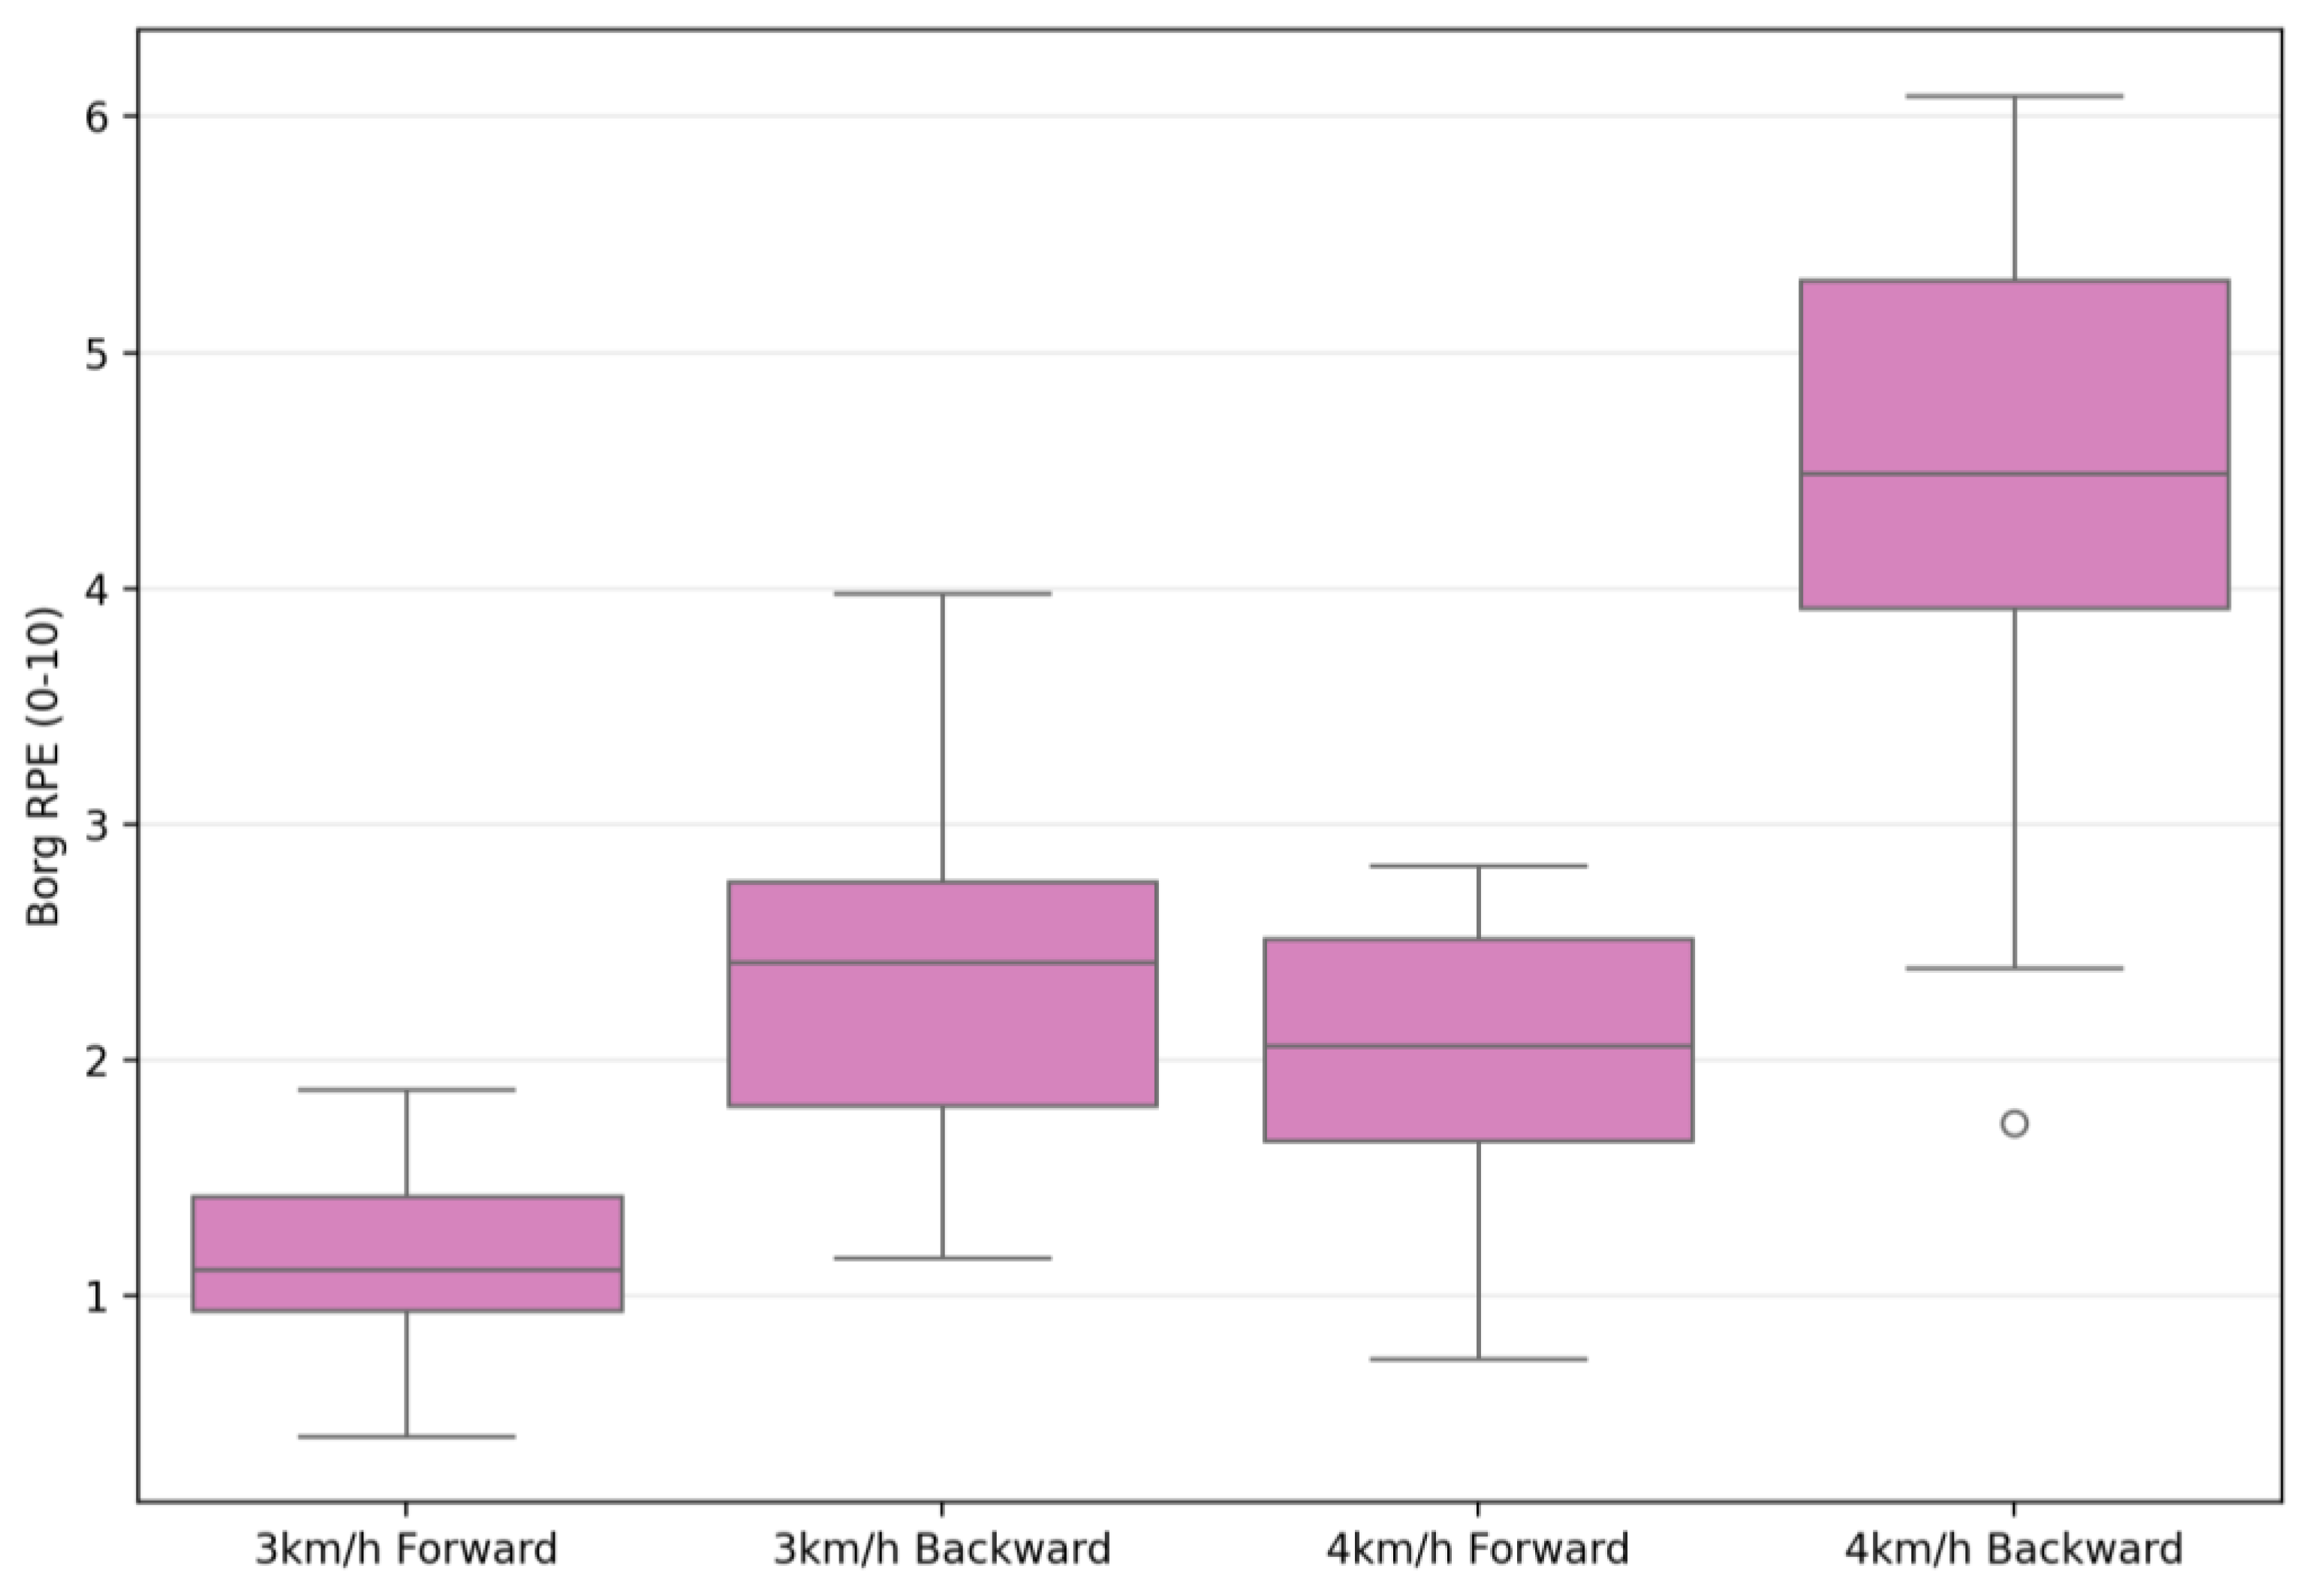
| Borg RPE (0–10) | 1.21 ± 0.42 | 2.61 ± 0.74 | 2.04 ± 0.74 | 4.46 ± 1.04 | 289.71 | 0.001 ** | 0.91 | 93.35 | 0.001 ** | 0.77 | 32.48 | 0.001 ** | 0.54 |
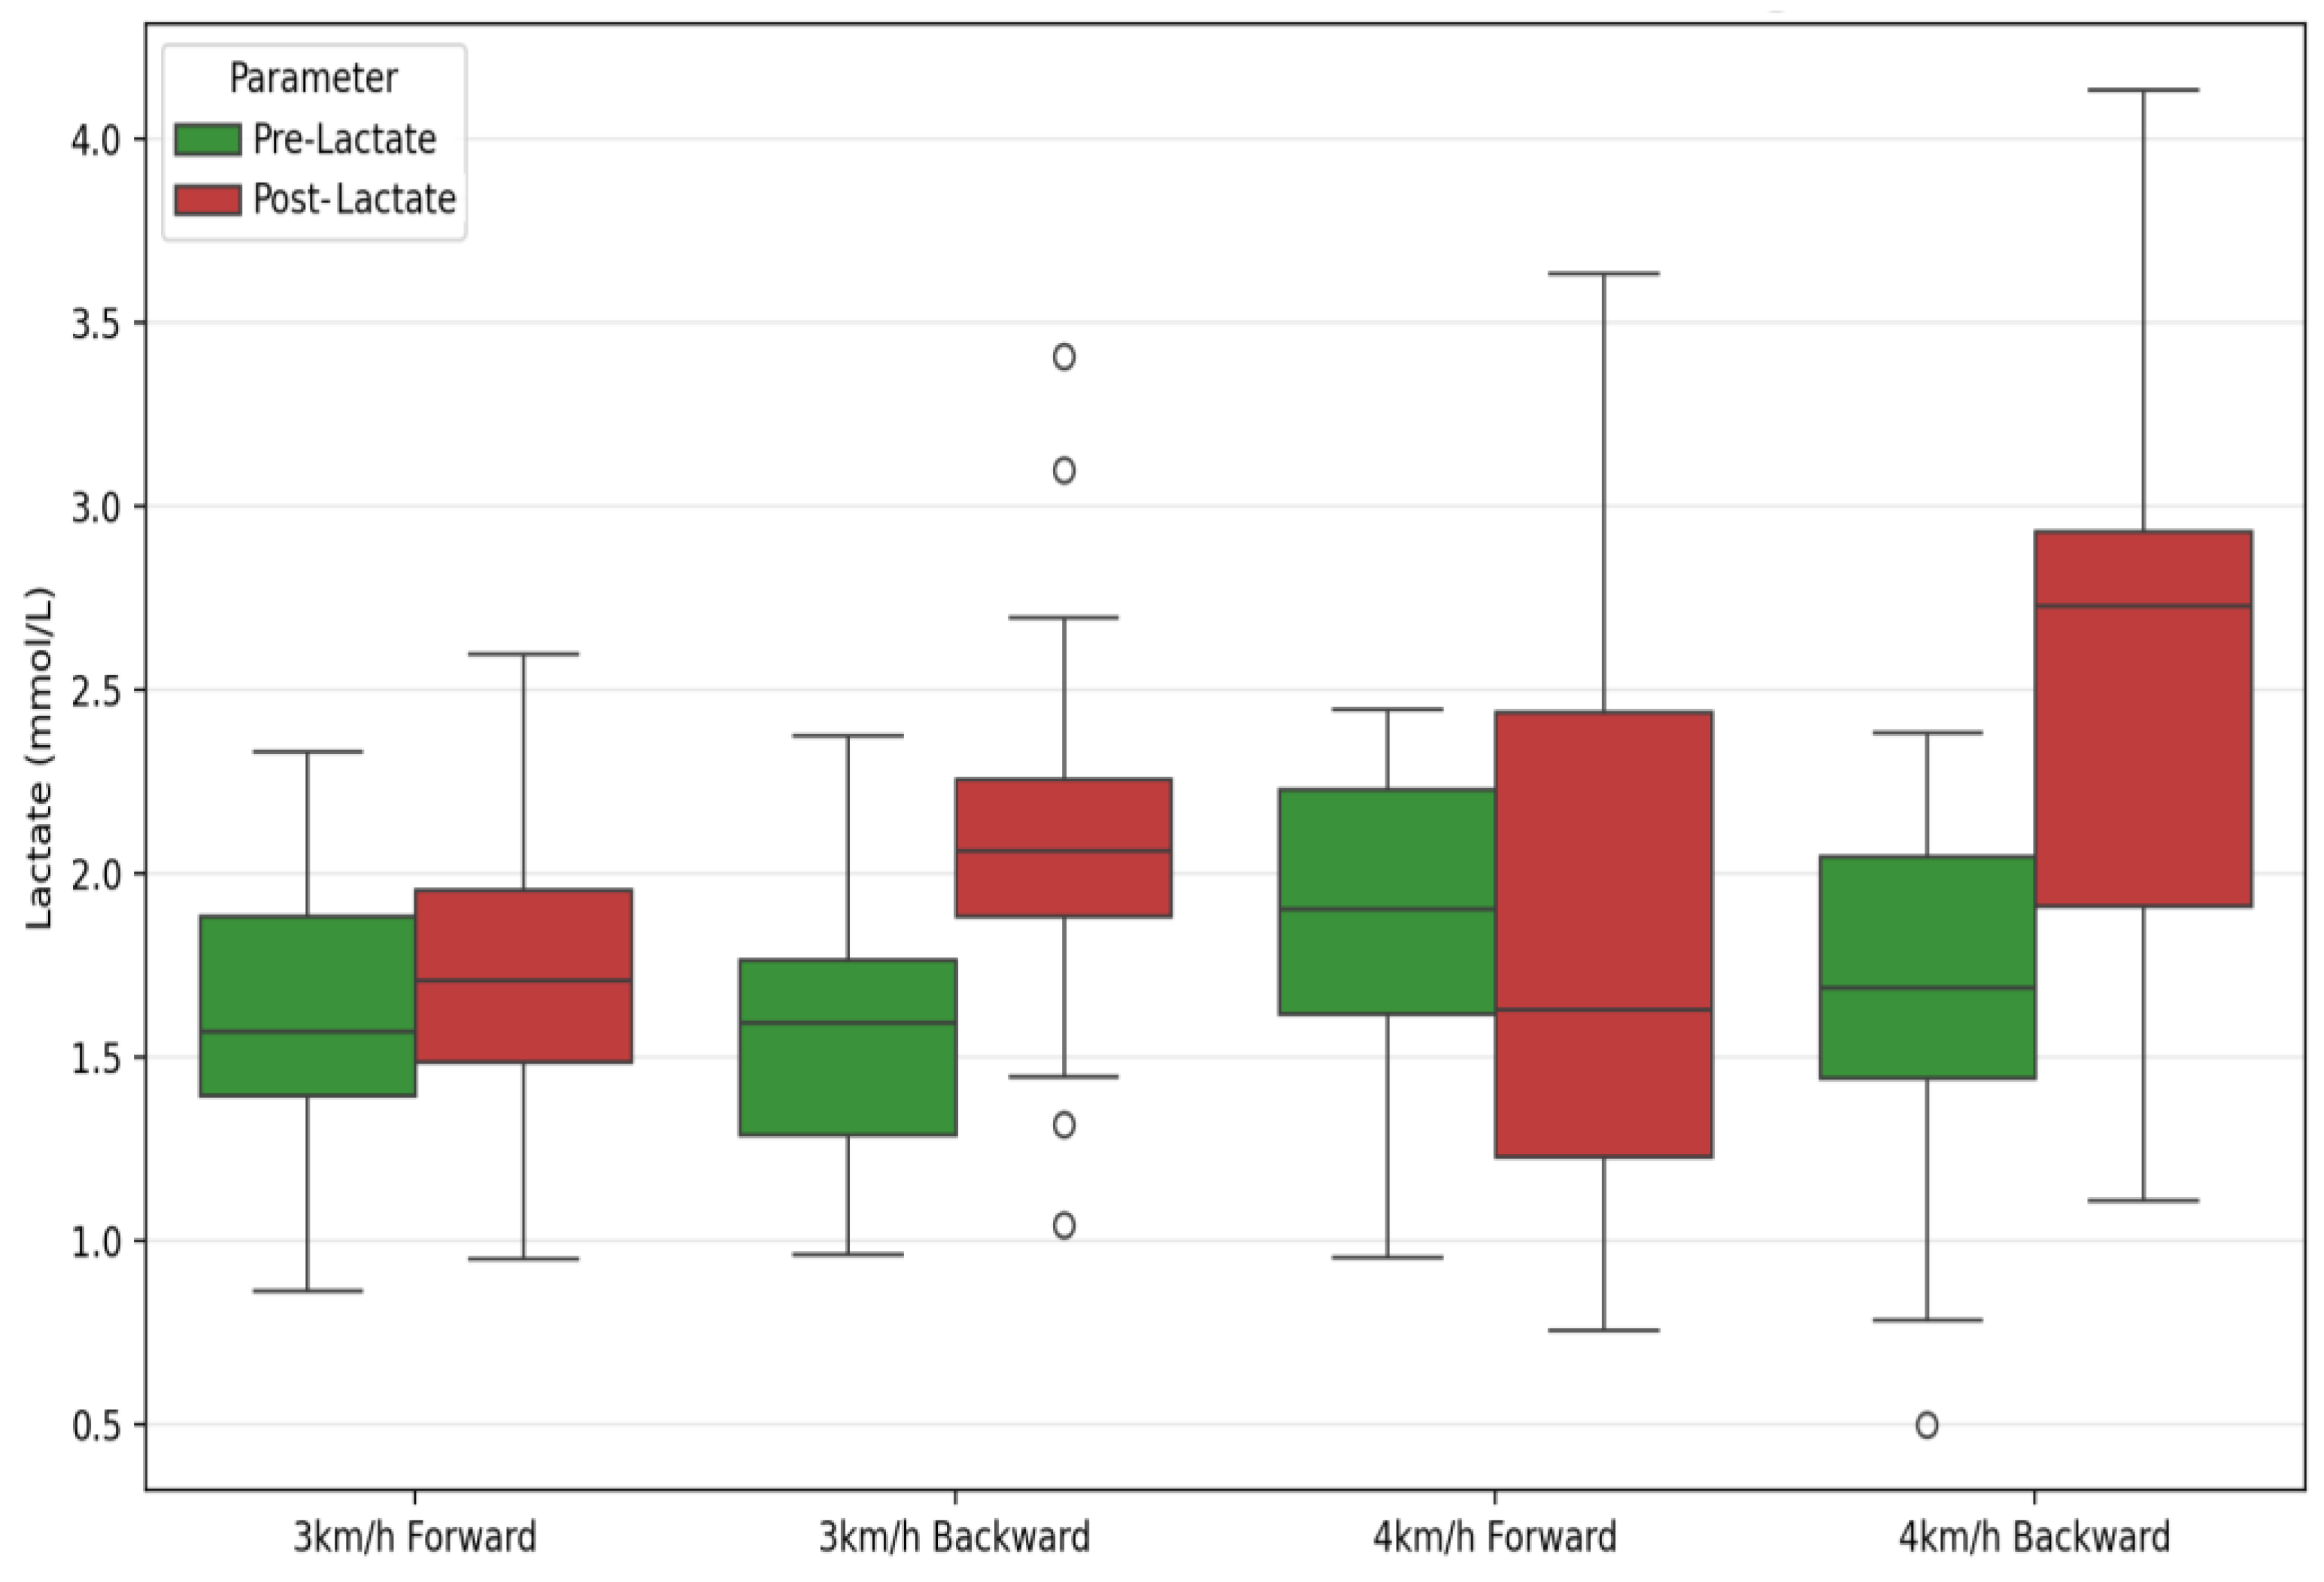
| Pre-Lactate (mmol/L) | 1.67 ± 0.42 | 1.69 ± 0.37 | 1.89 ± 0.53 | 1.68 ± 0.45 | 2.38 | 0.13 | 0.08 | 1.59 | 0.22 | 0.05 | 3.06 | 0.09 | 0.10 |
| Post-Lactate (mmol/L) | 1.77 ± 0.56 | 2.08 ± 0.54 | 1.95 ± 0.77 | 2.51 ± 0.87 | 20.41 | 0.001 ** | 0.43 | 4.77 | 0.04 * | 0.15 | 2.04 | 0.16 | 0.07 |
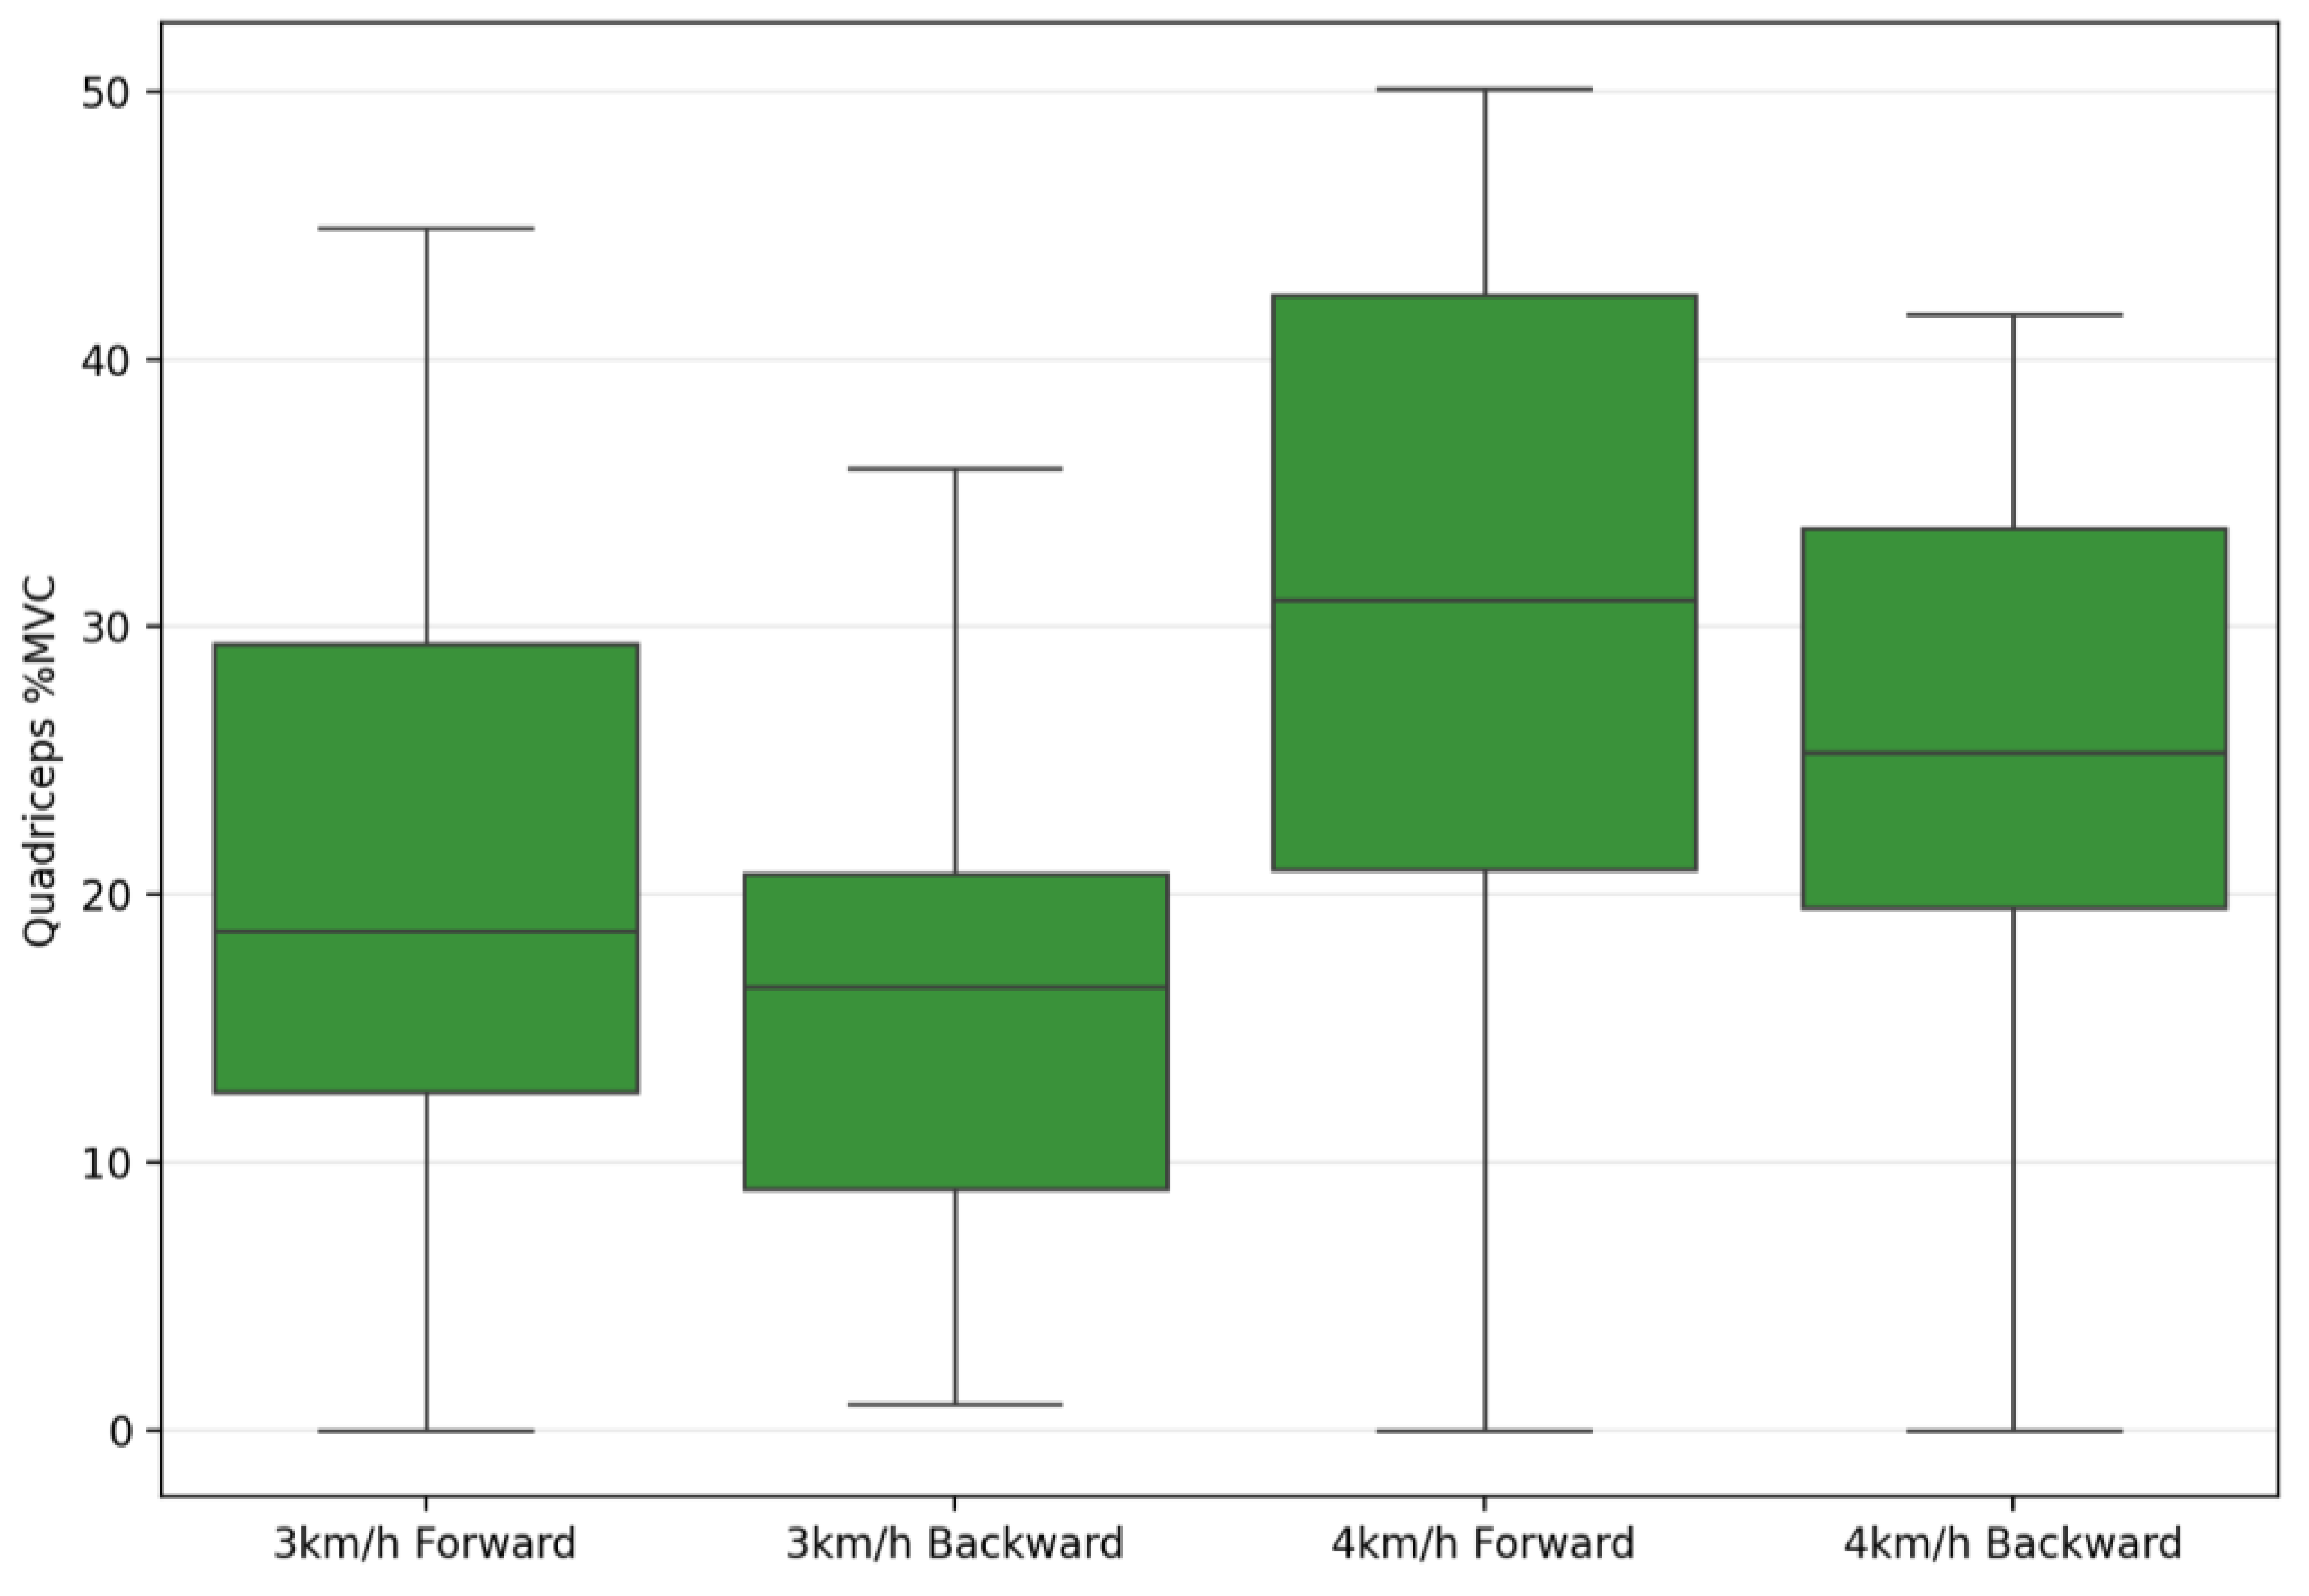
| Quadriceps %MVC | 22.02 ± 14.50 | 18.94 ±9.17 | 30.47 ± 18.55 | 25.03 ± 10.64 | 6.78 | 0.015 * | 0.20 | 81.85 | 0.001 ** | 0.75 | 1.81 | 0.189 | 0.06 |
| Hamstring %MVC | 12.77 ± 5.60 | 13.18 ± 3.18 | 15.93 ± 6.19 | 18.02 ± 4.77 | 5.23 | 0.03 * | 0.16 | 94.67 | 0.001 ** | 0.77 | 2.72 | 0.11 | 0.09 |
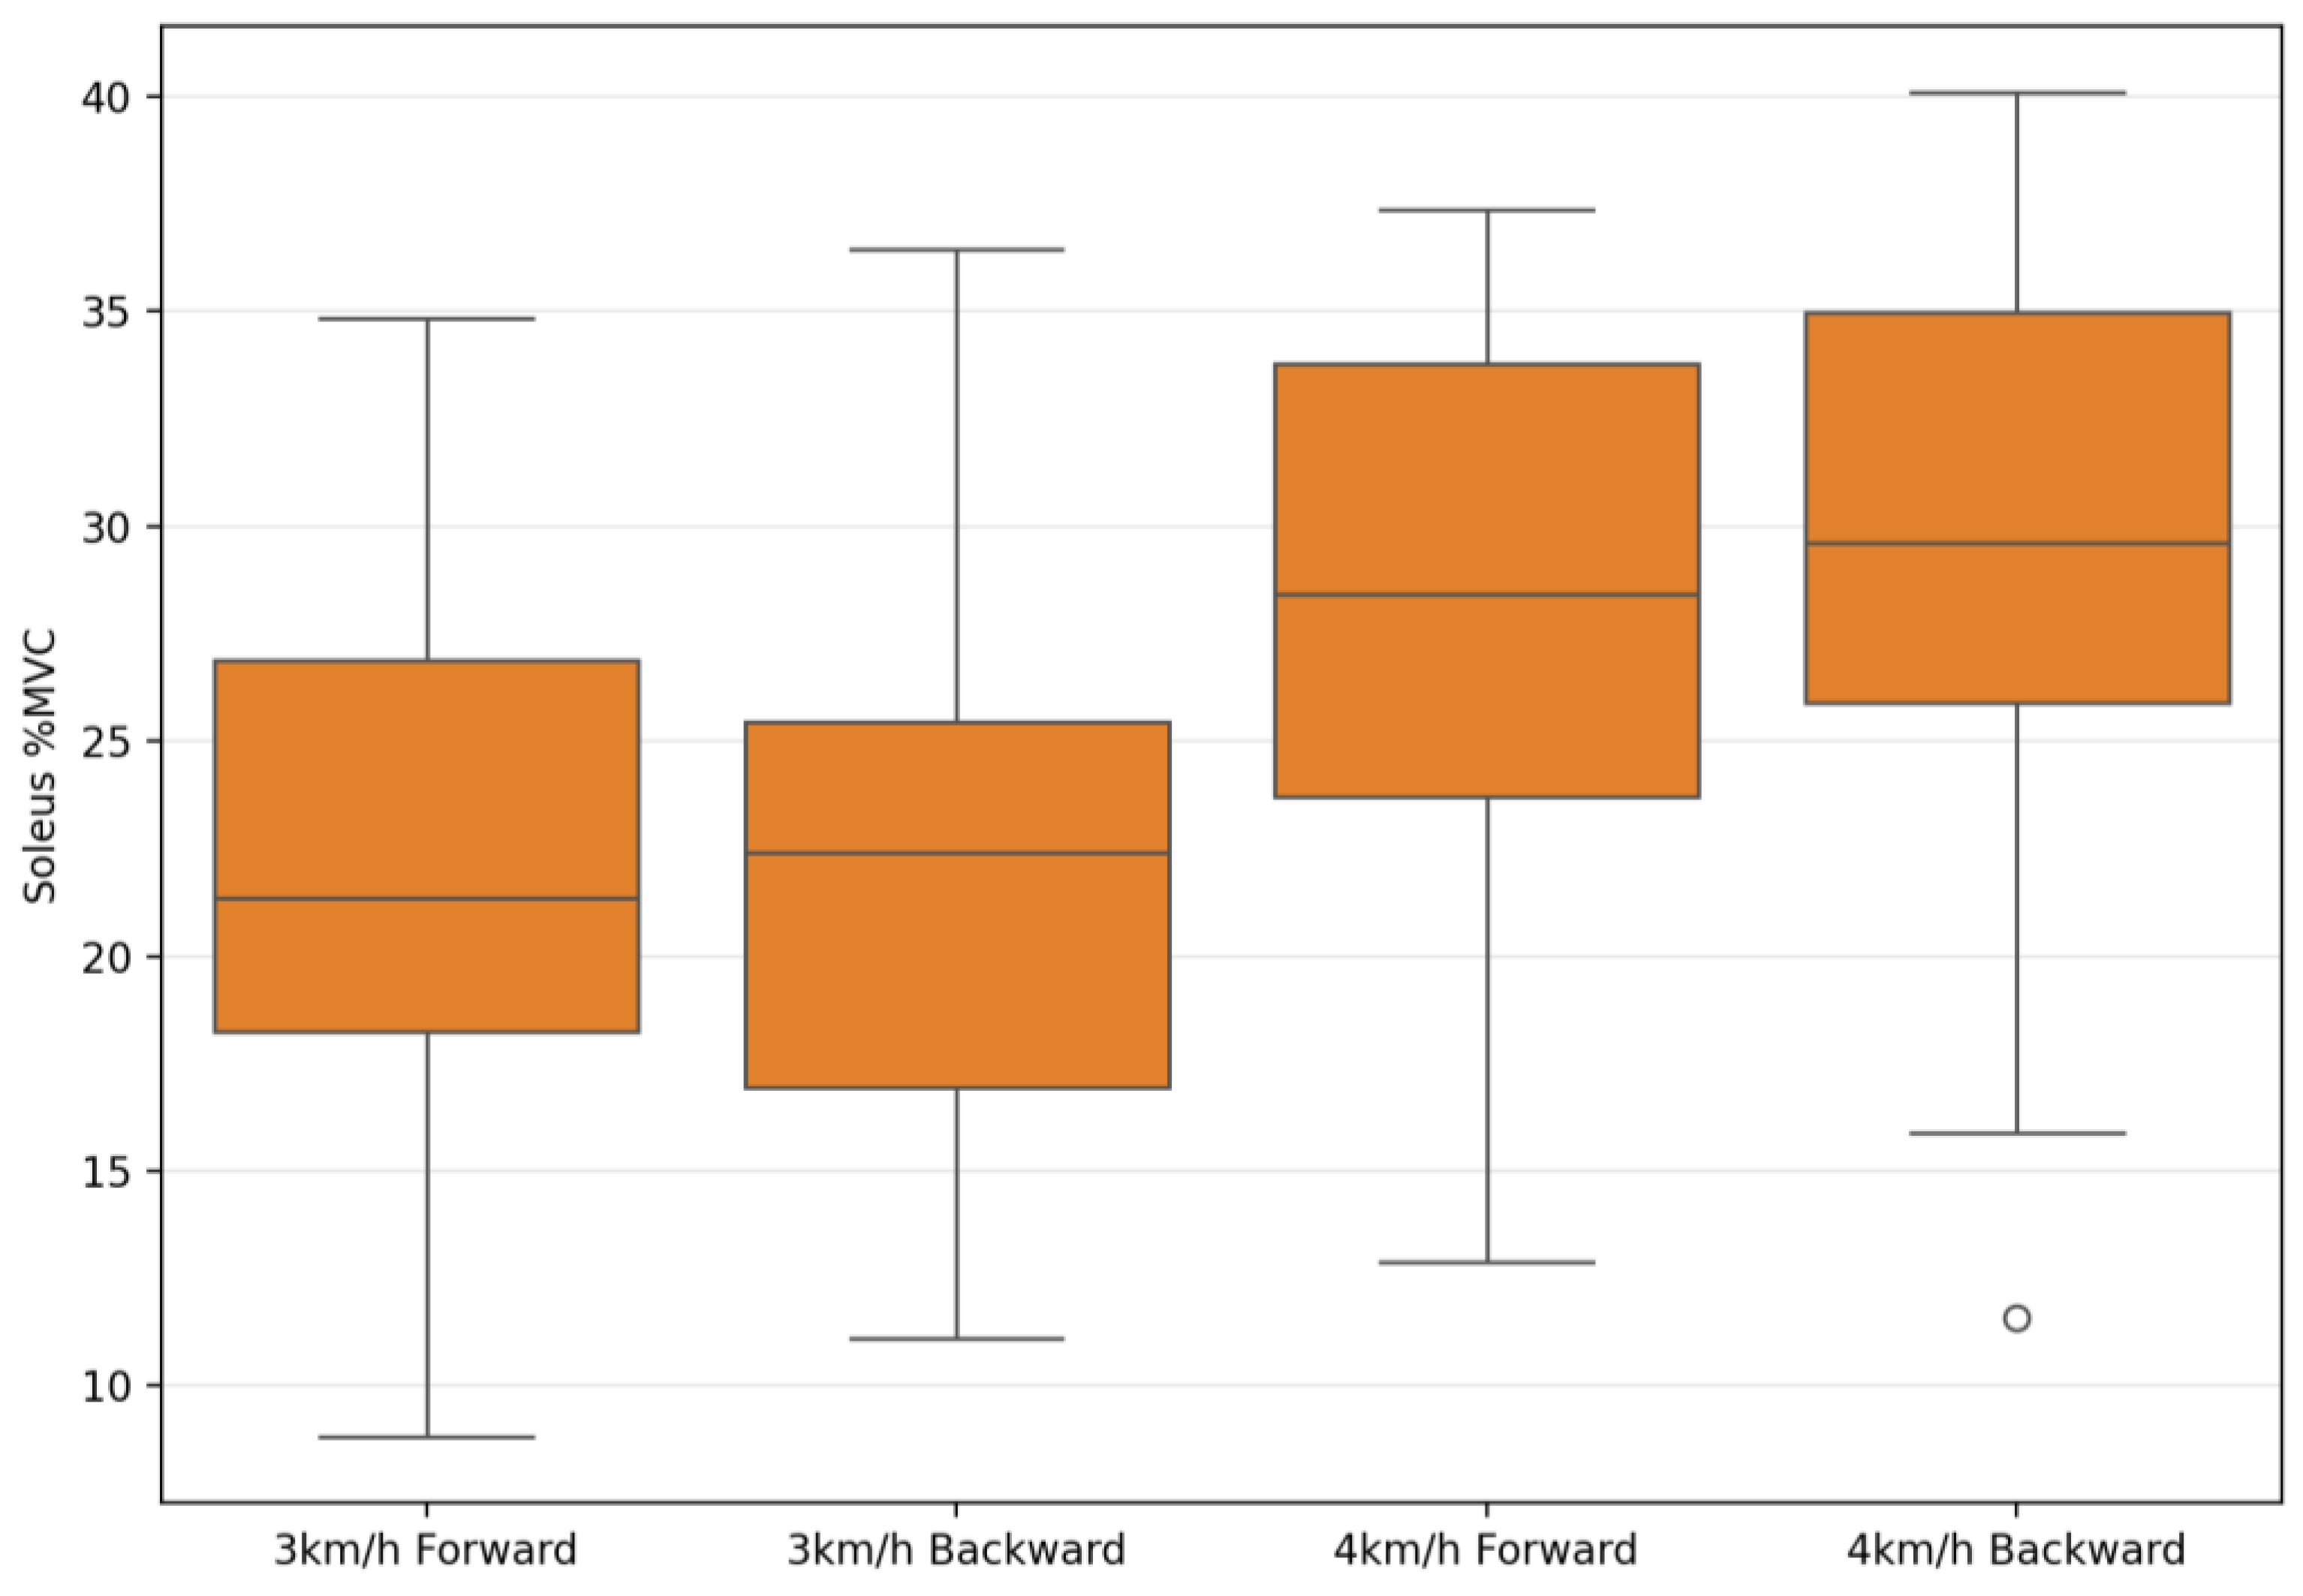
| Soleus %MVC | 23.08 ± 7.45 | 24.13 ± 6.64 | 28.18 ± 8.68 | 29.43 ± 6.81 | 1.88 | 0.181 | 0.06 | 67.29 | 0.001 ** | 0.71 | 0.26 | 0.87 | 0.01 |
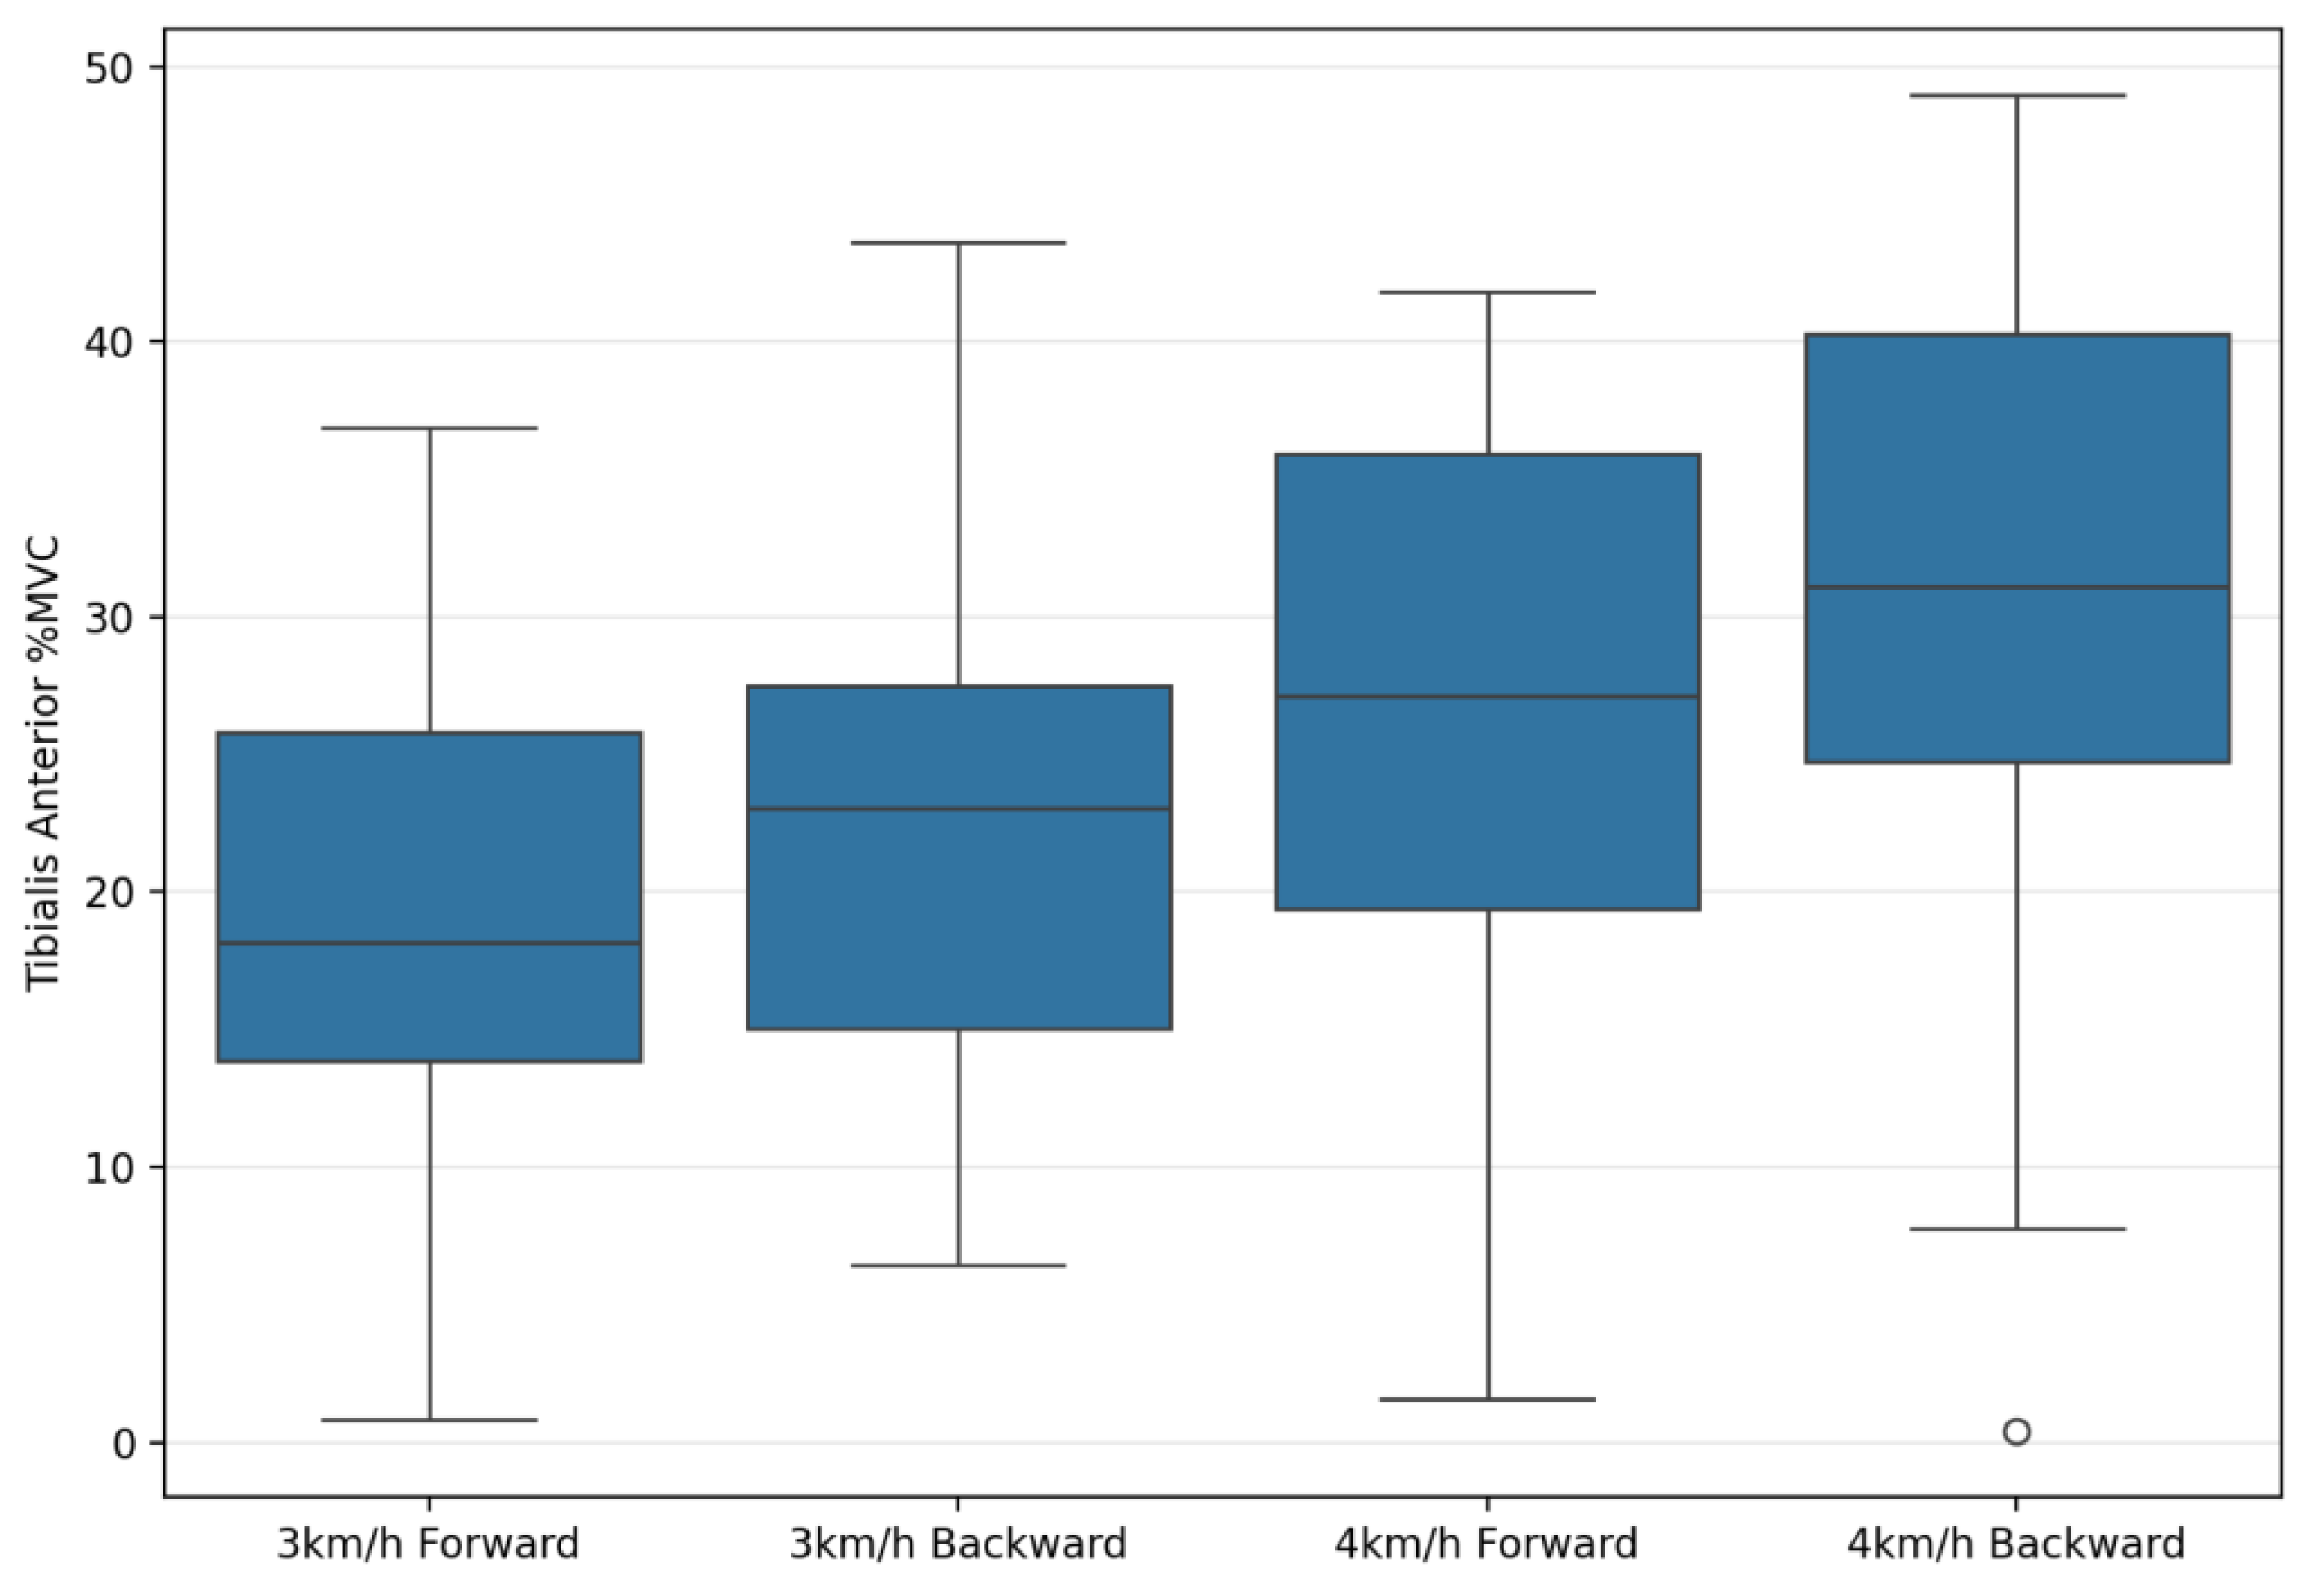
| Tibialis Anterior %MVC | 20.57 ± 10.32 | 25.56 ± 9.75 | 26.74 ± 14.27 | 30.81 ± 11.60 | 19.87 | 0.001 ** | 0.42 | 73.64 | 0.001 ** | 0.73 | 0.93 | 0.34 | 0.03 |
Disclaimer/Publisher’s Note: The statements, opinions and data contained in all publications are solely those of the individual author(s) and contributor(s) and not of MDPI and/or the editor(s). MDPI and/or the editor(s) disclaim responsibility for any injury to people or property resulting from any ideas, methods, instructions or products referred to in the content. |
© 2025 by the authors. Licensee MDPI, Basel, Switzerland. This article is an open access article distributed under the terms and conditions of the Creative Commons Attribution (CC BY) license (https://creativecommons.org/licenses/by/4.0/).
Share and Cite
Torun, M.C.; Çelenk, Ç.; Yılmaz, A.; Turan, M.B.; Akkurt, S.; Torun, S. Backward Locomotion as a Novel Strategy for Enhancing Obesity Management. Appl. Sci. 2025, 15, 7099. https://doi.org/10.3390/app15137099
Torun MC, Çelenk Ç, Yılmaz A, Turan MB, Akkurt S, Torun S. Backward Locomotion as a Novel Strategy for Enhancing Obesity Management. Applied Sciences. 2025; 15(13):7099. https://doi.org/10.3390/app15137099
Chicago/Turabian StyleTorun, Mustafa Cebel, Çağrı Çelenk, Alpaslan Yılmaz, Mehmet Behzat Turan, Soner Akkurt, and Samet Torun. 2025. "Backward Locomotion as a Novel Strategy for Enhancing Obesity Management" Applied Sciences 15, no. 13: 7099. https://doi.org/10.3390/app15137099
APA StyleTorun, M. C., Çelenk, Ç., Yılmaz, A., Turan, M. B., Akkurt, S., & Torun, S. (2025). Backward Locomotion as a Novel Strategy for Enhancing Obesity Management. Applied Sciences, 15(13), 7099. https://doi.org/10.3390/app15137099