Article

Study on the Choice of a Suitable Material Model for the Numerical Simulation of the Incremental Forming Process of Polymeric Materials

by
Nicolae Rosca
1,
Sherwan Mohammed Najm
2,
Eugen Avrigean
1,*,
Mihaela Oleksik
1,
Tomasz Trzepieciński
3 and
Valentin Oleksik
1
1
Faculty of Engineering, “Lucian Blaga” University of Sibiu, Victoriei Bd. 10, 550024 Sibiu, Romania
2
Technical Engineering College—Kirkuk, Northern Technical University, Kirkuk 36001, Iraq
3
Department of Manufacturing and Production Engineering, Faculty of Mechanical Engineering and Aeronautics, Rzeszow University of Technology, al. Powst. Warszawy 8, 35-959 Rzeszów, Poland
*
Author to whom correspondence should be addressed.
Appl. Sci. 2025, 15(13), 7094; https://doi.org/10.3390/app15137094
Submission received: 24 May 2025 / Revised: 16 June 2025 / Accepted: 21 June 2025 / Published: 24 June 2025
(This article belongs to the Section Materials Science and Engineering)

Abstract

Featured Application

This paper aims to present a tool for choosing the most convenient material model when simulating the incremental forming process or other forming processes of polymeric materials.

Abstract

The aim of this paper is to identify the most suitable material model for the numerical simulation of the incremental forming of polymeric materials using the finite element method. The analysis program used was Ls-Dyna, and two material models, namely material 24 (Piecewise Linear Plasticity) and material 89 (Plasticity Polymer), were chosen for comparison from the library of the program. A comparison was made between two polymeric materials, polyamide PA 6.6 and polyethylene HDPE 1000, with the following dimensions of the forming tools: punch diameter, Dp = 6 mm; die length, Ld = 190 mm; die radius, Rd = 5 mm; die corner radius, Rcorner = 10 mm; and blankholder length, Lbl = 190 mm. The simulation using the finite element method was performed with the Ls-Dyna software, and the experimental research was carried out using the Kuka KR210-2 robot. The strains were measured with the Aramis 2M optical system. Experimental investigations were carried out simultaneously, and the results obtained were compared in terms of main strains, thickness reduction, and forces on three directions. Close results were obtained between theoretical and experimental research for both material models.

1. Introduction

The incremental forming process is a relatively new process that is constantly being developed and improved and is being used in more and more industrial fields, especially in those involving the production of parts in small series, prototypes or one-off productions. In contrast to traditional forming processes, where the active element (in most cases, the punch) only performs an alternating rectilinear movement to produce the part, the incremental forming process produces a complex, three-dimensional trajectory. The main advantage consists in the universality of the process, allowing for a wide variety of geometric shapes to be produced using the same punch and die but with different trajectories. In recent years, interest in the incremental forming of polymeric materials has grown significantly, driven by their extensive industrial applications and the rising demand for prototypes, one-off components, and small-batch production. The automotive sector, in particular, has been actively exploring the replacement of metal components with lighter alternatives to reduce vehicle weight and enhance fuel efficiency and autonomy [1]. Furthermore, the biocompatibility of specific polymeric materials with human tissue has enabled the use of incremental forming techniques for the fabrication of biomedical implants. These implants, often derived from autologous or cadaveric sources, aim to reduce immunological rejection and minimize the risk of postoperative infection [2,3].
The latest advances in incremental forming of polymeric materials were presented by Husain et al. [4]. Most papers published on this topic study the formability of polymeric materials [5], as well as the variation of main strains and thickness reduction [6] and forces occurring in the forming process [7]. Polycarbonate materials [8] and polypropylene materials [9] are the most frequently studied materials in the scientific literature.
Regarding numerical simulation, using the finite element method of an incremental forming process, most papers have studied the behaviour of metallic materials. A synthesis paper offers a comprehensive analysis of the use of the finite element method (FEM) in modelling the incremental forming of metal sheets [10]. The authors provide an overview of the evolution of the finite element method (FEM), discussing the different types of simulations employed and the commonly used software platforms, including Abaqus, Ls-Dyna, and Ansys. They highlight the benefits of FEM in incremental forming, such as precise prediction of stress and strain distribution, force dynamics, and material thinning. The study underscores the critical role of FEM simulations in process optimization, cost reduction, and enhancing the quality of the final components.
Incremental forming of metal sheets by methods, with and without the use of auxiliary tools, using finite element method (FEM) simulations is analysed by Ibrahim [11]. Finite element method (FEM) simulations revealed notable distinctions between single-point incremental forming (SPIF) and two-point incremental forming (TPIF), emphasising the positive impact of auxiliary tools on enhancing geometric precision and forming consistency. The study offers a strong foundation for optimising incremental forming process and underscores the advantages of incorporating auxiliary tools to achieve higher-quality components.
Conte et al. developed a thermomechanical model in Abaqus incorporating the damage initiation criteria to simulate the behaviour of long fibre-reinforced composite materials at forming temperatures around 220 °C [12]. To enhance formability, they introduced an innovative setup featuring controlled hydrostatic pressure and a protective AA-6056 aluminium alloy sheet. The study examined the effects of laminate configuration, applied pressure, and tool path strategy on the quality of the formed components. Results indicated that hydrostatic pressure and alternating tool paths significantly reduce thinning and enhance geometric precision.
Sy et al. [13] proposed a numerical approach for simulating the SPIF process of polypropylene sheets at room temperature using a modified viscoplasticity based on overstress (VBO) model. The model was calibrated using experimental data from tensile, relaxation, and creep tests conducted at various strain rates and previous strain levels. Implementation of the VBO model was carried out via a Fortran subroutine that described the material’s constitutive behaviour within the simulation framework. Finite element simulations showed good agreement with experimental results, accurately predicting both the final geometry and thickness distribution of the formed parts. The findings confirm the effectiveness of the modified VBO model in capturing deformation behaviour and identifying mechanical defects during SPIF, thereby offering a robust foundation for optimising polymer sheet incremental forming processes.
The finite element method was also used to simulate the two-point incremental forming (TPIF) process of woven fabric composite sheet [14]. In this paper, the authors propose a combined experimental–numerical study that combines incremental forming with autoclave treatment, aiming to reduce costs and production time for small batches. To prevent viscous friction and material damage, a metal–fibre–metal (MFM) sandwich configuration was used. Metal sheets were actually only used to protect the fabric on both sides. The analysis using the finite element method was performed in the Pam-Form software. To validate the numerical model, the section profiles, peripheral contours and shear strain distribution between experiments and simulations were compared.
Another comparative, numerical–experimental study was conducted by Rai et al. [15]. They analysed the mechanical behaviour of 1.8 mm thick polycarbonate (PC) sheets subjected to the SPIF process. The authors manufactured rectangular square cup parts at variable wall angles (15°, 30°, 45°, 60°). Numerical simulations conducted using Abaqus enabled the assessment of forming forces and the distribution of Von Mises stresses, showing strong agreement with experimental results. Additionally, fracture energy was determined from force–displacement curves, offering valuable insights into the material behaviour during the SPIF process.
García-Collado et al. developed a coupled thermomechanical model for simulating the SPIF process of polymer sheets [16]. The numerical model employs an explicit formulation in Abaqus, integrating J2 plasticity with isotropic hardening and temperature-dependent material behaviour to simulate the deformation of thermoplastics such as PVC, PC, and HDPE. Experimental validation showed a prediction error of less than 11% for the vertical forming force. The study underscored the critical influence of finite element type and size, as well as material modelling, on simulation accuracy and computational efficiency. The finite element model effectively predicted temperature distribution, final geometry, and sheet thinning, serving as a reliable tool for optimising the SPIF process in polymers. This study offers a practical balance between accuracy and computational cost, without relying on complex rheological models.
An advanced robotized approach to the SPIF process for polymer sheets, with a particular focus on PVC was presented by Ostasevicius et al. [17]. A novel forming tool, integrating ultrasonic vibrations and localised laser heating, was developed to enhance material formability and reduce friction during processing. Thermal and mechanical behaviours during SPIF process were analysed using finite element method (FEM) simulations conducted in Ansys. The simulations effectively predicted temperature distribution and material deformation. Experimental trials validated the simulation results, showing strong agreement between predicted and actual displacements. Thermal imaging and displacement sensors provided real-time monitoring of the forming process.
Two constitutive models, one based on a hyperelastic–plastic constitutive equation and another based on a simplified semi-analytical model that extends the specific energy concept used in materials processing, are used to predict forming forces at SPIF process [18]. Both methods were experimentally validated using polycarbonate (PC) and polyvinyl chloride (PVC) sheets, showing strong correlation with the observed results. The FEM model effectively predicted temperature distribution and material thickness throughout the forming process.
The occurrence of wrinkling defects in the SPIF process of thin polycarbonate sheets is investigated through a combination of experimental tests and finite element method simulations [19]. The study examines how tool path parameters—specifically wall angle and vertical step—affect forming forces, strain distribution, and thickness reduction. Findings reveal that these process parameters play a critical role in the onset of wrinkling and twisting, underscoring their impact on the overall quality of the SPIF process.
Kulkarni et al. developed a coupled thermomechanical numerical model to simulate the SPIF process with convective heat assistance for polycarbonate sheets [20]. The model incorporates a spatial distribution of convective heat transfer coefficients to replicate localized heating and employs the temperature dependent Three-Network Model (TNM) within the Ansys simulation software. The approach was applied to the forming of a frustum of a cone with a 45° wall angle. Experimental validation demonstrated strong agreement, with a temperature prediction error of ±5 °C and a displacement deviation of approximately 0.77 mm.
The optimization of the SPIF process applied to polycarbonate sheets, using finite element method (FEM) simulations, is analysed by Formisano et al. [21]. The study explored how different tool path strategies affect forming forces, deformation behaviour, energy consumption, and processing time in the SPIF process. The findings revealed that employing alternating tool paths—combining ascending diagonal and descending vertical steps—significantly reduces forming forces and minimizes defects such as wrinkling and sheet twisting. This strategy enhances surface finish and lowers energy usage while maintaining efficient production times.
Having reviewed the research in this field, the present paper aims, by means of a comparative study, to analyse the differences obtained between numerical simulation and experimental research for two material models from the Ls-Dyna program, namely models 24 (Piecewise Linear Plasticity) and 89 (Plasticity Polymer), applied to the incremental forming process for two materials, polyamide PA 6.6 and polyethylene HDPE 1000. Both the results of the experimental investigations and the results of the numerical simulations were focused on the main strains and forces during the single-point incremental forming process.
This study contributes to strengthening science, engineering, and technological development by addressing a practical yet underexplored challenge in modern simulations of forming processes: choosing the appropriate material model depending on the objective of the FEM simulation, predicting with the highest possible degree of accuracy the forces in the process, or the strain evolution during the forming process.

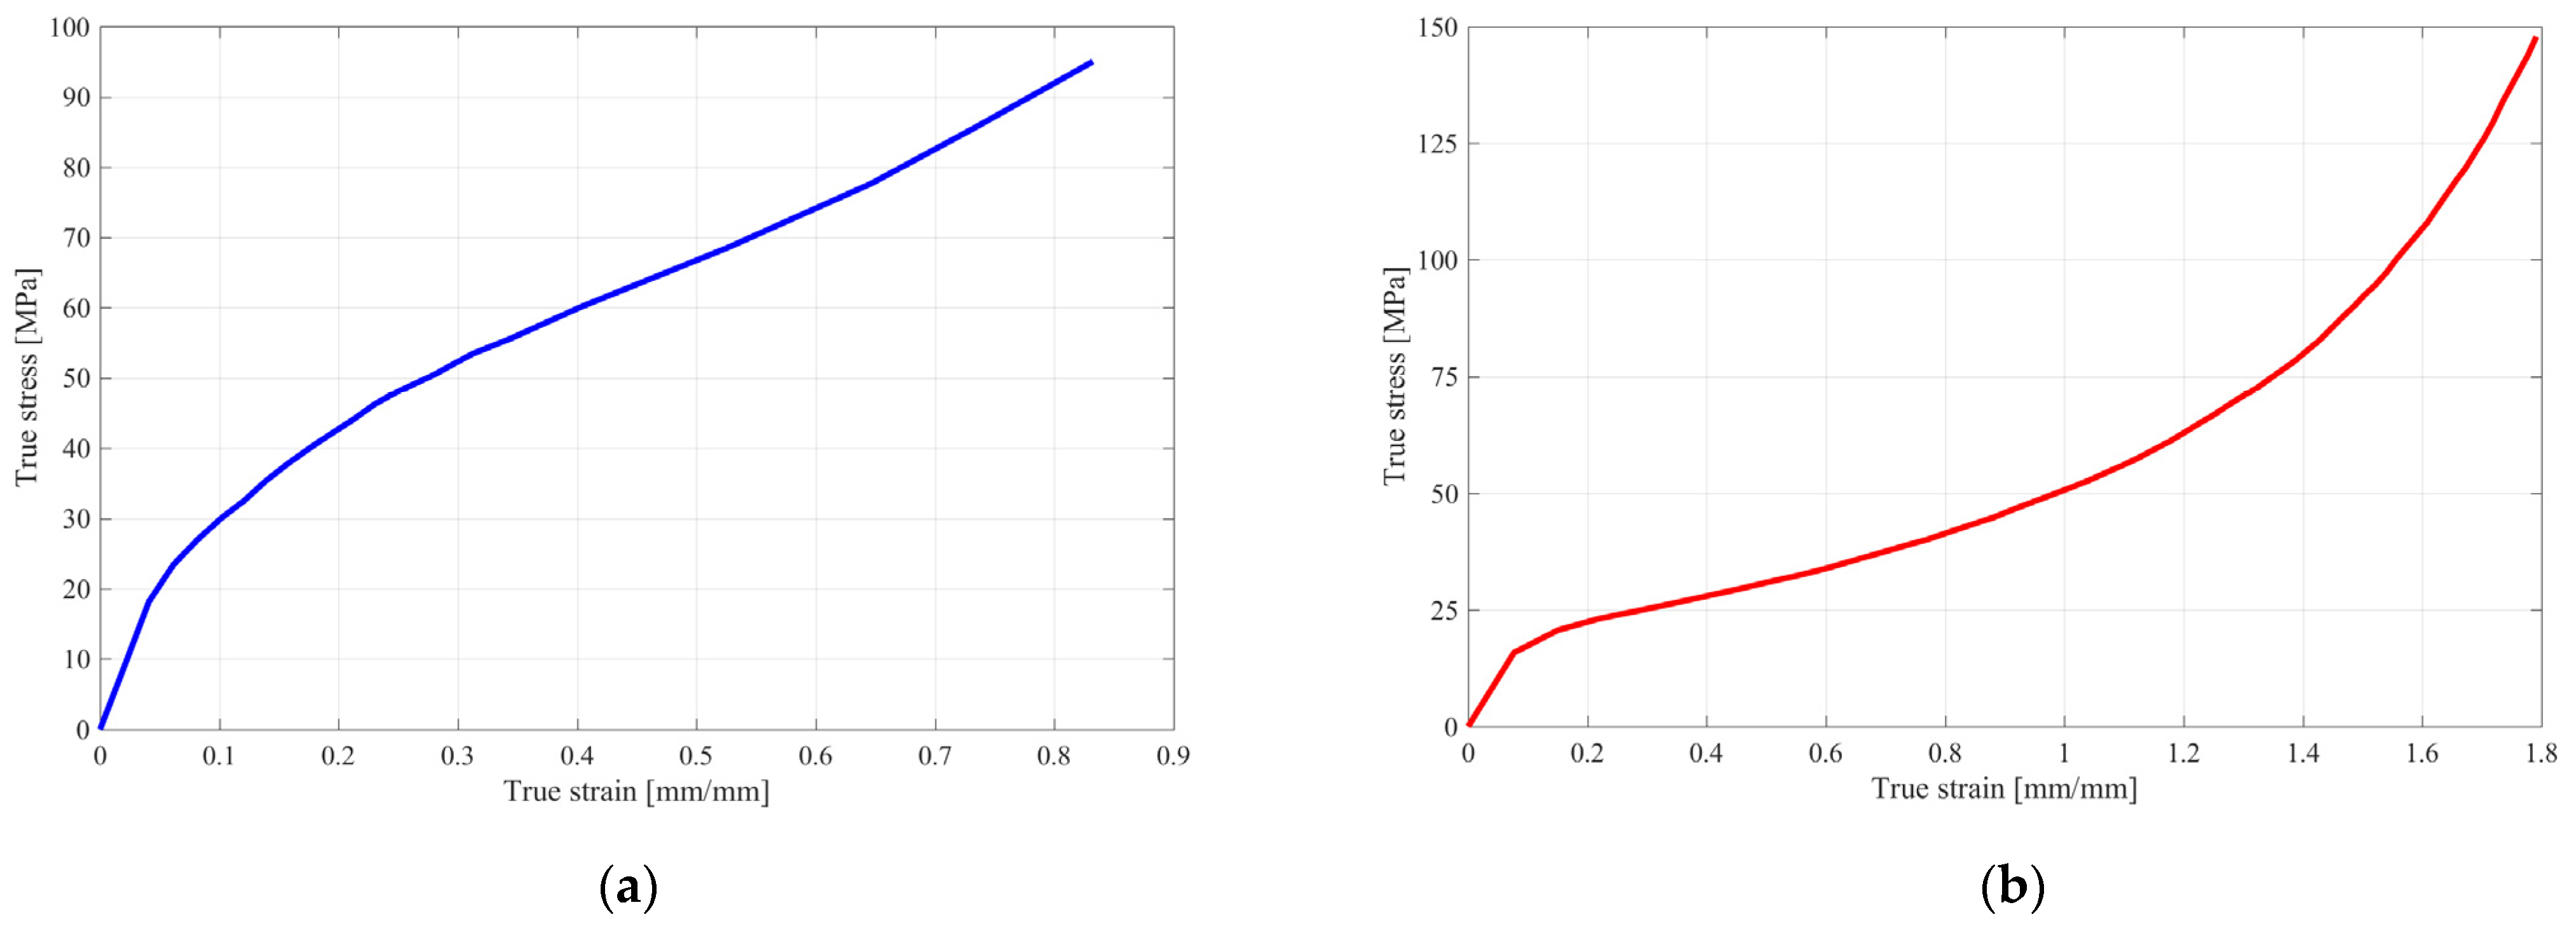
2. Materials and Methods

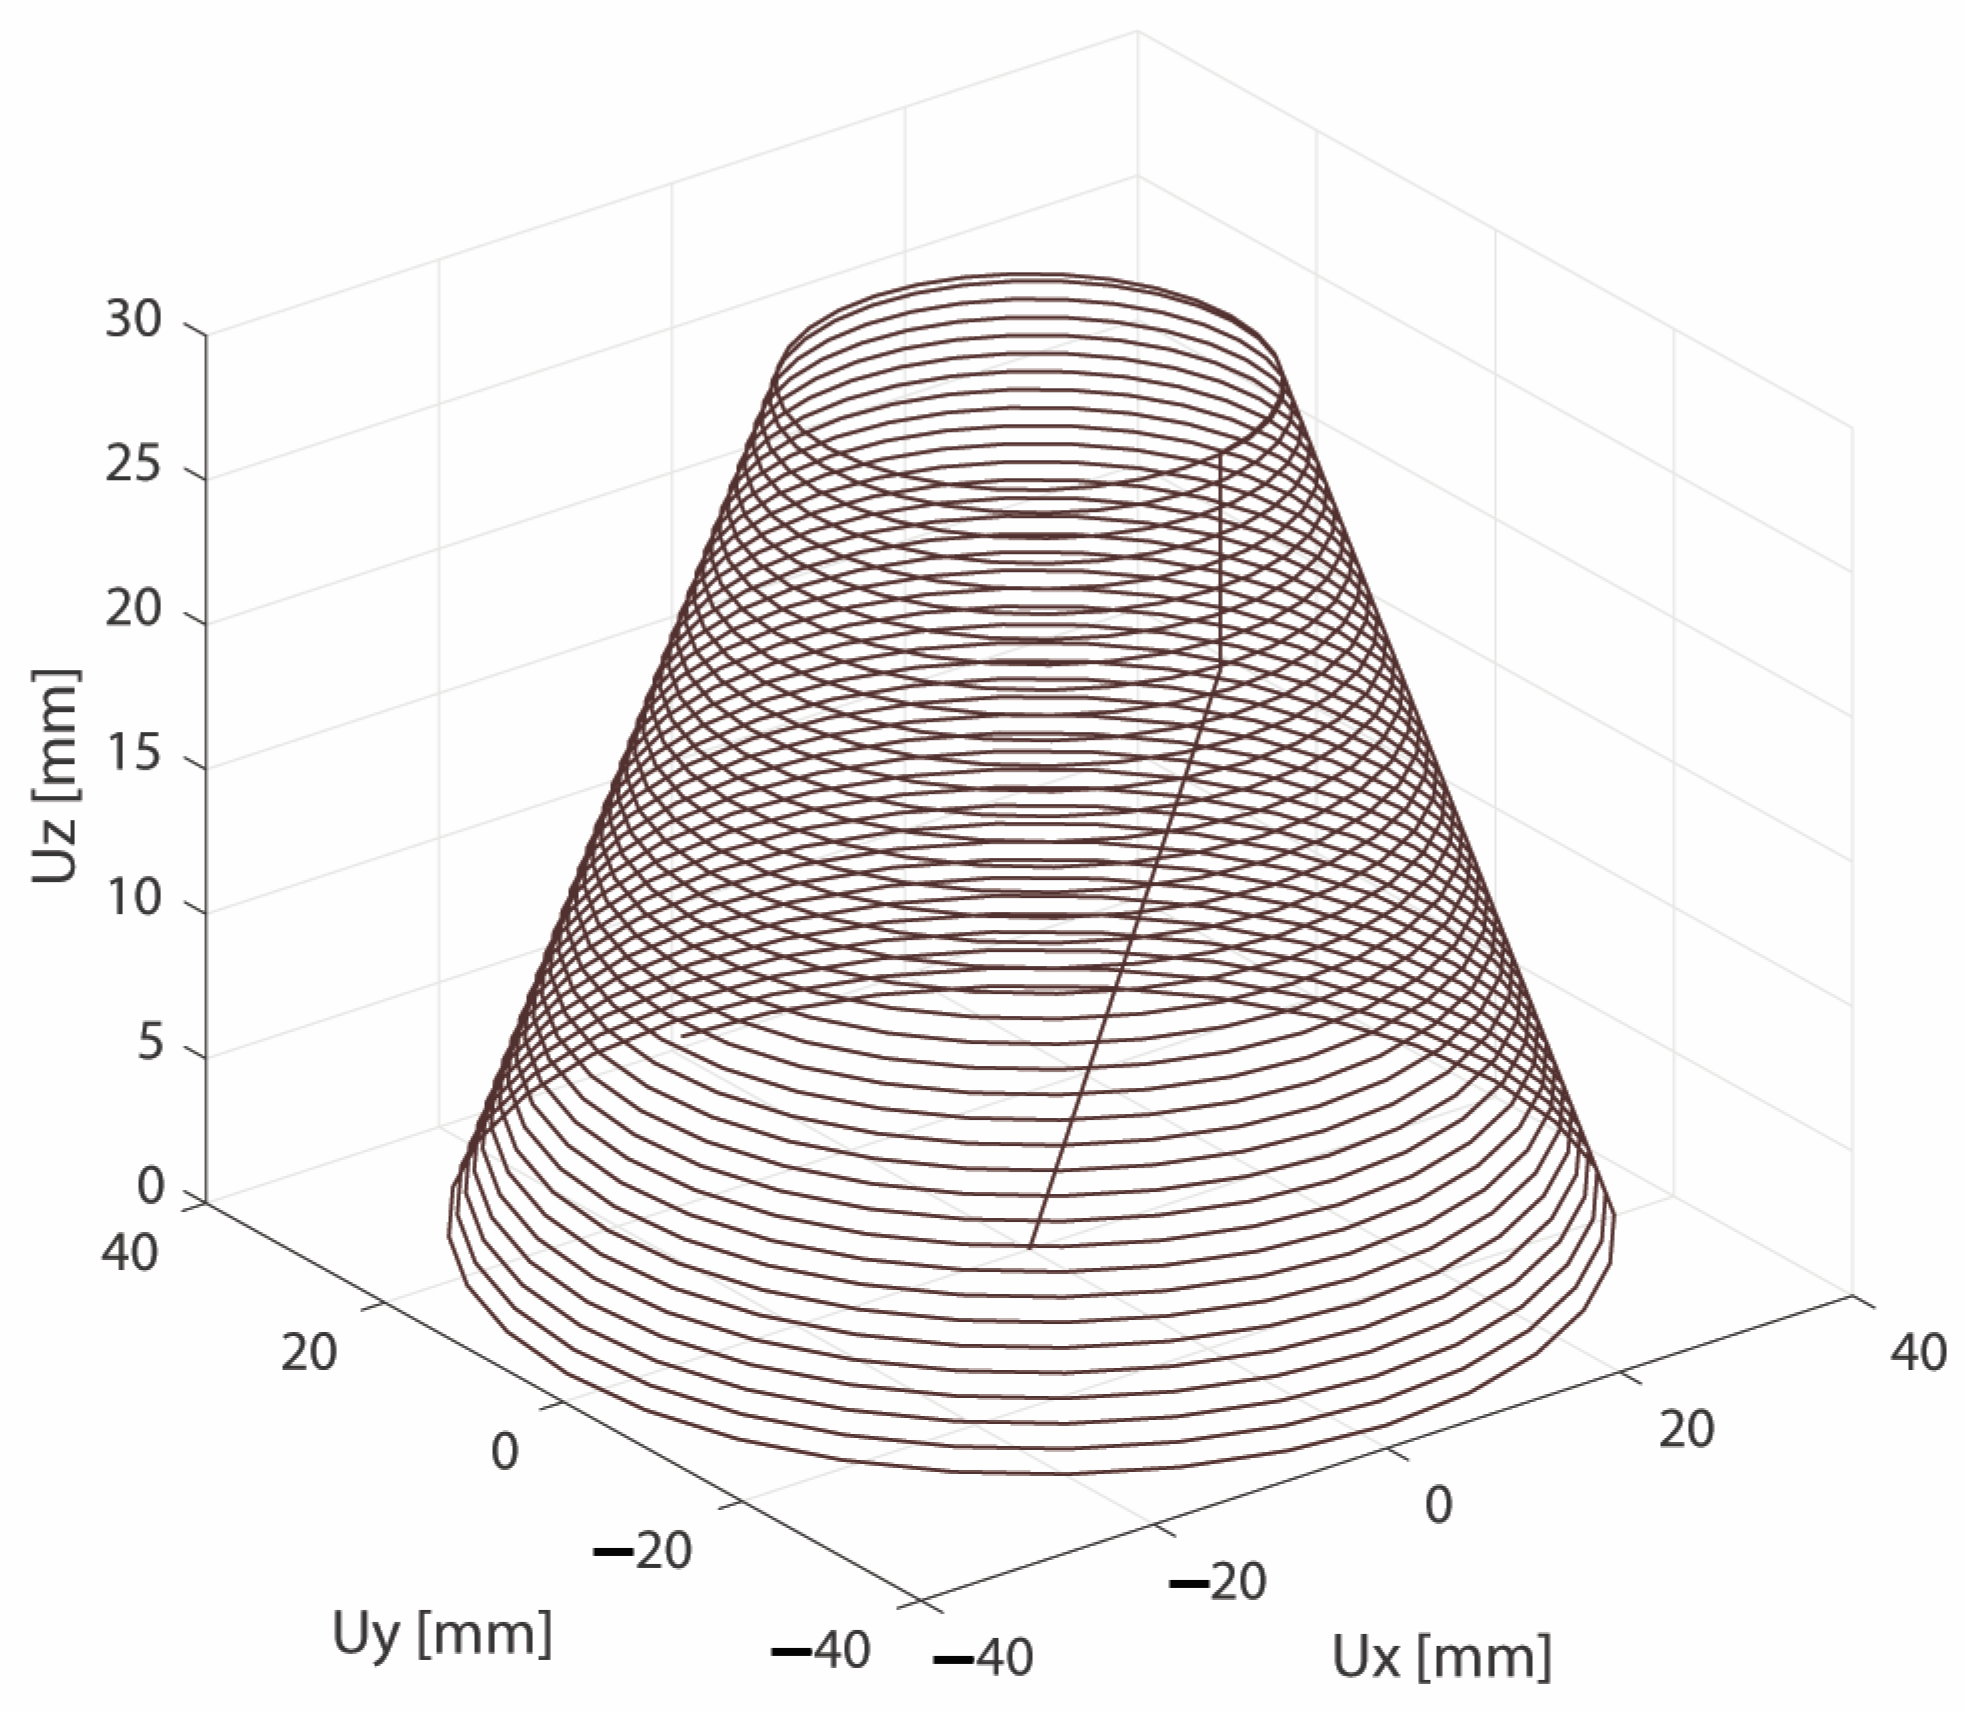
2.1. Numerical Simulation

Simulations that can be performed in the plastic, nonlinear domain and have been implemented in commercial numerical simulation software are inverse analysis and explicit or implicit direct analysis, and optimization analyses.
The inverse analysis starts with the final geometric shape of the part (in most cases, deep-drawn). Then, an analysis that does not take into account the forming tools (punch, die, and blankholder), the clearances between them, and the holding forces in the process is used to determine the shape and size of the blank before the plastic deformation process, as well as a presumptive state of the strains and thinning on both the deformed part and the blank. This analysis is useful in the case of forming processes because it allows one to obtain the shape and size of the blank not only based on geometrical considerations, by means of calculating the unfolded length, but also by taking into account the thinning or thickening occurring in the process, based on the law of constant volume.
The direct analysis involves the modelling of all elements involved in the forming process, punch, die, blankholder and blank, as well as determining their initial positions so as to ensure the clearances between these elements. The kinematics of the punch or blank are then defined, according to the forming diagram, together with the force or pressure acting on the blankholder and the contacts and frictional forces between the elements participating in the forming process. Direct analyses can be implicit or explicit. Explicit dynamic analyses are used to calculate the unknown functions of a model at a time other than the current time. In contrast, an implicit dynamic analysis finds a solution for the unknown functions by solving an equation that includes both the current time and the time following the current time. This implicit analysis requires additional calculations and is more difficult to implement.
Optimization analyses are intended for identifying the material or rheological parameters by combining an analysis with a physically conducted experiment and by imposing the condition that the results of both studies overlap, allowing for a specified coefficient of error.
Regarding the type of analysis concerning the numerical simulation of the incremental forming process of polymeric materials, an explicit dynamic analysis was chosen due to the advantages it offers and the reduction in the total time required for the analysis.
The program used for the analysis with the finite element method was Ls-Dyna R13.1.0. As far as the construction of the geometrical model of the part proposed for the simulation of the incremental forming process of polymeric materials is concerned, it can be performed either directly in the pre-processing module of the analysis program or in one of the dedicated CAD programs. It is worth mentioning that, since the shell elements were desired for the analysis, the volumes of the tools participating in the incremental forming process (punch, die, and blankholder) were not modelled, but only their outer surfaces, which will come into contact with the blank. Thus, the hemispherical-headed punch is modelled as a sphere with an outer diameter equal to the diameter of the active side of the punch, the die is represented by its outer surfaces, and the blankholder is modelled as a flat surface pressing directly on the blank. The blank is represented by a square surface with a side of 250 mm and is modelled along its middle fibre, i.e., at the middle of its thickness.
In order to allow for the comparison of the results of the simulation using the finite element method with the ones obtained experimentally, the following dimensional data were chosen for the active elements: punch diameter, Dp = 6 mm; die length, Ld = 190 mm; die radius, Rd = 5 mm; die corner radius, Rcorner = 10 mm; and blankholder length, Lbl = 190 mm.
The PA 6.6 and HDPE sheets had the same thickness (t = 3 mm) and did not undergo any pretreatment. Regarding lubrication, for the PA 6.6 sheets, we used a synthetic lubricant, recommended for the forming process of these types of polymeric materials, namely, Vascomill CSF 10, produced by Blaser Swisslube. This type of vegetable oil-based lubricant avoids the risk of contamination of the polymeric material and is environmentally friendly. The lubricant was applied to the surface that comes into contact with the punch. When processing polymeric materials by forming, the phenomenon of self-heating occurs. In the case of single-point incremental forming, this is more pronounced because the punch has a complex trajectory that leads to greater friction with the polymeric sheet. By ensuring the lowest possible roughness of the punch (Ra = 0.8 μm), proper lubrication, and a larger vertical step (s = 1 mm), we ensured that the part temperature did not exceed 64 °C in the case of PA 6.6 and 56.3 °C in the case of PEHD.
The type of finite element considered is a thin shell element, suitable for surface discretization. Both the tools (punch, die and blankholder) and the blank were discretized with this type of element. Shell elements have had a number of formulations over the years. The −16 formulation appropriately modifies an existing standard assumed strain element, namely, the type 16 element (fully integrated shell), which is a fully integrated extension of the Belytschko–Lin–Tsay element. In the analyses presented in the paper, the −16 formulation was used, as it leads to an acceptable accuracy under the conditions of a lower running time.
In order to choose the type of material for each part that composes the forming model, the non-deformable solid parts (forming tools) had to be separated from the deformable part (blank). As far as the forming tools are concerned, there was no problem in choosing the type of material because Ls-Dyna R13.1.0 provides the user with a non-deformable type of material for which, in addition to the material properties, any constraints that may be required must also be determined when defining the material. This material model is called Rigid in the program.
Thus, the following parameters were introduced for the die: the longitudinal modulus of elasticity, E = 210,000 MPa, the density ρ = 7.85 × 10⁻⁹ t/mm3 and Poisson’s ratio, ν = 0.3. In addition, since the die is fixed throughout the entire forming process, all six degrees of freedom were cancelled.
While the same material input data were entered for the punch, only the degrees of freedom related to the rotations of the punch were cancelled, thereby allowing for the 3 translational degrees of freedom. There is an issue concerning the cancellation of the rotational degrees of freedom because there are situations where the incremental forming process is carried out on a machining centre or a CNC milling machine, where the punch can rotate around its own axis (Oz axis). In the present paper, where the forming process will be performed on an industrial robot, the punch is unable to rotate around its own axis; therefore, the three rotational degrees of freedom were cancelled.
The material data assigned to the blankholder are the same as for the die and the punch and, with regard to the degrees of freedom, all rotations and translations in the Ox and Oy directions were cancelled, only allowing for the translation in the Oz direction, which is the direction of the holding force.
As for the choice of the material model for the blank, the deformable solid, two models were chosen from the Ls-Dyna R13.1.0 program library, which are recommended in the case of polymeric materials.
Both material 24 and material 89 can be used to simulate the forming process of polymeric materials. Material model 24 is widely used in Ls-Dyna R13.1.0 due to its robust algorithms, computational efficiency, and support for load curve-based input. For material 24, it is necessary to enter, as input data for the plastic zone, the true stress–strain curve from which the elastic component is removed. The hardening slope in the true stress–strain curve must not exceed the initial modulus. Otherwise, it can lead to significant errors in the simulation, especially during repeated loading–unloading. By default, the hardening behaviour is explicitly defined through a user-specified true stress–strain curve, as shown below [22]:
σ = f ε p
where εp represents effective plastic strain.
In material model 89, hardening is not governed by a stress–strain curve but by a rheological framework that combines elastic–viscoelastic–plastic (with hardening) behaviour. For material 89, the true strain–stress curve is introduced without eliminating the elastic component, as in the case of material 24. It uses the tangent stiffness (slope of the true stress–strain curve) at the point of unloading for reloading. The hardening law is embedded in the flow stress formulation.
The flow stress σ for material 89 can be obtained using the following equation [22]:
σ = σ y · 1 + C · ε p n
where σy represents yield stress, C and n are hardening constants, and εp represents effective plastic strain.
If material 24 can also be successfully used with metallic materials, material 89 is dedicated to polymeric materials such as PA or HDPE.
In order to determine which of the two material models produces results that are closer to the ones obtained experimentally, two analyses were performed for each material, one using model 24 and the other using model 89. Therefore, the longitudinal modulus of elasticity, E = 1839 MPa, density, ρ = 0.114 × 10⁻⁹ t/mm3, and Poisson’s ratio, ν = 0.39, were introduced for polyamide, whereas the longitudinal modulus of elasticity, E = 1035.6 MPa, density ρ = 1.036 × 10⁻⁹ t/mm3, and Poisson’s ratio, ν = 0.42 were introduced for polyethylene. These data have been entered for both models, with the difference consisting in the introduction of the stress–strain curve. It should be mentioned that for both types of models the strain rate was not taken into account because the incremental forming process is carried out at low strain rates, at which the influence is reduced.
Both models started from the conventional stress–strain curve obtained from the uniaxial tensile test. Figure 1 and Figure 2 show the conventional curves for the two materials, namely polyamide and polyethylene. Based on the two curves, the true stress and the true strain were calculated, resulting in the true stress–true strain curve. Subsequently, for material model 24, the elastic component of the strain was removed, retaining only the effective plastic strain.
Figure 2 shows the discretized geometric model of the entire assembly that participates in the forming process. A special mention is given to the blank which, following a first discretization, was remeshed in the area subjected to deformation in order to obtain better accuracy in the results.
In the simulated incremental forming process, it is only the punch that moves, while the blankholder constantly presses the blank with a force of 2 kN. Since the desired trajectory is a frustum of cone-type trajectory, a spiral trajectory was chosen, presented in Figure 3.
As can be seen in Figure 3, the trajectory of the punch also includes the areas of “entry” into the material and “exit” from the material, just as in the real, experimental case.
A particularly important issue in dynamic analyses where parts come into contact, as in the present analysis, concerns how the contacts between the parts participating in the forming process are defined. The Ls-Dyna R13.1.0 program provides users with several types of contacts, such as knot-on-knot, knot-on-surface, surface-on-surface, etc. The software manuals recommend using either an ASTS (Automatic Surface-to-Surface) or an FOSS (Forming One-way Surface-to-Surface) contact to simulate plastic deformation operations. When using the ASTS contact, the user must take into account all the thicknesses of the elements that are to be or are in contact at the time the analysis starts. In this type of model, a hypothetical thickness is assigned to all parts that will make contact. Not only is the blank 3 mm thick, but the punch, die, and blankholder are also of the same thickness. Basically, the geometric model is not built on the outer surface of the parts (either the forming tools or the blank) but on their “middle” surfaces, located in the middle of a hypothetical thickness. In the case of the FOSS contact, the reasoning used for the ASTS contact is no longer valid. It is only the blank that is built on the middle fibre, while the forming tools are built on their outer surface. Thus, the distance between the punch and the blank will be g/2 this time, as is the case in reality. The same applies to the other contacts.
Since Ls-Dyna R13.1.0 recommends using the second type of contact, and because of the simplicity of model construction, with no need to perform calculations to develop the geometry of the forming tools, the second type of contact was chosen to simulate the incremental forming process.
In order to be able to simulate any process in the Ls-Dyna R13.1.0 program, it is necessary to determine, on the one hand, the final time of the analysis and, on the other hand, the time increment. To get as close as possible to the real phenomenon, the final time was considered to be 188.5 s, identical to that obtained in the experiments. With regard to the time increment, it is desirable for it to be as large as possible in order to shorten the analysis time. However, this time cannot be lowered below a certain limit value, which in Ls-Dyna is generically set as the time the sound travels through the finite element. For all four analyses, a time increment of Δt = 3 × 10⁻⁶ s was used.

2.2. Experimental Layout

The experimental research was carried out using the Kuka KR210-2 robot (Kuka, Augsburg, Germany), which has the advantage of allowing for the measurement of the strains in the process throughout the entire stroke of the punch.
The trajectory was developed based on the geometric shape of the part (frustum of cone), modelled in Catia and exported in stp format to the SprutCam program. The strain rate was 400 mm/min.
Force measurements during the incremental forming of polymeric materials were conducted using a measurement system comprising a PCB261A13 piezoelectric sensor (Piezotronics, Depew, NY, USA), a CMD600 signal amplifier (Hottinger Brüel & Kjær, Virum, Denmark), and a Quantum X MX840B (Hottinger Brüel & Kjær, Virum, Denmark) data acquisition system integrated with the Catman software V5.0 suite. Strain analysis was performed using the Aramis 2M optical measurement system. The experimental setup used in this study is illustrated in Figure 4.
The Aramis 2M optical system is a non-contact measurement technology capable of capturing strain distribution and material thinning throughout the entire incremental forming process. This is accomplished by first applying a white, matte base coat to the surface area not in contact with the forming tool, followed by—after drying—the application of a contrasting black matte speckle pattern. The use of matte finishes for both coatings is essential to eliminate light reflections that could interfere with optical measurements.
The Aramis 2M optical system is equipped with two Zeiss cameras, each featuring a 50 mm focal length and an adjustable aperture range from f/2.8 to f/11. The system is capable of capturing images at a maximum resolution of 1600 × 1200 pixels. Because the optical measuring system allows for the measurement of volumes of different sizes, depending on the type of calibration and necessity, it has a maximum acquisition rate of 10 images/second. In the present case, where the measurement volume was 90 × 120 × 40 mm3, the acquisition rate was 1 image/s, which was not a drawback, because the incremental forming process is slow, with times of up to 250–300 s. The Aramis 2M software processes the displacement of individual speckle pattern points on the specimen surface, converting these displacements into strain values and thickness reductions based on the assumption of the law of constant volume. The system enables the measurement of strain in the X and Y directions, major and minor strains, shear angle, and thickness reduction.

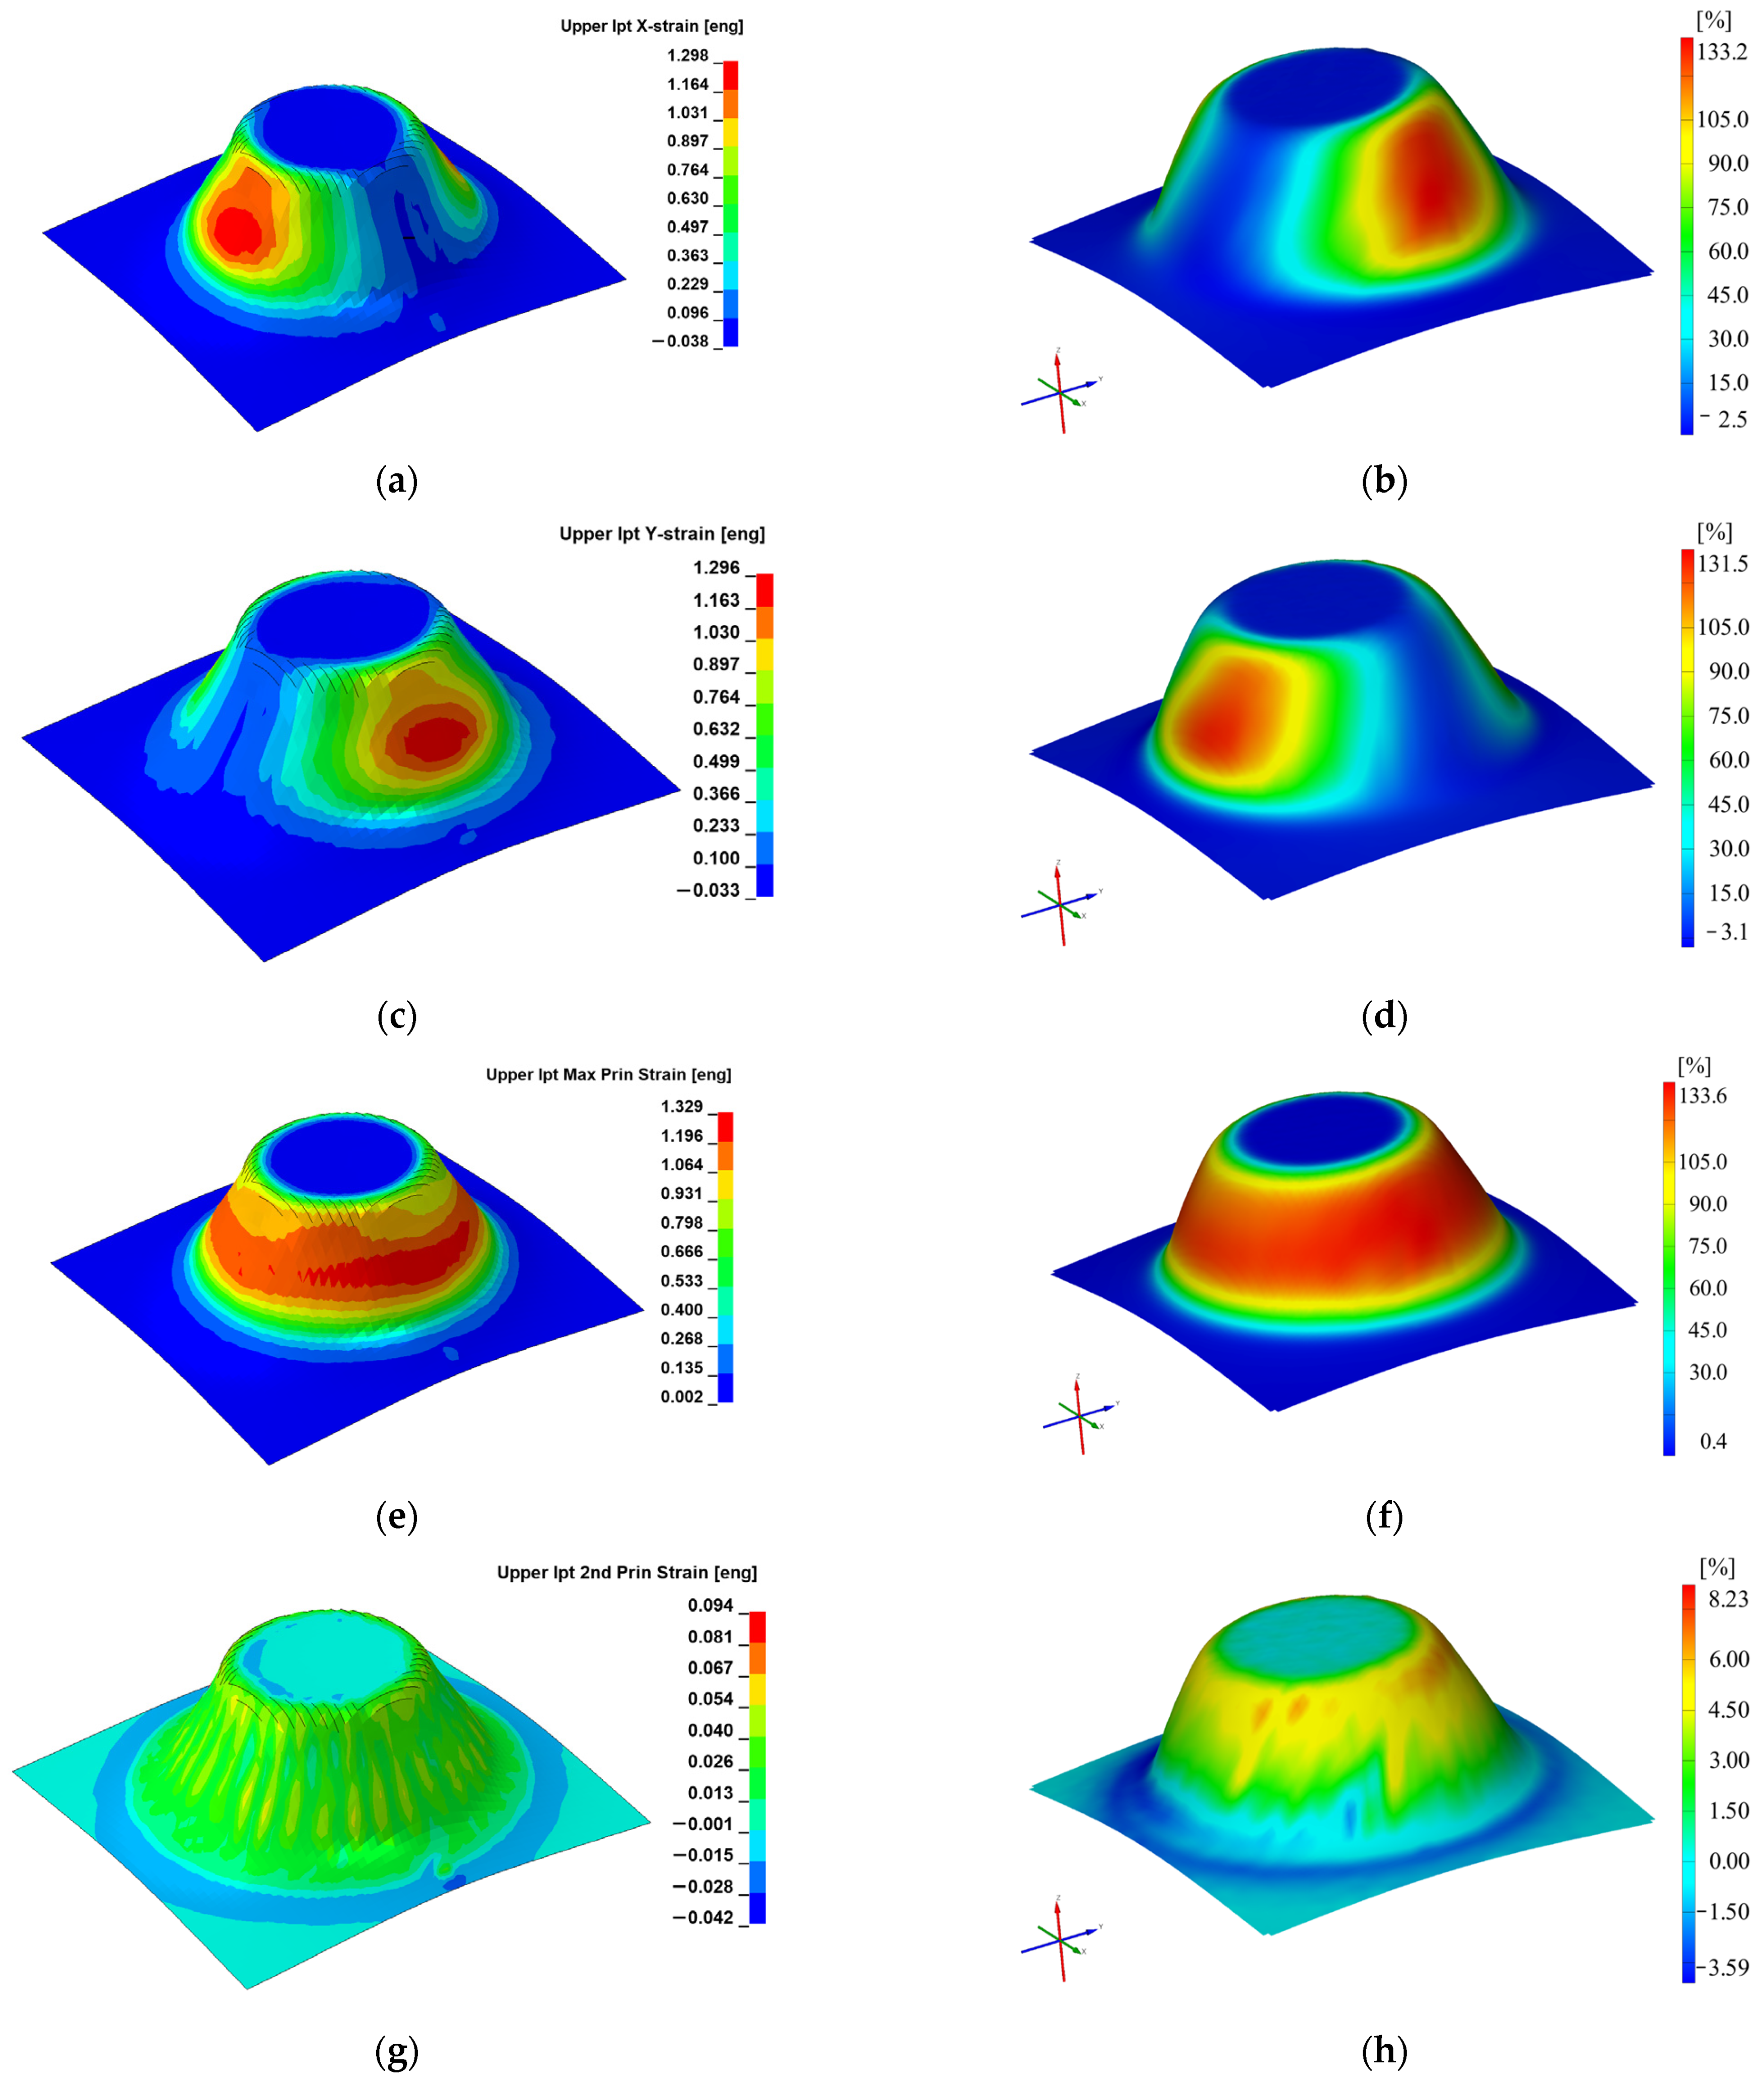
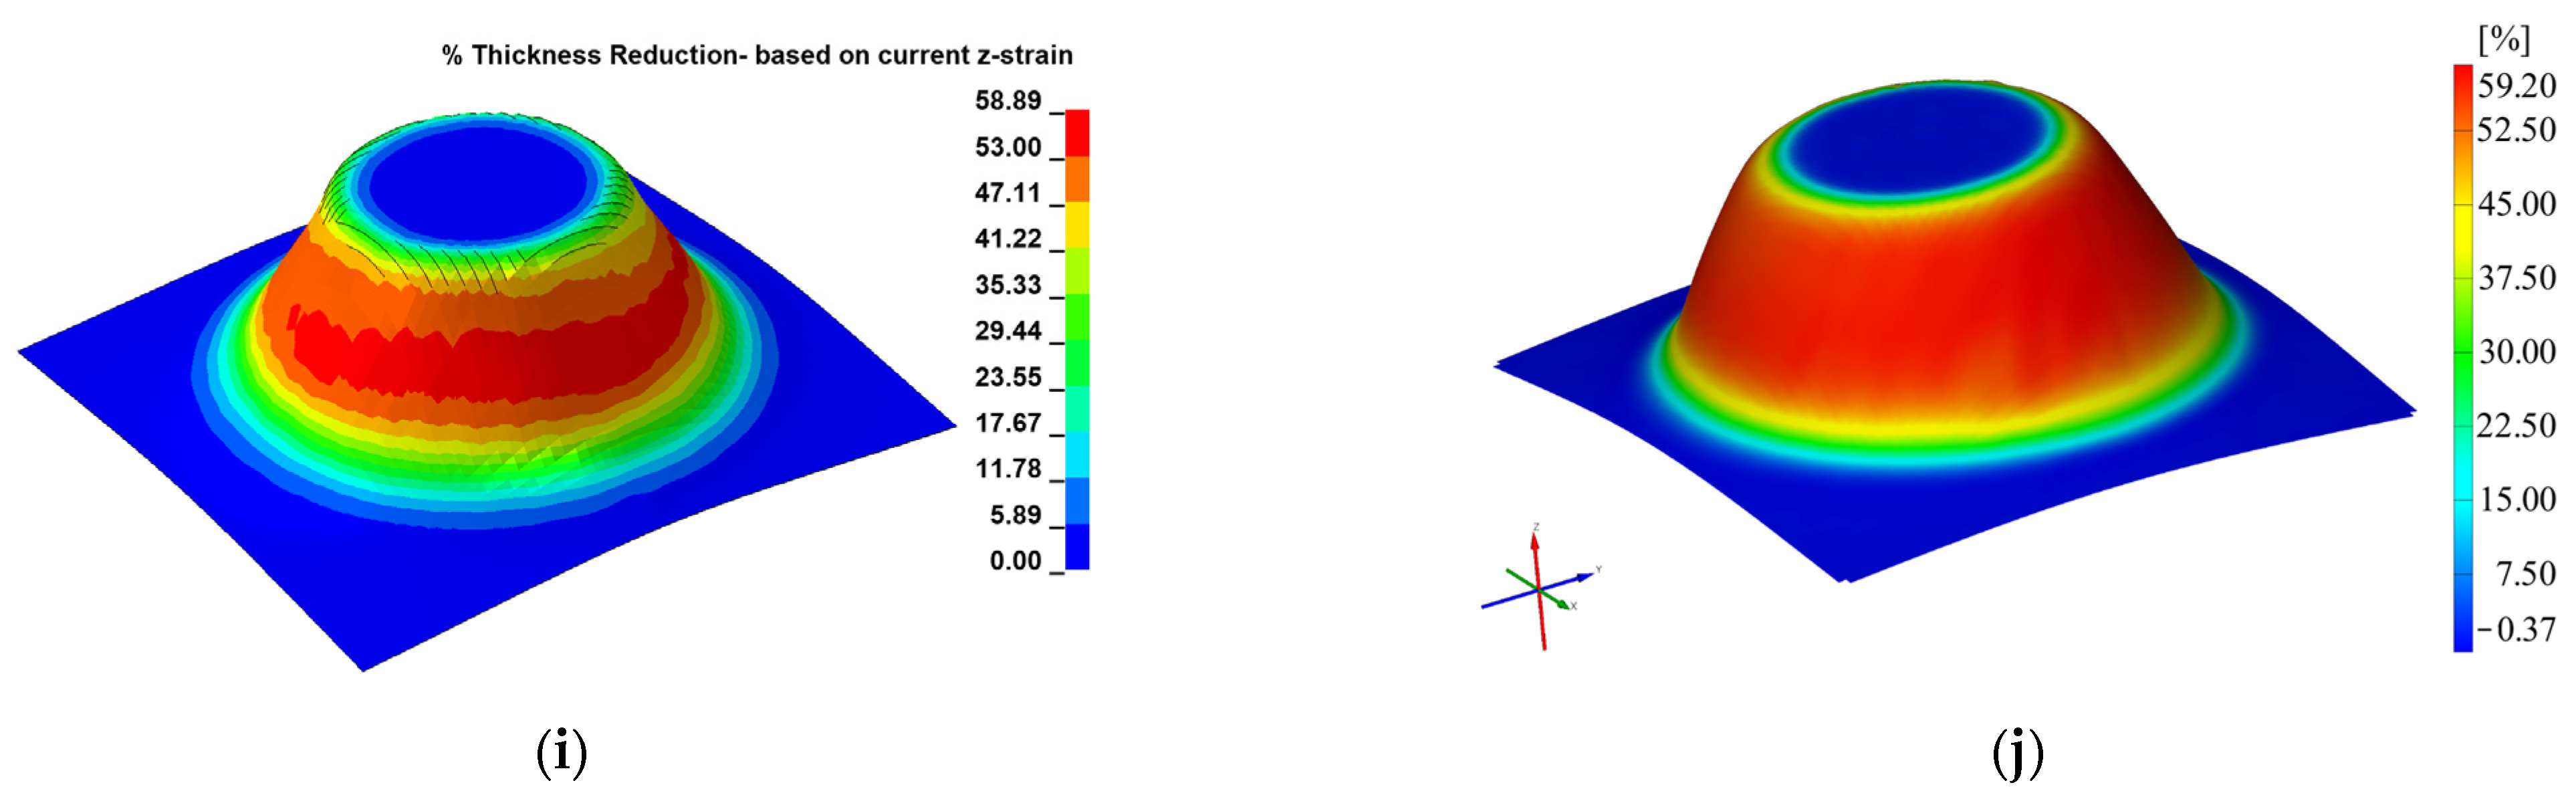
3. Results and Discussion

Given the fact that four analyses were performed, two for each type of material, with the two material definition options presented above, the results obtained experimentally were compared with those obtained by the simulation using the finite element method. Figure 5 and Figure 6 show the results obtained for the strains and thickness reduction when using material model 24 for polyamide and material model 89 for polyethylene. For the two figures, the left columns (Figure 5a,c,e,g,i and Figure 6a,c,e,g,i) represent the results of the FEM simulation, while the right columns (Figure 5b,d,f,h,j and Figure 6b,d,f,h,j) represent the experimental results.
A summary of the strain results obtained both experimentally and by simulation is given in Table 1.
All strains are engineering strains, requiring multiplication by 100 for those in the simulation so that they can be compared with the ones obtained experimentally. The figures present the results obtained for the material models for which the results were closer to those obtained experimentally.
An analysis of Figure 5 and Figure 6 shows that, in most cases, the distribution of specific strains and thickness reduction obtained by numerical simulation is very similar to that obtained experimentally. It can be observed that in both numerical and experimental cases, the specific strains εx and εy reach their maximum values on the wall of the frustum of the cone, in the directions of the axes corresponding to their names. The major strain, ε1, is relatively uniformly distributed on the wall of the frustum of the cone in both polyamide and polyethylene. The minor strain, ε2, also reaches its maximum values on the wall of the frustum of the cone, towards its lower base. The thickness reduction has a variation similar to that of the major strain ε1 for both types of materials.
A comparative analysis of the results in Table 1 shows that, with the exception of the minor strain ε2, which has small values compared to the major strain, for all other types of strains and thickness reduction, material 24 gives results closer to the experimental values than material 89 for polyamide, while model 89 gives better results than model 24 for polyethylene.
In many cases of sheet forming processes (such as deep drawing process), it is well known that ε1 > ε2, but the strain state in single-point incremental forming is different. Single-point incremental forming process is a localized plastic forming process because the tool moves incrementally, forming the part in small steps. Usually, the punch follows a helical path and its movement causes compression or less elongation in the direction of motion (ε1) and more stretching in the circumferential direction (ε2) and therefore ε2 can exceed ε1.
Material 24 for polyamide gives the following differences: 2.55% for the specific strain εx, 1.44% for the specific strain εy, 0.52% for the major strain ε1, 14.7% for the minor strain ε2, and 0.52% for the relative thickness reduction, as presented in Table 2. Material 89 for polyamide gives the following differences: 4.21% for the specific strain εx, 2.74% for the specific strain εy, 2.84% for the major strain ε1, 15.55% for the minor strain ε2, and 2.99% for the thickness reduction.
The differences given by material 24 for polyethylene are 4.63% for the specific strain εx, 1.38% for the specific strain εy, 4.63% for the major strain ε1, 6.58% for the minor strain ε2, and 4.52% for the relative thickness reduction. The differences given by material 89 for polyethylene are 4.21% for the specific strain εx, 1.85% for the specific strain εy, 1.59% for the major strain ε1, 9.29% for the minor strain ε2, and 3.27% for the thickness reduction.
The analysis of the results shows that in all cases the largest difference between the data obtained experimentally and the data obtained by simulation occurs for the minor strain ε2. While 15.55% seems high, a closer look reveals that there is only a 1.28% difference in absolute value between the simulation and the experiment. Considering all these results, a good correlation is found between the experimental and theoretical results with regard to the strains.
Figure 7 and Figure 8 show the variation graphs of the forces in the forming process obtained by simulation and experiment for polyamide and polyethylene with material model 89. For the two figures, the left columns (Figure 7a,c,e and Figure 8a,c,e) represent the results of the FEM simulation, while the right columns (Figure 7b,d,f and Figure 8b,d,f) represent the experimental results.
The figures present the results obtained for the simulations using material model 89, for which the results were closer to the ones obtained experimentally. A very close agreement between the curves obtained by simulation and those obtained experimentally in terms of the allure of the curves can be observed from the analysis of the graphs presented. It is worth mentioning that both the simulations and the experiments were performed using the same geometrical data (punch diameter, step, and wall angle of the part).
When examining the graphs of the forces obtained by simulation, it can be seen that, especially in the case of the vertical force Fz, a “noise” is present on the graph. This noise occurs as a result of the loss of contact between the punch and the blank for very short sequences of time. The forces in the incremental forming process are obtained from a file provided by the Ls-Dyna program, called rcforc, which contains the contact forces between the different parts making contact.
The summary of the results obtained both experimentally and by simulation for forces is given in Table 3.
An analysis of the data presented in Table 3 shows that for forces, the values closest to the ones obtained experimentally are given by material 89. In both the numerical simulation and the performed experiments, the maximum values obtained for the forces in polyamide are higher than those obtained for polyethylene.
In contrast to the analysis of strains, in the case of the forces in the process, the values obtained from the simulation are higher than the values obtained experimentally when using both material model 24 and material model 89.
The differences given by material model 24 for polyamide are 4.23% for the Fz force, 4.74% for the Fx force and 4.56% for the Fy force, as presented in Table 4. The differences given by material model 89 for polyamide are 1.83% for the Fz force, 2.24% for the Fx force and 2.54% for the Fy force.
In the case of polyethylene, material model 24 gives differences of 4.78% for the Fz force, 4.68% for the Fx force and 4.30% for the Fy force, while material model 89 gives differences of 2.43% for the Fz force, 2.71% for the Fx force and 2.60% for the Fy force.
According to the analysis of the data presented above, a very good agreement can be observed in this case as well, especially when using material model 89, but also when using material model 24, with a maximum difference between simulation and experiments of 4.78%.
Material 89 outperforms material 24 in predicting forces because it provides a continuous, analytical stress response (no tabular interpolation), which avoids artificial stiffness or “steps”. The decrease in accuracy in predicting specific strain at PA 6.6 is due to the existence of a yield plateau and material 89 uses a simple equation which oversimplifies this curve, especially in the post-yield region. Also, strain prediction accuracy depends on how well the material model can capture strain localization (necking). Material 24’s tabulated form allows it to follow strain softening or local necking onset better than material 89.

4. Conclusions

The analysis of the information presented in this paper leads to the following main conclusions:
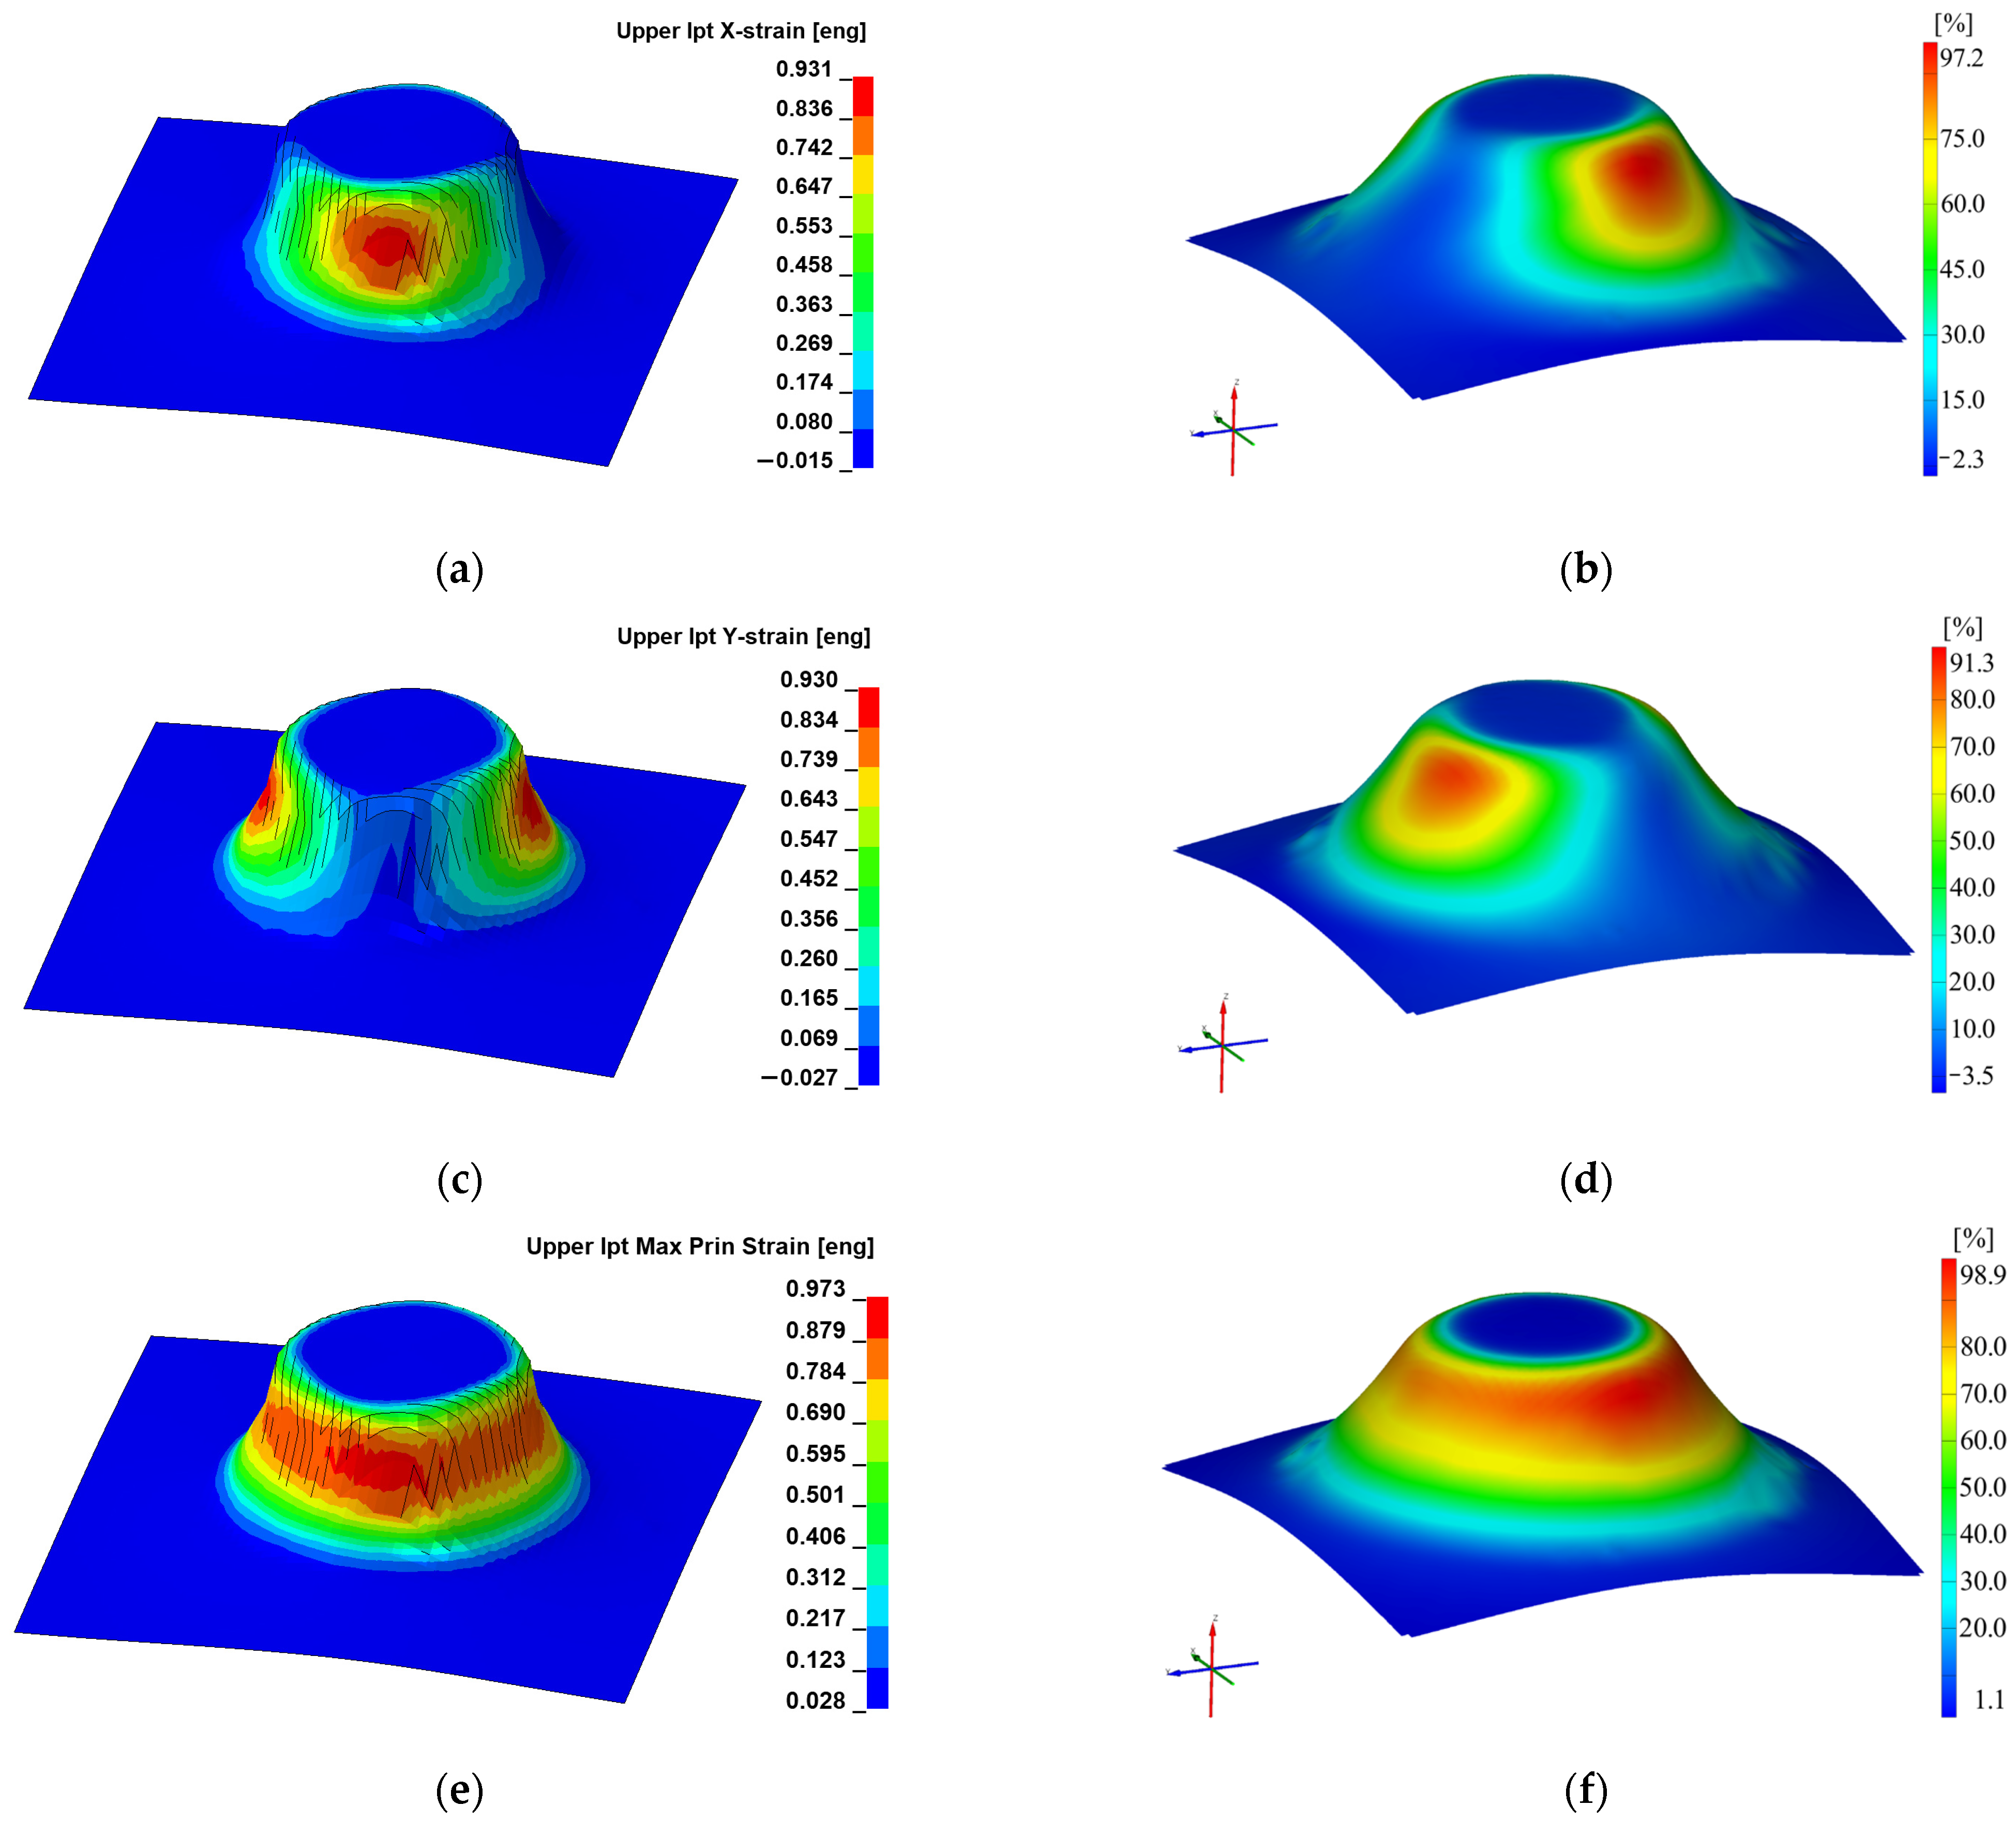
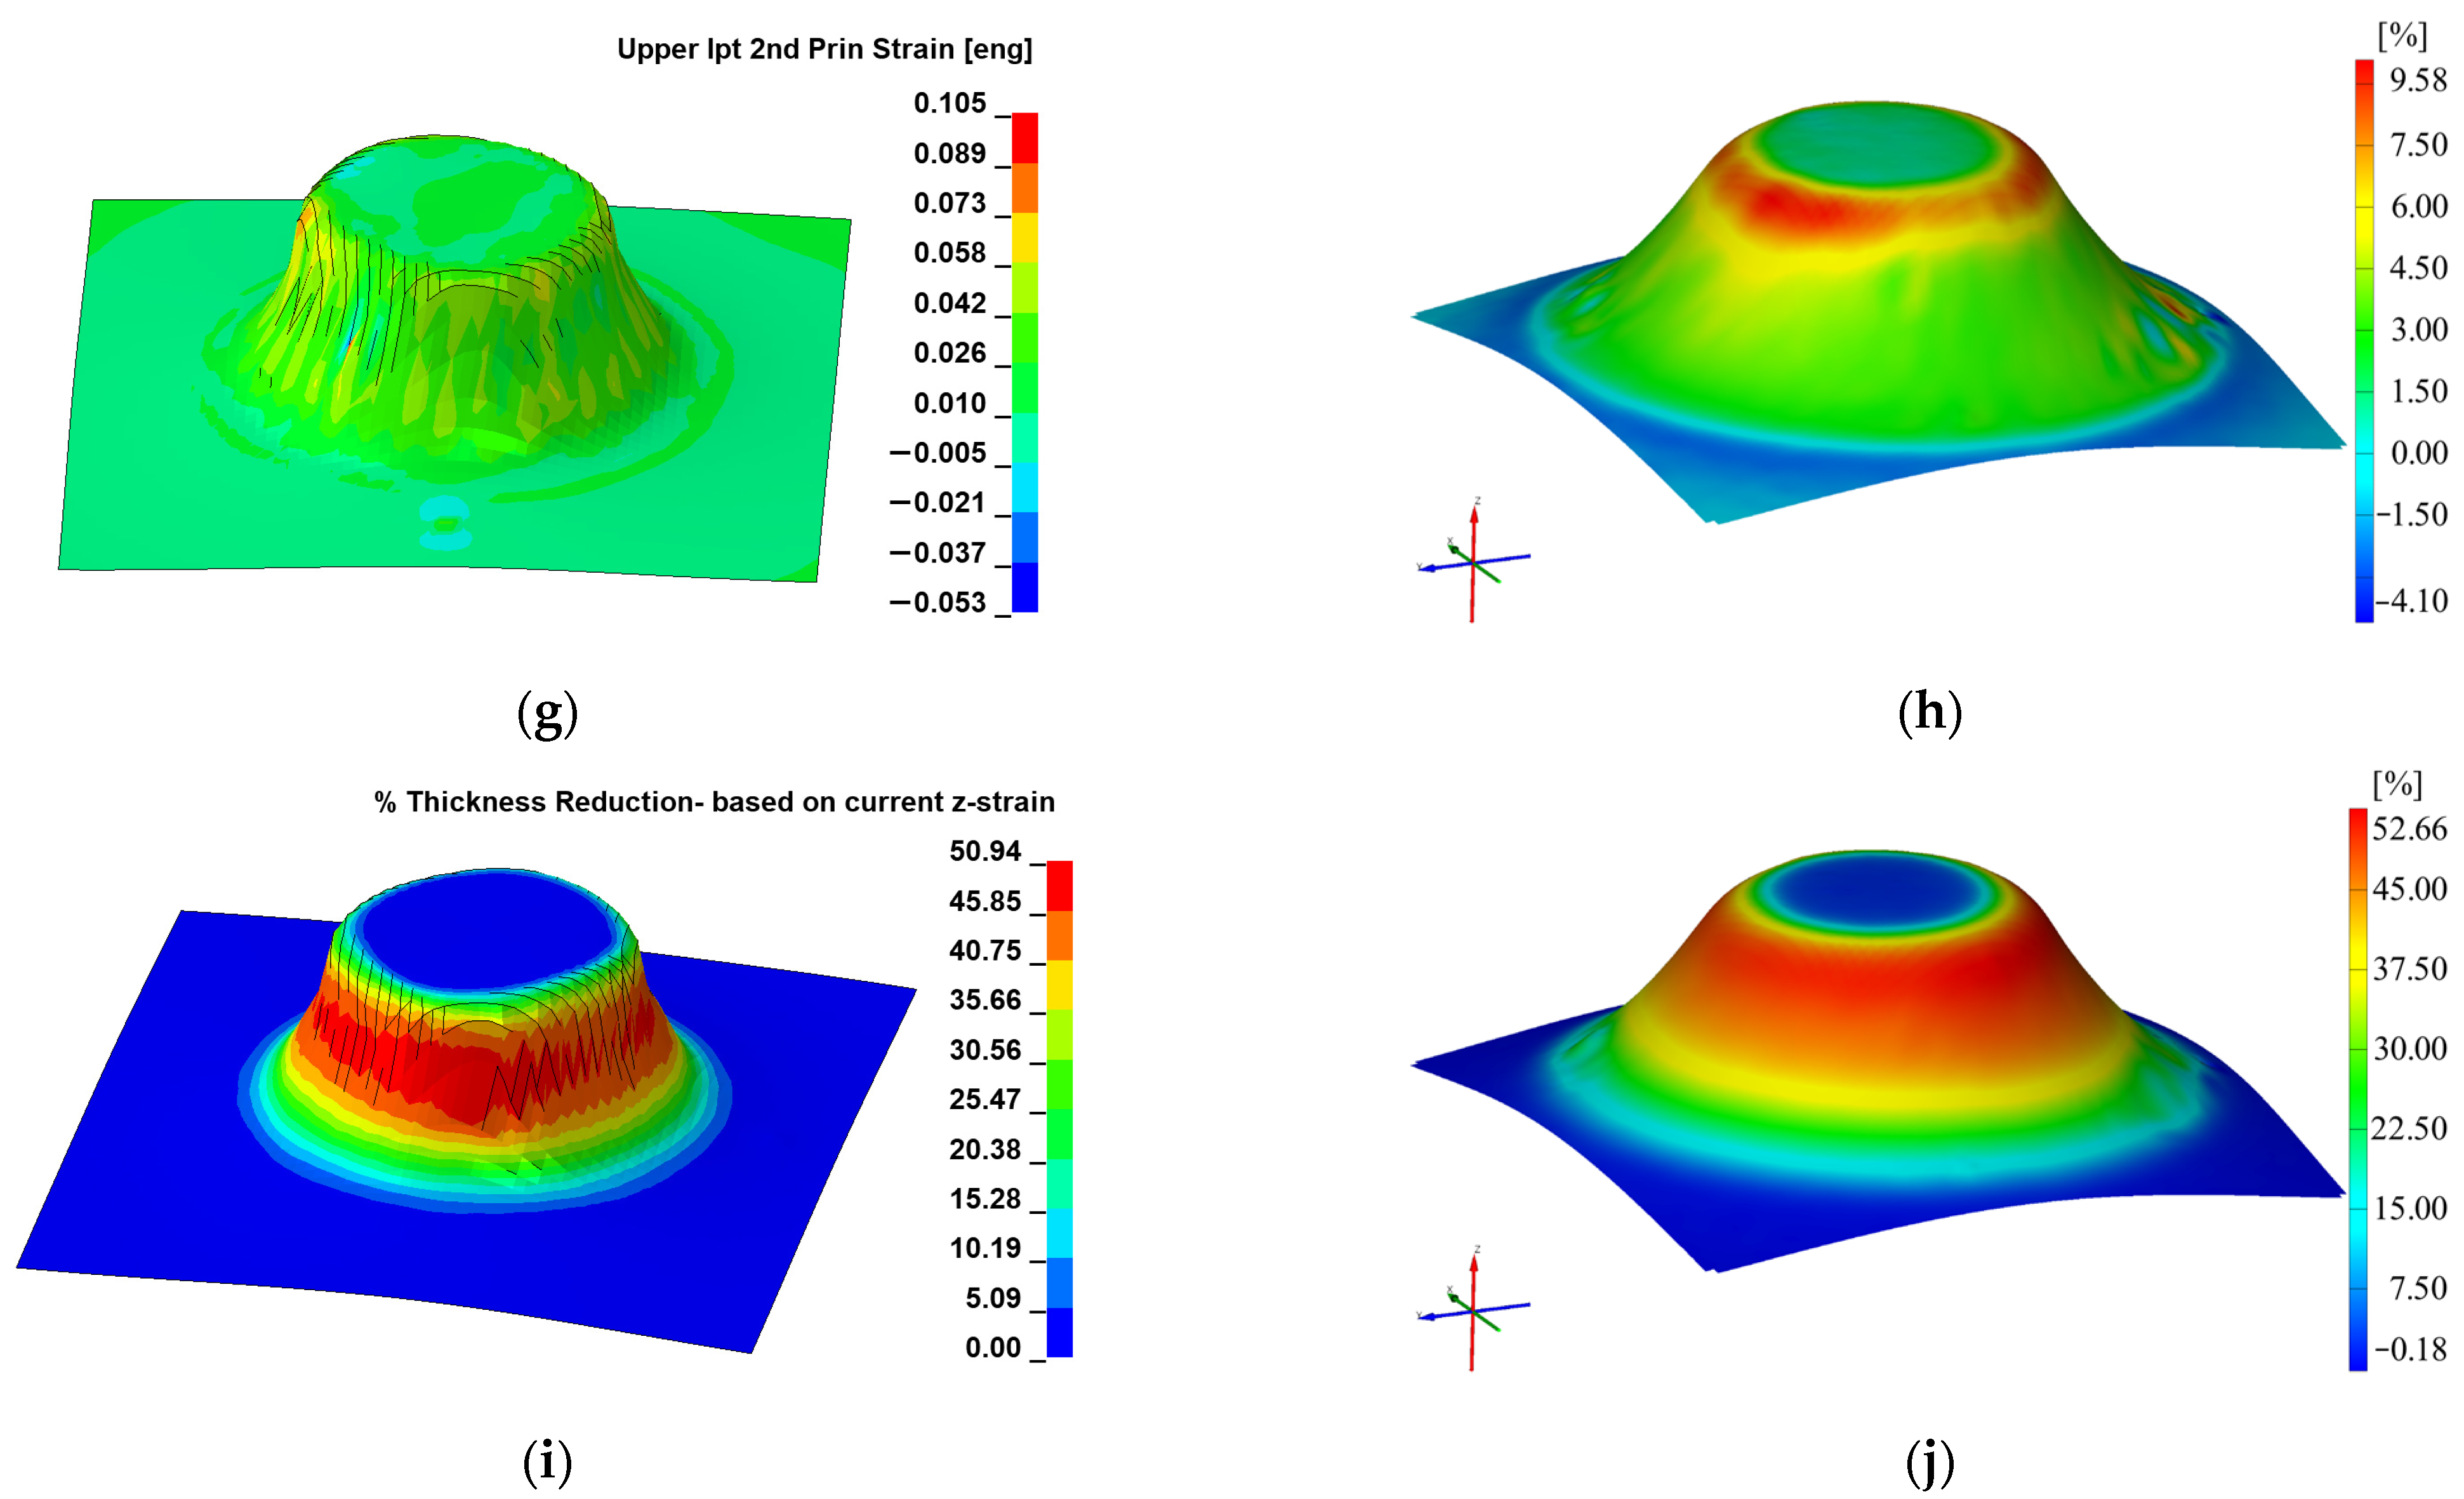
  • Finite element simulation of the incremental forming process for polymeric materials yields results that closely align with experimental data, demonstrating strong agreement in both the distribution and magnitude of strain and thickness reduction.
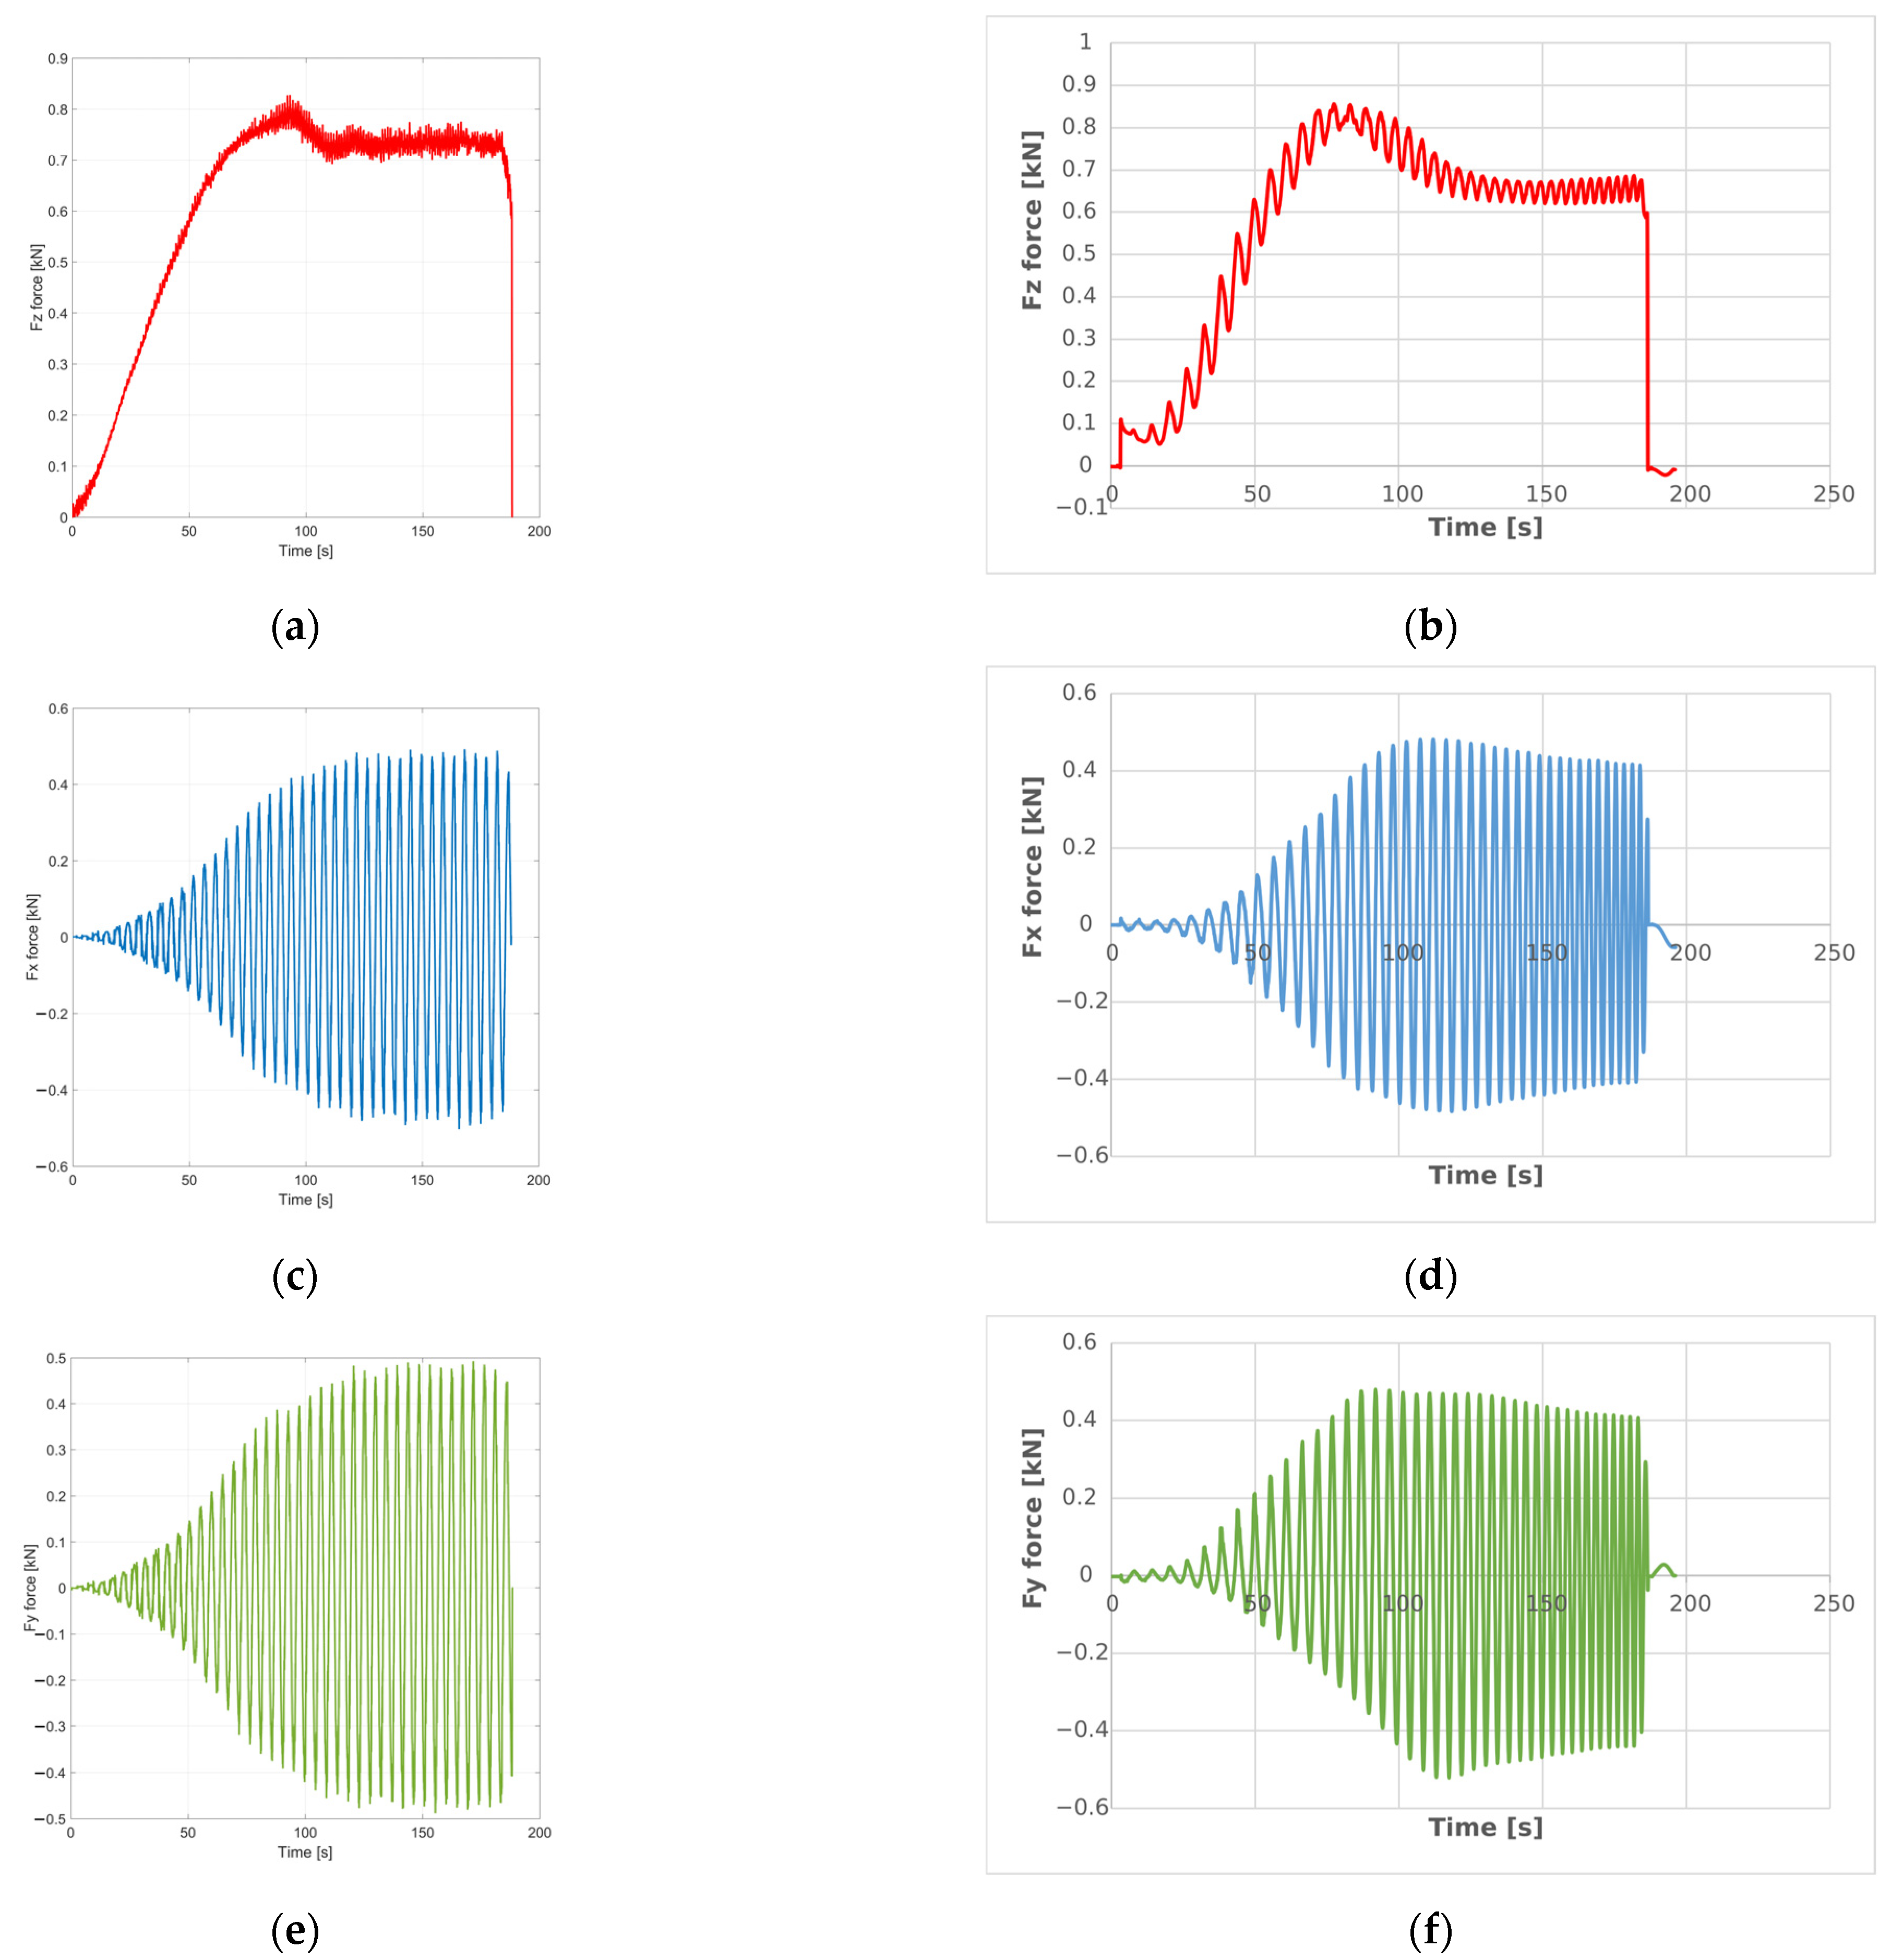
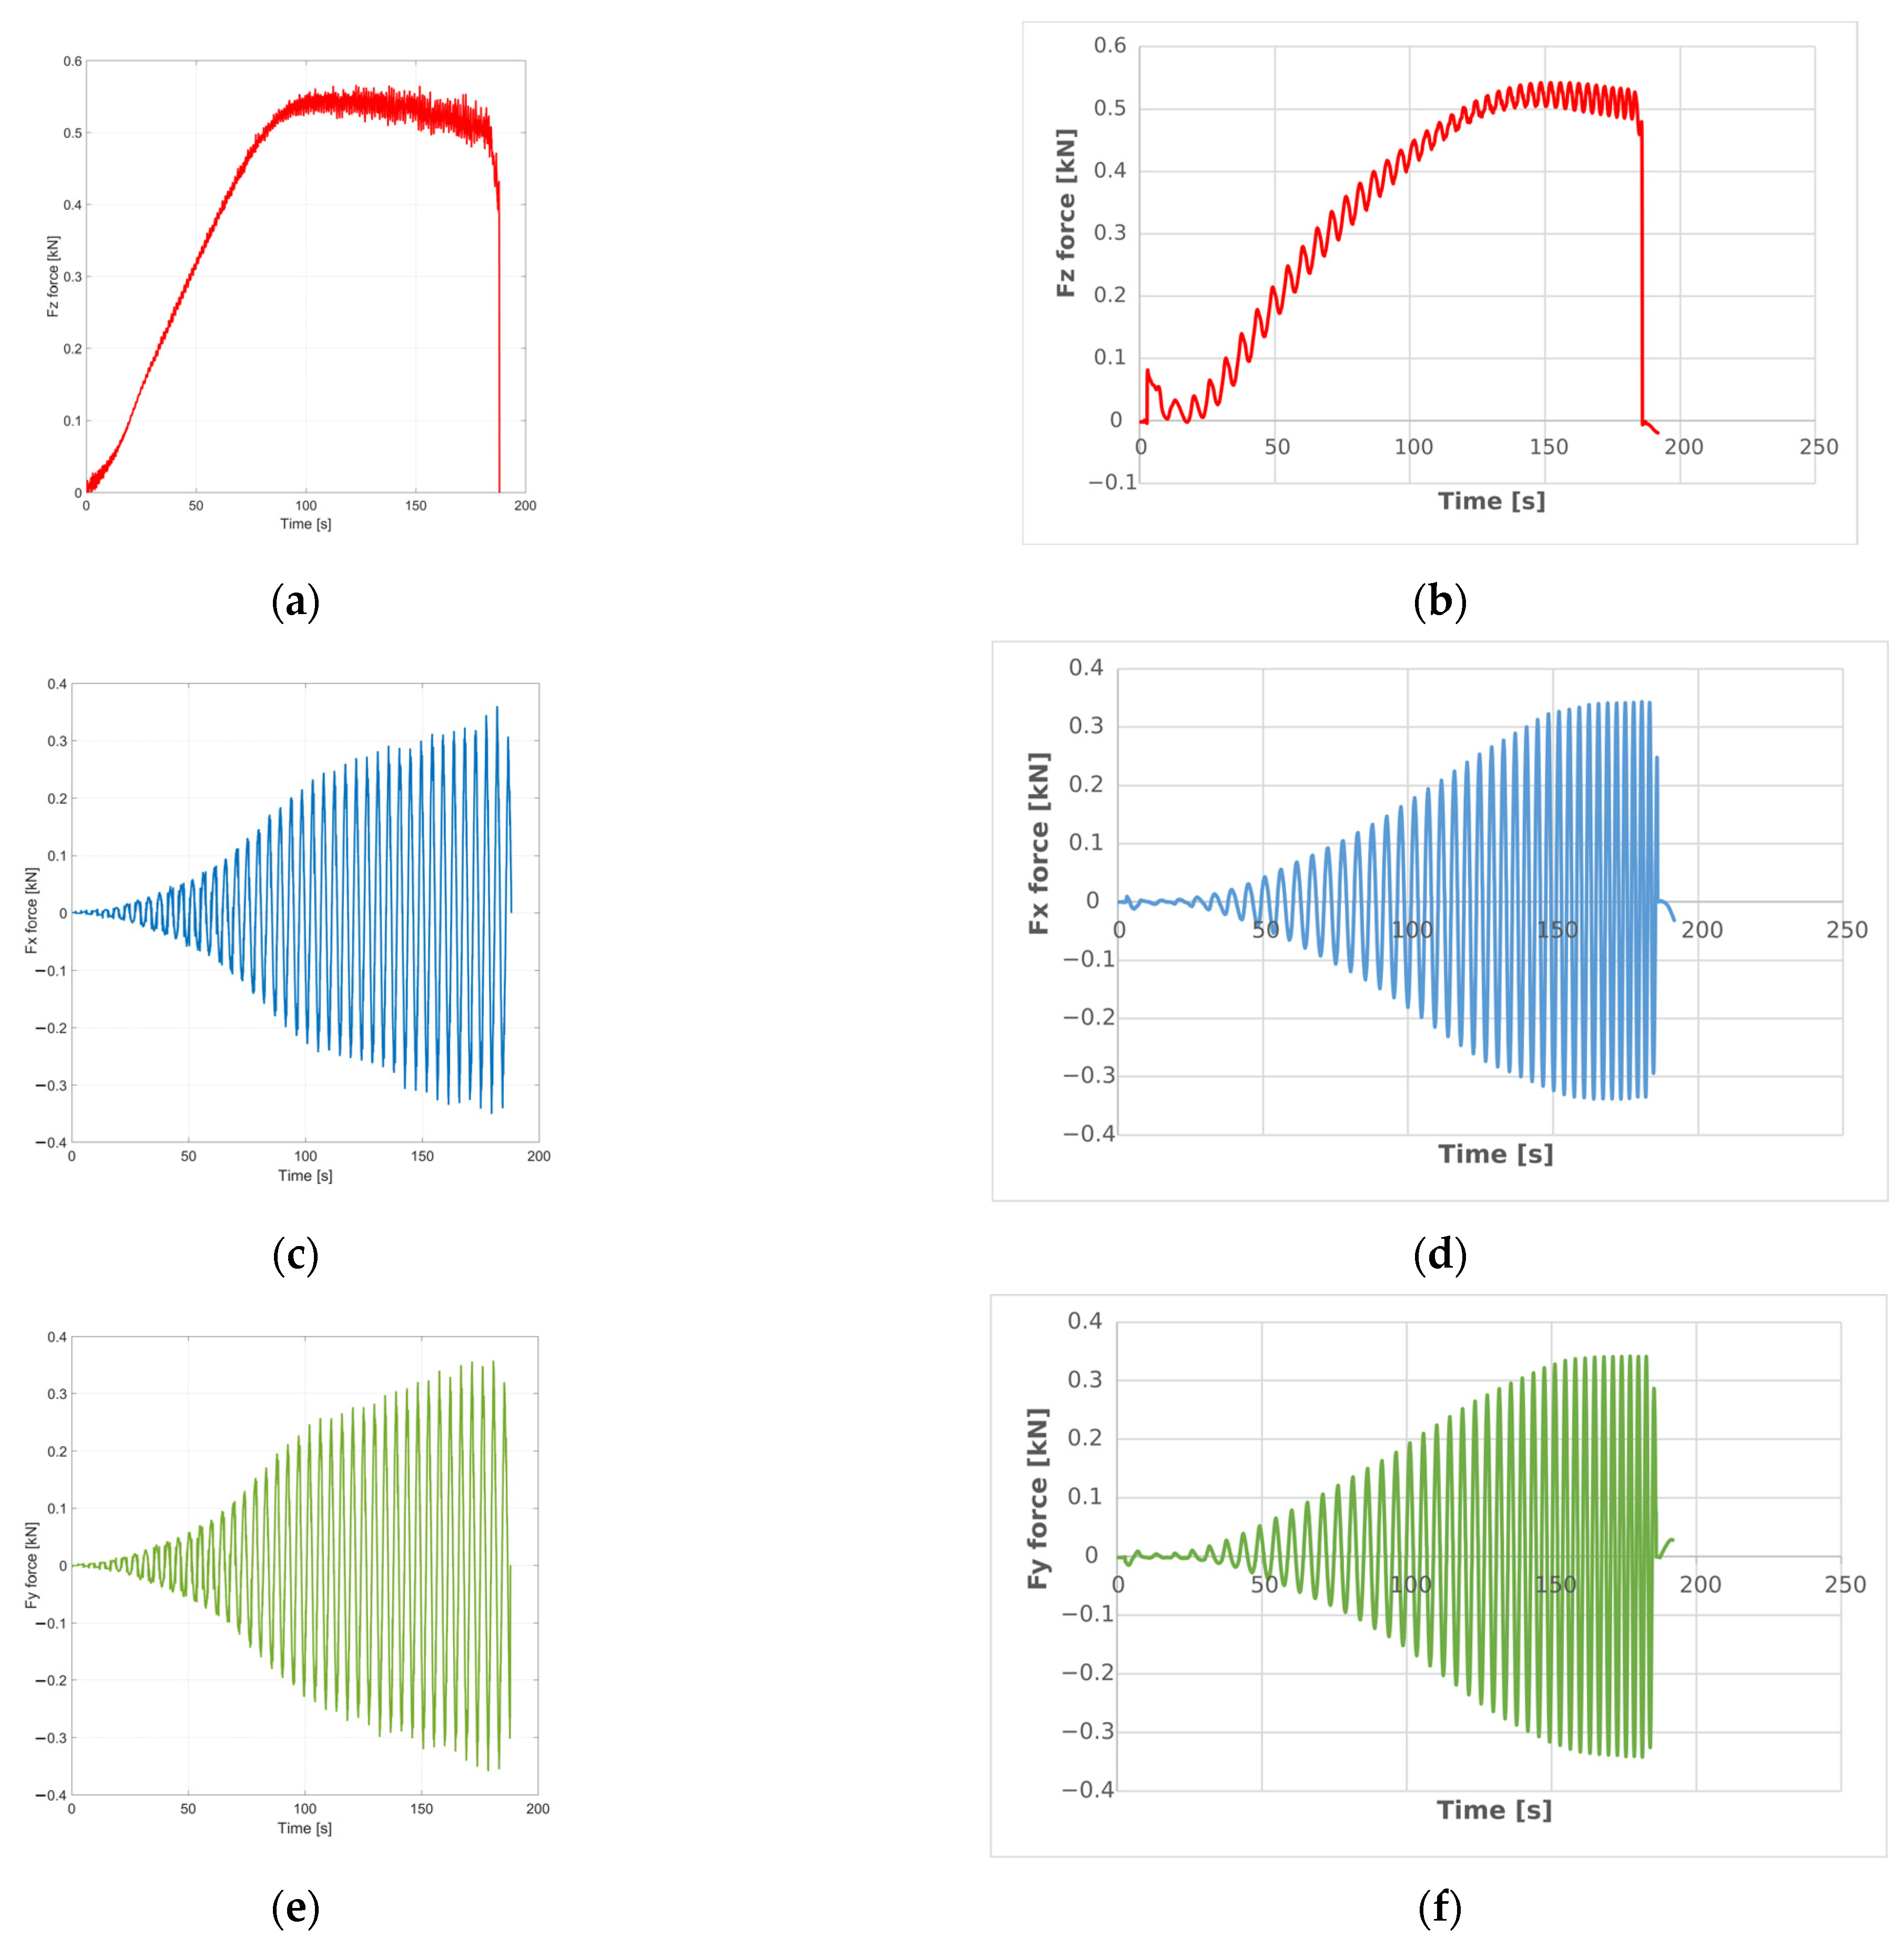
  • The force variation curves obtained through finite element simulation closely match the experimental results, with only minor discrepancies observed between the numerical and experimental values.
  • To achieve higher accuracy in simulating the incremental forming process, material model 24 in Ls-Dyna is recommended for polyamide and model 89 is recommended for polyethylene when predicting specific strains and thickness reduction. However, for more accurate force prediction during the forming process, material model 89 is recommended for both polymer types.
  • When the appropriate material model is applied, the discrepancy between experimental and simulated results for specific strains and thickness reduction (excluding minor strain) remains within a maximum of 2.55% for polyamide and 4.21% for polyethylene.
  • Using the appropriate material model, the maximum deviation between experimental and simulated process forces is 2.54% for polyamide and 2.71% for polyethylene, respectively.
It can be concluded that, despite the computational intensity and sensitivity to various parameters, the simulation of the incremental forming process can yield highly accurate results—provided that optimal input conditions are ensured, including appropriate finite element mesh density, suitable material models, and accurately defined contact interactions.
The inclusion of strain rate effects can lead to an improvement in the quality of the results in most FEM simulations of forming processes. We did not take this effect into account because the single-point incremental forming process is a slow, quasi-static process, especially if an industrial robot is used, as in our case.
The vast majority of other studies regarding FEM simulation of the behaviour of polymeric materials during single-point incremental forming refer only to the analysis of the results obtained and their comparison with experimental results. In contrast, the study presented in this paper is the first to constitute a practical tool for choosing the closest material model for two types of polymeric materials (PA 6.6 and PEHD) depending on the accuracy of simulations related to forces or strains.
In future research, we will aim to perform FEM simulations using material models with viscoelastic or hyperelastic behaviour to increase the accuracy of the obtained results.

Author Contributions

Conceptualization, N.R., T.T., E.A. and M.O.; methodology, N.R., E.A., S.M.N. and V.O.; software, N.R., S.M.N., M.O. and E.A.; validation, S.M.N., T.T. and V.O.; formal analysis, N.R., E.A. and M.O.; investigation, N.R., M.O., E.A. and V.O.; resources, E.A., M.O., T.T. and S.M.N.; data curation, V.O., T.T. and S.M.N.; writing—original draft preparation, N.R., T.T., S.M.N. and M.O.; writing—review and editing, S.M.N., E.A., T.T.; visualization, N.R., V.O.; supervision, T.T., S.M.N. and V.O.; project administration, E.A. and M.O. All authors have read and agreed to the published version of the manuscript.

Funding

This research received no external funding.

Institutional Review Board Statement

Not applicable.

Informed Consent Statement

Not applicable.

Data Availability Statement

The original contributions presented in this study are included in the article. Further inquiries can be directed to the corresponding author.

Conflicts of Interest

The authors declare no conflicts of interest.

Abbreviations

The following abbreviations are used in this manuscript:
FEMFinite element method
SPIFSingle-point incremental forming
TPIFTwo-point incremental forming
VUMATVectorized user material
ANOVAAnalysis of variance
VBOViscoplasticity based on overstress
PAPolyamide
HDPEHigh-density polyethylene
PCPolycarbonate
PVCPolyvinyl chloride

References

  1. Barimani-Varandi, A.; Nasrabadi, M.K.; Ravan, B.A.; Javadi, M. Rapid prototyping of aircraft canopy based on the incremental forming process. J. Braz. Soc. Mech. Sci. Eng. 2021, 43, 2811. [Google Scholar] [CrossRef]
  2. Bagudanch, I.; García-Romeu, M.L.; Ferrer, I.; Ciurana, J. Customized cranial implant manufactured by incremental sheet forming using a biocompatible polymer. Rapid Prototyp. J. 2018, 24, 120–129. [Google Scholar] [CrossRef]
  3. Diabb Zavala, J.M.; Leija Gutiérrez, H.M.; Segura-Cárdenas, E.; Mamidi, N.; Morales-Avalos, R.; Villela-Castrejón, J.; Elías-Zúñiga, A. Manufacture and mechanical properties of knee implants using SWCNTs/UHMWPE composites. J. Mech. Behav. Biomed. Mater. 2021, 120, 104554. [Google Scholar] [CrossRef] [PubMed]
  4. Hassan, M.; Hussain, G.; Wei, H.; Qadeer, A.; Al Kahtani, M. Progress on single-point incremental forming of polymers. Int. J. Adv. Manuf. Technol. 2021, 114, 1–26. [Google Scholar] [CrossRef]
  5. Durante, M.; Formisano, A.; Lambiase, F. Formability of polycarbonate sheets in single-point incremental forming. Int. J. Adv. Manuf. Technol. 2019, 102, 2049–2062. [Google Scholar] [CrossRef]
  6. Rosca, N.; Trzepiecinski, T.; Oleksik, V. Minimizing the Forces in the Single Point Incremental Forming Process of Polymeric Materials Using Taguchi Design of Experiments and Analysis of Variance. Materials 2022, 15, 6453. [Google Scholar] [CrossRef] [PubMed]
  7. Rosca, N.; Oleksik, M.; Rosca, L.; Avrigean, E.; Trzepiecinski, T.; Najm, S.M.; Oleksik, V. Minimizing the Main Strains and Thickness Reduction in the Single Point Incremental Forming Process of Polyamide and High-Density Polyethylene Sheets. Materials 2023, 16, 1644. [Google Scholar] [CrossRef] [PubMed]
  8. Beşliu, I.; Tamaşag, I.; Slătineanu, L. An Experimental Study on Incremental Forming Process of Polycarbonate Sheets. Macromol. Symp. 2021, 395, 2000282. [Google Scholar] [CrossRef]
  9. Kong, F.; Cha, G.; Yan, A.; Pu, Y. An improvement study on incremental forming resilience of PP plate. Bol. Tec. 2017, 55, 110–115. [Google Scholar]
  10. Jaglan, A.; Dogra, N.; Kumar, A.; Kumar, P. Finite Element Simulation Approach in Incremental Sheet Forming Process. In Handbook of Flexible and Smart Sheet Forming Techniques: Industry 4.0 Approaches; Wiley: Hoboken, NJ, USA, 2023; pp. 129–139. [Google Scholar]
  11. Ibrahim, A.K. A comparative study of simulation models on incremental forming process by using the enhancement tools. Mater. Sci. Forum 2019, 957, 93–102. [Google Scholar]
  12. Conte, R.; Serratore, G.; Ambrogio, G.; Gagliardi, F. Numerical analyses of long fiber–reinforced polymeric sheets processed by Single Point Incremental Forming. Int. J. Adv. Manuf. Technol. 2022, 123, 1203–1214. [Google Scholar] [CrossRef]
  13. Sy, L.V.; Hue, P.T.M. Implement a modified viscoplasticity based on overstress model into numerical simulation of the incremental sheet forming process. Lect. Notes Electr. Eng. 2017, 415, 23–33. [Google Scholar]
  14. Xu, P.; Li, X.; Feng, F.; Li, X.; Yang, Y. Experimental and numerical studies on two-point incremental forming of woven fabric composite sheet. J. Manuf. Process. 2023, 85, 205–215. [Google Scholar] [CrossRef]
  15. Rai, S.; Kumar, R.; Nirala, H.K.; Francis, K.; Agrawal, A. Experimental and simulation study of single point incremental forming of polycarbonate. ASME Int. Manuf. Sci. Eng. Conf. 2019, 6, MSEC2019-3026. [Google Scholar]
  16. García-Collado, A.; Medina-Sanchez, G.; Gupta, M.K.; Dorado-Vicente, R. Application of the finite element method to the incremental forming of polymer sheets: The thermomechanical coupled model and experimental validations. Polymers 2020, 12, 1715. [Google Scholar] [CrossRef] [PubMed]
  17. Ostasevicius, V.; Eidukynas, D.; Grigaliunas, V.; Jurenas, V.; Paleviciute, I.; Gudauskis, M. Investigation of advanced robotized polymer sheet incremental forming process. Sensors 2021, 21, 7459. [Google Scholar] [CrossRef] [PubMed]
  18. Medina-Sanchez, G.; Garcia-Collado, A.; Carou, D.; Dorado-Vicente, R. Force prediction for incremental forming of polymer sheets. Materials 2018, 11, 1597. [Google Scholar] [CrossRef] [PubMed]
  19. Formisano, A.; Durante, M. A numerical-experimental investigation of the wrinkling defect in incremental forming of thin polycarbonate sheets. Int. Rev. Model. Simul. 2019, 12, 206–211. [Google Scholar] [CrossRef]
  20. Kulkarni, S.S.; Mocko, G.M. A finite element simulation model of convective heat-assisted single-point incremental forming of thermoplastics. Int. J. Adv. Manuf. Technol. 2020, 111, 3305–3317. [Google Scholar] [CrossRef]
  21. Formisano, A.; Boccarusso, L.; Durante, M. Optimization of Single-Point Incremental Forming of Polymer Sheets through FEM. Materials 2023, 16, 451. [Google Scholar] [CrossRef] [PubMed]
  22. Ls-Dyna Keyword User’s Manual, Vol. II, Material Models, Version R13.1.0.0; Livermore Software Technology Corporation: Livermore, CA, USA, 2012.
Figure 1. True stress–strain curve for PA 6.6 (a) and PEHD 1000 (b).
Applsci 15 07094 g001
Figure 2. Discretized model components at the beginning of the simulation of the incremental forming process.
Applsci 15 07094 g002
Figure 3. Spiral, spatial trajectory used in the simulation.
Applsci 15 07094 g003
Figure 4. Experimental layout.
Applsci 15 07094 g004
Figure 5. (a) Strain on x direction for FEM using material 24 for simulating PA 6.6; (b) strain on x direction determined experimentally for PA 6.6; (c) strain on y direction for FEM using material 24 for simulating PA 6.6; (d) strain on y direction determined experimentally for PA 6.6; (e) major strain for FEM using material 24 for simulating PA 6.6; (f) major strain determined experimentally for PA 6.6; (g) minor strain for FEM using material 24 for simulating PA 6.6; (h) minor strain determined experimentally for PA 6.6; (i) thickness reduction for FEM using material 24 for simulating PA 6.6; (j) thickness reduction determined experimentally for PA 6.6.
Applsci 15 07094 g005aApplsci 15 07094 g005b
Figure 6. (a) Strain on x direction for FEM using material 89 for simulating PEHD 1000; (b) strain on x direction determined experimentally for PEHD 1000; (c) strain on y direction for FEM using material 89 for simulating PEHD 1000; (d) strain on y direction determined experimentally for PEHD 1000; (e) major strain for FEM using material 89 for simulating PEHD 1000; (f) major strain determined experimentally for PEHD 1000; (g) minor strain for FEM using material 89 for simulating PEHD 1000; (h) minor strain determined experimentally for PEHD 1000; (i) thickness reduction for FEM using material 89 for simulating PEHD 1000; (j) thickness reduction determined experimentally for PEHD 1000.
Applsci 15 07094 g006aApplsci 15 07094 g006b
Figure 7. (a) Force variation on z direction for FEM using material 89 for simulating PA 6.6; (b) force variation on z direction determined experimentally for PA 6.6; (c) force variation on x direction for FEM using material 89 for simulating PA 6.6; (d) force variation on x direction determined experimentally for PA 6.6; (e) force variation on y direction for FEM using material 89 for simulating PA 6.6; (f) force variation on y direction determined experimentally for PA 6.6.
Applsci 15 07094 g007
Figure 8. (a) Force variation on z direction for FEM using material 89 for simulating PEHD 1000; (b) force variation on z direction determined experimentally for PEHD 1000; (c) force variation on x direction for FEM using material 89 for simulating PEHD 1000; (d) force variation on x direction determined experimentally for PEHD 1000; (e) force variation on y direction for FEM using material 89 for simulating PEHD 1000; (f) force variation on y direction determined experimentally for PEHD 1000.
Applsci 15 07094 g008
Table 1. Results obtained for specific strains and thickness reduction for polyamide and polyethylene.
Material TypeMaterial ModelStrain on x Direction εxStrain on y Direction εyMajor Strain ε1Minor Strain ε2Thickness Reduction
[%][%][%][%][%]
PA24129.80129.60132.909.4458.89
PA89127.30127.90129.809.5157.43
Experimental PA133.20131.50133.608.2359.20
PE2492.7092.5694.3210.2150.28
PE8993.1192.9997.3310.4750.94
Experimental PE97.2091.3098.909.5852.66
Table 2. Specific strain and thickness reduction differences between experimental and simulated values for polyamide and polyethylene.
Material TypeMaterial ModelStrain on x Direction εx
[%]
Strain on y Direction εy
[%]
Major Strain ε1
[%]
Minor Strain ε2
[%]
Thickness Reduction
[%]
PA242.551.440.5214.700.52
894.212.742.8415.552.99
PE244.631.384.636.584.52
894.211.851.599.293.27
Table 3. Results obtained for forces for polyamide and polyethylene.
Material
Type
Material
Model
Fz Force
[kN]
Fx Force
[kN]
Fy Force
[kN]
PA240.910.500.50
PA890.890.490.49
Experimental PA0.870.480.48
PE240.570.360.36
PE890.560.350.35
Experimental PE0.540.340.34
Table 4. Force differences between experimental and simulated values for polyamide and polyethylene.
Material TypeMaterial ModelFz Force
[%]
Fx Force
[%]
Fy Force
[%]
PA244.234.744.56
891.832.242.54
PE244.784.684.30
892.432.712.60
Disclaimer/Publisher’s Note: The statements, opinions and data contained in all publications are solely those of the individual author(s) and contributor(s) and not of MDPI and/or the editor(s). MDPI and/or the editor(s) disclaim responsibility for any injury to people or property resulting from any ideas, methods, instructions or products referred to in the content.

