1. Introduction
Heart rate is a fundamental physiological parameter that reflects the autonomic regulation of the cardiovascular system and serves as a crucial indicator of an organism’s health and metabolic state. In aquatic biology, especially in developmental and environmental physiology, monitoring the heart rate of fish—particularly at early life stages—has emerged as a valuable non-invasive approach to assess stress responses, detect environmental perturbations, and investigate ontogenetic changes [
1,
2,
3,
4]. Transparent fish species, such as Danionella, offer an exceptional opportunity for such research due to their optical transparency, which allows direct visualization of internal organs, including the beating heart, without the need for surgical intervention or complex imaging techniques [
5,
6,
7,
8].
In recent years, the ability to continuously and accurately monitor heart rate in larval fish has become increasingly important for several reasons. First, the larval stage is a critical period in the life cycle of fish, during which rapid morphological and physiological changes occur. Subtle shifts in environmental conditions—such as temperature, pH, or exposure to pollutants—can significantly affect cardiac performance during this stage, potentially leading to developmental abnormalities or increased mortality [
9,
10,
11,
12,
13,
14,
15]. As such, heart rate measurements serve as an early and sensitive biomarker for detecting physiological stress and sublethal toxicological effects [
16,
17,
18,
19,
20,
21,
22]. Second, in the context of comparative physiology and developmental biology, heart rate data provide key insights into the evolution and function of the vertebrate cardiovascular system. Transparent fish models, like Danionella or zebrafish, are widely used in genetics, neurobiology, and pharmacological research. These species allow researchers to correlate physiological readouts such as heart rate with molecular or genetic manipulations, enhancing our understanding of gene function and cardiac regulation. Furthermore, developmental studies often require high-throughput screening methods, and heart rate monitoring is an effective metric for evaluating the impact of genetic mutations, drugs, or environmental exposures.
Traditionally, heart rate in larval fish is monitored using video imaging methods. These techniques involve recording high-frame-rate video of the fish and analyzing changes in pixel intensity within the heart region to detect rhythmic movements associated with cardiac contractions. While this approach is non-invasive and provides accurate results, it typically requires manual pre-processing steps, including the selection and definition of the heart region (the area of interest) in each video. This manual annotation is time-consuming, subjective, and limits scalability, especially in high-throughput experiments. Moreover, many of the existing software solutions for video-based heart rate analysis are commercially available and expensive. Their high cost and complexity can be barriers for small laboratories or educational institutions, and their lack of adaptability may hinder their application across different species or experimental settings.
To overcome these limitations, this study introduces a novel heart rate monitoring system based on the analysis of interframe luminance differences. By measuring frame-to-frame changes in brightness within video sequences of Danionella larvae, our system detects the rhythmic movements of the beating heart of the region of interest. This approach enables semi-automated, low-cost, and accessible heart rate monitoring suitable for a wide range of applications in developmental biology, ecophysiology, and toxicology research.
The aim of this study is to develop and evaluate the feasibility and accuracy of this interframe luminance difference-based method for heart rate monitoring in fish larvae. We test our system using transparent Danionella larvae and compare the heart rate measurements obtained through our method with values reported in previous studies. By validating our system, we demonstrate its potential as a reliable and efficient tool for non-invasive physiological monitoring in aquatic research. The ability to monitor heart rate accurately and continuously at early developmental stages holds significant implications for understanding larval development, environmental adaptation, and stress physiology in fish.
2. Materials and Methods
2.1. Fish and Ethical Considerations
Danionella translucida (National Cerebral and Cardiovascular Center, Osaka, Japan) were raised and maintained as previously described (PMID: 30323353) at the Mie University Zebrafish Research Center. Although this study was purely observational and did not involve any toxicological procedures, it was conducted in accordance with the ethical guidelines for zebrafish toxicological studies established by Mie University. In addition, since fish are explicitly included among the target species in Japan’s national guidelines for animal experimentation, the present study was carried out within the scope of the National Institute for Environmental Studies guidelines.
2.2. Video Acquisition
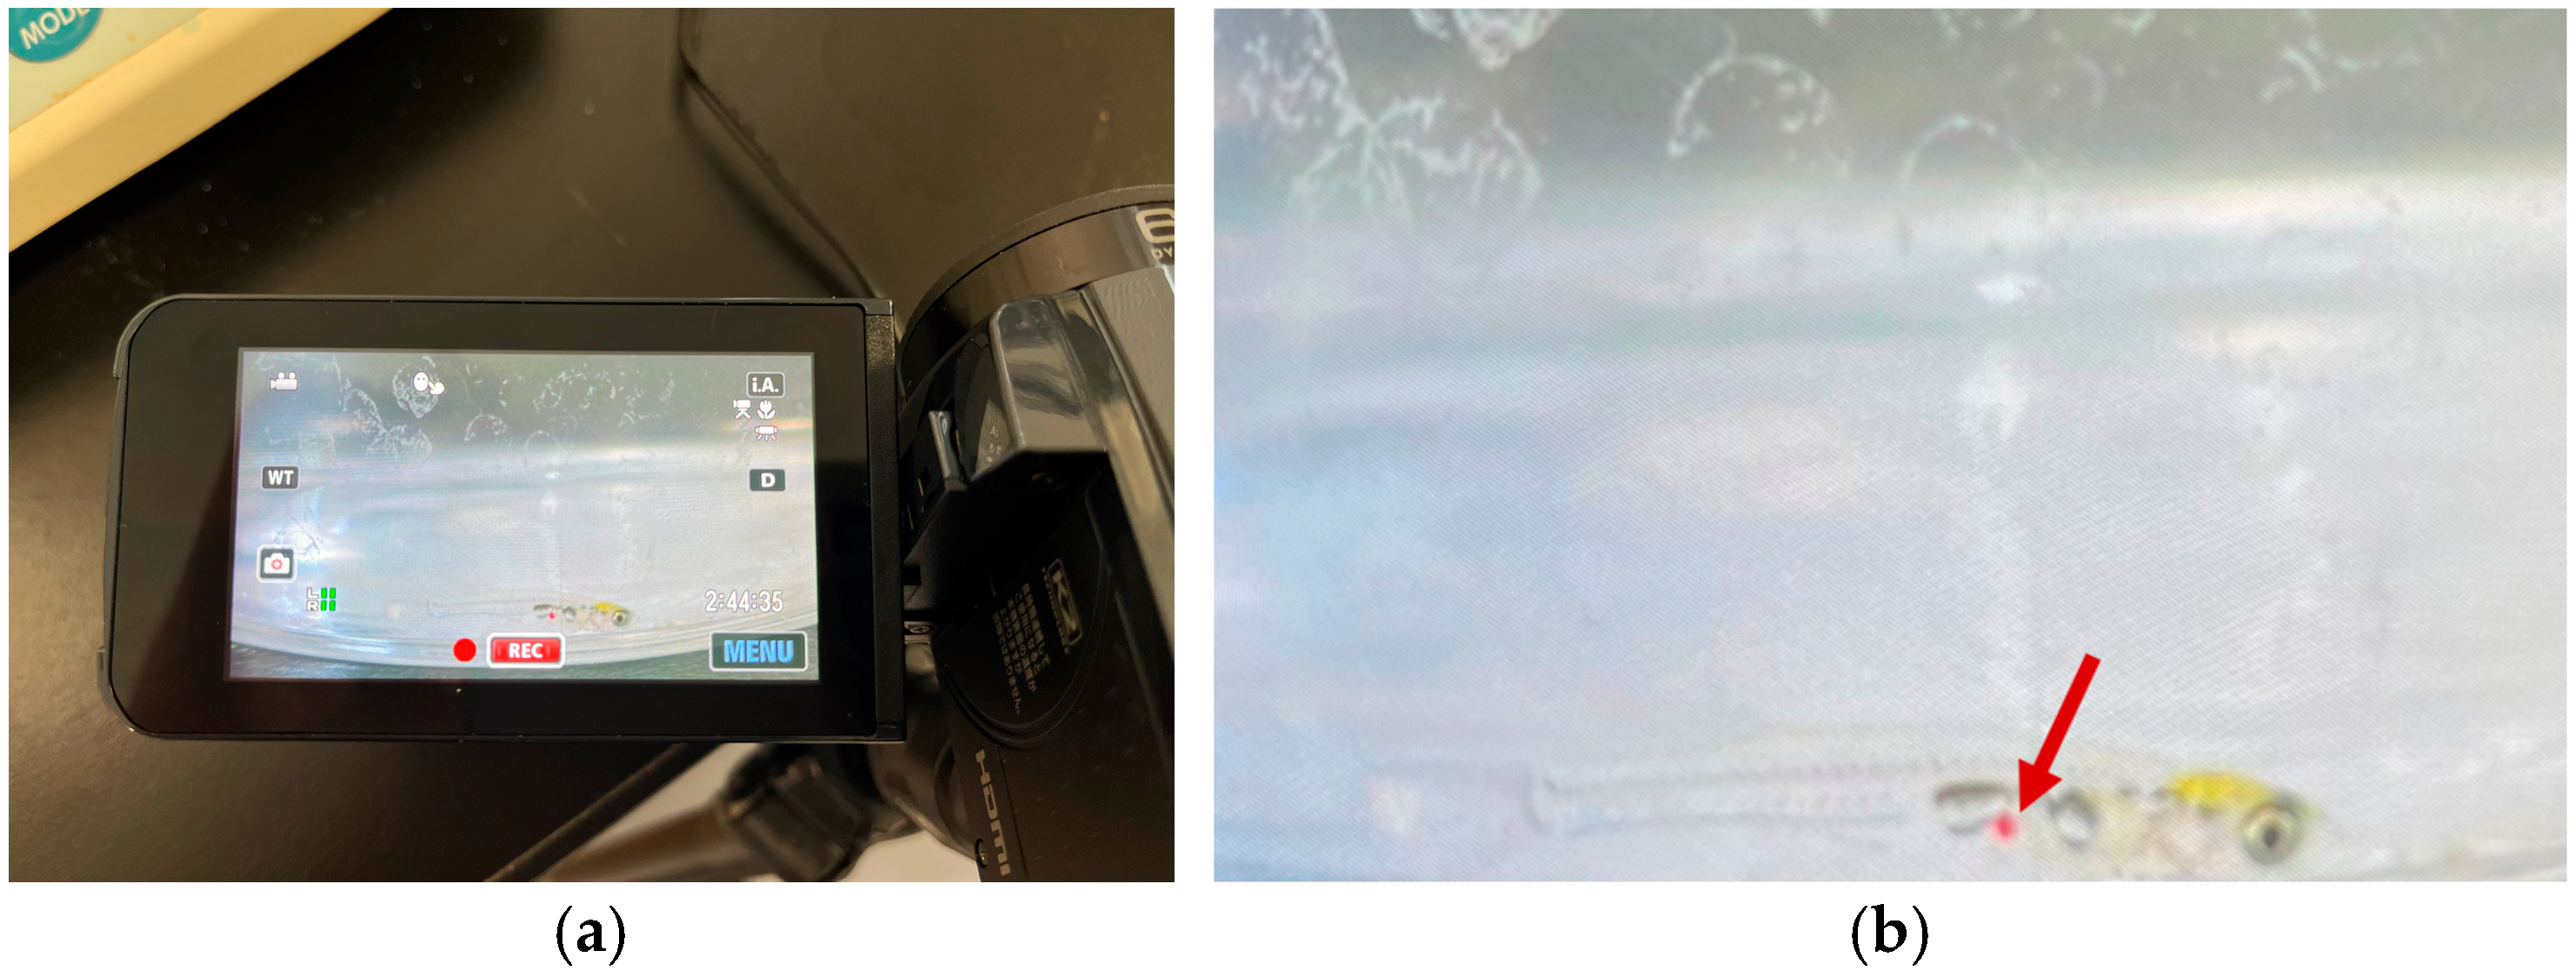
To monitor heart rate activity, 4 individual Danionella larvae were placed in a beaker filled with aquarium water. A waterproof, dustproof, shockproof, and cold-resistant digital video camera (Everio R, JVC Kenwood Corporation, Yokohama, Japan) was positioned beside the beaker (as shown in
Figure 1) to record the larvae through the glass wall of the beaker. The camera captured footage at a resolution of 1920 × 1080 pixels using an interlaced scan (60i) with a variable bit rate (VBR) averaging approximately 24 Mbps. The device supports continuous recording for approximately 4 h and 40 min and measures 60 × 59.5 × 128 mm (
Figure 1, dimensions refer to the physical size of the recording camera. Battery life factors limit recording autonomy to 4 h 40 min). The method involves a frame-by-frame analysis of video recordings. First, the color video is transformed into grayscale. Next, illuminance differences (pixel-wise differences between consecutive frames) are computed. These differences are then thresholded to create a binary motion mask. The number of motion pixels is counted, and a cardiac cycle is detected when this motion count exceeds a predefined threshold.
Due to the optical transparency of Danionella larvae, internal organs, including the heart, are clearly visible. The heart appears reddish under standard lighting conditions owing to circulating blood, which facilitates visual identification and motion-based heartbeat detection. The red arrow indicates the heart. In transparent fish, the beating heart is clearly visible. The heart is a pump that sends blood throughout the body, and here, the beating heart is the subject of observation and research.
Figure 1a shows a Danionella being filmed with a video camera. Depending on the time of day, there is little movement, so the heart rate can be measured visually using a multi-counter (The lack of movement here refers to the movement of fish larvae. The variation in heart rate at different times of the day suggests that heart rate may increase after eating and decrease before sleep).
Figure 1b shows a Danionella filmed in video mode. Due to the extreme optical transparency of Danionella larvae, not only the heart but also skeletal structures such as the vertebral column are clearly visible without dissection or staining. This characteristic facilitates non-invasive observation of physiological and anatomical features.
2.3. ROI Selection and Heart Rate Detection
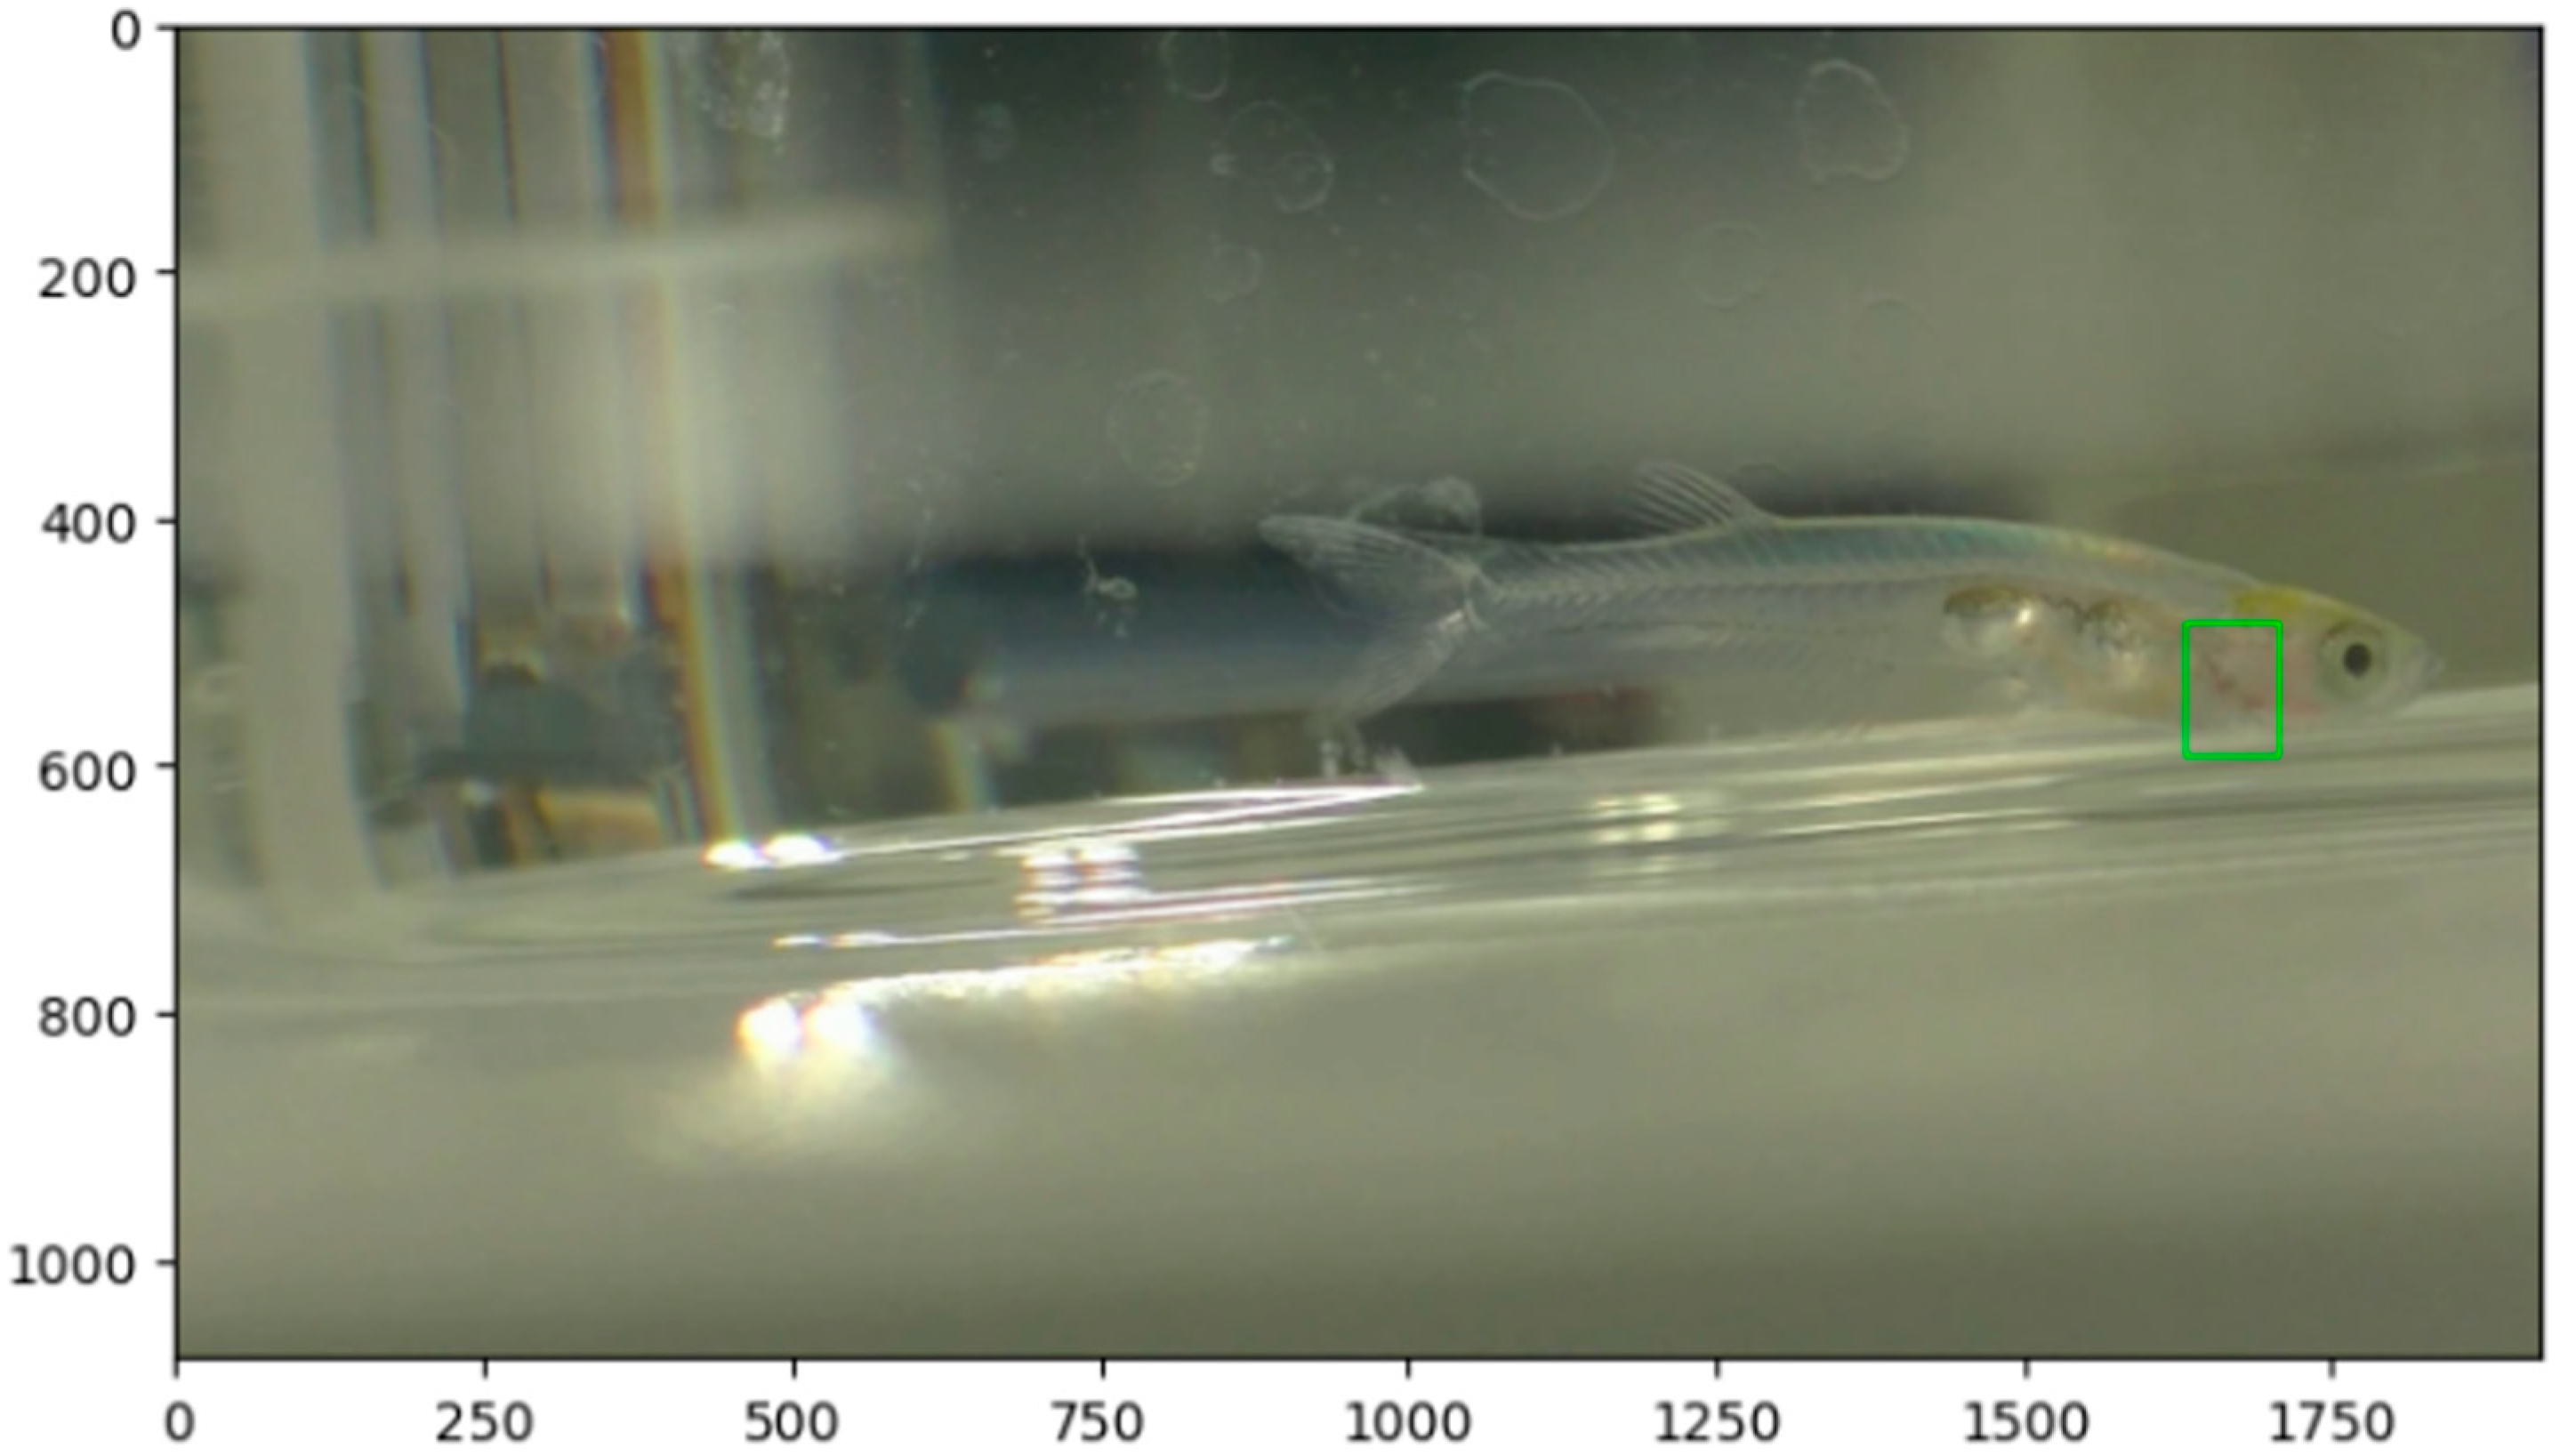
Heart rate estimation was performed by analyzing motion within the heart region of the larvae using a frame-difference-based algorithm. Each recorded video was processed frame-by-frame to extract a fixed region of interest (ROI) around the visible cardiac area, where blood flow can be observed. The ROI was defined based on the stationary positioning of the larvae during filming, and care was taken to ensure consistent placement across frames.
The ROI from each frame was converted to grayscale, and its luminance change was calculated by subtracting the corresponding grayscale values from the preceding frame. To emphasize blood movement, a thresholding process was applied to the resulting difference image: pixels with a luminance change above a predefined threshold were assigned a value of 255 (white), and those below were set to 0 (black), resulting in a binary image. The sum of white pixels was then calculated for each frame, representing the extent of motion in the cardiac region.
When the white pixel count exceeded a certain threshold, it was interpreted as one cardiac contraction. This process was repeated for each frame over the entire video sequence. For final heart rate estimation, the number of beats detected within each 10 s segment was multiplied by six to yield beats per minute (bpm).
Let (
x) be the grayscale intensity of the pixel at location (
x,
y) in the Region of Interest (ROI) at frame
t. The frame difference image (
x) is computed as (1)–(6)
A binary motion mask (
x) is then computed by applying a threshold
θ to
Dt(
x,
y)
The motion magnitude
St for frames
t, representing the total number of pixels above the threshold, is then:
Let
Ts be the threshold for detecting a heartbeat (i.e., a sudden increase in
St). Then, a heartbeat is detected at frame
t if:
This formula means that if the signal St exceeds the threshold Ts, and the previous signal St−1 is below the threshold, the result is 1 (event occurs); otherwise, it is 0. This allows us to count events corresponding to each heartbeat.
The total number of beats
B in a time window of
N frames is:
If the video frame rate is
f, frames per second (fps), and
T is the total duration in seconds (i.e.,
N =
f⋅
T), then the heart rate in beats per minute (bpm) is:
For example, if f is 30 fps, T is 10 s, and B is 12 beats detected, the result will be 72 bpm.
To evaluate heart rate estimation in Danionella translucida larvae, we utilized video recordings (MP4 format,
Video S1) where blood flow in the cardiac region was clearly visible. A fixed region of interest (ROI) was defined manually around the heart area, ensuring it included the main visible vessel and pulsatile blood flow. The ROI size was set to 500 × 500 pixels, adjusted based on the size of the fish, and positioned using fixed screen coordinates to maintain consistency throughout the video.
The larvae remained stationary during the recordings, providing stable conditions for motion detection. The frame rate of the video was 30 frames per second (fps), allowing sufficient temporal resolution to capture cardiac activity (the heart rate of zebrafish varies depending on the environmental temperature, age, and stress level, but has been reported to be approximately 140 to 200 bpm [
1,
2,
4]).
A custom frame-differencing algorithm was implemented using Python (v3.12.7) in the Spyder IDE (v5.5.1) on the Anaconda open data science platform. The algorithm processed the extracted ROI frame-by-frame using the following steps:
Grayscale Conversion: Each ROI frame was converted to grayscale to simplify intensity analysis.
Frame Differencing: The absolute difference between each grayscale frame and its preceding frame was computed using OpenCV’s cv2.absdiff() function, which calculates pixel-wise intensity differences.
Thresholding: A binary threshold was applied to the difference image. Pixels with an intensity difference greater than a defined diff_threshold were assigned a value of 255 (white), while all others were set to 0 (black). This emphasized areas of significant motion, typically corresponding to blood flow during a heartbeat.
White Pixel Summation: The total number of white pixels in the thresholded image was calculated for each frame.
Beat Detection: If the white pixel count exceeded a predefined movement_count threshold, the frame was considered to reflect a cardiac contraction.
This process was repeated for every frame in the video. The number of beats detected in each 10 s interval was multiplied by six to estimate the heart rate in beats per minute (bpm).
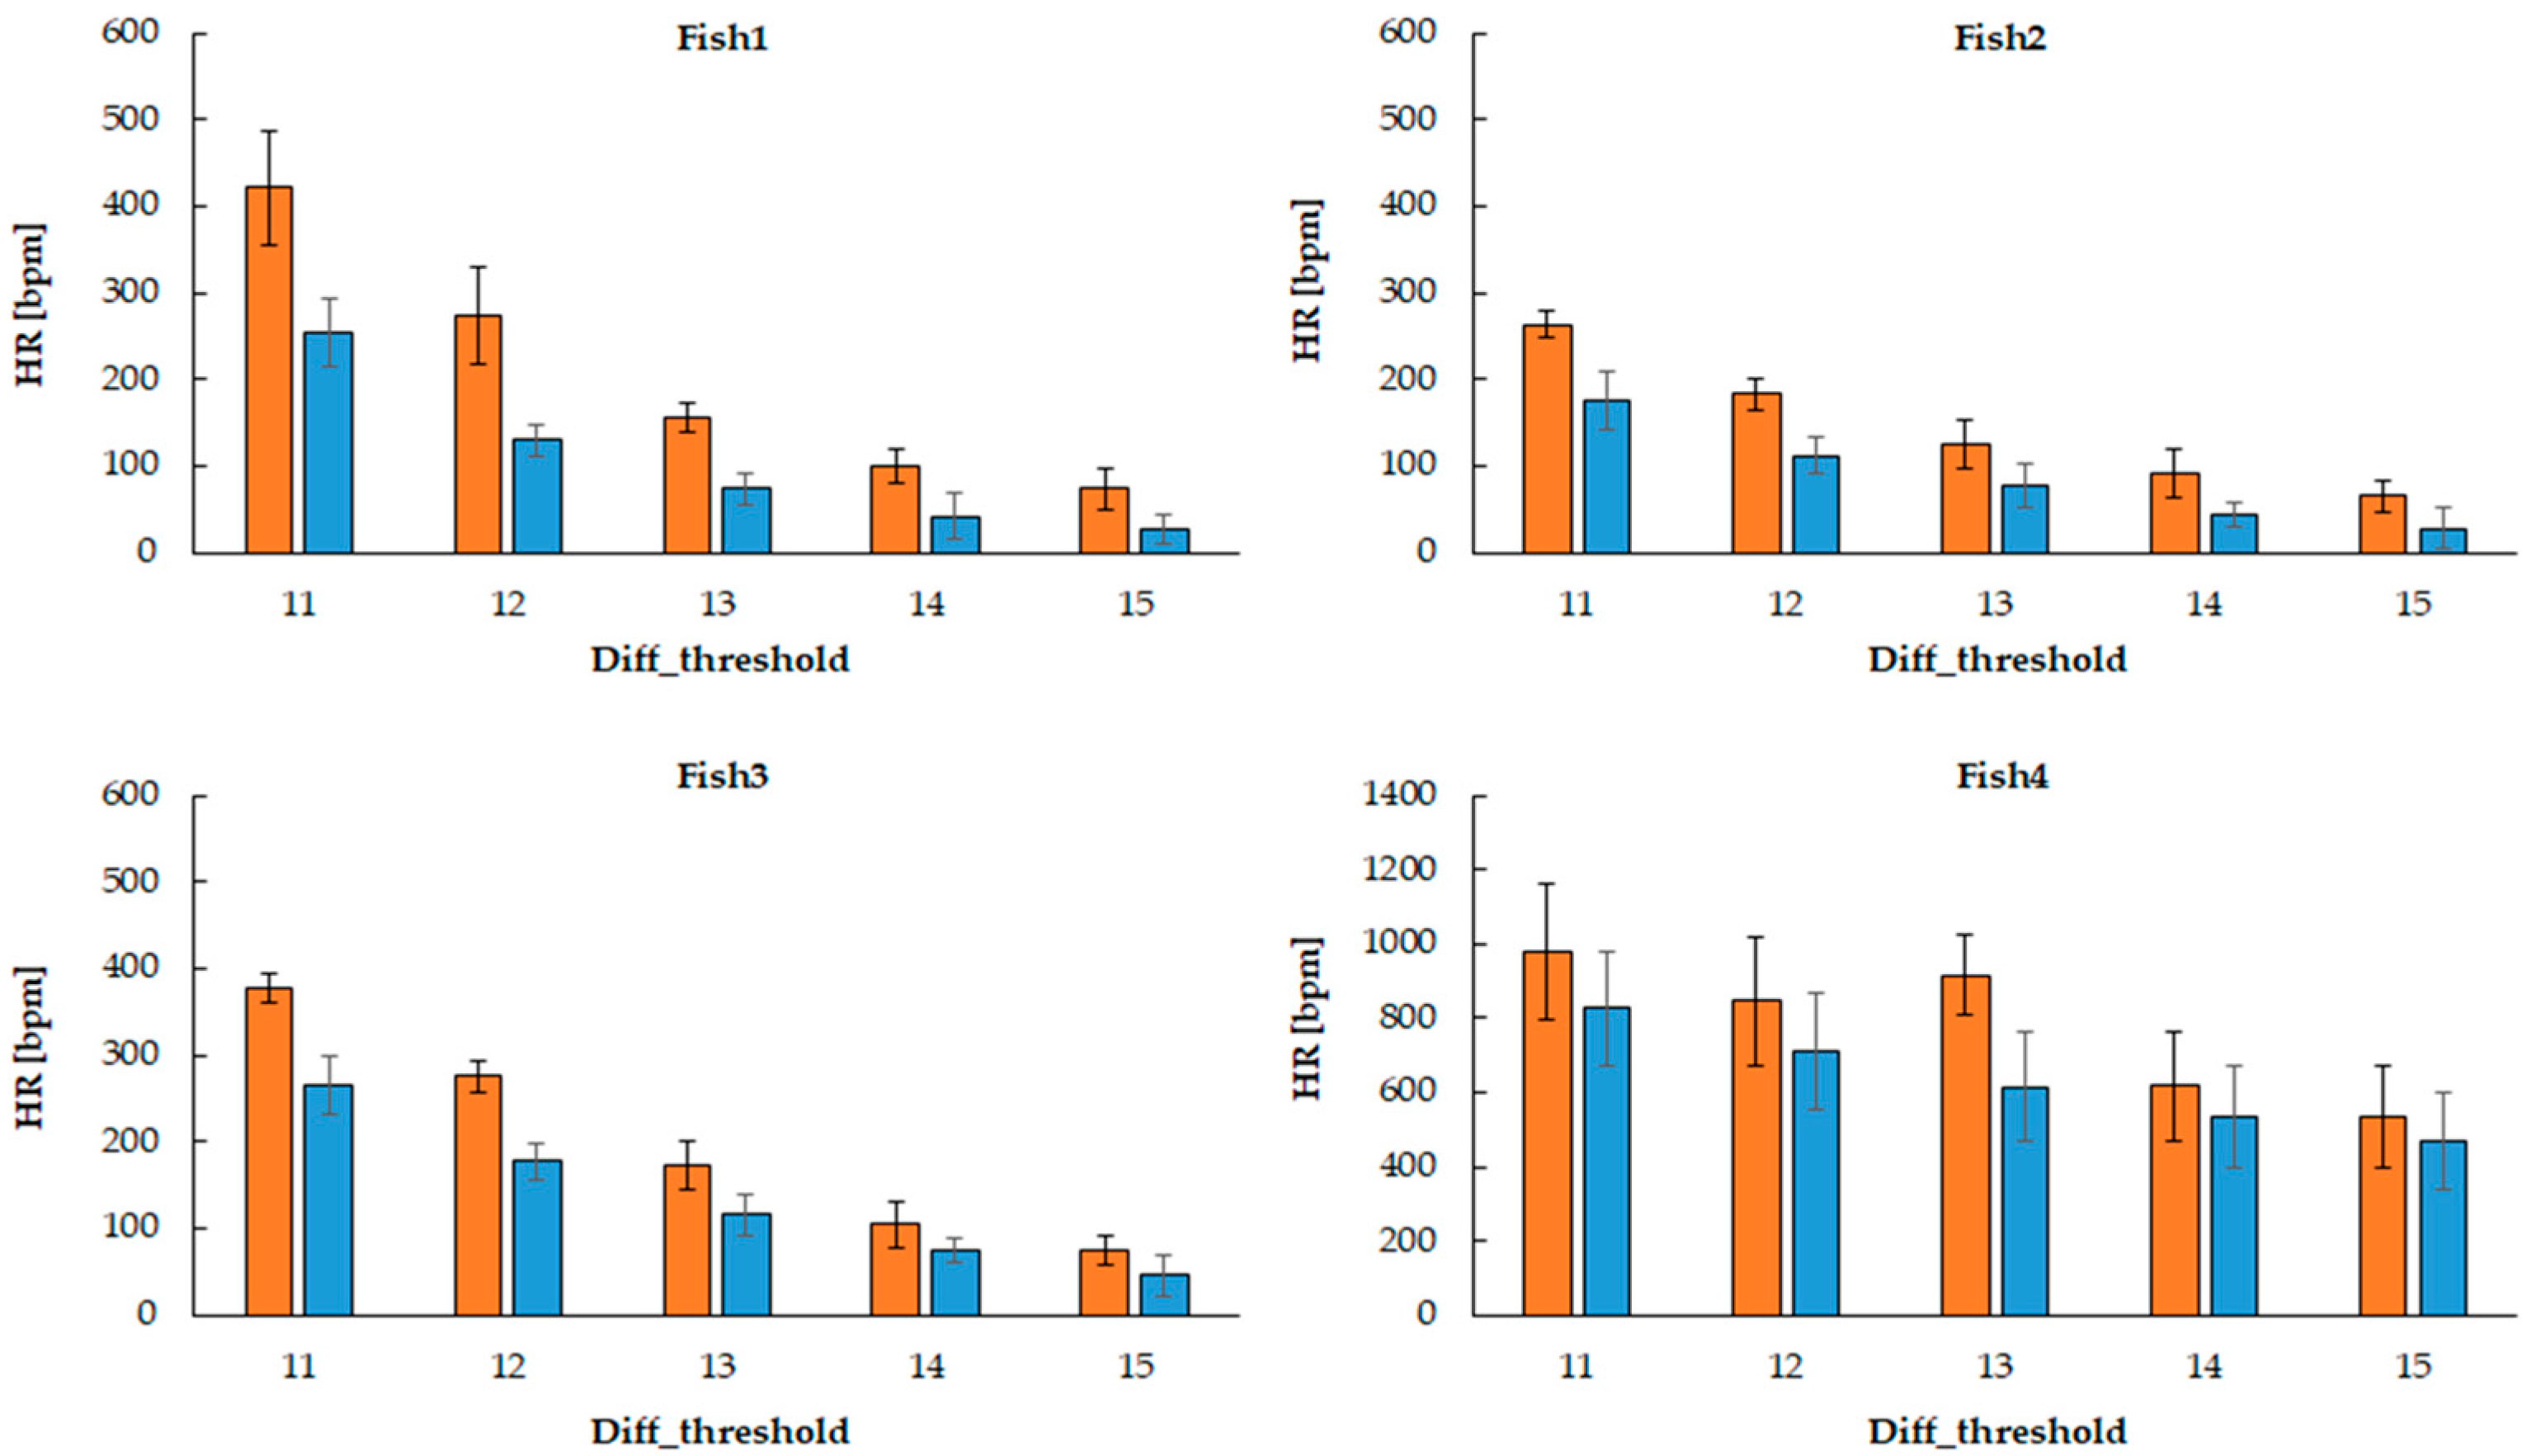
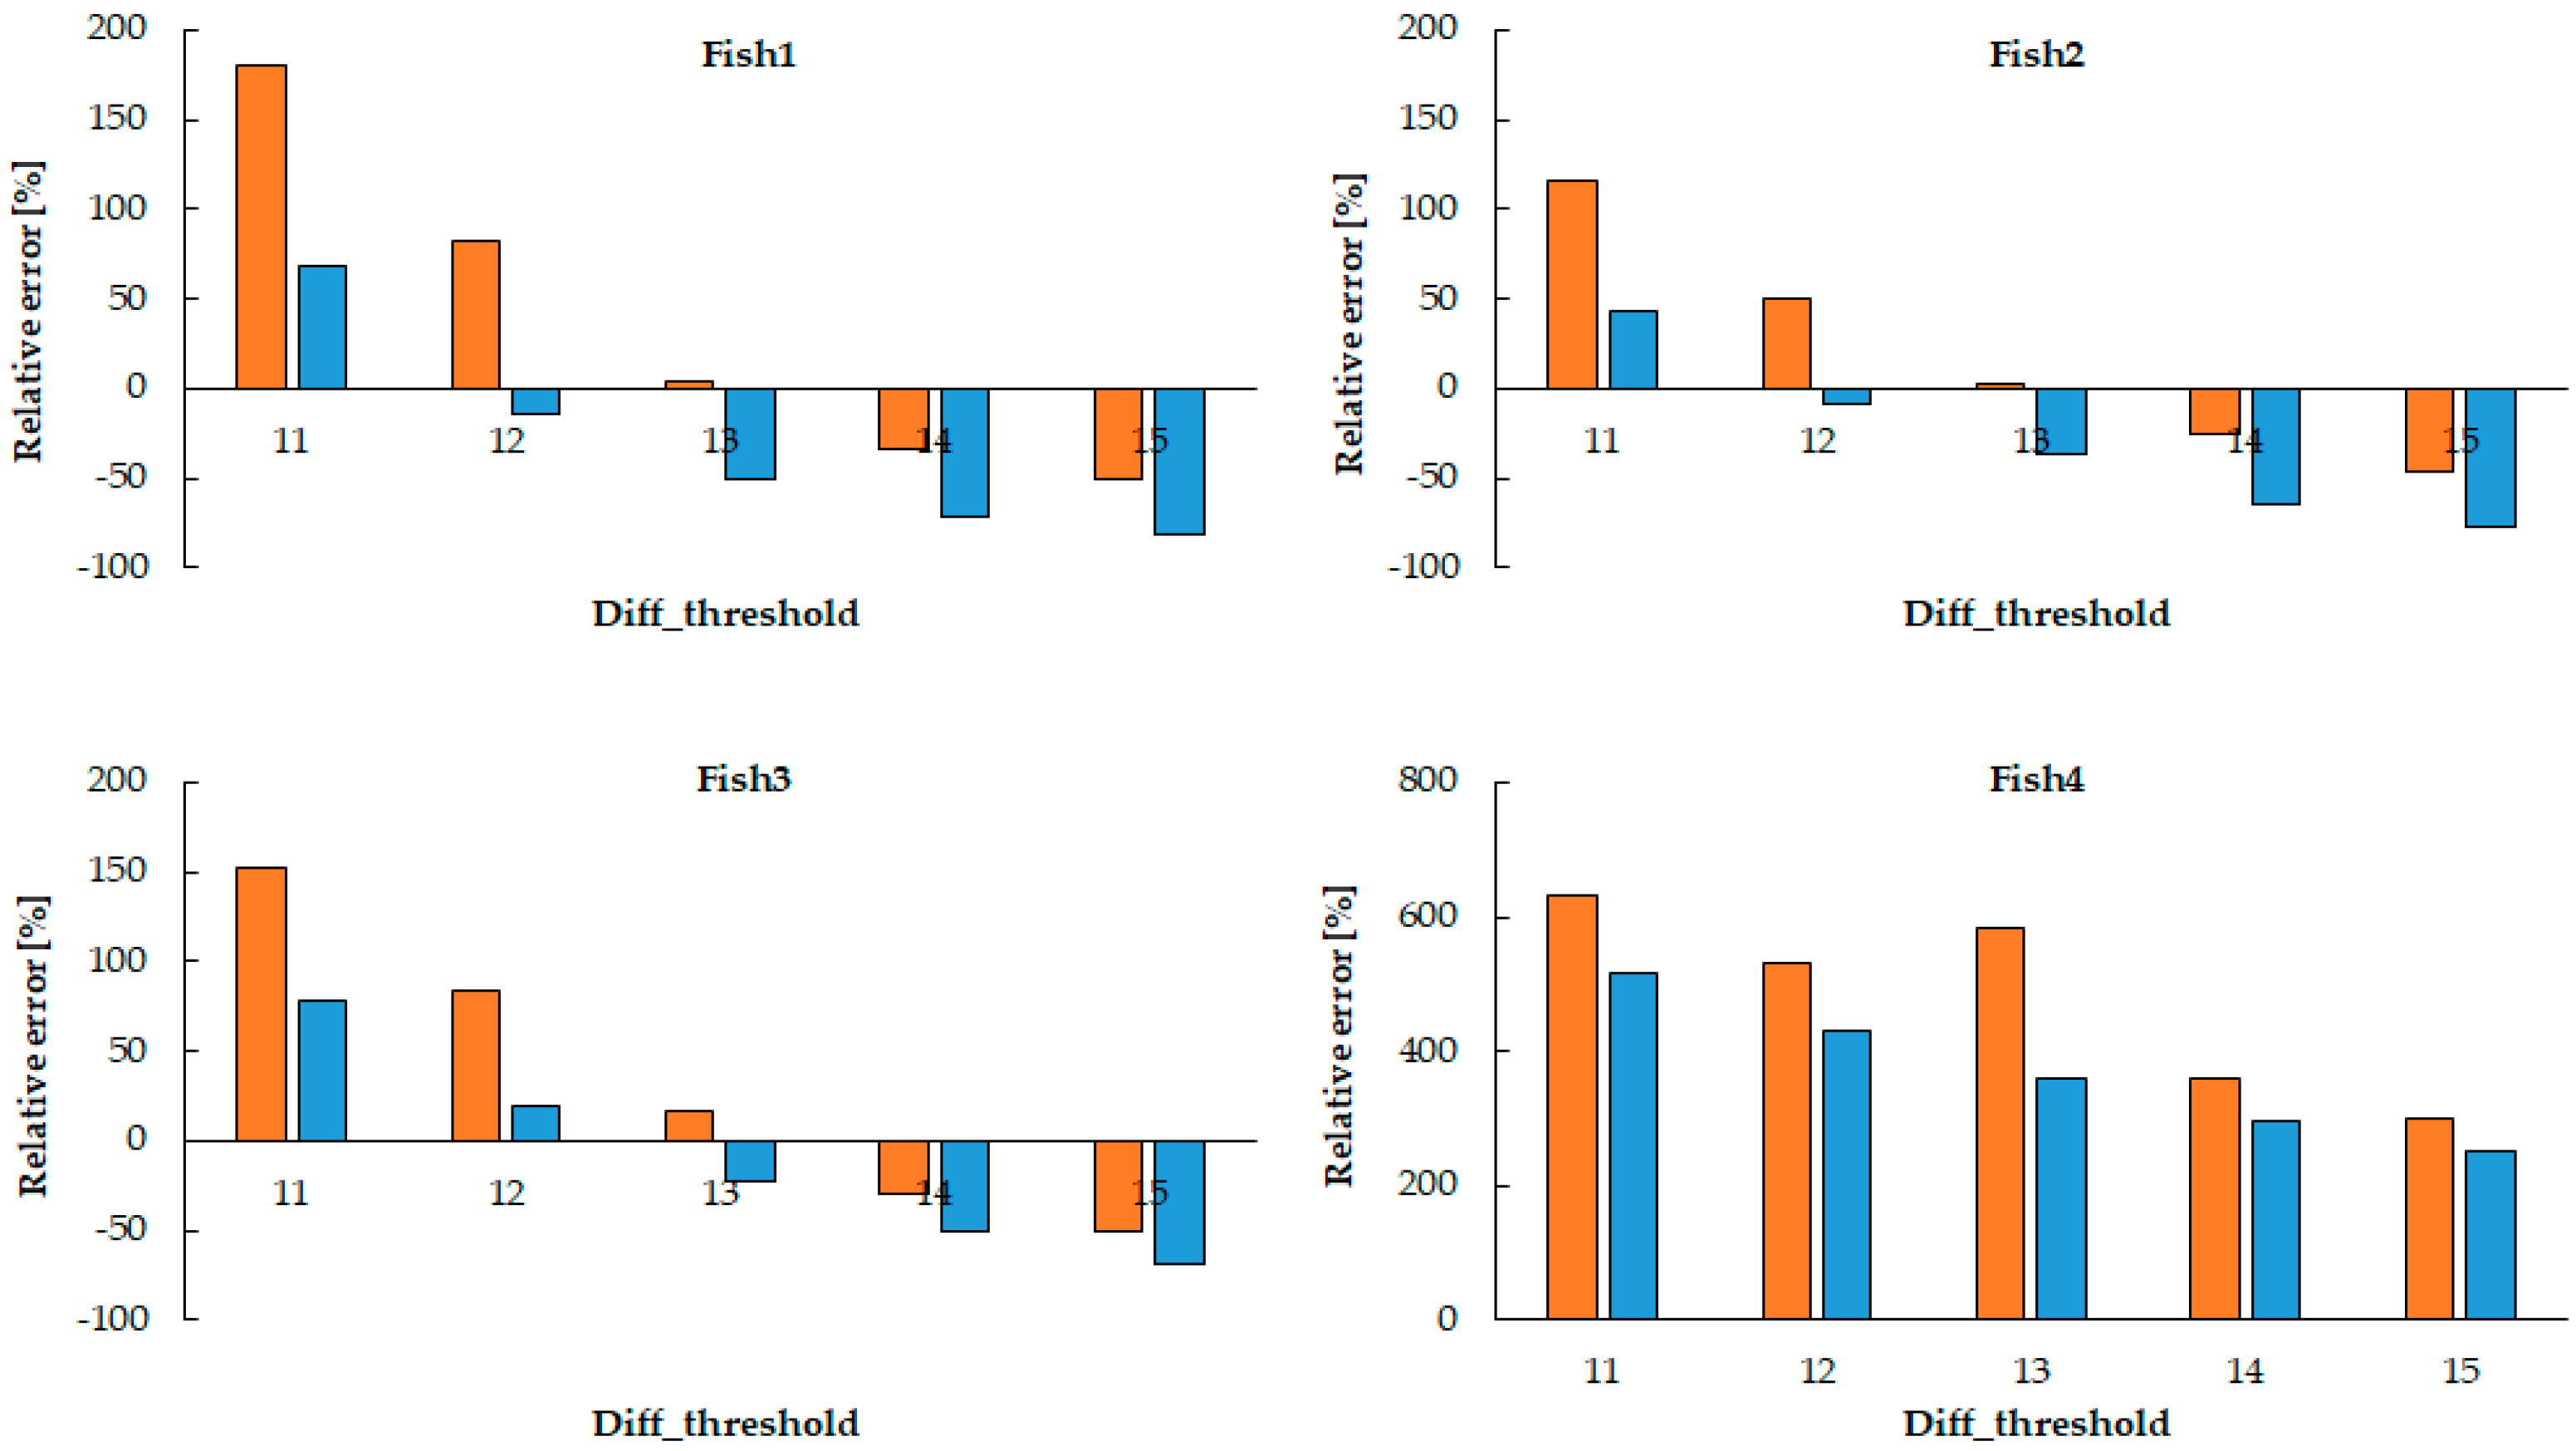
To assess algorithm performance under varying sensitivity levels, we tested combinations of the following parameters in a matrix format:
diff_threshold: {11, 12, 13, 14, 15}
movement_count: {1, 2}
This sensitivity analysis enabled us to identify optimal thresholds for the reliable detection of heartbeat-induced motion while minimizing noise from minor movements or camera artifacts.
To evaluate the validity of the algorithm, manual heartbeat measurements were conducted using a handheld counter (validation using manual counting). Observers visually inspected the same video and counted heartbeats based on observable blood flow pulses corresponding to ventricular contractions. This manual counting served as the gold standard against which the algorithm-derived heart rate estimates were compared. The video was replayed multiple times to ensure consistent visual detection, and each heartbeat was defined as a single pulse of blood movement caused by cardiac contraction. The comparison with algorithmic estimates was conducted over identical 10 s time segments.
2.4. Manual Validation
To validate the detection results, a handheld counter was used to manually count visible heartbeats from the video footage. This manual count was used for comparison with the algorithmic estimation to ensure the accuracy and reliability of the heart rate detection system.
4. Discussion
In this study, we demonstrated an approach to estimating heart rate in Danionella larvae using a frame-differencing algorithm applied to video recordings. By extracting a fixed region of interest (ROI) around the visible cardiac area and analyzing luminance fluctuations between consecutive frames, we were able to detect periodic motion patterns corresponding to cardiac contractions. The optimal parameters are relatively robust because they capture the main heart movements, even if the ROI is slightly off-center, as long as it covers the entire heart. However, if the ROI is significantly off-center, noise increases and accuracy decreases. This technique, when paired with binary thresholding, effectively transformed subtle movements of blood flow into quantifiable image features. One of the major strengths of this method lies in its simplicity and accessibility.
The rhythmic increase in white pixel count—indicating heartbeat—was reliably detected across different time segments in the video. The average relative error is approximately 12.74%, indicating that the heart rate estimation system performs reasonably well, although there are some cases with larger individual errors (up to 25.97%). The parameter set with diff_threshold = 13 and movement_count ≥ 1 px yielded the best results for three of the four fish, suggesting this as a reliable baseline setting. The system could capture physiological variability, and these estimates were validated against manual counting using a handheld counter, which served as the gold standard in this study. The high degree of visual and quantitative agreement between the two methods supports the validity of our algorithm.
Heart rate monitoring in the zebrafish cardiovascular system has traditionally been performed manually (using a stopwatch) to count heartbeats. However, these methods are labor-intensive, time-consuming, and require specific training to execute. As a result, several automated measurement techniques have been developed [
16,
17,
18]. Many of these methods detect changes in active pixels between frames, defining the heart region as an area and detecting heartbeats within the frame. However, these detection software tools are commercially available, and some are difficult to implement [
19,
23,
24,
25]. Compared to these existing methods, our proposed approach offers a more accessible and practical solution. For example, Kang et al. (2018) [
26] proposed an automated heart rate measurement method using digital motion analysis; that technique is the use of a half-heart mask combined with empirical mode decomposition (EMD) and high-pass filtering. However, their system still required relatively sophisticated image processing setups and was limited in flexibility for varying experimental conditions. While this method can effectively screen for cardiac abnormalities, it faces several limitations: the accuracy and robustness of mask generation are highly sensitive to noise and individual variability, mask creation often requires manual adjustments due to variations in lighting, heart position, and orientation, and the EMD process can become unstable, especially when low-frequency noise sources, such as respiration, overlap with the cardiac signal. Moreover, EMD is computationally intensive, which may restrict its suitability for real-time monitoring. In contrast, our method focuses on simplifying the heart rate measurement process while maintaining reasonable accuracy, reducing both technical barriers and computational demands. Unlike previous methods that require complex preprocessing or proprietary software, our approach is designed to be easily applied using accessible tools, making it highly suitable for preliminary experiments, high-throughput screenings, or educational purposes where fast and low-cost measurement is desirable. By emphasizing simplicity, affordability, and ease of use, our work contributes to broadening the applicability of heart rate monitoring in zebrafish studies, especially in contexts where high-end equipment and advanced computational resources are not available.
In this experiment, we showed an example of a recording with T = 10 s. Evaluating the sensitivity of instantaneous heart rate extraction to the time window duration, T, is important in several aspects. The first is the sensitivity to the time window duration, T. For a short time window (e.g., 1–5 s), the advantage is that it is possible to capture rapid changes in heart rate (heart rate variability, stress response, etc.) in a more real-time manner. The disadvantage is that the sensitivity to noise in the signal increases. Even noise or artifacts of a few beats can have a significant effect on heart rate estimation. In addition, when using frequency analysis such as fast Fourier transform (FFT), the frequency resolution decreases. Even with methods such as EMD, it is difficult to resolve stable IMFs with short signals. For a long time window (e.g., 15–30 s or more), the advantage is that the effect of noise can be averaged out, and a more stable average heart rate can be calculated. The frequency resolution also improves. The disadvantage is that the ability to capture instantaneous fluctuations is reduced because rapid changes in heart rate are smoothed out. It is not suitable for analyzing heart rate variability, and it also increases the possibility that low-frequency components, such as breathing, will affect the heart rate band. A time window of 10 s is a balanced choice that can capture relatively short-term heart rate variability while maintaining a certain degree of stability. However, depending on the research purpose and the need to evaluate heart rate variability, the value of T should be adjusted, and the sensitivity should be evaluated. For example, a short T would be suitable for seeing changes before and after stress loading, and a long T would be suitable for obtaining a stable baseline heart rate for long-term monitoring. The challenge is how much influence from other physiological movements, such as breathing, can be removed, and ensuring that the frame rate of the video is high enough (having a time resolution that can separate the heart rate). In conclusion, a time window of 10 s is long enough to extract the instantaneous heart rate, and its fluctuations can be captured by using appropriate signal processing and peak detection techniques.
Also, in this study, there was a discrepancy between the estimated heart rate and the manual measurements of fish 4. Three factors were considered for this: factors on the automatic measurement side, factors on the manual measurement side, and factors on both sides. First, environmental factors are considered on the automatic measurement side. In a low temperature environment, peripheral blood vessels constrict and blood flow decreases, making it difficult for the sensor to detect the heart rate. In addition, if external light hits the sensor directly, it can be a source of noise. Factors on the manual measurement side include the skill and experience of the person who measures it, concentration, and environmental factors. The use of appropriate anesthesia protocols and fixation devices, which securely immobilize small fish while minimizing physiological effects and enabling accurate heart rate measurement with microelectrode technology, is not suitable for simplified measurement procedures. Laser Doppler flowmetry (LDF) can measure blood flow in a relatively small area, but there are limitations to the measurement technology, and there are also limitations to trying to measure blood flow in a limited area of small fish (e.g., gills and certain fin blood vessels). There are individual differences in the ability to capture the heart rate rhythm and errors in time measurement, such as counting seconds, and discrepancies in the timing of starting and stopping a stopwatch that can also cause errors. Physiological fluctuations are considered as factors on both sides. The heart rate varies greatly throughout the day and also changes depending on meals. The feeding time for the fish used in the experiment was generally 10 a.m., but sometimes it was delayed. Any one of these factors, or a combination of multiple factors, may cause abnormal values in the estimated heart rate and manual measurements.
Despite its advantages, the proposed method has several limitations. First, the system relies on the subject remaining stationary within the ROI. Any significant movement of the larva, such as swimming or body rotation, can shift the heart outside the fixed ROI, leading to inaccurate measurements or signal loss. While this was minimized in our current study by selecting periods of immobility, a robust implementation for live monitoring would require an automatic tracking system capable of dynamically adjusting the ROI. (Because larvae move in three dimensions, changes in depth, angle, and position can affect measurements. In this study, we only used a 60 s clip in which fish movement was minimal.) Second, the threshold value for binary segmentation was determined heuristically. While effective in this experiment, this parameter may need tuning under different lighting conditions, fish orientations, or developmental stages. Future studies should investigate adaptive thresholding techniques or incorporate machine learning algorithms to improve generalizability. Third, the frame rate (interlaced 60i) of the recording may introduce temporal artifacts that could influence the accuracy of motion estimation. Although we achieved meaningful results with this setup, higher frame rate recordings may enhance temporal resolution and allow for more precise heartbeat detection, especially in faster-beating or smaller hearts. Further testing samples should be increased.
Additionally, validation against more precise physiological measurement systems—such as electrocardiography (ECG) or laser Doppler flowmetry—was not conducted in this study. While the handheld counter served as a practical reference, it does not provide temporal precision at the millisecond level. Incorporating such gold-standard measurements in future work would offer a more rigorous evaluation of our algorithm’s accuracy. This study is merely a pilot experiment. Since measurements were conducted on only four fish, the statistical power is sufficient for performing counterbalanced within-subject comparisons but not for conducting an independent two-sample t-test between different individuals. For example, when examining whether there is a difference in the heart rate of a single fish between resting and active states, the required sample size for a paired t-test is approximately three, assuming an effect size of d = 2.0, a significance level of α = 0.05 (two-tailed), and a statistical power of 0.80. However, for an independent two-sample t-test comparing different fish, approximately five fish per group would be required. In such cases, it is necessary to balance the groups by randomly assigning fish to each group. The proposed method in this study is intended solely for preliminary data collection.
As future perspectives, automating the ROI selection using object tracking techniques, such as centroid-based tracking (YOLO, You Only Look Once) [
27,
28,
29,
30,
31,
32], would increase robustness and applicability for longer recording durations or more active larvae. Furthermore, the integration of more sophisticated image processing techniques, including optical flow or frequency-domain analysis, could improve detection sensitivity and robustness in noisier conditions. These enhancements would extend the utility of our system not only for cardiac monitoring but also for analyzing other physiological parameters such as respiration or vascular dynamics. Although validation of the heart rate range is not sufficient to quantitatively assess the performance or reliability of the estimation method, it is useful for initial screening and for roughly checking whether the estimates are deviating significantly. Motion extraction using grayscale conversion and frame difference is a standard and general-purpose method in video processing and is easy to implement in that it does not require special preprocessing or highly accurate region extraction. Compared to other advanced heartbeat detection methods, it may be slightly inferior in accuracy, but it has the advantage of being computationally low and quick and easy to apply. Compared to complex methods aimed at high-precision measurement, this method is suitable for preliminary experiments and rapid screening applications, making it an appropriate choice depending on the usage environment and purpose. This paper does not solve the problem of limited scalability in high-throughput experiments, but it proposes a simple heartbeat detection method that may replace existing expensive solutions in the future.


