Research on the Shear Performance of Carbonaceous Mudstone Under Natural and Saturated Conditions and Numerical Simulation of Slope Stability


Abstract
1. Introduction
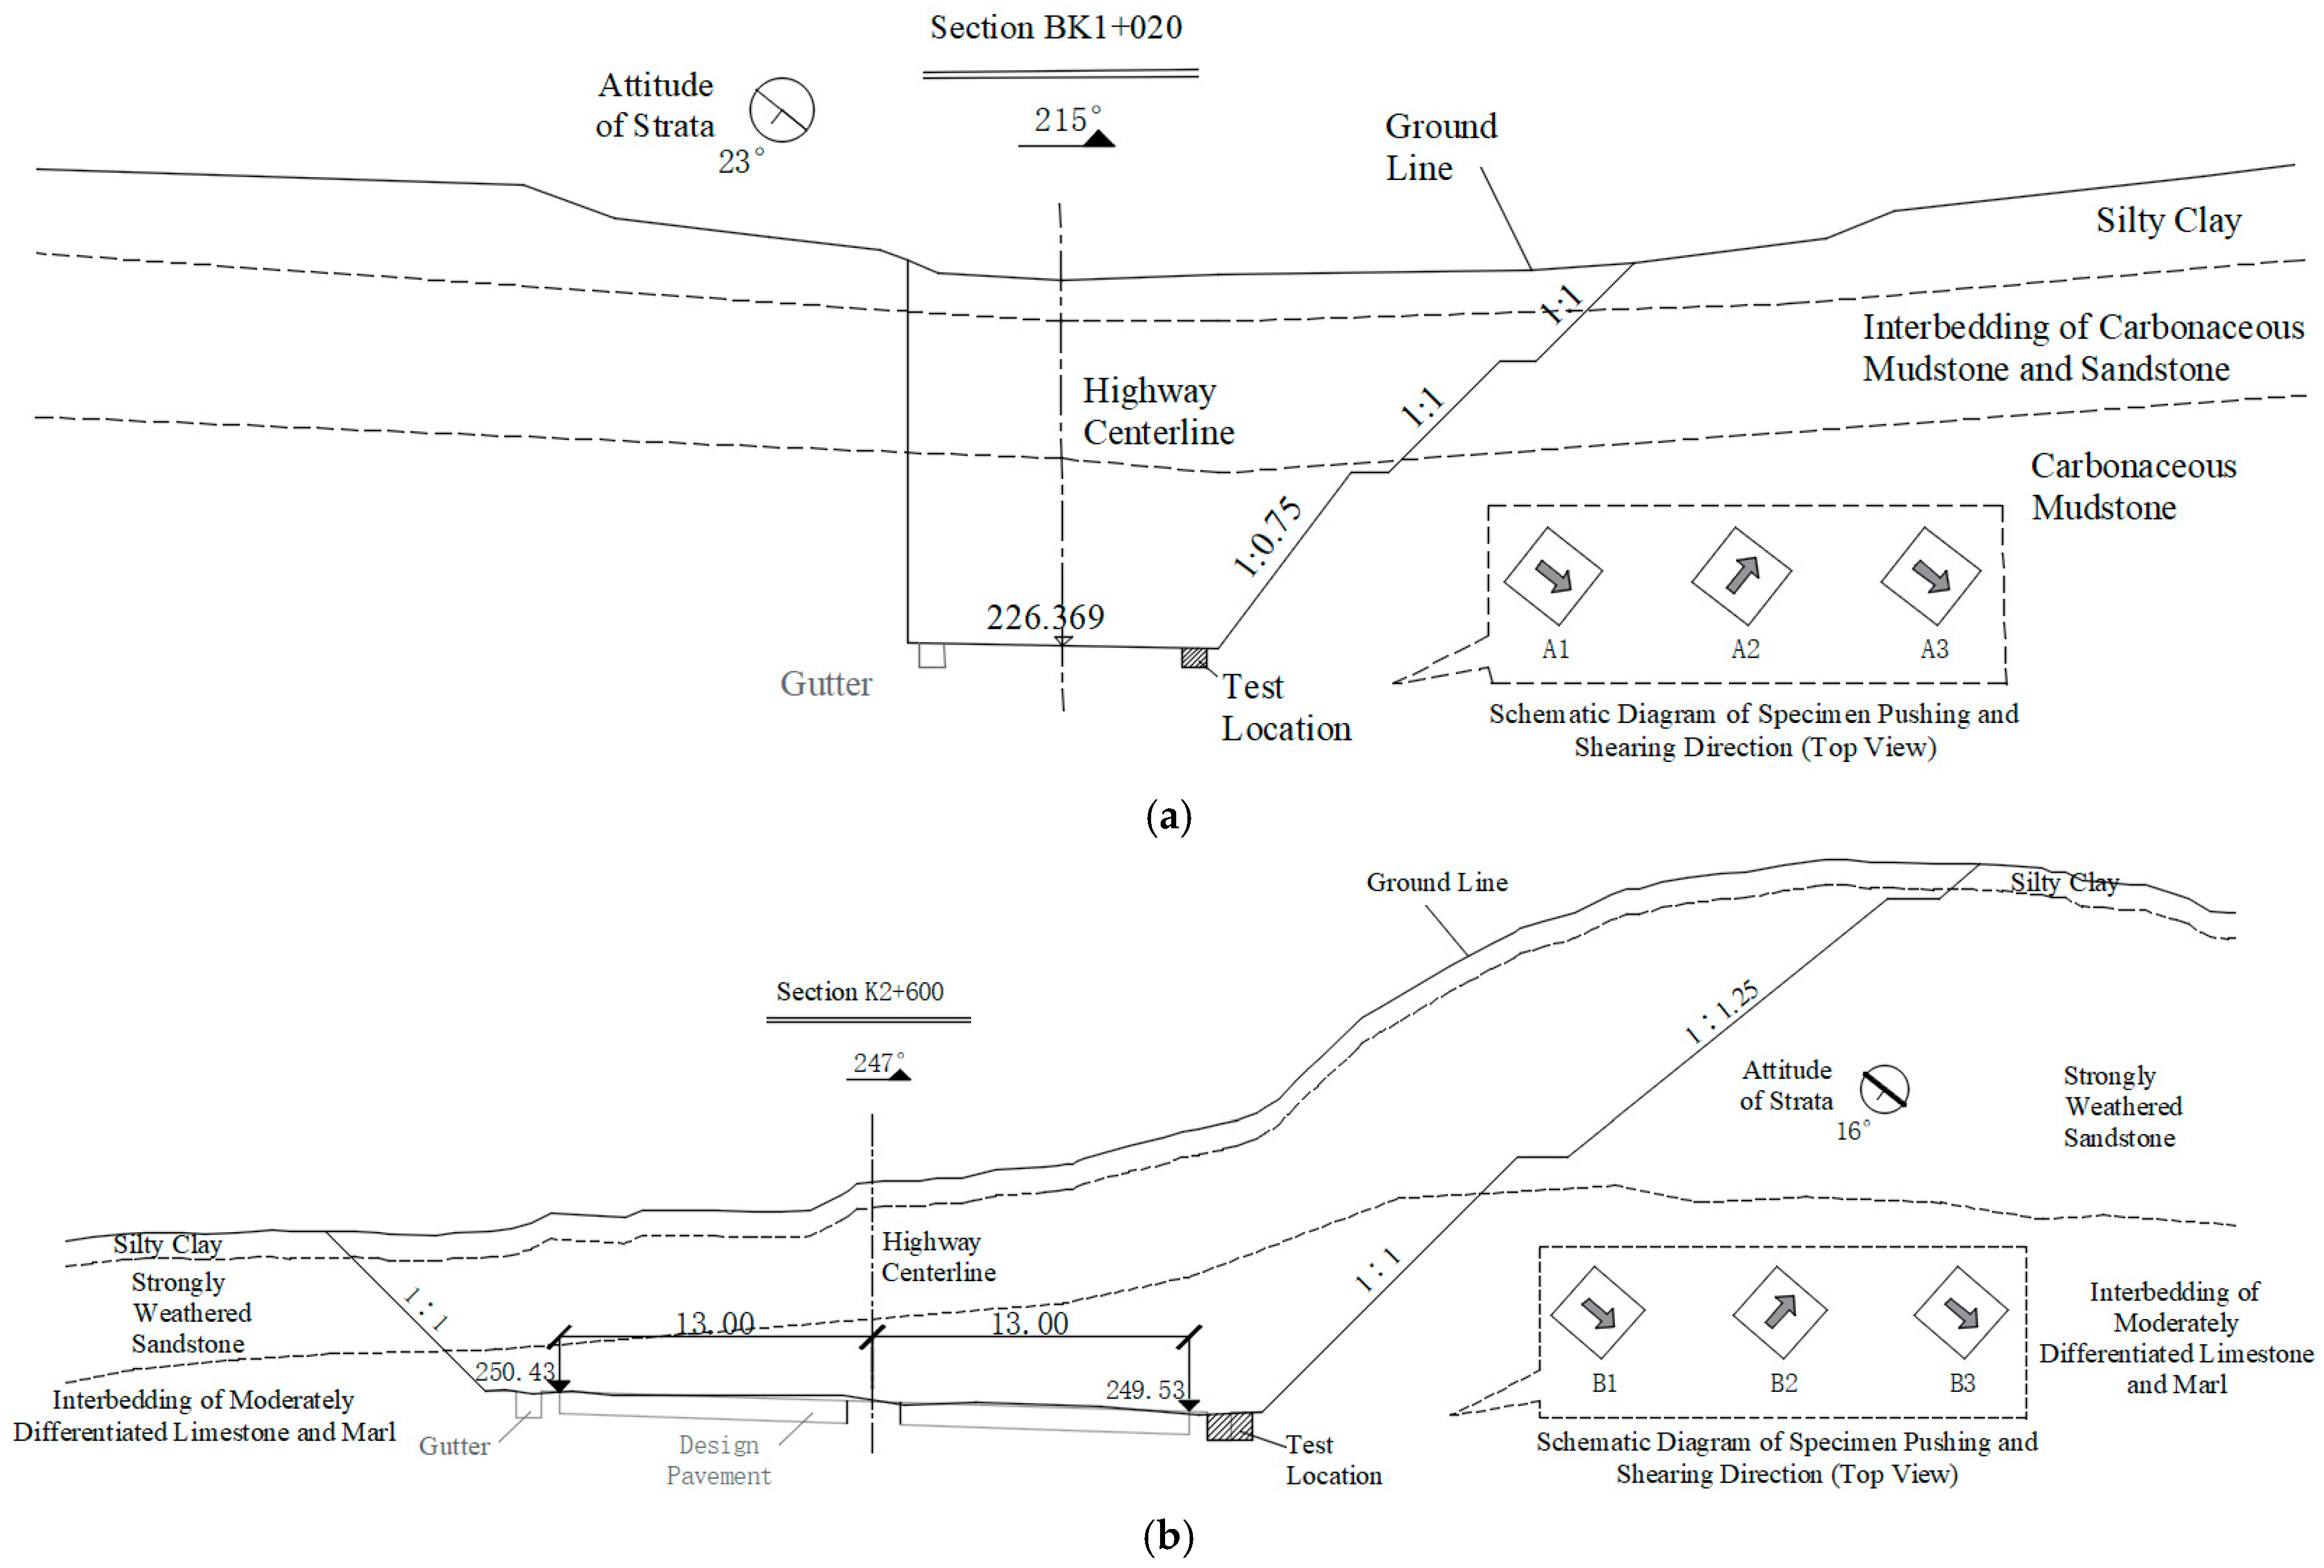
2. Test Location
3. Materials and Methods
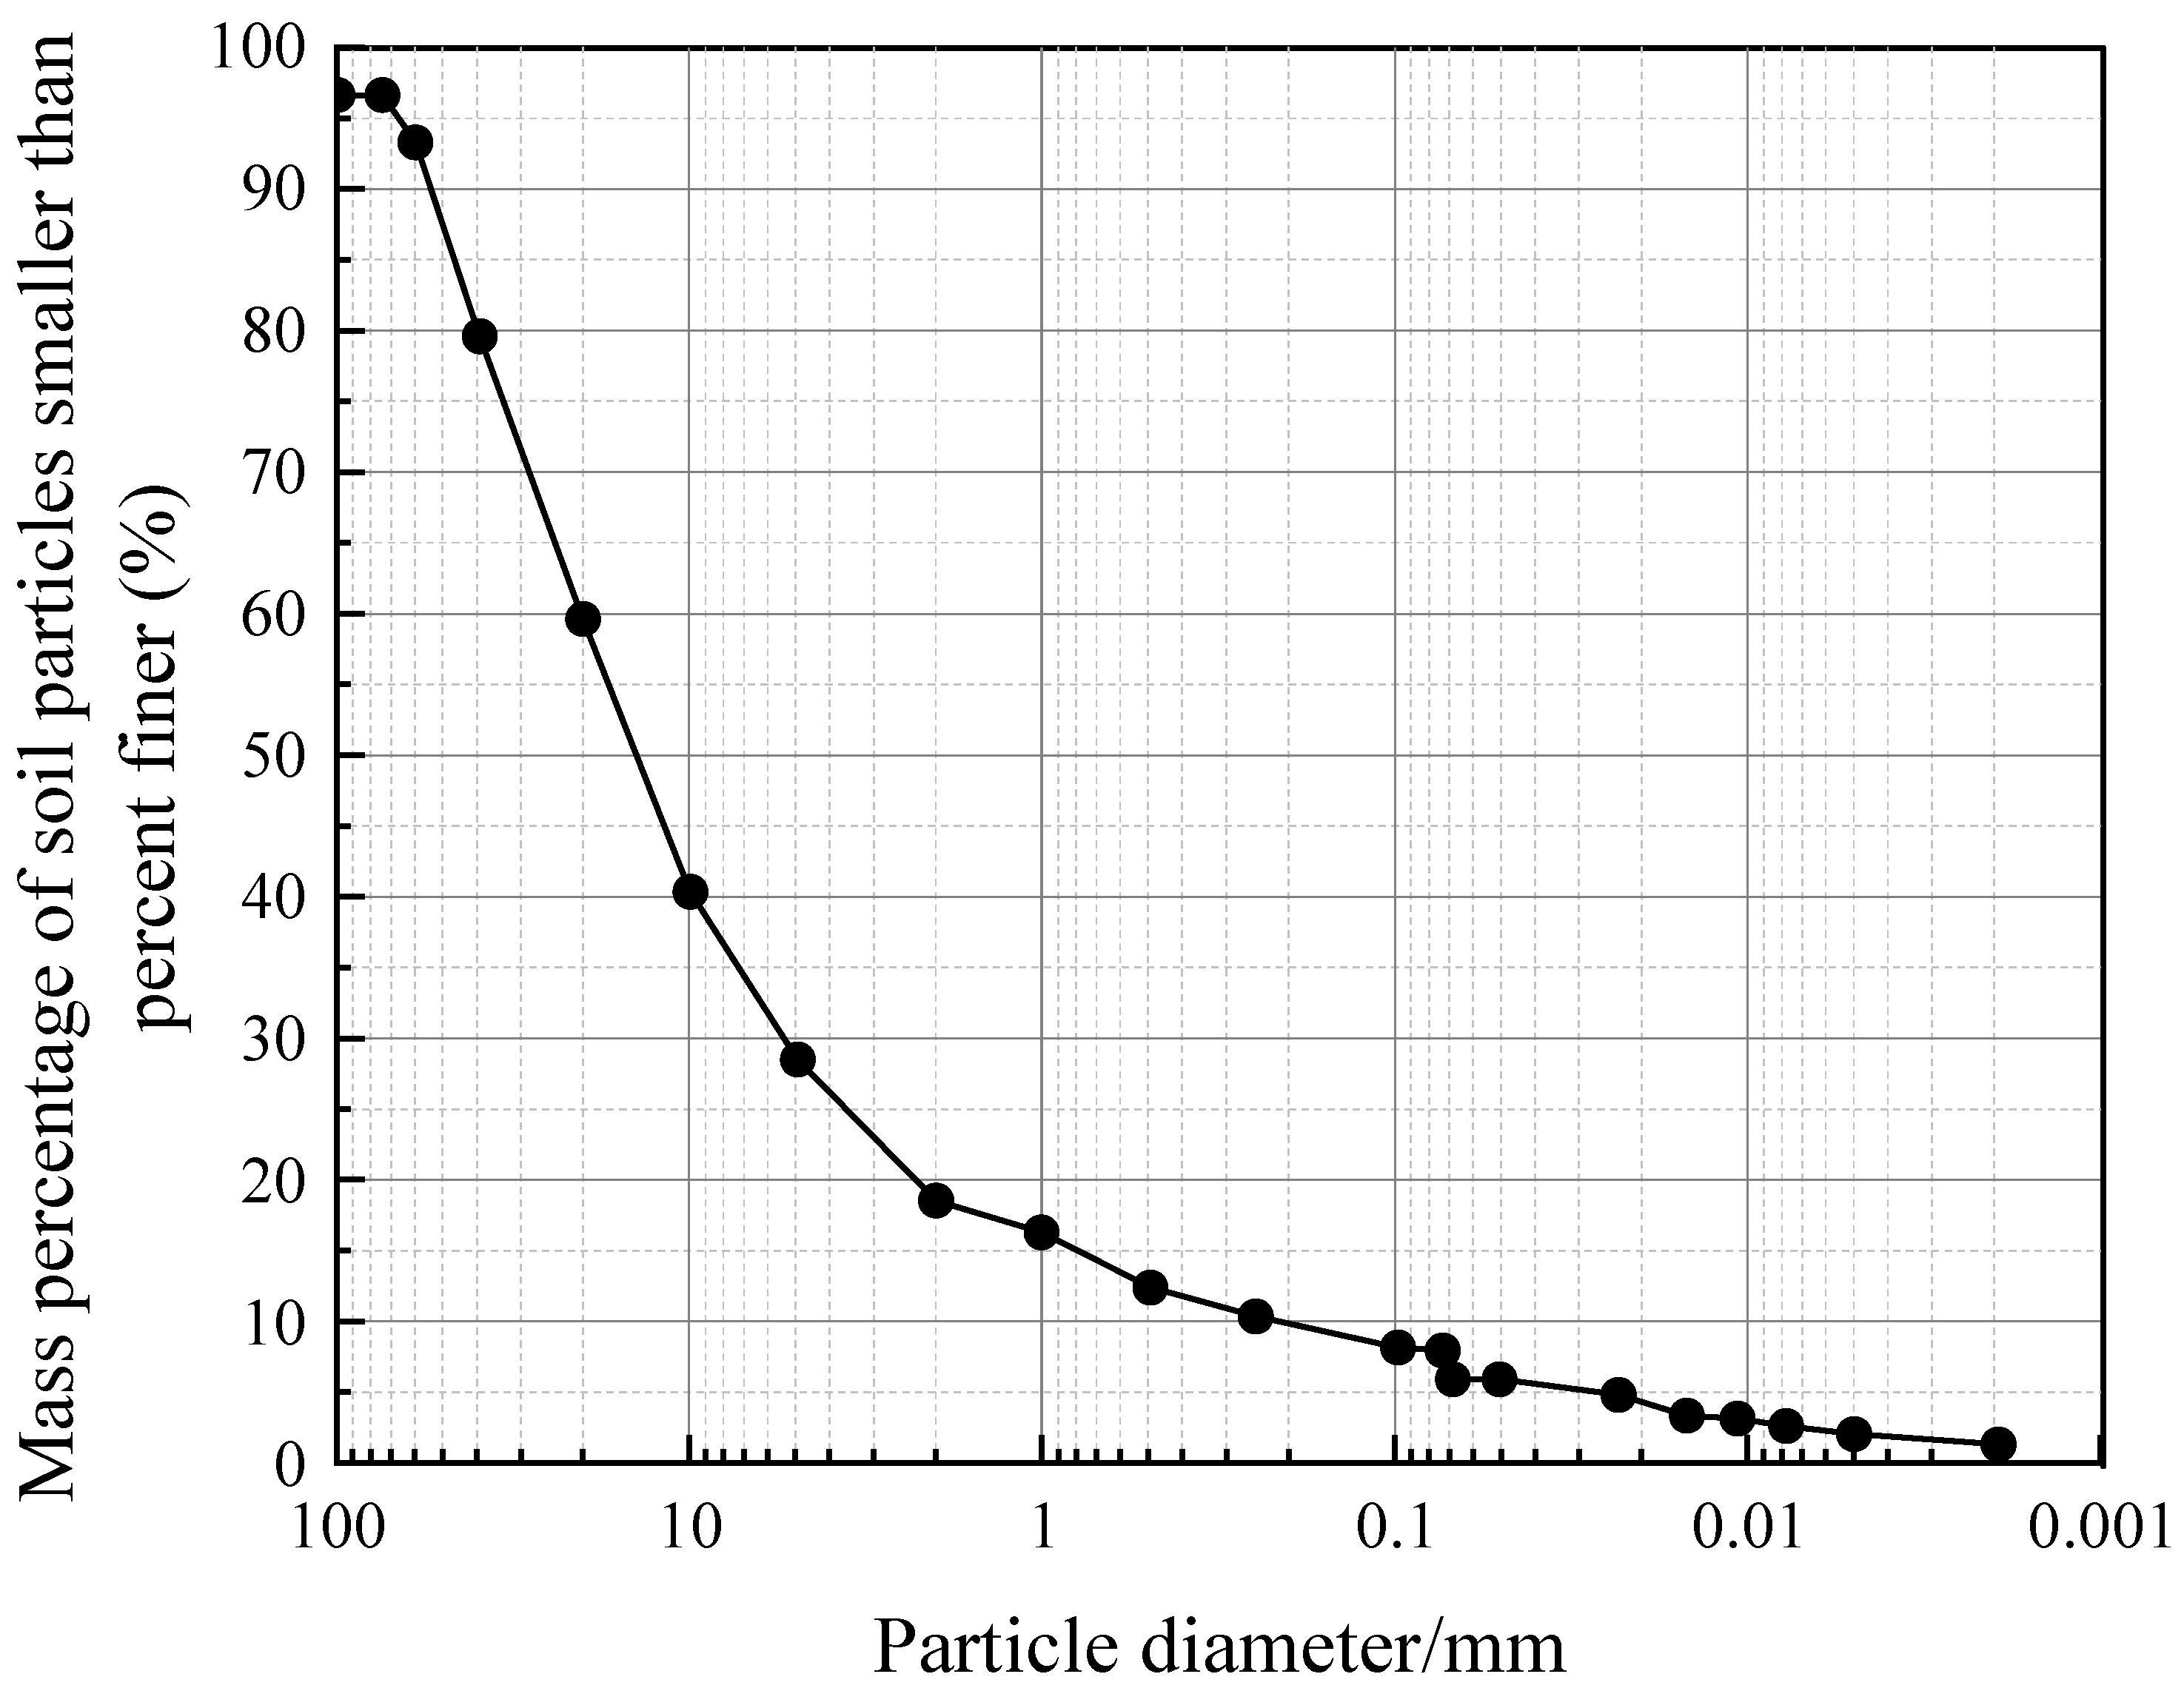
3.1. Test Materials
3.2. In Situ Horizontal Push Shear Test
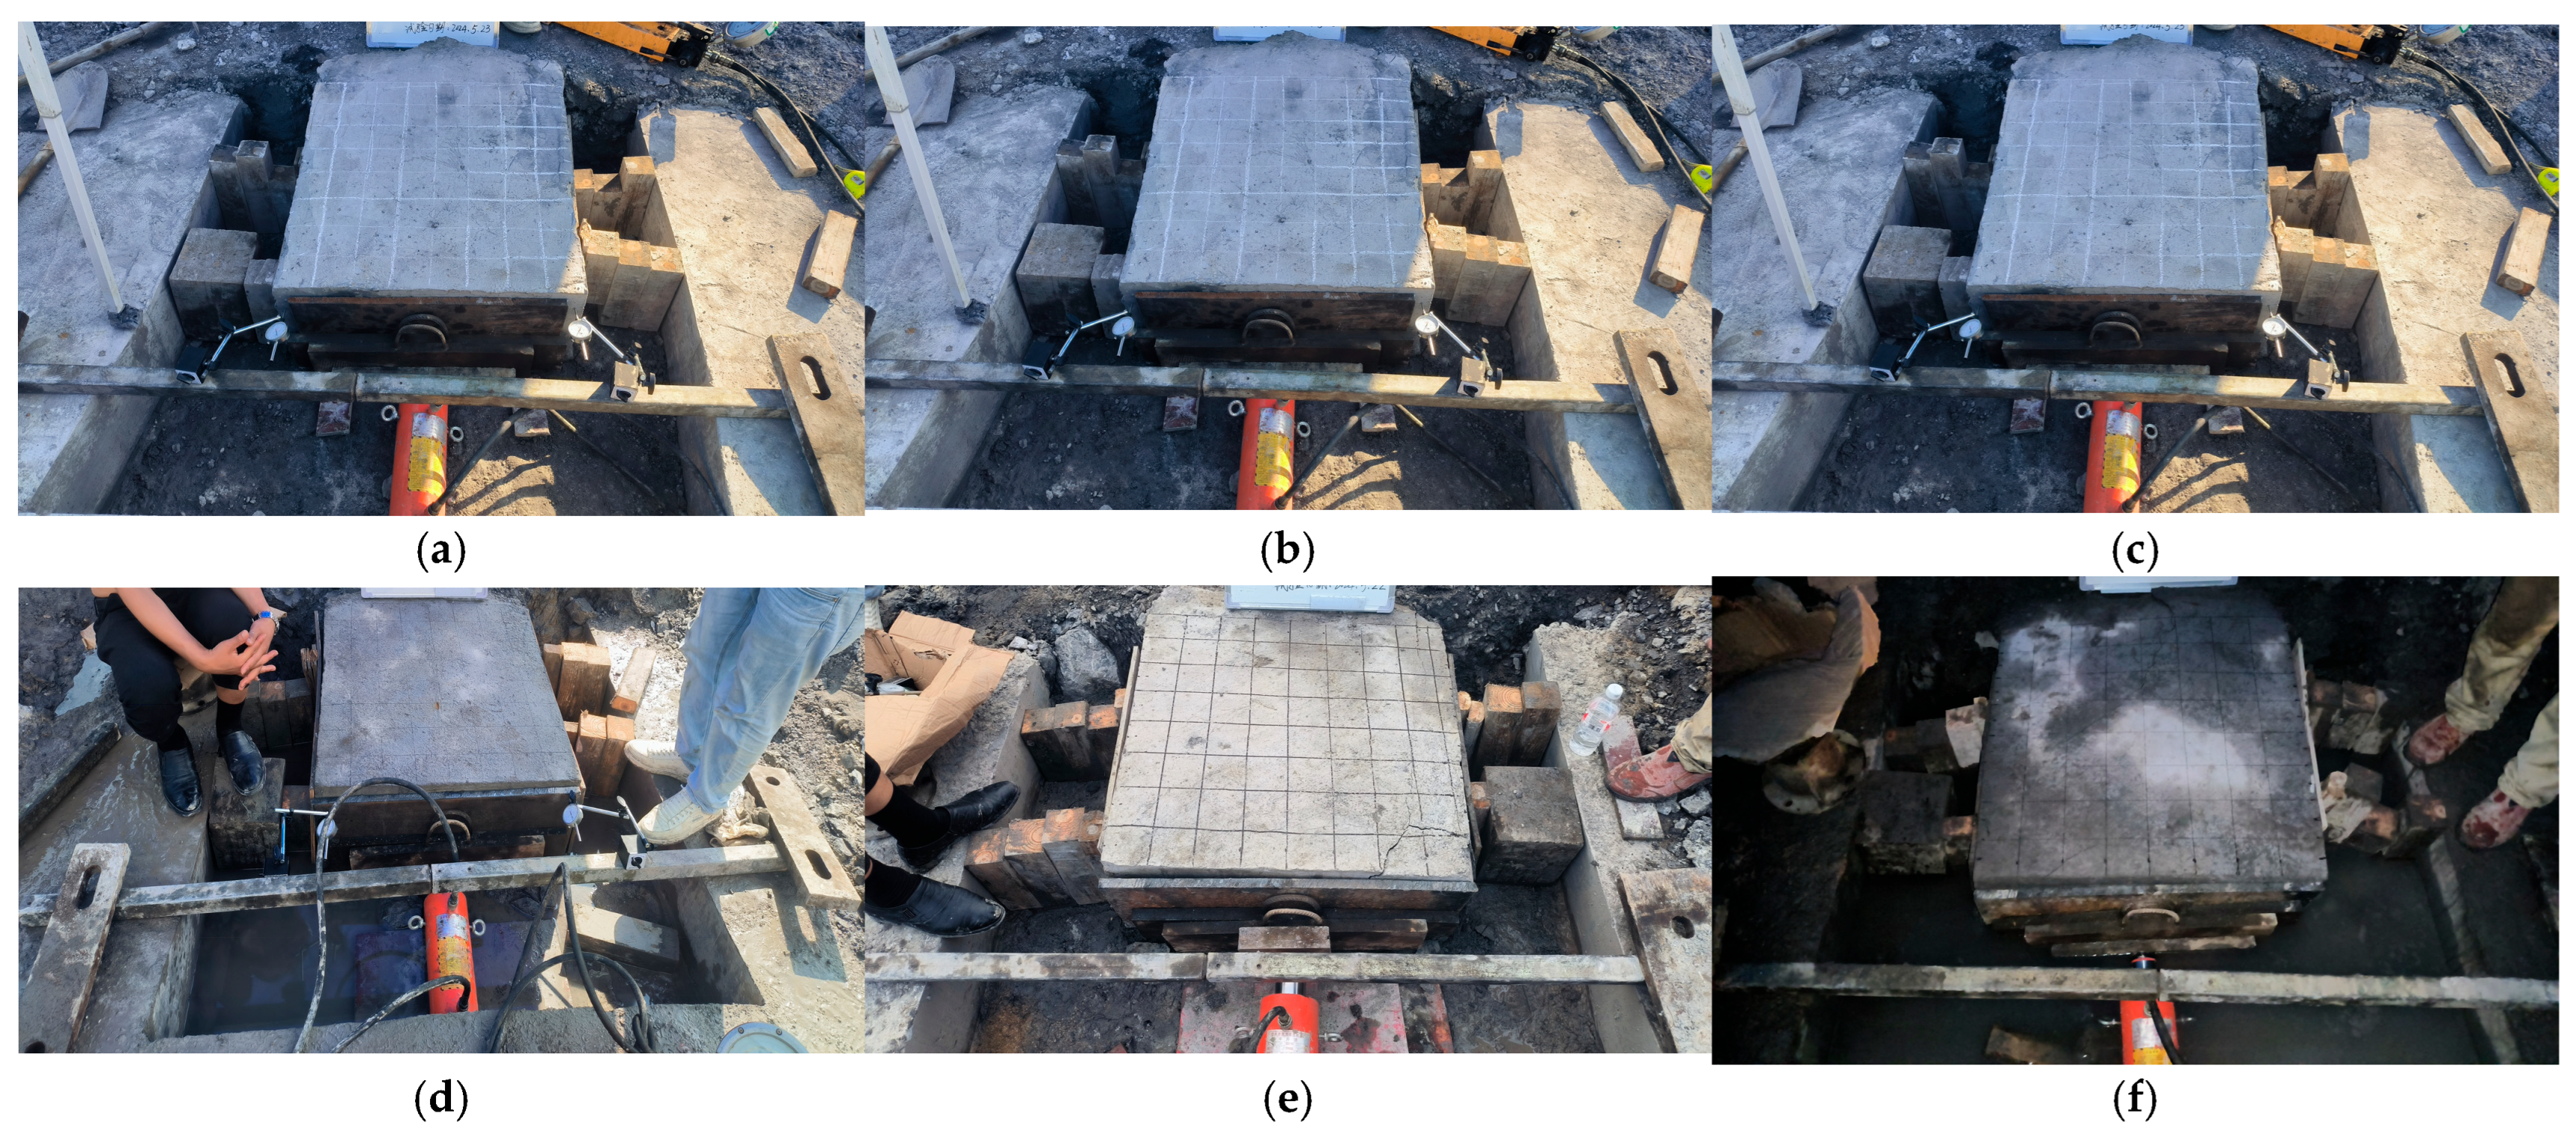
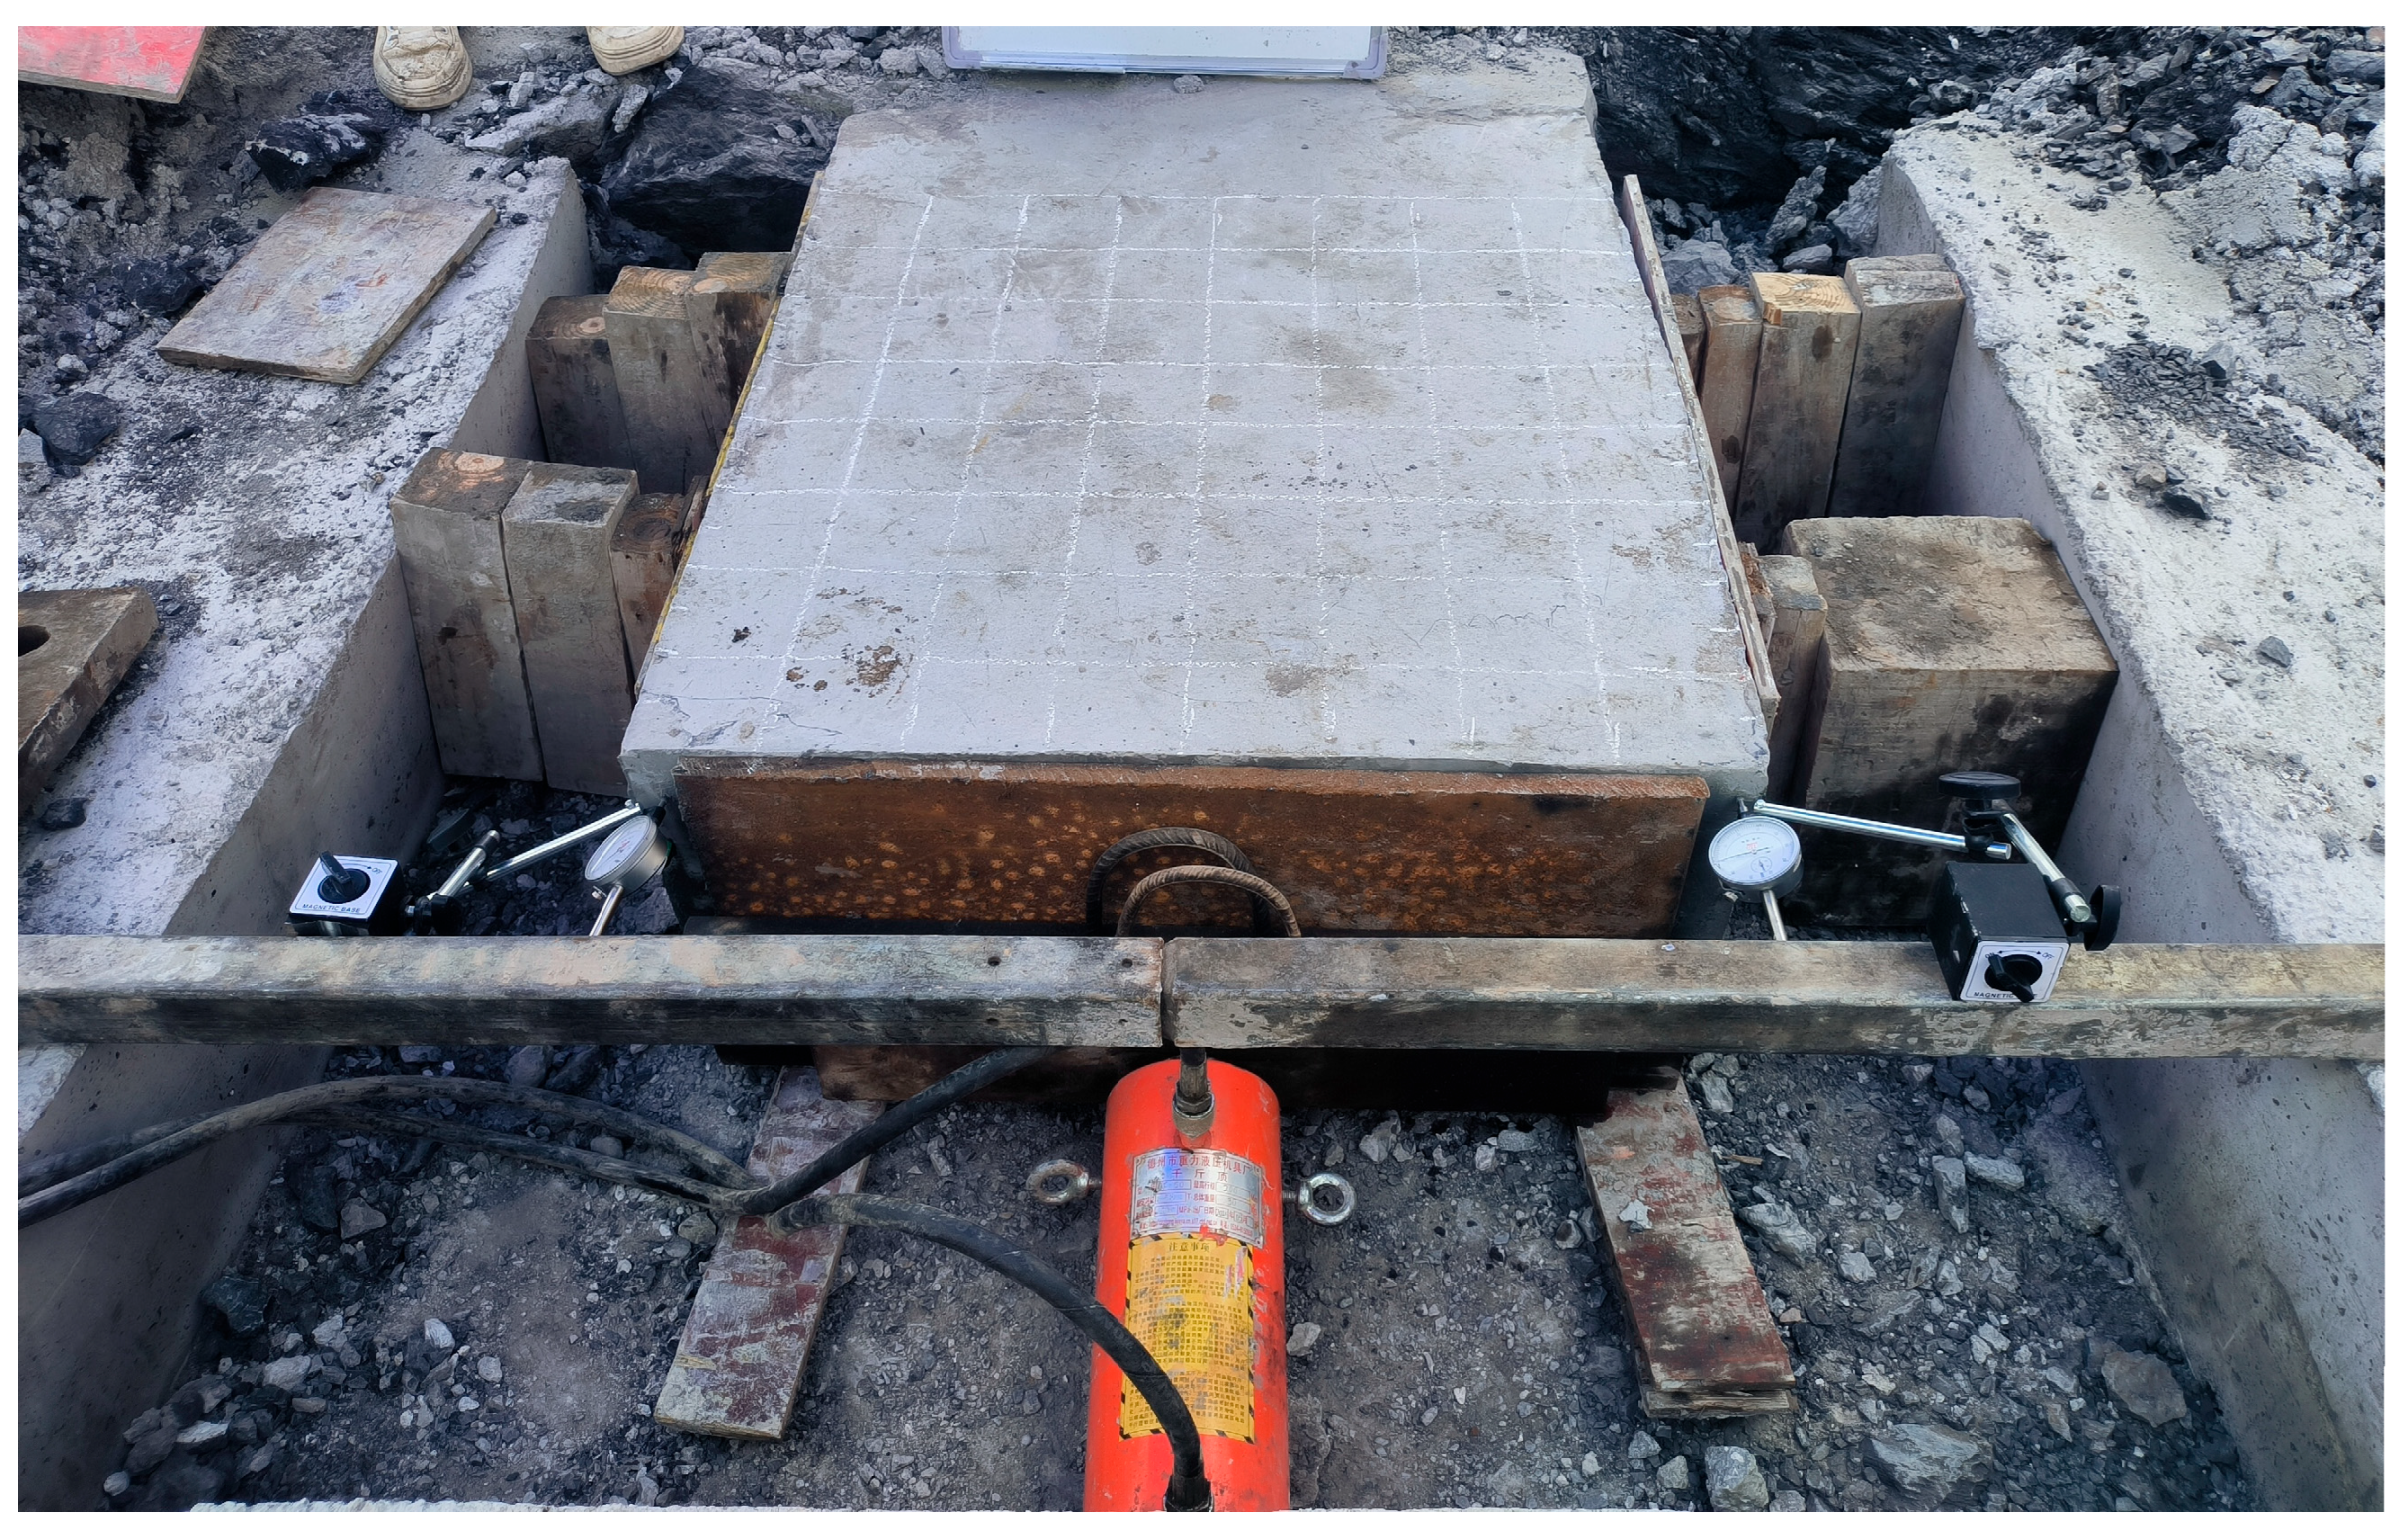
3.3. Sample Preparation and Equipment Installation
3.4. Test Procedure
4. Results and Discussion
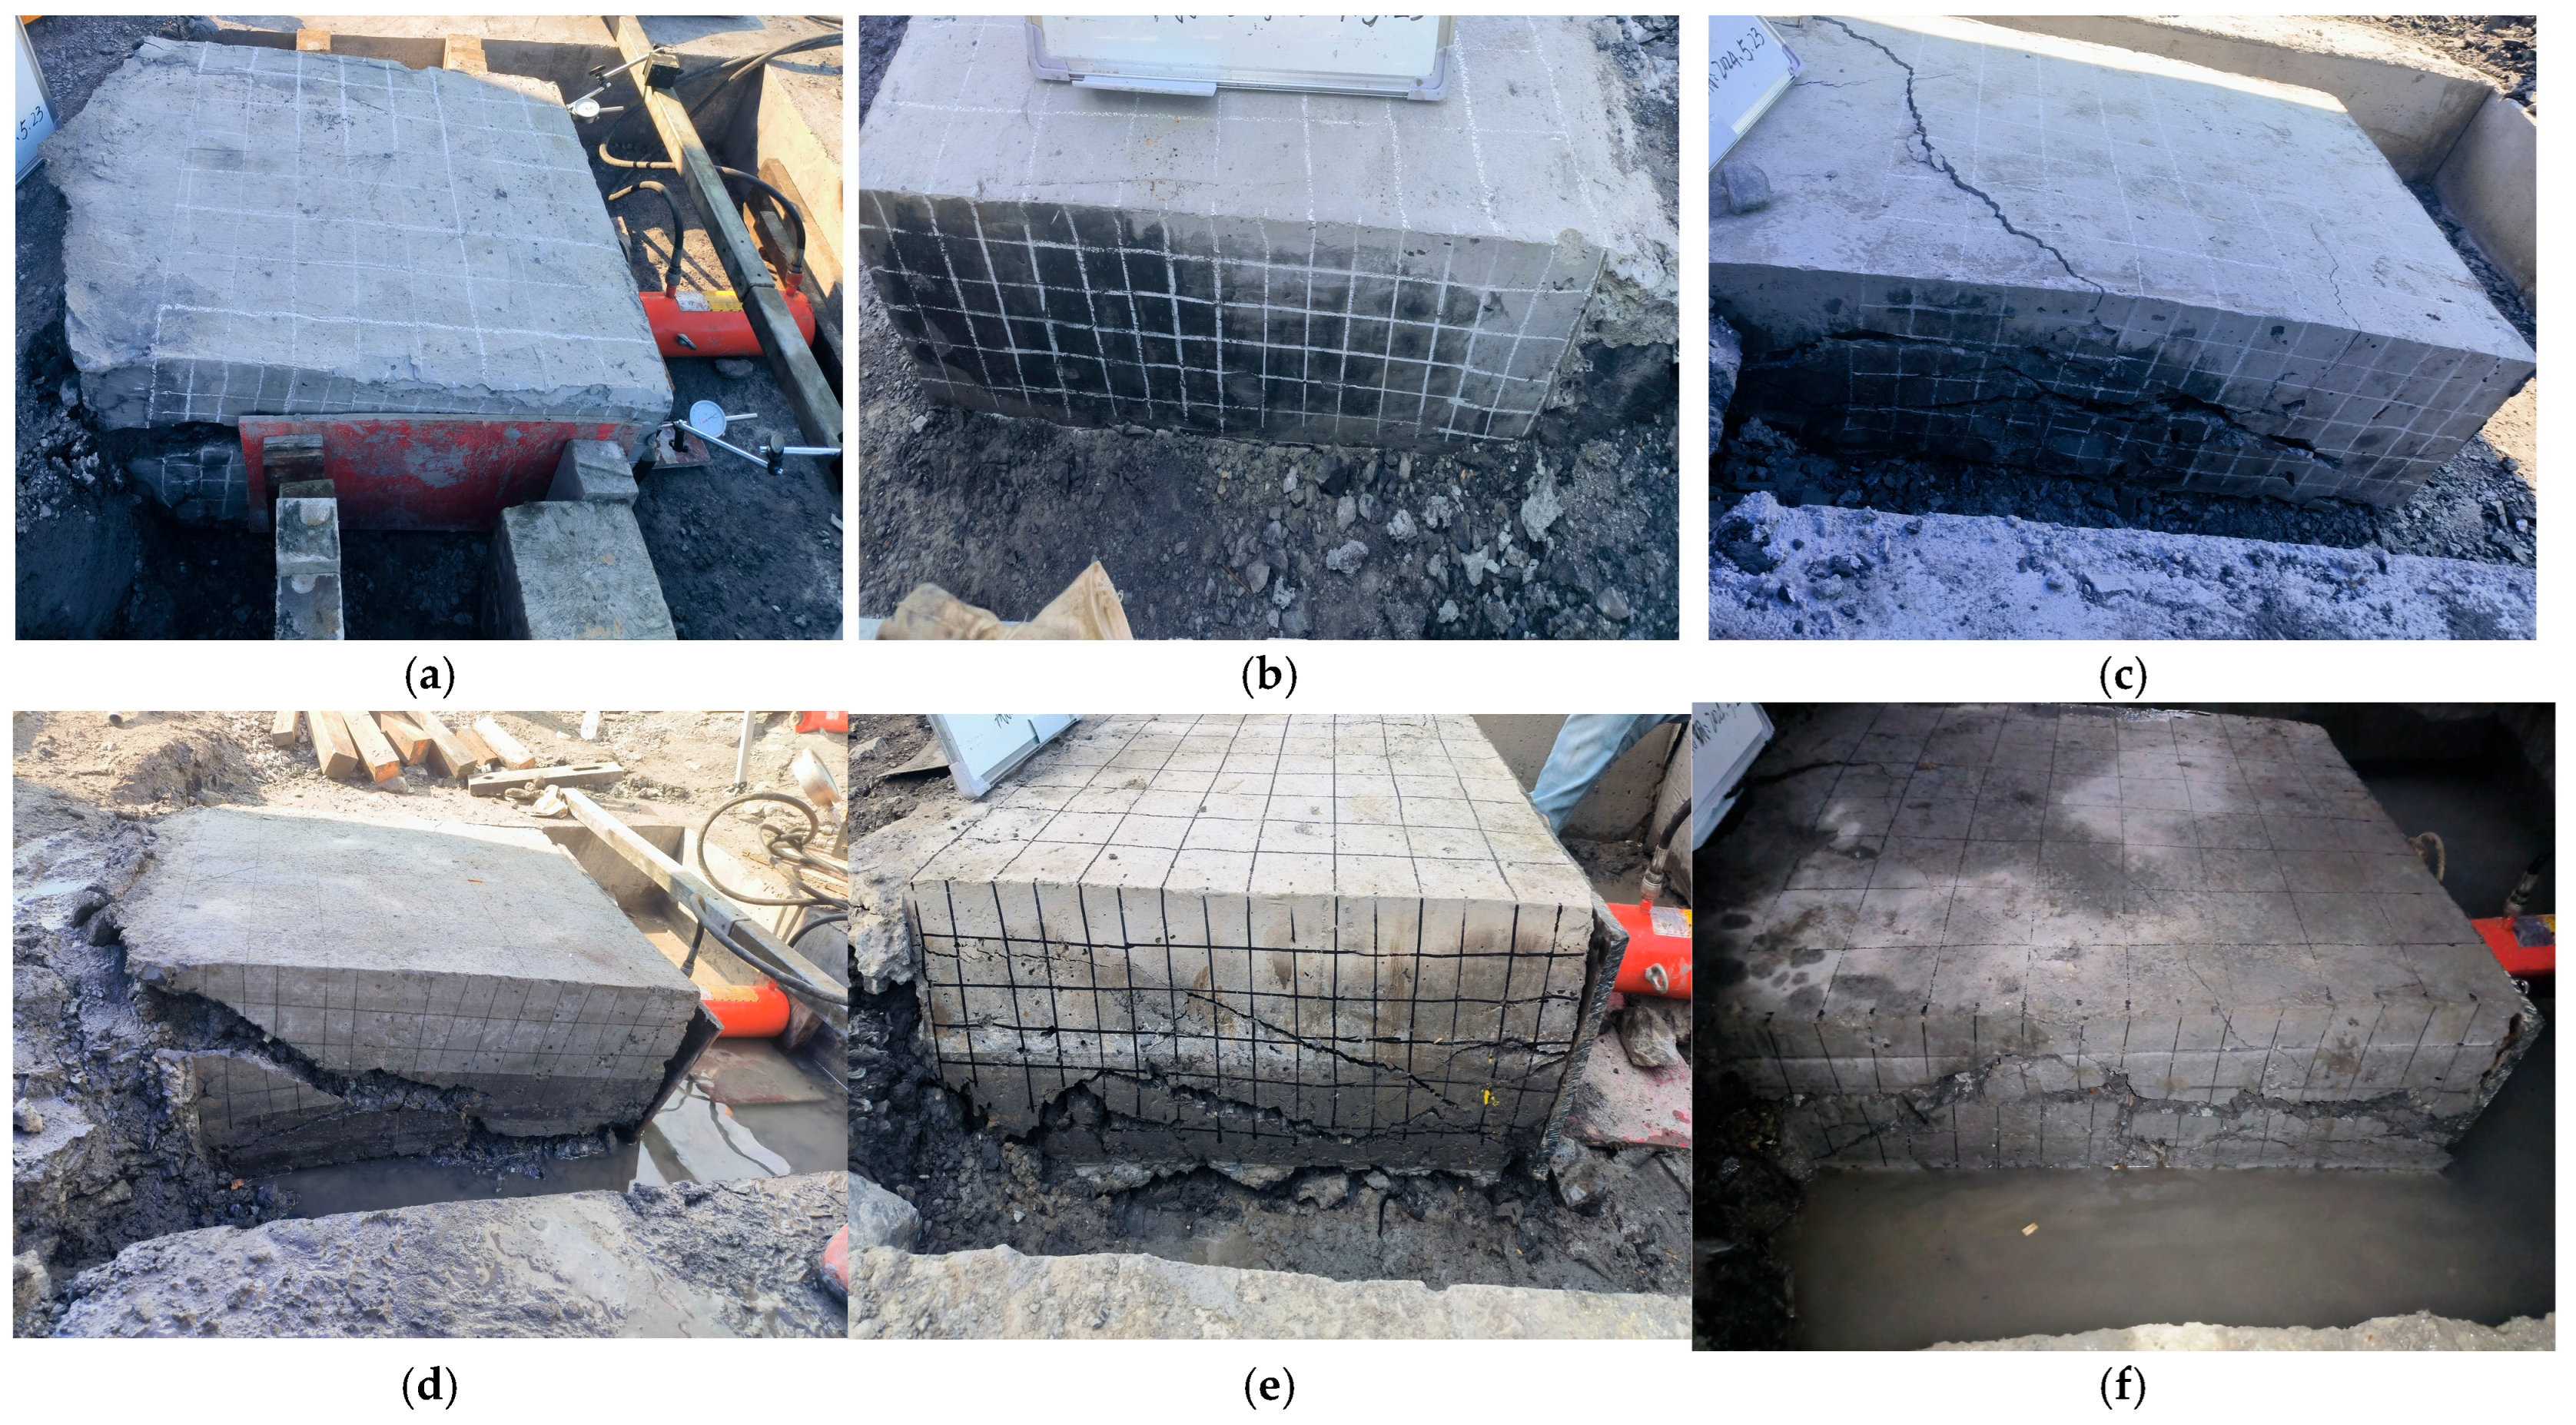
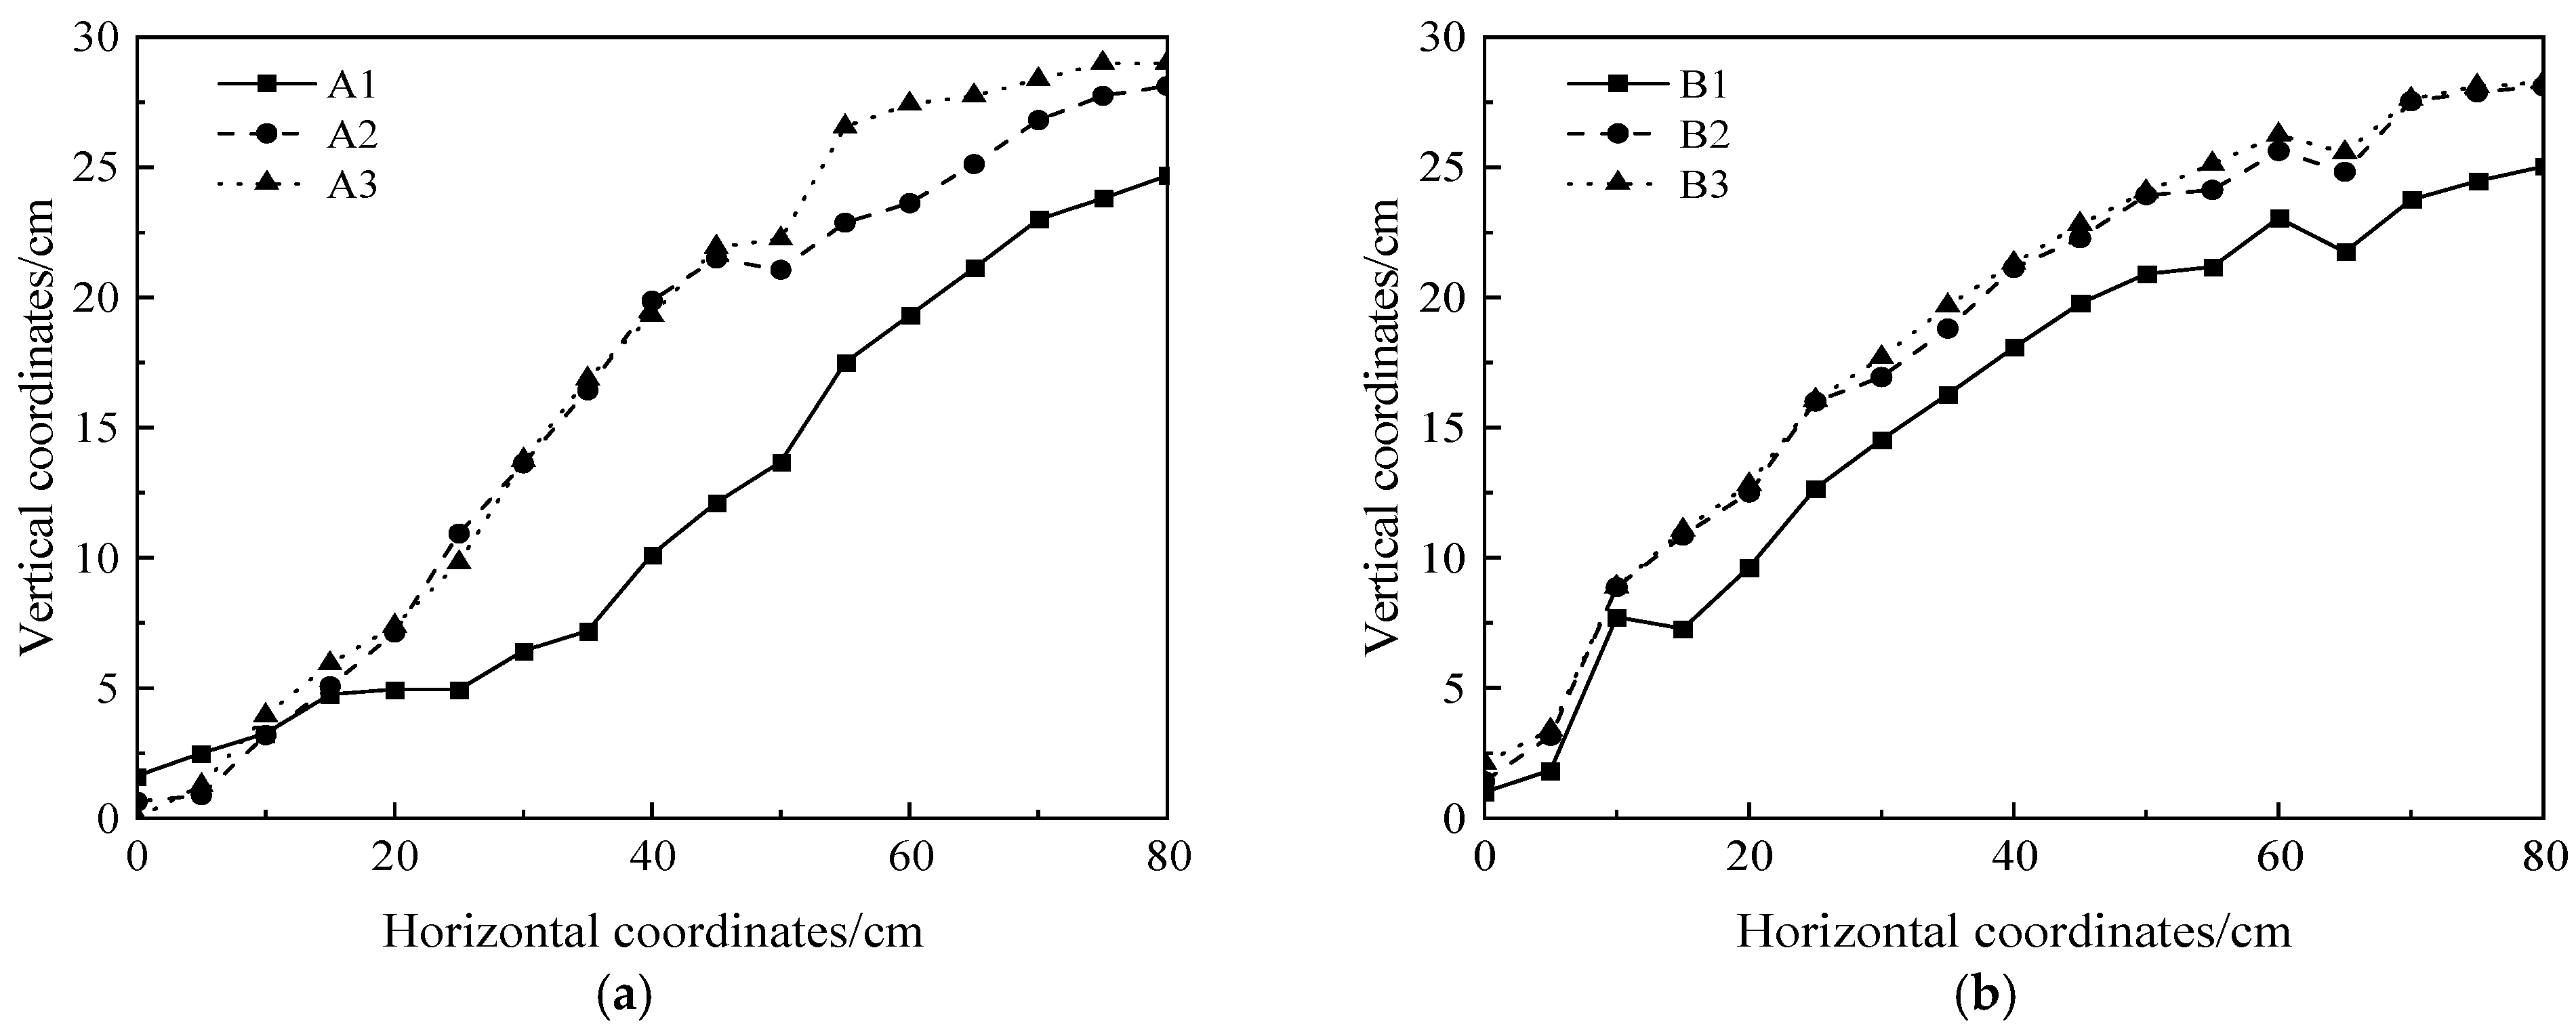
4.1. Destruction Form and Shape of Rupture Surface
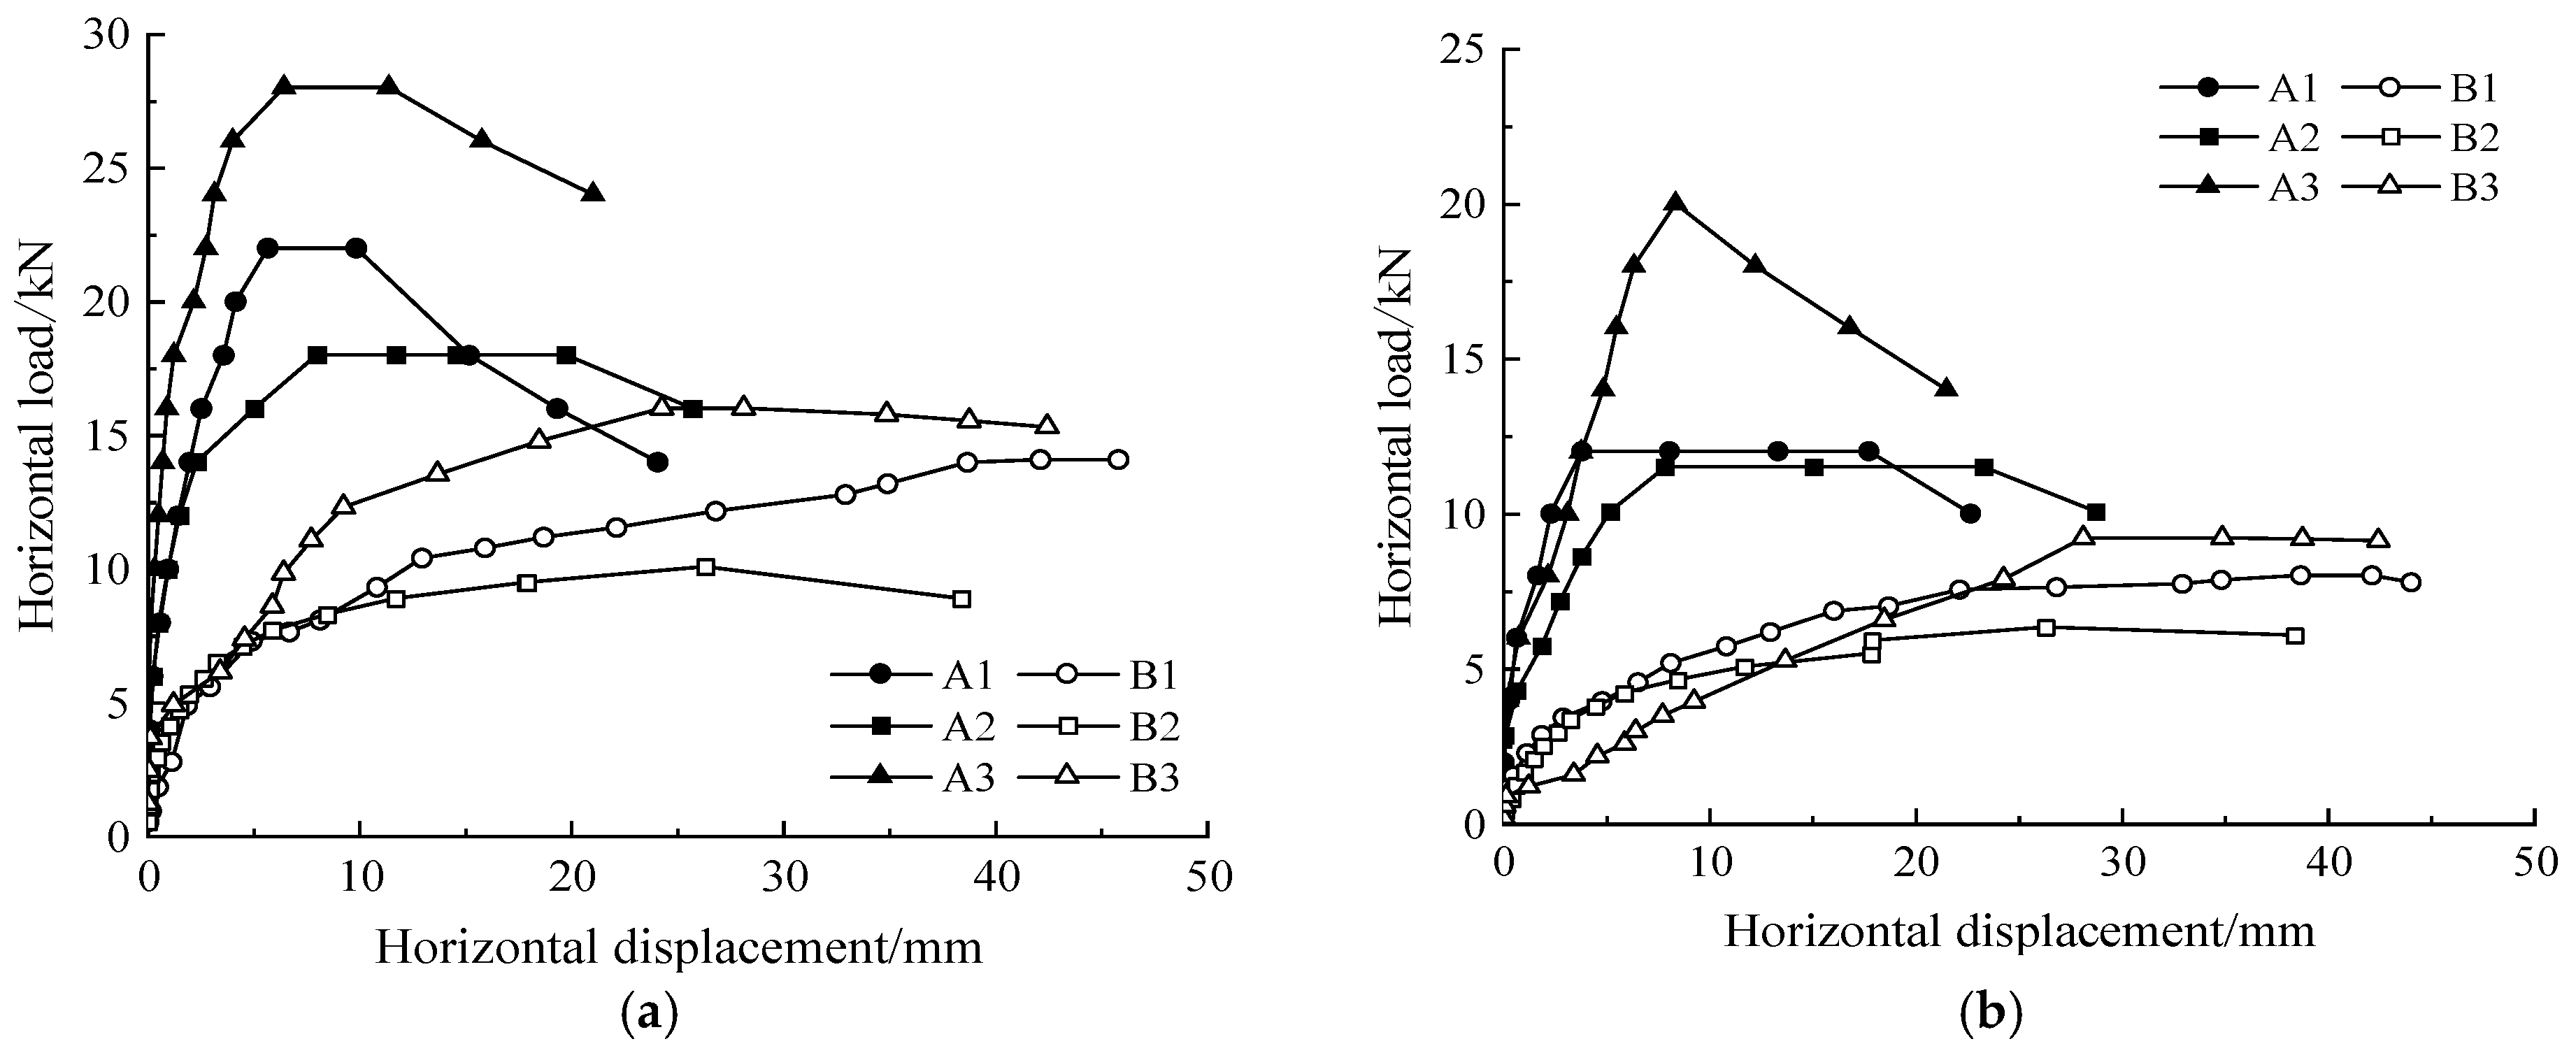
4.2. Push–Shear Force–Push–Shear Displacement Characteristics
4.3. Determination and Analysis of c and φ Values of Carbonaceous Mudstone
4.3.1. Determination of c and φ Values for Carbonaceous Mudstone
4.3.2. Analysis of c and φ Values of Carbonaceous Mudstone
5. Stability Analysis of High Slope of Carbonaceous Mudstone Based on Numerical Simulation
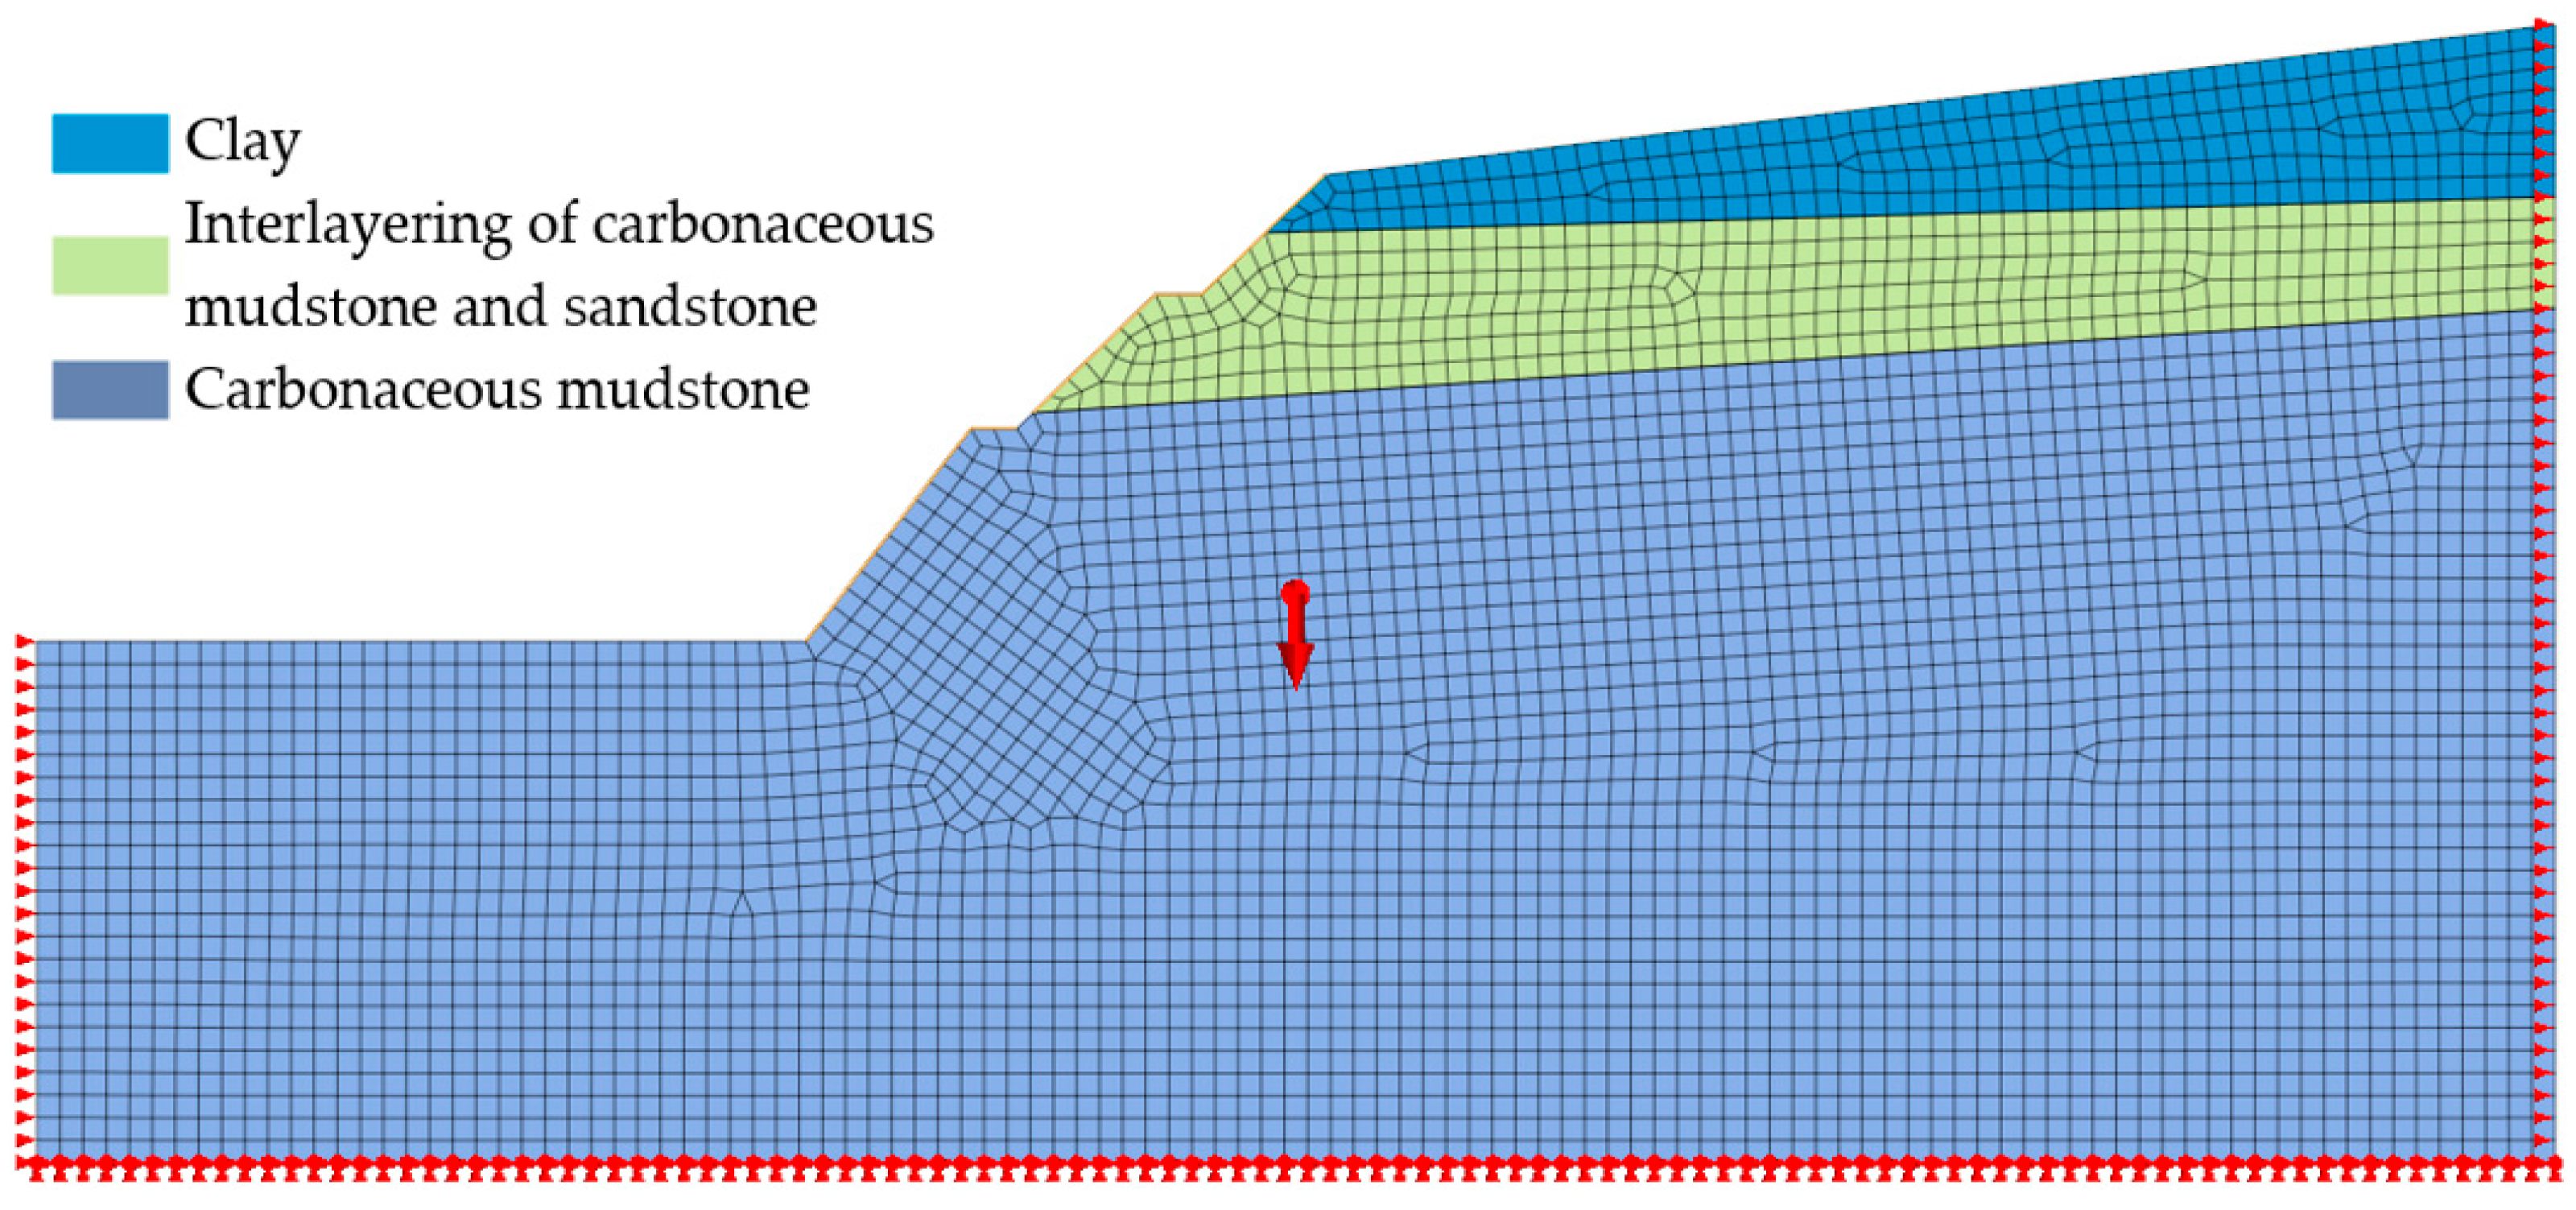
5.1. Establishment of Slope Model
5.2. Determination of Geological Material Parameters
5.3. Stability Analysis of Slope Excavation
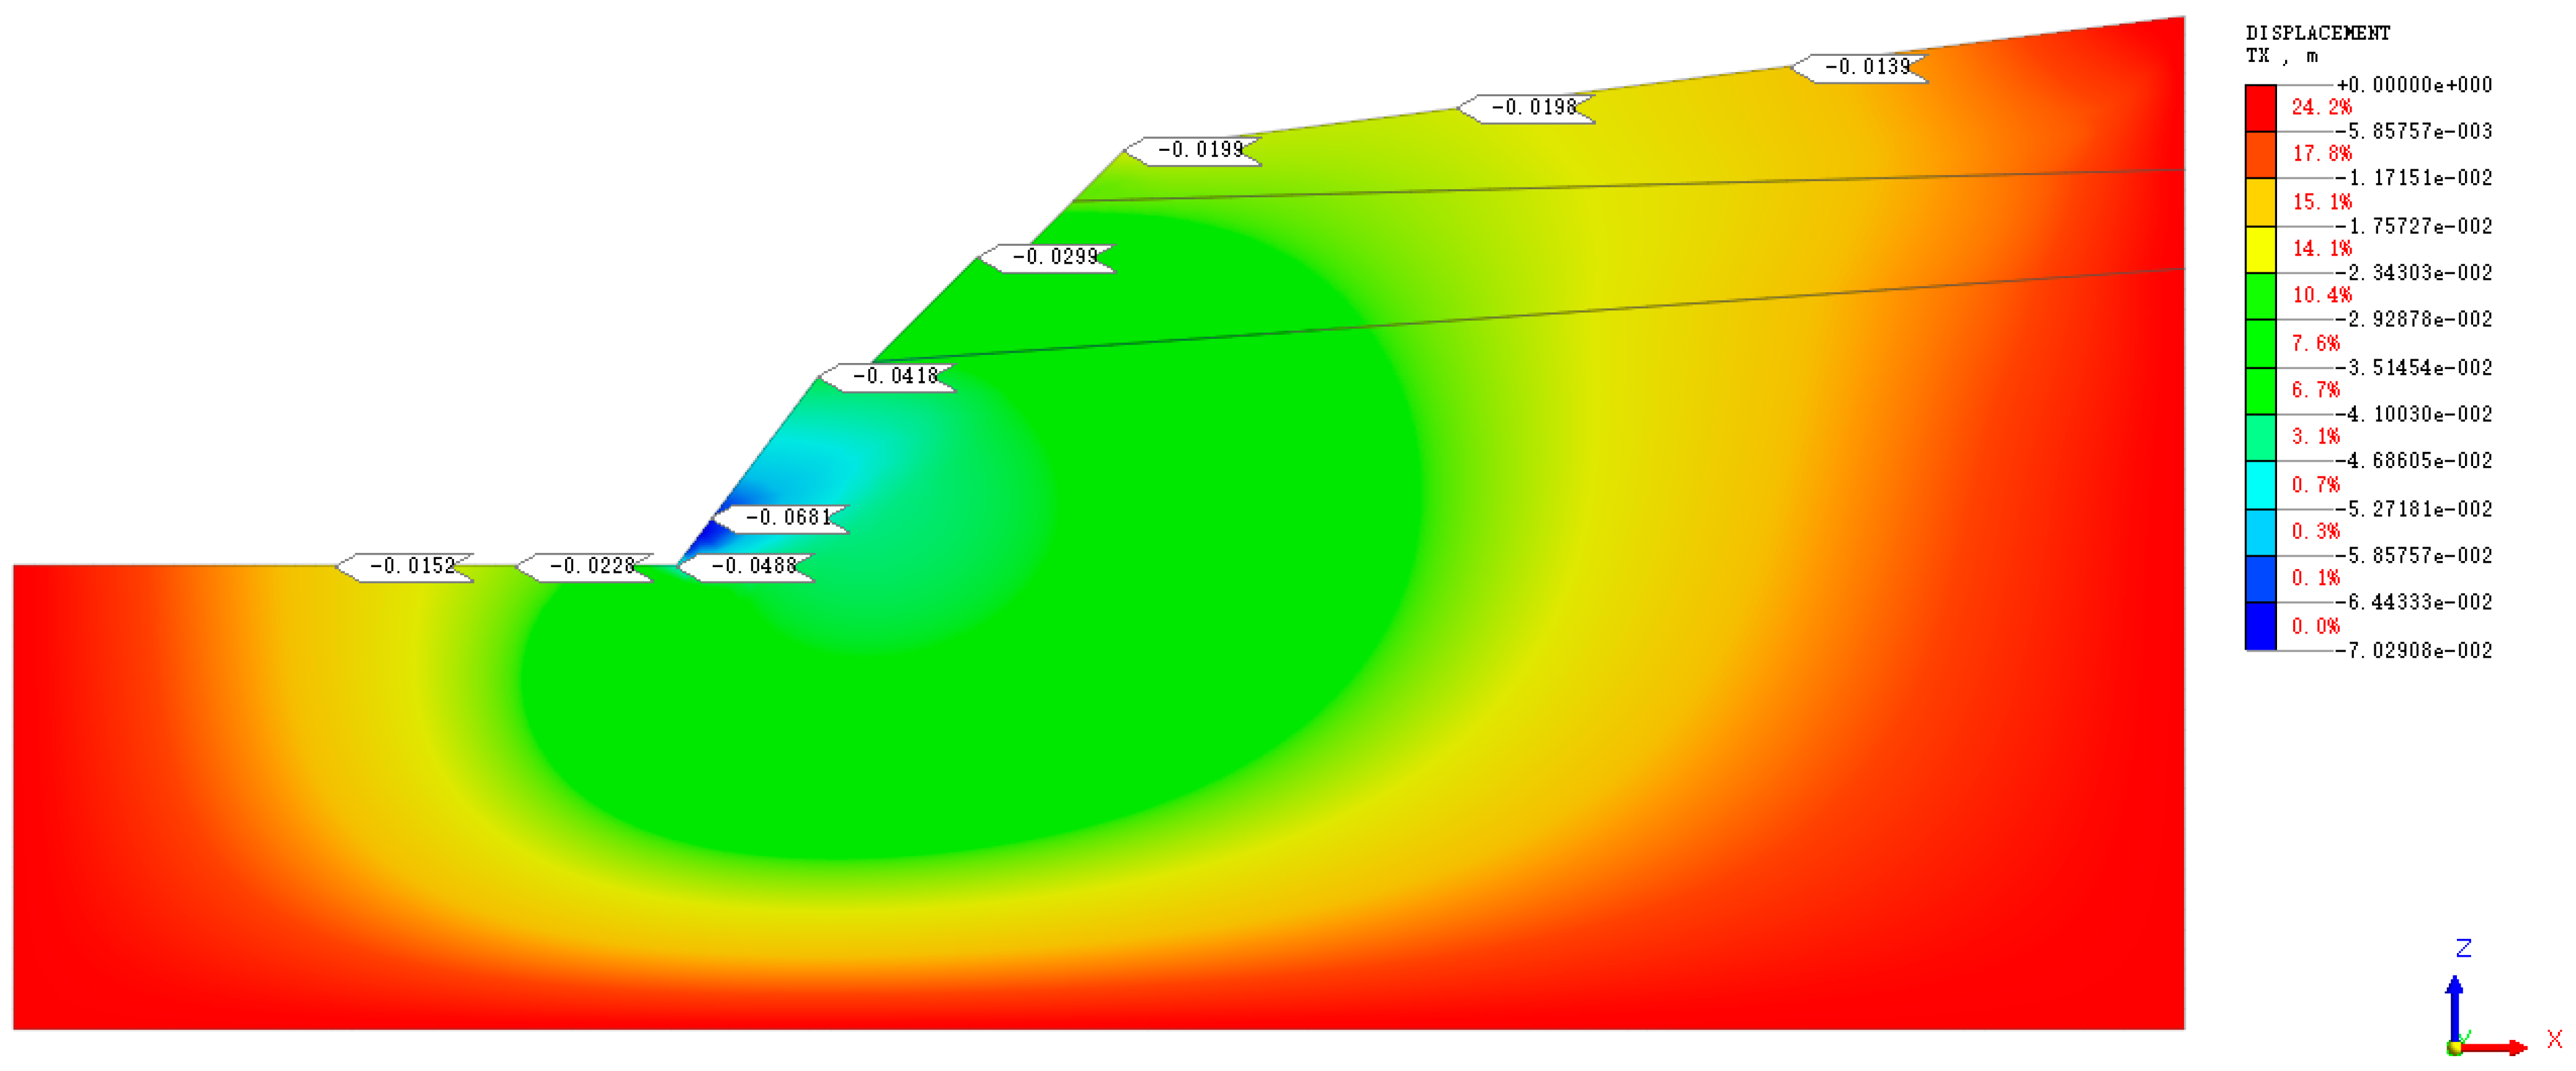
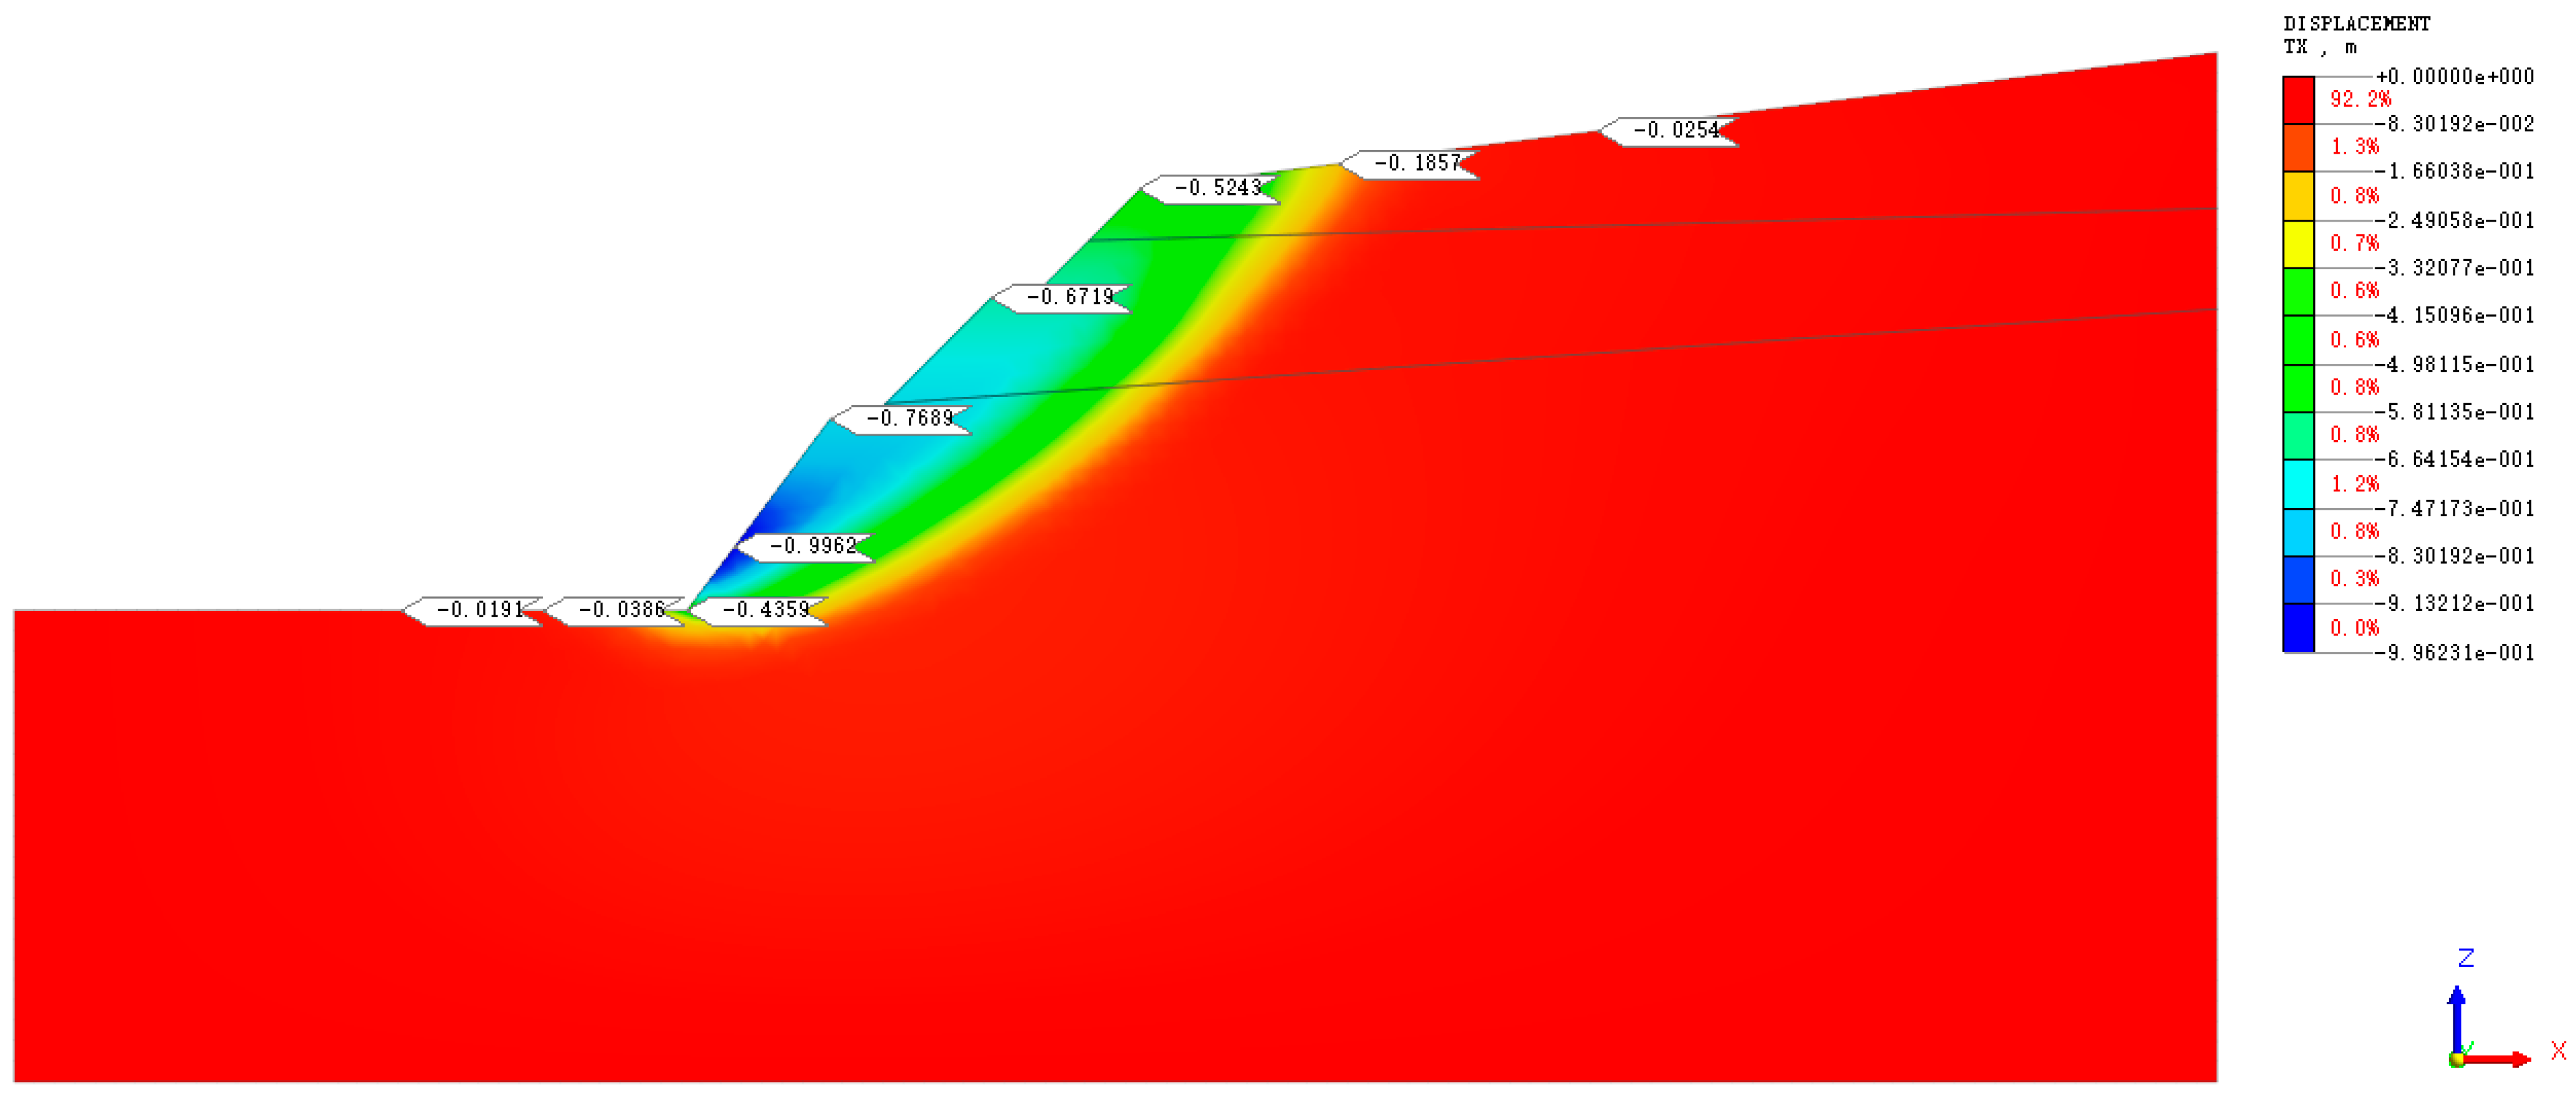
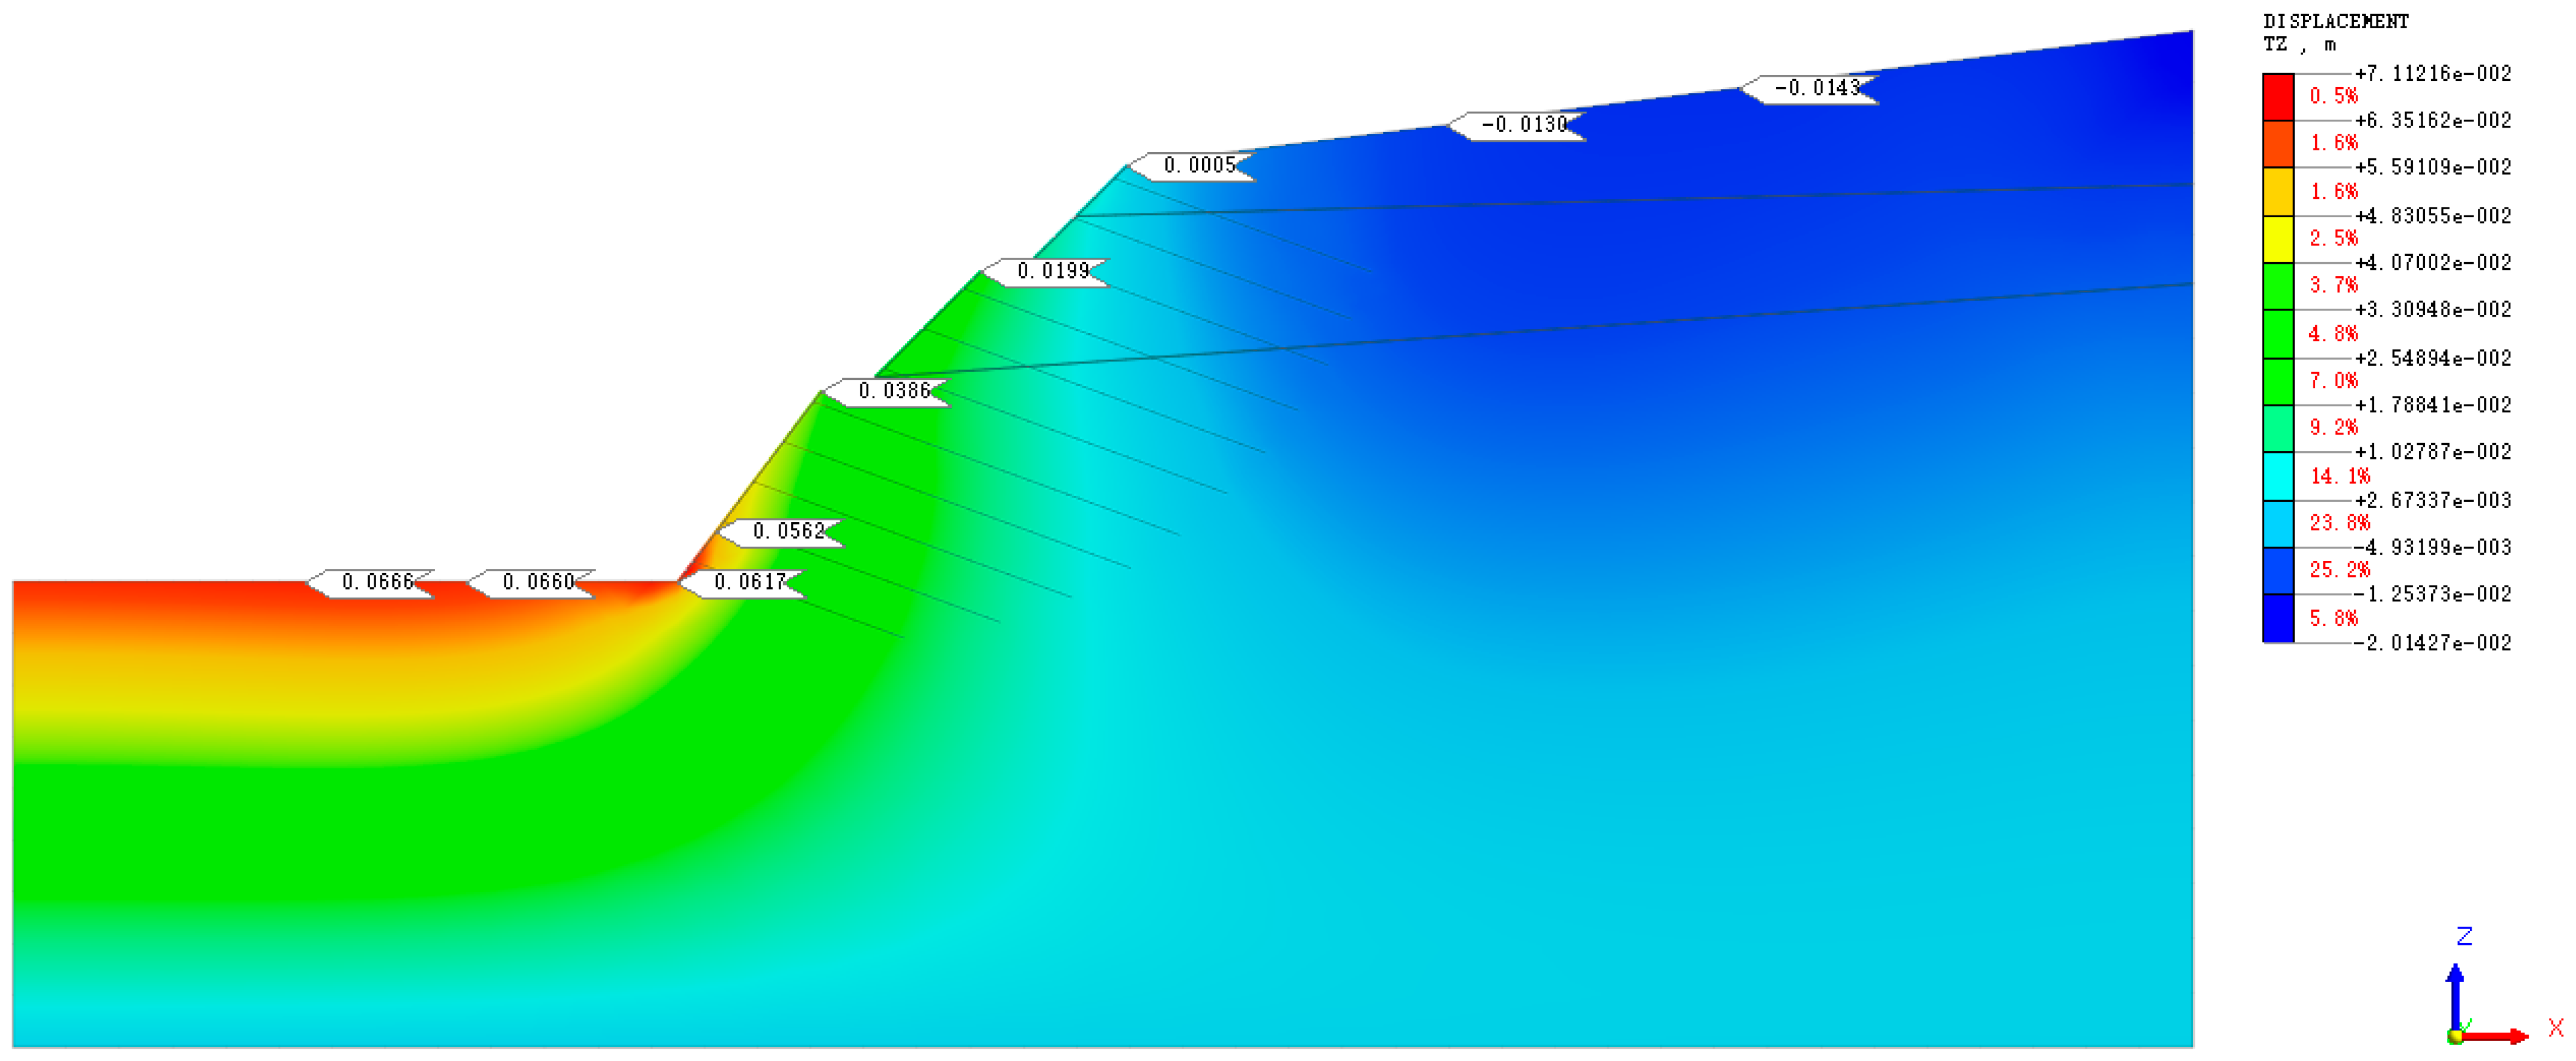
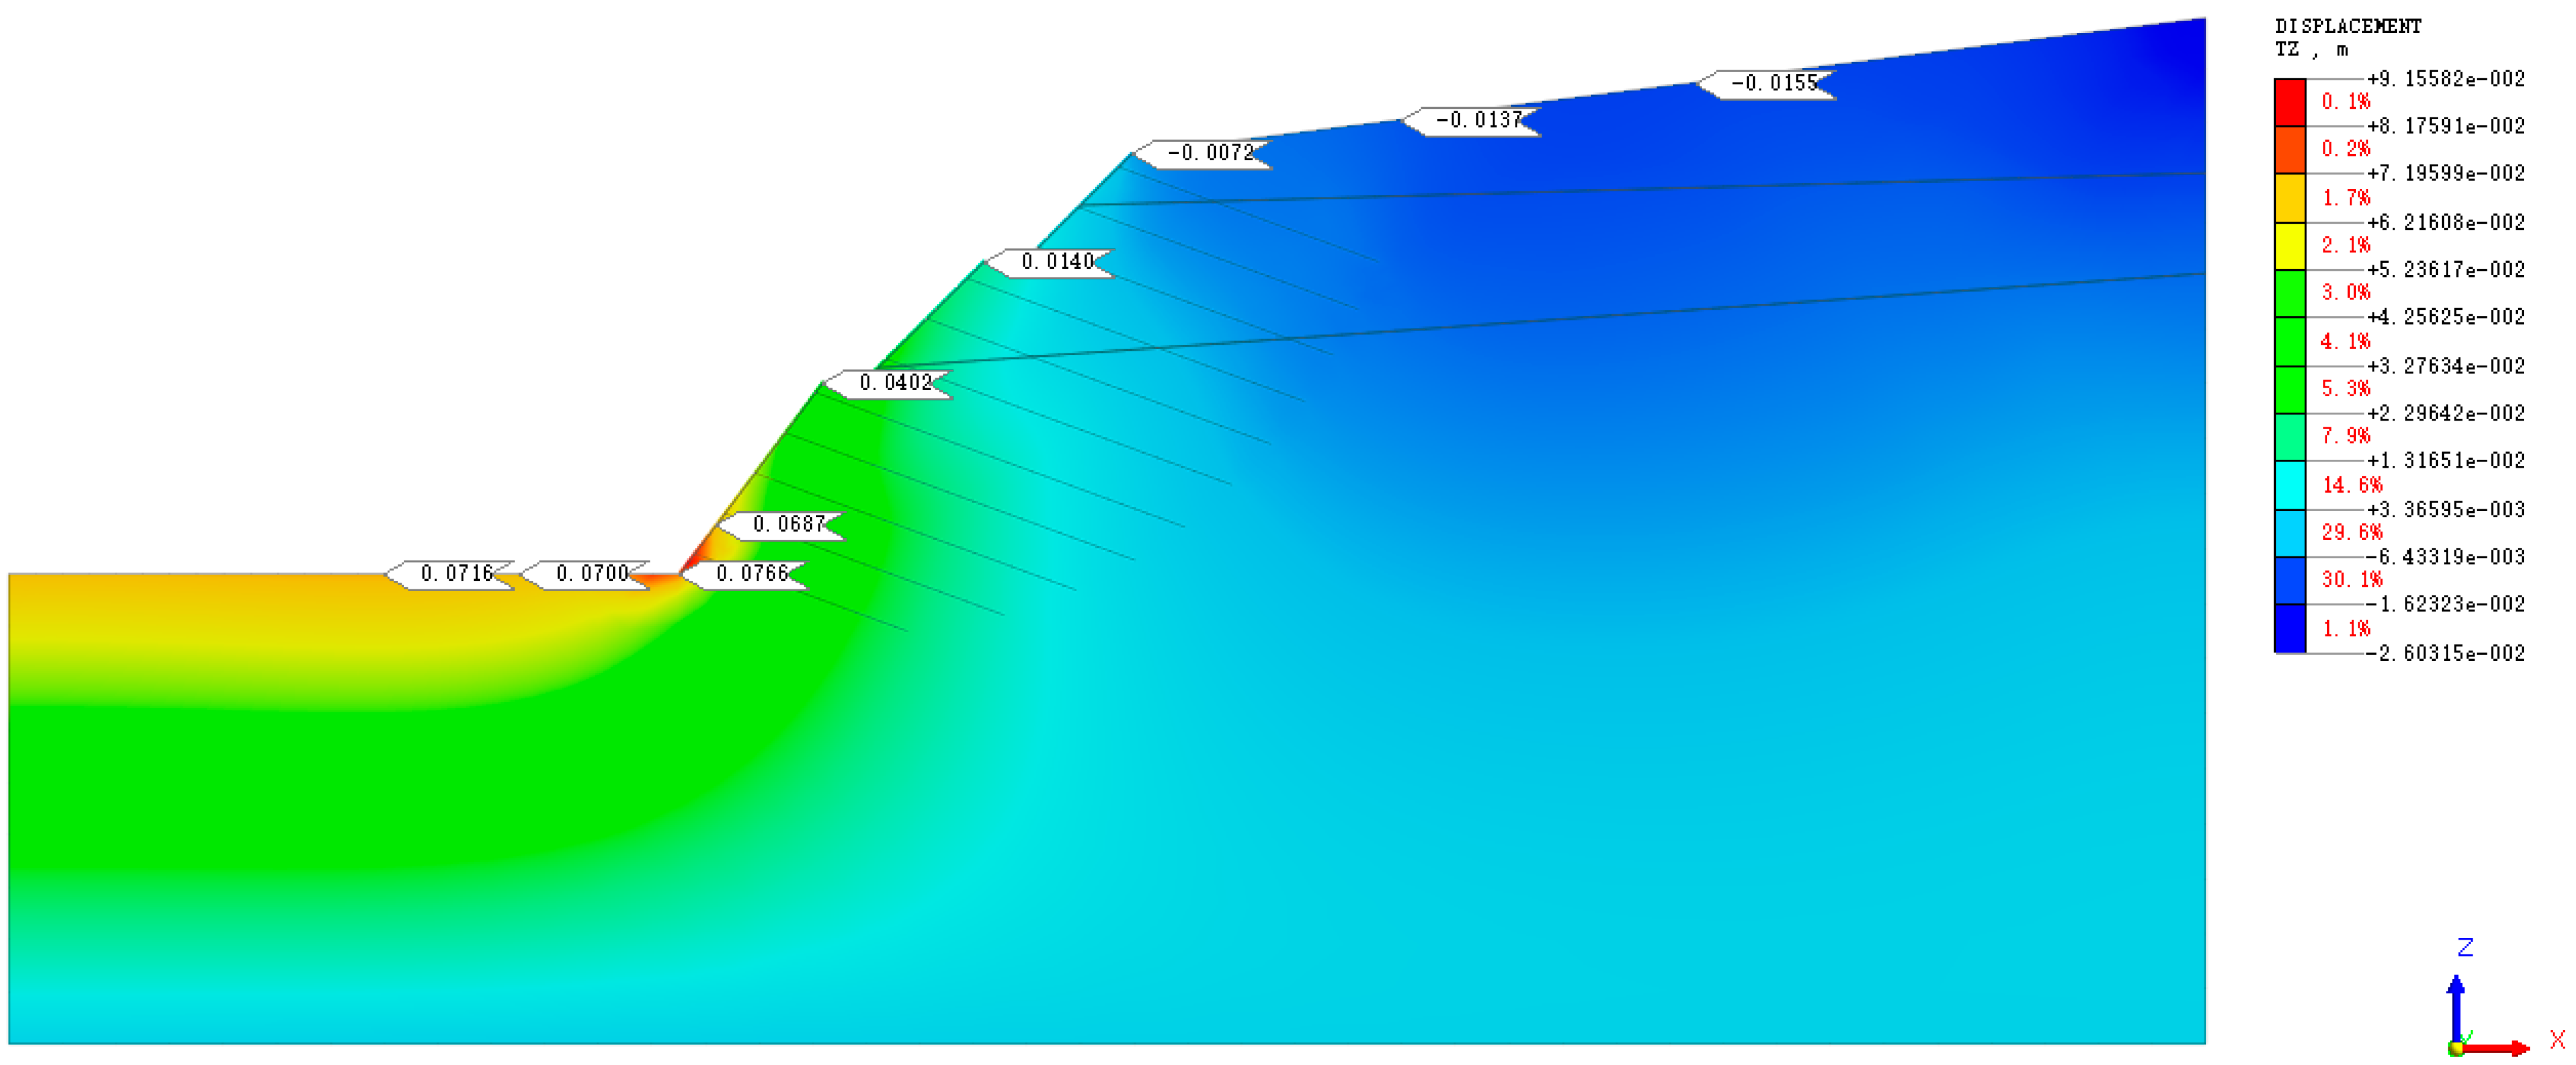
5.3.1. Horizontal Displacement Analysis of Slope
Natural State
Saturated State
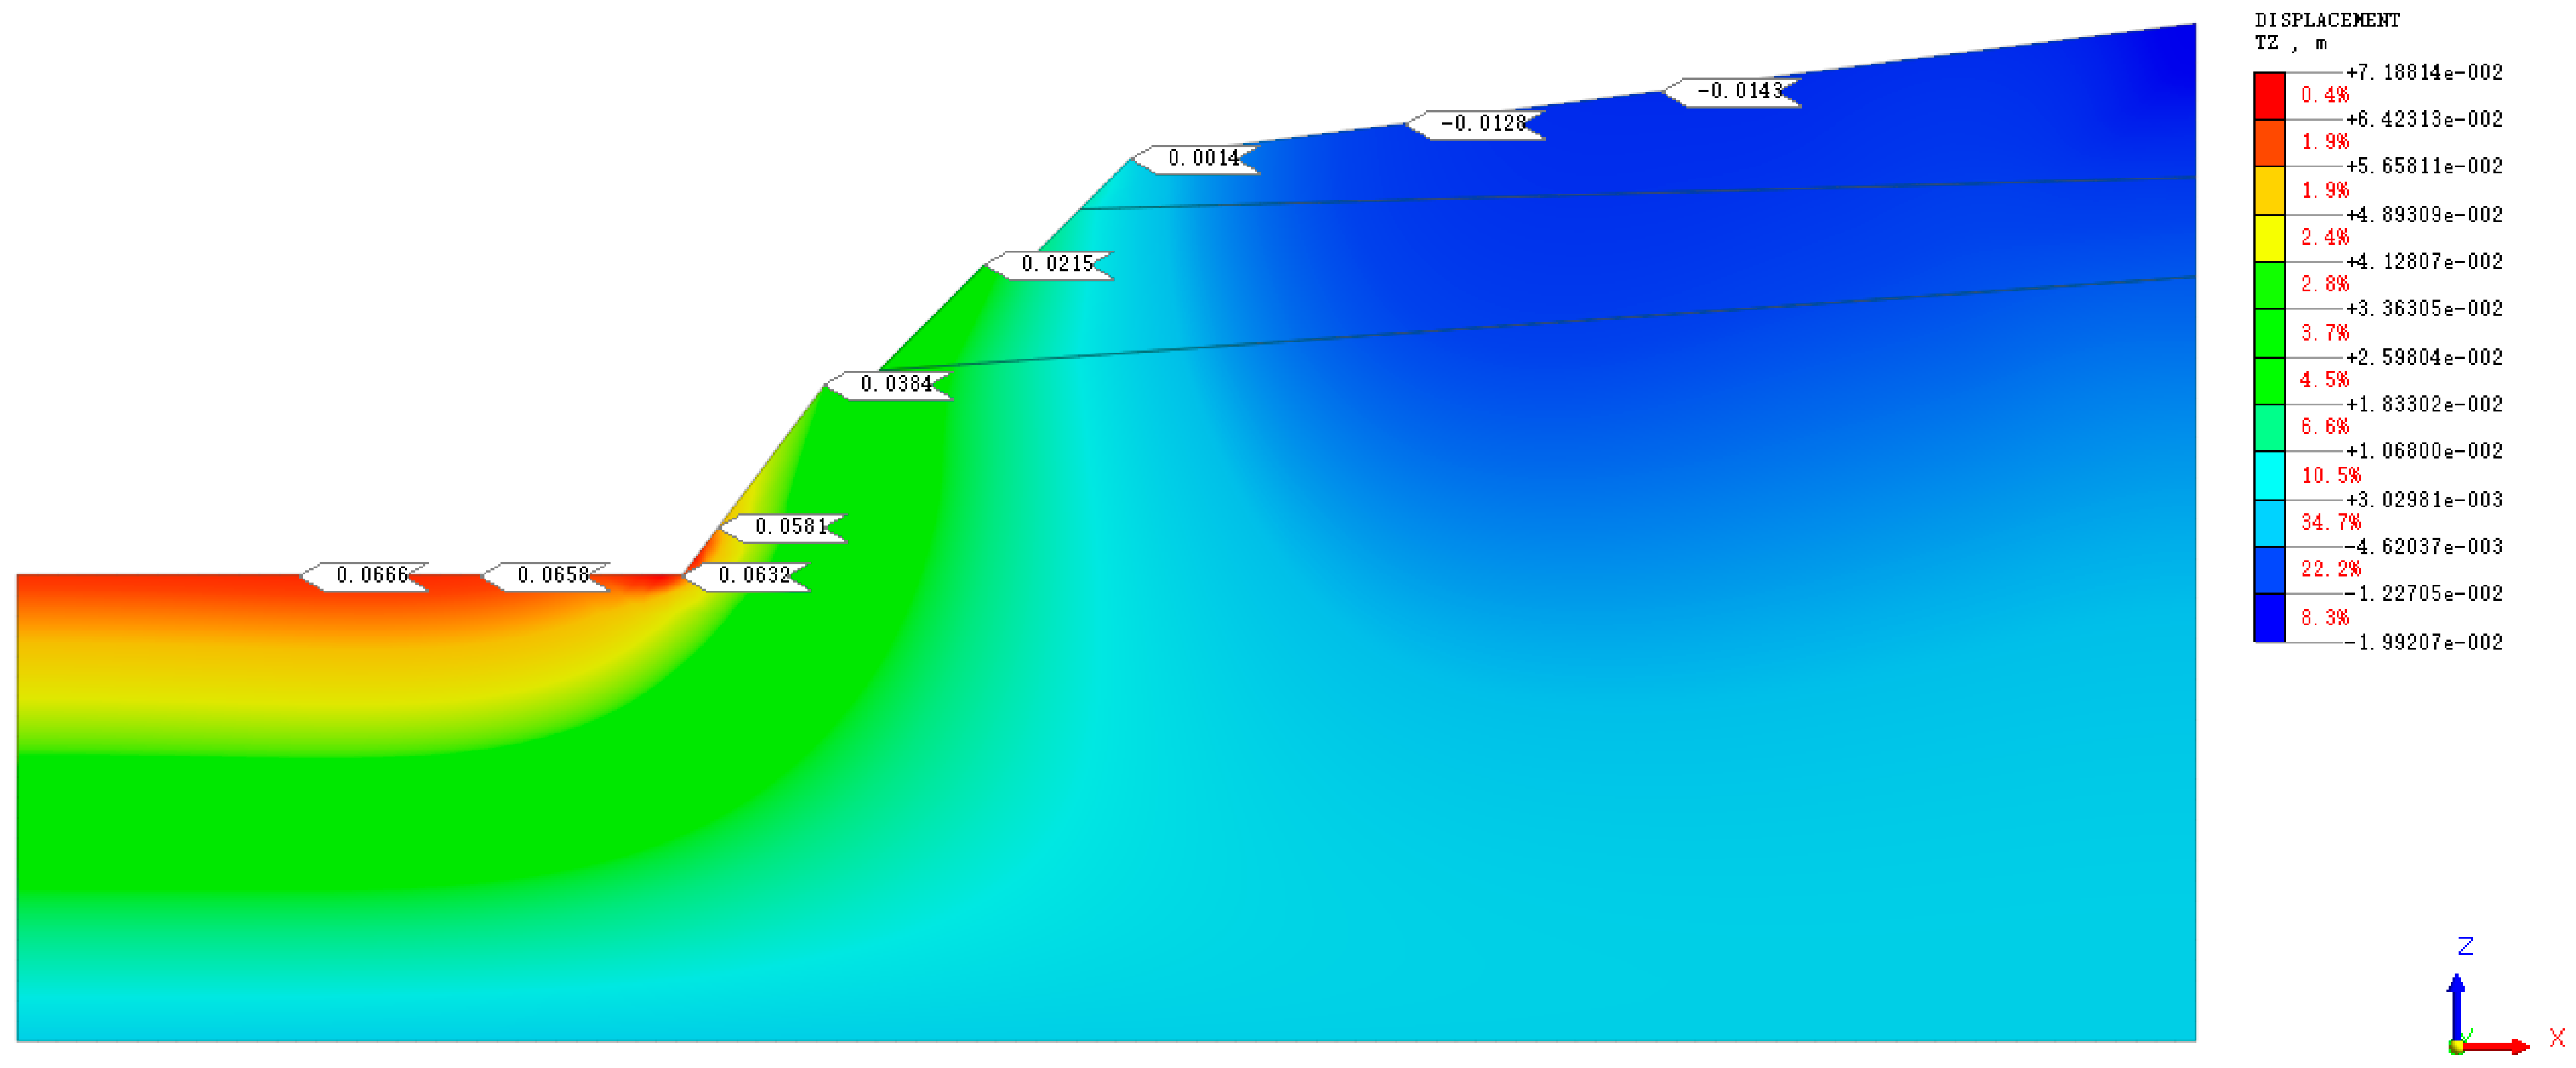
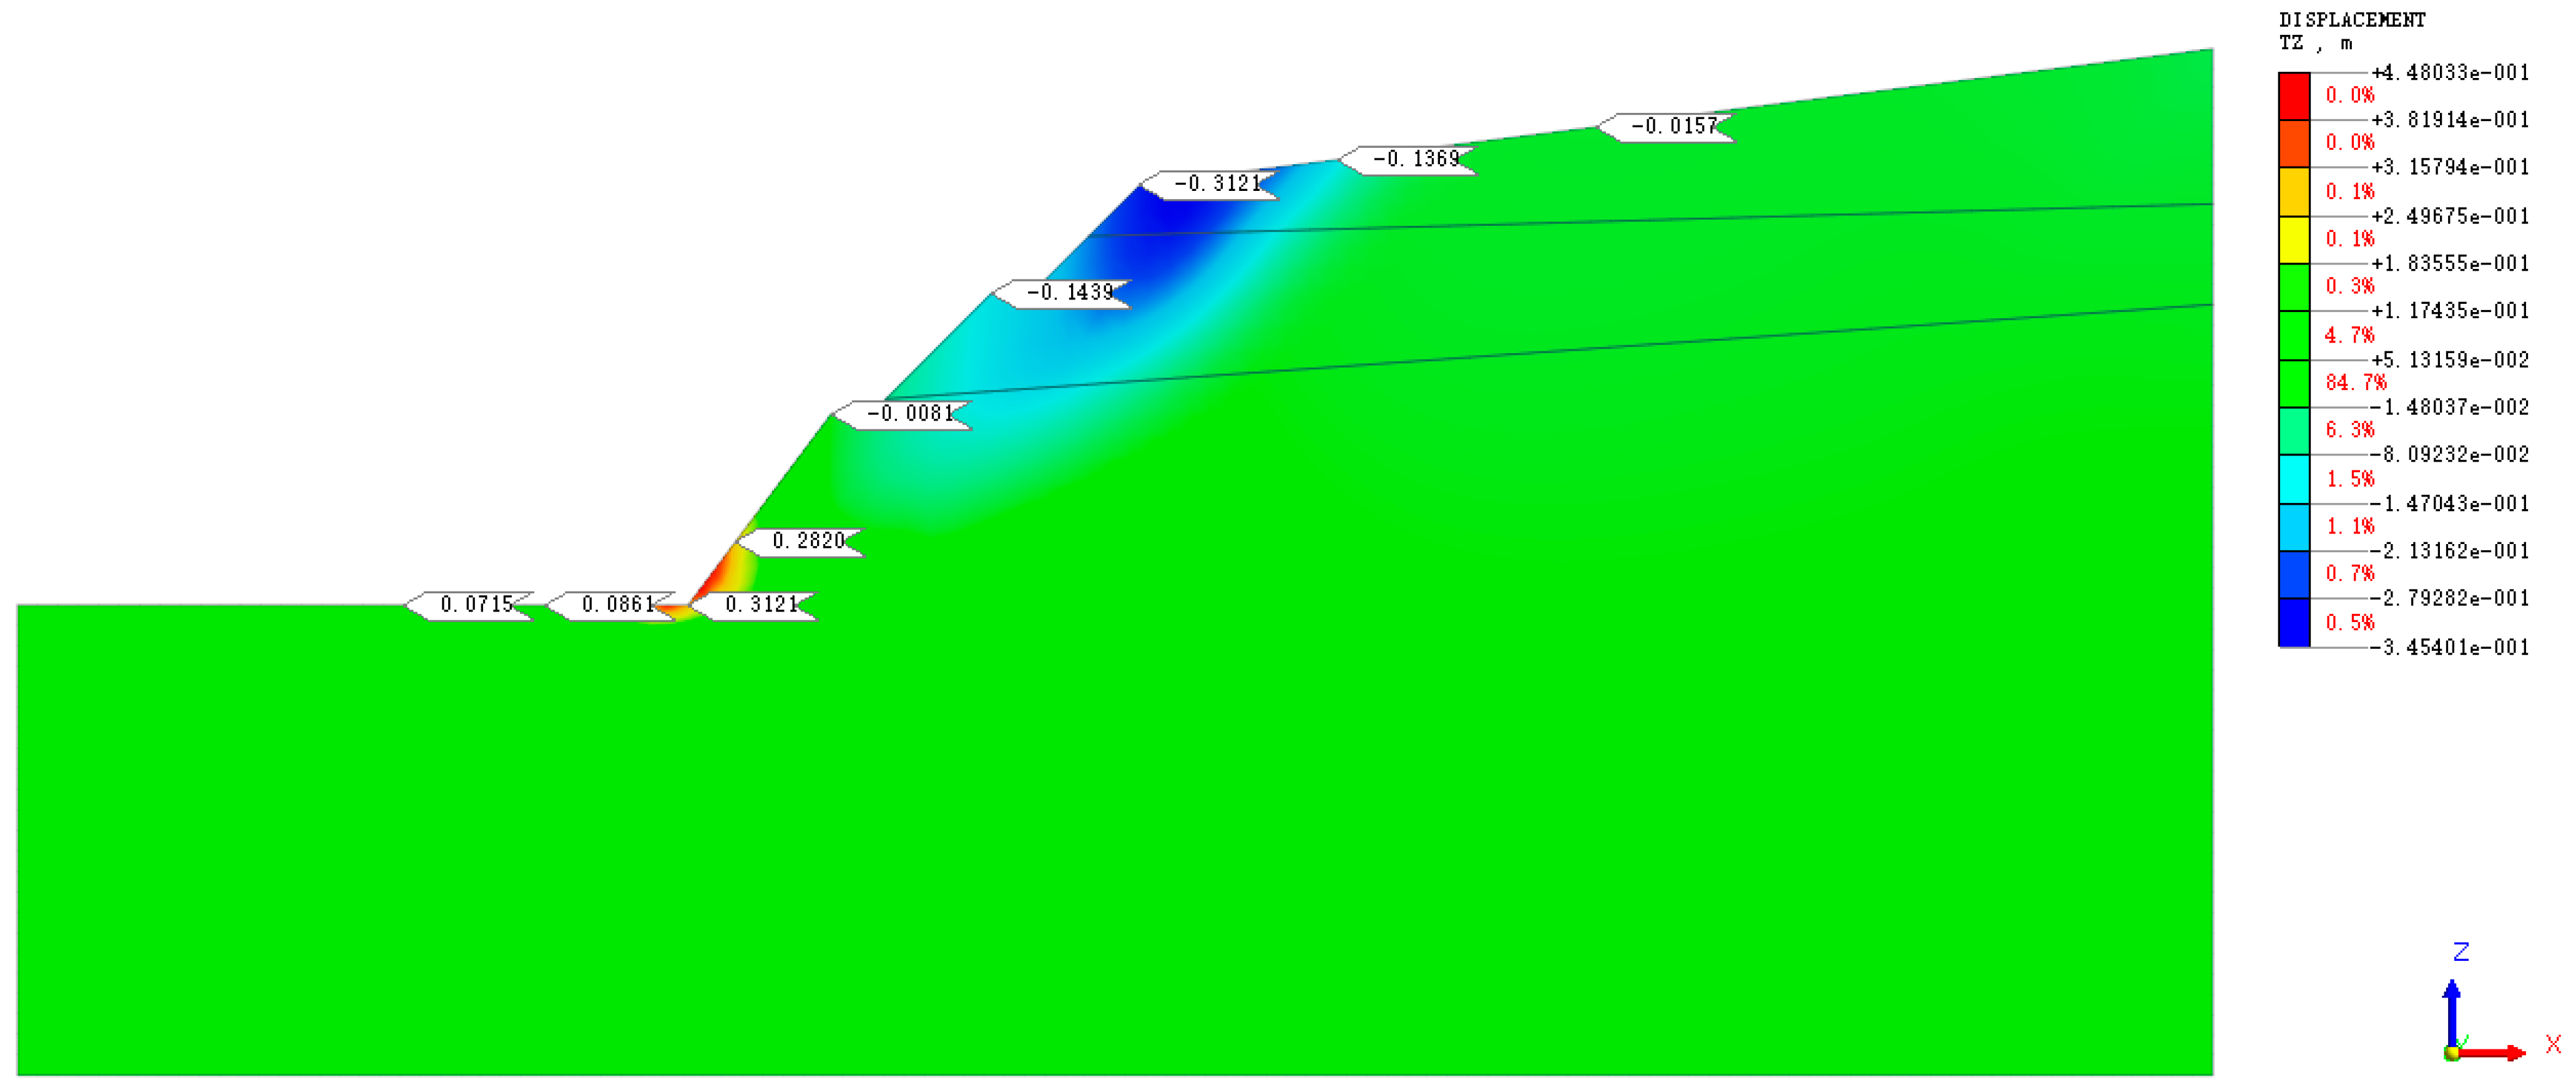
5.3.2. Vertical Settlement Displacement Analysis of Slope
Natural State
Saturated State
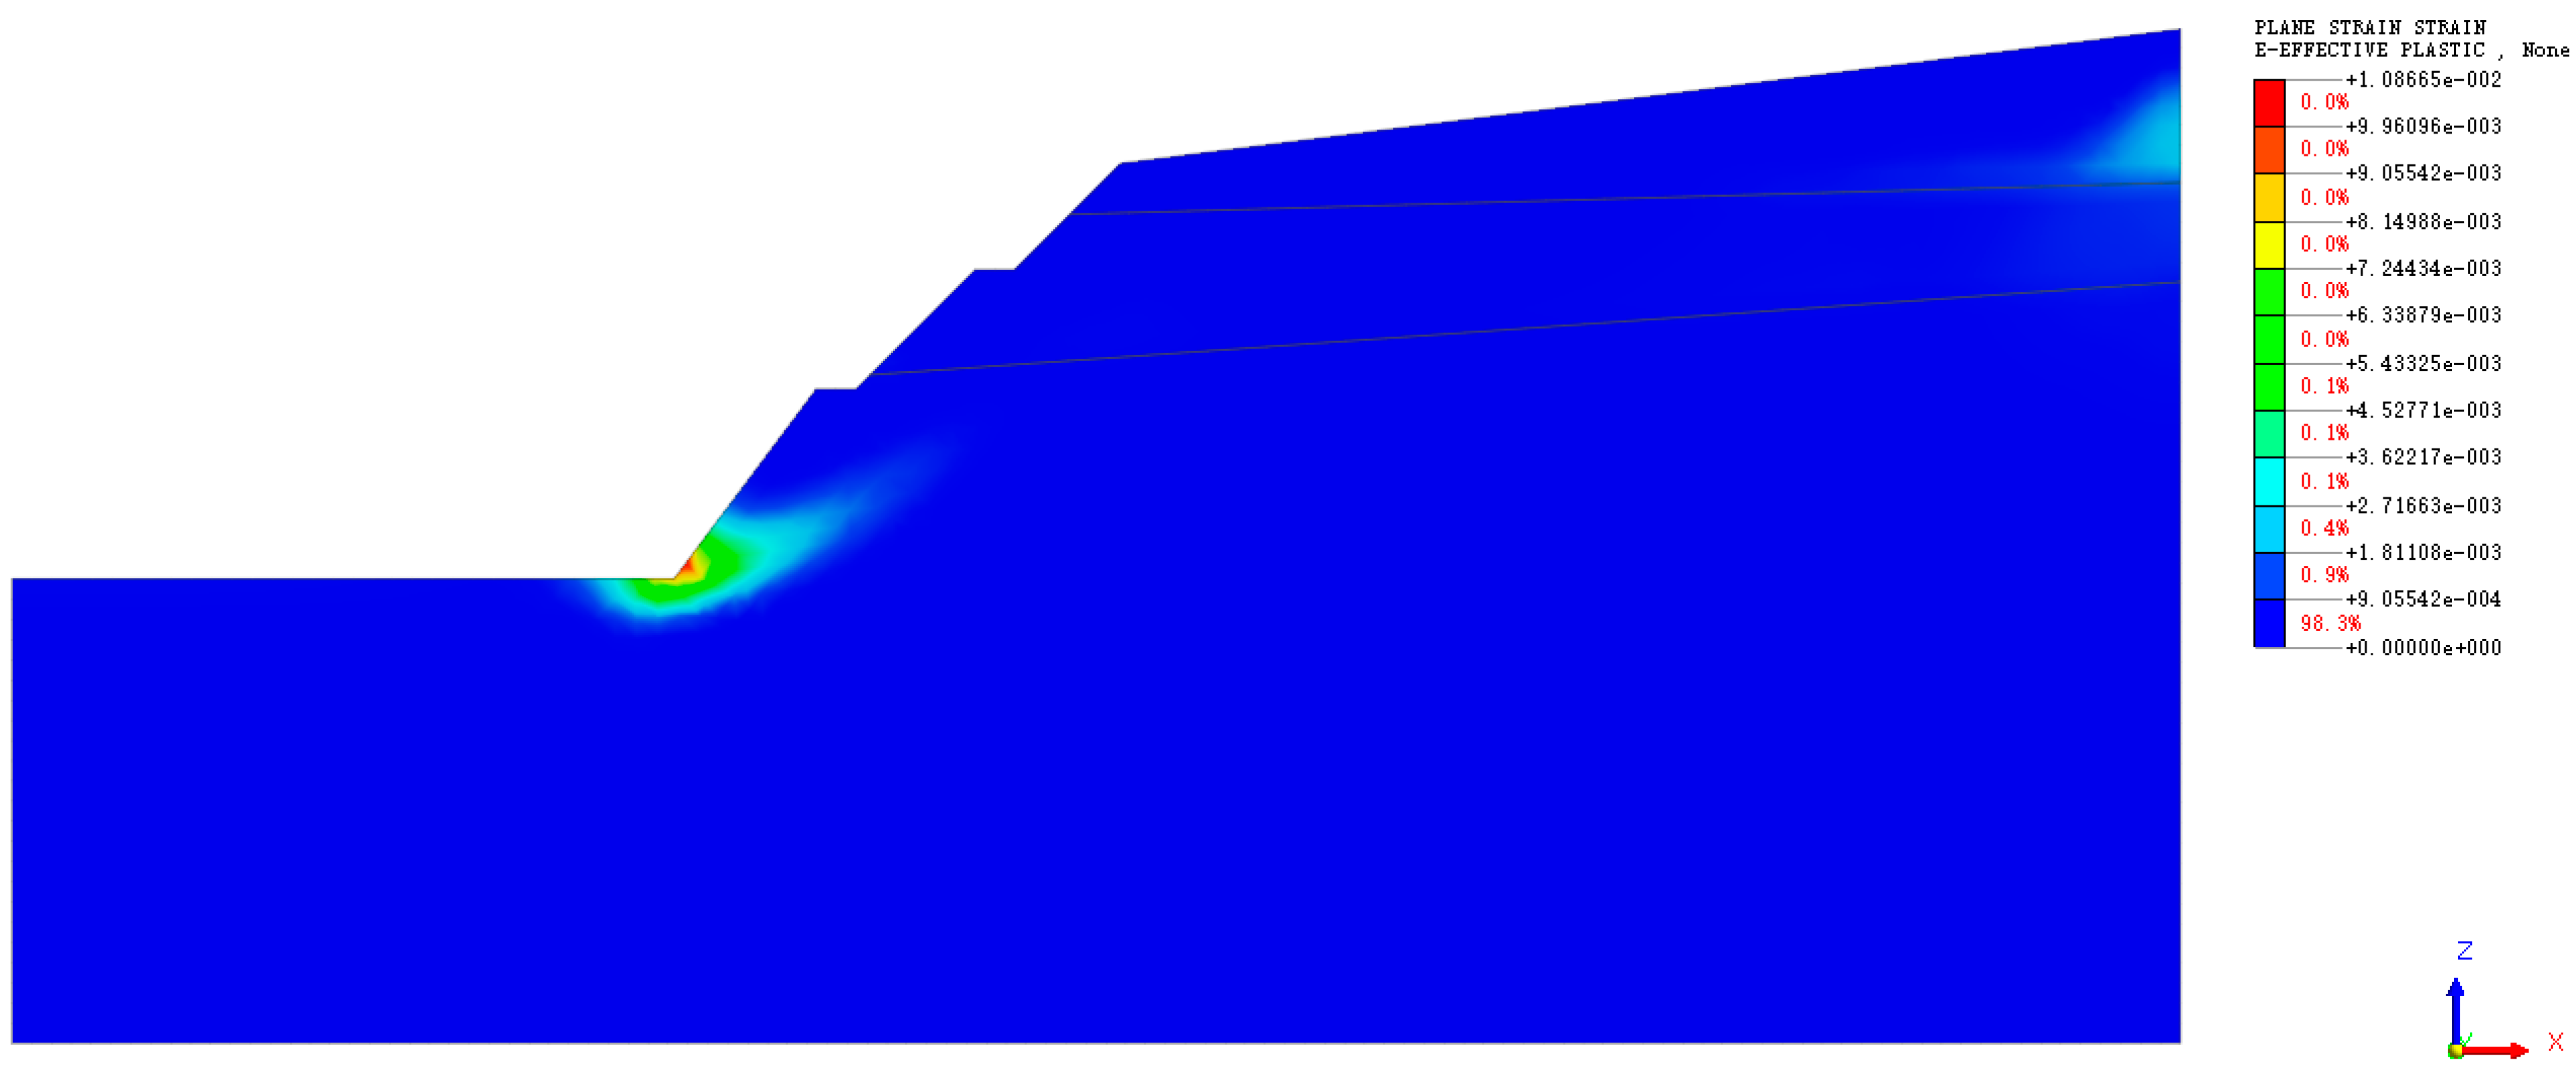
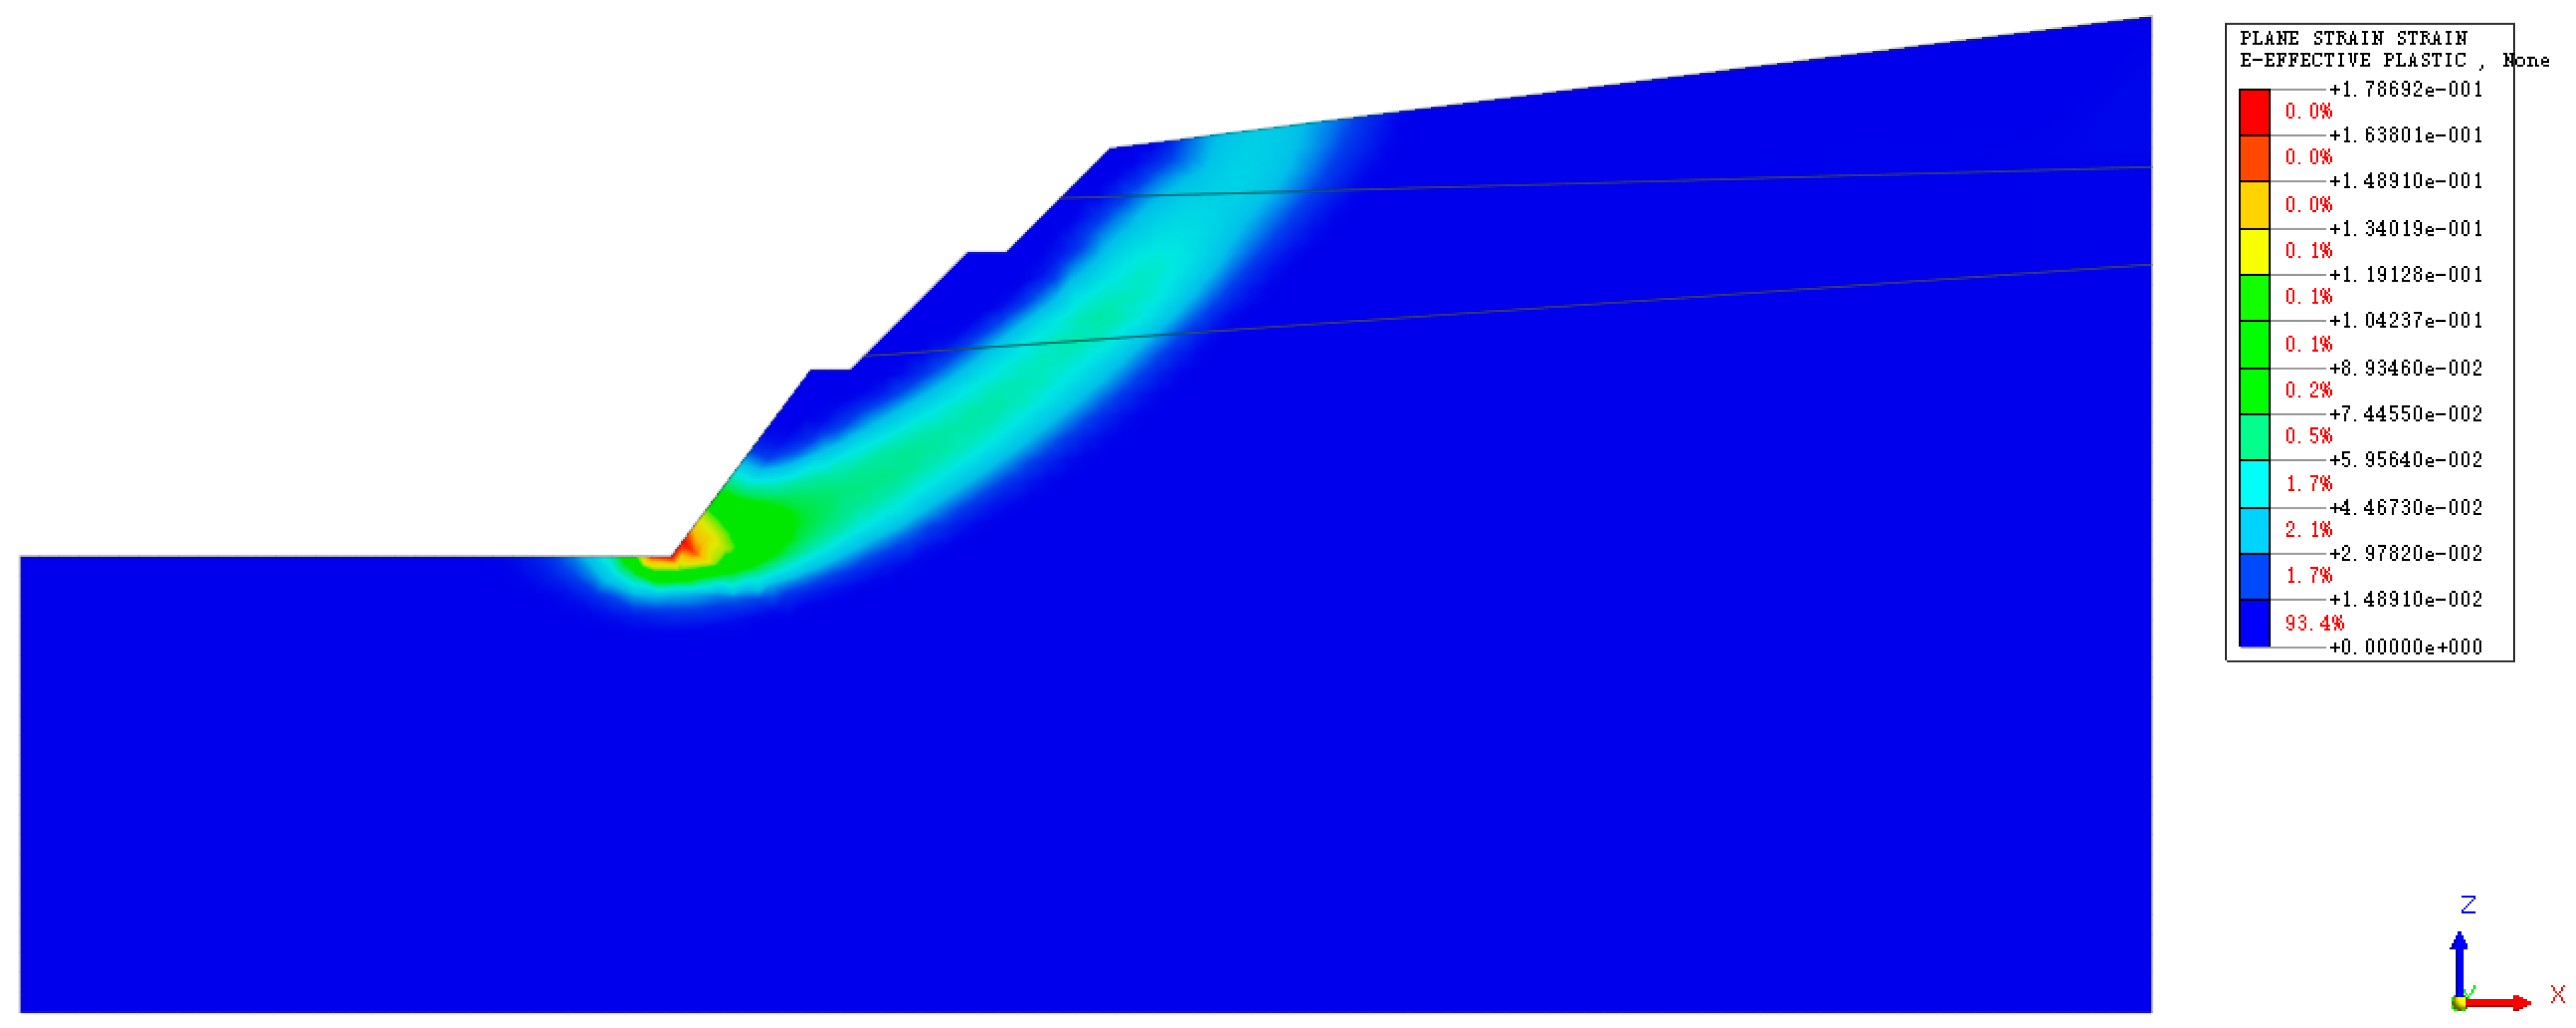
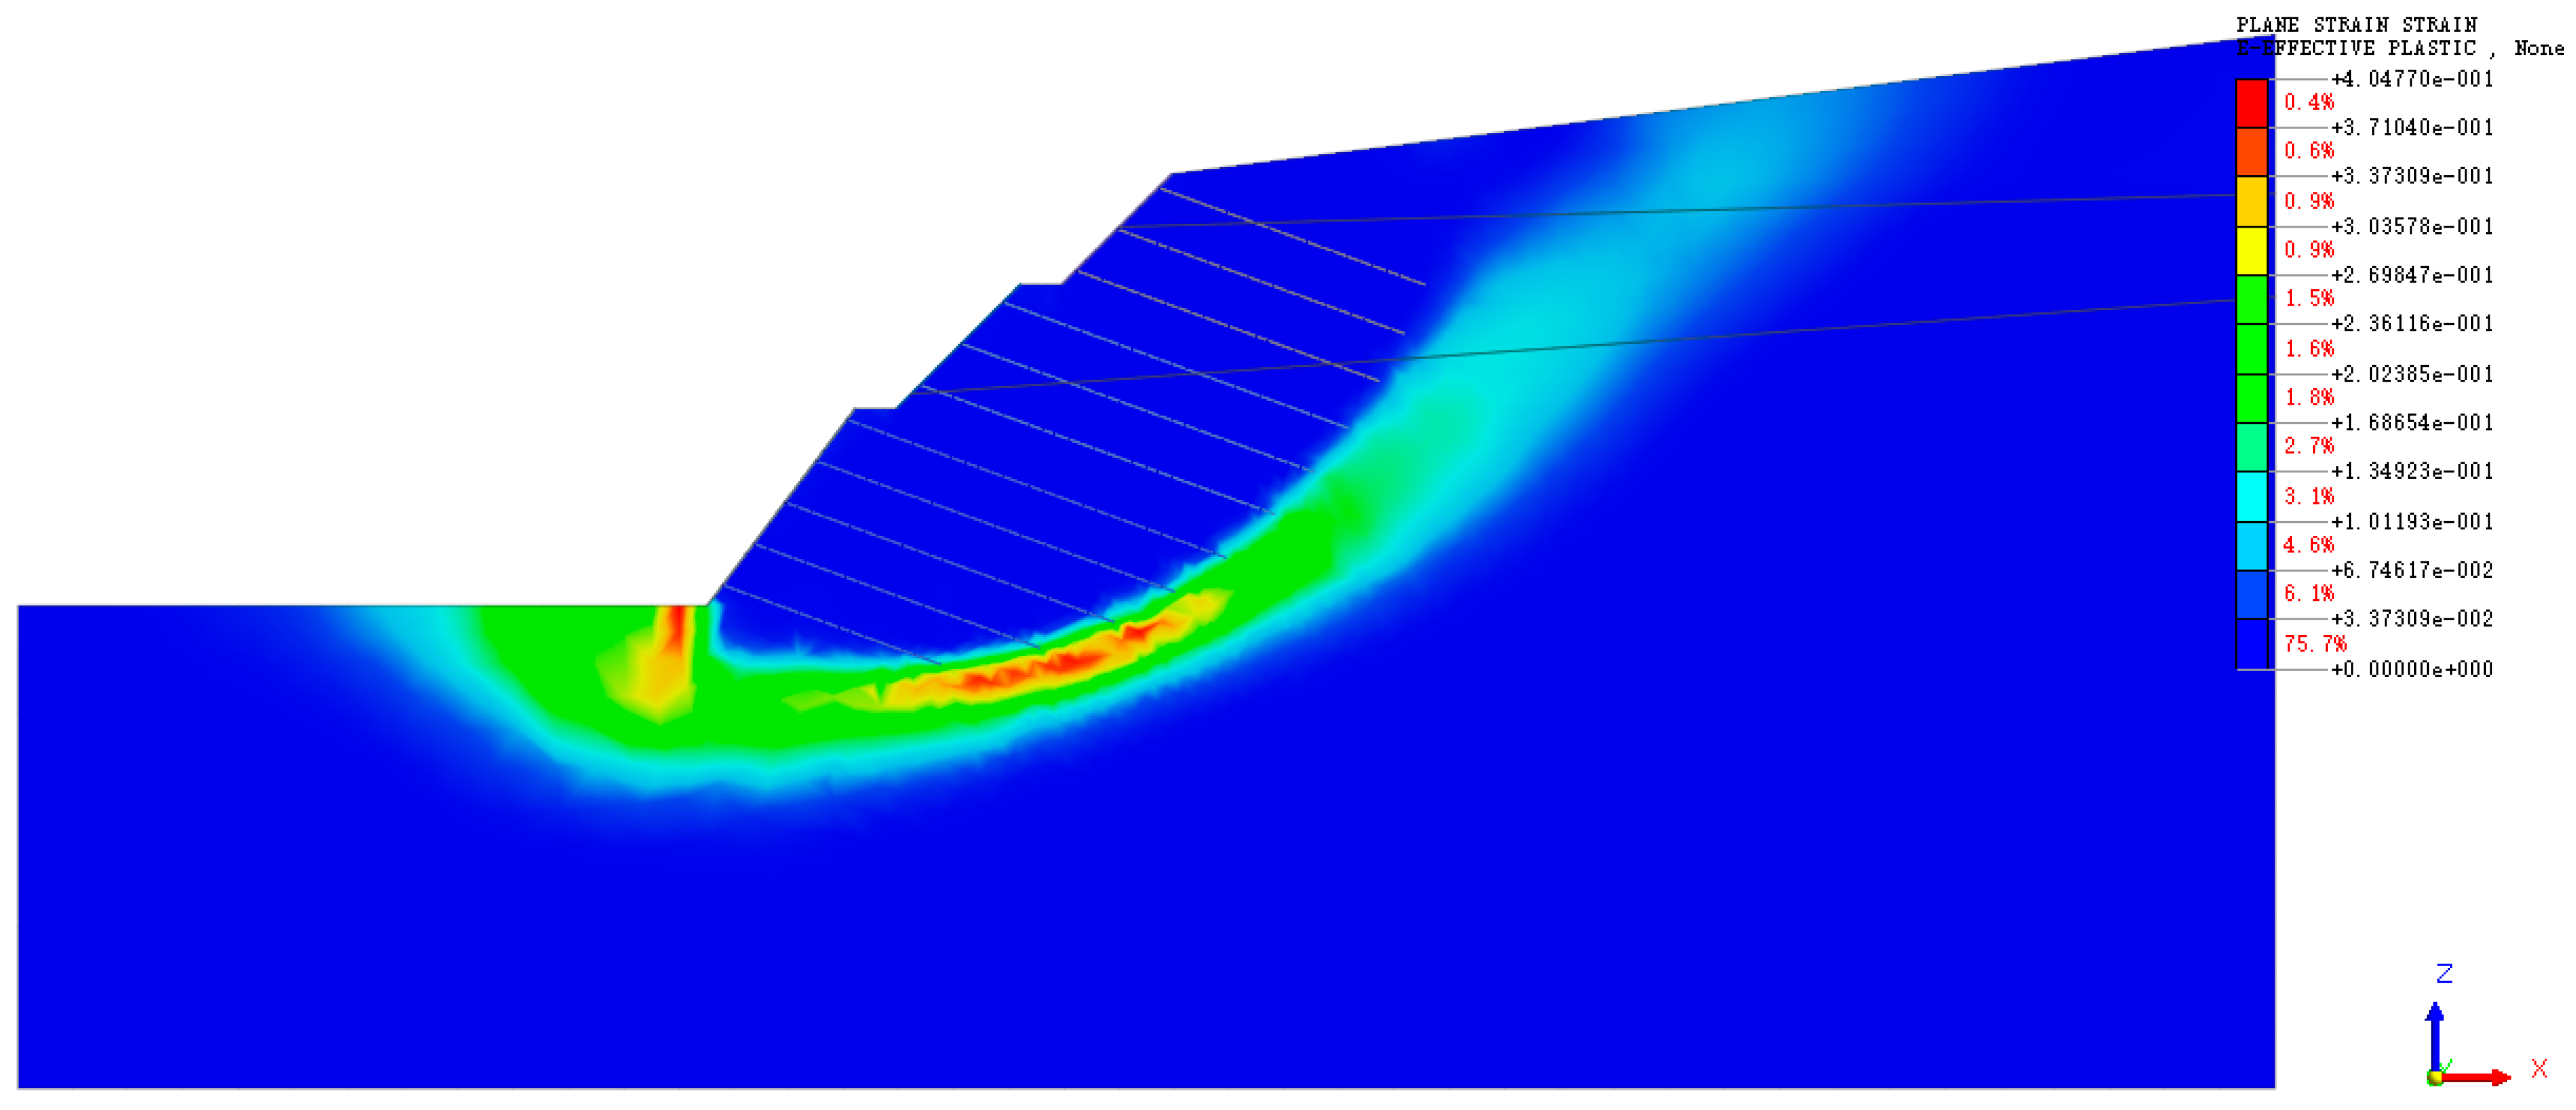
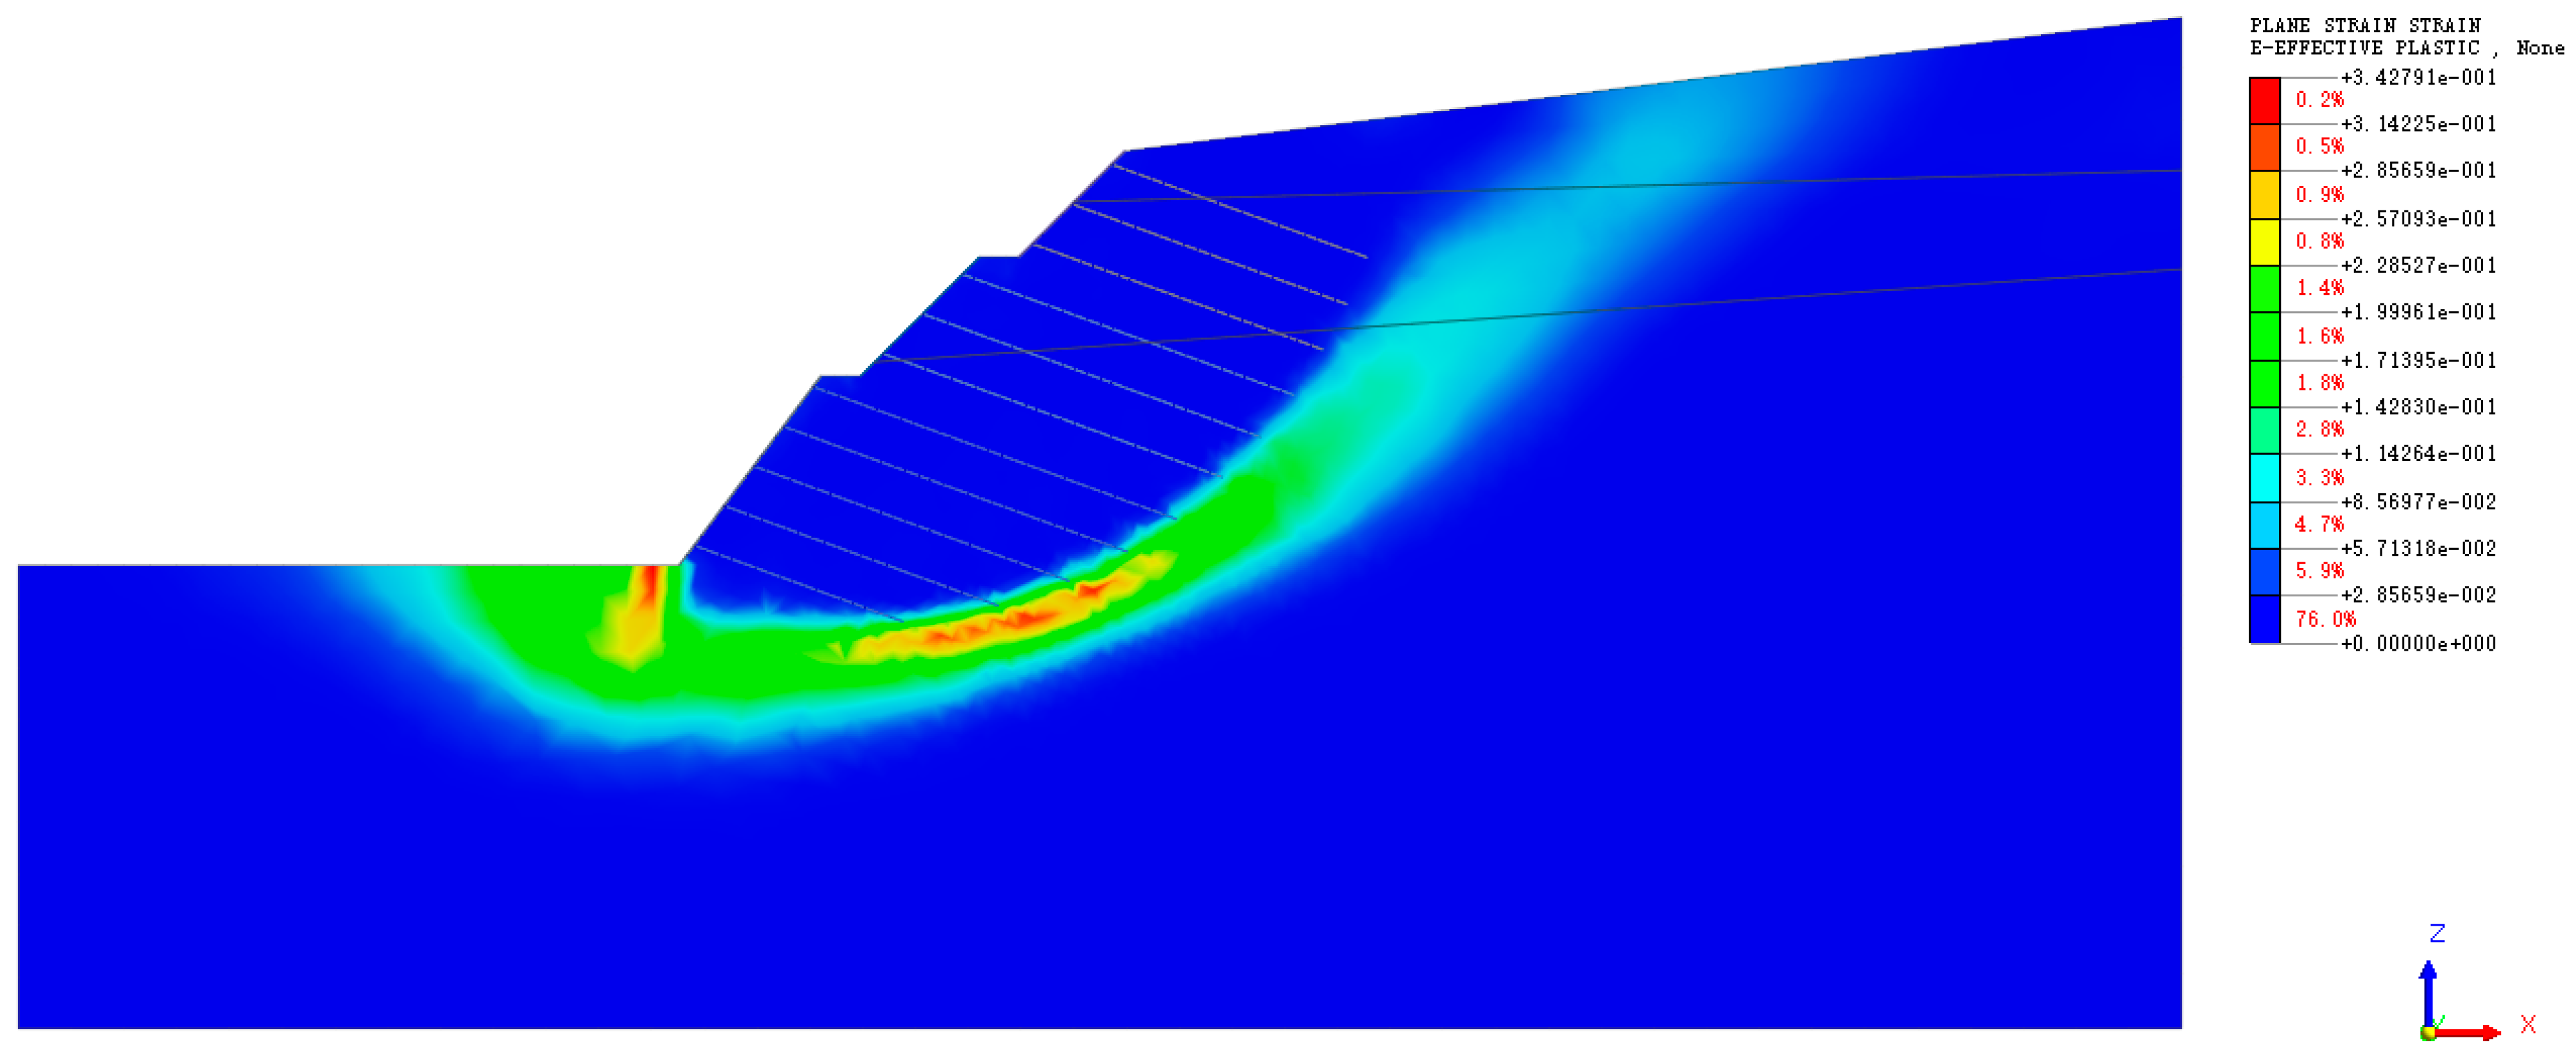
5.3.3. Effective Plastic Strain Analysis of Slope
Natural State
Saturated State
5.3.4. Stability Coefficient Analysis
5.4. Stability Analysis of Slope After Support
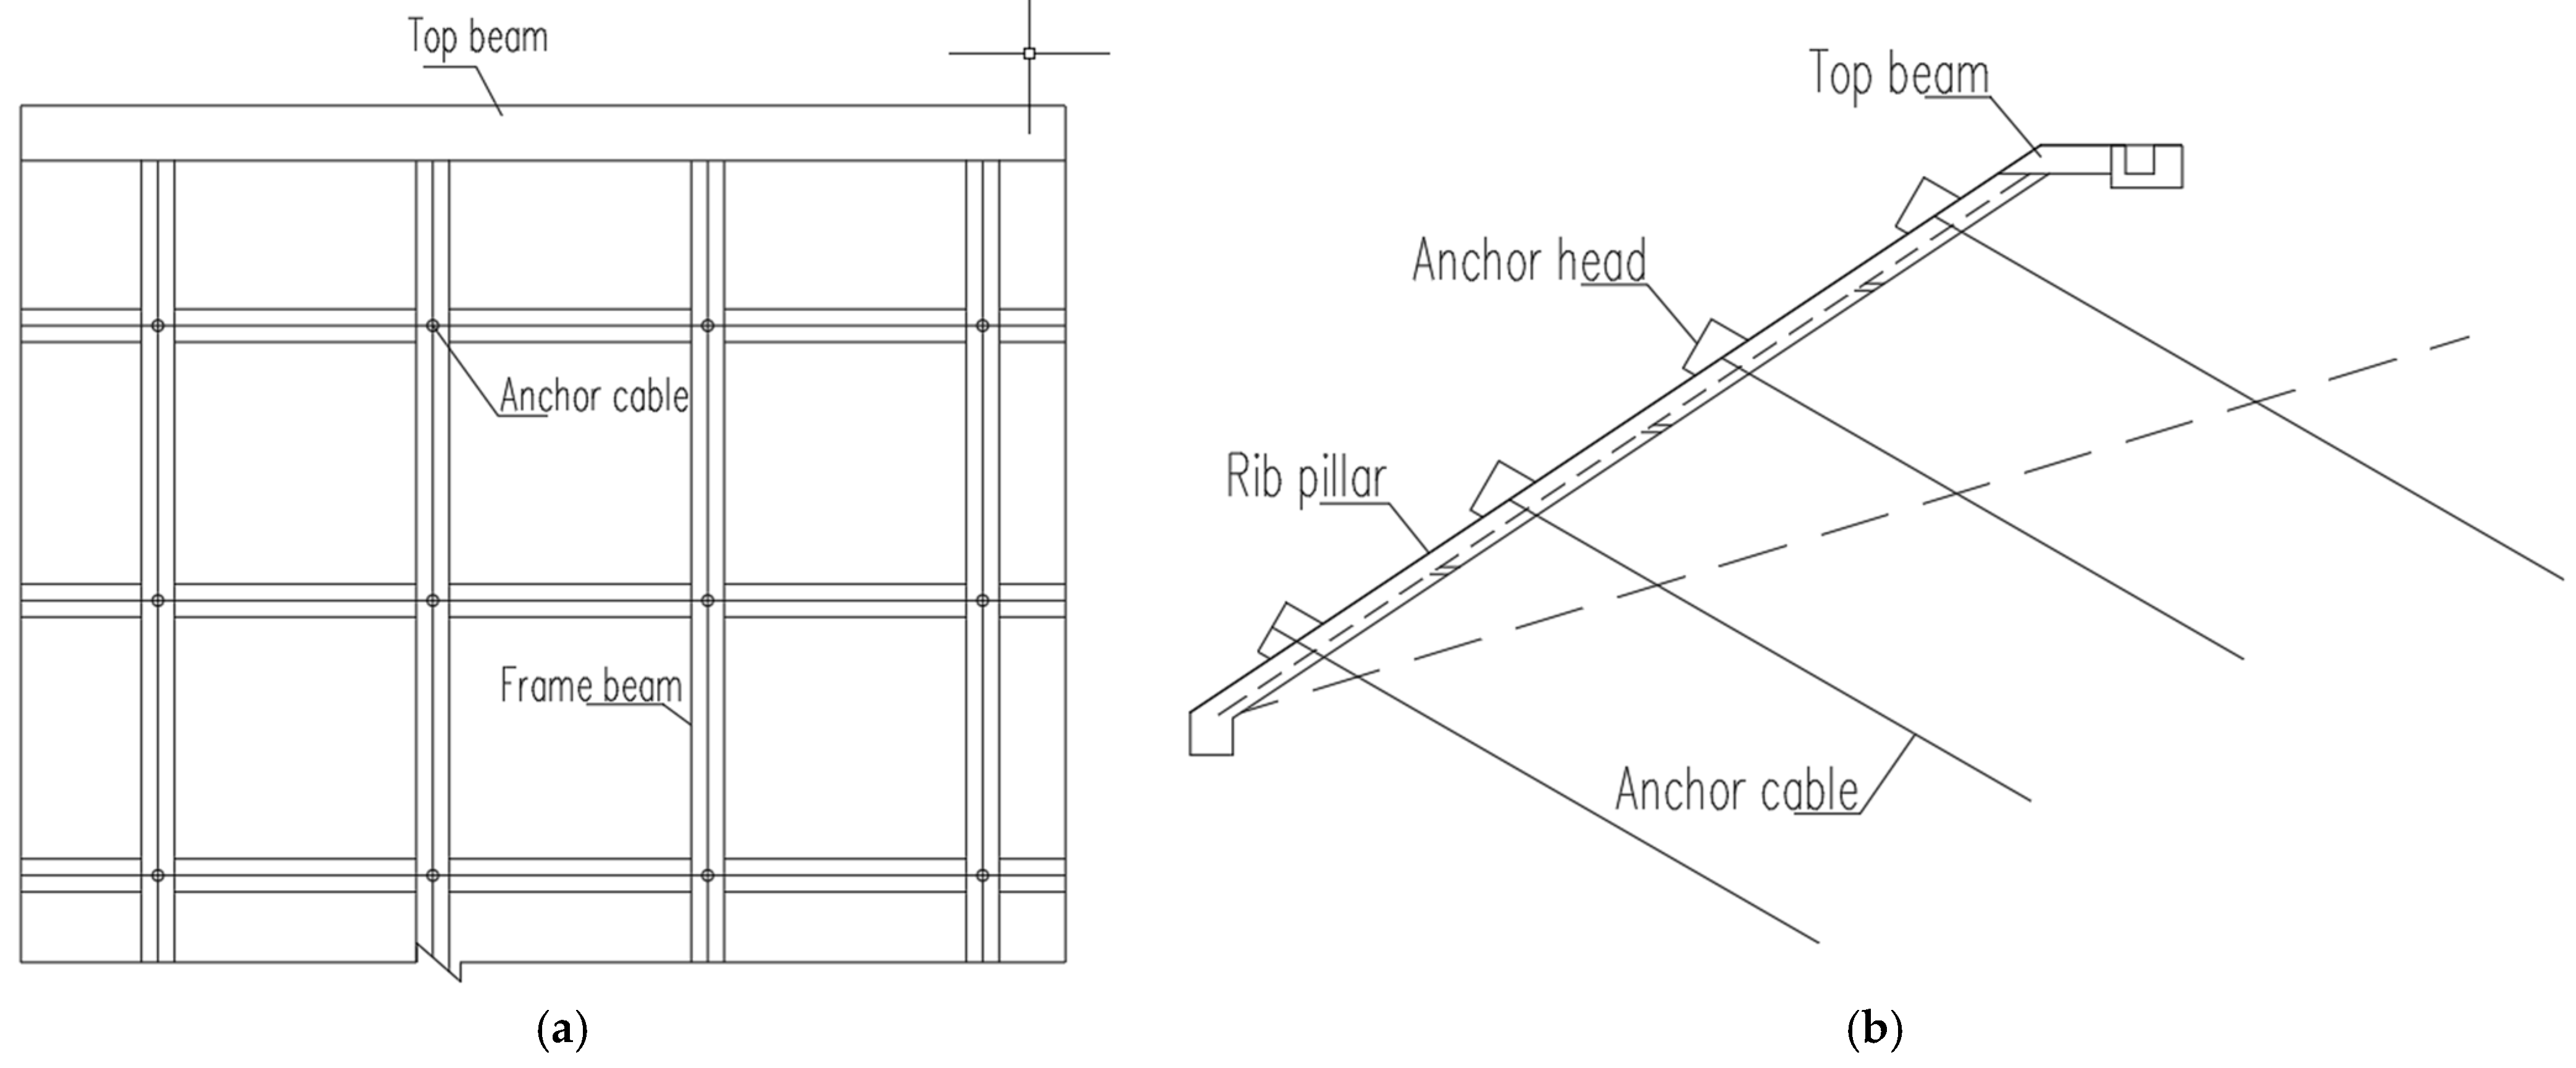
5.4.1. Selection of Support Scheme
5.4.2. Stability Coefficient Analysis
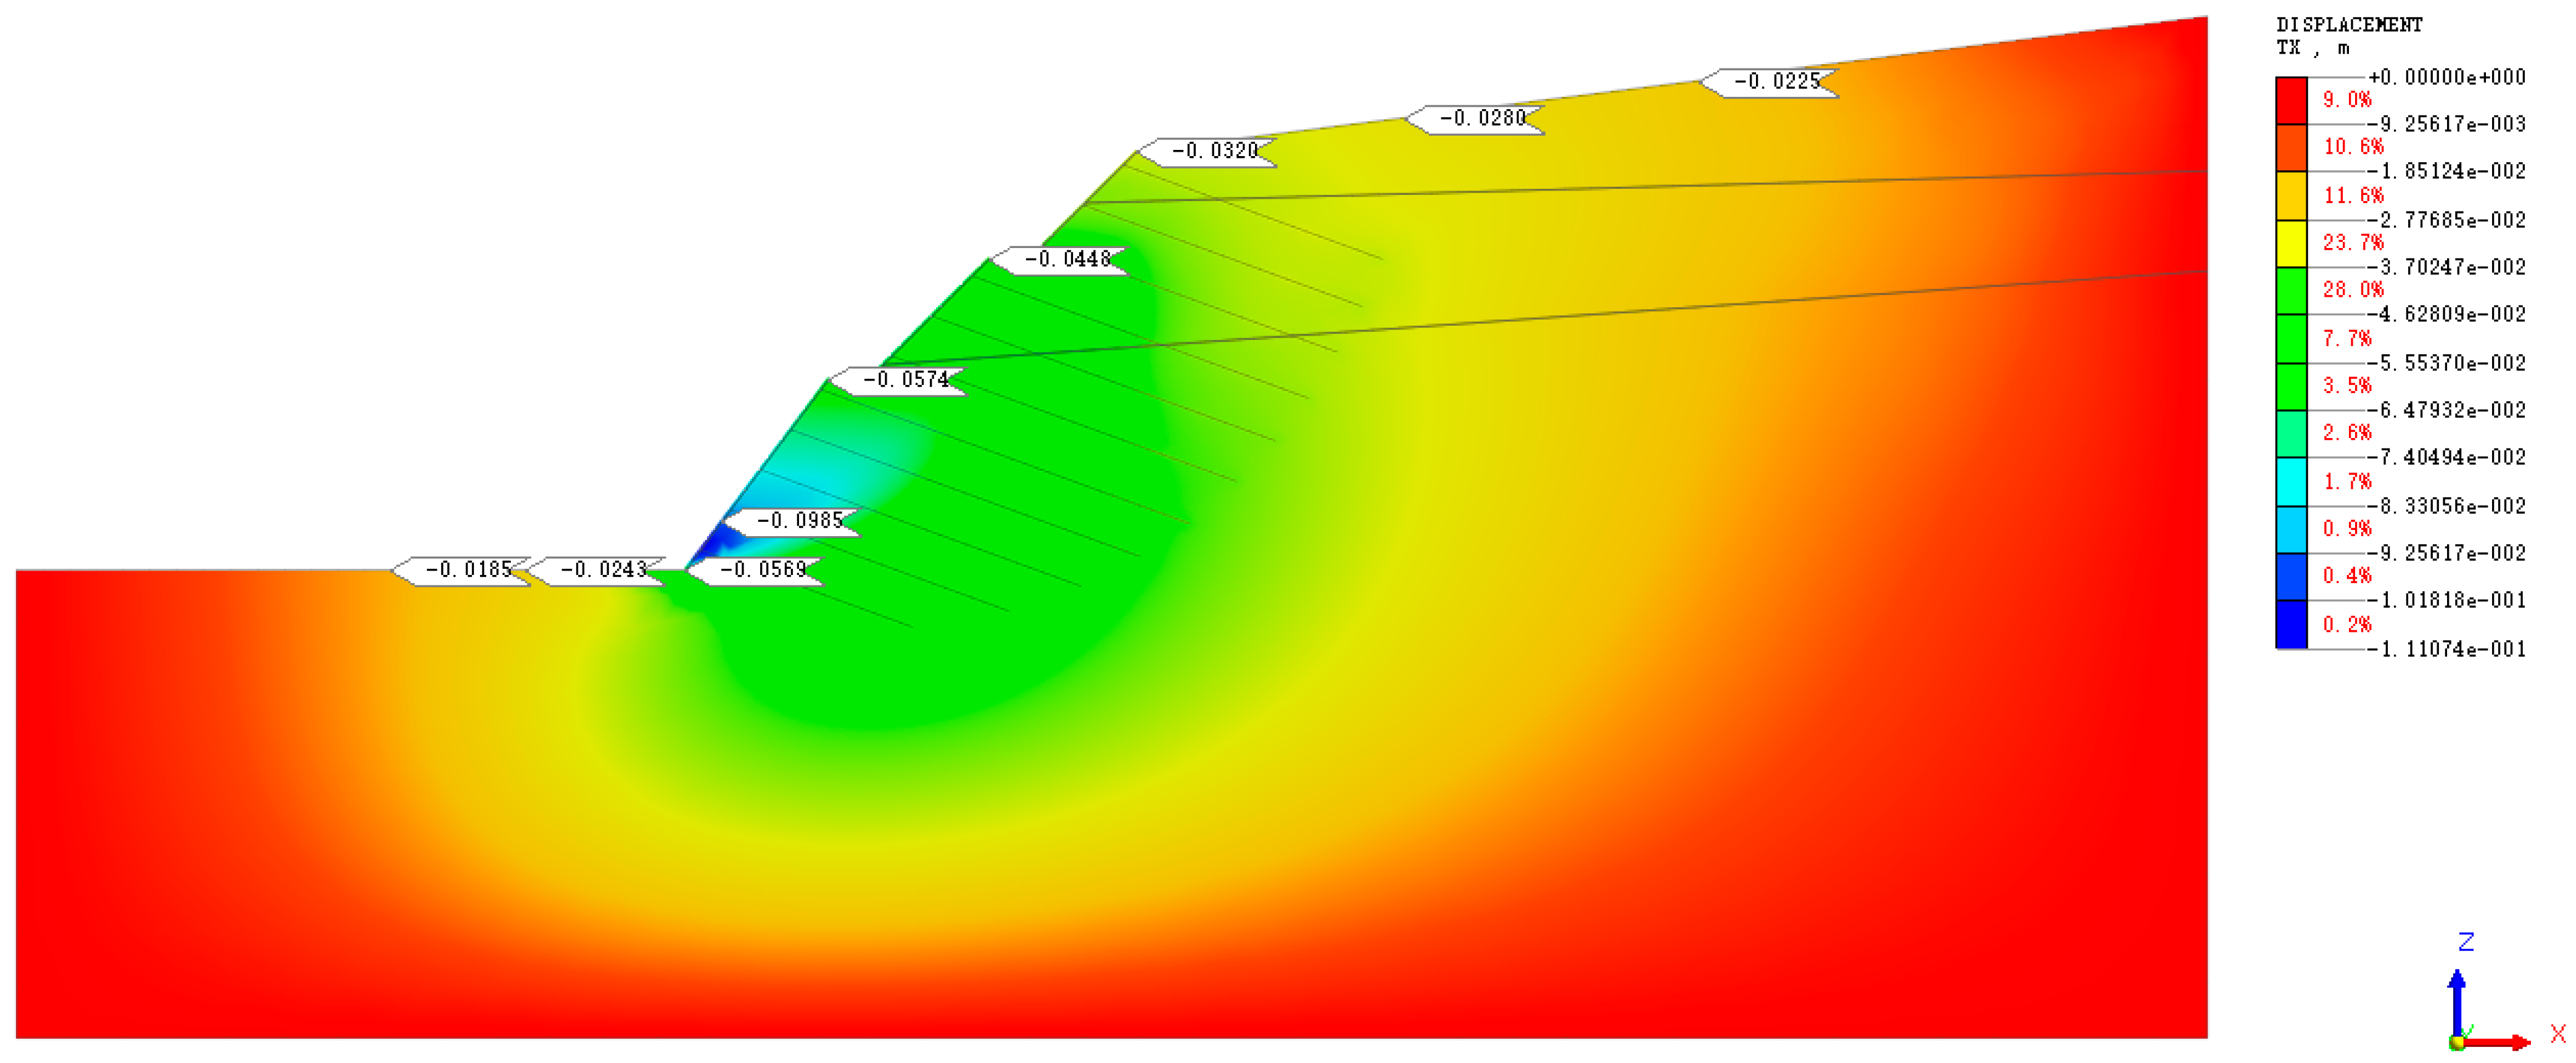
5.4.3. Horizontal Displacement Analysis of Slope
5.4.4. Vertical Settlement Displacement Analysis of Slope
5.4.5. Effective Plastic Strain Analysis of Slope
6. Conclusions
- (1)
- The water environment has a great influence on the shape of the push–shear rupture surface of carbonaceous mudstone, and the rupture surface under the natural water content conditions approximates to an inverse S-shaped curve, while the recommended rupture surface after saturated water immersion is closer to a straight line or a circular arc.
- (2)
- The push–shear deformation of carbonaceous mudstone in the natural state shows a typical full stress–strain curve characteristic, and the whole process roughly covers four stages: linear elastic deformation, yield deformation, strengthening, and local deformation. After saturated water immersion, the deformation of carbonaceous mudstone is mainly in the elastic-plastic state, and the push–shear force grows slowly, and when the specimen is damaged, it enters into the plastic deformation stage, and at this time, the push–shear force is only slightly reduced.
- (3)
- The moisture content has a significant impact on the shear strength of carbonaceous mudstone. After soaking in saturated water, the average cohesion of carbonaceous mudstone is 33% lower than under natural conditions, and the internal friction angle is 15% lower. Therefore, after soaking in saturated water, the fracture surface, shear deformation curve, and c and φ values of carbonaceous mudstone will be greatly affected. In engineering practice, they must be fully valued and relevant waterproof and drainage measures must be taken.
- (4)
- Through numerical simulations of carbonaceous mudstone high slopes before and after rainfall, it is further confirmed that rainfall has a significant impact on the stability of slopes and requires timely maintenance and treatment.
Author Contributions
Funding
Institutional Review Board Statement
Informed Consent Statement
Data Availability Statement
Conflicts of Interest
References
- Zeng, L.; Lou, X.C.; Zhang, J.H.; Wu, C.; Liu, J.; Jia, C.K. Carbonaceous mudstone and lignin-derived activated carbon and its application for supercapacitor electrode. Surf. Coat. Technol. 2019, 357, 580–586. [Google Scholar] [CrossRef]
- Liu, Z.F.; He, Z.M.; Zhang, W.Z.; Luo, S.J. Laboratory test and prediction model of dynamic resilient modulus of carbonaceous mudstone coarse-grained soil. Case Stud. Constr. Mater. 2023, 18, 15. [Google Scholar] [CrossRef]
- Zeng, L.; Yu, H.C.; Liu, J.; Gao, Q.F.; Bian, H.B. Mechanical behaviour of disintegrated carbonaceous mudstone under stress and cyclic drying/wetting. Constr. Build. Mater. 2021, 282, 12. [Google Scholar] [CrossRef]
- Zeng, L.; Luo, J.T.; Liu, J.; Gao, Q.F.; Bian, H.B. Disintegration Characteristics and Mechanisms of Carbonaceous Mudstone Subjected to Load and Cyclic Drying-Wetting. J. Mater. Civ. Eng. 2021, 33, 12. [Google Scholar] [CrossRef]
- Chen, C.Y.; Fu, H.Y.; Chen, Y.Y. Disintegration behavior and its grading entropy characterization of polyurea modified graded carbonaceous mudstone under loading and drying-wetting cycles. Constr. Build. Mater. 2024, 411, 11. [Google Scholar] [CrossRef]
- Fu, H.Y.; Zha, H.Y.; Zeng, L.; Gao, Q.F. Disintegration behavior and mechanism of carbonaceous mudstone under acidic corrosion and wetting-drying cycles. Bull. Eng. Geol. Environ. 2023, 82, 18. [Google Scholar] [CrossRef]
- Li, S.N.; Huang, Z.H.; Liang, Q.; Liu, J.; Luo, S.L.; Zhou, W.Q. Evolution Mechanism of Mesocrack and Macrocrack Propagation in Carbonaceous Mudstone under the Action of Dry-Wet Cycles. Geofluids 2022, 2022, 8. [Google Scholar] [CrossRef]
- Yang, Y.L.; Zhang, T.; Liu, S.Y.; Luo, J.H. Mechanical Properties and Deterioration Mechanism of Remolded Carbonaceous Mudstone Exposed to Wetting-Drying Cycles. Rock Mech. Rock Eng. 2022, 55, 3769–3780. [Google Scholar] [CrossRef]
- Zeng, L.; Yu, H.C.; Qiu, J.; Luo, J.T.; Liu, J.; Gao, Q.F.; Zhang, H.R. Pore characteristics and microscopic damage mechanism of disintegrated carbonaceous mudstone exposed to dry-wet cycles. Constr. Build. Mater. 2024, 433, 10. [Google Scholar] [CrossRef]
- Li, S.N.; Peng, Z.; Huang, Z.H.; Liang, Q.; Liu, J.; Zhou, W.Q. Time-Dependent Deformation and Long-Term Strength of Carbonaceous Mudstone under Dry and Wet Cycles. Sustainability 2022, 14, 12044. [Google Scholar] [CrossRef]
- Yu, M.Y.; Liu, B.G.; Liu, K.Y.; Sun, J.L.; Deng, T.B.; Wang, Q. Creep behavior of carbonaceous mudstone under triaxial hydraulic coupling condition and constitutive modelling. Int. J. Rock Mech. Min. Sci. 2023, 164, 19. [Google Scholar] [CrossRef]
- Fu, H.Y.; Xue, C.W.; Wen, W.; Yang, Q.Y.; Chen, L. Research on the Road Performance of Carbonaceous Mudstone Soil-Rock Mixtures under Multifactor Influence. KSCE J. Civ. Eng. 2024, 28, 1227–1237. [Google Scholar] [CrossRef]
- Fu, Y.Y.; Liu, Z.H.; Zeng, L.; Wen, W.; Yang, Q.Y. Seepage characteristics test of carbonaceous mudstone soil-rock mixture considering rock content and rainfall infiltration angle. J. Cent. South Univ. 2023, 30, 3467–3480. [Google Scholar] [CrossRef]
- Fu, H.Y.; Yang, H.T.; Wu, H.; Zeng, L.; Wu, E.L.; Wang, Y. Study on modified pre-disintegrated carbonaceous mudstone triaxial test and binary medium model. Granul. Matter 2024, 26, 14. [Google Scholar] [CrossRef]
- Xue, F.; Hu, B.; Zhong, Z.X.; Zhang, H.J.; Li, H.Y. Study on Shear Creep Characteristics of Carbonaceous Mud Shale at Different Moisture Contents Under Temperature Cycling. Water 2025, 17, 567. [Google Scholar] [CrossRef]
- Fu, Y.Y.; Liu, Z.H.; Zeng, L.; Gao, Q.F.; Luo, J.T.; Xiao, X.H. Numerical Analysis Method That Considers Weathering and Water-Softening Effects for the Slope Stability of Carbonaceous Mudstone. Int. J. Environ. Res. Public Health 2022, 19, 14308. [Google Scholar] [CrossRef]
- McDowell, G.R.; Amon, A. The Application of Weibull Statistics to the Fracture of Soil Particles. Soils Found. 2000, 40, 133–141. [Google Scholar] [CrossRef]
- Zhang, Z.L.; Xu, W.J.; Xia, W.; Zhang, H.Y. Large-scale in-situ test for mechanical characterization of soil-rock mixture used in an embankment dam. Int. J. Rock Mech. Min. Sci. 2016, 86, 317–322. [Google Scholar] [CrossRef]
- Jin, J.W.; Jin, Q.Q.; Li, M.Y.; Liu, B.; Zhao, S.Y.; Wei, Y.Q. Analysis of Large-Scale In Situ Shear Tests of Sandy Gravel with Cobbles. Int. J. Civ. Eng. 2024, 22, 2031–2040. [Google Scholar] [CrossRef]
- Wei, H.Z.; Xu, W.J.; Wei, C.F.; Meng, Q.S. Influence of water content and shear rate on the mechanical behavior of soil-rock mixtures. Sci. China-Technol. Sci. 2018, 61, 1127–1136. [Google Scholar] [CrossRef]
- Xu, W.J.; Qiang, X.; Hu, R.L. Study on the shear strength of soil–rock mixture by large scale direct shear test. Int. J. Rock Mech. Min. Sci. 2011, 48, 1235–1247. [Google Scholar]
- Cen, D.F.; Huang, D.; Ren, F. Shear deformation and strength of the interphase between the soil-rock mixture and the benched bedrock slope surface. Acta Geotech. 2017, 12, 391–413. [Google Scholar] [CrossRef]
- Xu, W.J.; Hu, R.L.; Tan, R.J. Some geomechanical properties of soil–rock mixtures in the Hutiao Gorge area, China. Geotechnique 2007, 57, 255–264. [Google Scholar] [CrossRef]
- Gao, W.; Iqbal, J.; Hu, R.L. Investigation of geomechanical characterization and size effect of soil-rock mixture: A case study. Bull. Eng. Geol. Environ. 2021, 80, 6263–6274. [Google Scholar] [CrossRef]
- Coli, N.; Berry, P.; Boldini, D. In situ non-conventional shear tests for the mechanical characterisation of a bimrock. Int. J. Rock Mech. Min. Sci. 2011, 48, 95–102. [Google Scholar] [CrossRef]
- Jiang, J.Q.; Yang, G.L. Field tests on mechanical characteristics and strength parameters of red-sandstone. J. Cent. South Univ. Technol. 2010, 17, 381–387. [Google Scholar] [CrossRef]
- Xu, W.J.; Hu, R.L.; Zeng, R.Y. Research on horizontal push-shear in-situ test of subwater soil-rock mixture. Chin. J. Geotech. Eng. 2006, 28, 814–818. [Google Scholar]
- Wu, L.Z.; He, B.; Peng, J.B. Analysis of Rainfall-Caused Seepage into Underlying Bedrock Slope Based on Seepage Deformation Coupling. Int. J. Geomech. 2024, 24, 04024076. [Google Scholar] [CrossRef]
- Wu, L.Z.; Zhou, Y.; Sun, P.; Shi, J.S.; Liu, G.G.; Bai, L.Y. Laboratory characterization of rainfall-induced loess slope failure. Catena 2017, 150, 1–8. [Google Scholar] [CrossRef]
- Ye, X.; Zhu, H.H.; Cheng, G.; Pei, H.F.; Shi, B.; Schenato, L.; Pasuto, A. Thermo-hydro-poro-mechanical responses of a reservoir-induced landslide tracked by high-resolution fi ber optic sensing nerves. J. Rock Mech. Geotech. Eng. 2024, 16, 1018–1032. [Google Scholar] [CrossRef]
- Zhang, P.H.; Gao, N.; Yan, W.N.; Hou, J.; Liu, H.L. Strength Deterioration Pattern and Stability Evaluation of Open-Pit Mine Slopes in Cold Regions Under Freeze-Thaw Cycles. Appl. Sci. 2025, 15, 4853. [Google Scholar] [CrossRef]
- GB/T 50145-2007; Standard for Engineering Classification of Soil. Ministry of Construction of the People’s Republic of China, China Planning Press: Beijing, China, 2008; pp. 20–33.
- Xie, W.; Liu, Z.G.; Kong, Z.G.; Jing, L.; Xiao, R. A Multi-Scale Investigation of Sandy Red Clay Degradation Mechanisms During Wet-Dry Cycles and Their Implications for Slope Stability. Appl. Sci. 2025, 15, 4085. [Google Scholar] [CrossRef]
- Lin, Z. Geotechnical Engineering Test Monitoring Manual; China Construction Industry Press: Beijing, China, 2005; pp. 35–395. [Google Scholar]
- Compilation Committee of Engineering Geology Manual. Handbook of Engineering Geology; China Construction Industry Press: Beijing, China, 2018; pp. 264–275. [Google Scholar]
- SL386-2007; Design Code for Engineered Slopes in Water Resources and Hydropower Projects. The Professional Standards Compilation Group of People’s Republic of China, China Water Power Press: Beijing, China, 2007; pp. 1–73.
- GB50330-2013; Technical Specification for Building Slope Engineering. Chongqing Municipal Commission of Urban and Rural Development: Chongqing, China; China Architecture & Building Press: Beijing, China, 2013; pp. 1–91.


| Material Category | Natural Moisture Content/% | Density/g·cm−3 | Liquid Limit/% | Plastic Limit/% | Plastic Limit Index | Cohesion Force/kPa | Internal Friction Angle/(°) |
|---|---|---|---|---|---|---|---|
| Carbonaceous mudstone | 12.30 | 2.20 | 32.90 | 25.30 | 7.60 | / | / |
| Specimen Number | Maximum Thrust/kN | Minimum Thrust/kN | Slider Weight/kN | ∑gicosαi/kN | ∑gisinαi /kN | ∑Li /m | ∑Wi /kN | c/kPa | φ/(°) |
|---|---|---|---|---|---|---|---|---|---|
| A1 | 22.01 | 12.03 | 2.75 | 2.63 | 0.67 | 0.84 | 22.01 | 14.77 | 52.33 |
| A2 | 18.02 | 11.53 | 2.07 | 1.90 | 0.71 | 0.86 | 18.02 | 9.40 | 48.96 |
| A3 | 28.02 | 20.02 | 1.92 | 1.74 | 0.74 | 0.87 | 28.02 | 11.46 | 52.92 |
| B1 | 14.10 | 8.03 | 2.11 | 1.93 | 0.63 | 0.87 | 14.10 | 8.77 | 45.31 |
| B2 | 10.10 | 6.36 | 1.70 | 1.53 | 0.63 | 0.87 | 10.10 | 5.38 | 41.68 |
| B3 | 16.02 | 9.23 | 1.64 | 1.48 | 0.61 | 0.86 | 16.02 | 9.84 | 43.54 |
| Rock and Soil Category | Unit Weight/kN·m−3 | Elastic Modulus/MPa | Poisson’s Ratio | Cohesion/MPa | Internal Friction Angle | |||
|---|---|---|---|---|---|---|---|---|
| Natural State | Soak in Saturated Water | Natural State | Soak in Saturated Water | Natural State | Soak in Saturated Water | |||
| Clay | 19.4 | 20 | 13 | 0.3 | 2.60 | 2.40 | 13.02 | 11.25 |
| Interlayering of carbonaceous mudstone and sandstone | 25 | 25.4 | 110 | 0.35 | 45.10 | 43.14 | 25.85 | 23.87 |
| Carbonaceous mudstone | 22 | 24 | 190 | 0.4 | 11.88 | 8.00 | 51.40 | 43.51 |
| Working Condition | Standard Requirements for Safety Factor | Actual Safety Factor | Stability Evaluation |
|---|---|---|---|
| Natural state | 1.10 | 1.15 | Stable |
| Soak in saturated water | 1.05 | 1.03 | Potentially unstable |
| Material Name | Unit Type | Elastic Modulus (kPa) | Poisson’s Ratio | Unit Weight (kN/m3) |
|---|---|---|---|---|
| Anchor cable | Implantable truss | 1.95 × 10⁸ | 0.3 | 78.5 |
| Frame beam | Beam | 3.2 × 10⁷ | 0.2 | 25 |
| Working Conditions | Support Method | Stability Coefficient |
|---|---|---|
| Natural state | Before support | 1.15 |
| After support | 1.57 | |
| After soaking in full water | Before support | 1.03 |
| After support | 1.40 |
| Working Conditions | Support Method | Maximum Horizontal Displacement/mm |
|---|---|---|
| Natural state | Before support | 70.3 |
| After support | 74.0 | |
| After soaking in full water | Before support | 996.2 |
| After support | 111.1 |
| Working Conditions | Support Method | Maximum Vertical Displacement/mm |
|---|---|---|
| Natural state | Before support | 19.9 |
| After support | 20.1 | |
| After soaking in full water | Before support | 345.4 |
| After support | 26.0 |
Disclaimer/Publisher’s Note: The statements, opinions and data contained in all publications are solely those of the individual author(s) and contributor(s) and not of MDPI and/or the editor(s). MDPI and/or the editor(s) disclaim responsibility for any injury to people or property resulting from any ideas, methods, instructions or products referred to in the content. |
© 2025 by the authors. Licensee MDPI, Basel, Switzerland. This article is an open access article distributed under the terms and conditions of the Creative Commons Attribution (CC BY) license (https://creativecommons.org/licenses/by/4.0/).
Share and Cite
Zhao, J.; Chen, H.; Nie, R. Research on the Shear Performance of Carbonaceous Mudstone Under Natural and Saturated Conditions and Numerical Simulation of Slope Stability. Appl. Sci. 2025, 15, 6935. https://doi.org/10.3390/app15126935
Zhao J, Chen H, Nie R. Research on the Shear Performance of Carbonaceous Mudstone Under Natural and Saturated Conditions and Numerical Simulation of Slope Stability. Applied Sciences. 2025; 15(12):6935. https://doi.org/10.3390/app15126935
Chicago/Turabian StyleZhao, Jian, Hongying Chen, and Rusong Nie. 2025. "Research on the Shear Performance of Carbonaceous Mudstone Under Natural and Saturated Conditions and Numerical Simulation of Slope Stability" Applied Sciences 15, no. 12: 6935. https://doi.org/10.3390/app15126935
APA StyleZhao, J., Chen, H., & Nie, R. (2025). Research on the Shear Performance of Carbonaceous Mudstone Under Natural and Saturated Conditions and Numerical Simulation of Slope Stability. Applied Sciences, 15(12), 6935. https://doi.org/10.3390/app15126935