Article

Analysis of the Causes of Excessive Noise and Vibrations of Live Steam Pipelines

Faculty of Mechanical Engineering, Wrocław University of Science and Technology, 50-370 Wroclaw, Poland
*
Author to whom correspondence should be addressed.
Appl. Sci. 2025, 15(12), 6925; https://doi.org/10.3390/app15126925
Submission received: 28 March 2025 / Revised: 23 May 2025 / Accepted: 25 May 2025 / Published: 19 June 2025

Abstract

The article discusses the causes of excessive noise and vibrations of a live steam pipeline in a power unit. A scanning laser vibrometer was used to measure the vibrations of the live steam pipeline for two power units. Additionally, the sound (noise) level of the live steam pipeline was measured with an acoustic camera. A discrete model of the pipeline was created, and FEM modal analysis was performed. Based on experimental tests and numerical simulations, the sources of noise were identified. The final conclusions propose methods of eliminating the harmful noise.

1. Introduction

Power plants and heating power stations have a significant influence on the atmospheric air, soil, and water and, in effect, on plants, animals, and people, i.e., on the natural environment. Such influence is exerted by:
-
Products of fuel combustion, i.e., produced as by-products of the power plant fuel cycle. Such products include the following: fumes containing fly ash (dust), sulfur dioxide, nitrogen oxides, carbon monoxide and dioxide, slag from boilers, and waste and wastewater from fuel desulphurization (dustiness also occurs during the transport, storage, and unloading of fuels).
-
The natural environment is significantly affected by industrial wastewater, which is the by-product of water purification for steam cycles and cooling cycles and is also produced by fuel desulphurization systems, as well as systems for heating water in rivers (lakes) if turbines are cooled by means of an open cooling system. Closed cooling systems—based on ventilators and towers—produce noise [1,2,3], which leads to complaints from residents in nearby areas.
-
Electrical networks, through the impact of electromagnetic fields, also have a detrimental effect on the natural environment.
-
Noise.
With the progressing knowledge about the influence of sound on human performance, the development of countries, and the awareness of societies, noise pollution has become a regular aspect of environmental planning and protection. With that, requirements for all the industrial installations, especially those erected in past few decades, have put more focus on noise generation.
There are many places in the power-generating units of a power plant that create the following types of noise:
-
Noise caused by transformers and engines;
-
Noise caused by turbines [4];
-
Noise caused by the unloading and crushing of coal;
-
Noise produced by air and fume extraction fans and compressors;
-
Noise caused by steam collectors;
-
Noise from other sources.
Protection against noise has become a challenge for the entire civilization. Currently, all power plants are required to prepare inventories of noise sources and measure the average sound level. Power plants must also implement a noise reduction program by acquiring low-noise-emission equipment, building anti-noise barriers and noise dampers, and soundproofing the facility [5]. Basic investments aimed at protection against excessive noise emission include noise enclosures and sound insulation for air and fume extraction fans, acoustic protection of boiler outlet pipes, acoustic enclosures for turbine casing, acoustic protection of air fans in ash storage tanks, an anti-noise wall with a sliding door, acoustic enclosures and screens for several pieces of equipment, and others [6,7].
In power plants, the situation might be even more complicated, as the interaction of the flowing media might excite structural vibrations. It is a challenge of great importance to secure laminar flow both from the point of view of the process as well as complex aeroacoustic phenomena, often leading to resonant amplification and wideband noise emissions. Properly designed geometry of the media guiding structures is of great importance. Additionally, the application of the attenuating materials can be taken under consideration. Recent years have brought great development in sustainable damping/attenuating materials and especially great promise in the application of novel acoustic metamaterials [7]. However, one has to keep in mind that the power plant is a harsh environment with elevated or even extreme temperatures.
In one of the coal power plants (Figure 1), it was noticed that one of the live steam pipelines vibrated and generated an excessive level of noise in comparison to the other similar ducts. Additionally, that unusual noise presence was observed shortly after maintenance operations. As the general noise in the power plant hall where the power-generation unit is placed can reach up to around 90–100 dB, the noise level generated by pipeline at the level exceeding 100 dB does not make a big change in the exposure to noise. However, the fact that the pipeline used to work with an unnoticeable noise level and fact of the presence of the high-frequency noise (around 1000 Hz) raised questions about the proper and safe operation of the pipeline. This brought the necessity of the investigation of the noise/vibration cause. A schematic diagram of the power-generating unit in the power plant is shown in Figure 2.

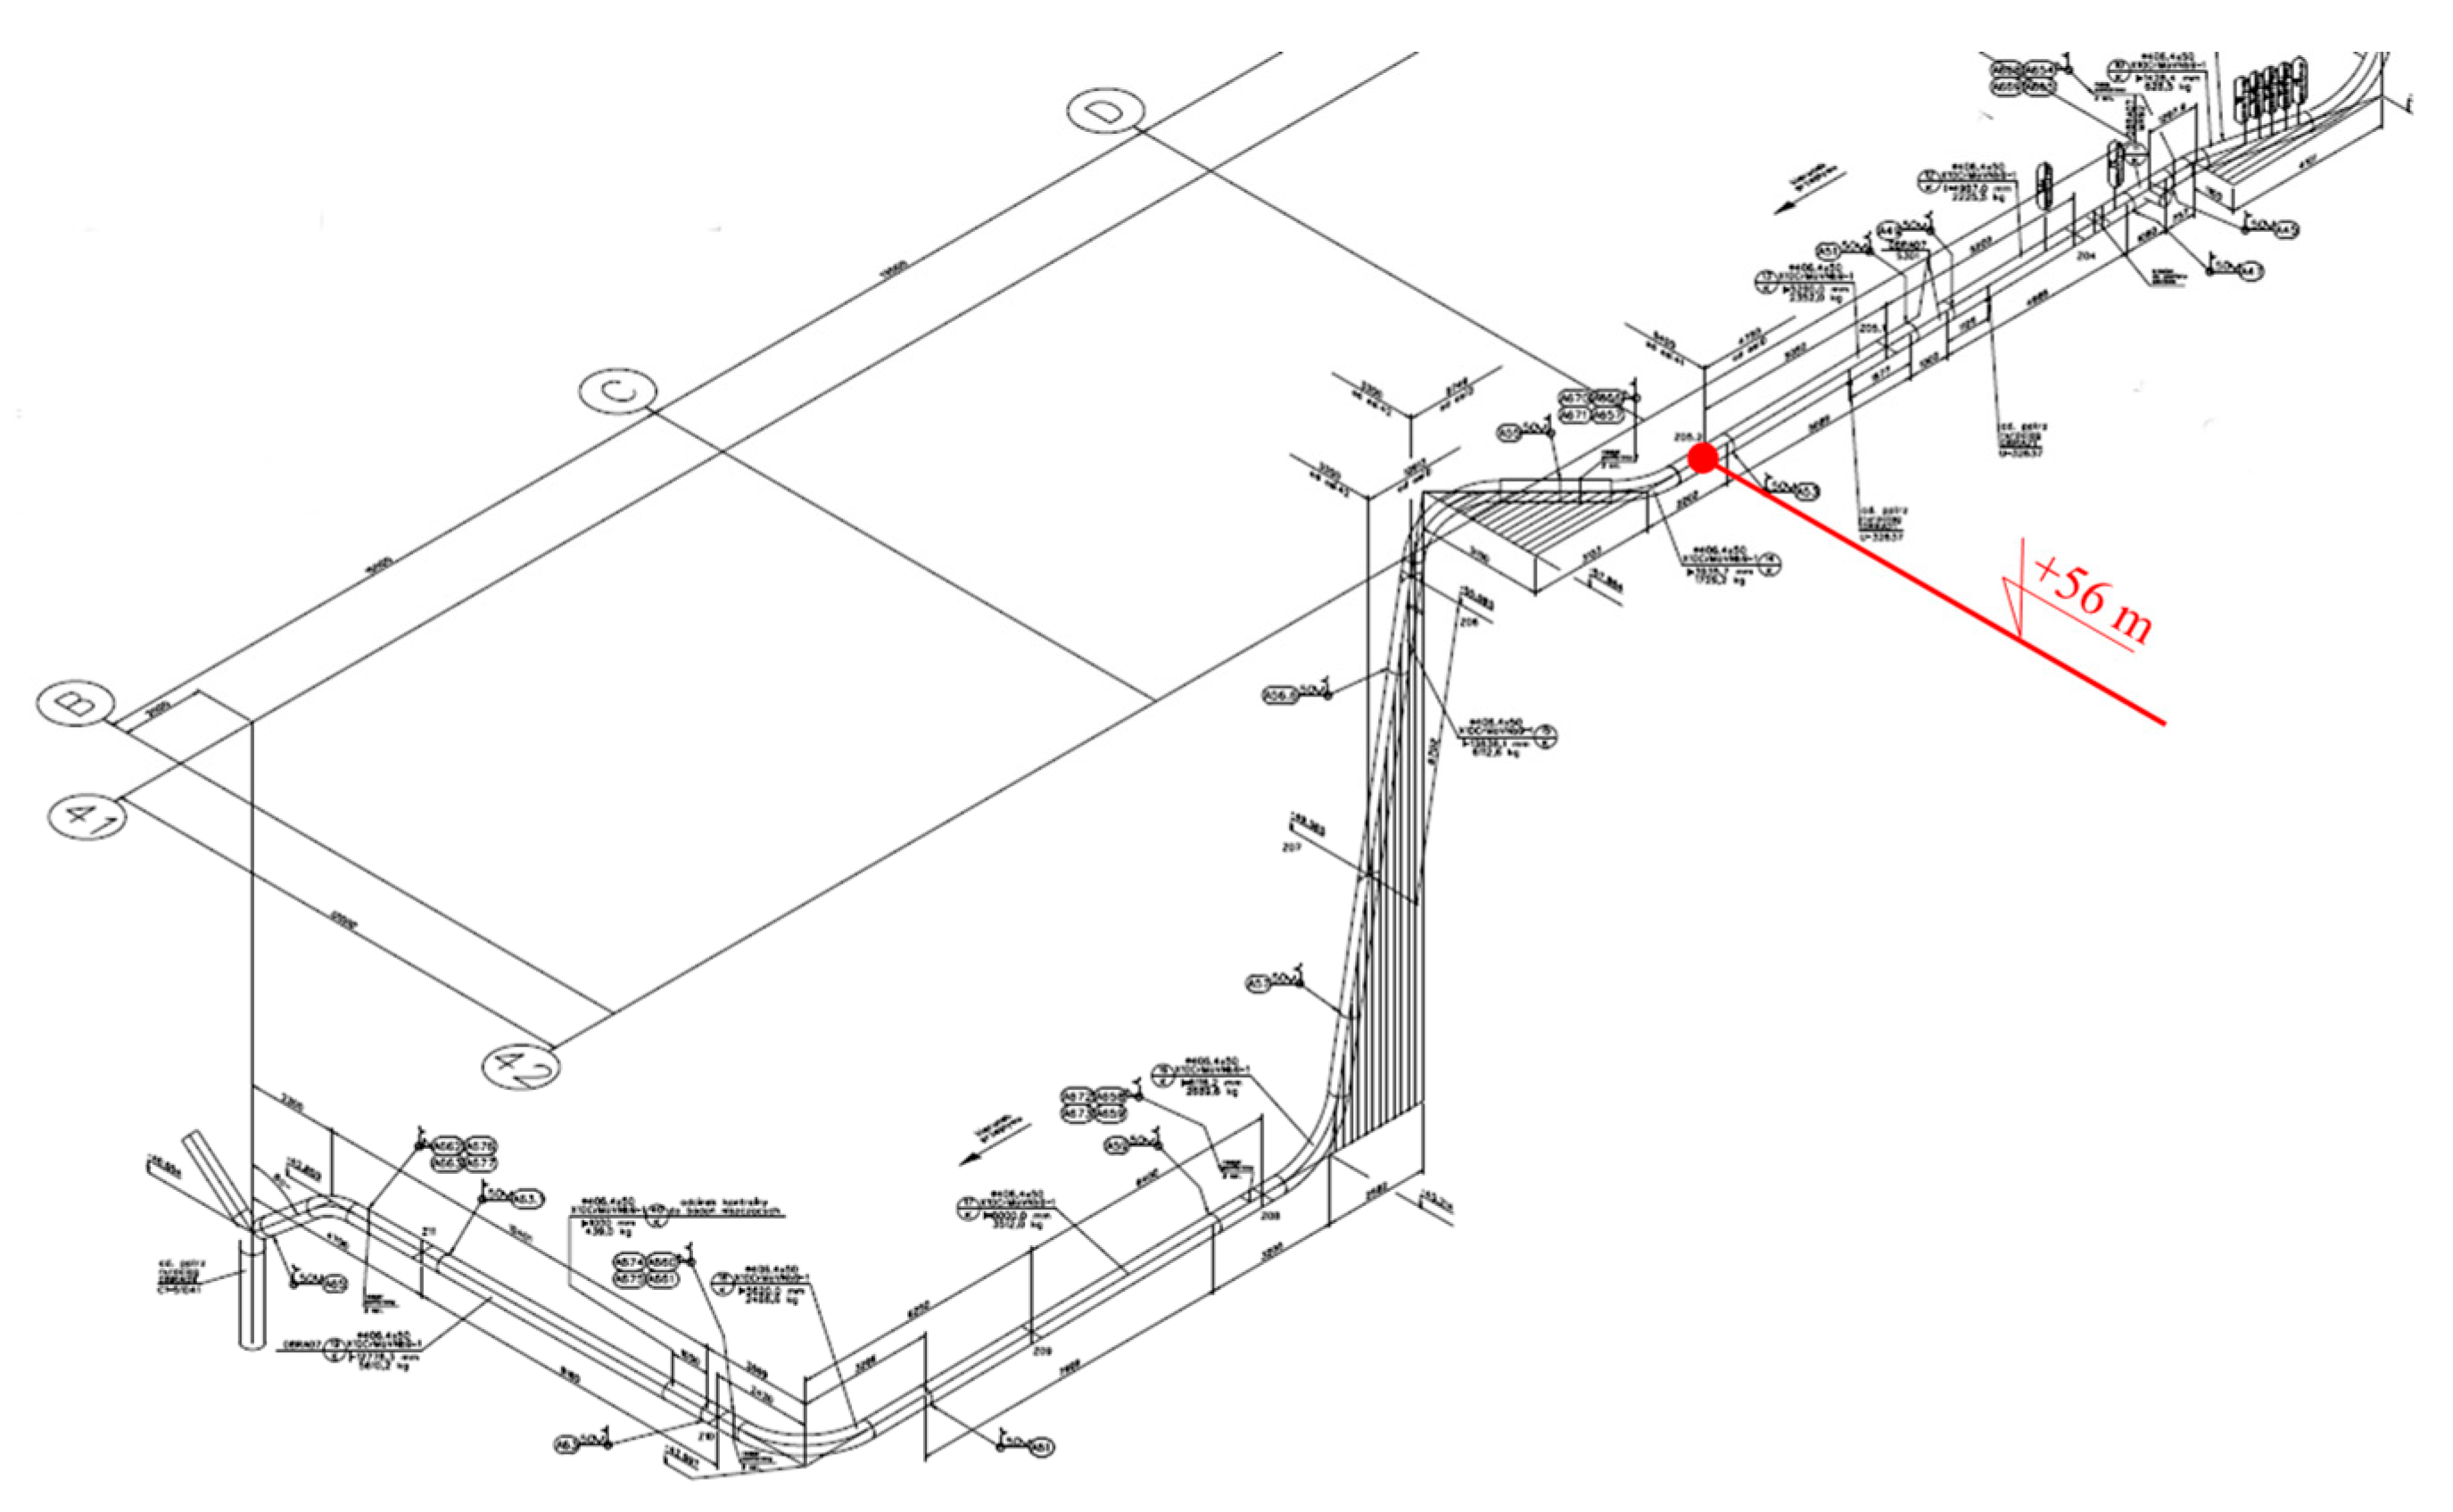
2. Description and Parameters of the Pipeline

The object of measurements and analysis is the live steam pipeline in power-generating unit A of the power plant (Figure 3 and Figure 4). The noise generated in this pipeline exceeds permissible levels and reaches up to 105 dB. In the top span above the Y-pipe, before the valves, a Ø406.4 × 50 mm pipeline was used, which is different than the pipeline used in power unit B, where the diameters of the same pipelines are smaller, i.e., Ø355.6 × 40 mm. The upper Y-pipe has a diameter of Ø508/406.4 mm (power unit A), while the Y-pipe in the same location in power unit B has a diameter of Ø508/355.6 mm. The vertical span of the piping (Figure 4) below the Y-pipe, between the levels of 12 m and 37 m, has the same diameter as the one in power unit “B”, i.e., Ø508 × 55 mm. At the level of 23 m, there is a measuring nozzle with a diameter of Ø317.55 mm, which is larger than in power unit “B”, where the nozzle has a diameter of Ø297.58 mm. Towards the turbine, there is the lower Y-pipe, with identical dimensions as the upper Y-pipe, i.e., Ø508/406.4 mm, and it is followed by two branches of pipelines of the same diameter as the top pipelines, i.e., Ø406.4 × 50 mm.

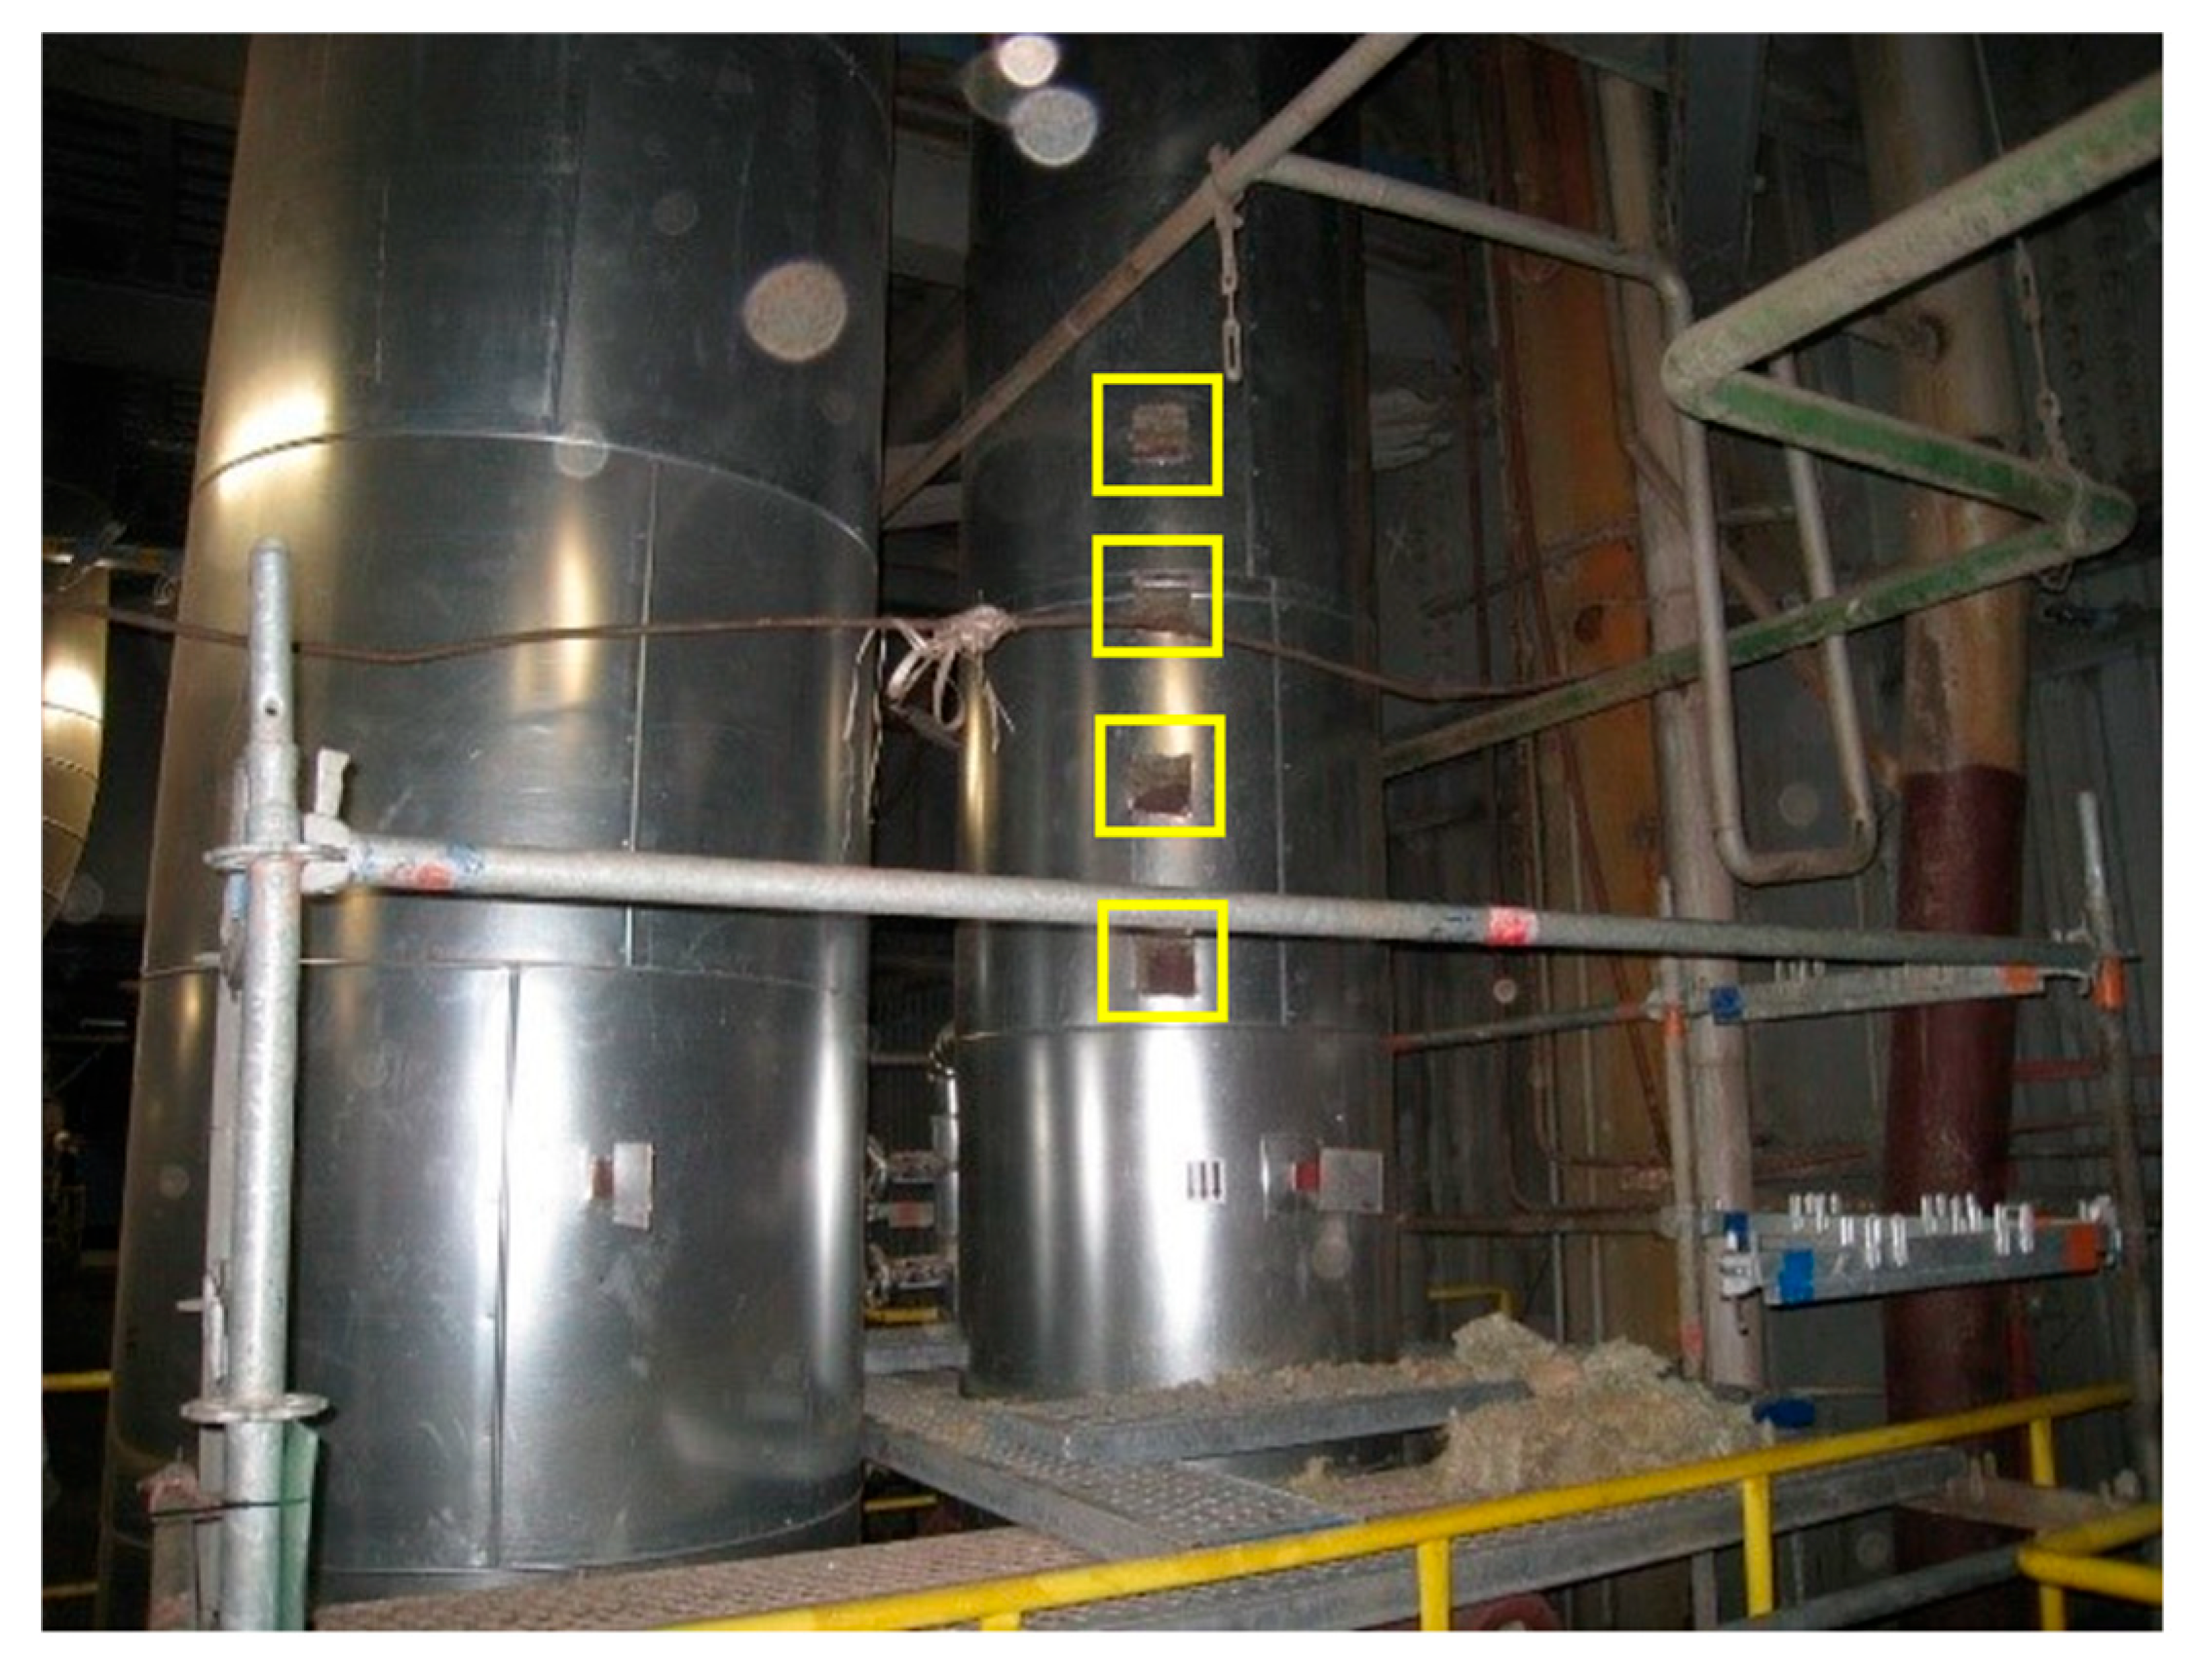
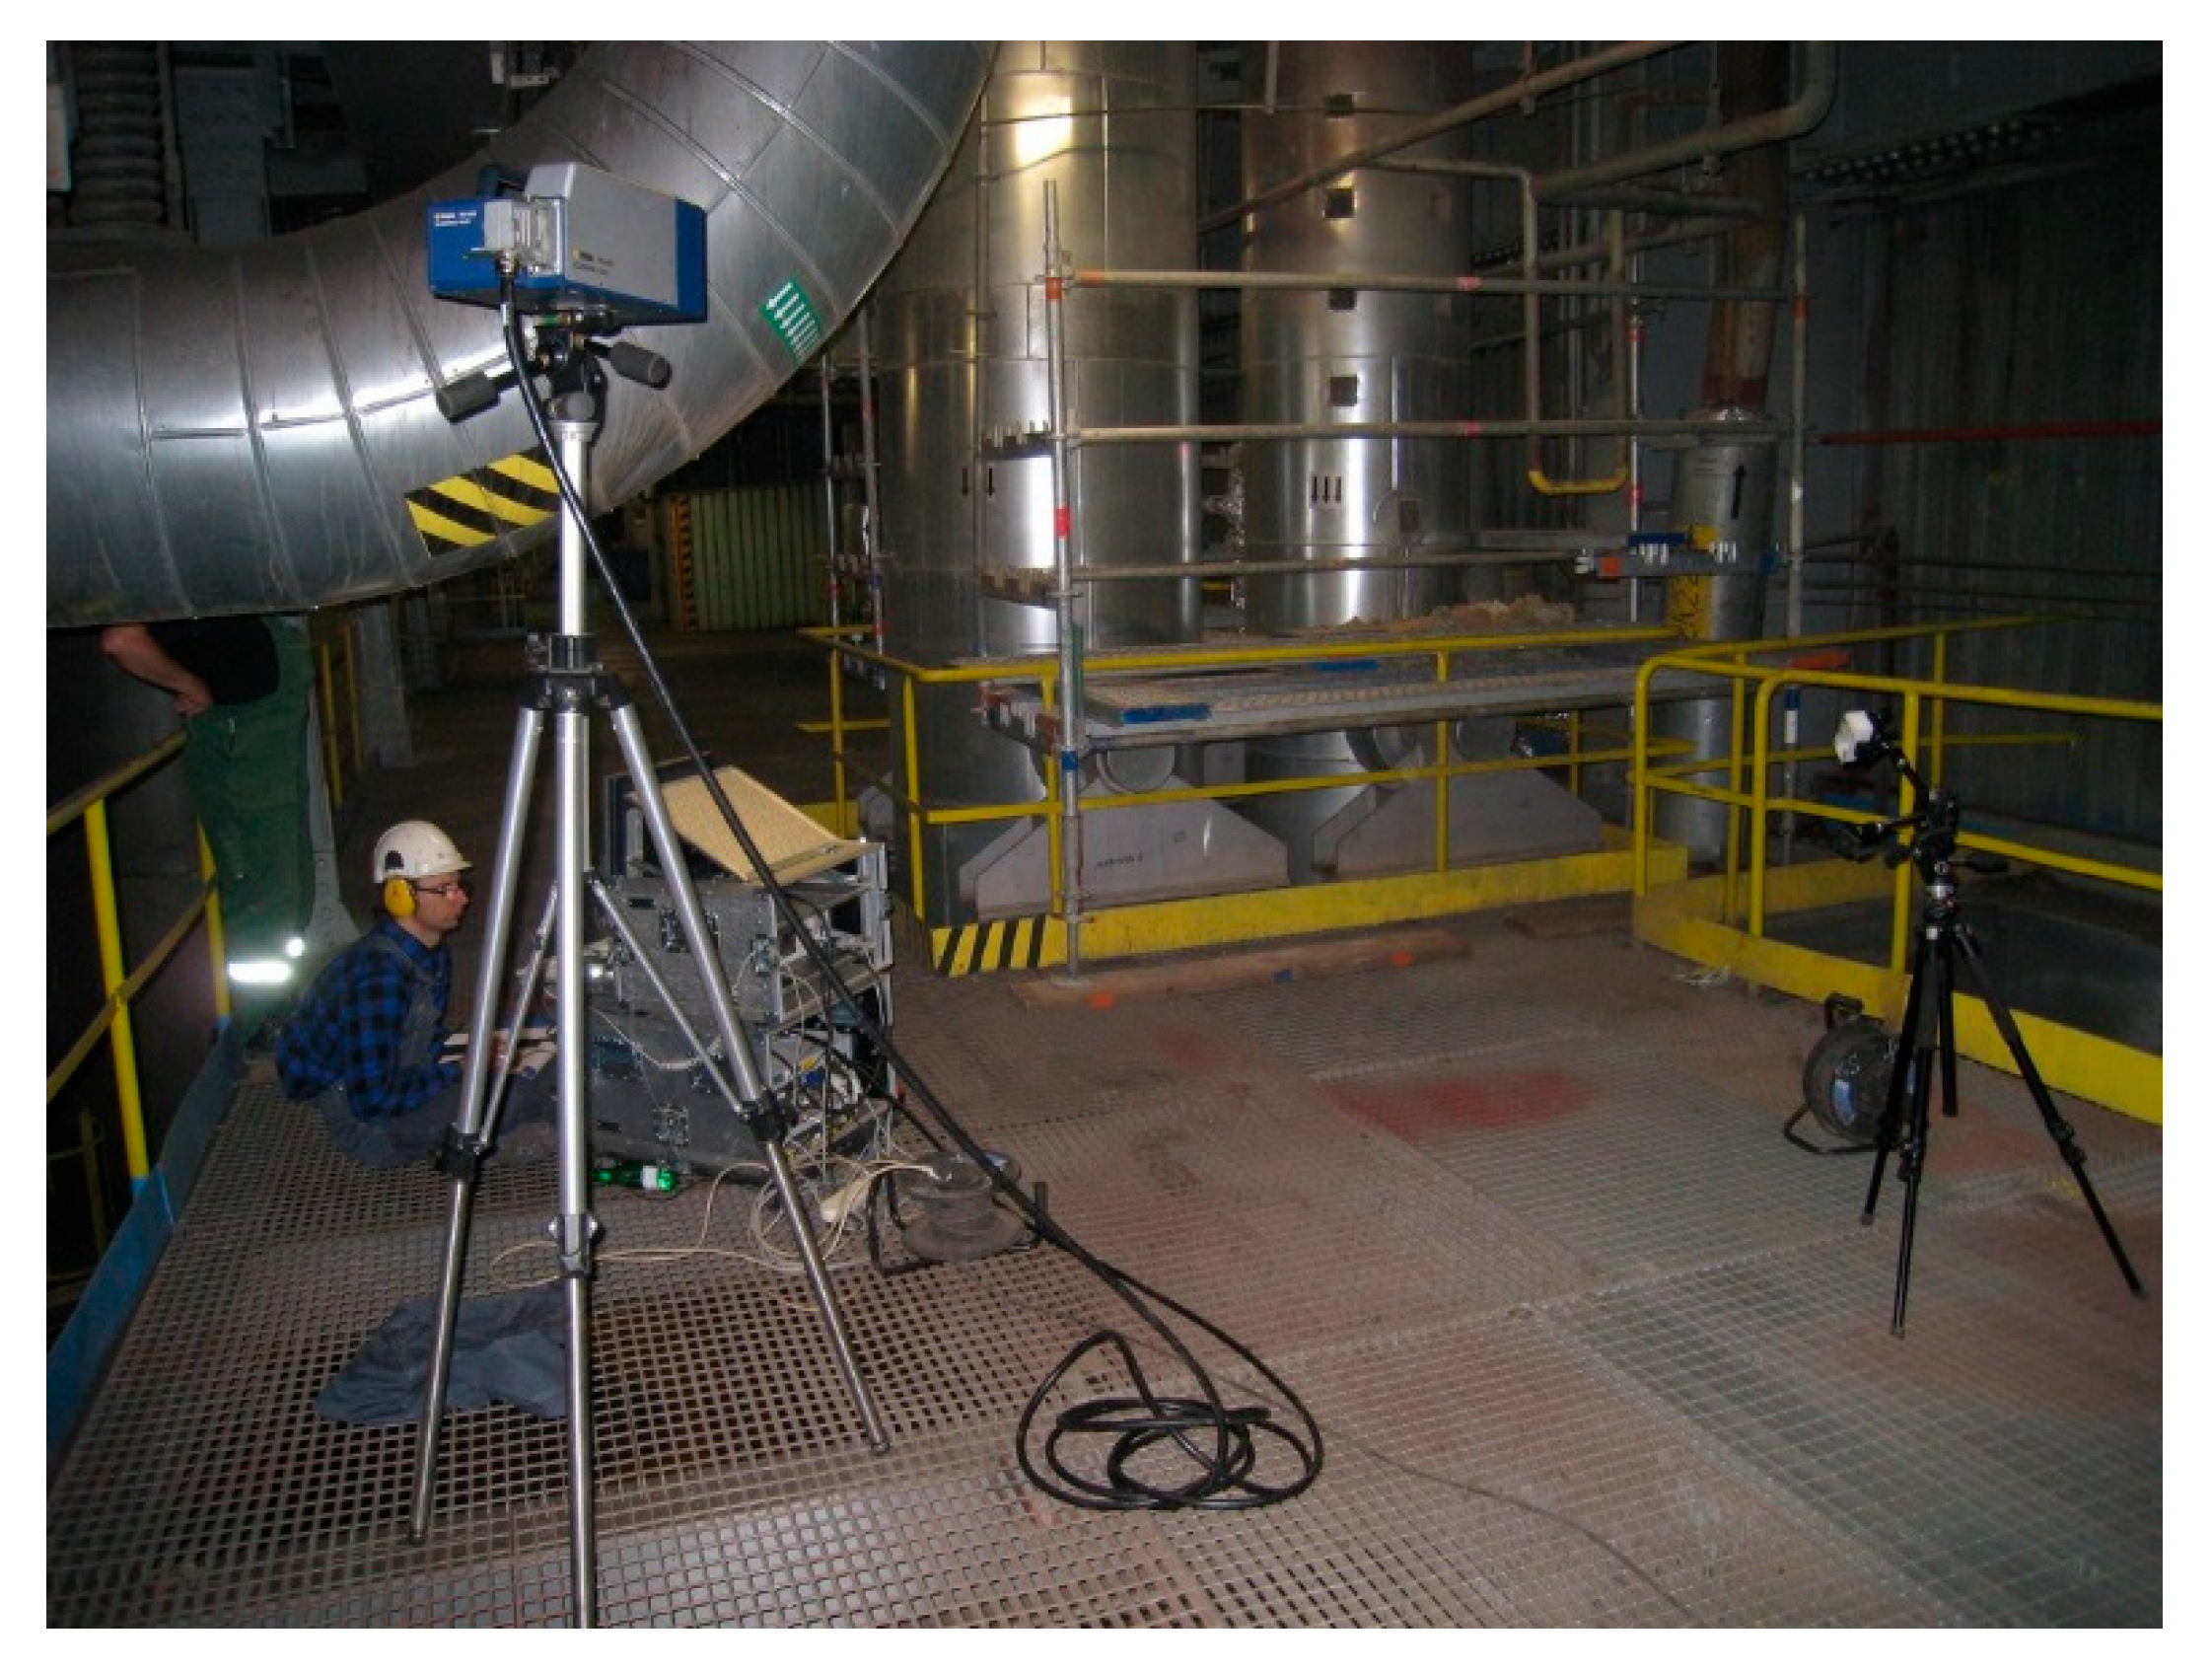
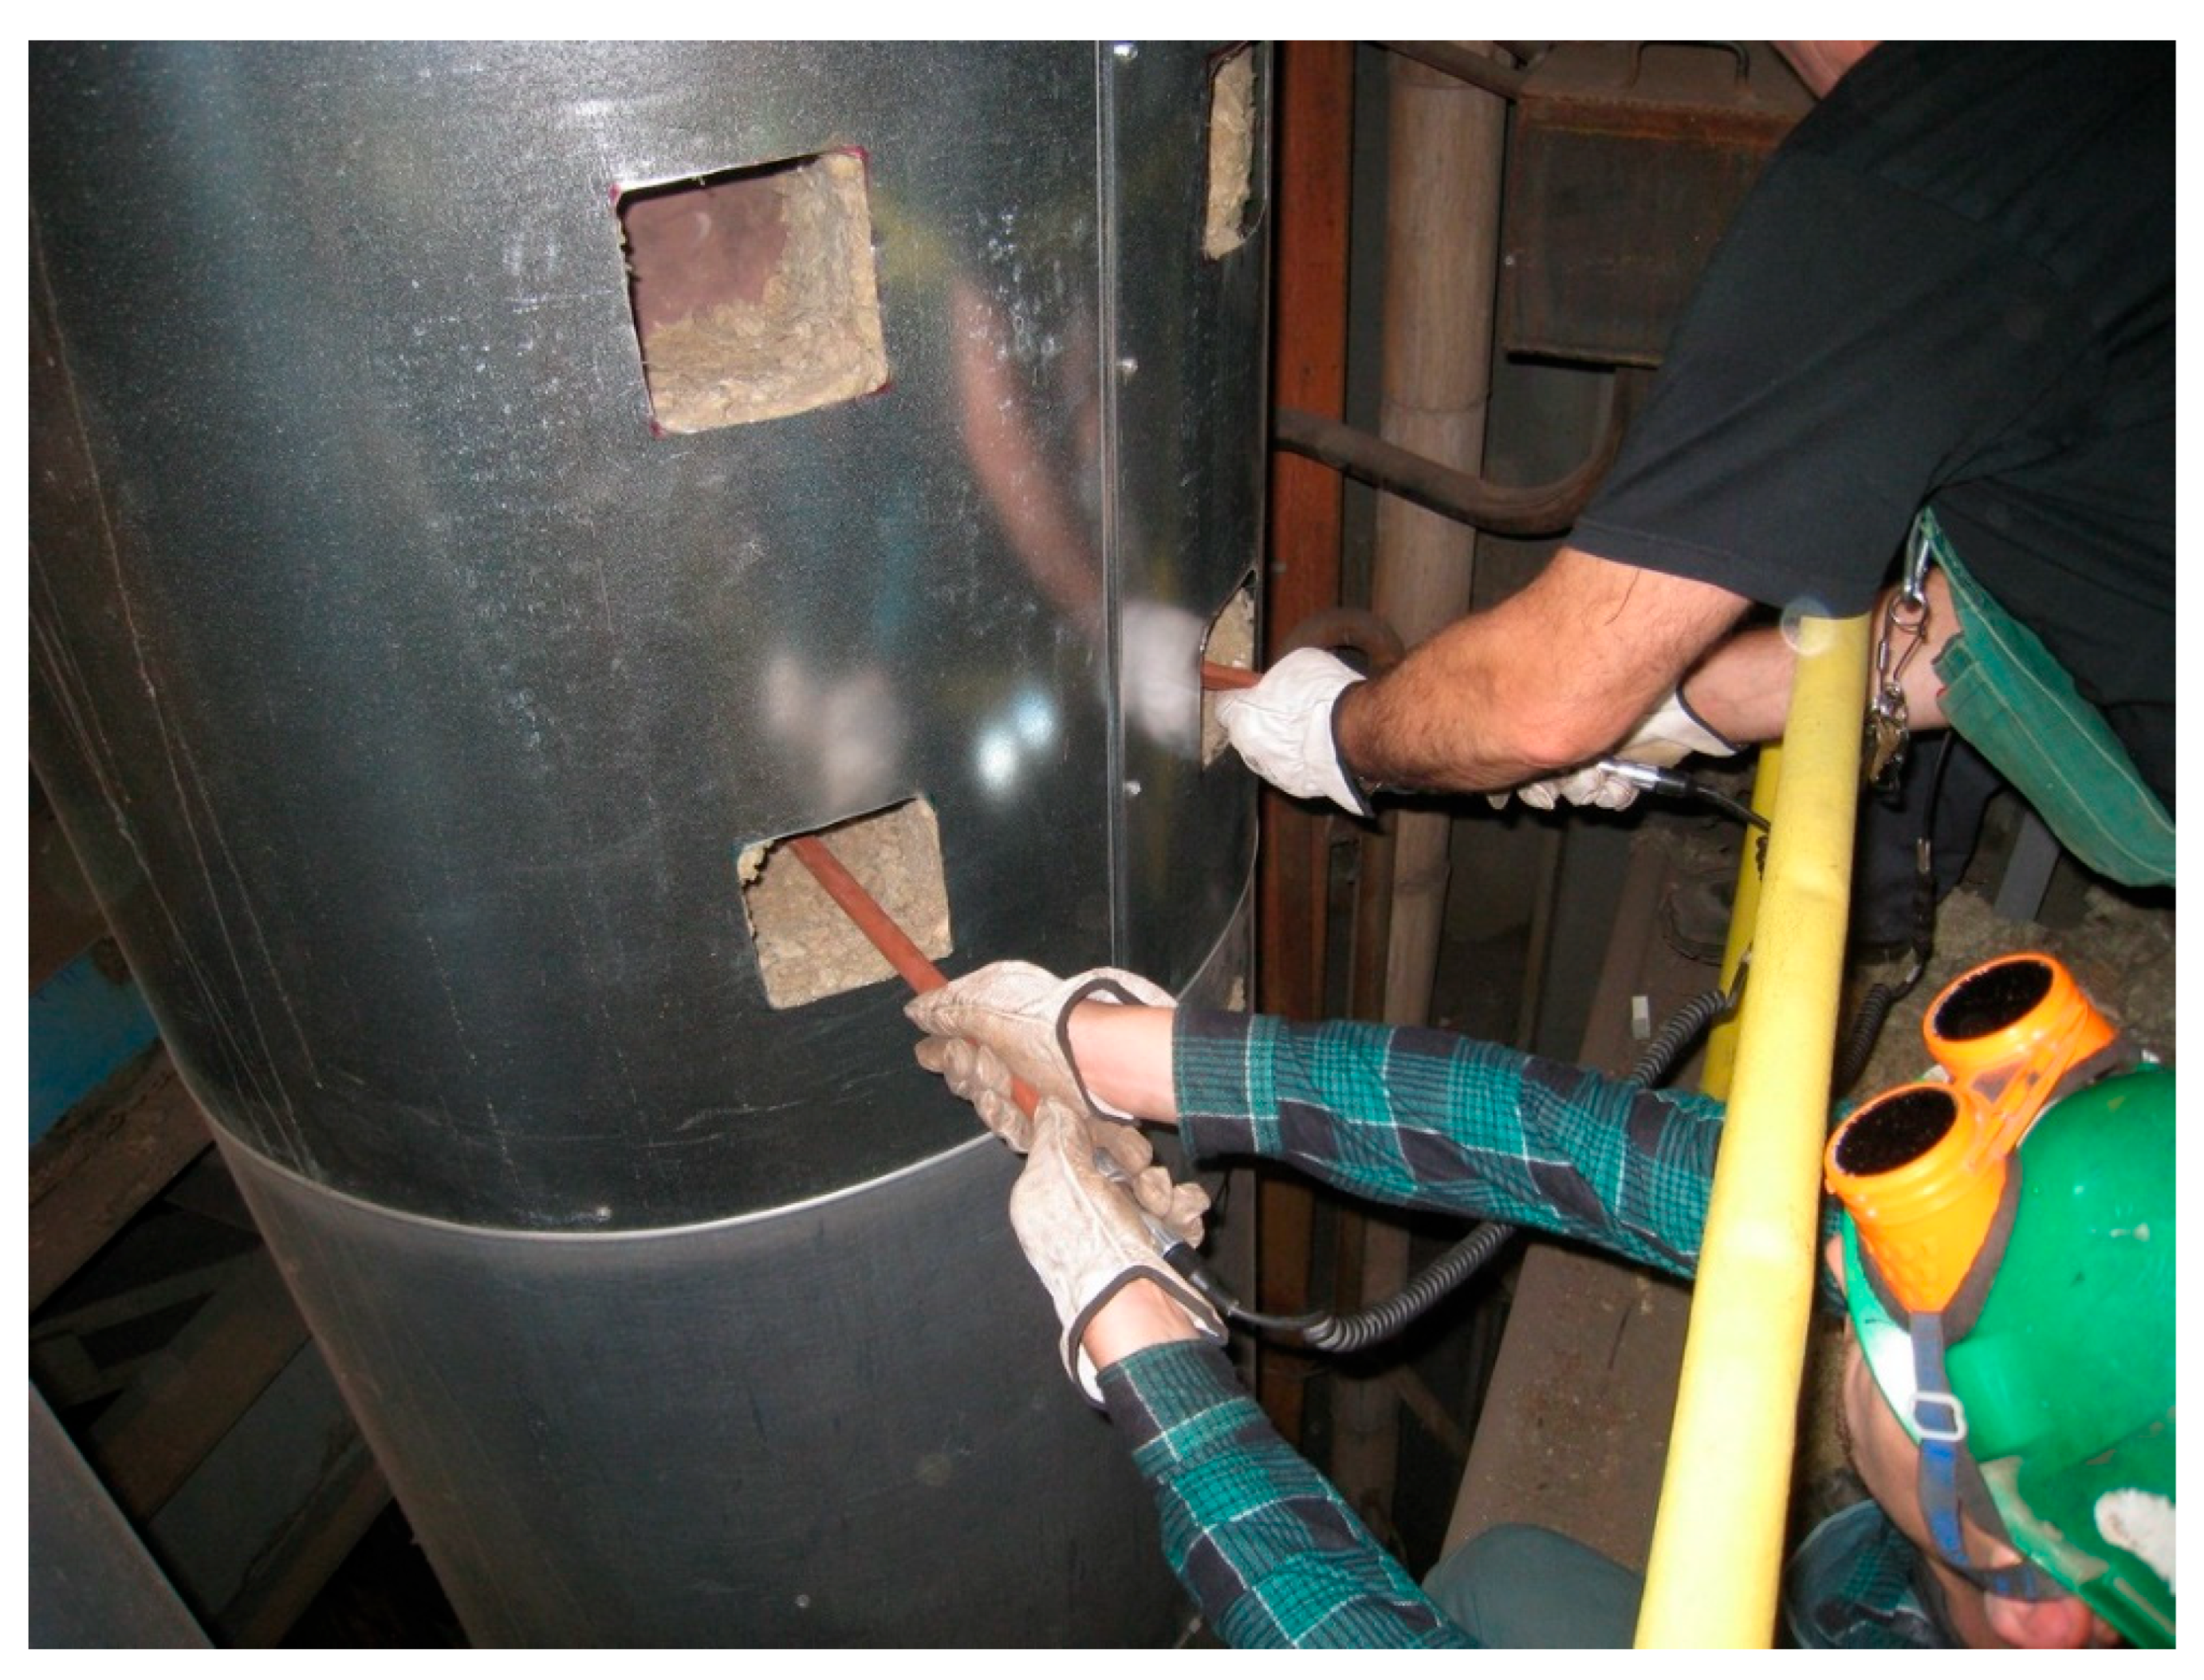
3. Measurement of Vibrations of the Live Steam Pipelines

Experimental tests were performed by means of a Polytec PSV-400 scanning laser vibrometer (Polytec GmbH, Waldbronn, Germany), which allows for direct non-contact measurements of vibration velocity and displacement. The basic parameters of the measuring system were as follows:
-
Bandwidth range from 0.1 to 250 kHz;
-
Maximum scan speed—100 points per second;
-
Vibration velocity range—1 μm/s to 10 m/s;
-
Displacement range—1 μm to 160 mm;
-
Laser type—633 nm (red) He-Ne laser, with power lower than 1 mW;
-
Scanning range ±20° about X, Y;
-
Angular resolution < 0.002°.
Vibration measurements were taken on power unit A, in which the live steam pipeline vibrated and generated noise at the level of 105 dB. For the purposes of comparison, vibration measurements were taken in the almost identical power unit B, where such problem did not occur. Vibration measurements of both pipelines were taken by means of a laser vibrometer. In order to measure the vibrations directly in both pipelines, holes were made in the thermal insulation at the following three levels of power unit A: 12 m, 17 m, and 36 m and at the level of 12 m in the control unit B, where excessive vibration and noise does not occur. The locations of the measurement points/levels were dictated by the expected structural modal vibrations modes and were selected to avoid vibration nodes. The exact height of the measurement levels (12, 17, 36) was dictated by the floor level of the building in which the pipeline was installed. Examples of measurement points are shown in Figure 5, Figure 6 and Figure 7. The holes were spaced at 0.40 m vertically and 45° around the circumference. Figure 6 shows the laser vibrometer system during vibration measurements.
The following parameters were measured:
-
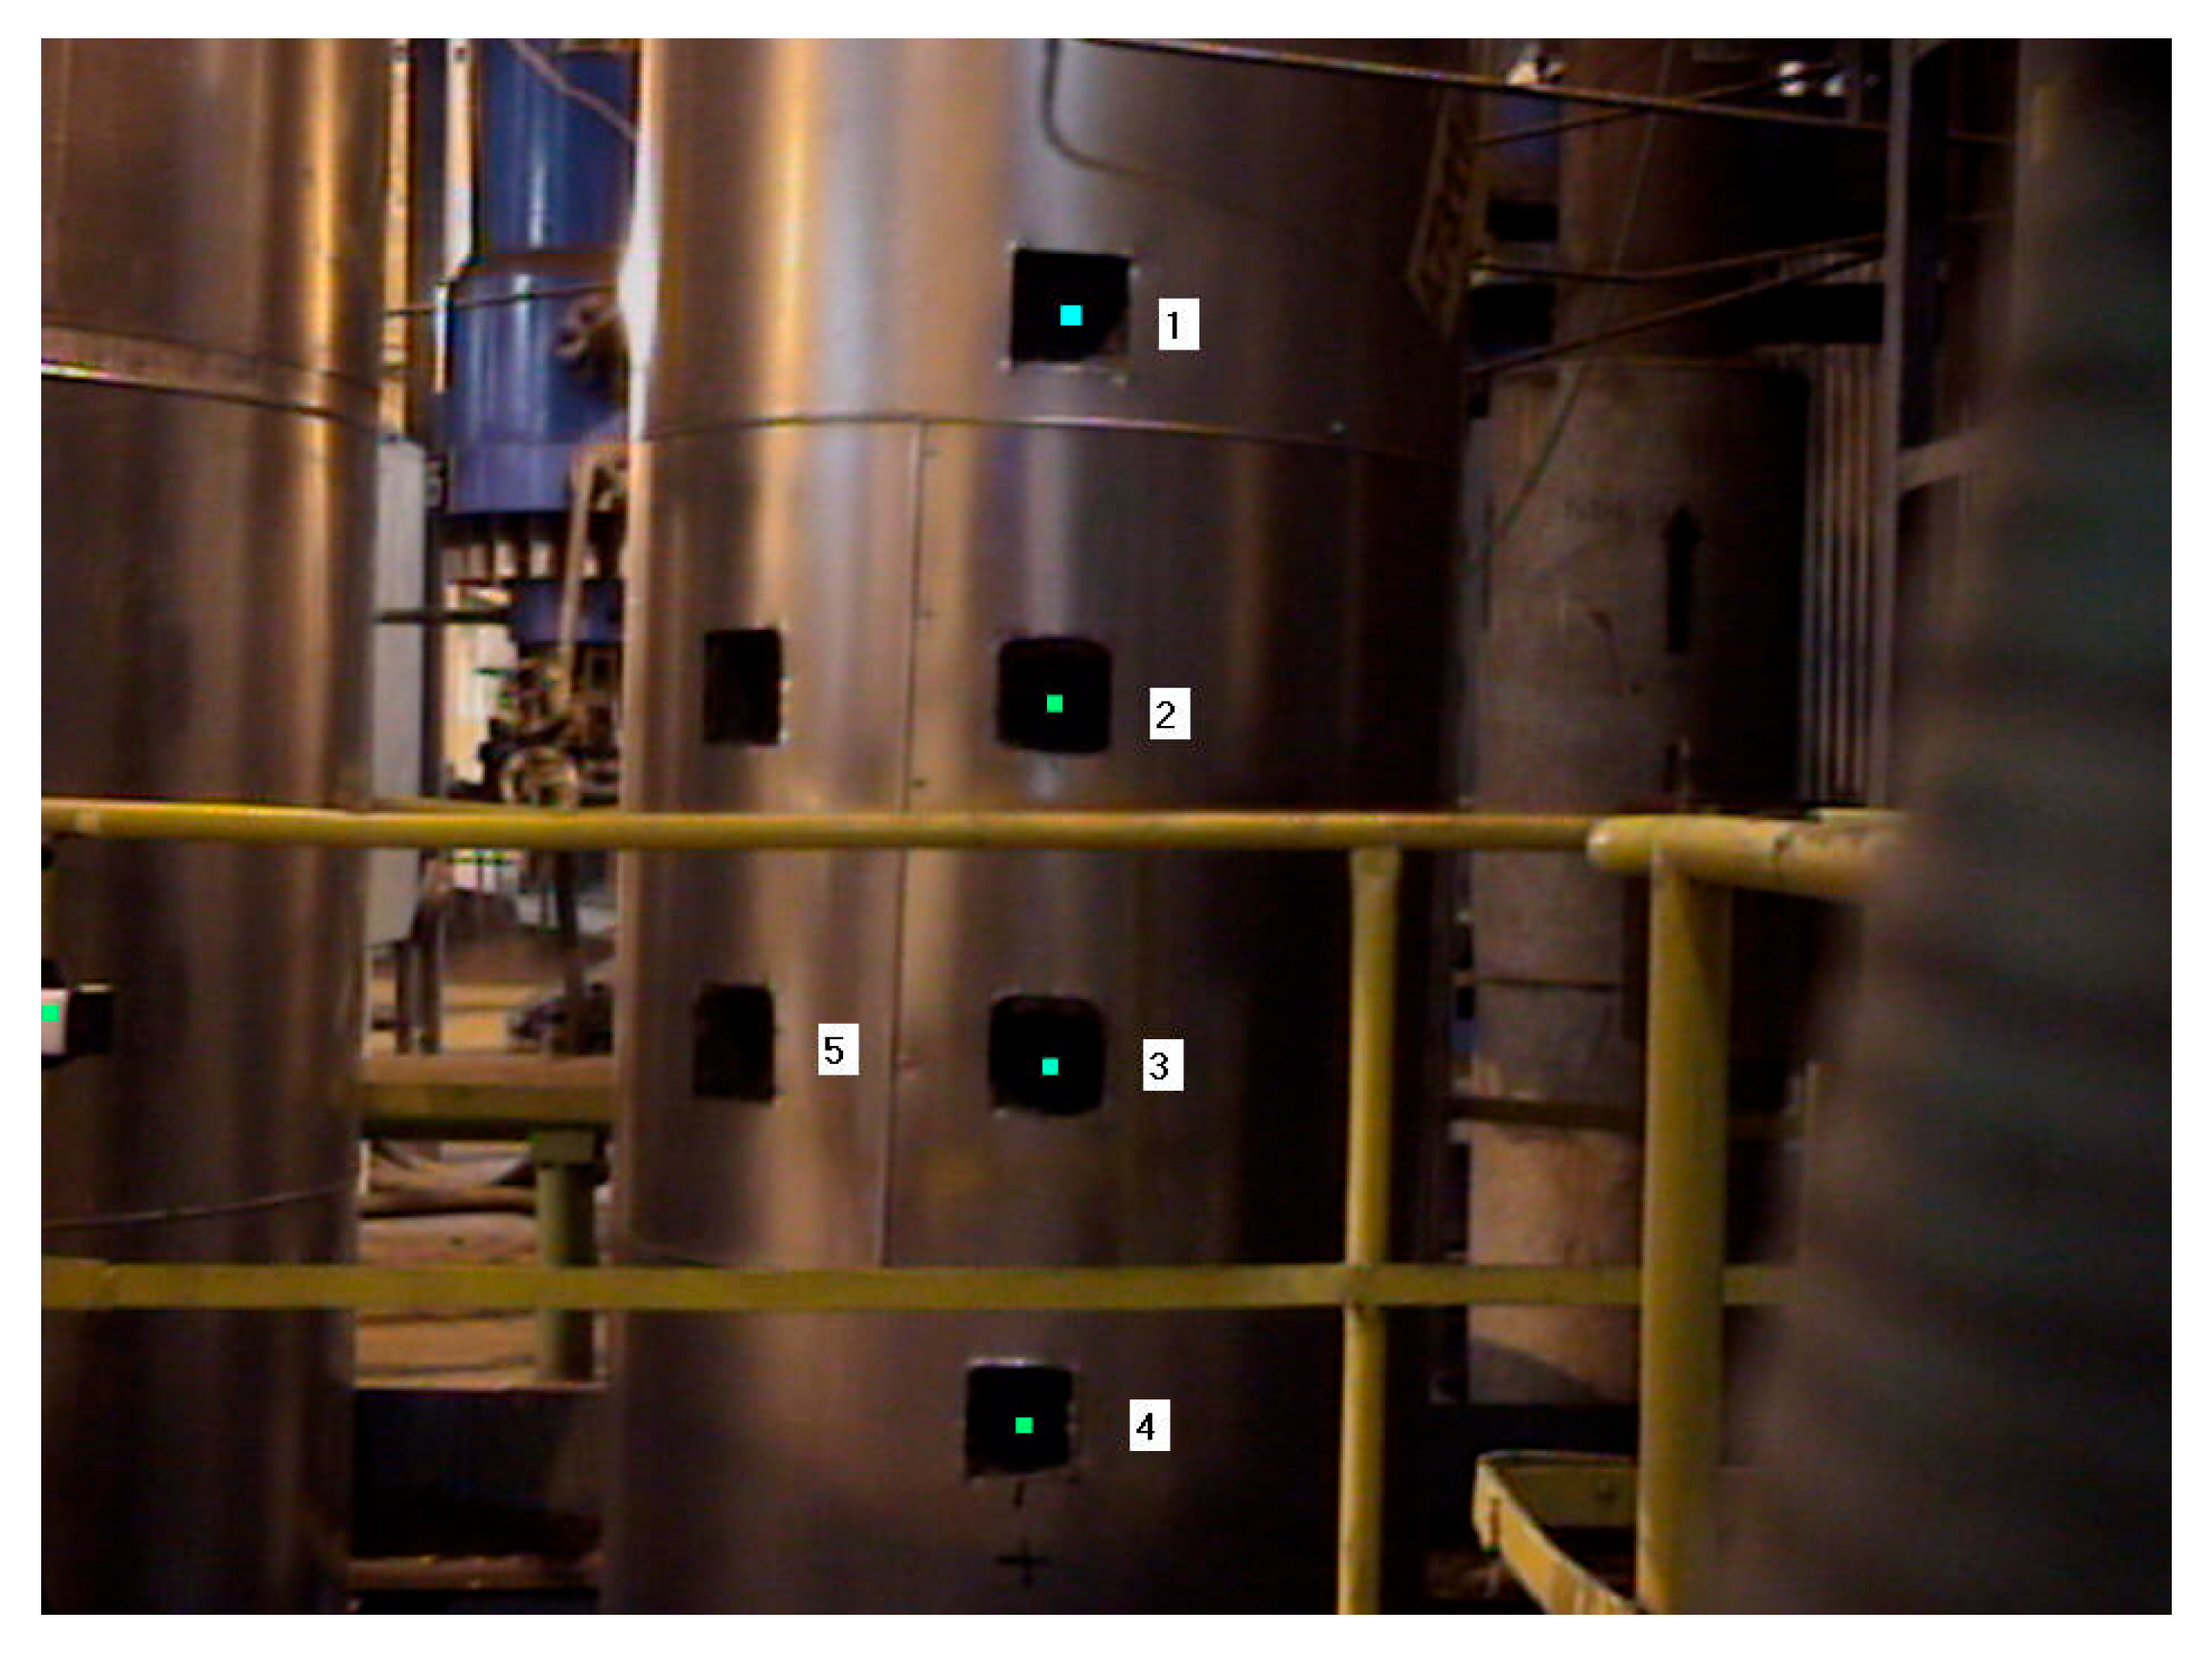
The velocity and the RMS values of vibrations at individual measurement points;
-
Mode shapes at individual levels [8], where measurements were taken;
-
Amplitude–frequency spectrums for individual measurement points in order to evaluate if the structure does not operate in the resonant bands.
For the time of the measurements, the control operation was responsible for keeping the operational parameters of the installation at the unchanged level to secure the stationary character of the vibrations.
Table 1 lists the results in the form of RMS values of vibration velocity at individual measurement points, recorded at subsequent working levels in power unit A. The results of measurements taken at the level of 12 m in unit B are also included for comparison. Figure 7 shows the labels for measurement points used in Table 1.
Figure 8 shows the amplitude–frequency plot for vibrations at the operating levels where measurements were made. The analysis also included the calculation of mode shapes, which are described in detail in [8], where it was concluded that they are of variable character similar to that of a sinusoidal waveform. The amplitude–frequency plot for vibrations of the live steam pipeline (Figure 8a) shows that in unit A, the dominating vibration frequency is 957 Hz, which was registered at all levels of unit A. On the other hand, the measurements taken on a similar power unit with identical parameters, except for the diameters of live steam pipeline, i.e., in power unit B, do not show this dominating frequency value, as illustrated in Figure 8b. The dominating vibration frequency in unit B is 7.5 Hz.
Based on the obtained results of measurements of vibrations of the live steam pipeline taken by means of a laser vibrometer, the following were observed:
-
The highest recorded RMS vibration velocity (Table 1) in power unit A at the level of 17 m was VRMS,17,A = 10.92 mm/s;
-
The lowest vibration level was recorded at the level of 36 m, where the RMS value of vibration was about 50% lower than the vibrations at the level of 17 m;
-
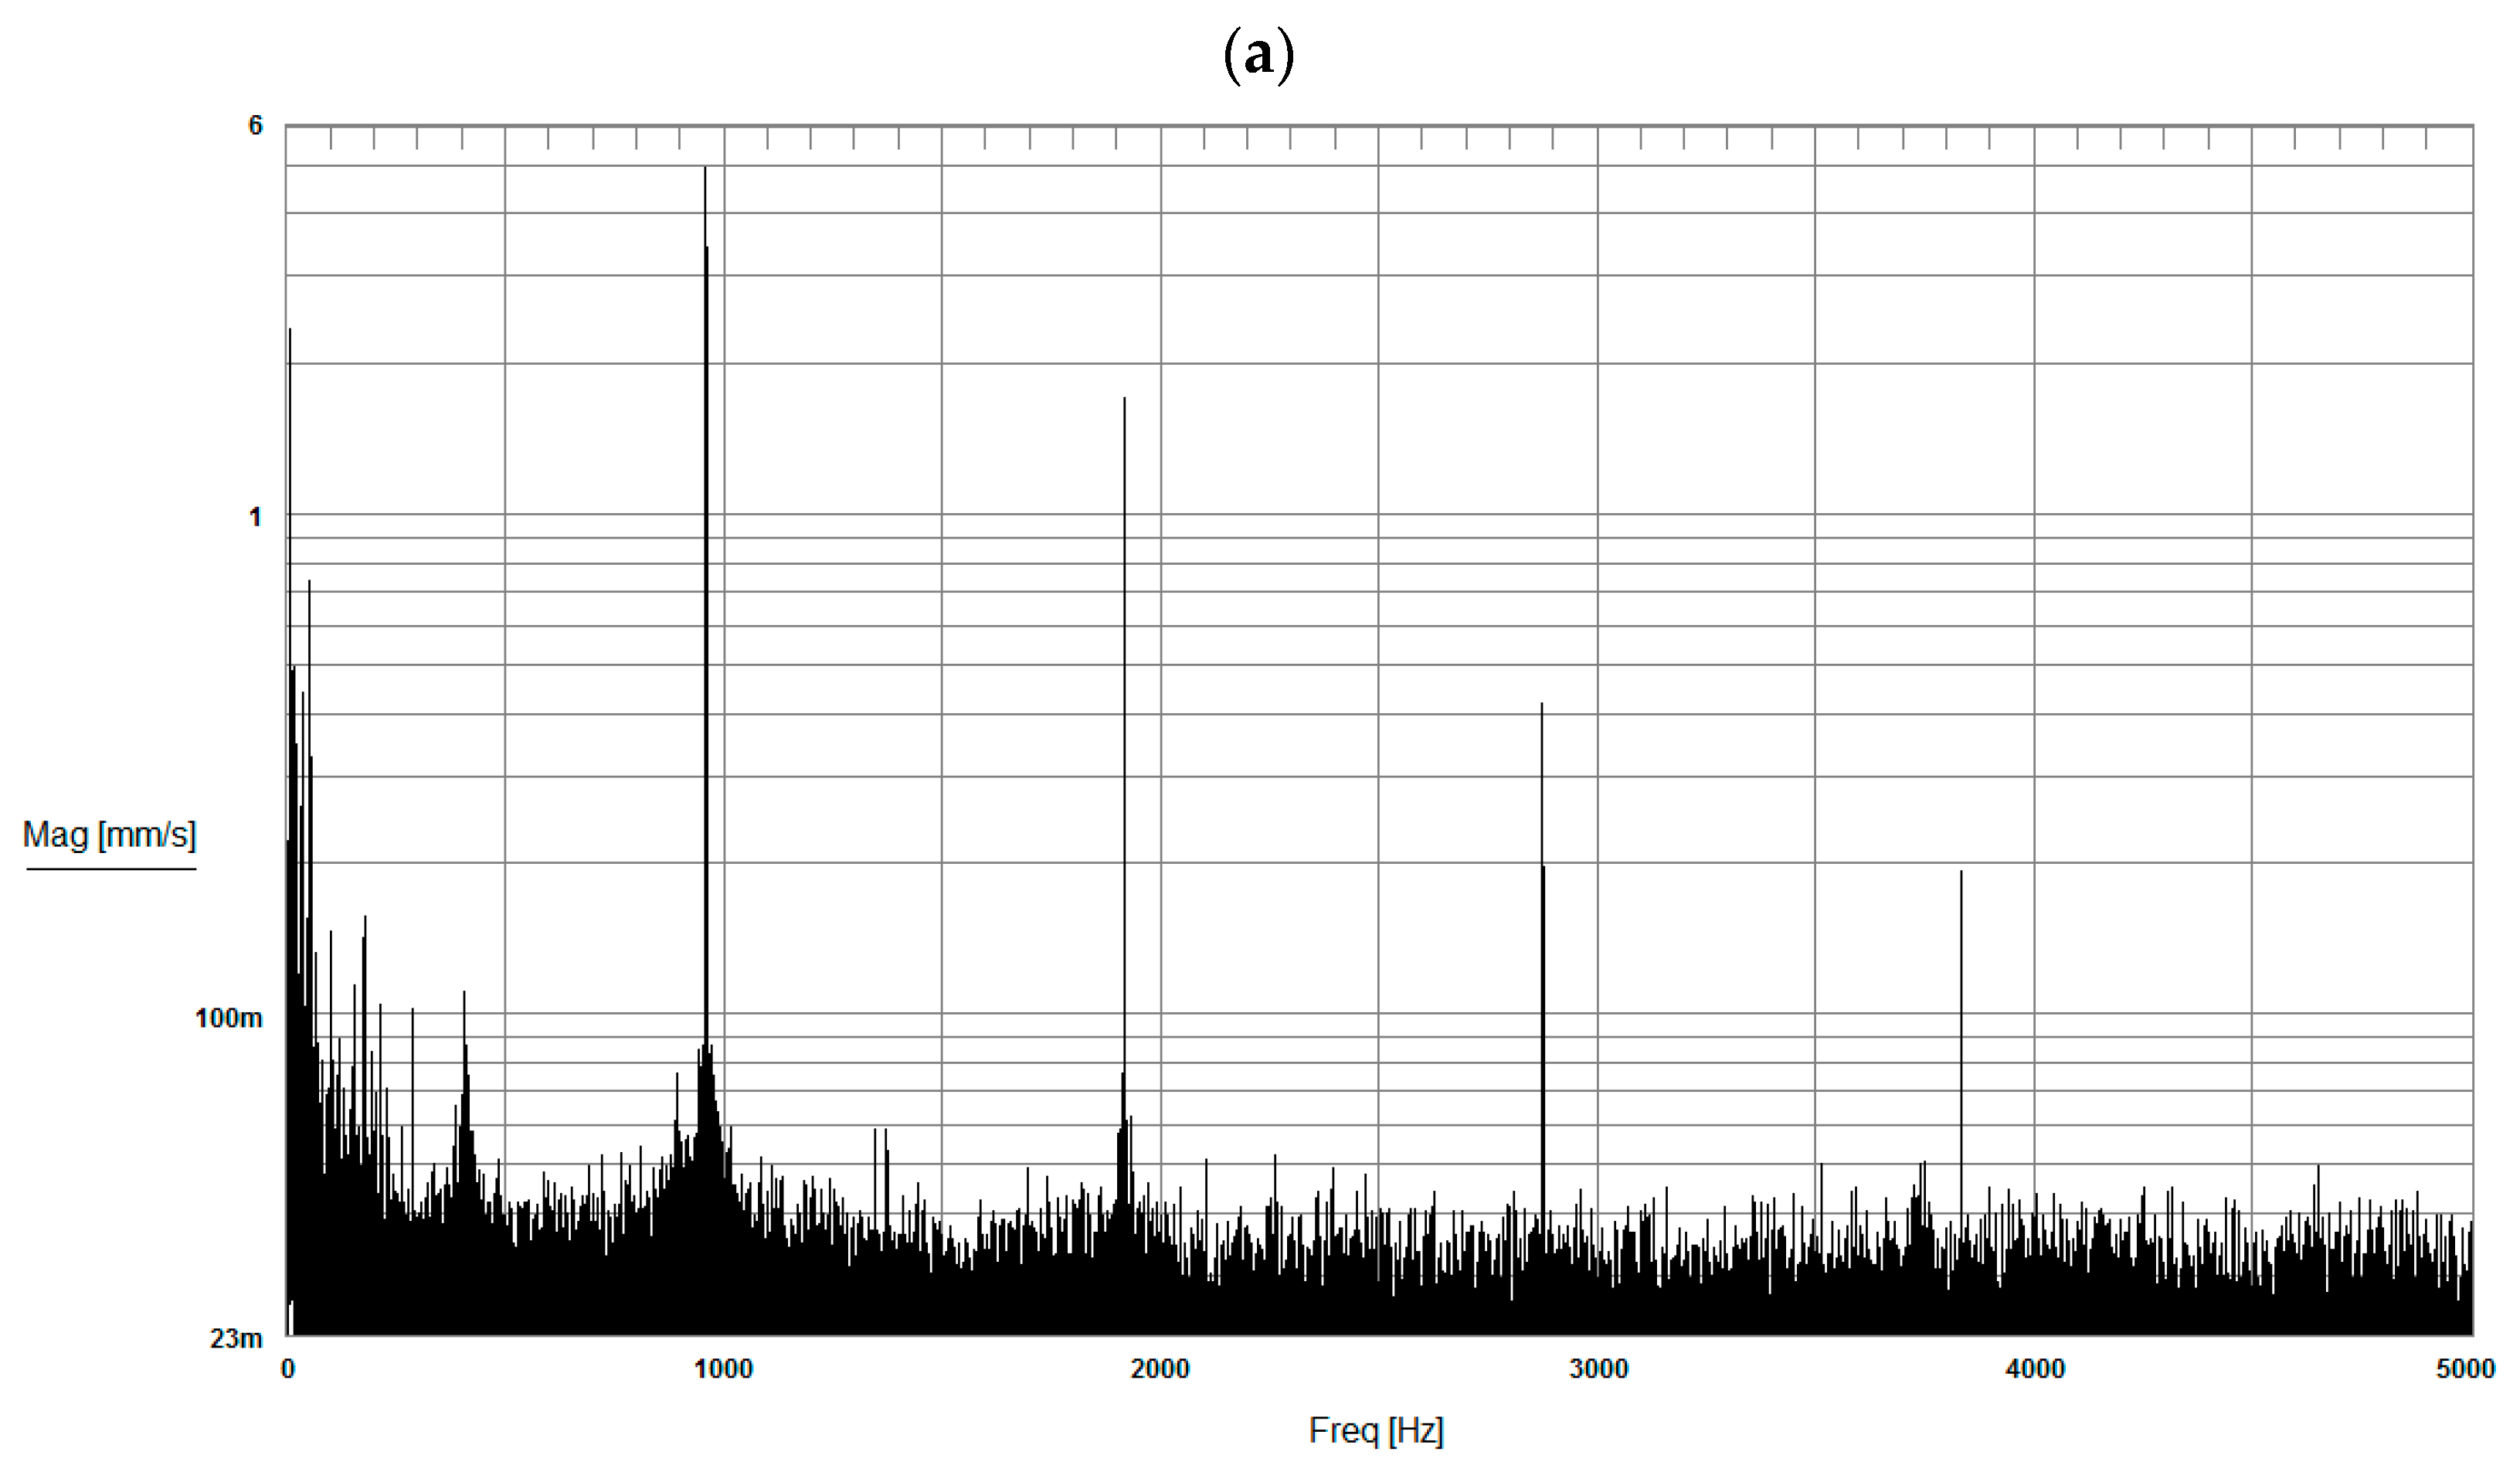
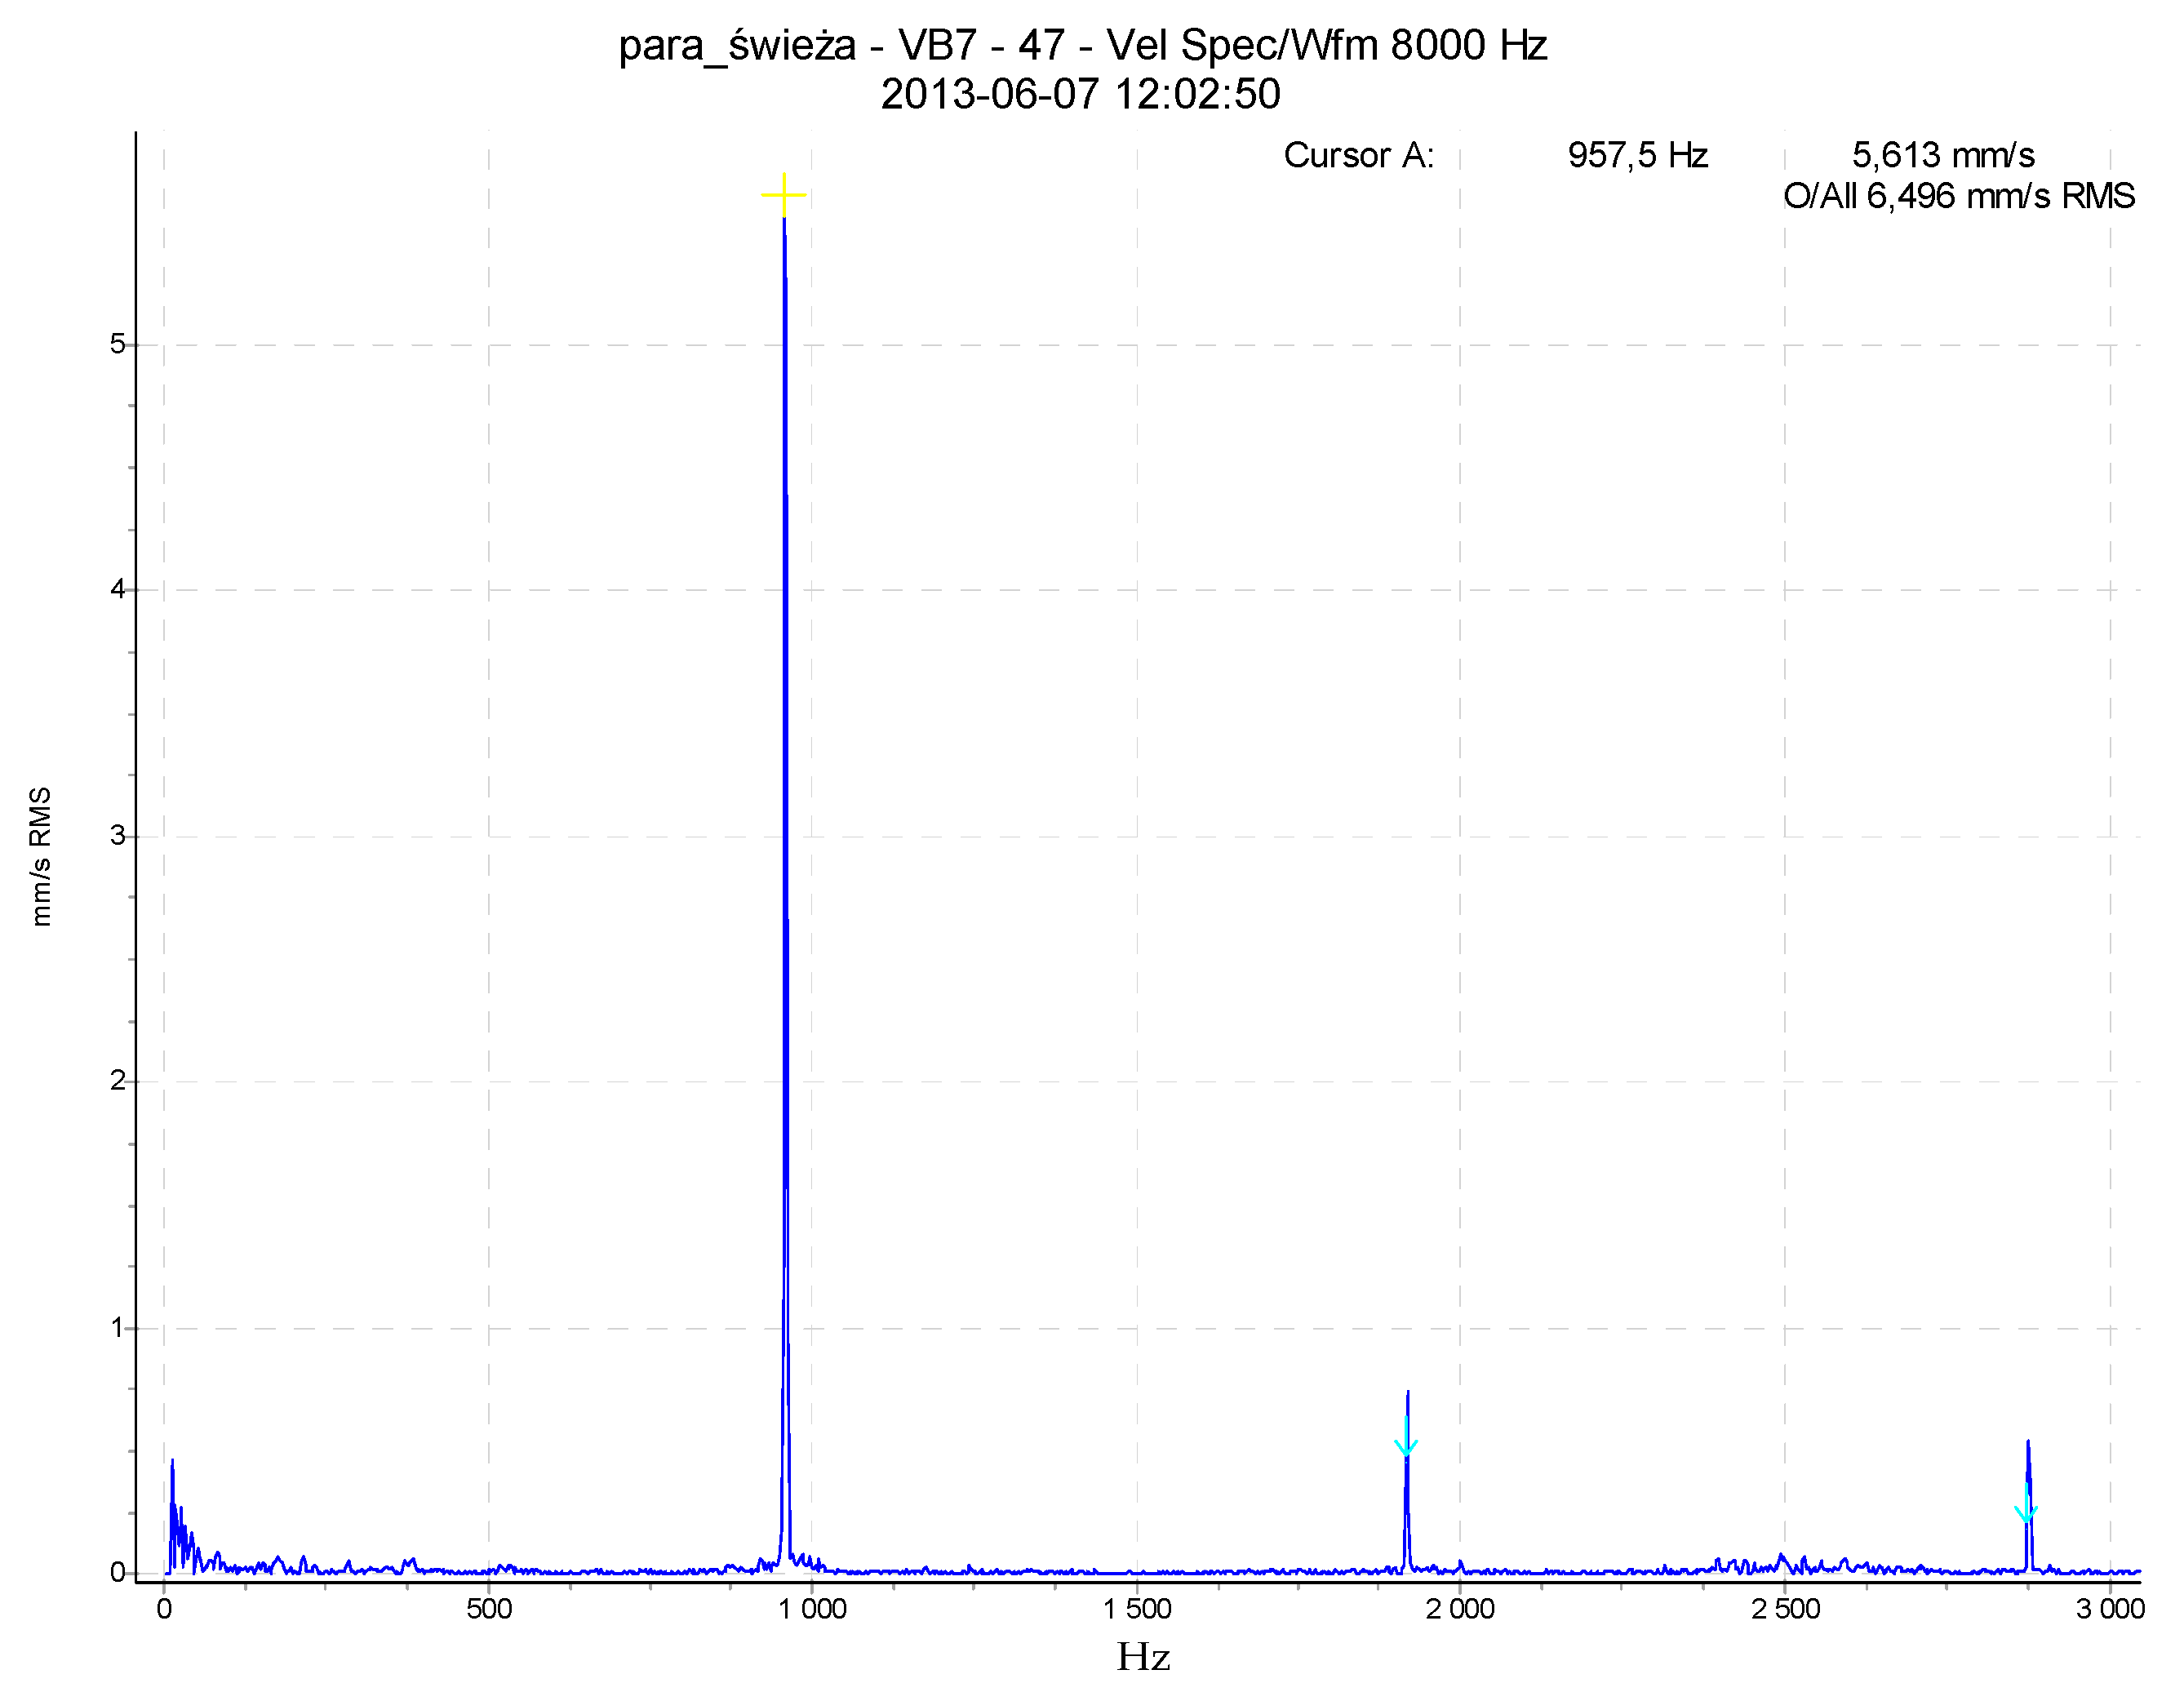
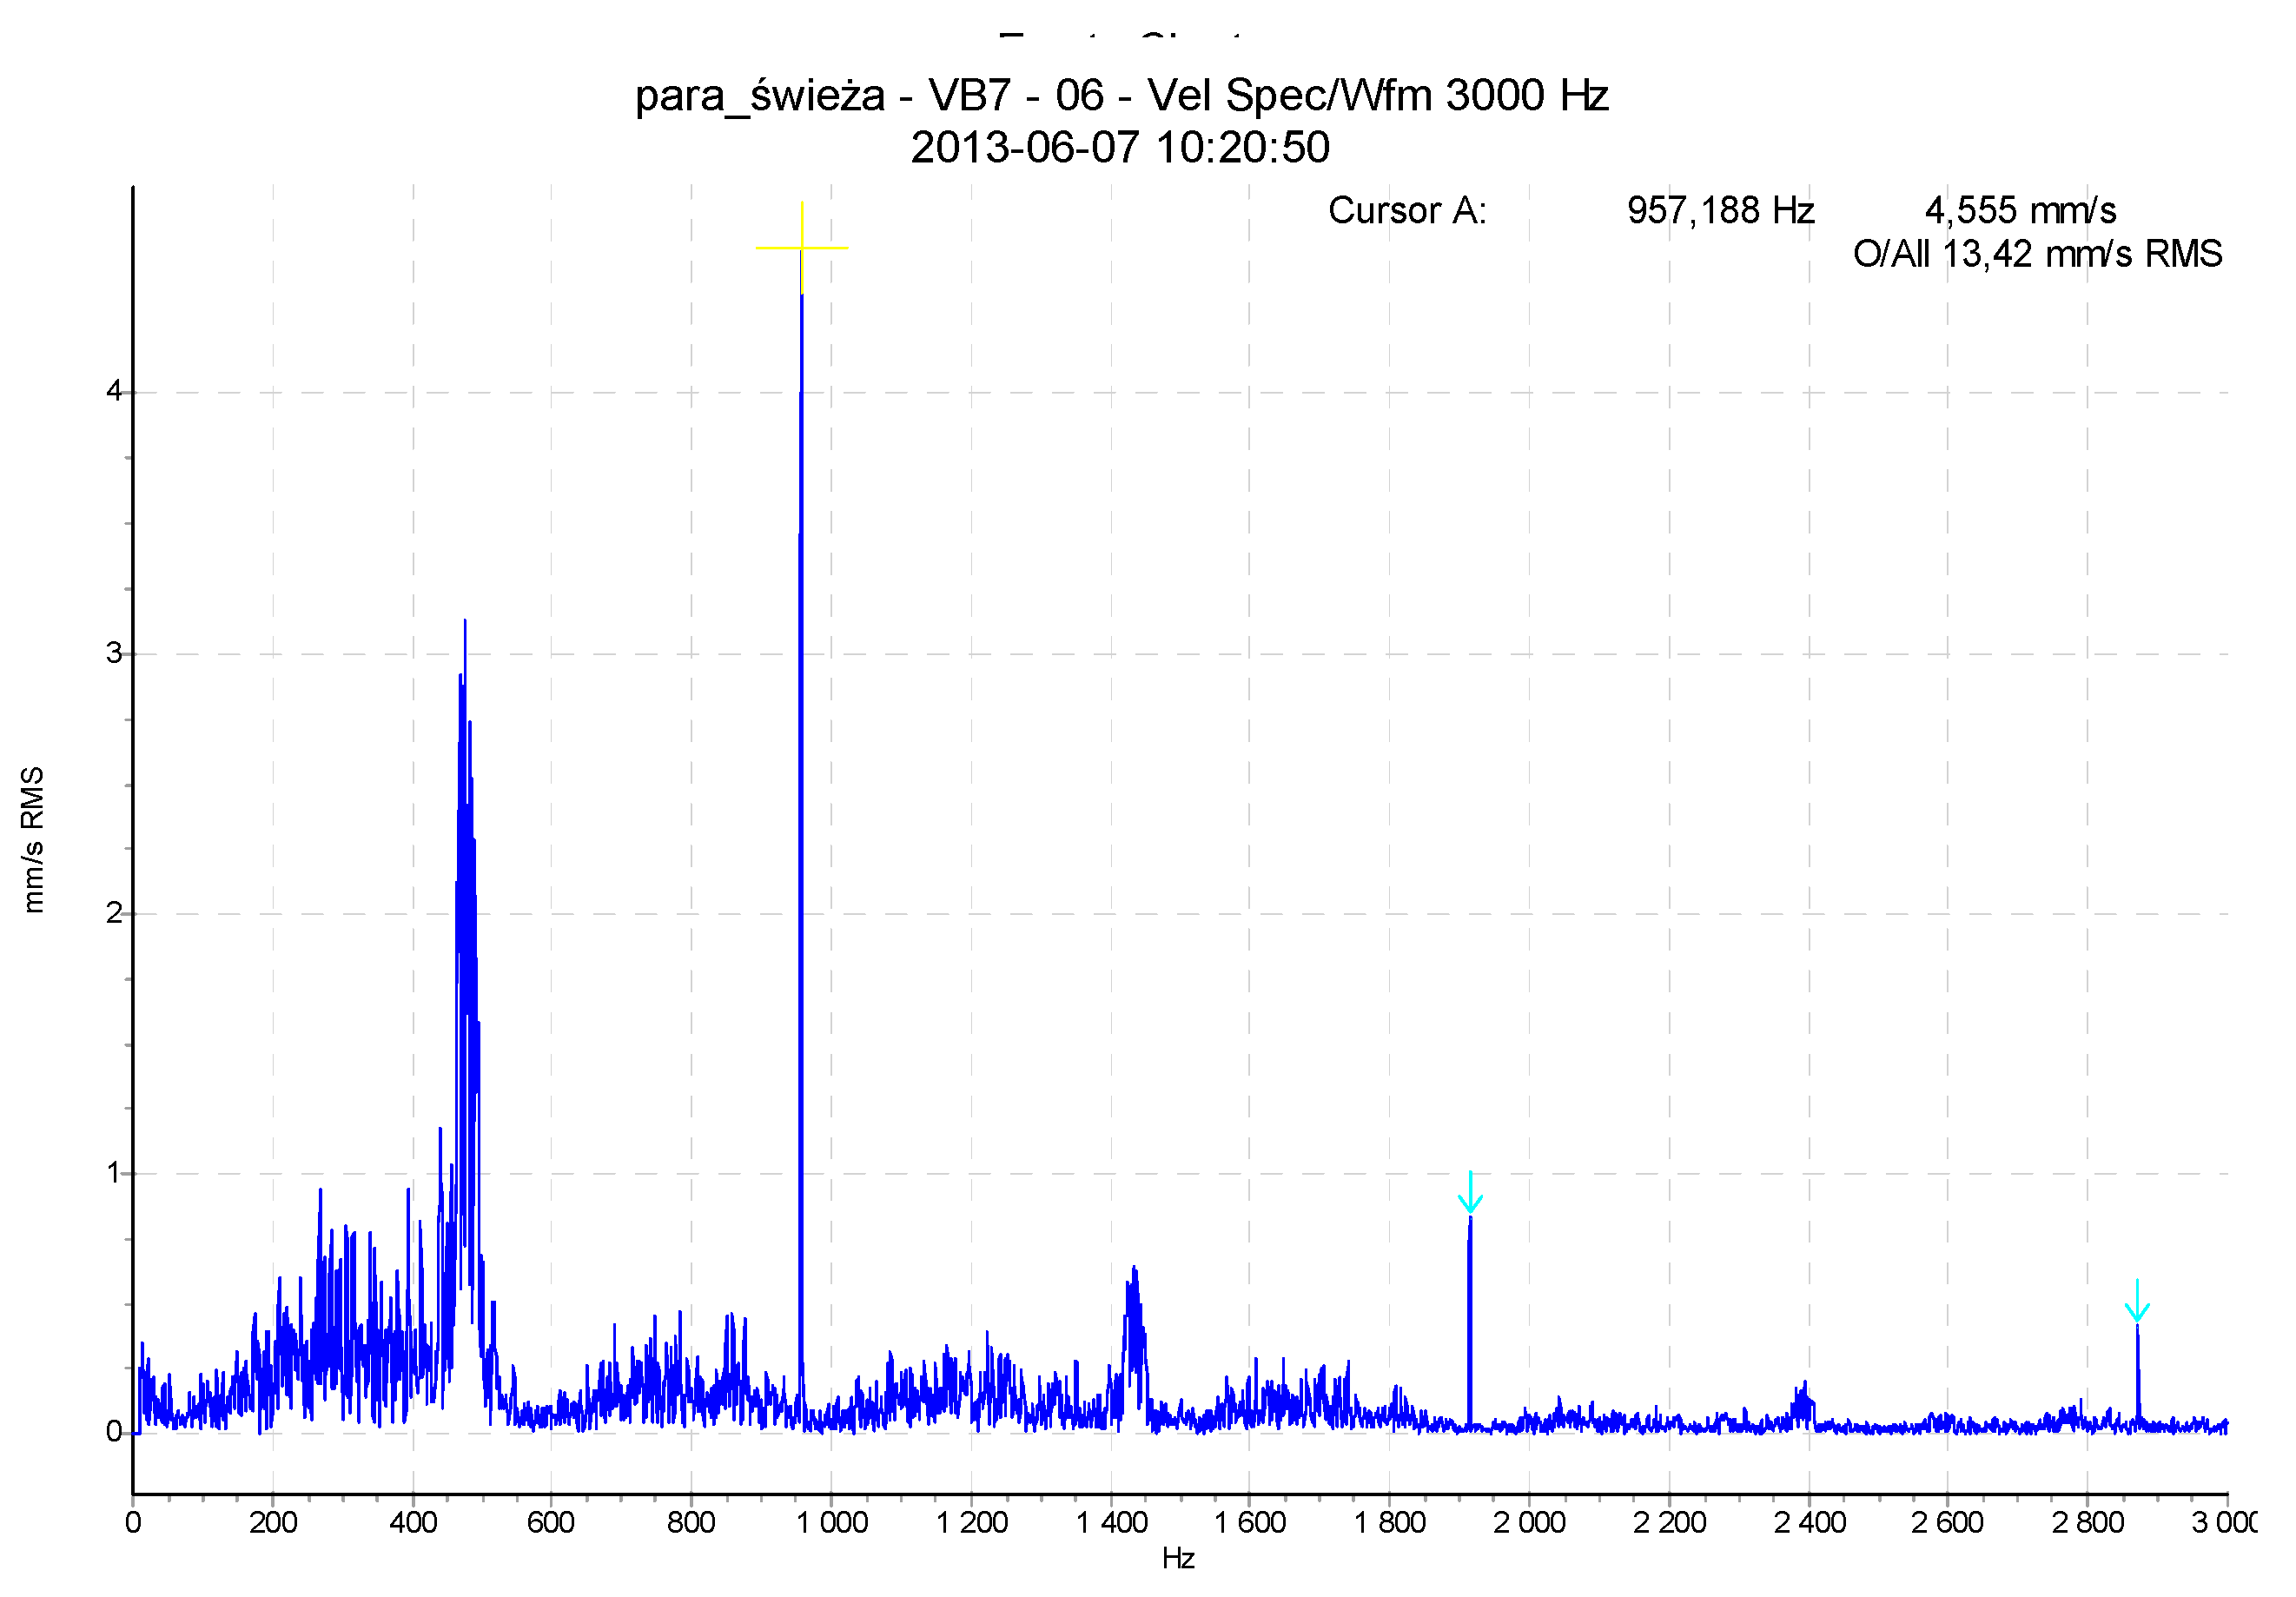
The dominating vibration frequency recorded at all levels of the noise-generating power unit A was fA = 957 Hz, which is in close match to the structural modal modes identified in numerical simulations (see Section 6);
-
In comparison, the results of measurements taken on power unit B, whose parameters are identical to those of the noise-generating unit A, show that the highest RMS value of vibration velocity (Table 1) was VRMS,12,B = 3.70 mm/s, with a vibration frequency of fB = 7.5 Hz;
-
The mode shape of the pipeline in unit A has characteristics of a sinusoidal-wave shape transmitted along its axis. A mode shape of this type was not observed in unit B [8]

4. Vibration Measurements Using a Handheld Dual-Channel Accelerometer

The vibration of the pipeline was measured using a Commtest VB7 dual-channel vibration analyzer. The measurement was taken using a handheld method. Due to the significant thickness of the pipe insulation, which made it impossible to mount the sensors directly on the pipe surface, the measurement resembled an indirect method and was taken by means of probes (steel rods—Figure 9). Measurements using this method were taken on supports in power unit A at the levels of 12 m, 17 m, 36 m, and 56 m. Due to the difficult access and the necessity to use probes, the measurements of the pipeline in unit B were taken only at the levels of 12 m and 17 m.
The presented diagrams in Figure 10 and Figure 11 illustrate the RMS amplitude and frequency spectrums of the vibration of the pipeline supports at the levels of 12 m and 17 m in power unit A.

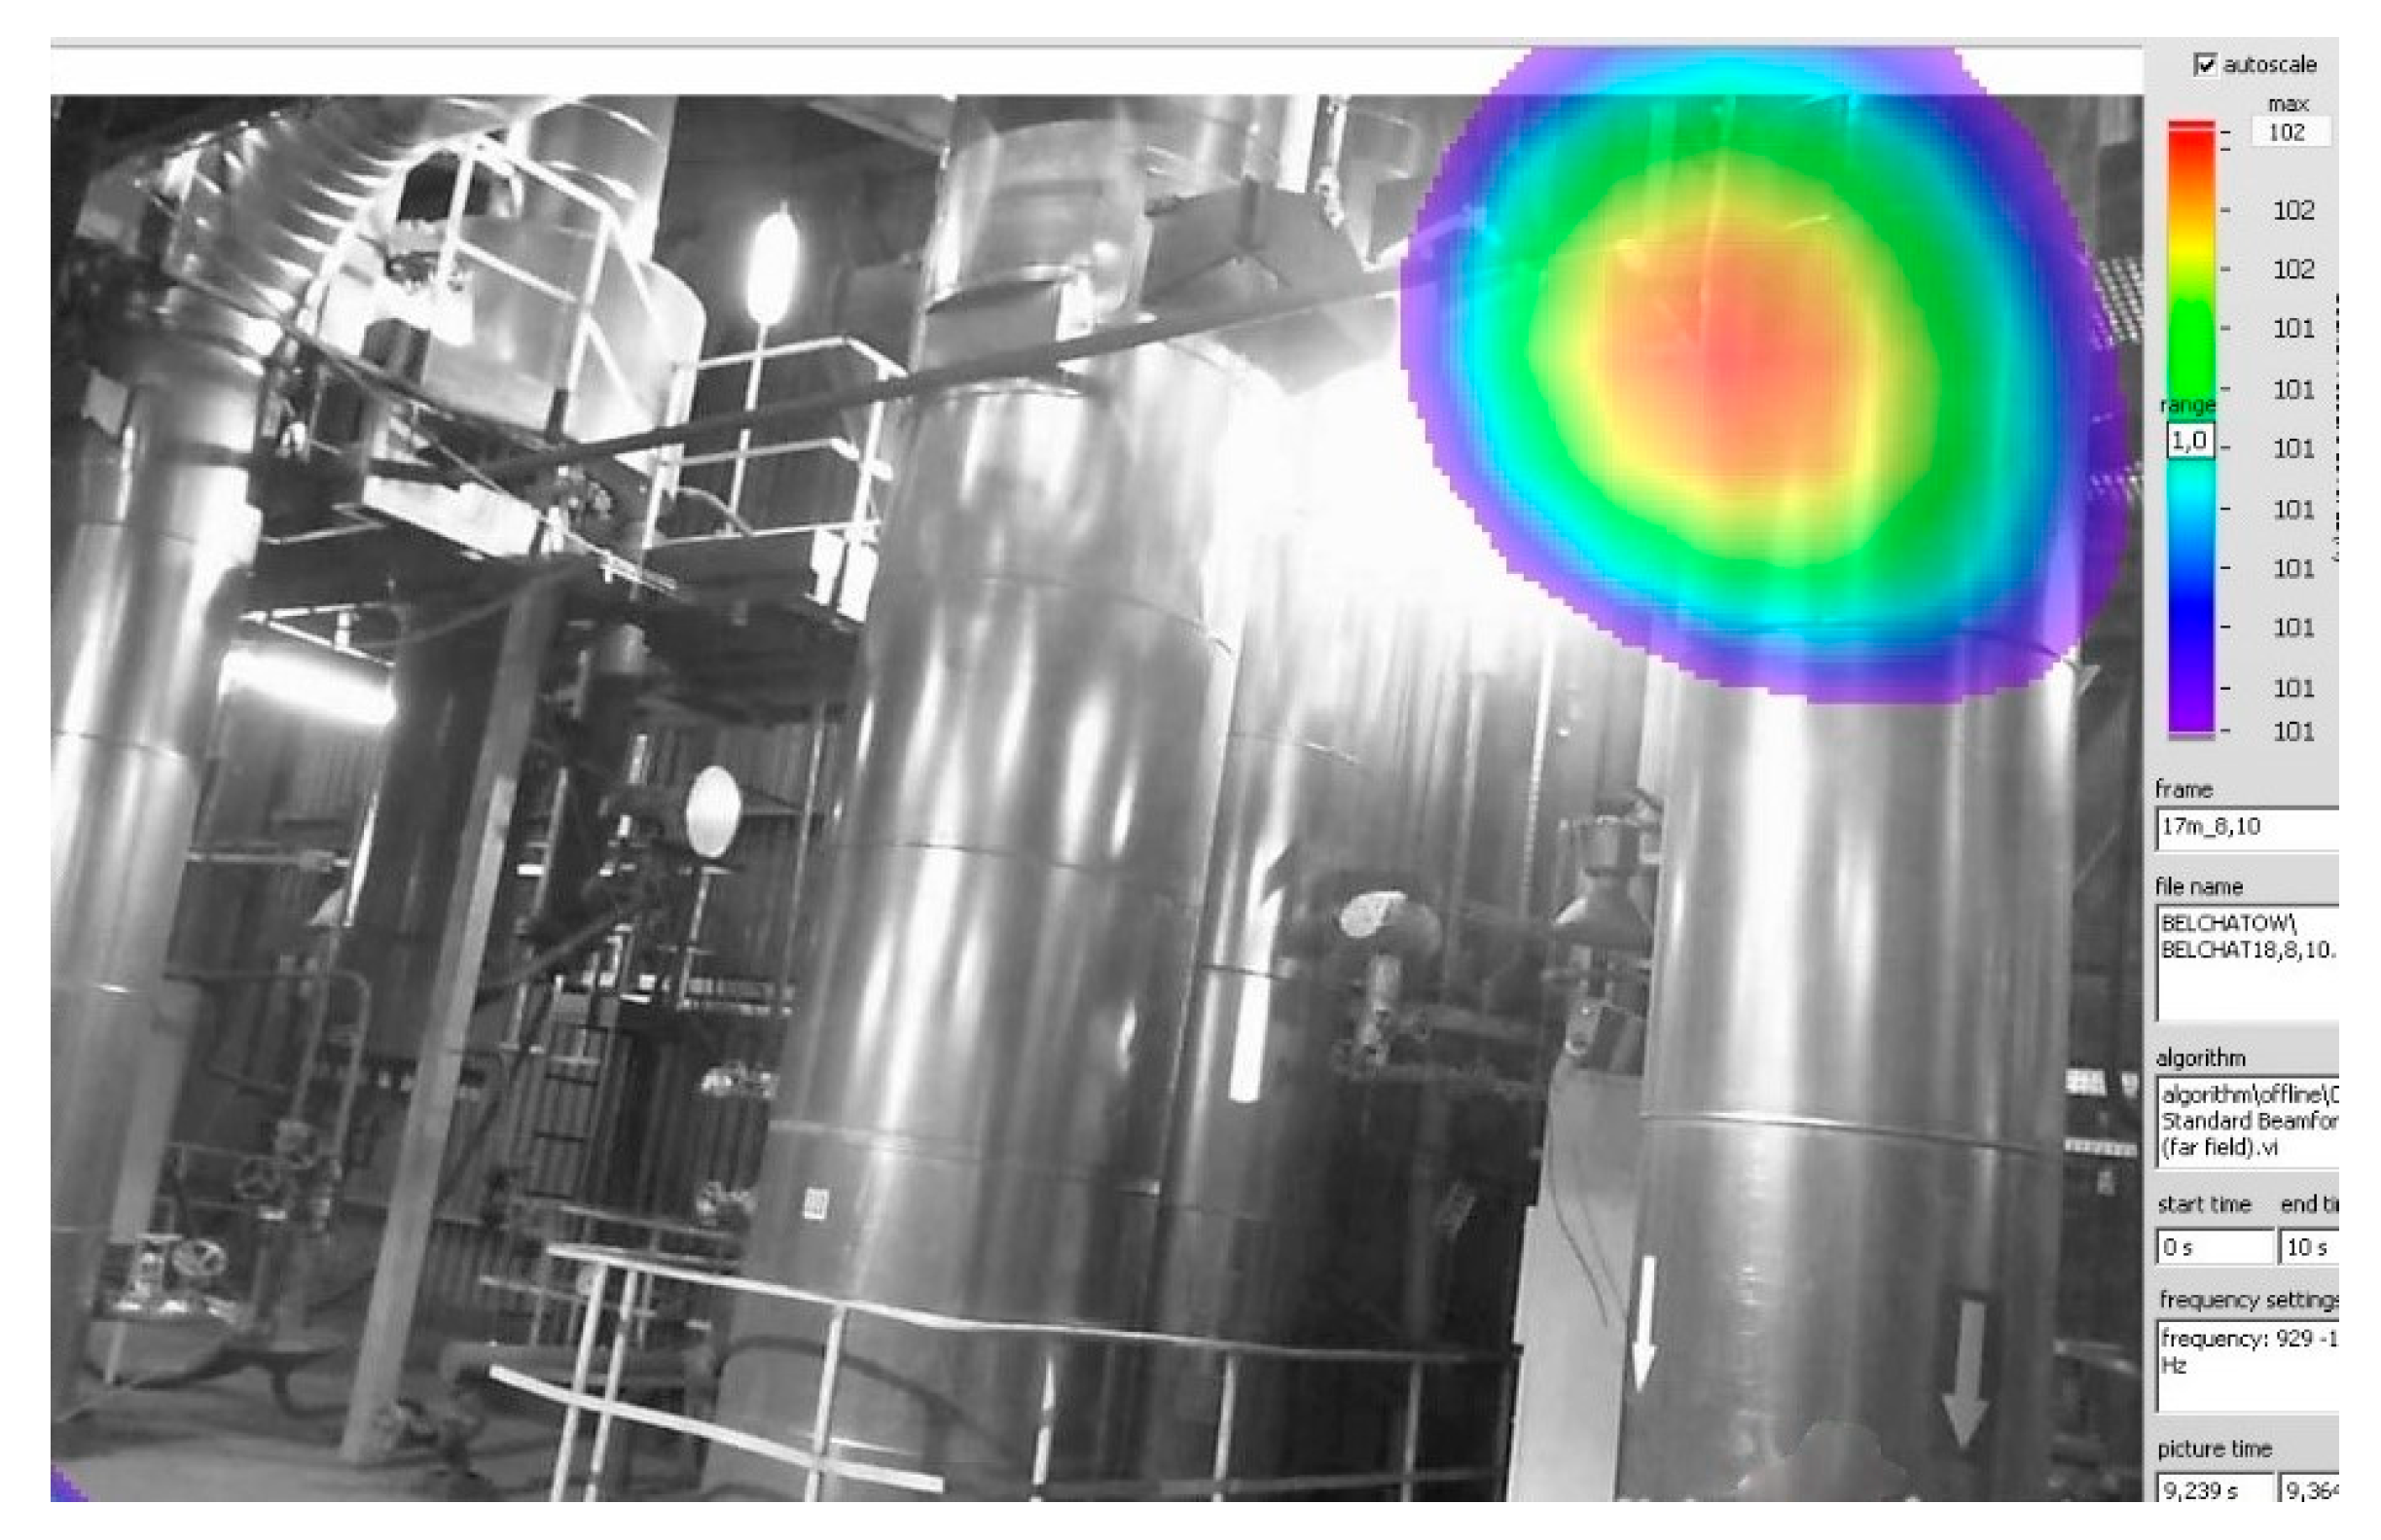
5. Measurement of the Sound Level Using an Acoustic Camera

The analysis of pipelines included the measurement of the sound (noise) level in the live steam pipeline in power unit A using an acoustic camera array with 40 microphones (CAE Noise Inspector). The measurement frequency range was aiming to identify the noise source, preliminary observed roughly at the frequency of about 1 kHz. The results of such measurements are illustrated in Figure 12, Figure 13 and Figure 14. The measurements of the sound intensity level taken at the level of 12 m indicate that the sounds in the frequency range of 929 Hz ÷ 1059 Hz originate at higher levels (Figure 12). The bottom portion of the image shows the reflections of sounds located near the microphone. The sound intensity level was approximately 101 dB.
The measurements of the sound intensity taken at the level of 17 m indicate that the sounds in the frequency range of 929 Hz ÷ 1059 Hz originate near the support above the nozzle (Figure 13). The concentration of sound intensity source is slightly away from the supports because the acoustic wave is reflected from the surrounding elements. The level of sound intensity on the support was approximately 102 dB, whereas on the pipeline, at a distance of approximately 2.4 m from the support, it was 10 dB lower.
The measurements of the sound intensity level taken at the level of 36 m indicate that the sounds in the frequency range of 929 Hz ÷ 1059 Hz originate at higher levels, where individual branches of the pipeline are located (Figure 14). The sound intensity level there was approximately 107 dB.
The performed measurements of sound intensity for the live steam pipeline indicate that only at the level of 17 m was it possible to precisely locate the sound source. The level of noise generated by the support located above the nozzle in the analyzed frequency range was thus significantly lower than the level of noise produced by the surrounding elements. In the case of levels 12 m and 36 m, the sound intensity of the environment and a series of reflections from surrounding elements made it only possible to approximate the location of the sound source.

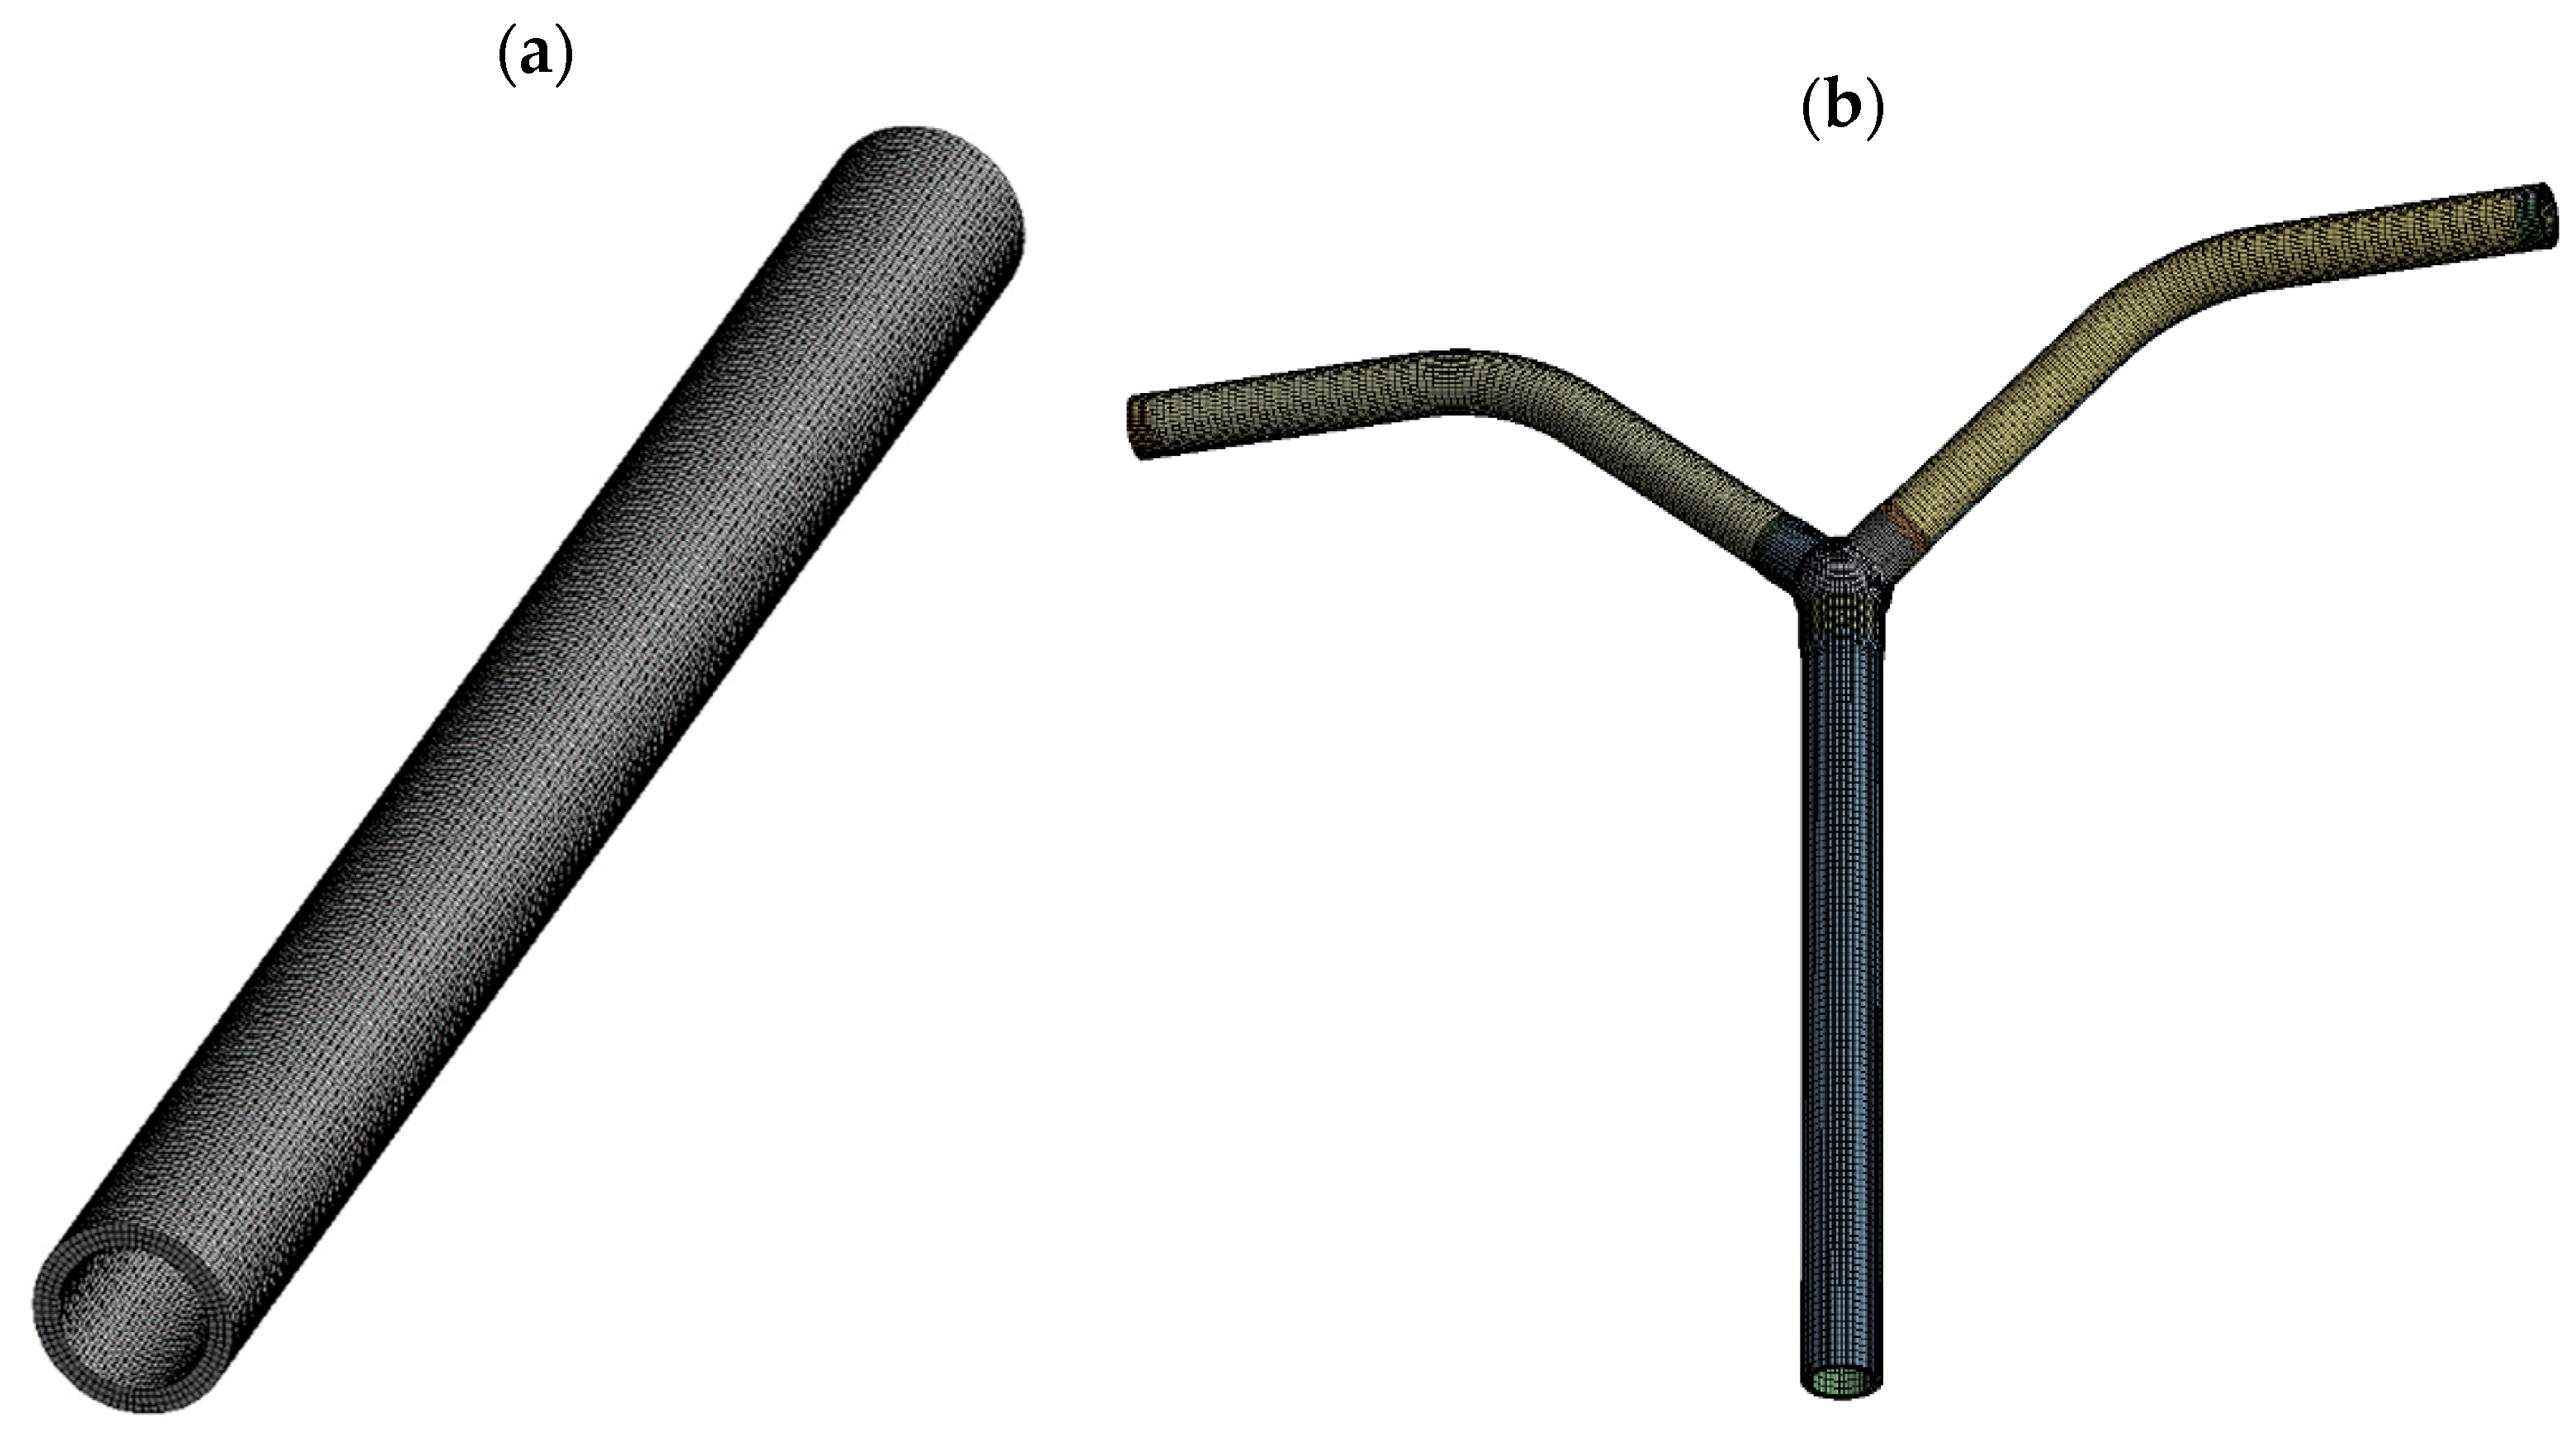
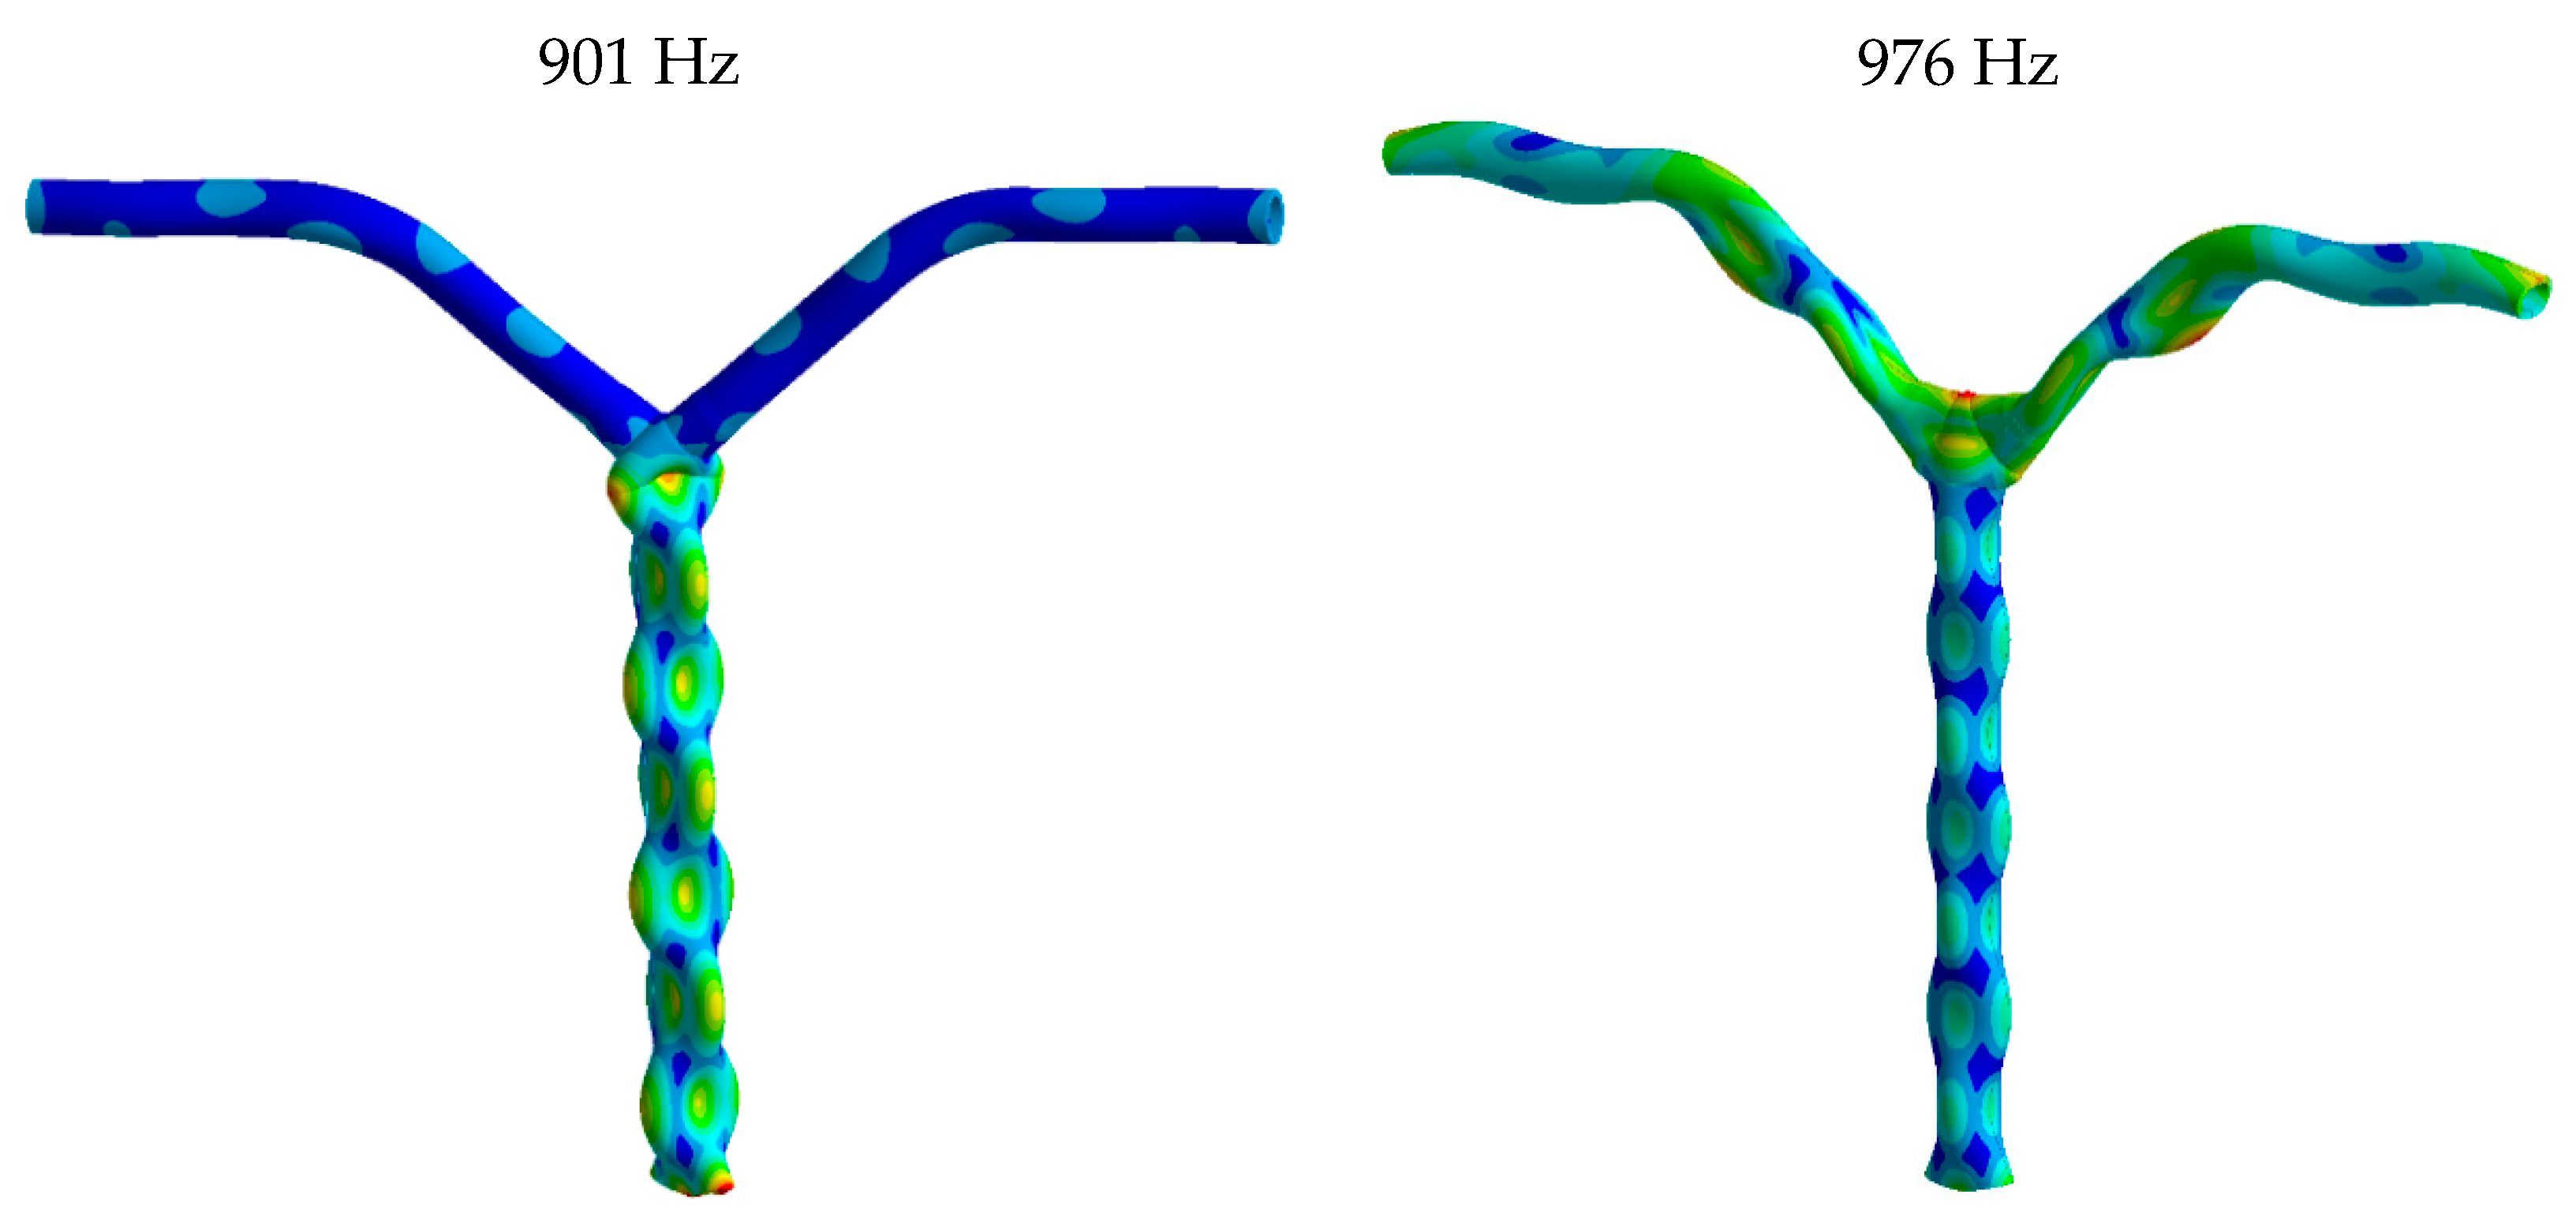
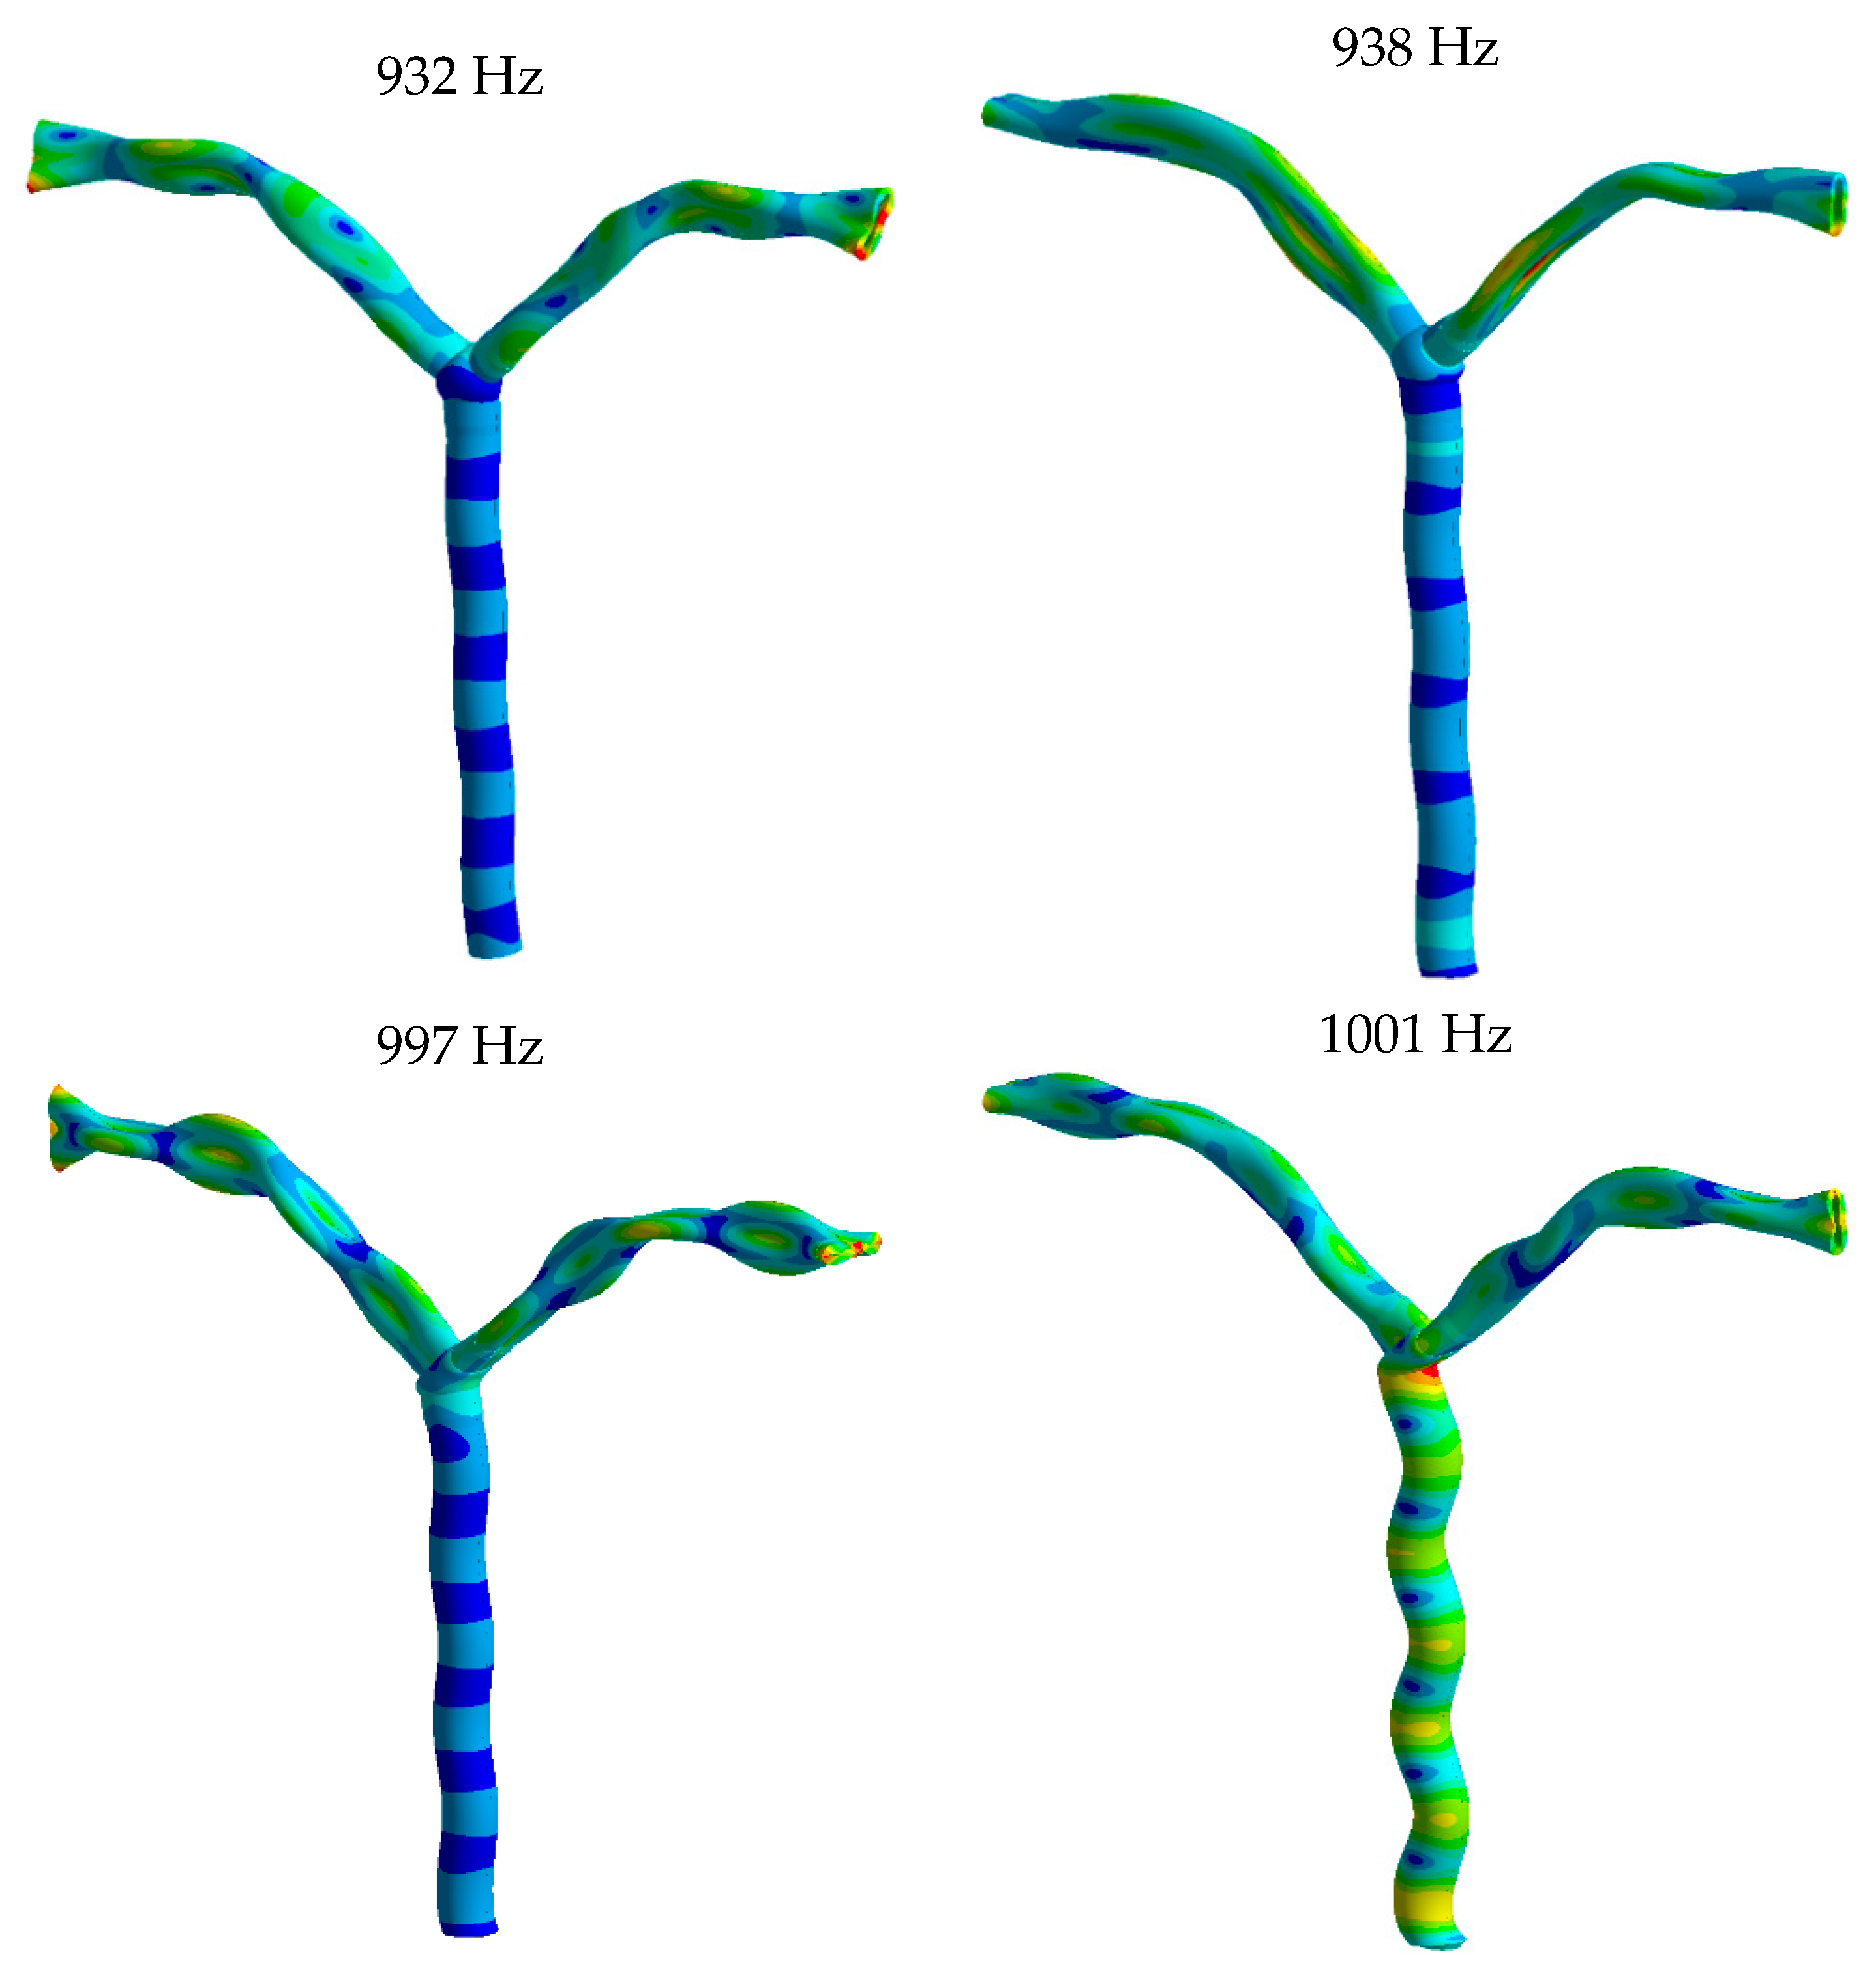
6. Numerical Analysis of Vibrations of the Live Steam Pipelines

A numerical modal analysis was performed using the finite element method [9] in order to identify the frequency and mode shape in the frequency range above 900 Hz. This range is significant because of the potential excessive noise. FEM calculations were performed on [10] geometrical models of straight pipeline spans for pipes with the following dimensions: Ø508 mm × 55 mm, Ø406.4 m × 50 mm, and Ø355.6 mm × 40 mm, as well as on models of pipeline spans near the spherical Y-pipes. Due to the fact that these are thick-walled elements, their discrete models were created with division into solid elements [4], which are shown in Figure 15.
The modal analysis includes both the thermal loads and mechanical loads in the form of a temperature and pressure field generated by the flowing live steam. Calculations were performed using the commercial code of ANSYS Workbench 13.0 for two operating states of the power unit. The first was the nominal power state, whereas the second was related to the operating parameters of the unit on the date of measurement. The parameters of the live steam for individual cases of analysis are presented in Table 2.
Figure 16 shows examples of the modal analysis results of FEM calculations for [1] a span of the live steam pipeline in power unit A for the natural vibrations frequency range of 900–1001 Hz in the pipeline’s nominal operating state.
The modal analysis of a span of the live steam pipeline in power unit A near the top Y-pipe indicates that the circular mode shape of natural vibrations of the pipes connected to the Y-pipe may occur for the following frequencies: 901, 976, and 995 Hz (Figure 16). Another form of normal modes is flexural vibrations of pipes, which occurred for the following frequencies: 932 Hz, 934 Hz, 938 Hz, 945 Hz, 997 Hz, and 1001 Hz (Figure 17).
FEM numerical calculations were performed for a live steam pipeline near the top Y-pipe and for straight spans of pipes used in units A and B [2,11,12]. Due to the influence of operating parameters, i.e., temperature in particular [3,8,13,14,15,16,17,18,19], calculations were performed for the nominal operating state and for the current operating state on the date of measurements. Table 3 presents a comparison of vibration frequencies for corresponding mode shapes.
The comparison in Table 3 between results for unit A and unit B shows that the frequency of vibrations during operation on the date of measurements is approximately 3 ÷ 7 Hz higher than the values during nominal state of the unit. The corresponding mode shapes for unit B occur at substantially higher frequencies, i.e., 26 ÷ 49 Hz higher in comparison with those for the vibrations for unit A.
An analysis of the vibration frequencies in straight pipe segments (Table 4) for corresponding mode shapes shows that the vibration frequencies of the Ø406.4 × 50 mm pipe are lower than the vibration frequencies of the Ø355.6 × 40 mm pipe by 28, 26, 21, 14, and 6 Hz for subsequent mode shapes. In this frequency range, the Ø508 × 55 pipe has only one circular mode shape and one flexural mode shape.

7. Summary and Conclusions

Based on the performed tests and numerical FEM calculations for the live steam pipeline in one of the power units, it can be stated that the likely cause of the phenomenon of high-frequency vibrations, which generates the maximum noise of 101–107 dB, is as follows:
-
A change in the geometry of the pipeline elements resulted in a change in the parameters of the broadband noise generated in one of those elements.
-
Parameters of acoustic transmission were on the border of effective sound transmission, and as a result of the change, the effective frequency of transmission (957 Hz) overlapped with the range of generated noise. The results include an effective reinforcement of lateral vibrations of the steam column, pipe resonance, and effective transmission of sound into the environment.
-
Vibrations are probably generated in the vertical segment near the nozzle and probe. They are propagated effectively for both Y-pipes. Further propagation in steam is very difficult; this frequency is strongly dampened, but vibrations may propagate in the pipe material and above the vertical segment due to the fact that the value of natural frequencies in all these pipes is approximately 957 Hz. As the distance from the 508 mm × 55 mm pipe increases, the vibration waves in the pipe material disperse, and the level of noise decreases [10,13,14,20,21].
Based on the analysis of the live steam pipeline, the potential source of noise might be one of the following four elements, listed according to decreasing probability of vibration generation:
-
The nozzle located near the level of 17 m and the probe located near the nozzle;
-
The Y-pipe at the level of 42 m;
-
Steam valves located in pipeline branches above the top Y-pipe;
-
The Y-pipe at the level of 9 m.
The maximum amplitudes of pipe vibration were recorded at the level of 17 m. At the same level, the sonometer recorded the maximum level of noise. Measurements with an acoustic camera also point to the source of noise being above the level of 12 m. This indicates that the nozzle or probe are the most probable source of noise. The frequencies generated on the probe located near the nozzles, calculated for the full range of Strouhal numbers, ranged from 372 Hz to 872 Hz. This does not mean that it could not generate vibrations with a frequency of 957 Hz. It is sufficient that the 957 Hz frequency is a multiple of the whirl generation frequency. Moreover, in reality, the nozzle does not generate a single frequency but a certain range of frequencies, which increases the possibility of exciting vibrations. It is proposed to exchange the nozzle for an identical one to the nozzle in power unit B.
Another potential source is the Y-pipe at the level of 42 m. Its geometry is different in comparison to unit B, which could cause a different band of noise generation through whirls. A change in the diameter of the pipes from Ø355.6 × 40 mm to Ø406.4 × 50 mm substantially changed the character of steam flow through the Y-pipe. In the case of the solution with two Ø355.6 × 40 mm pipes entering the Y-pipe, the sum of the sections of both these pipes (A = 119.310 mm2) was approximately equal to the section of the vertical pipe (A = 118.237 mm2), whereas in the new solution, the sum of sections of pipes entering the Y-pipe was equal to A = 147.468 mm2, which is approximately 25% larger than the section of the (vertical) exit pipe. Therefore, the flow speed in the vertical pipe increases, and surges occur in the Y-pipe.
What makes the top Y-pipe an unlikely source of vibration is the lower levels of noise and measured vibrations of the pipe wall in the top span of the vertical 508 mm pipeline.
Additionally, the steam valves were mounted in a piping span whose diameter was reduced from 406 mm to 355 mm. This could potentially cause noise-generating whirls, but the level of noise measured near the valves was significantly lower than that in the lower span of the vertical 508 mm pipe. An experiment involving the closing of the steam valves, which substantially changed the character of flows in the top Y-pipe, did not prove any correlation between these flows and the level of vibrations. Therefore, it is unlikely that the noise is a result of changes in the diameter of the pipeline before and after the steam valves.
To explicitly identify the causes of harmful noise generation in unit A, it would be necessary to perform a full analysis of the flow of the live steam through the pipeline, examine the method of mounting and the superstructure of the power unit, and measure the vibrations on exposed elements of the live steam pipeline in unit A, which could be compared with the same spans in the live steam pipeline of unit B. It would be recommended to continuously measure the noise during power changes in the power unit, at particular points of the pipeline in both the control unit and unit A. Additionally, a numerical simulation should be performed to reconstruct the flow of the medium as well as the phenomenon of acoustic resonance for the geometry of power units A and B near levels of 17 m and 36 m. Numerical simulation should also be applied to determine the scope of alterations in the geometry that are required to eliminate the acoustic resonance. Coupled simulations combining fluid structure interactions or structural-born noise might be necessary.

Author Contributions

Software, M.P.; Validation, P.M.; Investigation, D.P., J.C., A.I., P.M. and M.P.; Resources, P.M.; Data curation, A.G.; Writing—original draft, A.I.; Writing—review & editing, D.P. and A.G.; Project administration, J.C. All authors have read and agreed to the published version of the manuscript.

Funding

This research received no external funding.

Institutional Review Board Statement

Not applicable.

Informed Consent Statement

Not applicable.

Data Availability Statement

The original contributions presented in this study are included in the article. Further inquiries can be directed to the corresponding author.

Conflicts of Interest

The authors declare no conflict of interest.

References

  1. Engel, Z.; Engel, J.; Kosała, K. Procesy Wibroakustyczne Źródła, Badania, Analiza; WIMiR AGH: Kraków, Poland, 2009. [Google Scholar]
  2. Engel, Z. Ochrona Środowiska Przed Drganiami i Hałasem, Wydanie Drugie Poprawione i Uaktualnione; Wydawnictwo Naukowe PWN: Warszawa, Poland, 2001. [Google Scholar]
  3. Engel, Z.; Piechowicz, J.; Stryczniewicz, L. Podstawy Wibroakustyki Przemysłowej; Uczelniane Wydawnictwa Naukowo-Dydaktyczne AGH: Kraków, Poland, 2003. [Google Scholar]
  4. Shin, Y.S.; Wambsganss, M.W. Flow-induced vibration in LMFBR steam generators: A state-of-the-art review. Nucl. Eng. Des. 1977, 40, 235–284. [Google Scholar] [CrossRef]
  5. Bosnjak, S.M.; Zrnic, N.D. Dynamics, failures, redesigning and environmentally friendly technologies in surface mining systems. Arch. Civ. Mech. Eng. 2012, 12, 348–359. [Google Scholar] [CrossRef]
  6. Weber, F.; Maślanka, M. Frequency and damping adaptation of a TMD with controlled MR damper. Smart Mater. Struct. 2012, 21, 055011. [Google Scholar] [CrossRef]
  7. Fusaro, G.; Billi, R.; D’orazio, D. Multiphysical design for optimised ventilation and noise attenuation in ducts: An approach using metamaterials. In Proceedings of the INTER-NOISE24, Nantes, France, 25–29 August 2024; pp. 8163–8171. [Google Scholar]
  8. Wójs, K.; Szulc, P.; Tietze, T.; Sitka, A. Concept of a system for waste heat recovery from flue gases in a coal-fired power plant. J. Energy Sci. 2010, 1, 171–178. [Google Scholar]
  9. Zienkiewicz, O.C.; Taylor, R.L. The Finite Element Method, 4th ed.; McGRAW-HILL Book Company: New York, NY, USA, 1991; Volumes 1–2. [Google Scholar]
  10. Rusiński, E.; Czmochowski, J.; Górski, A.; Iluk, A.; Moczko, P.; Paduchowicz, M.; Pietrusiak, D. Pomiary i Analiza Nadmiernego Hałasu Oraz Drgań Rurociągu Pary Świeżej Bloków 7 i 8 w Elektrowni Bełchatów; Raport Nr 33/2013; PWr: Wrocław, Poland, 2013. [Google Scholar]
  11. Czmochowski, J.; Górski, A.; Paduchowicz, M.; Rusiński, E. Diagnostic method of measuring hanger rods tension forces in the suspension of the power boilers combustion chamber. J. Vibroengineering 2012, 14, 151–156. [Google Scholar]
  12. Dobrociński, S. Modelowanie Zagadnień Obliczania Naprężeń Cieplnych; WNT: Warszawa, Poland, 2000. [Google Scholar]
  13. Kostowski, E. Promieniowanie Cieplne; Wyd. Naukowe PWN: Warszawa, Poland, 1993. [Google Scholar]
  14. Kostowski, E. Przepływ Ciepła; Wydawnictwo Politechniki Śląskiej: Gliwice, Poland, 2000. [Google Scholar]
  15. Jabłoński, M.; Ozga, A. Distribution of Random Pulses Acting on a Vibrating System as a Function of Its Motion; AGH University of Science and Technology Press: Kraków, Poland, 2013; ISBN 978-83-7464-660-4. [Google Scholar]
  16. Maślanka, M.; Sapiński, B.; Snamina, J. Experimental study of vibration control of a cable with an attached MR damper. J. Theor. Appl. Mech. 2007, 45, 893–917. [Google Scholar]
  17. Taller, J. (Ed.) Procesy Cieplne i Przepływowe w Dużych Kotłach Energetycznych. Modelowanie i Monitoring; Wydawnictwo Naukowe PWN: Warszawa, Poland, 2011. [Google Scholar]
  18. Yoshihiro, O.; Yoshinobu, T. Three-dimesional transient thermall stresses of functionally graded rectangular plate due to partial heating. J. Therm. Stress. 1999, 22, 35–55. [Google Scholar]
  19. Ocampo Ramirez, A.; Hernández Gómez, L.H.; Núñez Carrera, A.; Armenta Molina, A.; Fernández Valdés, D.; Escalona Cambray, F.; Guzmán Escalona, M.A. Evaluation of the Acoustic Noise Inside the Main Steam Line of a BWR/5 Nuclear Reactor. Appl. Sci. 2025, 15, 3974. [Google Scholar] [CrossRef]
  20. Jabłoński, M.; Ozga, A. Determining the distribution of values of stochastic impulses acting on a discrete system in relation to their intensity. Acta Phys. Pol. A 2012, 121, A-174–A-178. [Google Scholar] [CrossRef]
  21. Smolnicki, T.; Stańco, M.; Pietrusiak, D. Distribution of loads in the large size bearing—Problems of identification. Teh. Vjesn.—Tech. Gaz. 2013, 20, 831–836. [Google Scholar]
Figure 1. General view of the power plant.
Applsci 15 06925 g001
Figure 2. A schematic diagram of the power-generating unit.
Applsci 15 06925 g002
Figure 3. Live steam pipeline above the upper Y-pipe, right branch.
Applsci 15 06925 g003
Figure 4. Live steam pipeline from the turbine to the upper Y-pipe.
Applsci 15 06925 g004
Figure 5. Holes in the insulation for measuring pipeline vibrations.
Applsci 15 06925 g005
Figure 6. The laser vibrometer system during vibration measurements.
Applsci 15 06925 g006
Figure 7. Labeling of measurement points at the level of 17 m.
Applsci 15 06925 g007
Figure 8. Amplitude–frequency plot at the level of 12 m: (a) power unit A, (b) power unit B.
Applsci 15 06925 g008aApplsci 15 06925 g008b
Figure 9. Pipeline vibration measurements at the level of 17 m, unit A.
Applsci 15 06925 g009
Figure 10. Pipeline vibration measurements in the horizontal axis of the support pin at the level of 17 m, unit A.
Applsci 15 06925 g010
Figure 11. Pipeline vibration measurements in the second point at the level of 12 m, unit A.
Applsci 15 06925 g011
Figure 12. Results of measurements of sound intensity for the frequency range 929 ÷ 1059 Hz at the level of 12 m at a distance of 7.39 m from the sound source.
Applsci 15 06925 g012
Figure 13. Results of measurements of sound intensity for the frequency range 929 ÷ 1059 Hz at the level of 17 m at a distance of 8.1 m from the sound source.
Applsci 15 06925 g013
Figure 14. Results of measurements of sound intensity for the frequency range 929 Hz ÷ 1059 Hz at the level of 36 m at a distance of 11.48 m from the sound source.
Applsci 15 06925 g014
Figure 15. Discrete model of a span of the live steam pipeline: (a) piping span with dimensions of Ø406.4 × 50; (b) spherical Y-pipe with piping spans.
Applsci 15 06925 g015
Figure 16. Examples of the circular mode shape of natural vibrations in a span of the live steam pipeline in power unit A near the top Y-pipe.
Applsci 15 06925 g016
Figure 17. Examples of flexural mode shape of natural vibrations in a span of the live steam pipeline in power unit A near the top Y-pipe.
Applsci 15 06925 g017
Table 1. The RMS values of vibration velocity in mm/s.
Measurement PointVRMS
[mm/s]
Level of 12 munitAB
1 4.613.70
2 6.492.82
3 4.253.17
4 8.262.85
5 4.30-
Level of 17 munitA
1 8.18
2 9.15
3 3.91
4 10.92
5 7.76
Level of 36 munitA
1 4.60
2 6.84
3 3.99
4 5.66
5 5.65
A—unit which generates high vibrations of the live steam pipeline; B—control unit, with low vibrations.
Table 2. Values of live steam parameters included in the numerical analysis.
Values of Live Steam ParametersNominal Operating
State
Operating State on 2013-06-07
A UnitTemperature [°C]575555.6
Pressure [MPa]19.618.7
B UnitTemperature [°C]575Applsci 15 06925 i001
Pressure [MPa]19.6Applsci 15 06925 i001
Table 3. Comparison of vibration frequencies for corresponding mode shapes near the top Y-pipe.
No.Nominal State—Unit AMeasurement—Unit ANominal State—Unit B
HzHzHz
1901905927
2934941962
3936943995
4950957
5974981
69991002
Table 4. Comparison of vibration frequencies in straight pipe spans.
No.Description of Mode ShapeØ355.6 × 40Ø406.4 × 50Ø508 × 55
HzHzHz
1flexural
5 half waves
905
2circular
1 half wave
948920636
3circular
2 half waves
954928645
4circular
3 half waves
963942663
5circular
4 half waves
980966697
6circular
5 half waves
10091003753
7circular
6 half waves
833
8circular
7 half waves
935
9flexural
6 half waves
998
Disclaimer/Publisher’s Note: The statements, opinions and data contained in all publications are solely those of the individual author(s) and contributor(s) and not of MDPI and/or the editor(s). MDPI and/or the editor(s) disclaim responsibility for any injury to people or property resulting from any ideas, methods, instructions or products referred to in the content.

