1. Introduction
Accurate color reproduction on mobile device displays is a highly relevant and important area for online commerce. Since the iPhone was launched in 2007, smartphones and tablets have fueled rapid growth in online shopping, now predominantly performed both through web browsers and apps. For e-commerce—for example, fashion and interior design—it is crucial to display colors as accurately as possible in order to improve customer satisfaction and reduce the percentage of customers returning products due to different colors than expected during purchasing. Efforts are currently focused on enhancing both device-dependent and device-independent color reproduction models to reduce color discrepancies between electronic images as represented on a display and the actual products [
1].
On the one hand, it may not be sufficient to rely on a color space like sRGB [
2], as it was originally developed to meet the chromatic specifications of now-obsolete cathode-ray tube monitors. For example,
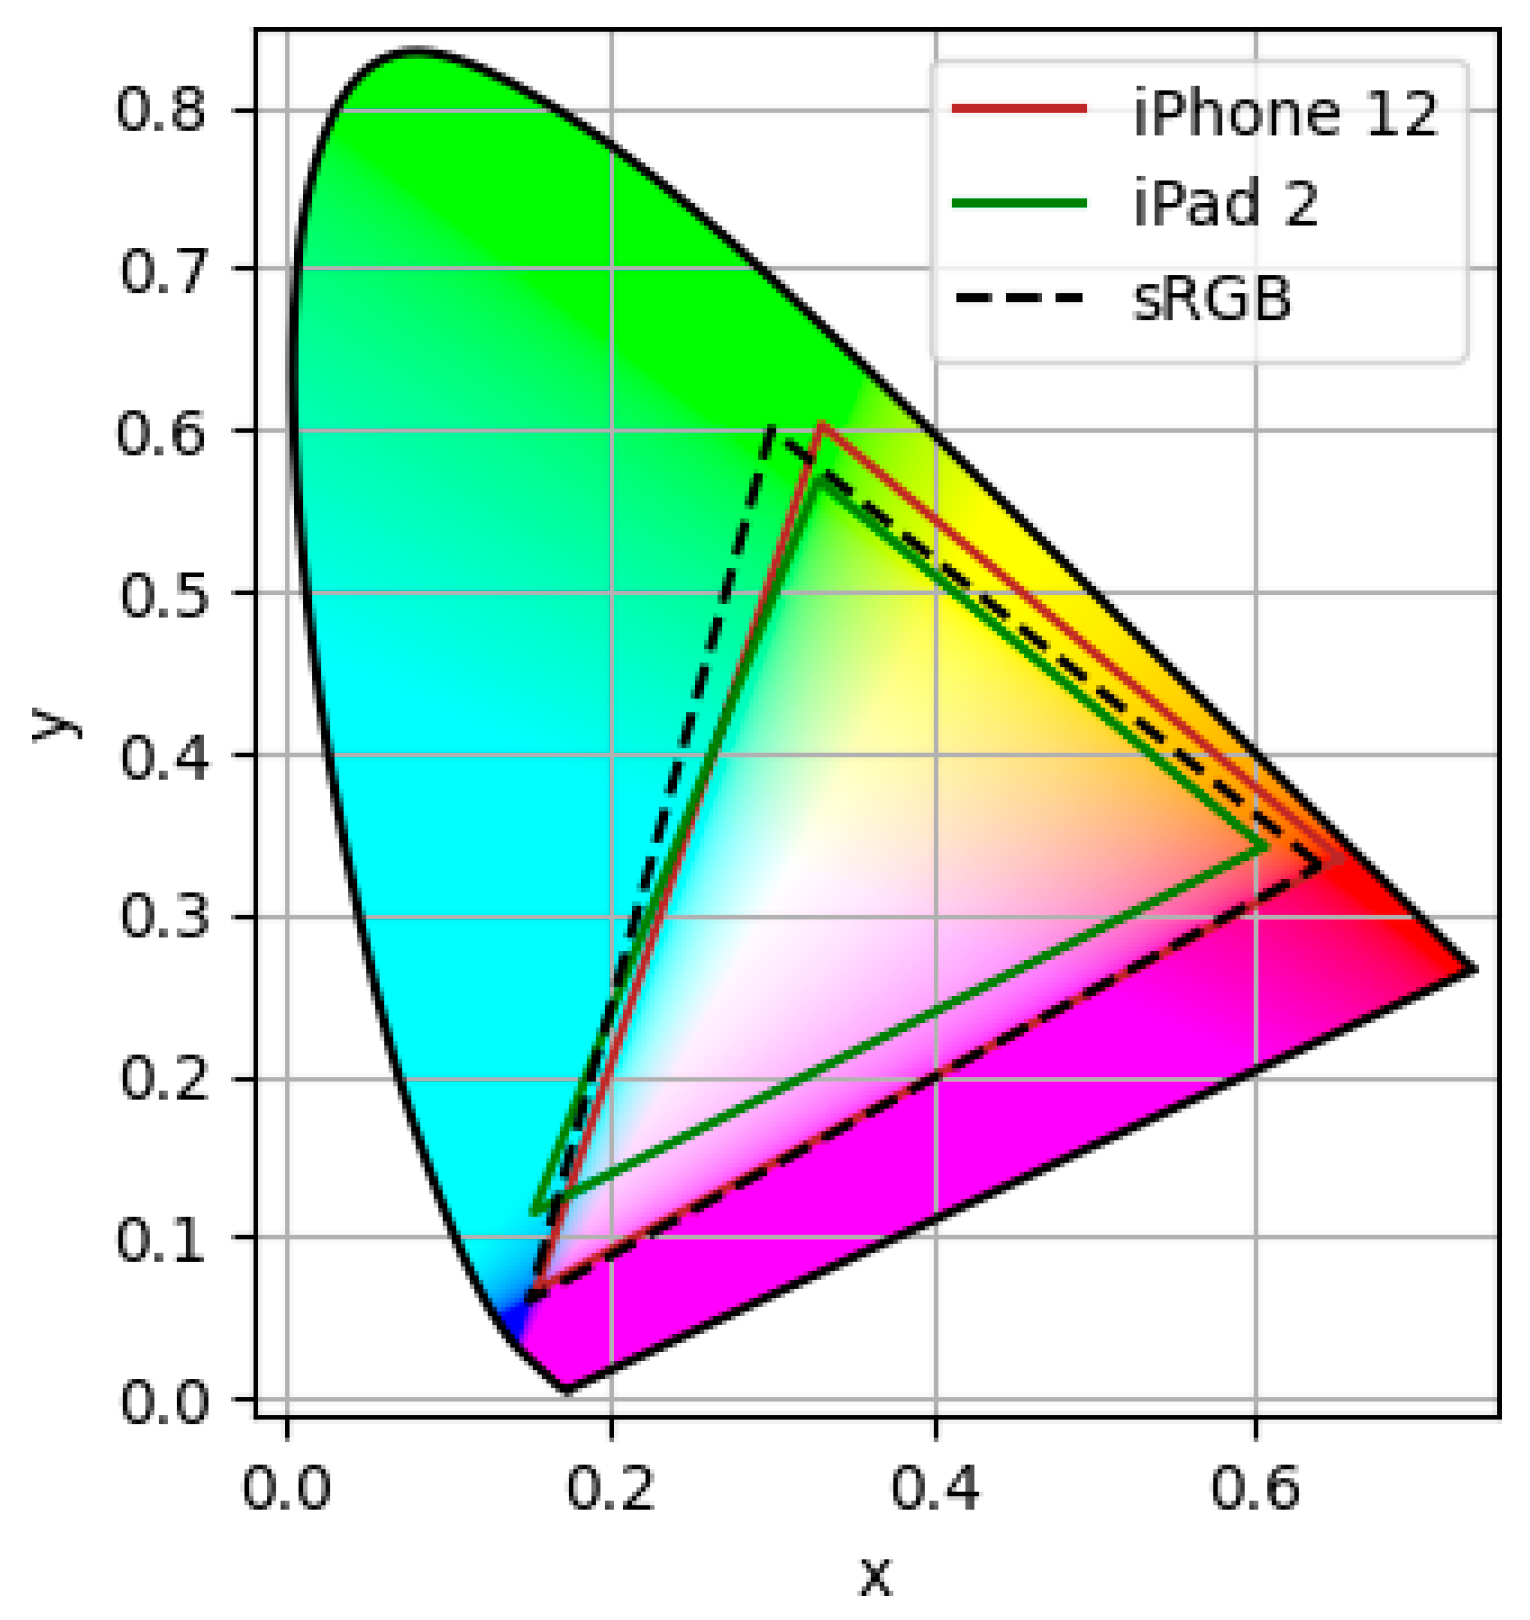
Figure 1 illustrates the color gamuts of two displays used in this study, one based on LCD technology and the other on OLED. As shown, their gamuts differ not only from each other but also from the standard sRGB gamut. This highlights the importance of developing new approaches for color rendering in modern display technologies.
On the other hand, if the display is part of a mobile device, ambient lighting conditions also need to be considered for improving color reproduction accuracy. Mobile displays are typically used under a wide variety of ambient lighting conditions [
3]. Even for indoor office applications, illuminance levels may vary considerably, with typical values between 500 and 2000 lx [
4]. The optimal color representation on a display is highly affected by the level of ambient lighting. Changes in ambient illumination can alter the viewer’s perception.
In addition, when referring to displayed colors, the spectral power distribution (SPD) of the display’s light source significantly impacts color rendering. The type of display technology also affects how colors are perceived. Moreover, color perception is inherently subjective and context-dependent, influenced by factors such as surrounding colors, observer adaptation, and individual differences in visual sensitivity.
Due to this subjectivity and the many variables involved in color perception, it becomes essential to understand the visual response to rendered samples through properly collected data obtained from well-designed and validated psychophysical experiments.
Different display calibration methods are commercially available. However, most users do not have the time or expertise to use those solutions. They can be grouped into three main categories: LUT-based models, numerical models, and physical models [
5,
6,
7,
8,
9]. LUT-based models use dense measurements and interpolation to map RGB values to a colorimetric space (e.g., XYZ). They are highly accurate and handle RGB channel interdependence well but require large datasets and are resource-intensive. Numerical models aim to approximate the RGB-to-colorimetric mapping using algorithms such as polynomial regression or neural networks. Polynomial models are simple and computationally efficient, but struggle with complex or non-linear device behaviors. Neural networks, by contrast, can model highly non-linear relationships and adapt to complex displays, though they require large datasets, are computationally expensive to train, and lack interpretability. Physical models are based on device physics, typically involving an electro-optical transfer function and a 3 × 3 matrix based on primary chromaticities. These models are interpretable and require fewer measurements.
The MDCIM (Mobile Display Characterization and Illumination Model) by Kirchner et al. [
10] is a physical model that takes the following two aspects into account: (i) a device-specific display characterization model and (ii) a method to account for ambient illuminance. It is based on objective measurement data from spectroradiometers (to characterize a particular display), spectrophotometers (for determining the reflectance properties of the objects that need to be displayed), and illuminance meters (for measuring the environmental illumination level). It improves color reproduction accuracy by considering the specific characteristics for a range of mobile displays from the Apple iPad Air 2, iPad 2017, and iPad 2018, as well as for the Samsung Galaxy S4 and iPhone XS Max [
10,
11,
12,
13]. The first three displays represent LCD display technology, whereas the others are OLED displays. Good results were obtained for illuminance levels from 600 to 2000 lx.
There are now modern display technologies such as virtual reality systems, lithium niobate crystal displays, and high dynamic range screens [
14,
15,
16,
17], which exhibit characteristics that differ significantly and offer a different color gamut than CRTs [
18]. This evolution further highlights the need to develop a new colorimetric characterization model that can be effectively applied to these emerging technologies. In this study, we focused on the most commonly used displays, namely tablets and smartphones, with predominantly LCD and OLED displays.
The sRGB color space, originally designed for cathode-ray tube displays, may be considered limited for modern applications, as it does not encompass the full color gamut of modern LCD and OLED displays. Additionally, the sRGB encoding does not account for variations in ambient illumination when computing the digital values necessary for color reproduction, which can lead to mismatches under real-world viewing conditions. This limitation reduces its ability to accurately represent colors on contemporary devices. Research has consistently shown that the MDCIM overcomes the shortcomings of sRGB by accounting for both ambient lighting conditions and the specific characteristics of individual devices. However, a significant drawback of MDCIM is its dependence on device-specific characterization, which requires costly specialized equipment and a time-consuming process.
This study aims to explore the differences and similarities among 11 devices characterized with the MDCIM and evaluate the feasibility of using generic parameters for different types of screens. To achieve this, this article focuses on a specific display, the iPhone XS Max.
2. Materials and Methods
2.1. The MDCIM
In order to apply the MDCIM [
10], color measurements on physical samples must be taken [
19]. These require a spectrophotometer, resulting in measurements of the reflectance spectral distribution, from which the tristimulus values
,
, and
can be derived.
To calculate the digital
,
, and
values for the red, green, and blue color channels in an image that best represents the color of a physical sample, the tristimulus values are converted to normalized luminance values (each scaled between 0 and 1) for each of the three channels. The standard device-independent color space, sRGB, is based on the Gain-Offset-Gamma model (GOG model) by Berns et al. [
20,
21]. This model linearly relates tristimulus values
,
, and
to luminance values
,
, and
of the red, green, and blue channels of a display:
The GOG model assumes a primarily exponential relationship between these normalized luminances and the digital values of each channel. In the MDCIM, an initial linear section is also considered for low digital values:
These three functions are called Tone Rendering Curves (TRCs) or electro-optical transfer functions. For displays with 3 × 8-bit color representation, the digital values
,
, and
are equal to the
,
, and
values that range from 0 to 255, divided by
. The parameter
represents the exponent of each curve, while
and
refer to the gain and offset of the curve, respectively. Additionally,
is the slope of the linear segment, which applies to lower luminance values at the threshold
.
In sRGB space, it is assumed that the matrix
in Equation (1) is given by the following expression [
22]:
For sRGB, it is also assumed that for all three color channels, the parameters gamma
, gain
, offset
, linear coefficient
and threshold
. The threshold parameter
and linear coefficient
can be obtained from purely mathematical and pragmatic arguments [
10,
12].
Furthermore, the elements of matrix
as appearing in Equation (1) are related to the values of the CIE 1931 chromaticity coordinates
and maximum luminance
of the 3 channels [
23,
24]:
Therefore, in Equation (3) the values of the elements for the matrix
for the sRGB color space correspond to particular values for display specifications. These are shown in
Table 1 and agree with the values for high-definition television as defined already in 1991 by the Comité Consultatif International pour la Radio (now replaced by the International Telecommunication Union) in recommendation BT.709 [
25]. It should be acknowledged that in the display specifications, as tacitly assumed when using sRGB space, the total display luminance (
) when displaying a white image is scaled to 100 according to the values shown in
Table 1.
The value of 2.4 for the
parameter in sRGB encoding color space is inherited from parametrizations from CRT displays before 1998, and also partly based on an optimization for a reference ambient illuminance level of 64 lx [
22,
26]. The international standard that specifies sRGB color space remarks that the typical office viewing environment has an ambient illuminance level of 350 lx, considerably exceeding 64 lx [
22]. But mobile displays are typically viewed under much higher illuminance than either of these two values. This is why the International Color Consortium recommends using different values for
in the case of situations that differ from the reference viewing environment [
27].
Furthermore, modern mobile displays have colorimetric specifications that differ significantly from those listed in
Table 1 for sRGB, as this color space was originally designed for CRT displays. However, today’s mobile and tablet displays, despite device-specific characterization proposed by the MDCIM and other models [
28,
29], have proven to significantly enhance color reproduction accuracy; the need to individually characterize each device poses a challenge for practical implementation.
Additionally, the MDCIM takes ambient lighting into account for color reproduction. The CIECAM02 model has been applied to account for ambient illuminance in mobile displays [
30,
31], but studies indicate it lacks precision under varied lighting and leaves room for accuracy improvements, even after refinement [
32].
Therefore, the MDCIM adopts an alternative approach to account for ambient illuminance. As previously mentioned, the MDCIM uses Equation (4) to determine display-specific maximum luminance and chromaticity coordinates. By combining Equations (4) and (1), tristimulus values with a luminance dimension are obtained. To calculate colorimetric parameters such as CIELAB values, the tristimulus values of the reference white must also be expressed in this dimension, which involves multiplication by the luminance
of the reference white:
where
is the luminous existence of reference white, and
is the ambient illumination level in lx [
33]. Equation (5) assumes that the reference white is a Lambertian scatterer, and in what follows, it will also be assumed to have ideal reflectivity
independent of wavelength. The approach of estimating luminance from illuminance based on the assumption of Lambertian distribution follows the definition established by the MDCIM, as referenced in [
10]. We chose to maintain consistency with this reference to ensure comparability.
2.2. Display Characterization
In a completely dark room, luminance and chromaticity coordinate measurements of each device display were taken by positioning the display against the aperture of a CS-2000A spectroradiometer (Konica Minolta), aligned perpendicularly to the display surface. The display was set to its maximum brightness, with automatic brightness adjustment turned off. A series of full-screen images was shown on the display, and for each image, the chromaticity coordinates and luminance were measured. For instance, in order to determine the model parameters of the Tone Rendering Curve of the red channel, images were displayed with and , while varying from 0 to 255 in steps . This provides a comprehensive sampling of the full Tone Rendering Curve.
A total of 11 devices were analyzed, consisting of 6 smartphones and 5 tablets. Of these, 8 were based on LCD and 3 on OLED display technology. For LCD-based displays, even when showing a completely black image, some luminance remains visible due to the backlighting transmission in the LCD, reaching up to
. To correct for this black level, Equation (1) is adjusted as follows [
27]:
Here,
,
, and
represent the tristimulus values for a completely black image. These values are straightforward to calculate, as the measurement setup closely follows the standard procedure for measuring colorimetric characteristics of electronic displays [
34,
35], by measuring the chromaticity coordinates and luminance
,
, and
. The modified Equation (6) compensates for one type of flare caused by light leakage through the LCD when displaying dark colors [
32].
2.3. Psychophysical Experiment
For this study, the iPhone XS Max was utilized, a device previously tested using the MDCIM [
13]. As an Apple product, it stands out as one of the highest-rated brands in the market, it belongs to the most represented brand among the 11 characterized devices, and has an OLED display. The experiment compared the sRGB color space with the MDCIM based on the average parameters from all Apple devices in the sample, referred to as the CAAD.
The test involved visual assessments of 30 low-gloss samples from the NCS Quality Level 2 set. NCS samples are standardized color representations based on the Natural Color System, a scientifically developed model for describing and categorizing colors as perceived by human vision [
36,
37]. Unlike systems based on physical color mixing, the NCS is rooted in perceptual attributes, using six elementary color percepts: white, black, red, yellow, green, and blue. Each NCS color is defined by its similarity to these elementary colors, allowing for a highly intuitive and consistent classification. NCS samples are produced under strict quality controls to ensure accurate color rendering across various applications. They are widely used in design, architecture, and color science, and are particularly useful in psychophysical experiments where consistent and reproducible visual stimuli are required.
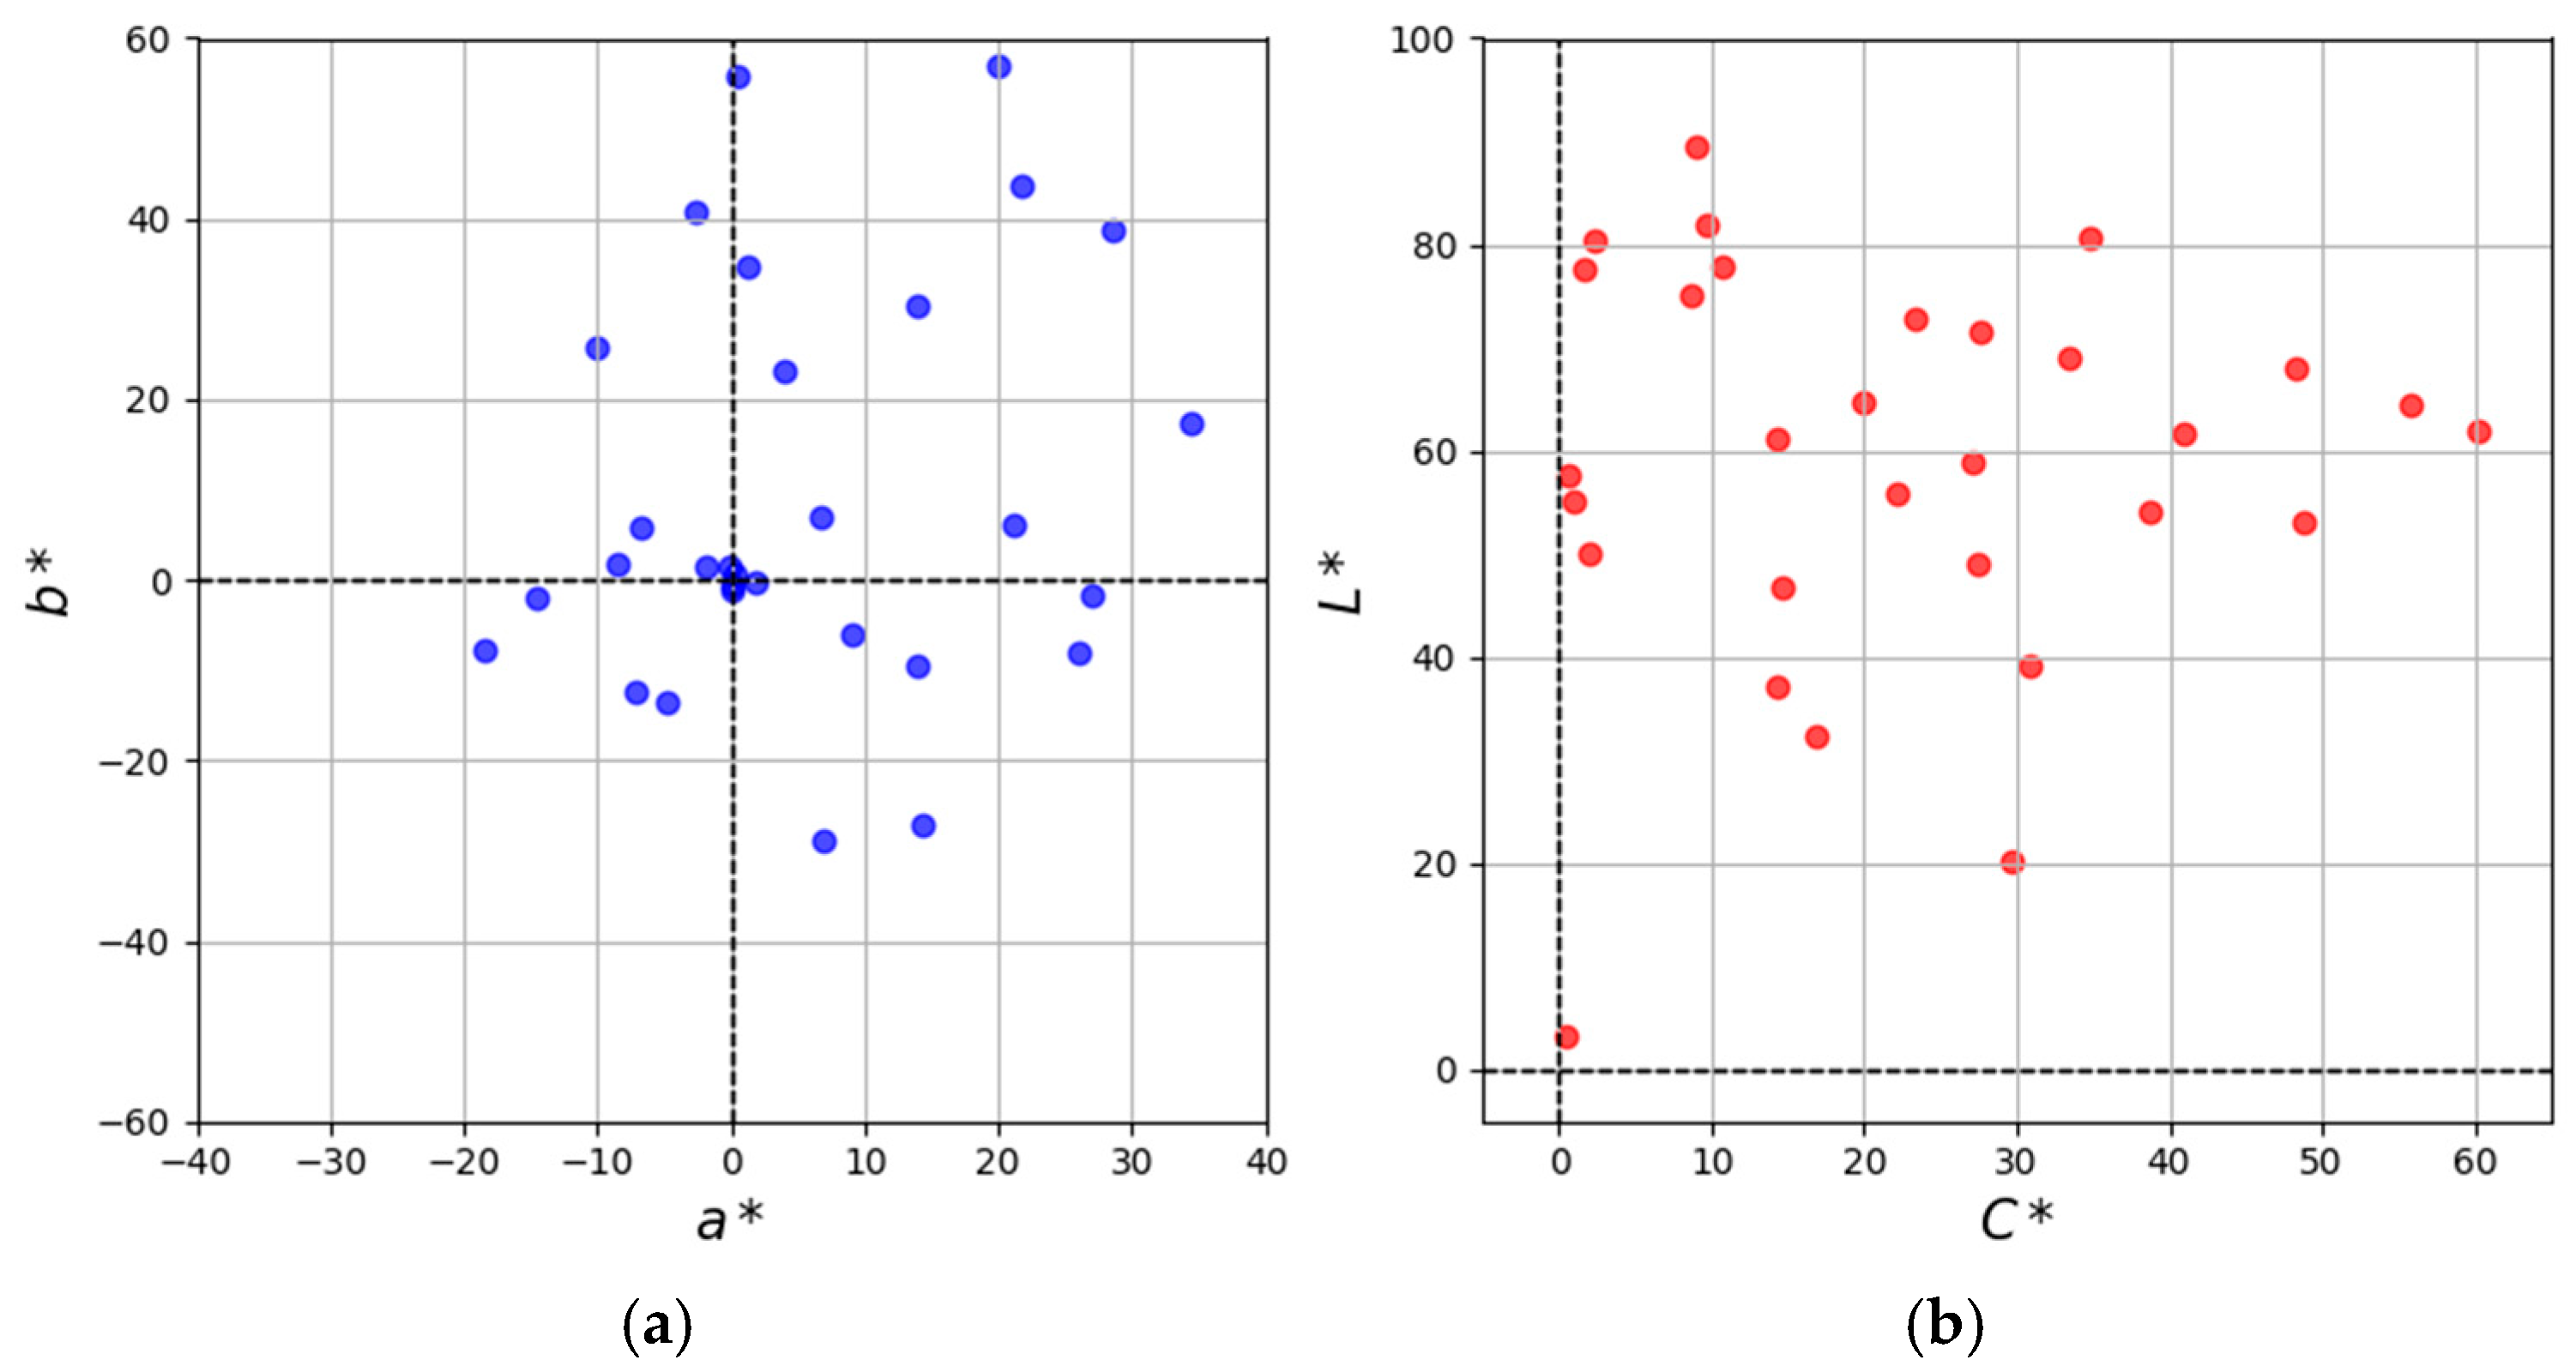
The samples used in this particular experiment included colors from six chromatic categories—yellow, orange, red, purple, blue, and green—with variations in lightness and saturation, and also six achromatic samples, as these have previously been identified as particularly challenging for color reproduction accuracy [
23]. The color characteristics of these samples are shown in
Figure 2.
To prepare the samples, their spectral reflectance data were measured using a BYK-Mac multiangle spectrophotometer at 110° aspecular angle. This angle minimizes the effects of gloss and produces results comparable to d/8 spectral reflectance data.
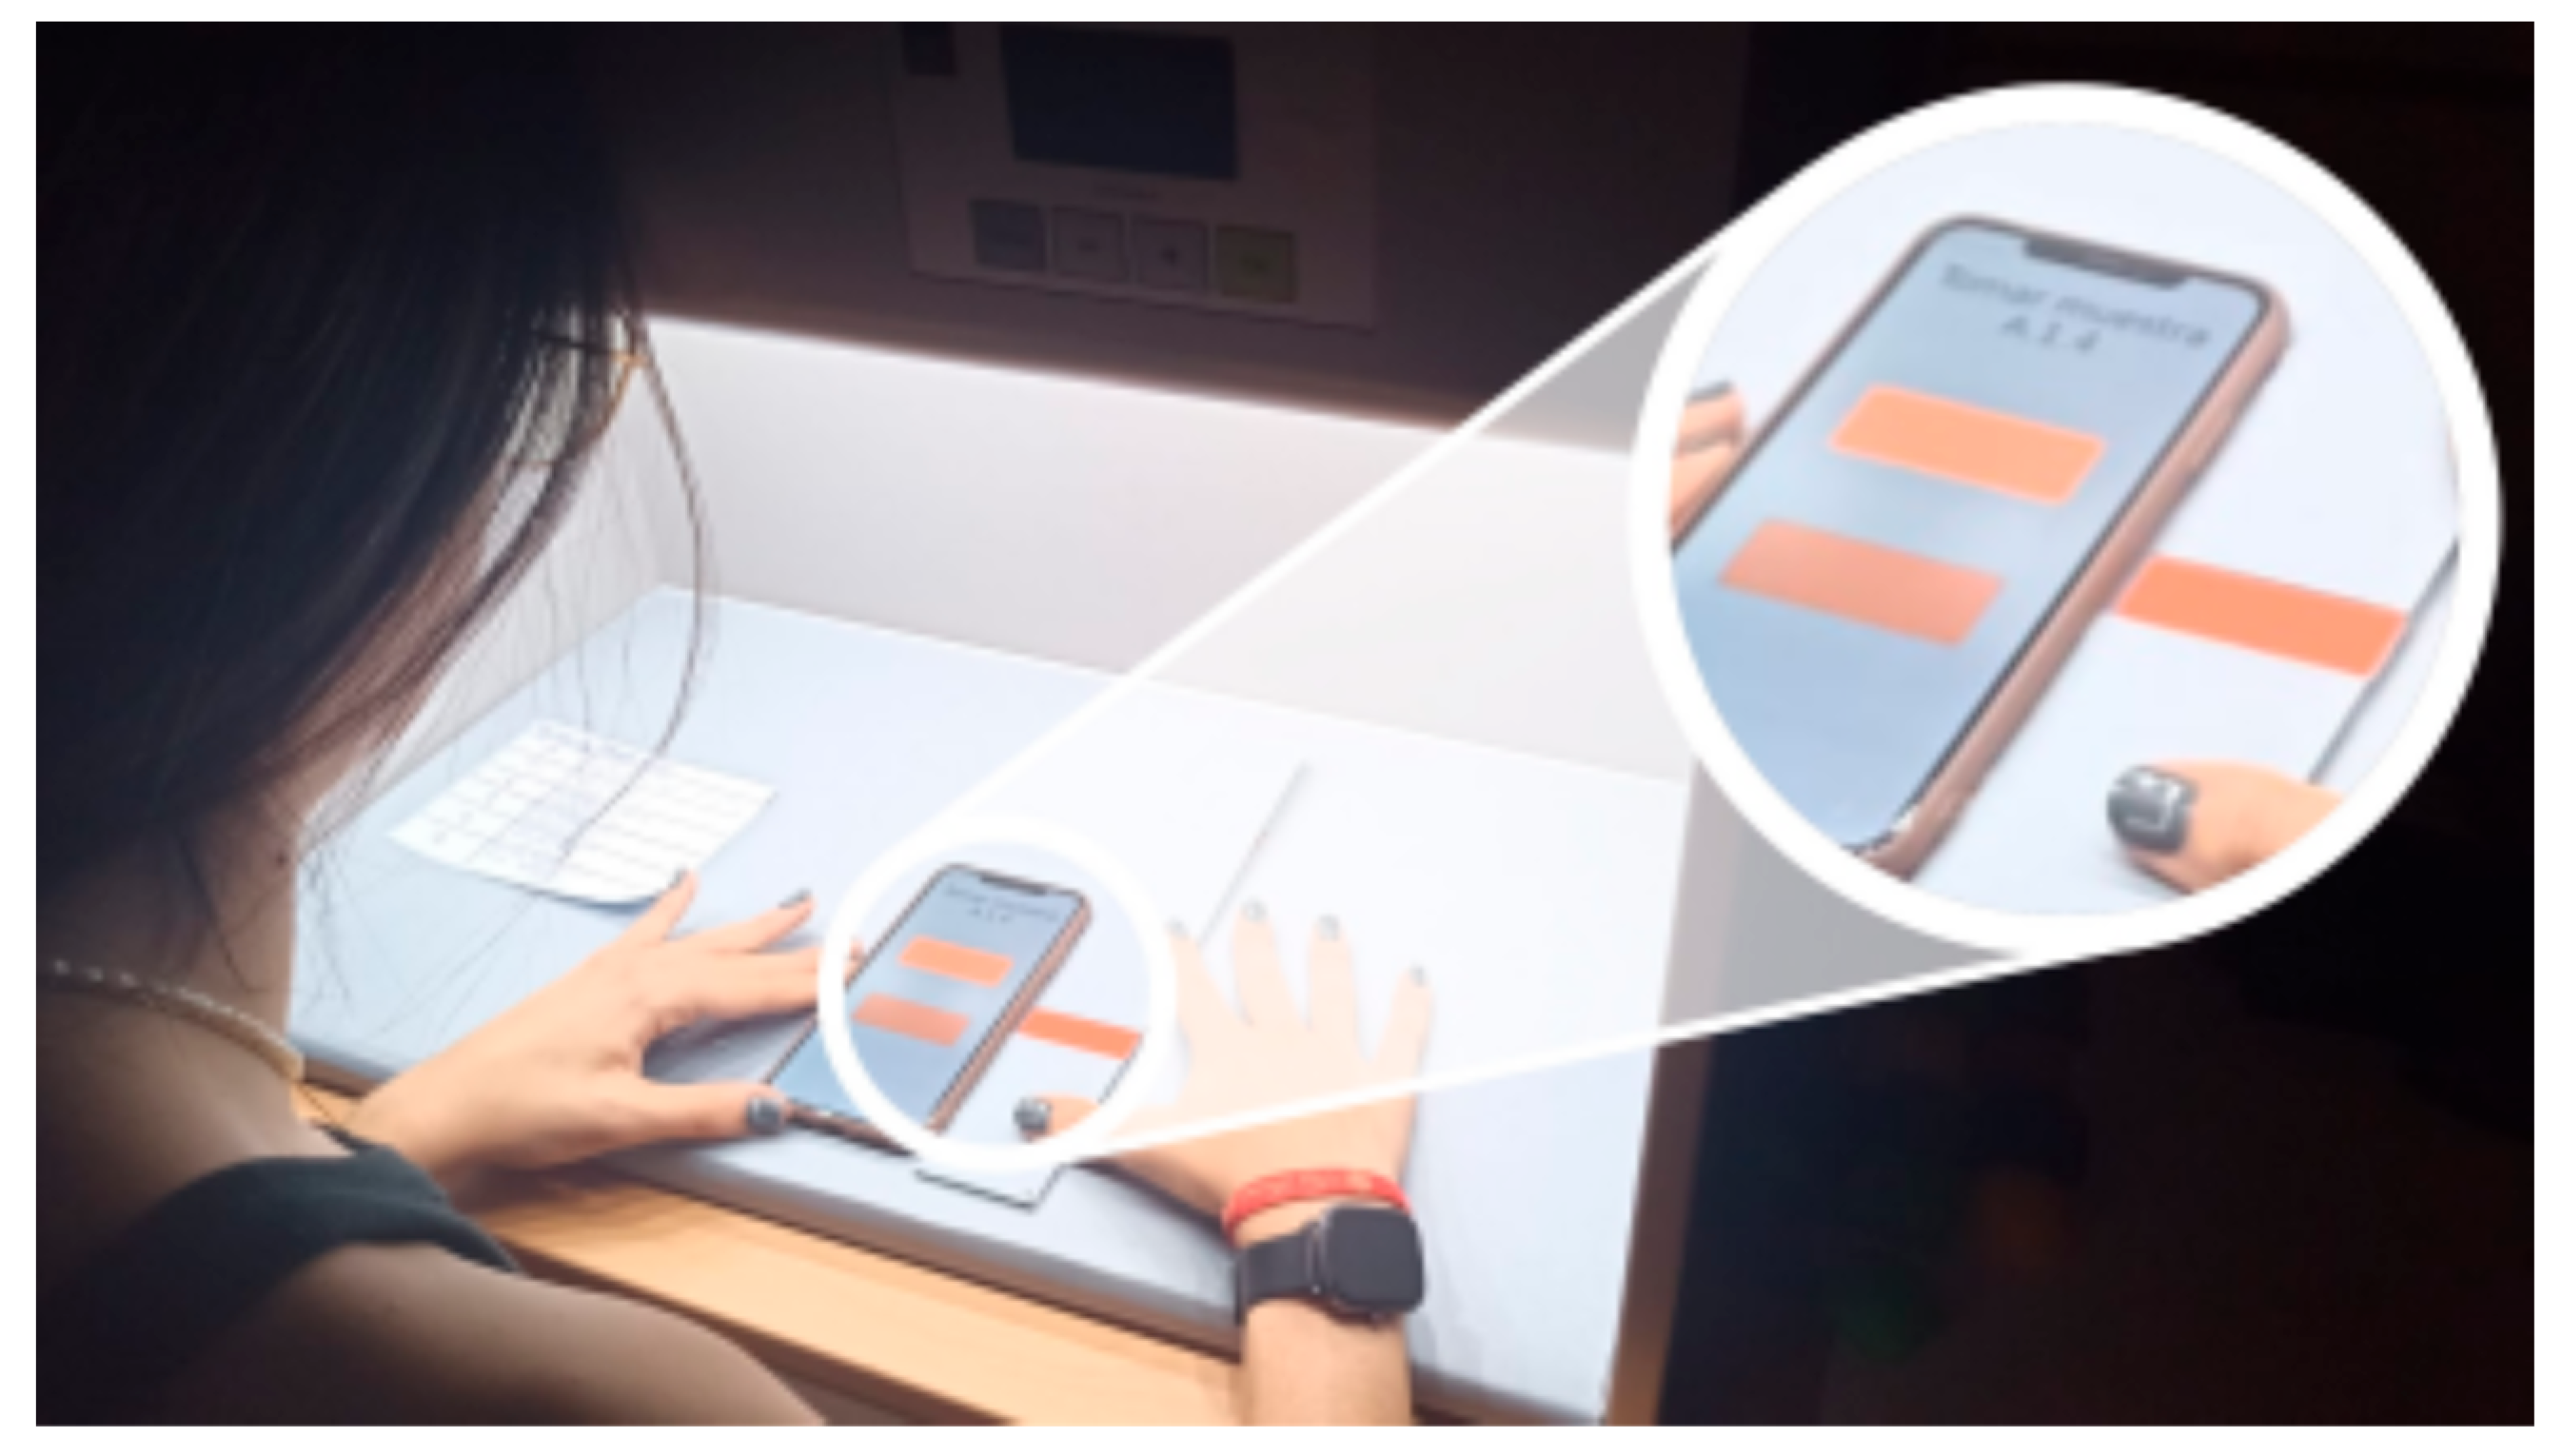
The visual assessments took place in a light booth, the JUST Normlicht LED Color Viewing Light, under D65 illuminant and 750 lx illumination level (JUST Normlicht, Langhorne, PA, USA). Eight observers (3 males and 5 females, aged between 22 and 25 years) with normal color vision (verified by Ishihara tests) participated. During testing, the iPhone XS Max was placed flat in front of the observers and viewed directly from above. As illustrated in
Figure 3, the physical samples were held beside the display for direct comparison, with observers allowed to tilt both slightly for better judgment. The entire experiment was repeated for all 30 samples, with each observer completing three separate sessions. The order and positions of samples were randomized to eliminate repetition bias.
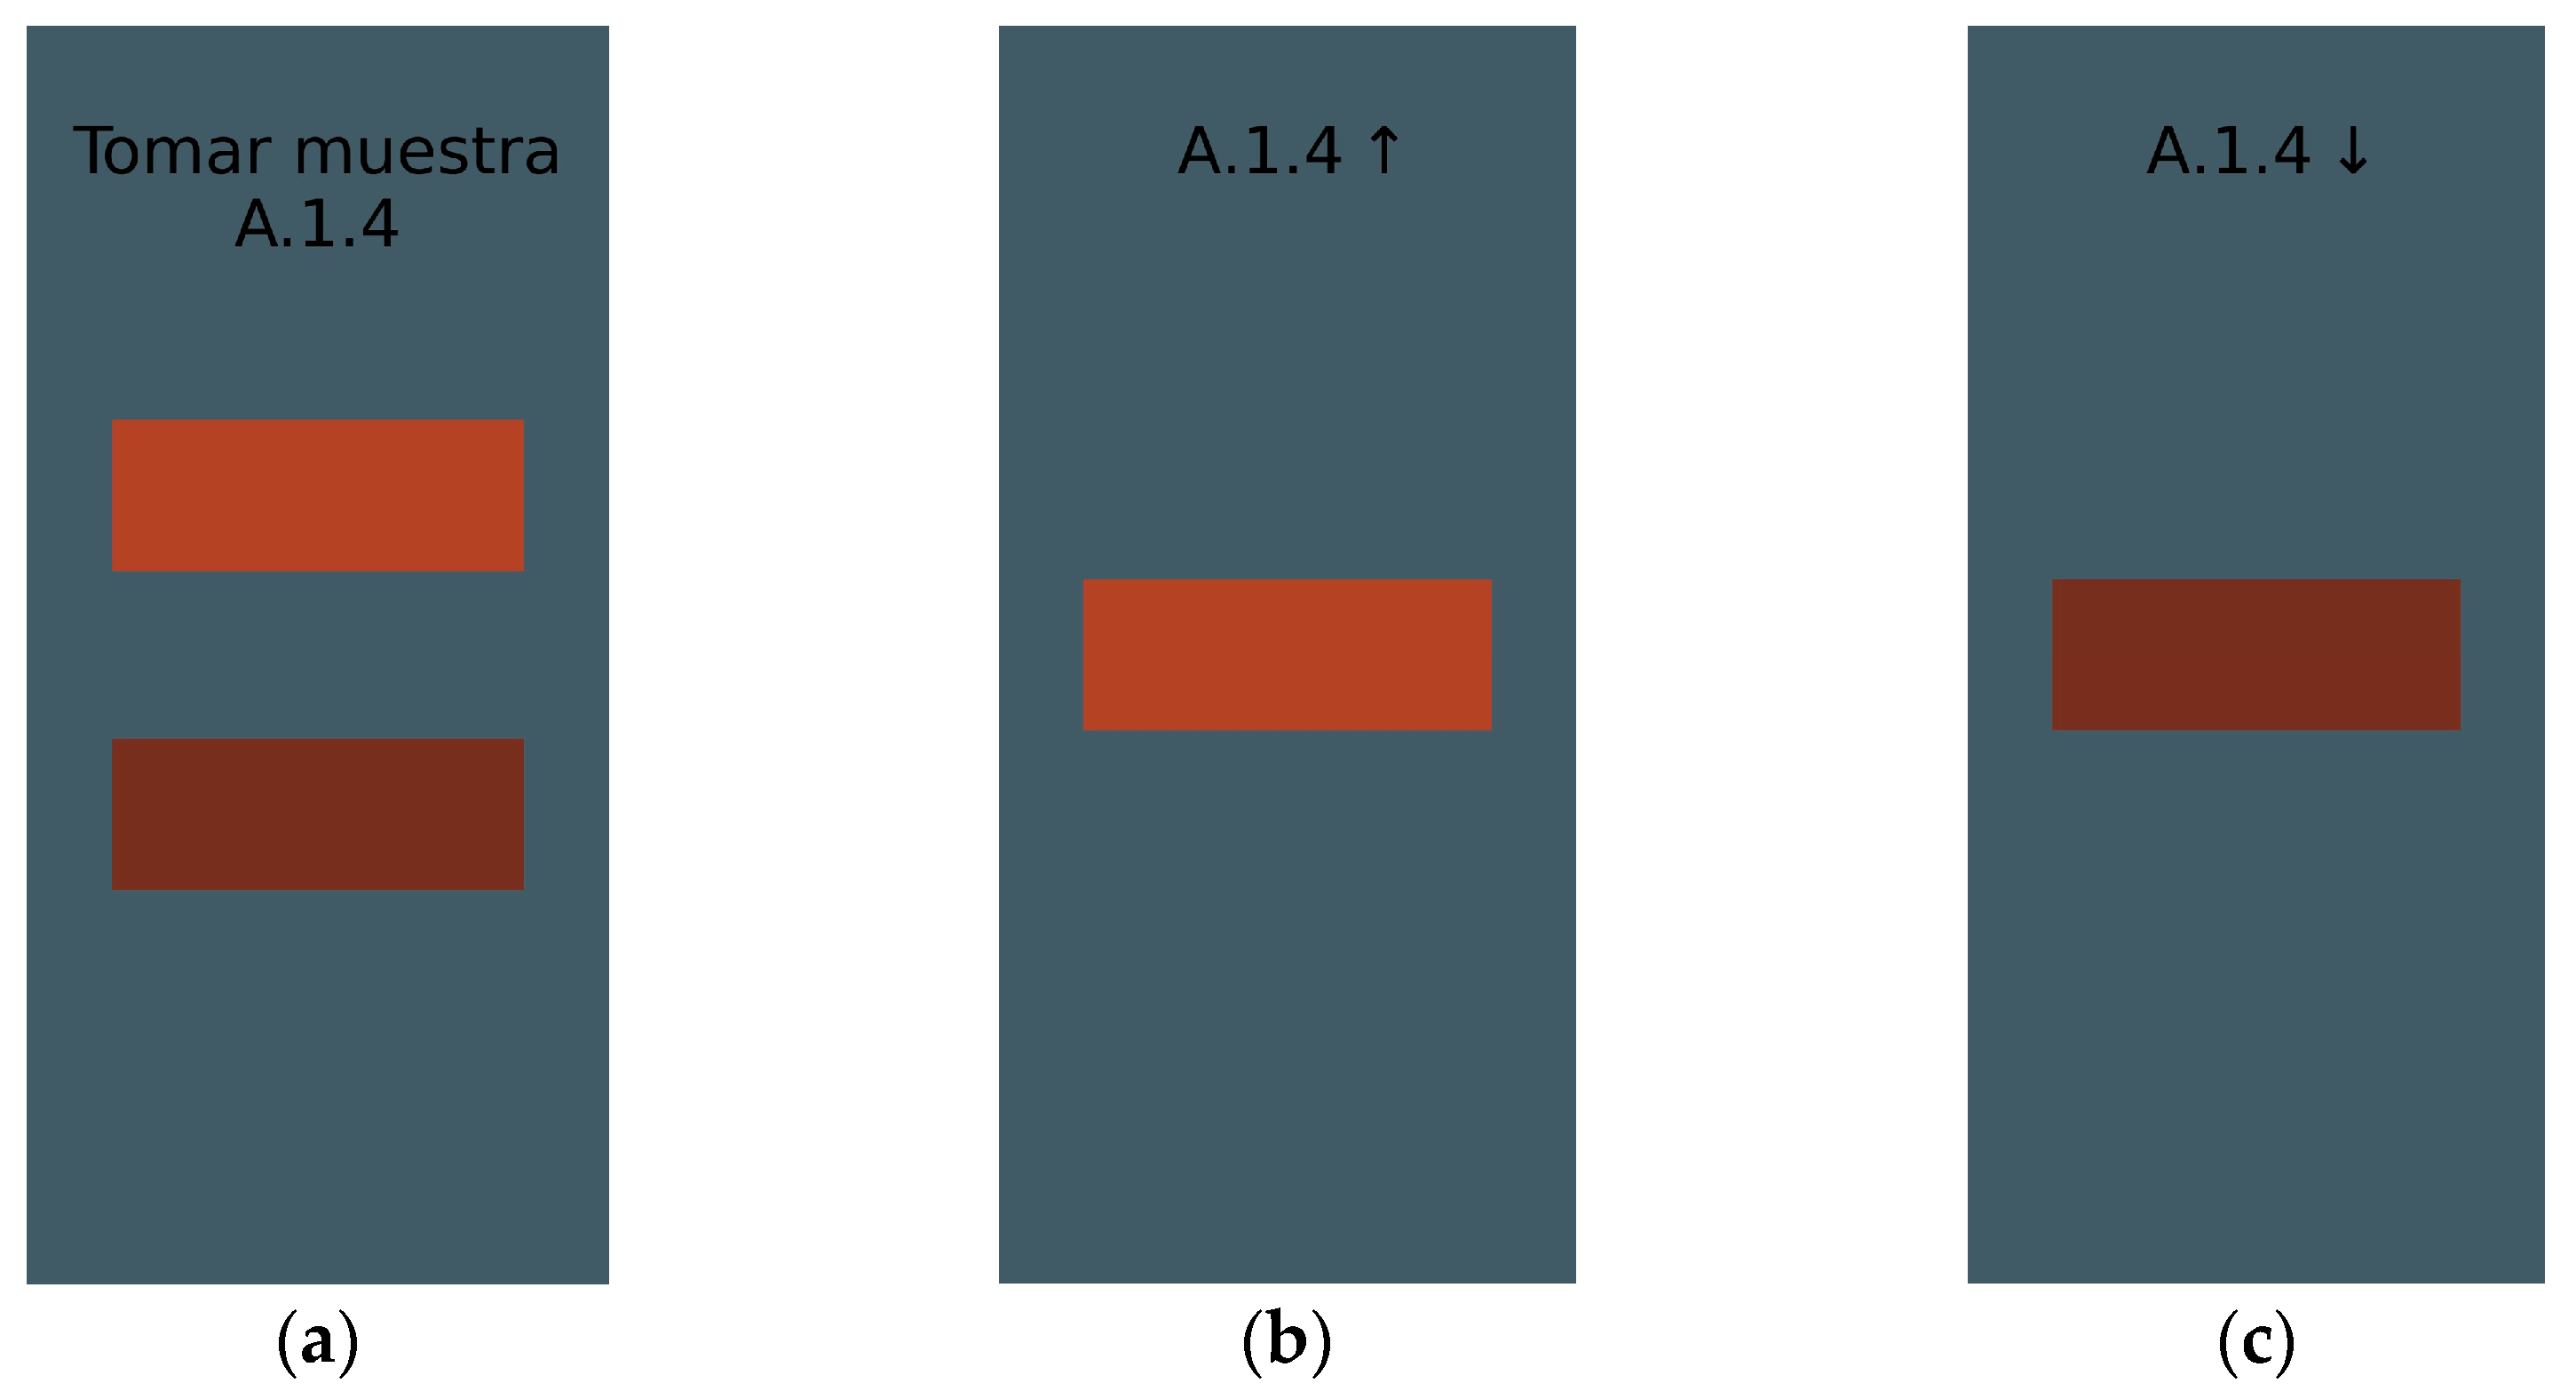
As shown in
Figure 4a, each displayed image contained two color patches: one generated using the default sRGB method and the other using the CAAD model. The patch positions were also randomized to prevent bias. The color patches were designed to match the dimensions of the physical paint samples (2 cm × 5 cm). To mitigate simultaneous contrast effects, the background color of the digital image was adjusted to closely replicate the color of the light booth used during the visual experiment. Although this configuration could introduce minor spatial variations in luminance and potentially alter the SPD, such effects were minimized by consistently positioning the test samples at the center of the screen, where display uniformity in both luminance and chromaticity is typically highest. Display uniformity was verified through both visual inspection and instrumental measurements. Consequently, any influence of the simulated background on the SPD was considered negligible for the purposes of this study.
Observers identified which patch matched the physical sample best. Next, they assigned a quality score when comparing the top image with the physical sample (
Figure 4b), followed by giving a visual score for comparing the bottom image with the physical sample (
Figure 4c). Visual scores range from 0 to 4, with the description shown in
Table 2.
The study followed the principles outlined in the General Data Protection Regulation (EU) 2016/679 and the Spanish Organic Law 3/2018 on the Protection of Personal Data and Guarantee of Digital Rights. As the research involved no sensitive personal data, posed no physical or psychological risk, and ensured full anonymity of participants, it was exempt from mandatory ethics committee approval under the applicable legislation.
3. Results
3.1. Results on Display Characterization
For the 11 devices analyzed, the chromatic coordinates
and maximum luminance
were calculated for each of the three color channels and for the black image, as well as the MDCIM parameters
and
(
Table 3). Additionally, the mean relative errors (MRE) for the luminance fit of each Tone Rendering Curve compared to the sRGB curve were computed, as well as the Tone Rendering Curves for each channel of each device.
All TRCs show a clear improvement when using the MDCIM compared to using the sRGB color space parametrization, as quantified by comparing the average relative difference between the luminance measurements and the values predicted by the MDCIM and sRGB color space. As shown in
Table 4, for all of them the MRE of their TRCs is smaller when using the MDCIM than when using sRGB color space parametrization.
Figure 5a presents an example of the TRC graph measured for the iPhone 12. The improvement in the fitting can be observed across the three channels, particularly in the region corresponding to low digital values, shown in
Figure 5b. The scatter plots of the R, G, and B measurements represent the normalized luminance values obtained from single-channel images, where only one color channel is active (with values ranging from 0 to 255 on the horizontal axis) and the other two are set to zero. The R, G, and B TRC lines for each channel correspond to the function defined in Equation (2), fitted by minimizing the relative error. As shown in
Table 3, the fitted parameters
and
vary between channels, even within the same device, and differ from the standard sRGB model parameters (
,
), which assume identical behavior across all three channels. The sRGB model is represented by the black dashed line in
Figure 5.
In total, 33
parameters were calculated, all ranging from 2 to 3, with 28 values falling below the value
from the sRGB method. Only three devices had at least one color channel with
(
) larger than 2.4. As shown in
Table 3, the channels exceeding 2.4 were the blue ones for the three and the red ones for all but one of them. The remaining
values across devices are all below 2.4.
To build a generalized model representing all devices characterized, the TRC exponential parameters would be set as , and . The average values for the parameter are slightly higher than . Thus, for practical purposes, it could be assumed that .
On the other hand, the values of MDCIM parameters for the iPhone XS Max were also presented at a recent conference [
13].
Table 5 shows these values, comparing them with the corresponding values calculated here for the CAAD, as well as the values implicitly assumed when using the sRGB color space.
3.2. Results on the Visual Experiment
Visual scores were collected from eight observers. For each of the 30 samples, observers assessed the color reproduction quality of digital color visualization by visually comparing the digital reproduction obtained with sRGB and the CAAD. In order to be able to analyze observer repeatability and reproducibility, the same test was repeated by each observer three times, each of the sessions being planned on different days. This resulted in a total of 720 visual scores for the color representation calculated with sRGB color space, 720 corresponding visual scores for the color representation by CAAD, and 720 preferences for color representation by either sRGB color space or CAAD model.
To statistically validate the experiment, an analysis of variance (ANOVA) was conducted. ANOVA is a statistical technique used to assess whether there are significant differences between the means of multiple groups by examining the contribution of different sources of variability to the total observed variance. Prior to the ANOVA, a preliminary analysis of the data was performed to verify that the underlying assumptions were reasonably satisfied. The normality assumption was found to be acceptable, and no evident heteroscedasticity was detected. In this case, the ANOVA was used to evaluate the statistical significance of each factor that might influence the assigned scores. The results are summarized in
Table 6.
The method used to render the color samples (sRGB or CAAD) accounts for nearly all of the variability in the data, as indicated by its exceptionally high F-value and extremely small p-value. This suggests that the difference between the sRGB and CAAD methods is the primary source of variation in the scores. Although the differences between observers are statistically significant, they contribute less to the overall variability, reflecting individual differences among participants, but with a smaller effect size. Similarly, the session factor is significant, but its influence is relatively minor, likely due to learning or fatigue effects over time.
The significant interaction between method and observer suggests that some participants perceive one method as more effective than the other, while others do not notice such a clear difference. The interaction between method and session is also significant, though weaker, indicating that preferences for one method over another may slightly vary across sessions, but the effect is less pronounced.
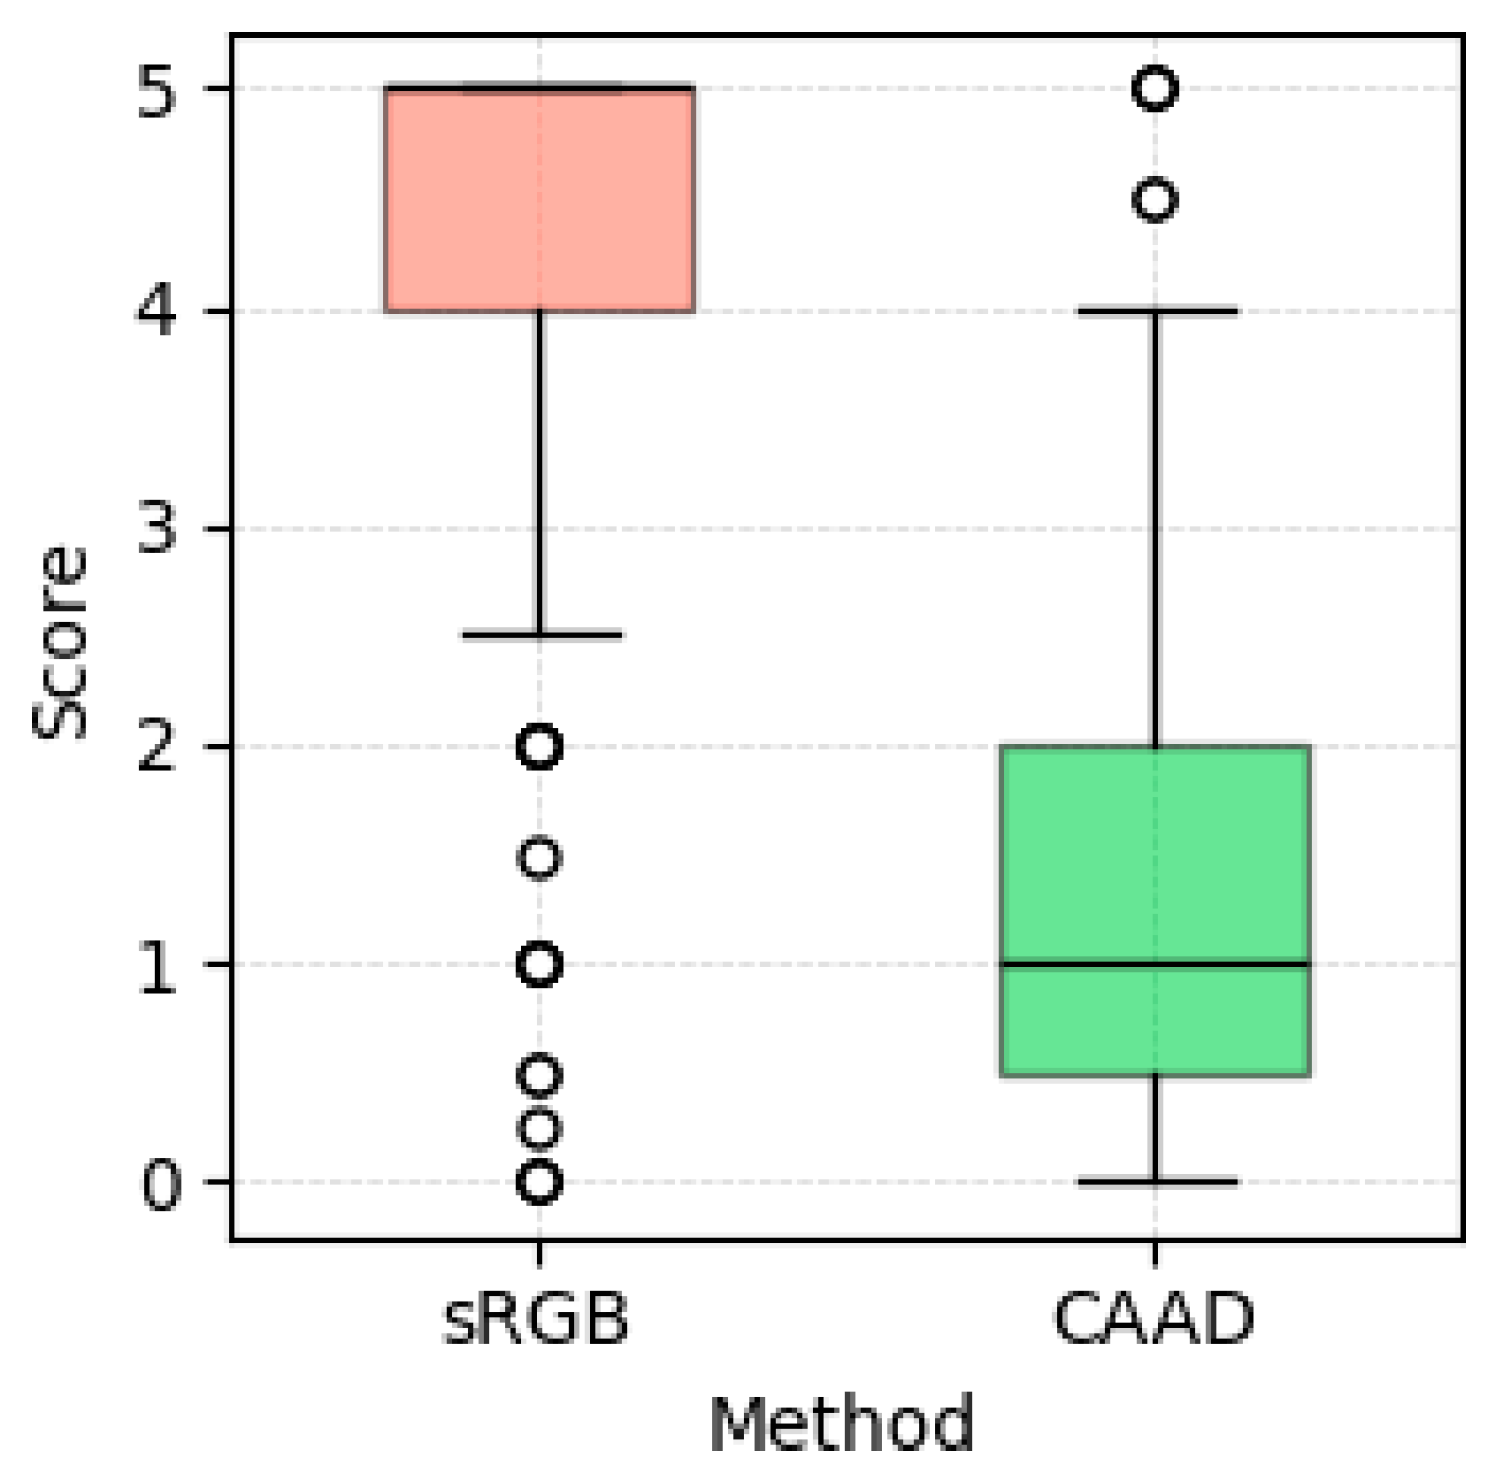
A visual comparison of the score distributions through a boxplot further reinforces the statistical findings. The boxplot in
Figure 6 clearly illustrates that the CAAD model consistently received higher ratings than the sRGB method. Despite the presence of a few outliers and the slight overlap between the lower whisker of CAAD and the upper whisker of sRGB, the interquartile ranges remain completely separate, highlighting a marked difference in overall performance between the two models.
Overall, the experiment demonstrates robust performance by effectively capturing substantial differences between the methods being compared. To further validate the results, intra-observer repeatability and inter-observer reproducibility were determined. The intra-observer repeatability is calculated as the average absolute difference between the visual score given by an observer for a particular color in a particular session and the corresponding value for that same combination of observer and color after averaging over all three sessions. This quantifies how repeatable a visual score is for a particular observer-color combination. After averaging this for all observers and colors, the result is an intra-observer repeatability of 0.36 for color representations calculated using sRGB color space and 0.47 for CAAD.
The inter-observer reproducibility is calculated as the average absolute difference between the visual score given by an observer for a particular color (averaged over three sessions) and the corresponding value for that same color after averaging over all observers and all their sessions. This quantifies how reproducible a visual score is for a particular color. After averaging this for all colors, the inter-observer reproducibility is 0.42 for color representations calculated using the sRGB color space and 0.57 for CAAD model parameters.
The observer data contain a set of 720 assessments about which of the two digital color representations was preferred by each observer for every sample in each session. In 97.4% of the evaluations, observers preferred the color representation calculated with the CAAD model. It is important to emphasize that the observers were unaware of which method had been used for each image.
The visual data also contains 720 visual scores for the color accuracy of digitally representing the physical samples using sRGB color space, and 720 visual scores for the case where the digital color representations are calculated with the average Apple parameters.
Table 7 shows a large difference in visual scores when using the CAAD model versus when using the sRGB color space. The average visual score improves from 4.33 to 1.29 by using the CAAD.
A different measure to investigate the two color reproduction accuracies is to calculate the percentage of visual scores that are 4 or higher. Based on the scoring scale shown in
Table 2, these scores refer to poor color matches between the digital color representation and the physical sample. When using sRGB color space to calculate digital color reproductions, in 85.3% of the evaluations, the color match is rated as not correct or even very bad.
Table 7 shows that this percentage shrinks to 4.9% when using the CAAD model. A related measure is the percentage of visual scores that are 2 or smaller. This may be viewed as the percentage of color matches that is reasonable or better. This percentage increases from 4.0% when using the sRGB color space to 84.2% when using the MDCIM with averaged Apple parameter values.
4. Discussion
The characterization results for all 11 devices (
Table 3) indicate a certain degree of deviation from the sRGB color space. Notably, the average parameters across all measured devices do not align with the default sRGB gamma value or its chromatic assumptions. These findings provide quantitative evidence that the sRGB color space is not the most suitable for color rendering on modern displays, particularly in mobile OLED and LCD screens.
In terms of perceptual evaluation, the CAAD model (based on averaged parameters from 11 Apple devices) delivered a color reproduction accuracy nearly equivalent to the fully device-specific MDCIM when tested on the iPhone XS Max [
13]. Using the CAAD model yields very similar results: 97.4%, and the visual difference is reduced to 1.29. This finding is particularly relevant, as it suggests that accurate color reproduction may be achievable without performing individual spectroradiometric characterization, which can be time-consuming and resource-intensive.
It is important to consider that the performance improvements observed with the CAAD model stem from two key factors: (1) the use of averaged device-specific display characterization parameters, and (2) the adaptation to ambient lighting conditions. While the current study does not independently quantify the contribution of each component, their combined effect leads to a significant enhancement in perceptual color fidelity over the sRGB baseline.
The results also indicate that the CAAD model significantly improves color matching over sRGB. The percentage of reasonable or good color matches increases from 4.0% with sRGB to 84.2% with the averaged model.
These results reinforce the broader implication that the sRGB approach for color rendering is insufficient for current display technologies. As new display systems continue to evolve, the need for flexible, context-aware models becomes increasingly urgent.
5. Conclusions
This study offers a promising approach to leverage the advantages of the MDCIM: the development of a generalized model that, while potentially not suitable for some devices, could be effective for a range of devices with shared characteristics. Notably, it is demonstrated that on the iPhone XS Max, under specific lighting conditions, the device-specific MDCIM delivers almost identical results to an averaged model derived from the characterization of 11 Apple devices, the CAAD. These findings pave the way for creating less device-dependent MDCIMs, simplifying the characterization process, and enabling more accessible implementation without significantly compromising color reproduction accuracy.
This article explores the effectiveness of the MDCIM [
10], which adapts the GOG model to incorporate both ambient lighting levels and the chromatic properties of the device on which it is used. The model has been tested across a wider range of devices, and the results demonstrate that its parameters typically differ from those of the sRGB space (
).
This study presents the results for 11 different mobile and tablet screens. Using measurements from a spectroradiometer, the MDCIM parameters were specifically optimized for each screen, making it possible to examine how these parameters vary across devices.
The results of a visual experiment conducted on a specific OLED display, the iPhone XS Max, are also presented. Using averaged parameters from all Apple devices for on-screen color reproduction yields nearly the same accuracy as using device-specific parameters. This indicates that achieving a substantial improvement in color reproduction accuracy with the MDCIM does not necessarily require fully device-specific parameters.
This fact is noteworthy, as it would allow for improved color reproduction on a display without requiring full characterization measurements with a spectroradiometer, a process that can take between 30 and 60 min, depending on whether the device is an LCD or an OLED. OLEDs, which produce deeper dark colors, emit less light than LCDs, thus requiring longer integration times for measuring the luminances of most images in the characterization.
By having predefined
and
parameters applicable to a range of models, the MDCIM could be implemented to enhance color reproduction on any device. Additionally, it would be necessary to know the chromatic coordinates
and the maximum luminances
for the three device channels. This information is available online through video diagnostic platforms like DISPLAYMATE [
34].
Future research could explore additional visual experiments to directly compare the two MDCIMs (specific and average) with the sRGB color space, assessing their performance under various lighting conditions. This would help to gain a deeper understanding of how they perform in different lighting environments.
It would be especially useful to examine the impact of the device-specific chromatic characteristics on color reproduction accuracy, as well as the role of adapting to ambient lighting conditions. This information could help inform the development of a model that places less emphasis on device-specific features and focuses more on adjusting to ambient light.
The CAAD model incorporates two key elements: the use of a device-dependent color rendering and the inclusion of ambient lighting conditions. Nonetheless, the inclusion of ambient lighting conditions is a particularly significant factor in the performance improvement, as it allows the model to better reflect the perceptual context in which colors are actually viewed. In the future, it would be of interest to explore whether a device-independent model could yield results comparable to those of device-specific models across varying lighting conditions. If such a model proved effective in most scenarios, it could greatly simplify device characterization and facilitate broader adoption.
Author Contributions
Investigation, A.L., E.K., L.N., E.P., C.V. and J.E.; Writing–review & editing, A.L., E.K., E.P., C.V. and J.E. All authors have read and agreed to the published version of the manuscript.
Funding
This research and APC were funded by AKZO NOBEL CAR REFINISHES B.V. and UNIVERSITY OF ALICANTE grant number VIGROB24-130.
Institutional Review Board Statement
Ethical review and approval were waived for this study due to the study was conducted in compliance with the General Data Protection Regulation (EU) 2016/679 and the Spanish Organic Law 3/2018, the research involved no sensitive personal data, posed no physical or psychological risk, and ensured full anonymity of participants, it was exempt from mandatory ethics committee approval under the applicable legislation.
Informed Consent Statement
Informed consent was obtained from all subjects involved in the study.
Data Availability Statement
The original contributions presented in this study are included in the article. Further inquiries can be directed to the corresponding author.
Acknowledgments
The authors acknowledge the company AKZO NOBEL CAR REFINISHES B.V. for the funded project “IMPROVE ACCURACY COLORS ON DISPLAYS”.
Conflicts of Interest
The authors declare that they have no known competing financial interests or personal relationships that could have appeared to influence the work reported in this paper. Eric Kirchner and Lan Njo are employees of AkzoNobel Research and Development. The authors declare that this study received funding from AkzoNobel Research and Development. The funder had no role in the design of the study; in the collection, analysis, or interpretation of data, in the writing of the manuscript, or in the decision to publish the results.
References
- Silverstein, L.D. Color Display Technology: From Pixels to Perception. In Proceedings of the Final Program IS &T/SID Color Imaging Conference, Scottsdale, AZ, USA, 7 November 2005. [Google Scholar]
- Anderson, M.; Motta, R.; Chandrasekar, S.; Stokes, M. Proposal for a Standard Default Color Space for the Internet—SRGB. In Proceedings of the IS&T 4th Color Imaging Conference: Color Science, Systems, and Applications, Scottsdale, AZ, USA, 19 November 1996. [Google Scholar]
- Cummings, W.; Fiske, T.G. Simplified Ambient Performance Assessment for Mobile Displays Using Easy Measurements. In Proceedings of the SID International Symposium Digest of Technical Papers, San Diego, CA, USA, 1 June 2014; Volume 45. [Google Scholar]
- CIE 195:2011; Specification of Colour Appearance for Reflective Media and Self-Luminous Display Comparisons. International Commission on Illumination (CIE): Vienna, Austria, 2011.
- Tian, D.; Xu, L.; Luo, M.R. The Characterization of HDR OLED Display. In Proceedings of the IS&T International Symposium on Electronic Imaging Science and Technology, Burlingame, CA, USA, 13–17 January 2019; Volume 2019, pp. 326–331. [Google Scholar]
- Zhang, J.Q.; Cai, F.; Liu, Z.; Wu, G.Y.; Zhu, M. A Composite Model for Accurate Colorimetric Characterization of Liquid Crystal Displays. J. Soc. Inf. Disp. 2016, 24, 600–610. [Google Scholar] [CrossRef]
- Wu, J.; Wei, M.; Yang, Y.; Wang, W. Color Characterization Model for OLED Displays with Crosstalk Effects. Color. Res. Appl. 2023, 48, 662–672. [Google Scholar] [CrossRef]
- De Fez, D.; Luque, M.J.; Garcia-Domene, M.C.; Camps, V.; Piñero, D. Colorimetric Characterization of Mobile Devices for Vision Applications. Optom. Vis. Sci. 2016, 93, 85–93. [Google Scholar] [CrossRef] [PubMed]
- Bhaumik, U.; Spieringhs, R.M.; Smet, K.A.G. Color Characterization of Displays Using Neural Networks. In Proceedings of the CEUR Workshop Proceedings, Gjøvik, Norway, 8–9 September 2022; Volume 3271. [Google Scholar]
- Kirchner, E.; van der Lans, I.; Martínez-Verdú, F.M.; Perales, E. Improving Color Reproduction Accuracy of a Mobile Liquid Crystal Display. J. Opt. Soc. Am. A 2017, 34, 101–110. [Google Scholar] [CrossRef] [PubMed]
- Kirchner, E.; Njo, L.; Perales, E.; Larrosa Navarro, A. Quantifying Visual Differences Between Color Visualizations on Different Displays. In Proceedings of the London Imaging Meeting, London, UK, 12 September 2023; Volume 4. [Google Scholar]
- Kirchner, E.; van der Lans, I.; Perales, E.; Martínez-Verdú, F. Improving Color Reproduction Accuracy of an OLED-Based Mobile Display. Color. Res. Appl. 2018, 43, 34–46. [Google Scholar] [CrossRef]
- Kirchner, E.; Njo, L.; Perales, E.; Larrosa, A.; Vázquez, C.; van der Lans, I.; Spiers, P. Improving Accuracy of Color Reproduction on Mobile Displays. In Proceedings of the London Imaging Meeting, London, UK, 27 June 2024; Volume 5, pp. 116–119. [Google Scholar]
- Yang, Q.; Yu, M.; Chen, Z.; Ai, S.; Kentsch, U.; Zhou, S.; Jia, Y.; Chen, F.; Liu, H. A Novel Approach towards Robust Construction of Physical Colors on Lithium Niobate Crystal. Opto-Electron. Adv. 2025, 8, 240193. [Google Scholar] [CrossRef]
- Kim, H.-S.; Kim, E.J.; Kim, J. The Optimal Color Space for Realistic Color Reproduction in Virtual Reality Content Design. Electronics 2023, 12, 4630. [Google Scholar] [CrossRef]
- Cebrián, P.; Pérez-Sienes, L.; Sanz-Vicente, I.; López-Molinero, Á.; de Marcos, S.; Galbán, J. Solving Color Reproducibility between Digital Devices: A Robust Approach of Smartphones Color Management for Chemical (Bio)Sensors. Biosensors 2022, 12, 341. [Google Scholar] [CrossRef] [PubMed]
- Basova, O.; Gladilin, S.; Kokhan, V.; Kharkevich, M.; Sarycheva, A.; Konovalenko, I.; Chobanu, M.; Nikolaev, I. Evaluation of Color Difference Models for Wide Color Gamut and High Dynamic Range. J. Imaging 2024, 10, 317. [Google Scholar] [CrossRef]
- Sharma, G. LCDs versus CRTs—Color-Calibration and Gamut Considerations. Proc. IEEE 2002, 90, 605–622. [Google Scholar] [CrossRef]
- ISO 14861:2015; Graphic Technology—Requirements for Colour Soft Proofing Systems. International Organization for Standardization: Geneva, Switzerland, 2015.
- Berns, R.S.; Motta, R.J.; Gorzynski, M.E. CRT Colorimetry. Part I: Theory and Practice. Color. Res. Appl. 1993, 18, 299–314. [Google Scholar] [CrossRef]
- Berns, R.S. Methods for Characterizing CRT Displays. Displays 1996, 16, 173–182. [Google Scholar] [CrossRef]
- IEC 61966-2-1:1999; Multimedia Systems and Equipment—Colour Measurement and Management Part 2-1: Colour Management—Default RGB Colour Space—SRGB. International Electrotechnical Commission (IEC): Geneva, Switzerland, 1999.
- Kirchner, E.; van der Lans, I.; Njo, L. Perception-Based Accurate Colour Calibration of Electronic Displays. In Proceedings of the 12th Congress of the International Colour Association (AIC), Newcastle, UK, 8 July 2013; pp. 1077–1080. [Google Scholar]
- Berns, R.S. Billmeyer and Saltzman’s: Principles of Color Technology, 3rd ed.; John Wiley & Sons: Hoboken, NJ, USA, 2000. [Google Scholar]
- ITU-R BT.709-6; Parameter Values for the HDTV Standards for Production and International Programme Exchange. International Telecommunication Union (ITU): Geneva, Switzerland, 2015.
- Poynton, C. Digital Video and HDTV: Algorithms and Interfaces, The Morgan Kaufmann Series in Computer Graphics; Morgan Kaufmann Publishers Inc.: San Francisco, CA, USA, 2003. [Google Scholar]
- International Color Consortium A Standard Default Color Space for the Internet—sRGB. Available online: http://www.color.org/srgb.xalter (accessed on 1 May 2025).
- Fairchild, M.D.; Wyble, D.R. Colorimetric Characterization of the Apple Studio Display (Flat Panel LCD); Munsell Color Science Laboratory: Rochester, NY, USA, 1998. [Google Scholar]
- Day, E.A.; Taplin, L.; Berns, R.S. Colorimetric Characterization of a Computer-Controlled Liquid Crystal Display. Color. Res. Appl. 2004, 29, 365–373. [Google Scholar] [CrossRef]
- Gao, X.; Khodamoradi, E.; Guo, L.; Yang, X.; Tang, S.; Guo, W.; Wang, Y. Evaluation of Colour Appearances Displaying on Smartphones. In Proceedings of the Midterm Meeting of the International Colour Association, Tokyo, Japan, 19–22 May 2015; pp. 539–544. [Google Scholar]
- Park, Y.K.; Li, C.J.; Luo, M.R.; Kwak, Y.; Park, D.S.; Kim, C. Applying CIECAM02 for Mobile Display Viewing Conditions. In Proceedings of the IS&T/SID Color Imaging Conference, Albuquerque, NM, USA, 5–9 November 2007. [Google Scholar]
- Park, Y.K.; Luo, M.R.; Li, C.J.; Kwak, Y. Refined CIECAM02 for Bright Surround Conditions. Color. Res. Appl. 2015, 40, 114–124. [Google Scholar] [CrossRef]
- Ryer, A. Light Measurement Handbook; International Light Technologies: Peabody, MA, USA, 1997. [Google Scholar]
- Display Mate. Testing and Evaluating Displays and Projectors. Available online: http://www.displaymate.com/testing.html (accessed on 1 May 2025).
- CNET. How We Test Tablets? Available online: https://www.cnet.com/tech/computing/cnet-tablet-battery-life-results/ (accessed on 1 May 2025).
- Hård, A.; Sivik, L.; Tonnquist, G. NCS, Natural Color System—From Concept to Research and Applications. Part I. Color. Res. Appl. 1996, 21, 180–205. [Google Scholar] [CrossRef]
- Hård, A.; Sivik, L.; Tonnquist, G. NCS, Natural Color System—From Concept to Research and Applications. Part II. Color. Res. Appl. 1996, 21, 206–220. [Google Scholar] [CrossRef]
| Disclaimer/Publisher’s Note: The statements, opinions and data contained in all publications are solely those of the individual author(s) and contributor(s) and not of MDPI and/or the editor(s). MDPI and/or the editor(s) disclaim responsibility for any injury to people or property resulting from any ideas, methods, instructions or products referred to in the content. |
© 2025 by the authors. Licensee MDPI, Basel, Switzerland. This article is an open access article distributed under the terms and conditions of the Creative Commons Attribution (CC BY) license (https://creativecommons.org/licenses/by/4.0/).


 ,
, 


