1. Introduction
According to the Food and Agriculture Organization (FAO), aquaculture has significant potential to help meet the food demands of the growing global population. However, it is imperative that this activity develops sustainably. The FAO estimates an increase 13% in aquaculture by 2030, highlighting the need to reduce pollution, protect biodiversity, promote social equality, and protect ecosystems [
1,
2].
In Peru, aquaculture production reached 143,830 tons in 2020, according to the Peru Ministry of Production. Puno is the second largest producing region, with 44,251 tons, which generates approximately PEN 407,544,000 from exports. The main sources of aquaculture in Puno are Lakes Titicaca, Arapa, Hunkuyo, and Lagunillas. However, significant challenges arise, such as feed-related losses and manual monitoring of breeding cages, due to the lack of automation in these processes.
To achieve efficient and profitable aquaculture production, it is essential to understand the relationship between the length and weight of the farmed fish. This knowledge enables estimation of growth, determination of appropriate feeding, and monitoring of fish health. Accurate modeling of the length–weight relationship (LWR) is crucial to estimating biomass from size-based abundance data, which is fundamental to modeling aquatic ecosystems and the development of resource management strategies for the sustainable use of aquatic living resources [
3,
4].
However, the length–weight relationship in fish is not clearly defined, as the exponential formula that relates these variables includes parameters (a and b) that vary depending on species and farming conditions [
5]. This relationship is essential to establish selection criteria for the commercialization of fish, to ensure that adequate size specimens are offered to the market.
To address this issue, digital image analysis has been used, involving the extraction of meaningful information from an image [
6]. This information can serve as input for image processing techniques which can, in turn, be applied prior to conducting specific analyses. An example is image segmentation, which divides an image into different regions, such as simple binarization (dividing into background and foreground) or multiple regions representing distinct objects within the image [
7]. The concepts of computer vision, digital image processing, and image analysis are interrelated and are often used to describe similar processes. However, the combined application of these techniques in animal and veterinary science has not yet been extensively explored [
8].
Some studies have used these methodologies to identify animal positions and track their movements [
9,
10,
11]. For example, in a study on pig identification, segmentation was applied to create a background matrix that facilitated animal identification, which improved the distribution of water in a population of 40 pigs in four pens [
12].
In this study, a supervised learning approach was implemented using a set of labeled images to train the model. This process was carried out manually, employing methodologies for recording and evaluating relevant characteristics, as well as training and supervising evaluators, incorporating crowd-sourcing techniques [
13] to reduce subjectivity in evaluation. In dairy cattle, segmentation has been used to obtain useful phenotypic information on 14 additional morphological traits, automatically extracting relevant biological information from images.
In aquaculture, automated prediction of fish weight and body measurements [
14] faces significant challenges related to fish positioning and body segmentation, as well as external factors such as lighting and environmental conditions during image capture. Ref. [
15] indicates that reliable image segmentation is essential for accurate measurements of fish size. To address these challenges, a refinement in segmentation is proposed, from coarse to fine contours. Furthermore, automation of the segmentation process is suggested by using deep learning [
16]. An innovative study proposed the implementation of a computer vision system to automatically measure the physical characteristics of Nile tilapia from images of 1653 fish, allowing the development of highly accurate linear models to predict the body and weight of the fish.
In this research, the main focus is on rainbow trout, the predominant species in Lake Titicaca, and the dataset used reflects this focus. Although the model is trained on rainbow trout data, it is anticipated that its application to other similar trout species would yield reasonably effective results. However, to maximize accuracy and ensure optimal performance, it is strongly recommended that one should retrain the model using image datasets specific to the trout species of interest. This retraining would allow the model to adapt to subtle morphological variations and environmental differences, ensuring its robustness and reliability in diverse aquaculture settings.
2. Related Work
In the field of semantic image segmentation, numerous advances have been made in recent years. This Related Work section presents an overview of the most relevant research in this area, focusing on applications similar to fish segmentation in aquaculture environments.
2.1. UNET
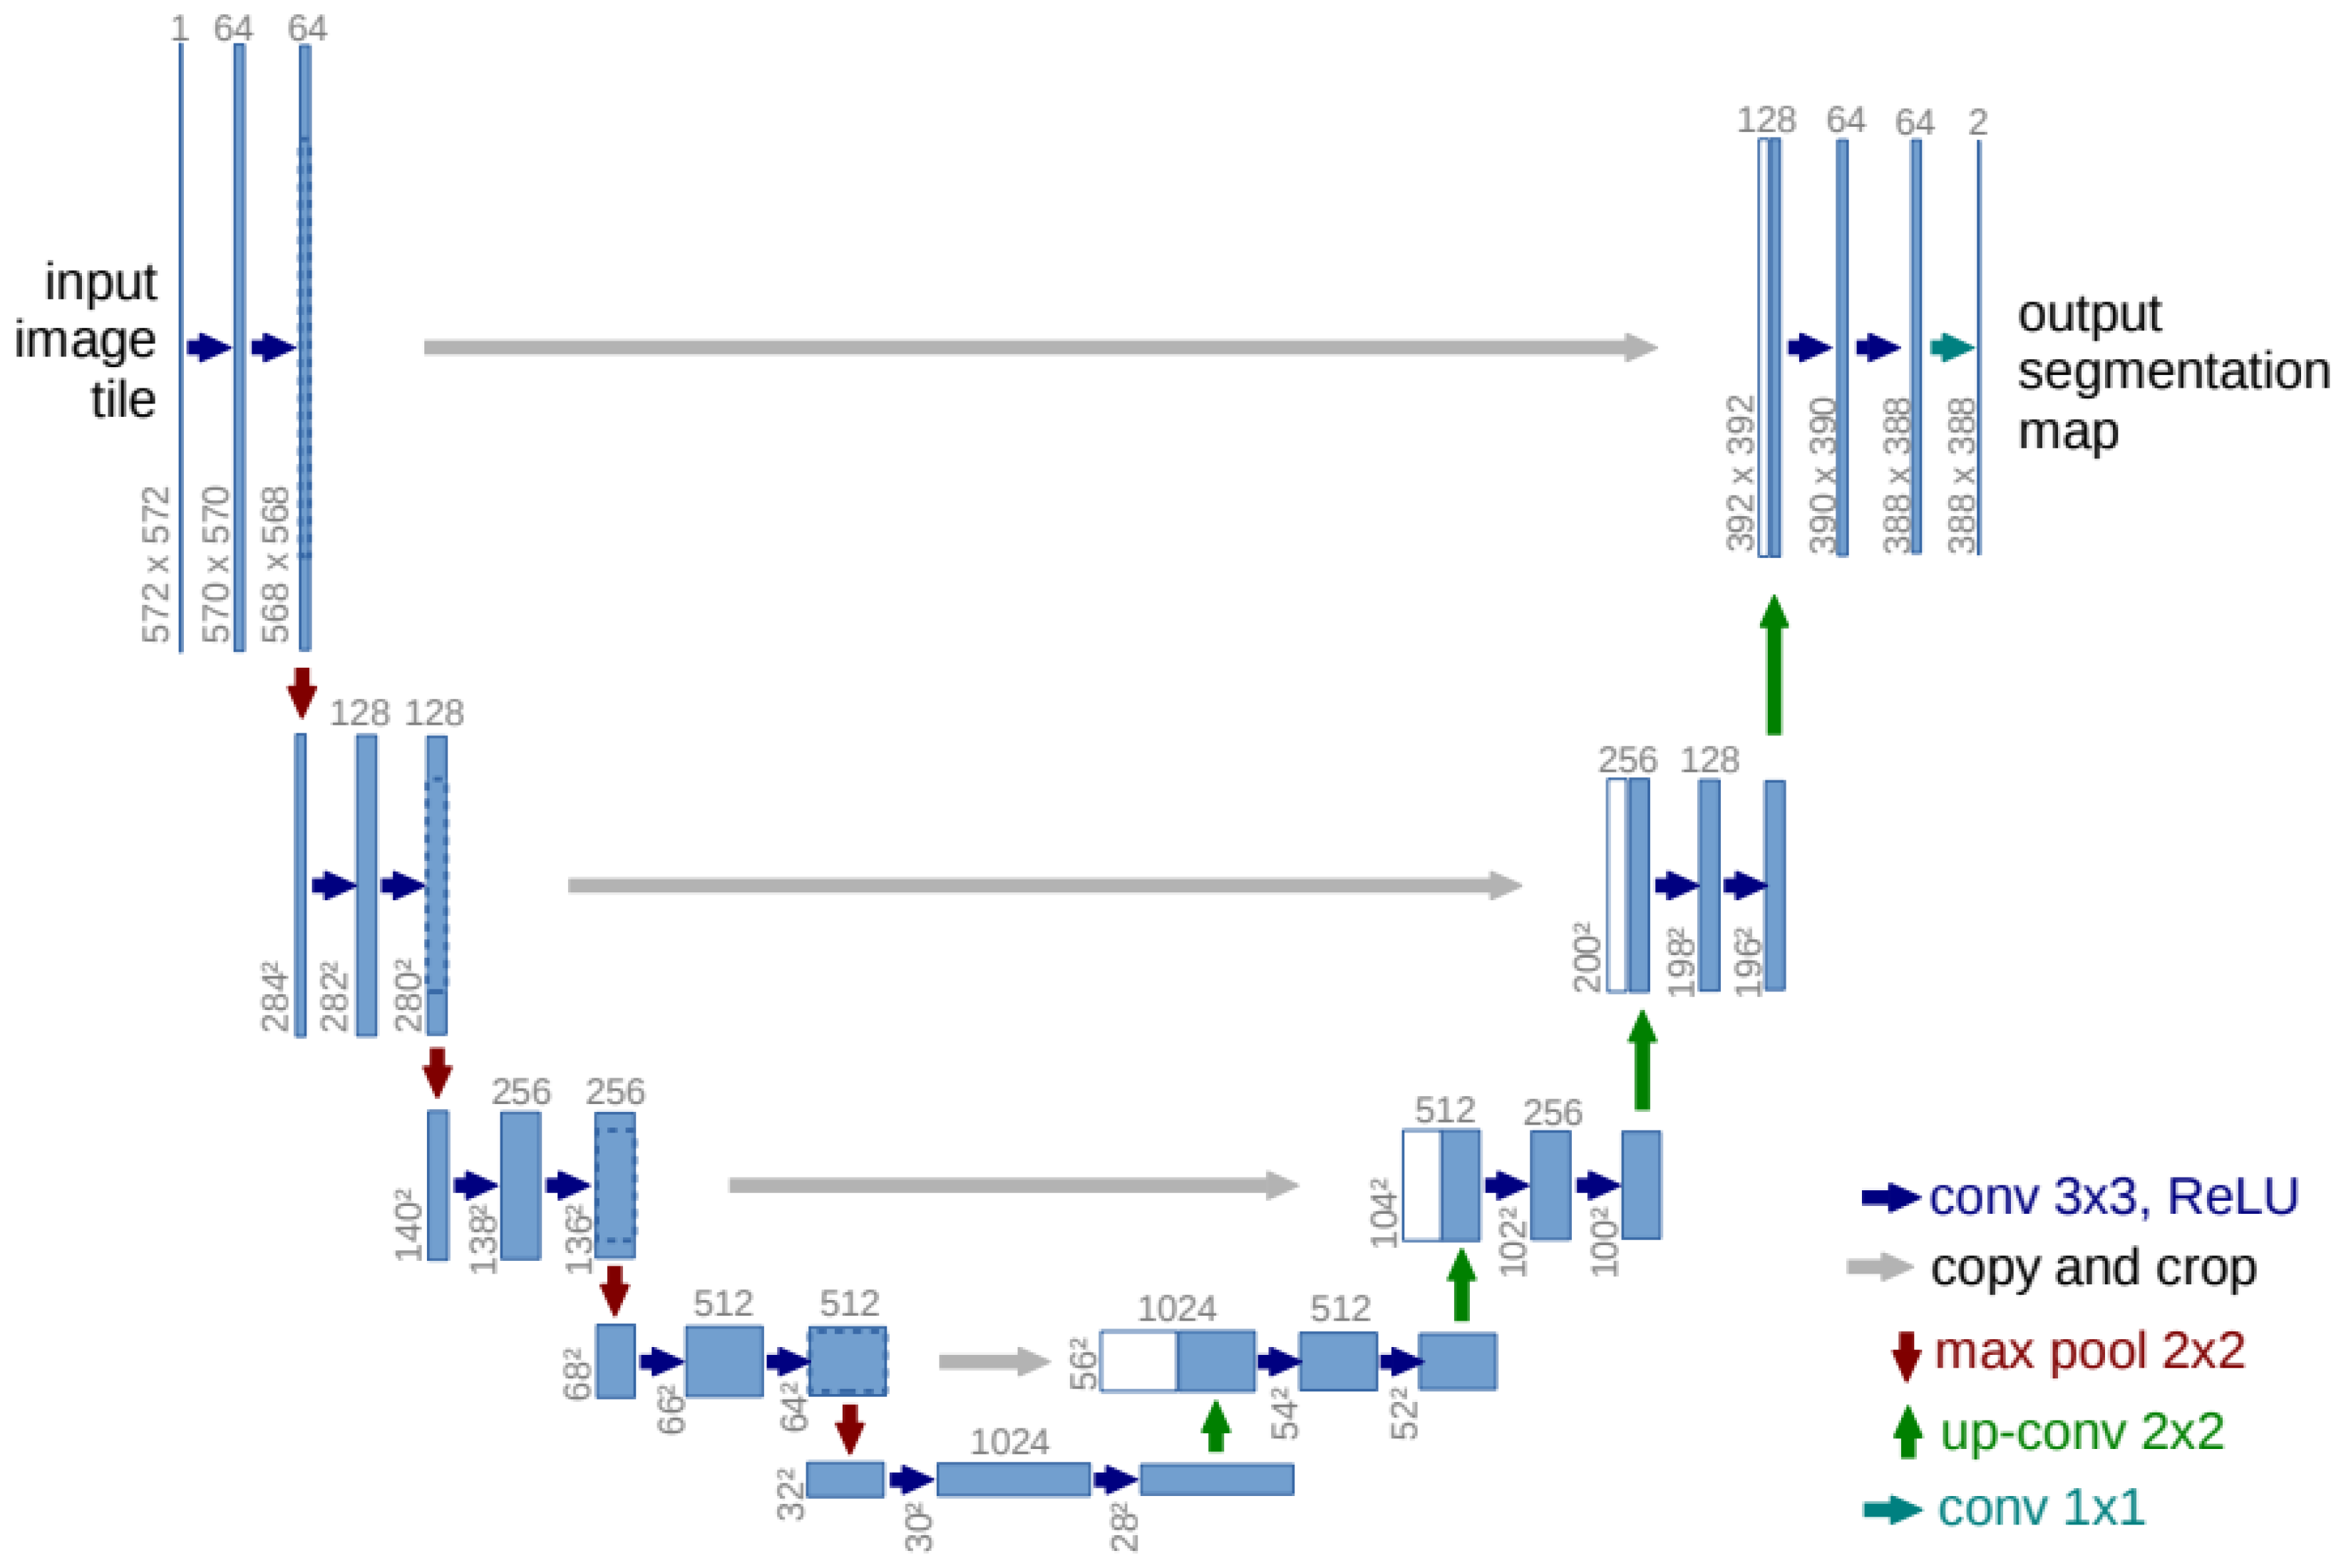
The UNET architecture is based on the work of [
17], who proposed an architecture that is shown in
Figure 1. UNet is a convolutional neural network architecture specifically designed for image segmentation tasks. UNet consists of two stages: the encoder and the decoder. In the encoder, features are extracted at different levels of abstraction. The spatial resolution of the dataset images is reduced to obtain more general and semantic features. It uses convolutional layers, ReLU as the activation function, and pooling.
In the decoder, the output of each layer is related to the output of the encoder, allowing the decoder to combine spatial details with semantic information. The spatial resolution increases at each layer through bilinear upsampling. The features in the decoder are concatenated with the corresponding features of the encoder at the same resolution level. This enables the decoder to recover the local details that were lost in the encoder and improves the segmentation accuracy.
2.2. Vision Transformer
The Vision Transformer (ViT) is a model that adapts the Transformer architecture, originally designed for text sequences, to computer vision tasks such as image classification. Instead of using convolutions (as in CNNs), the ViT processes images by dividing them into small blocks called patches and treating them as a sequence [
18].
Referring to [
19,
20,
21], the model follows the following steps:
2.2.1. Image Processing
The images are represented as a pixel matrix of size H × W with C channels (for example, an RGB image has = 3).
These images are divided into blocks of size P × P called patches. The total number of patches is
Each patch is flattened into a vector of length P × P × C and projected to a fixed dimension D (embedding dimension). This processing transforms an input image into a sequence of N vectors, where each vector represents a patch.
2.2.2. Patch Embedding
Patches are mapped to an embedding space using a dense layer (or convolution with a stride equal to the patch size). This turns each patch into a vector of size DD.
Positional Encoding
Token [CLS]
The final input to the Transformer is an array of size
where N is the number of patches and D is the dimension of the embedding.
2.2.3. Transformer Blocks
The Transformer blocks process the sequence of embeddings using two main components:
Each vector in the sequence interacts with all the others using the attention mechanism.
This allows the model to learn the global relationships between patches.
For each input vector, the matrices Q (Query), K (Key), and V (Value) are calculated:
where WQ, WK, and WV are matrices that can be learned.
Attention is calculated as follows:
In multi-head attention, multiple attentions are calculated in parallel and combined:
- 2.
Feedforward Network
Each vector in the sequence passes through a fully connected neural network with two layers:
- 3.
Normalization and Residual
Residual connections and layer-wise normalization are used to stabilize training and improve convergence.
A Transformer block contains the following: 1. a multi-head attention layer; 2. a feedforward network; and 3. normalization and residual connections.
ViT applies multiple Transformer blocks sequentially to refine the patch representations.
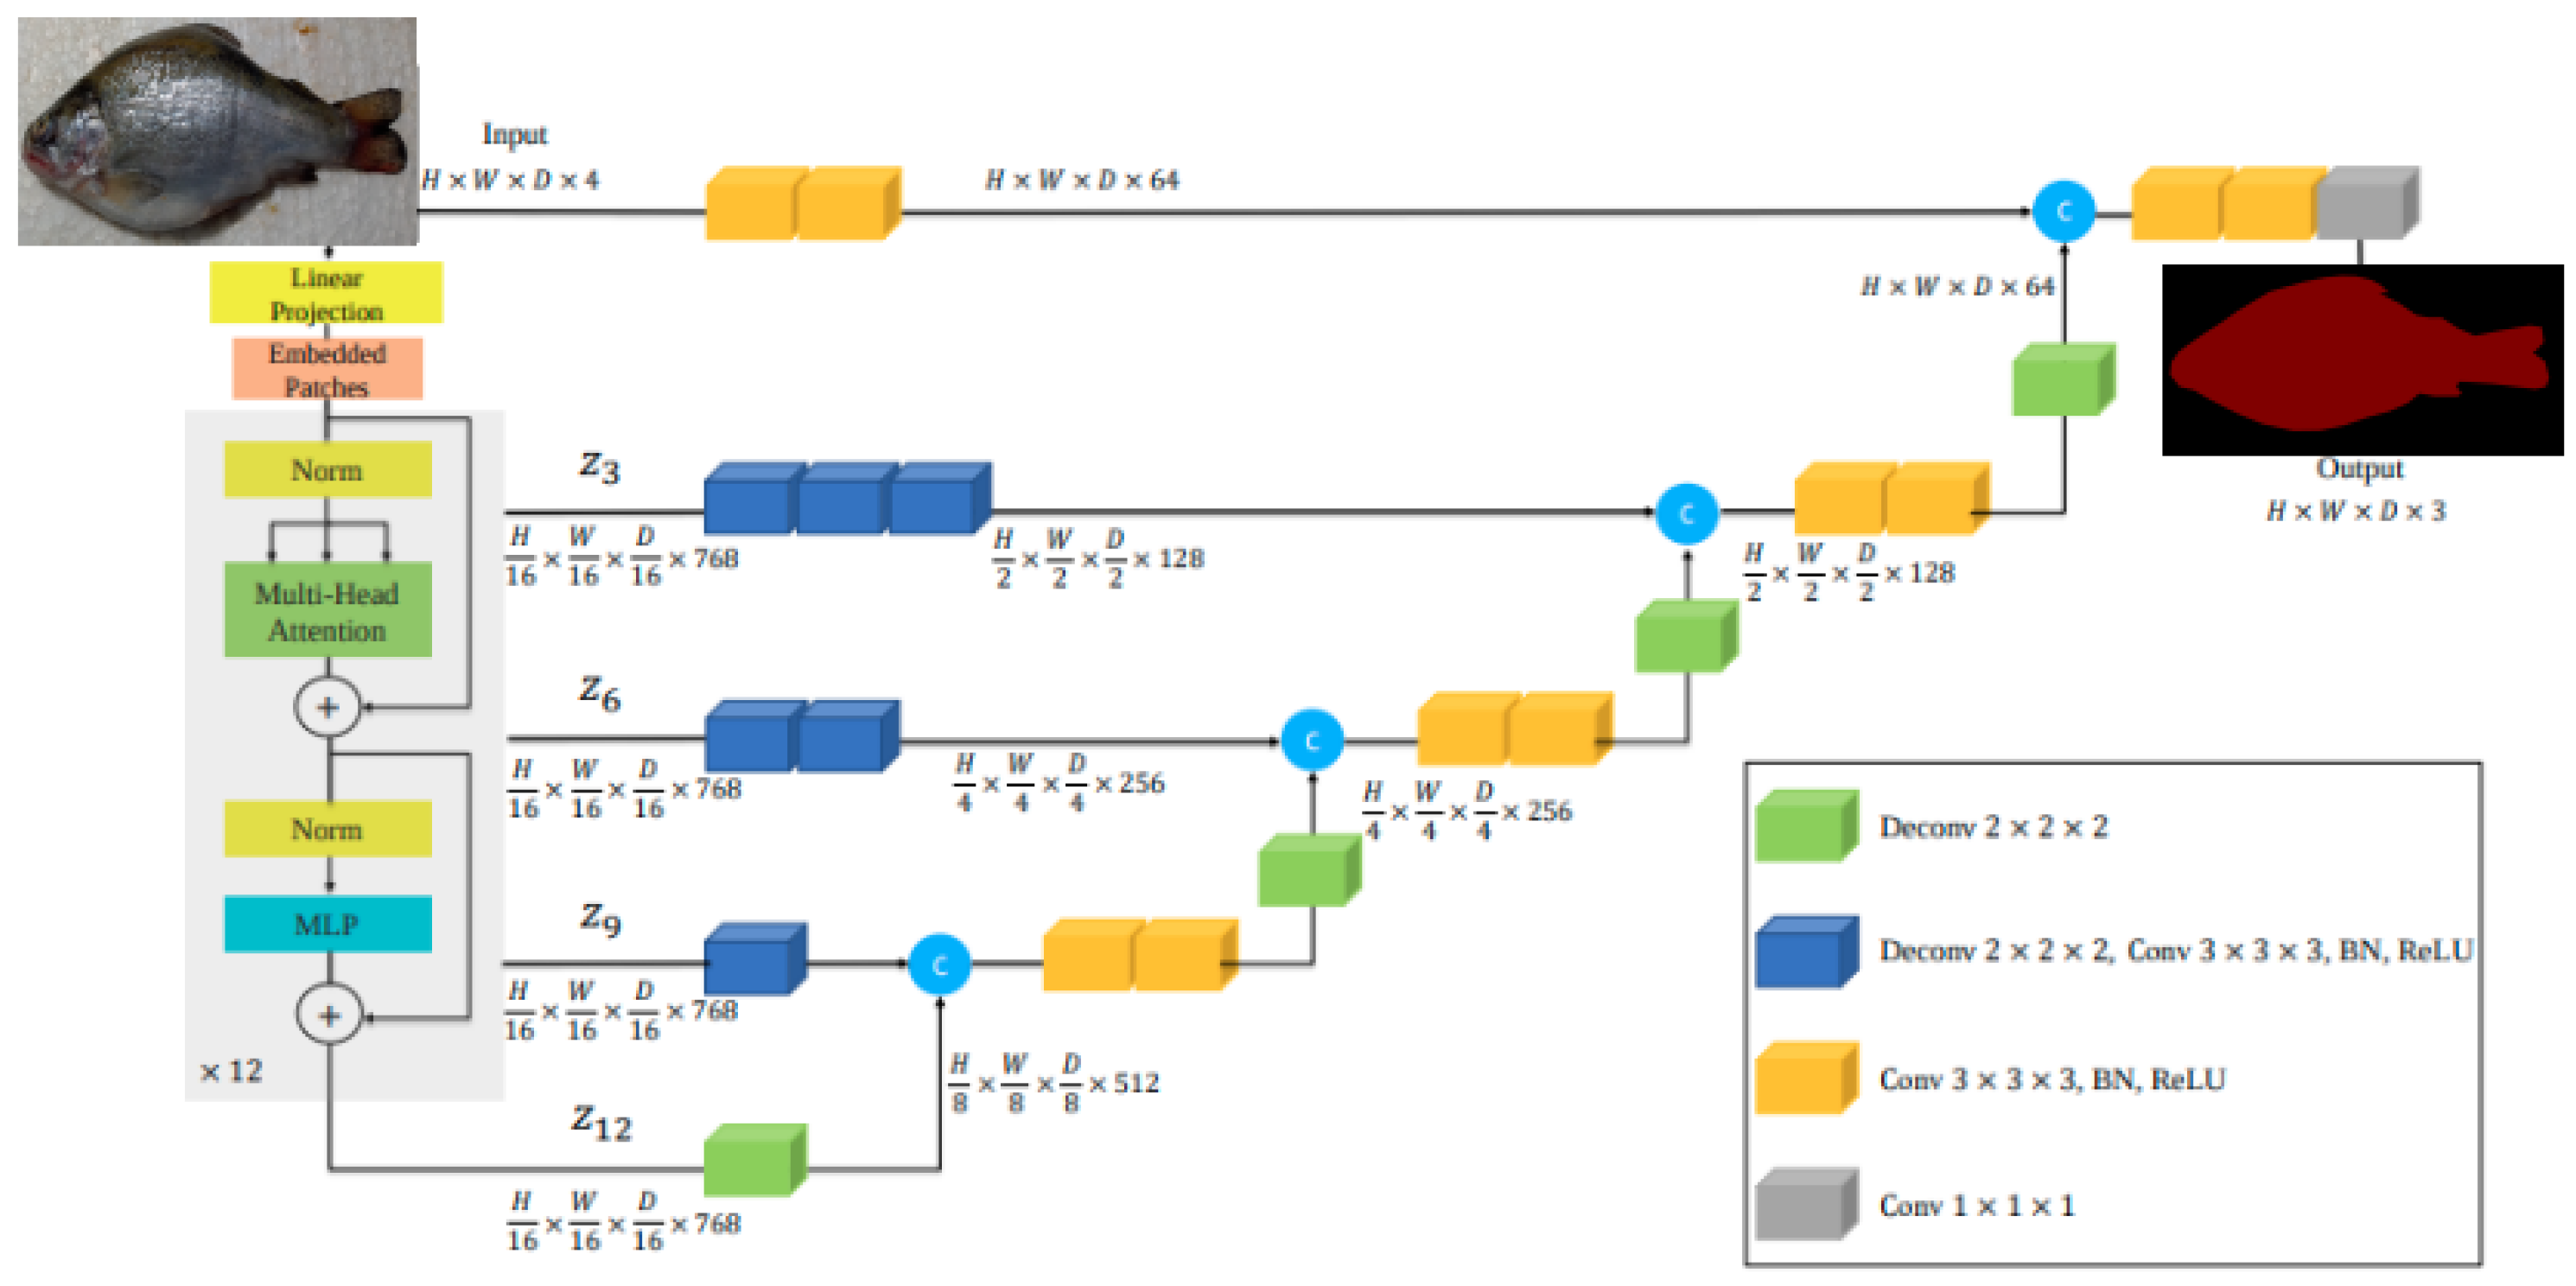
2.3. UNETR
According to [
18], UNETR introduced a novel architecture that uses a Transformer as the encoder. The architecture UNETR used by [
18] is shown in
Figure 3. This innovative approach enables the learning of sequence representations from the input volume, effectively capturing global multiscale information. The Transformer encoder is directly connected to a decoder through skip connections at various resolutions, facilitating the computation of the final semantic segmentation output.
In essence, the fundamental distinction between UNET and UNETR lies in their encoder mechanisms. UNET relies on a convolutional encoder, which excels at capturing local spatial hierarchies through successive downsampling and feature extraction. In contrast, UNETR uses a Transformer-based encoder, enabling it to model global dependencies and long-range interactions throughout the input image by treating it as a sequence of patches. This architectural shift allows UNETR to potentially capture more abstract and contextually rich representations, particularly advantageous in scenarios where global context is crucial.
3. Methodology
In this study, we used well-established deep learning architectures, namely UNET and UNETR, to address the challenge of semantic segmentation in rainbow trout images. This section details the methodology used to apply and evaluate these architectures in our specific aquaculture context.
3.1. Oncorhynchus mykiss (Rainbow Trout)
There are several varieties of trout, including brook trout, land-locked salmon, brown trout, and rainbow trout. The variety grown in Puno, Peru, is rainbow trout (
Oncorhynchus mykiss) [
22]. The first rainbow trout were introduced around 1941 or 1942 to the Chucuito fish farm near Puno, Peru, likely from the United States [
23]. Trout farming in the water bodies of the Puno region consists of artisanal floating cages made of wood or metal–nylon [
24]. Lake Titicaca produces more than 80% of Peru’s rainbow trout, with more than 800 farms relying on imported eggs [
25].
3.2. Semantic Segmentation
Semantic segmentation involves assigning a label to each pixel in an image [
26]. Unlike object detection models, which result in a bounding box around the detected object, semantic segmentation systems aim to delineate objects from different categories at the pixel level, producing an arbitrary shape.
3.3. Dataset
The dataset employed in this study, influenced by the investigations of [
27,
28], comprises 1200 high-resolution images (3120 × 4160 pixels) of trout, obtained from fish farms situated in Desaguadero. This collection encompasses complete depictions of the trout, alongside specific details of their gills and eyes, facilitating an in-depth examination of the morphological characteristics of the fish. The images were captured with the trout positioned horizontally, occasionally orienting towards the left and right.
To ensure measurement accuracy, a reference coin was included in many of the images. This addition allows for effective calibration during the analysis process, facilitating dimensional comparisons within the images.
The labeling process was carried out using the LabelMe tool [
29], which allowed the generation of detailed masks that accurately delineated the regions of interest in each image. These masks are essential for segmentation [
30], as they clearly define the specific areas to be analyzed.
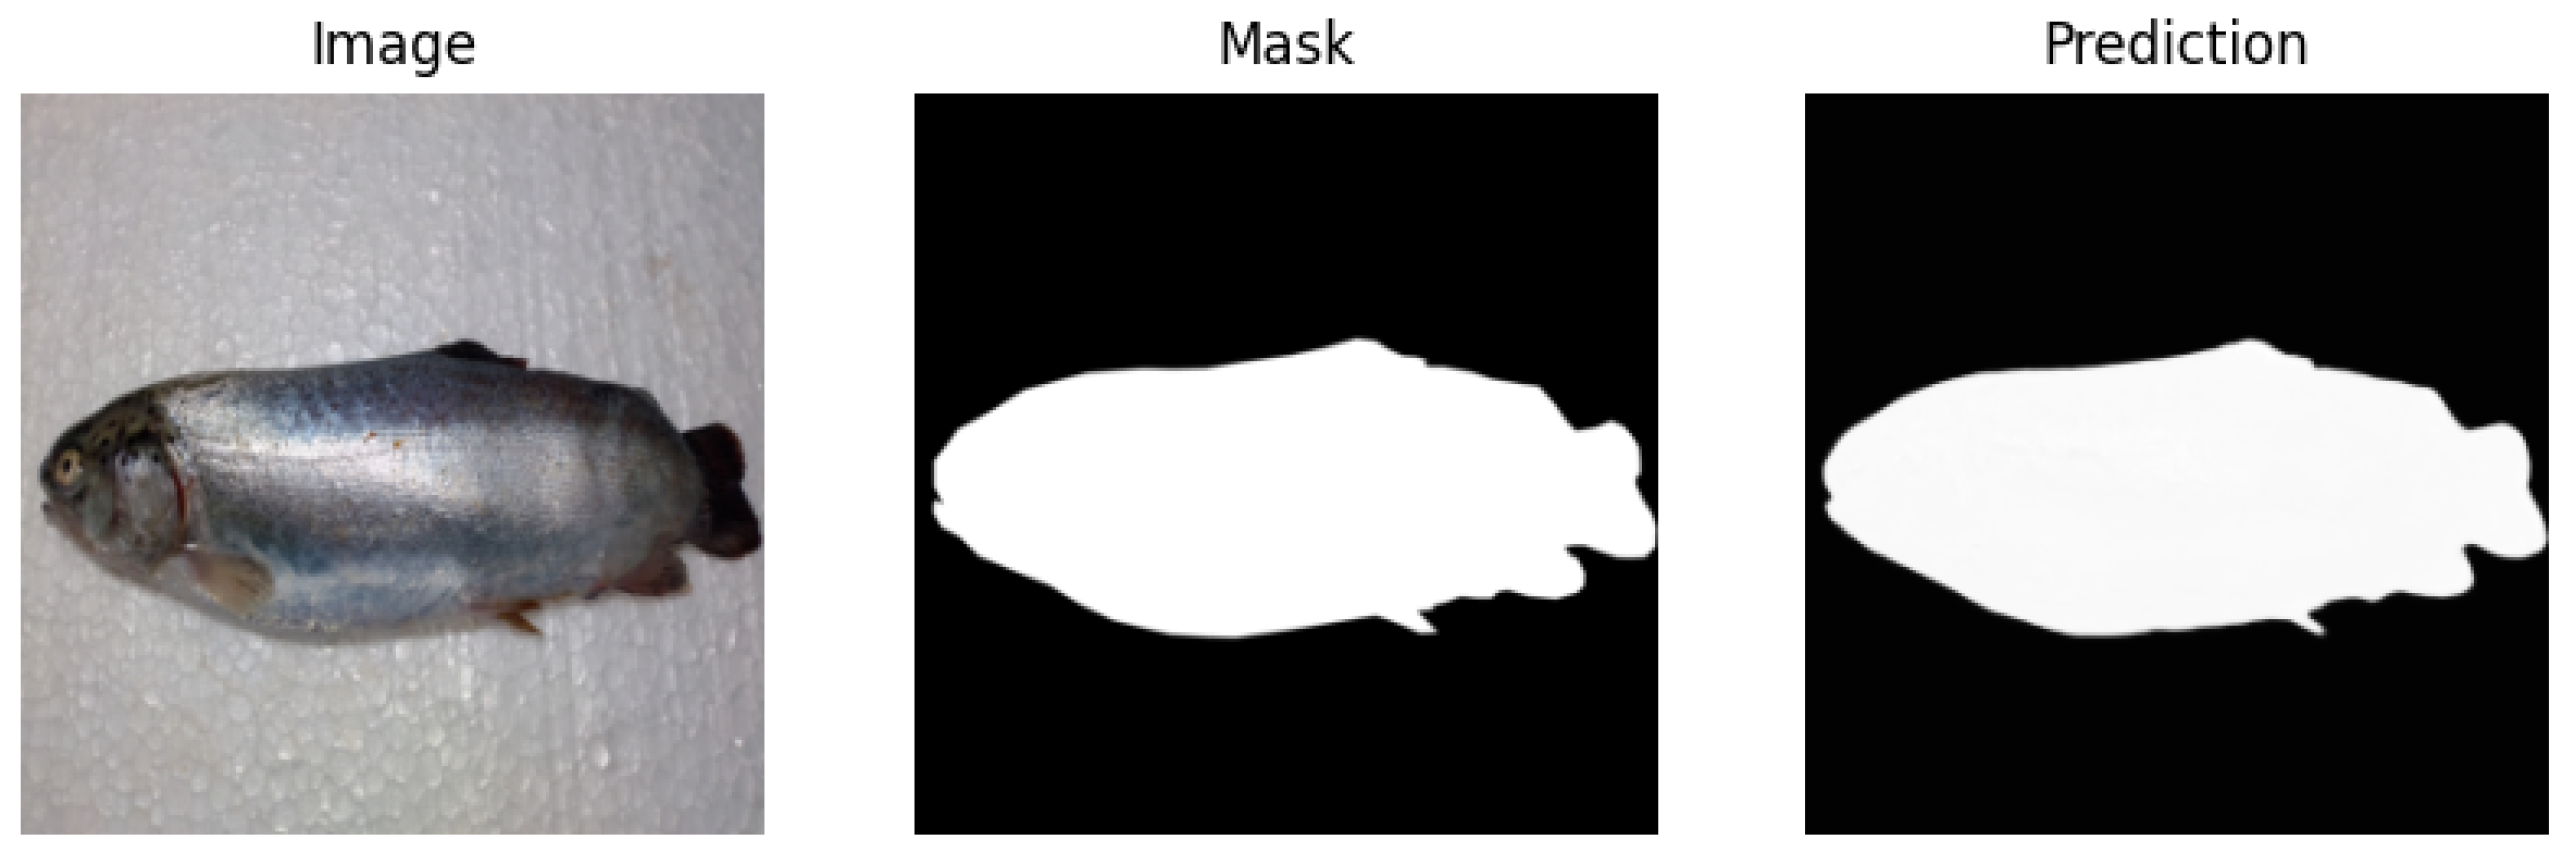
The dataset was divided into training subsets (900 images), validation subsets (100 images), and test subsets (45 images). This partitioning strategy was used to enable effective model training and evaluation. The training set facilitated parameter optimization, the validation set aided in hyperparameter tuning and overfitting prevention, and the test set provided an unbiased assessment of the model’s performance.
The percentage of trout in the dataset contributes to its richness and diversity, which presents a realistic challenge to segmentation algorithms. Furthermore, the high quality of the labels associated with the images makes this dataset a valuable resource for the development and evaluation of image segmentation techniques in the field of aquaculture. This dataset not only provides a solid foundation for research in image segmentation but can also serve as a reference for future semantic segmentation that involves assigning studies on the monitoring and management of aquaculture populations.
An example of an image and its corresponding mask is shown in
Figure 4.
3.4. Metrics—Intersection over Union
The Intersection over Union (IoU) [
31], also known as the Jaccard index, is a metric used in the field of computer vision to evaluate the precision of object detection and image segmentation. Measures the degree of overlap between two areas: the prediction and the reference (ground truth). IoU is represented in Equation (
7), where A and B are the areas of the two sets (prediction and ground truth).
A diagram with the proposed methodology is shown in
Figure 5.
4. Experimental Results
For the development of the experimental work, a Lenovo Legion laptop equipped with a NVIDIA GeForce 3020 graphics card was utilized. The operating system used was Linux Mint 21.1, providing a stable and efficient environment for data processing.
The programming language used was Python 3.12, complemented by various specialized libraries, including PyTorch 1.12, Matplotlib 3.6.2, and OpenCV 4.6.0. PyTorch was essential for the implementation of deep learning algorithms, while Matplotlib and OpenCV facilitated image visualization and processing, respectively.
Furthermore, NeptuneAI was utilized as a repository to store and track metrics obtained during experimental development. Finally, GitHub wit git 2.43 was used as the platform for code management and collaboration in the project.
4.1. Experimental Results 1
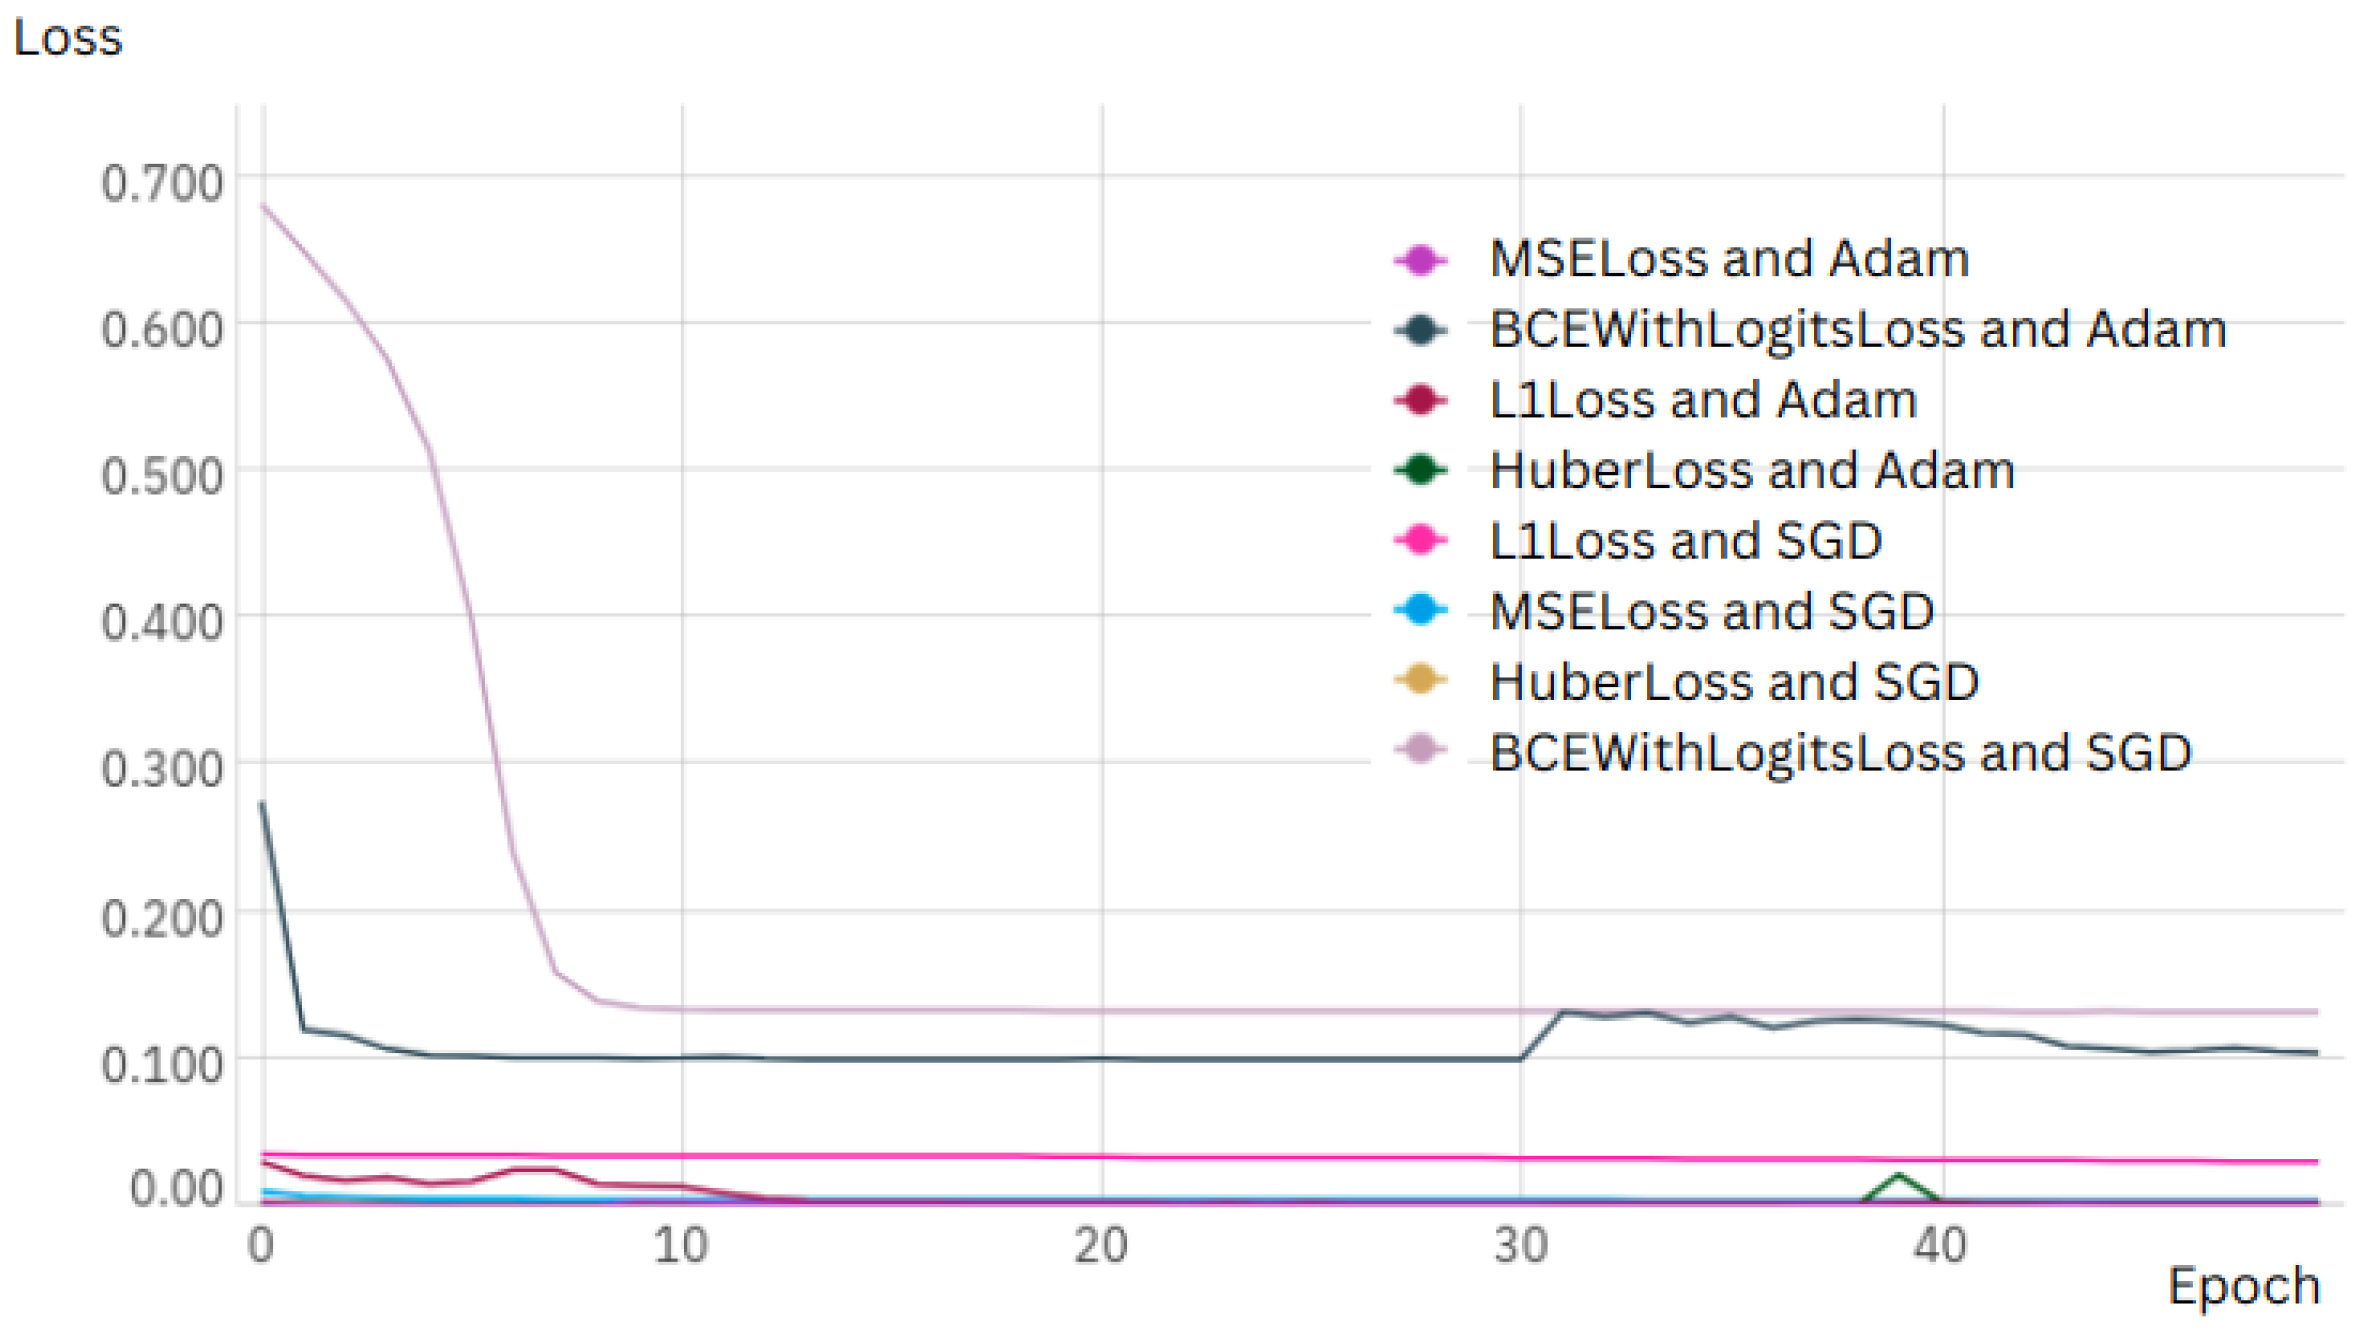
In the first set of experimental results, the UNET architecture was implemented and several loss functions were employed, including binary cross-entropy with logit loss (BCEWithLogitsLoss), mean squared error loss (MSELoss), Huber loss, and L1 loss. Regarding the optimizers, the stochastic gradient descent (SGD) algorithm and the ADAM algorithm were chosen, both known for their efficiency in adjusting model parameters. Data augmentation was used with random horizontal and vertical flips of the images.
Before the training phase, the input images were resized to 256 × 256 pixels, necessitating an adaptation of the UNET architecture to accommodate these new dimensions. The primary objective of this set of experimental results was to analyze the performance of the UNET architecture under different training configurations, specifically evaluating its behavior when performing 5, 10, 20, and 50 epochs of training.
Adjustments were made to the loss functions and optimizers to determine their impact on the model’s performance.
For the evaluation of the results, the Intersection over Union metric was used in the test dataset. The results obtained from this first set of experimental results are presented in
Table 1.
The loss function curve for every sample of 50 epoch is shown in
Figure 6.
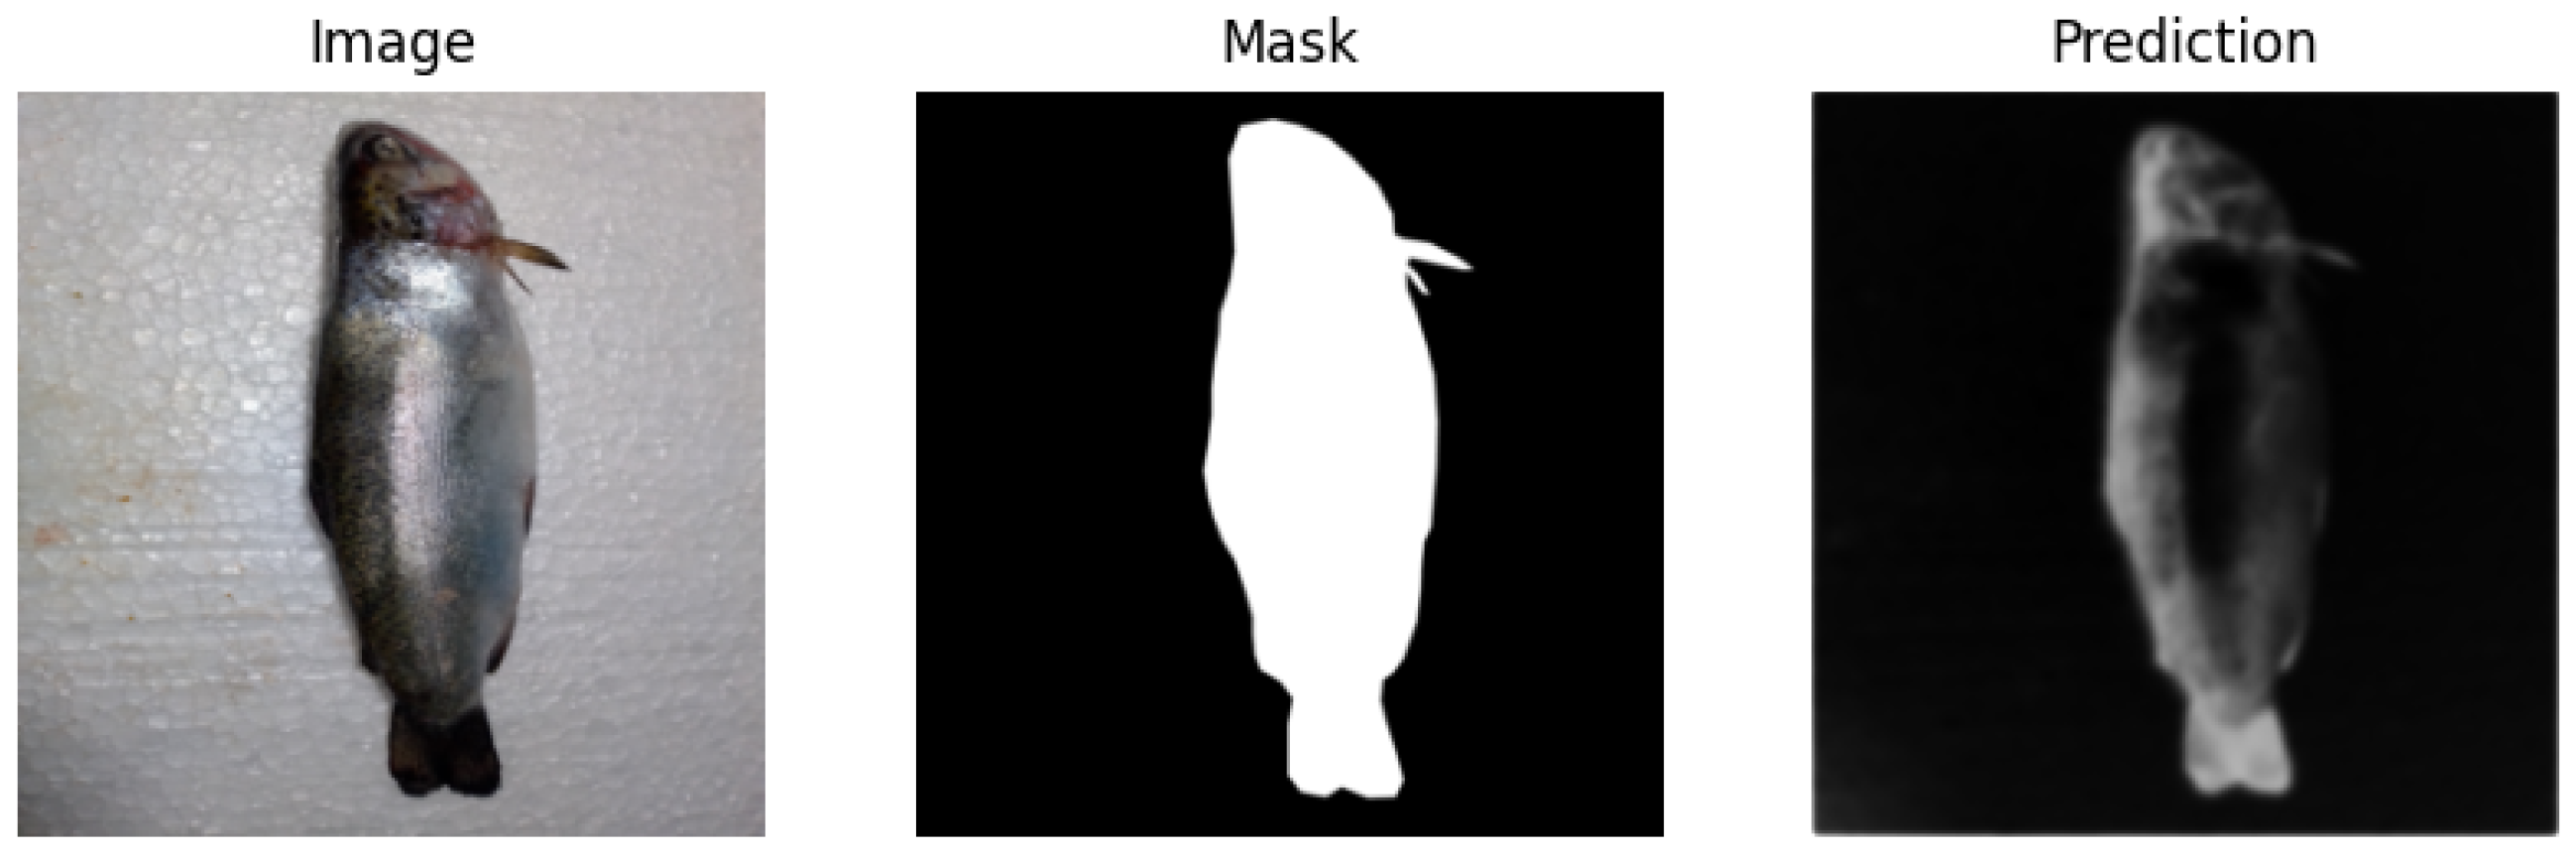
An example of a segmented image is shown in
Figure 7.
4.2. Experimental Results
In the second set of experimental results, the same loss functions and optimizers used in the first set were maintained, namely, binary cross entropy with logits loss (BCEWithLogitsLoss), mean squared error loss (MSELoss), Huber loss, and L1 loss, as well as the optimizers Stochastic Gradient Descent (SGD) and ADAM. This decision was made with the aim of consistently evaluating the performance of the UNET architecture under controlled conditions.
For this set of experimental results, a dataset with higher-resolution images (512 × 512 pixels) was used. This increase in spatial resolution is critical because it enables the capture of more details in the input images.
The results obtained from this second set of experimental results are presented in
Table 2.
The loss function curve for every sample of 50 epoch is shown in
Figure 8.
An example of a segmented image is shown in
Figure 9.
4.3. Experimental Results 3
In the third set of experimental results, the performance of various combinations of loss functions and optimizers was evaluated on an adapted UNETR architecture. UNETR, a Transformer-based neural network designed for computer vision tasks such as segmentation, was only used with input images of 256 × 256 due to hardware limitations on the GPU.
For this set of experimental results, four commonly used loss functions were selected: binary cross-entropy with logit loss (BCEWithLogitLoss), mean squared error loss (MSELoss), Huber loss, and L1 loss. These functions, in combination with the optimizers SGD and Adam, were evaluated using the same number of epochs as in previous sets of experimental results.
To adapt the output of the UNETR model to the specific characteristics of each loss function, the necessary modifications were made to the output layer of the network. In this way, stable and efficient training of the model was ensured.
The results obtained from this second experiment are presented in
Table 3.
The loss function curve for every sample of 50 epochs is shown in
Figure 10.
An example of a segmented image is shown in
Figure 11.
5. Fish Measurement
To obtain the dimensions of the segmented fish, a coin was used as a scale reference. This approach allowed for the quantification of the pixel size in terms of physical measurements, thus facilitating the precise calculation of the dimensions of the fish.
The measurement process was carried out using the OpenCV library, which provided the necessary tools to delimit the segmented fish area. Through this library, the distances along the length and width of the segmented image were detected. Specifically, the contours of the fish were identified, and the corresponding measurements were calculated on the basis of the scale established by the coin.
The methodology included converting the pixel coordinates to physical units using the scale relationship obtained from the coin as a reference. This procedure ensures that the measurements are accurate and representative of the actual size of the fish.
To validate the accuracy of our measurement process, we conducted a comparative analysis between the dimensions obtained from the segmented images and those measured directly from real images, both using the coin as a common scale reference. This comparison allowed us to assess the reliability of our segmentation and conversion methodology. We found a high degree of correlation between the measurements obtained from the segmented images and the real images, confirming the effectiveness of using the coin as a reliable scale reference and the precision of our image processing pipeline.
The segmentation and measurement process is illustrated in
Figure 12, where the key steps are shown in delimiting the segmented area and calculating the dimensions. This information is crucial for morphological analysis and the implementation of management strategies in aquaculture, as it allows a detailed evaluation of fish growth and development.
6. Discussions
The results obtained in this study provide valuable information about the performance of different segmentation architectures in the context of fish image analysis.
Experiment 1, which used the UNET architecture with images resized to 256 × 256 pixels, demonstrated remarkable precision, achieving an IoU of 0.942854 after 20 training epochs. This superior performance, achieved with MSELoss and the Adam optimizer, suggests that for this resolution and dataset size, UNET offers a highly efficient and accurate solution. Rapid convergence and high IoU indicate that this configuration is particularly well-suited for applications where accuracy and computational efficiency are critical.
In contrast, Experiment 2, which employed higher-resolution images (512 × 512 pixels), showed a decrease in IoU to 0.803244, although it required 50 training epochs using L1Loss and Adam. This reduction in performance, despite the increase in resolution, can be attributed to the inherent complexity of processing higher-resolution images. Although the result remains satisfactory, it underscores the importance of considering the trade-off between image resolution and model processing capacity.
Experiment 3, which explored the UNETR architecture with 256 × 256 pixel input images, revealed slightly lower performance compared to the UNET models. This observation aligns with the literature, which indicates that Transformer-based models, such as UNETR, require large datasets to reach their full potential. The limited dataset size in this study likely prevented UNETR from learning robust and generalizable representations. This result highlights the necessity of considering data availability when selecting a segmentation architecture, especially for models that rely on attention and transformation.
A crucial aspect of this study was the use of a coin as a reference scale, allowing precise measurements of the dimensions of the segmented fish. The implementation of OpenCV for contour detection and conversion of pixel coordinates to length units proved to be effective. This methodology is fundamental for morphological analysis and aquaculture management strategies, as it facilitates detailed monitoring of fish growth and development.
In summary, the choice of architecture and image resolution must be aligned with the specific application requirements and dataset limitations. For practical applications with datasets similar in size to the one used in this study, the UNET architecture with 256 × 256 pixel images (Experiment 1) offers the best balance of accuracy and computational efficiency. Although UNETR represents the state-of-the-art in many contexts, its performance in this study suggests that the size of the dataset is a key limiting factor. Future work could explore the performance of UNETR with larger datasets or data augmentation techniques to overcome this limitation.
7. Conclusions
This research investigates the application of advanced semantic image segmentation techniques, using both convolutional neural networks (CNNs) with the UNET architecture and Transformer-based models with UNETR, to accurately analyze and measure the dimensions of rainbow trout reared in aquaculture facilities in Puno, Peru. Three experiments were conducted to evaluate the performance of these models under varying conditions, including image resolution, loss function configurations, optimizer settings, and training epochs.
A key finding of this study is the significant influence of image resolution on segmentation accuracy. The increase in resolution in the second experiment, using the UNET architecture, demonstrated a clear improvement in the capture of finer details of the fish, leading to more precise size estimations. However, it was also observed that the number of training epochs exerts a considerable impact on segmentation quality, and a higher number of epochs generally leads to improved results.
The integration of UNETR, a Transformer-based model, into the third experiment provided valuable information on the application of this novel architecture to aquaculture image analysis. Although UNETR showed promise, its initial performance in this dataset may have been limited by the relatively small sample size. Transformer models typically require larger datasets to fully exploit their potential for learning robust and generalizable representations.
To comprehensively assess the robustness and adaptability of the models, four distinct loss functions (MSELoss, L1Loss, CrossEntropyLoss, and DiceLoss) were employed across the experiments. This methodological choice allowed for a thorough understanding of how different loss functions influence segmentation accuracy under varying experimental conditions. By evaluating performance across these diverse metrics, we gained insights into the strengths and weaknesses of the models, enabling a more nuanced understanding of their suitability for real-world aquaculture applications. This comparative analysis not only enhances the reliability of our findings, but also provides a framework for future studies seeking to optimize model performance through targeted loss function selection.
A crucial aspect of this study was the incorporation of a coin as a scale reference, allowing precise and accurate measurements of fish dimensions. This non-invasive approach significantly improves the value of semantic segmentation as a tool to monitor and manage fish farms. By automating the measurement process, this technology can significantly reduce reliance on manual methods, optimize the evaluation of fish growth and development, and ultimately improve operational efficiency and sustainability within the aquaculture sector.
Future studies should explore the performance of UNETR with larger datasets, investigate the impact of data augmentation techniques on model performance, and evaluate the effectiveness of other Transformer-based architectures and hybrid models that combine the strengths of CNNs and Transformers. Furthermore, the application of these techniques to other species and environments of aquaculture can further broaden the impact of image segmentation in advancing sustainable aquaculture practices.
Author Contributions
J.C., C.R. and F.P.; methodology, L.B., R.C. and E.A.; software, C.R., R.C. and F.P.; validation, J.C., L.B. and E.A.; formal analysis, E.A., C.R. and F.P.; investigation, J.C., C.R. and F.P.; resources, L.B., R.C., E.A. and C.R.; data curation, J.C., L.B. and F.P.; writing—original draft preparation, J.C., R.C. and F.P.; writing—review and editing, J.C., L.B. and F.P.; visualization, J.C., R.C. and F.P.; supervision, J.C., R.C. and F.P.; project administration, J.C., E.A. and F.P.; funding acquisition, E.A. and L.B. All authors have read and agreed to the published version of the manuscript.
Funding
This research was funded by Universidad Nacional del Altiplano—FEDU.
Institutional Review Board Statement
Ethical review and approval were waived for this study. The fish used in this research were purchased postmortem from a public market. Therefore, no live animal experimentation or intervention was conducted, and the study focused solely on image analysis of deceased specimens.
Informed Consent Statement
Not applicable. This study did not involve human participants. The fish used in this research were purchased from a public market, and therefore informed consent was not required.
Data Availability Statement
The data used in this study are part of an ongoing thesis project and are currently not publicly available. Data will be made publicly available upon completion and defense of the thesis. Requests for access to the data can be directed to the corresponding author in the interim.
Acknowledgments
Thanks to the Vice Rectorate of Research of the National Universidad Nacional del Altiplano for the support in the development of the research.
Conflicts of Interest
The authors declare no conflicts of interest.
Abbreviations
The following abbreviations are used in this manuscript:
| FAO | Food and Agriculture Organization |
| IoU | Intersection over Union |
| ReLU | Rectified linear unit |
| CNN | Cconvolutional neural networks |
| UNETR | U Network |
| UNET | UNet Transformer |
| RGB | Red, green, blue |
| ViT | Vision Transformer |
| SGD | Stochastic Gradient Descent |
| GPU | Graphics Processing Unit |
References
- FAO. The State of World Fisheries and Aquaculture 2022: Towards Blue Transformation; FAO: Rome, Italy, 2022. [Google Scholar] [CrossRef]
- Verdegem, M.; Buschmann, A.H.; Latt, U.W.; Dalsgaard, A.J.; Lovatelli, A. The contribution of aquaculture systems to global aquaculture production. J. World Aquac. Soc. 2023, 54, 206–250. [Google Scholar] [CrossRef]
- Dash, G.; Sen, S.; Pradhan, R.K.; Ghosh, S.; Josileen, J.; Jayasankar, J. Modeling framework for establishing the power law between length and weight of fishes and a meta-analysis for validation of LWRS for six commercially important marine fishes from the northwestern Bay of Bengal. Fish. Res. 2023, 257, 106496. [Google Scholar] [CrossRef]
- Chandran, R.; Singh, R.K.; Singh, A.; Ganesan, K.; Thangappan, A.K.; Lal, K.K.; Mohindra, V. Evaluating the influence of environmental variables on the length-weight relationship and prediction modelling in flathead grey mullet, Mugil cephalus Linnaeus, 1758. PeerJ 2023, 11, e14884. [Google Scholar] [CrossRef] [PubMed]
- Dikou, A. Weight–length relationship in fish populations reflects environmental regulation on growth. Hydrobiologia 2023, 850, 335–346. [Google Scholar] [CrossRef]
- Burger, W.; Burge, M.J. Digital Image Processing: An Algorithmic Introduction; Springer Nature: Cham, Switzerland, 2022. [Google Scholar] [CrossRef]
- Minaee, S.; Boykov, Y.; Porikli, F.; Plaza, A.; Kehtarnavaz, N.; Terzopoulos, D. Image segmentation using deep learning: A survey. IEEE Trans. Pattern Anal. Mach. Intell. 2022, 44, 3523–3542. [Google Scholar] [CrossRef]
- Fernandes, A.F.A.; Dórea, J.R.R.; Magalhães Rosa, G.J. Image analysis and computer vision applications in animal sciences: An overview. Front. Vet. Sci. 2020, 7, 551269. [Google Scholar] [CrossRef]
- Mathis, M.W.; Mathis, A. Deep learning tools for the measurement of animal behavior in neuroscience. Curr. Opin. Neurobiol. 2020, 60, 1–11. [Google Scholar] [CrossRef]
- Okinda, C.; Nyalala, I.; Korohou, T.; Okinda, C.; Wang, J.; Achieng, T.; Wamalwa, P.; Mang, T.; Shen, M. A review on computer vision systems in monitoring of poultry: A welfare perspective. Artif. Intell. Agric. 2020, 4, 184–208. [Google Scholar] [CrossRef]
- Li, G.; Huang, Y.; Chen, Z.; Chesser, G.D., Jr.; Purswell, J.L.; Linhoss, J.; Zhao, Y. Practices and applications of convolutional neural network-based computer vision systems in animal farming: A review. Sensors 2021, 21, 1492. [Google Scholar] [CrossRef]
- Lind, N.M.; Vinther, M.; Hemmingsen, R.P.; Hansen, A.K. Validation of a digital video tracking system for recording pig locomotor behaviour. J. Neurosci. Methods 2005, 143, 123–132. [Google Scholar] [CrossRef]
- Arganda-Carreras, I.; Turaga, S.C.; Berger, D.R.; Cireşan, D.; Giusti, A.; Gambardella, L.M.; Schmidhuber, J.; Laptev, D.; Dwivedi, S.; Buhmann, J.M.; et al. Crowdsourcing the creation of image segmentation algorithms for connectomics. Front. Neuroanat. 2015, 9, 142. [Google Scholar] [CrossRef] [PubMed]
- Saidi, A.; Cavallo, C.; Puleo, S.; Del Giudice, T.; Cicia, G. Defining traceability attributes and consumers’ segmentation based on fish attributes: A case study in Italy and Spain. Foods 2024, 13, 2518. [Google Scholar] [CrossRef] [PubMed]
- Wang, G.; Hwang, J.-N.; Wallace, F.; Rose, C. Multi-scale fish segmentation refinement and missing shape recovery. IEEE Access 2019, 7, 52836–52845. [Google Scholar] [CrossRef]
- Fernandes, A.F.; Turra, E.M.; de Alvarenga, É.R.; Passafaro, T.L.; Lopes, F.B.; Alves, G.F.; Singh, V.; Rosa, G.J. Deep learning image segmentation for extraction of fish body measurements and prediction of body weight and carcass traits in Nile tilapia. Comput. Electron. Agric. 2020, 170, 105274. [Google Scholar] [CrossRef]
- Ronneberger, O.; Fischer, P.; Brox, T. U-Net: Convolutional Networks for Biomedical Image Segmentation. 2015. Available online: https://arxiv.org/abs/1505.04597 (accessed on 10 January 2025).
- Hatamizadeh, A.; Yin, Y.; Myronenko, A.; Xiao, Y.; Foote, D.; Lam, F.; Roth, H.; Xu, Z. UNETR: Transformers for 3D Medical Image Segmentation. arXiv 2021, arXiv:2103.10504. [Google Scholar]
- Dosovitskiy, A.; Beyer, L.; Kolesnikov, A.; Weissenborn, D.; Zhai, X.; Unterthiner, T.; Dehghani, M.; Minderer, M.; Heigold, G.; Gelly, S.; et al. An Image is Worth 16 × 16 Words: Transformers for Image Recognition at Scale. arXiv 2020, arXiv:2010.11929. [Google Scholar]
- Panboonyuen, T.; Pattanakiat, S.; Dhital, D.; Lawawirojwong, S.; Jitkajornwanich, K.; Limprasert, W. Transformer-Based Decoder Designs for Semantic Segmentation on Remotely Sensed Images. Remote Sens. 2021, 13, 5100. [Google Scholar] [CrossRef]
- Ghali, R.; Hajek, P.; Abdelkrim, A.; Forestier, G.; Fromont, E.; Adam, S.; Gancarski, P. Wildfire Segmentation Using Deep Vision Transformers. Remote Sens. 2021, 13, 3527. [Google Scholar] [CrossRef]
- Matute, G.; Barrón, E.; Morón, A.; Murillo, J.; Rivera, J.C. Truchicultura en la Región Puno. 2008. Available online: https://repositorio.esan.edu.pe/items/5d57acf1-11e5-41fc-80bd-9150eae77147 (accessed on 10 January 2025).
- Loubens, G. Observations sur les poissons de la partie bolivienne du lac Titicaca: 4: Orestias spp., Salmo gairdneri et problèmes d’aménagement. Rev. Hydrobiol. Trop. 1989, 22, 157–177. Available online: https://www.documentation.ird.fr/hor/fdi:30067 (accessed on 10 January 2025).
- Avadi, A.; Pelletier, N.; Aubin, J.; Ralite, S.; Núñez, J.; Fréon, P. Comparative environmental performance of artisanal and commercial feed use in Peruvian freshwater aquaculture. Aquaculture 2015, 435, 52–60. [Google Scholar] [CrossRef]
- Medina, M.; Fernandez-Espinel, C.; Sotil, G.; Yunis-Aguinaga, J.; Flores-Dominick, V. First description of Weissella ceti associated with mortalities in farmed rainbow trout (Oncorhynchus mykiss) in Peru. Aquaculture 2020, 529, 735608. [Google Scholar] [CrossRef]
- Long, J.; Shelhamer, E.; Darrell, T. Fully Convolutional Networks for Semantic Segmentation. 2015. Available online: https://arxiv.org/abs/1411.4038 (accessed on 10 January 2025).
- Wilson, E.; Flores, M. Classification of Fish Freshness Using a Convolutional Neural Network. 2023. Available online: https://www.researchsquare.com/article/rs-3547262/v2 (accessed on 10 January 2025).
- Pineda, F.; Cruz, J. Classification model based on deep learning with hybrid loss function for trout freshness analysis. In Proceedings of the 2023 IEEE 7th Ecuador Technical Chapters Meeting (ECTM), Ambato, Ecuador, 10–13 October 2023. [Google Scholar]
- Wada, K. Labelme: Image Polygonal Annotation with Python. 2018. Available online: https://github.com/wkentaro/labelme (accessed on 10 January 2025).
- Fu, L.; Li, S. A new semantic segmentation framework based on UNet. Sensors 2023, 23, 8123. [Google Scholar] [CrossRef]
- Rezatofighi, H.; Tsoi, N.; Gwak, J.; Sadeghian, A.; Reid, I.; Savarese, S. Generalized Intersection Over Union: A Metric and a Loss for Bounding Box Regression. In Proceedings of the 2019 IEEE/CVF Conference on Computer Vision and Pattern Recognition (CVPR), Los Alamitos, CA, USA, 15–20 June 2019; pp. 658–666. Available online: https://doi.ieeecomputersociety.org/10.1109/CVPR.2019.00075 (accessed on 10 January 2025).
| Disclaimer/Publisher’s Note: The statements, opinions and data contained in all publications are solely those of the individual author(s) and contributor(s) and not of MDPI and/or the editor(s). MDPI and/or the editor(s) disclaim responsibility for any injury to people or property resulting from any ideas, methods, instructions or products referred to in the content. |
© 2025 by the authors. Licensee MDPI, Basel, Switzerland. This article is an open access article distributed under the terms and conditions of the Creative Commons Attribution (CC BY) license (https://creativecommons.org/licenses/by/4.0/).


