Article

BEST—Building Energy-Saving Tool for Sustainable Residential Buildings

1
Interdepartmental Research Centre Territory, Building, Restoration and Environment, Sapienza University of Rome, Via A. Gramsci, 53-00197 Rome, Italy
2
ENEA—Italian National Agency for New Technologies, Energy and Sustainable Economic Development, Via Anguillarese, 301-00123 Rome, Italy
*
Author to whom correspondence should be addressed.
Appl. Sci. 2025, 15(12), 6817; https://doi.org/10.3390/app15126817
Submission received: 26 April 2025 / Revised: 30 May 2025 / Accepted: 4 June 2025 / Published: 17 June 2025

Abstract

The building and construction sector significantly impacts CO2 emissions and atmospheric pollutants, contributing to climate change. Improving energy efficiency in buildings is essential to achieving carbon neutrality by 2050, as outlined in the European Green Deal. This study presents a decision-support tool for energy retrofit interventions in existing residential buildings. The methodological approach begins with the identification and classification of common roof and wall types in the national residential building stock, segmented by construction period, followed by defining optimized, pre-calculated standardized solutions. The performance evaluations of proposed solutions resulted in a matrix designed to guide practitioners in selecting pre-calculated, efficient, and sustainable prefabricated solutions based on energy performance criteria. The tool developed from this matrix enables preliminary energy assessment, offering an overview of potential retrofit interventions. It assists designers in identifying specific cases based on construction period, building type, and climate zone, allowing for the selection of standardized solutions, energy pre-analyses, energy and cost-saving simulations, and access to detailed performance sheets. Unlike other tools requiring extensive input on opaque envelope components and thermo-physical calculations, this tool streamlines the selection process of vertical and roof closures based on construction age and building type. Additionally, the tool estimates potential economic savings and the Net Present Value (NPV) of proposed insulation solutions, identifying available incentives for the intervention.

1. Introduction

It is widely recognized that the construction sector and the entire building industry significantly contribute to global CO2 emissions and other atmospheric pollutants. Studies such as that of Alhazmi et al. highlight how the environmental performance of residential buildings, analyzed through the Life-Cycle Assessment method, confirms this concerning trend [1]. Globally, the Intergovernmental Panel on Climate Change (IPCC) attributes approximately 40% of global energy consumption and about 25% of total CO2 emissions to this sector [2], which represent a critical factor in global warming and climate change [3,4].
In Europe, the situation appears particularly critical, with a largely obsolete and inefficient building stock (over 75%), as highlighted by the European Commission. Such inefficiency necessitates structural and energy retrofitting interventions to improve environmental performance and reduce the climate impact of buildings [5]. Studies have shown that residential buildings account for more than 25% of total energy consumption within the European Union [6].
The need for immediate action is further reinforced by the objectives set by the European Green Deal, which aims to achieve climate neutrality by 2050 [7], establishing an intermediate milestone of a 55% reduction in greenhouse gas emissions by 2030 [8]. COP27, held in Sharm el-Sheikh, reaffirmed the global commitment to the goals of the Paris Agreement, emphasizing the importance of mitigation measures to avoid catastrophic climate scenarios. This vision is consistent with the international orientation toward sustainable development, reflected in the adoption of green strategies and net-zero approaches. These criteria are crucial for revitalizing the construction sector and promoting the transition to a green economy [9].
In this context, addressing the built environment—particularly by targeting the existing building stock—emerges as a strategic priority for reducing the environmental footprint of human activities [10]. This direction has been formally embraced by the United Nations through the 2030 Agenda for Sustainable Development, adopted in 2015 by all member states. The Agenda sets out 17 Sustainable Development Goals (SDGs), among which are key objectives such as ensuring access to affordable, reliable, sustainable, and modern energy for all (Goal 7); making cities and human settlements inclusive, safe, resilient, and sustainable (Goal 11); and taking urgent action to combat climate change and its impacts (Goal 13). Against this backdrop, the European Directive 2018/844 represents a legislative milestone, replacing previous regulations and requiring member states to develop long-term national strategies for the energy retrofitting of buildings. The primary objective is to reduce emissions from the building sector in the European Union by 80–85% compared to 1990 levels, promoting the transformation of existing buildings into nearly zero-energy buildings (NZEB) [11]. This vision is further supported by the recent transition to positive energy buildings (PEB), which not only meet their own energy needs but also generate a surplus of energy, as demonstrated by emerging trends in the European building landscape [12]. The urgency of such interventions is not limited to the containment of emissions but also addresses climate resilience, energy efficiency, and the improvement of urban quality of life. In this context, eco-districts function not only as experimental platforms for sustainable urban development but also as strategic instruments for emissions reduction at the neighborhood scale. By integrating renewable energy systems, low-carbon mobility, energy-efficient buildings, and circular resource management, these districts contribute to the decarbonization of urban environments [13]. Their capacity to produce measurable reductions in greenhouse gas emissions while simultaneously enhancing urban livability positions them as key components of climate action strategies [14]. A systematic approach at European and global levels, combined with innovative technologies and sustainable management models, represents the key to effectively addressing the climate crisis through the transformation of the building sector [15].
Currently, numerous studies focus on evaluating the energy consumption of existing buildings. M. Sala-Lizarraga et al. [16] provide fundamental data that underscore the importance of optimizing building energy performance through energy analysis and thermoeconomics. Specifically, they state that the conventional energy efficiency of a building (based solely on energy balance) can exceed 90%, but actual energy efficiency is often below 30%. HVAC systems (heating, ventilation, and air conditioning) account for about 50% of a building’s total energy consumption, while the building envelope (walls, roofs, windows, floors) is responsible for approximately 30–40% of total thermal losses. Poel et al. [17] analyze methods, criteria, and results related to the evaluation of energy performance in existing residential buildings, with particular attention to energy retrofitting interventions and their impact on overall energy efficiency and greenhouse gas emissions. The main shortcomings include poor thermal insulation quality and the presence of thermal bridges, which increase energy demands for heating and cooling.
Existing buildings also often use outdated HVAC systems, characterized by low efficiency and high consumption. Paraschiv Lizica et al. [18] explore the crucial role of thermal insulation in improving building energy efficiency, highlighting its benefits in terms of reducing energy consumption, CO2 emissions, and operating costs.
Thermal insulation is recognized as one of the most effective strategies for reducing the energy demand of buildings by minimizing heat loss through the building envelope [19,20,21]. The widespread implementation of thermal insulation technologies can make a significant contribution to meeting global greenhouse gas reduction targets. According to Bazzocchi et al. [22], enhancing thermal insulation could lead to a reduction of approximately 20–30% in emissions from the building sector. A study conducted on a residential building in northern Iran demonstrated that implementing optimal thermal insulation led to a reduction in heat loss of 54.8% through the walls and 53.5% through the roof. The simultaneous application of appropriate insulation materials for both elements in regions characterized by moderate and humid climates resulted in the highest overall energy savings, reaching 47.2% across both summer and winter seasons. This approach not only significantly decreases energy losses related to heating and cooling but also improves the building’s resilience to environmental conditions and contributes to lowering energy demand within the building sector [23].
In recent years, research has focused on developing innovative solutions that offer superior thermal performance, environmental sustainability, and a reduced ecological footprint. The research of Imane et al. [24] investigates the use of natural thermal insulation materials, such as hemp fiber and sheep wool, in desert regions. The results indicate that these materials can reduce building energy consumption by over 42%, highlighting their effectiveness in enhancing energy efficiency in challenging climates.
Various tools, such as SUSREF [25], IFORE [26], TABULA [27], EPIQR [28], Façade Refurbishment Toolbox [29], DanCTPlan [30] have developed methodologies for evaluating the energy performance of buildings. However, these tools do not adequately address the environmental sustainability of the proposed solutions to improve energy efficiency.
Over the years, several decision-support tools have been developed for sustainable retrofitting projects, including the Decision-Support Tool (DST) designed by Garufi et al. [31]. This tool assists in making informed decisions within the context of sustainable renovations in the social housing sector in the Netherlands, evaluating the effectiveness of interventions in terms of greenhouse gas emissions reduction, energy savings, and social benefits.
Similarly, the tool by Dall’O’ et al. [32] focuses on the classification of energy performance of residential buildings at the urban level, proposing a methodology that integrates various parameters to analyze and improve energy efficiency of building stock. However, the tools designed by Garufi et al. and Dall’O’ et al. present limitations related to their dependency on detailed and up-to-date data, which are challenging to obtain in some areas. Additionally, both tools require financial resources and specialized expertise, limiting their applicability in resource-scarce contexts. They are tailored to specific contexts, making it difficult to adapt them to different realities. Furthermore, they require constant updates to remain aligned with regulations but often do not fully consider the social costs and indirect impacts of renovations. Deng Z. et al. [33] propose the AutoBPS (Automatic Building Performance Simulation) tool, developed to support urban-scale energy modeling, with the aim of promoting energy efficiency at the city level.
The tool stands out for its automation of the modeling process, using publicly available data such as GIS and cadastral databases to generate detailed models without complex manual intervention. However, AutoBPS has some main limitations, such as the need for high-resolution data, which may not always be available or up to date in all cities. Moreover, the model requires significant computational power, making it less practical for large-scale city applications or real-time analyses. The tool designed by Godoy-Rangel et al. [34] supports the assessment and improvement of building energy performance, focusing on the climatic and socioeconomic specificities of northern Mexico. This tool mainly emphasizes energy efficiency and emissions but does not provide an in-depth analysis of socio-cultural and behavioral variables of occupants, which are crucial for comprehensively improving energy efficiency. Moreover, its limited applicability outside the northern Mexico region reduces its adaptability to other areas with different climatic and infrastructural conditions. TecSB [35] is a decision-support tool designed for both residential and non-residential buildings located exclusively in the city of Monterrey, Mexico. It consists of a free virtual platform that assesses energy efficiency measures for roofs and windows, as well as the potential for on-site energy generation.
The tool described by Arab et al. [36] employs the OTTV (Overall Thermal Transfer Value) index to evaluate building energy efficiency, a parameter that measures the amount of heat a building absorbs through its exterior surface. While this index is useful for determining the need for envelope improvement interventions, it has limitations, as it does not account for climate variability and occupant behavior patterns.
A comparison of the various tools previously described is presented in Table 1 below.

The Proposed Tool: BEST

This research aims to develop BEST—Building Energy-Saving Tool for Sustainable Residential Buildings—an innovative decision-support tool for designing energy retrofitting interventions in the residential sector. This tool seeks to overcome the limitations of currently available tools by introducing a simplified and standardized approach to optimizing building energy performance. Compared to the tools analyzed earlier, BEST stands out for its ability to guide designers in identifying the most effective solutions without requiring complex inputs on the stratigraphy or thermo-physical parameters of building components. The key innovations introduced include:
  • Automated solution selection: The tool enables the selection of vertical and horizontal closures based on predefined parameters such as the era of construction, building type, and climatic zone.
  • Rapid pre-analysis of energy performance: Provides a preliminary assessment of energy-saving potential and compares proposed solutions in terms of energy performance and economic feasibility, in accordance with the current national regulatory framework.
  • Advanced economic evaluation: Unlike other tools, BEST includes the calculation of NPV and the identification of applicable economic incentives.
  • Focus on off-site construction: Proposes standardized solutions in line with the principles of industrialized and sustainable construction.
The methodology was developed by CITERA, the research center at Sapienza University of Rome, within the framework of the “Research of the Electricity System” program, in collaboration with ENEA and the Ministry of Economic Development. This initiative focused on the “Study of the state of the art of prefabricated solutions for roofing systems and the creation of a best practices catalog/Development of tools and support instruments for energy efficiency interventions in residential buildings undergoing refurbishment”. The proposed methodological approach was validated through its application to a representative case study of the Italian building stock. The paper is structured as follows. First, the methodology adopted for the development of the tool is presented. Section 3 provides an overview of the case study used to validate the BEST tool. The results are presented in Section 4 and further analyzed in Section 5. Finally, the paper concludes with a discussion on key findings and potential future developments.

2. Materials and Methods

The overarching goal of this research is to enhance the energy efficiency of the national residential building stock, with the aim of developing high-performance buildings aligned with the energy transition objectives set by current regulations.
The study focuses on the development of a tool designed to assist designers in identifying the most suitable retrofit solutions based on the building’s construction period, typology, structural characteristics, and climatic zone. The outcomes of previous research efforts have provided the foundation for the development of a decision-support tool for energy efficiency interventions in residential buildings undergoing renovation [37]. The tool is built on an Excel-based computational engine with macros in Visual Basic, integrating pre-calculated solutions through a dynamic matrix consisting of 718 configurations, in accordance with the parameters established by current regulations (Supplementary File S1).
Leveraging an optimized solution database, the system enables the selection of standardized, efficient, and sustainable technologies that meet the regulatory performance requirements for wintertime building performance, with reference to off-site construction practices. The tool offers a preliminary energy analysis, allowing users to assess the impact of retrofit interventions on the building envelope by providing insights into potential energy and cost savings. Through performance simulations, professionals can compare different optimized solutions, supported by a dynamic matrix that integrates criteria related to the existing building envelope and regulatory requirements. The calculations include heating and cooling energy demands, considering both the envelope and the most common HVAC system types. A key feature of the tool is its ability to select vertical and upper horizontal enclosures based on specific criteria, thereby simplifying the complexity associated with defining layer compositions. The proposed energy efficiency solutions, tailored to each case, allow for the calculation of economic savings, NPV, and available incentives. Additionally, users can download detailed reports containing stratigraphy information, simulation results, hygrothermal performance checks, and sustainability indicators. In the table below (Table 2) the functionalities of the BEST tool are presented.
The methodological approach underpinning this research is based on the definition of a flowchart that identifies the fundamental input data necessary to guide designers in selecting the most appropriate case scenario for the building to be retrofitted. This classification is based on construction period, building typology, structural characteristics, and climatic zone.
Figure 1 presents the methodological framework, outlining the key steps followed in the tool’s development. The activities and findings from previous research, essential for generating a database of optimized pre-calculated solutions, are highlighted in grey.
In particular, these first three steps represent the preliminary phase of the development of BEST. This phase is focused on building the technical and knowledge base required to generate effective energy retrofit solutions. A detailed description is provided below:
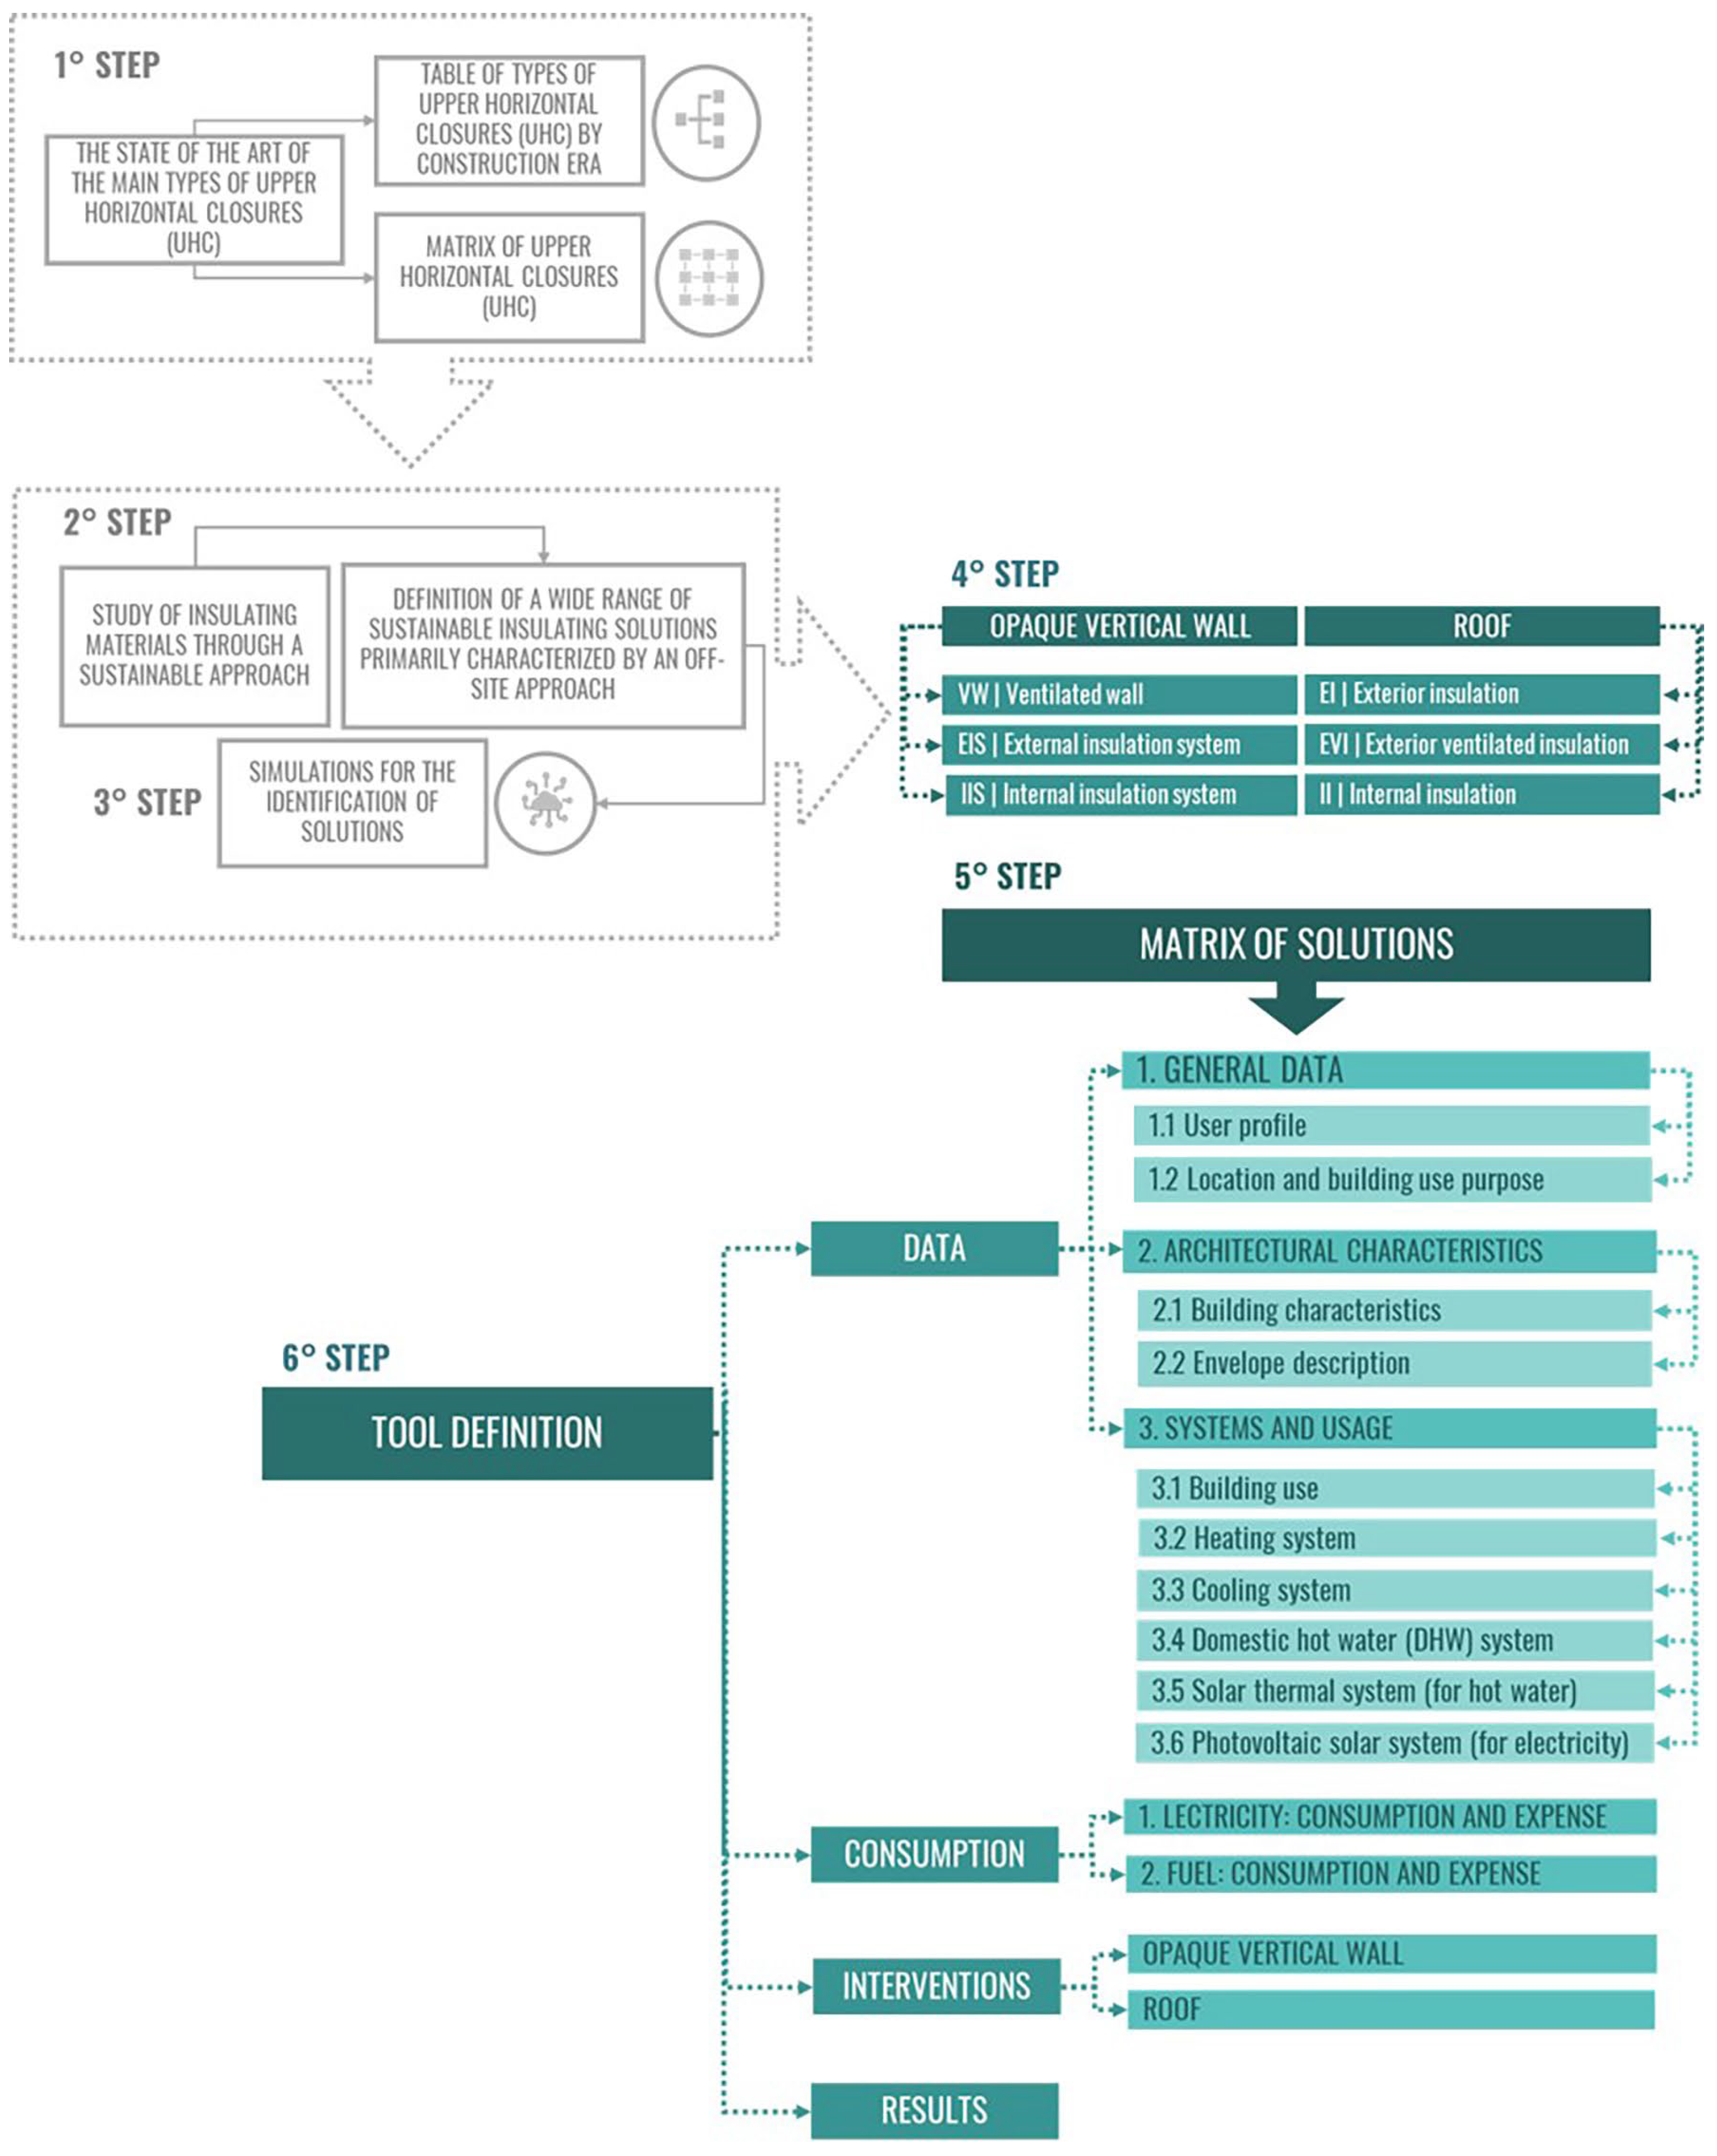
Step 1—State of the art of the main types of Upper Horizontal Closures (UHC): The first step involves a comprehensive analysis of the state of the art and a typological classification of UHCs based on the buildings’ construction periods. The objective of this step is to build an organized database that identifies the most recurrent construction solutions for each historical building era. The outcomes include a typology table of UHCs by construction age and a systematic classification matrix that will support the subsequent selection of appropriate retrofit interventions.
Step 2—Study of insulating materials through a sustainable approach: The second step focuses on the study of insulating materials with a strong emphasis on sustainability. A wide range of materials are analyzed and selected based on environmental sustainability criteria and energy efficiency performance. This step prioritizes solutions that follow an off-site approach—meaning prefabricated and standardizable systems—so as to facilitate practical application while reducing both time and costs associated with the interventions.
Step 3—Simulations for the identification of solutions: The third step consists of performing energy and performance simulations to evaluate the effectiveness of the selected insulating materials. The aim is to develop a validated dataset that will feed into the solution matrix outlined in Step 5. This matrix will serve as a key tool in recommending retrofit strategies that are coherent with the specific characteristics of each building.
The first three steps of the previous research are followed by the subsequent stages of tool definition as outlined below:
Step 4—Opaque vertical wall and roof solutions: In this step, the focus is on defining various insulation systems for the building envelope, specifically targeting opaque vertical walls and roofs.
Step 5—Matrix of solutions: This step involves creating a matrix that organizes and presents the available solutions for building envelope insulation, based on the choices made in Step 4. The matrix serves as a decision-making tool, guiding the selection of the most appropriate solutions for each building’s specific needs.
Step 6—Definition of the tool BEST: In the final step, the tool is defined based on the data, materials, and solutions identified in the previous steps. This step consolidates all the inputs and establishes the structure of the tool that will guide users in selecting appropriate retrofit solutions.
The tool BEST is structured as follows:
  • General data;
  • Architectural characteristics;
  • Systems and usage;
  • Energy consumption and costs;
  • Energy efficiency measures;
  • Results.
The first module of the BEST tool is designed for the systematic collection of data on the building under analysis. It is structured into three main sections: (1) general data, (2) architectural characteristics, and (3) systems and usage. The tool requires a set of fundamental input data to perform a reliable simulation. These minimum data inputs include location, building use (intended use), characteristics of heat-loss surfaces, type of thermal generators for heating/cooling/domestic hot water (DHW), use of renewable energy sources, and the installation period of the systems. These inputs are associated with simplifying assumptions based on standardized values derived from relevant UNI standards (e.g., UNI 10349, UNI TS 11300, UNI 10339).
All required inputs are mandatory for the simulation to proceed. The tool does not allow for missing or incomplete data among the essential inputs, thus ensuring consistency and reliability of the simulation results. The minimum required data and the related simplifying assumptions are as follows: (Table 3):
The data collection process follows a sequential approach to ensure the completeness and consistency of the information, providing a solid foundation for subsequent simulation phases.
The tool BEST guides designers through a series of integrated steps:
  • Case study identification: Based on a structured database, the tool facilitates the identification of the building’s current condition by taking into account its construction period, structural typology, and climatic zone. The tool includes 30 types of vertical perimeter walls and 30 roof configurations representative of the national residential building stock;
  • Preliminary energy analysis of opaque envelopes: It provides an overview of potential retrofitting opportunities in terms of energy savings and economic impact, addressing both heating and cooling energy demands;
  • Database of optimized solutions: Leveraging the results of prior Work Package activities, the tool suggests pre-calculated interventions for perimeter walls and for roof (Predominantly prefabricated insulation solutions (5 for the perimeter walls and 21 for the roofs) selected based on comparison parameters such as performance indicators, environmental impact, applicability, and cost, and validated through energy simulations conducted using certified BIM energy software to determine the required insulation material thicknesses);
  • Post-intervention simulation: BEST generates an energy model to evaluate the technical and economic performance of the proposed solutions. It also offers downloadable detailed performance sheets;
  • Prioritization of interventions: The tool ranks the available solutions to identify those with the best cost-benefit ratios.

2.1. BEST Tool Description

Users can access the tool via the internet using a browser as an interface; thus no specific hardware or software requirements are necessary. A simple internet connection and a browser are sufficient to fill in the data and run the calculation engine that generates the results.
The simplified interface allows for the description of building characteristics and their building systems in order to perform quick assessments of the potential interventions for the refurbishment of the opaque envelope of the residential building stock.
The BEST simulation tool was designed for application in the assessment of energy efficiency interventions for residential buildings, classified as follows:
  • E.1 (1)—Residential buildings with continuous occupancy (e.g., dwellings, boarding schools, convents, penitentiaries, barracks);
  • E.1 (2)—Residential buildings with intermittent occupancy (e.g., vacation homes and similar structures).
The computational tool aims to combine the simplicity of static methods with the accuracy of dynamic simulations, integrating additional functionalities to assess investment costs and their economic return, also considering the incentive schemes currently in force in Italy. For this reason, a simplified dynamic simulation approach was adopted, employing a single thermal zone to estimate the building’s annual energy consumption in both electrical and thermal terms.
The “simplified dynamic simulation” implemented in the BEST tool is based on the Italian technical standards UNI/TS 11300 (Parts 1, 2, and 4). These standards define the underlying assumptions and boundary conditions, including standardized climatic data, internal conditions (such as setpoint temperatures and internal gains), operational schedules, building envelope characteristics, ventilation rates, and system efficiencies. The approach can be described as a quasi-steady-state model applied over discrete time steps, rather than a detailed transient simulation.
Regarding the climatic zone, one was selected arbitrarily for the purpose of the simulation. Given the objective of the study and the standardized nature of the input parameters, the specific choice of climatic zone does not substantially affect the methodological outcomes, or the validity of the comparative analysis carried out by the tool.
The BEST tool supports simulations for all Italian climatic zones, as defined by national regulations. The UNI/TS 11300 standards incorporate climate-specific parameters for each of the six climatic zones in Italy (from Zone A to Zone F), ensuring that energy assessments and retrofit recommendations are both accurate and contextually relevant to the building’s geographical location. This climate sensitivity is essential to maintain the validity and applicability of the tool’s outputs.
The BEST tool has been developed in alignment with key European and national energy policies, particularly the objectives outlined in the European Green Deal, the Energy Performance of Buildings Directive (EPBD), and national long-term renovation strategies. The reference values for steady-state thermal transmittance were derived from the Italian Ministerial Decree of 6 August 2020, “Technical requirements for access to tax deductions for the energy retrofitting of buildings—so-called Ecobonus” (Official Gazette No. 246, 5 October 2020), Annex E—Requirements for thermal insulation interventions, Table 1—Maximum allowable transmittance values for eligibility for tax incentives.
The periodic transmittance values, attenuation factor, time shift, and internal areal heat capacity obtained through the application of various thermal insulation solutions were compared with the limit values set by the Ministerial Decree on Minimum Requirements (26 June 2015) and the UNI EN ISO 13786:2008 standard [40].

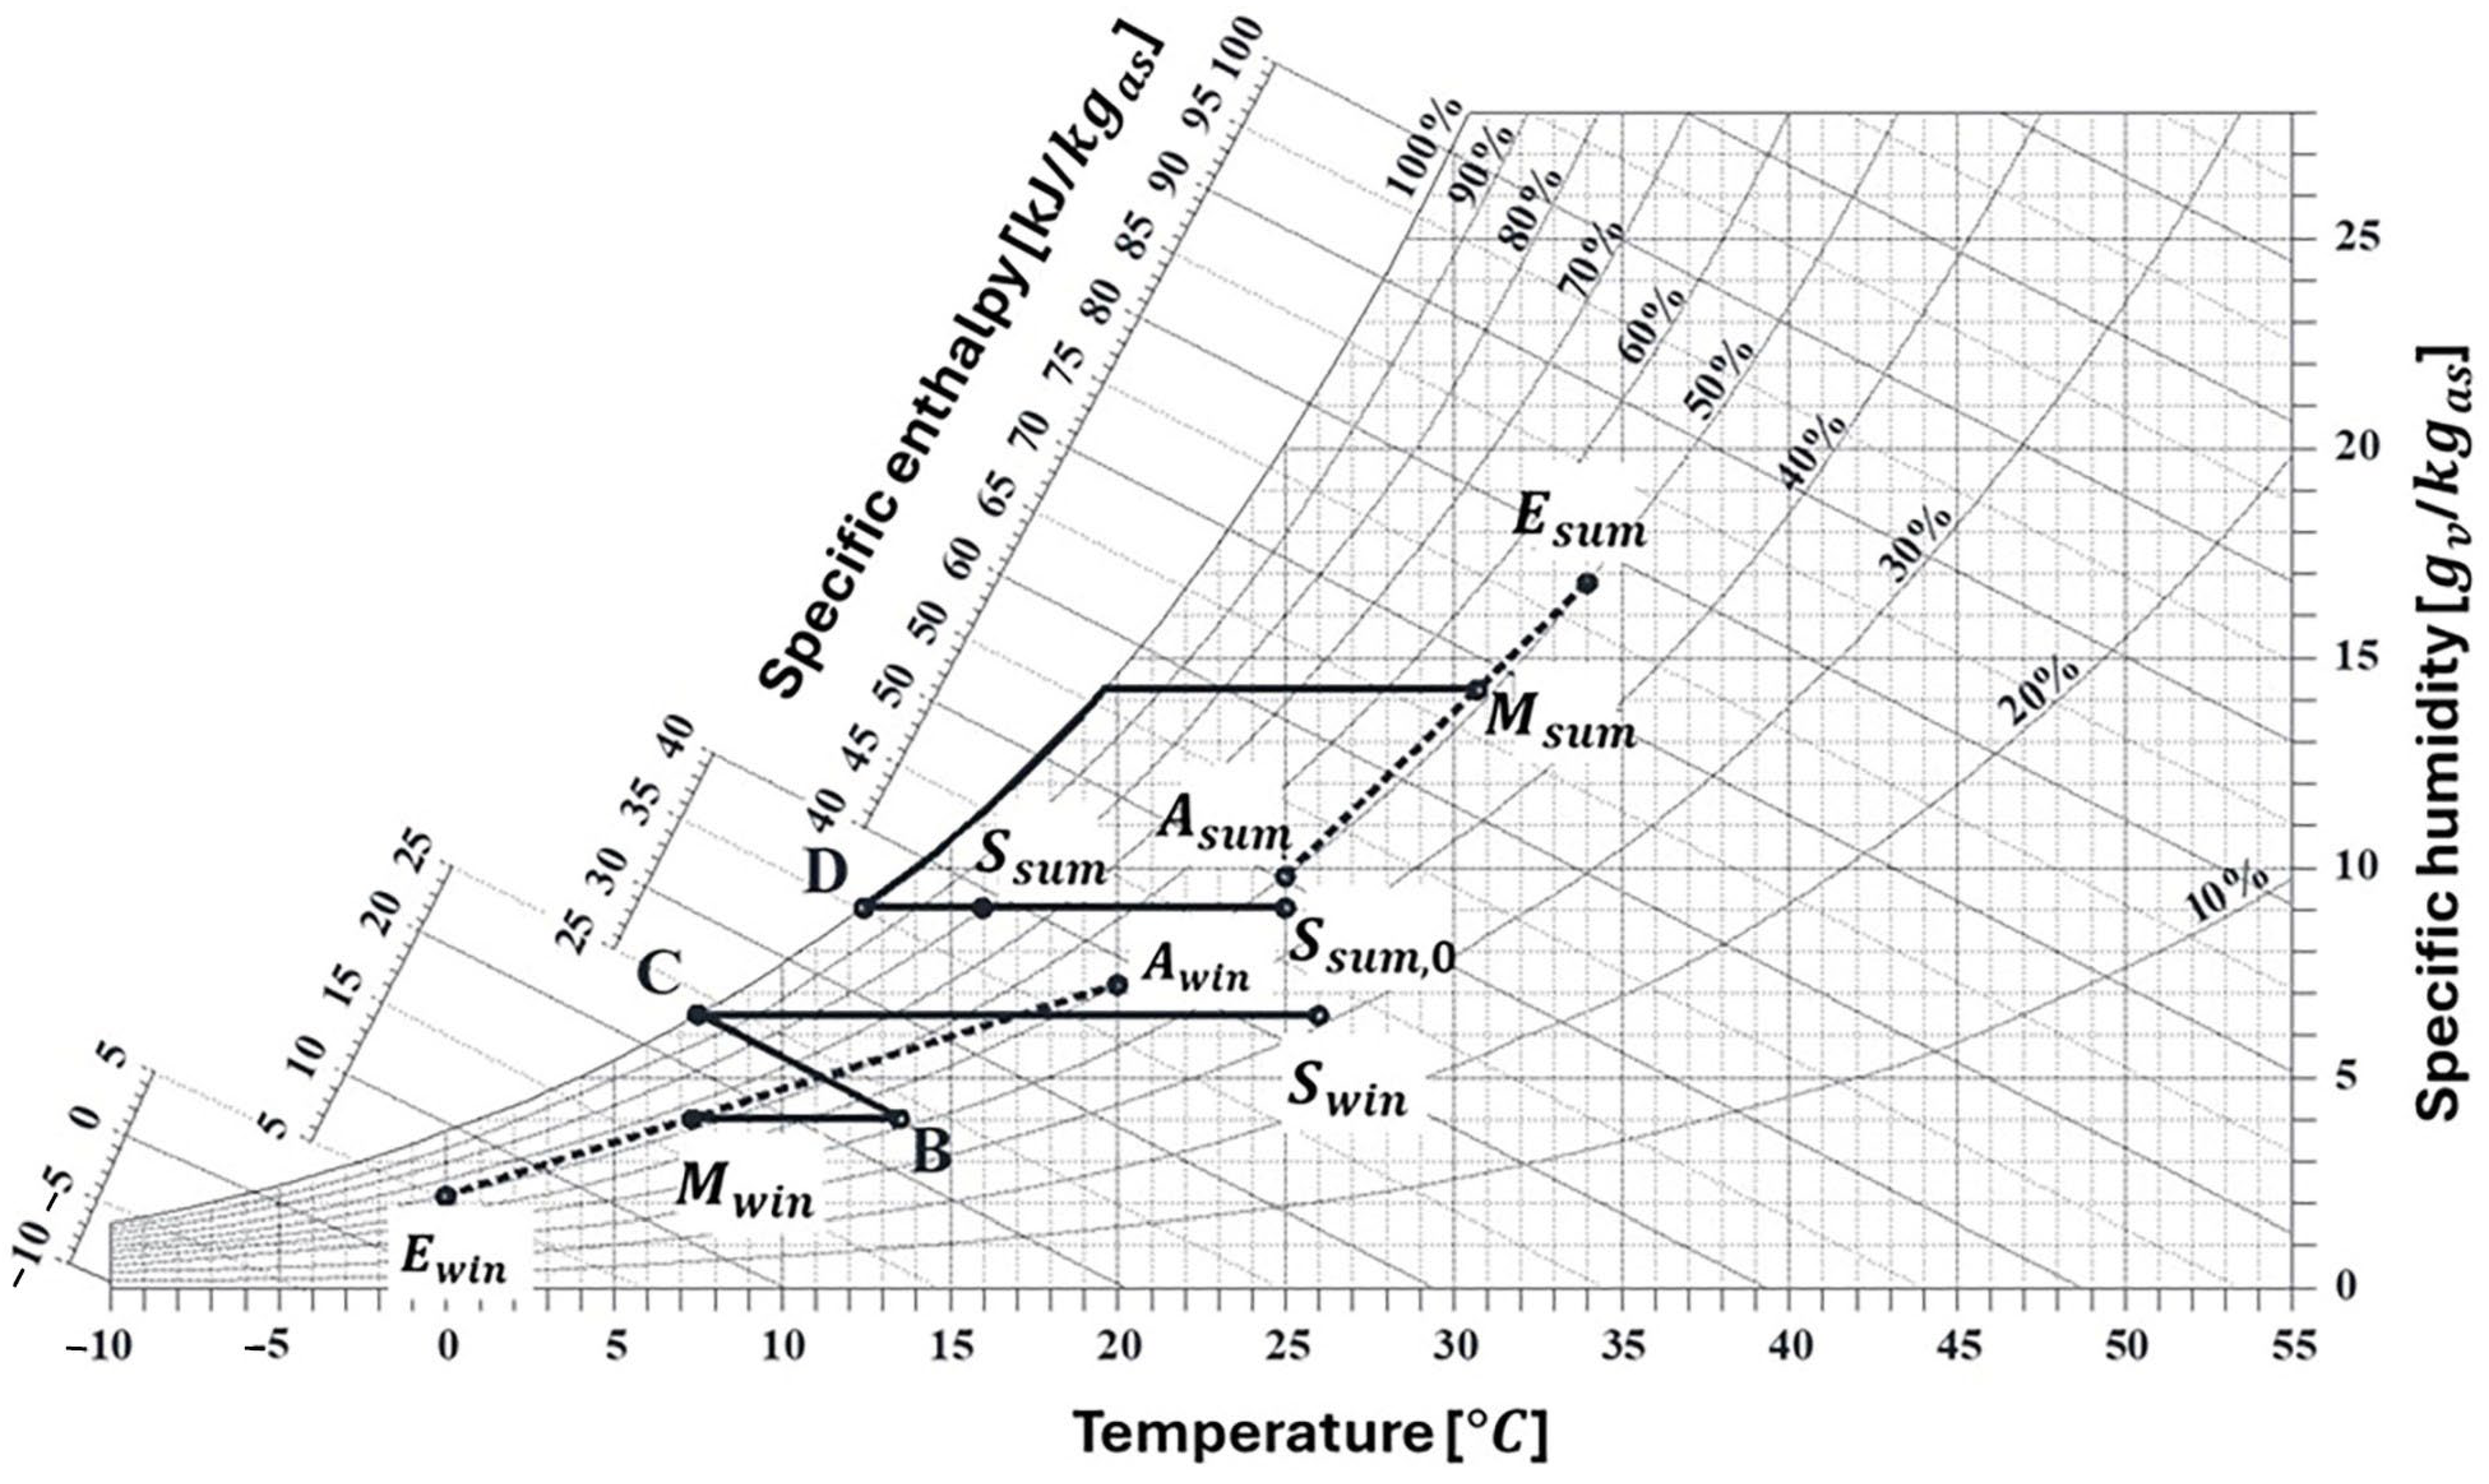
2.1.1. Useful Energy Demand for Heating and Cooling

Heat Balance
The heat balance calculation algorithm implemented in the spreadsheet used in this study is more detailed than that prescribed by the UNI TS 11300 standards [41]. The development of a more refined method primarily arises from two limitations of the UNI TS 11300 standard:
  • The inability to adequately assess intermittent use of the heating system;
  • The assumption that the external temperature remains constant, equal to the 24 h average temperature.
The dynamic approach entails setting up an energy balance over a maximum time interval of one hour, which the procedure automatically reduces (multi-rate logic) based on the rate of temperature variation. This ensures a higher calculation density during periods of rapid change while optimizing computational efficiency during more stable periods.
The user can specify the maximum number of time steps per hour, which consequently defines the minimum thermal balance period. The energy balance accounts for the various thermal exchanges affecting the building, including heat transfer, ventilation, internal gains, and solar gains. These exchanges are classified as either “sensible” or “latent”, as the method includes a detailed psychrometric analysis of air transformations.
For both winter and summer seasons, the heat balance equation takes the following form:
Q b i l , s e n s = Q t r + s o l , o + Q v e , s e n s + Q int , s e n s + Q s o l , t + Q c o r e + Q r e s t a r t
Q b i l , l a t = Q v e , l a t + Q int , l a t
During the winter season, if the heat balance Equations (1) and (2) yield a positive result, it indicates that the incoming heat exceeds the outgoing heat, resulting in a null thermal load. Conversely, if the balance is negative, a thermal load must be met through the HVAC systems.
The procedure simulates each emission system as an air-based system, with appropriate values for recirculated and outdoor airflows. These values vary depending on the type of emission system, the temperature of the heat transfer fluid, the recirculation rate, the presence of heat recovery devices, the type of fans used, and other relevant parameters.
For each step, based on the installed emission system, the procedure determines the supply air state required to meet the thermal demands established by Equations (1) and (2). If the system cannot control relative humidity (e.g., radiators, fan coil units, radiant floor heating, etc.), the supply air state will compensate only for the sensible heat component. Otherwise, it will also account for humidity correction, either through humidification or dehumidification.
Once the supply air state is determined, the procedure constructs the actual psychrometric transformation performed by the HVAC systems, considering both ambient conditions and the specific characteristics of the installed equipment.
The thermal and cooling energy required for this transformation is then calculated, representing the net winter heating demand Q H , n d or summer cooling demand Q C , n d . The psychrometric transformations performed follow a pattern similar to those illustrated in Figure 2.
The psychrometric analysis integrated into the BEST tool is based on a detailed thermodynamic approach, grounded in the properties of moist air as defined in the ASHRAE technical handbooks (particularly the ASHRAE Handbook—Fundamentals). The psychrometric transformations are not resolved through approximate empirical correlations but through precise modeling that takes into account fundamental parameters such as dry bulb temperature, dew point temperature, relative humidity, absolute humidity, specific enthalpy, and specific volume.
In the thermal balance calculation, the procedure implements an hourly iterative resolution of the state point of the supply air, based on the sensible and latent loads to be compensated. It clearly distinguishes between systems capable of regulating humidity (Air Handling Units with air treatment) and those that operate solely on the sensible load.
For each time step (with a maximum interval of one hour and dynamic adjustments based on thermal variations), the software determines the required state point for the supply air, calculating the necessary psychrometric transformations based on the environmental conditions. These transformations include sensible cooling, dehumidification, heating, humidification, and their combinations.
The transformations are plotted in the psychrometric space, as shown in Figure 2 of the article, following the corresponding thermodynamic trajectories. The calculation of the thermal energy required for each transformation is performed by integrating the variations in specific enthalpy of moist air, also considering airflows and ventilation conditions (either natural or mechanical). This approach allows for accurate determination of the net thermal and cooling demands (QH,nd and QC,nd) necessary to meet the latent and sensible loads, explicitly distinguishing between internal contributions (occupants, equipment) and external contributions (ventilation, infiltration).
The approach described inherently and naturally accounts for hourly variations in environmental parameters, as well as the effects of the thermal inertia of building structures. Consequently, it does not require an approximation method for these effects, such as the utilization factor for heat gains.
Heat Exchange by Transmission
The heat exchange by transmission consists of the thermal transfer to the external air, the ground, and unconditioned spaces. It also includes the extra-flow caused by infrared radiation towards the sky dome, as well as the incoming solar thermal gains transmitted through opaque components.
The method is directly based on the numerical solution of the general heat exchange equation using finite difference schemes. The Fourier equation is presented as a second-order differential equation:
2 θ x 2 = 1 α θ t
where:
α = λ ρ c p   is the thermal diffusivity [m2/s], which is the ratio between the material’s thermal conductivity λ [W/mK] and the product of its density ρ [kg/m3] and specific heat capacity cp [J/kgK].
The analytical solution to the equation is complex and ill-suited for a computational procedure. For this reason, the dynamic heat exchange problem through a wall is typically solved using numerical methods. The finite difference method, sometimes referred to as the “Heat Balance” (HB) or “Conduction Finite Difference” (CondFD) method, is the most accurate approach among the existing solution methods. It does not present the issues of transfer function methods, such as the “Conduction Transfer Function Method” (CTF or TFM), nor the problems of impulse response methods like “Radiant Time Series” (RTS), which are prone to inaccuracies and instability when applied to components with high mass. The CondFD method is also the most flexible and can simulate special materials, such as phase change materials (PCMs), although these are not yet incorporated into the current version of the procedure. For the solution, an explicit forward finite difference scheme was chosen, which can be schematized as shown in Figure 3.
The spatial discretization of the wall was simplified by dividing it into three unequal parts. Two surface zones with very small thickness (approximately 3% each of the wall’s thermal capacity), whose thermal capacity was aggregated with that of the internal and external spaces, and one internal zone containing the remainder of the thermal capacity. The assignment of 3% of the wall’s thermal capacity to its surface zones represents a deliberate simplification aimed at reducing model complexity while preserving an acceptable level of accuracy. These surface zones correspond to the outermost layers of the wall material and possess a lower thermal mass compared to the deeper layers. As a result, although surface layers are more sensitive to temperature fluctuations and respond more rapidly to thermal variations, they store relatively little heat. In contrast, the inner regions of the wall have a greater capacity to absorb and release heat over time due to their higher thermal mass. By allocating only a small fraction (3%) of the total thermal capacity to the surface zones, the model emphasizes the dominant role of the core wall layers in thermal dynamics, thus simplifying the computation without significantly compromising the physical realism of heat exchange processes.
The surface zones were introduced to properly model the inertial effect of the wall’s surface layers, which actively contribute to stabilizing the internal ambient temperature. Each wall has an internal temperature associated with the internal thermal capacity. This discretization can also be graphically represented as an equivalent electrical circuit (Figure 4).
In this diagram: Rwe and Rwi represent the thermal resistances [W/m2K] of the outer and inner portions of the wall, respectively; Ctw represents the thermal capacity of the inner part of the wall [J/kegs]; Te and Ti represent the temperatures of the external and internal environments [°C], respectively.
This representation helps simplify the complex thermal behavior of the wall by modeling it with thermal resistances and capacities, similar to an electrical circuit with resistances and capacitors.
Heat Exchange by Ventilation
The heat exchange by ventilation is modeled on a monthly basis and consists of thermal exchange with the external air and unconditioned spaces. The calculation methodology involves precise computation of psychrometric transformations and the corresponding energy. For natural or mechanical ventilation without treatment, the heat exchange is calculated at each time step based on the actual temperatures and flow rates.
Internal Gains
The detailed approach involves the precise calculation of the individual sensible and latent heat gains from both occupants and all electrical and combustion appliances present. Internal gains are incorporated instant by instant into the building’s dynamic energy balance as thermal flows directly injected into the internal air.
Solar Gains from Transparent Components
Solar gains are typically divided based on the component that the irradiation impacts. If the irradiation affects opaque components, such as walls or ceilings, part of it is absorbed by the wall and becomes part of the thermal balance of the wall, in the form of thermal flux injected at the surface of the wall.
Therefore, opaque irradiation enters the interior through conductive transfer across the opaque walls. If the irradiation affects transparent components, such as windows, most of it is transmitted inside and absorbed by the internal walls and furnishings. This second mode is clearly more direct, produces higher loads, and has very short propagation times.
The detailed approach calculates the solar fluxes Φ sol , op , mn , k   and Φ sol , w , k   in a manner similar to the regulatory calculation, with some differences (mainly for opaque components), and with the distinction that they are calculated on an hourly basis instead of monthly.
The solar gain from opaque components in the detailed method cannot be directly expressed with a formula, as it becomes part of the dynamic thermal balance of the opaque wall in the form of thermal flux injected into the wall’s surface layer, between the external surface resistance and the resistance of the outer portion of the wall.
The solar gain through transparent components is calculated in a way similar to the standard method, as it is not subject to accumulation by the structures (internal accumulation is neglected).
Energy Demand for Domestic Hot Water Preparation
The energy demand related to domestic hot water consumption is calculated in full compliance with the UNI TS 11300-2 standard [42].
Solar Thermal and Photovoltaic Systems
The behavior of solar thermal or photovoltaic systems is simulated through a procedure largely derived from the UNI TS 11300-4 technical standard [43].

2.1.2. Results Generated by the Tool

For each intervention (or combination of multiple interventions), the following information can be displayed:
  • The percentage reduction in total primary energy consumption compared to the baseline scenario (ex-ante);
  • The initial investment required for the implementation of the interventions;
  • The NPV of the investment over a 20-year period, compared to the current state. This represents the economic value generated by the investment over 20 years, net of the initial expenditure and taking into account the effects of inflation;
  • The Payback Time (PBT) of the investment, compared to the current state;
  • The amount of CO2 emissions avoided annually (kg/m2 year) with respect to the baseline scenario, as a result of the proposed solutions.
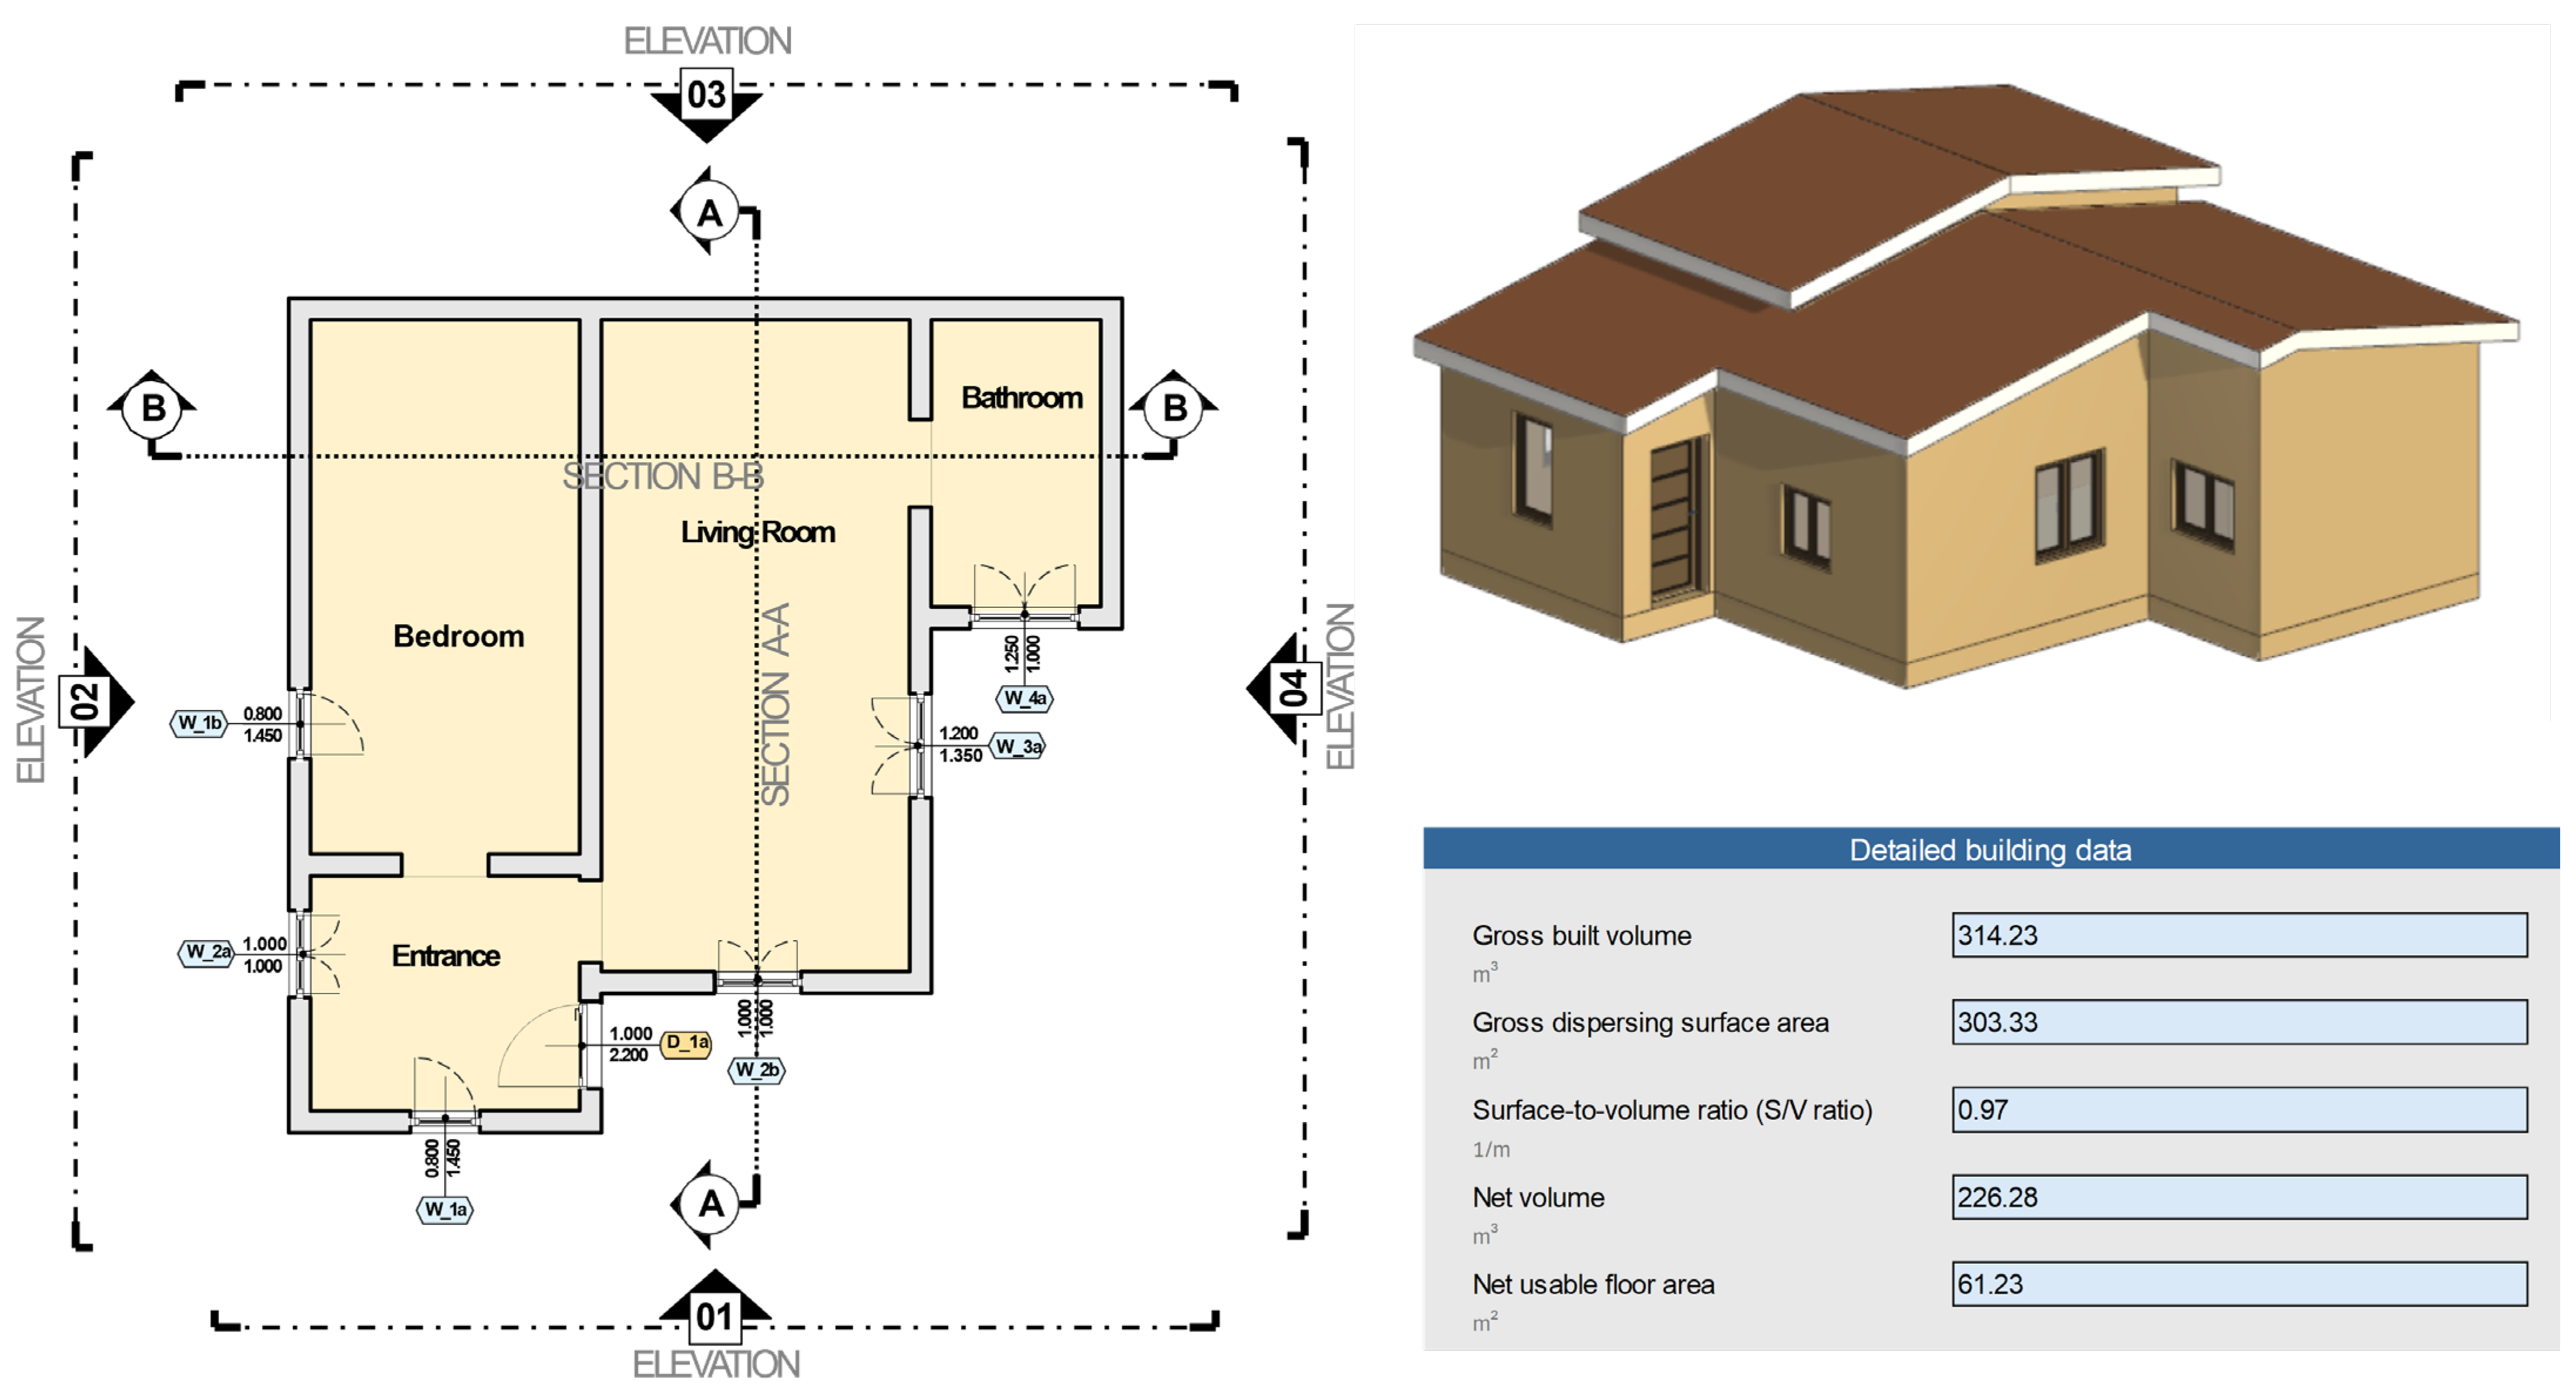
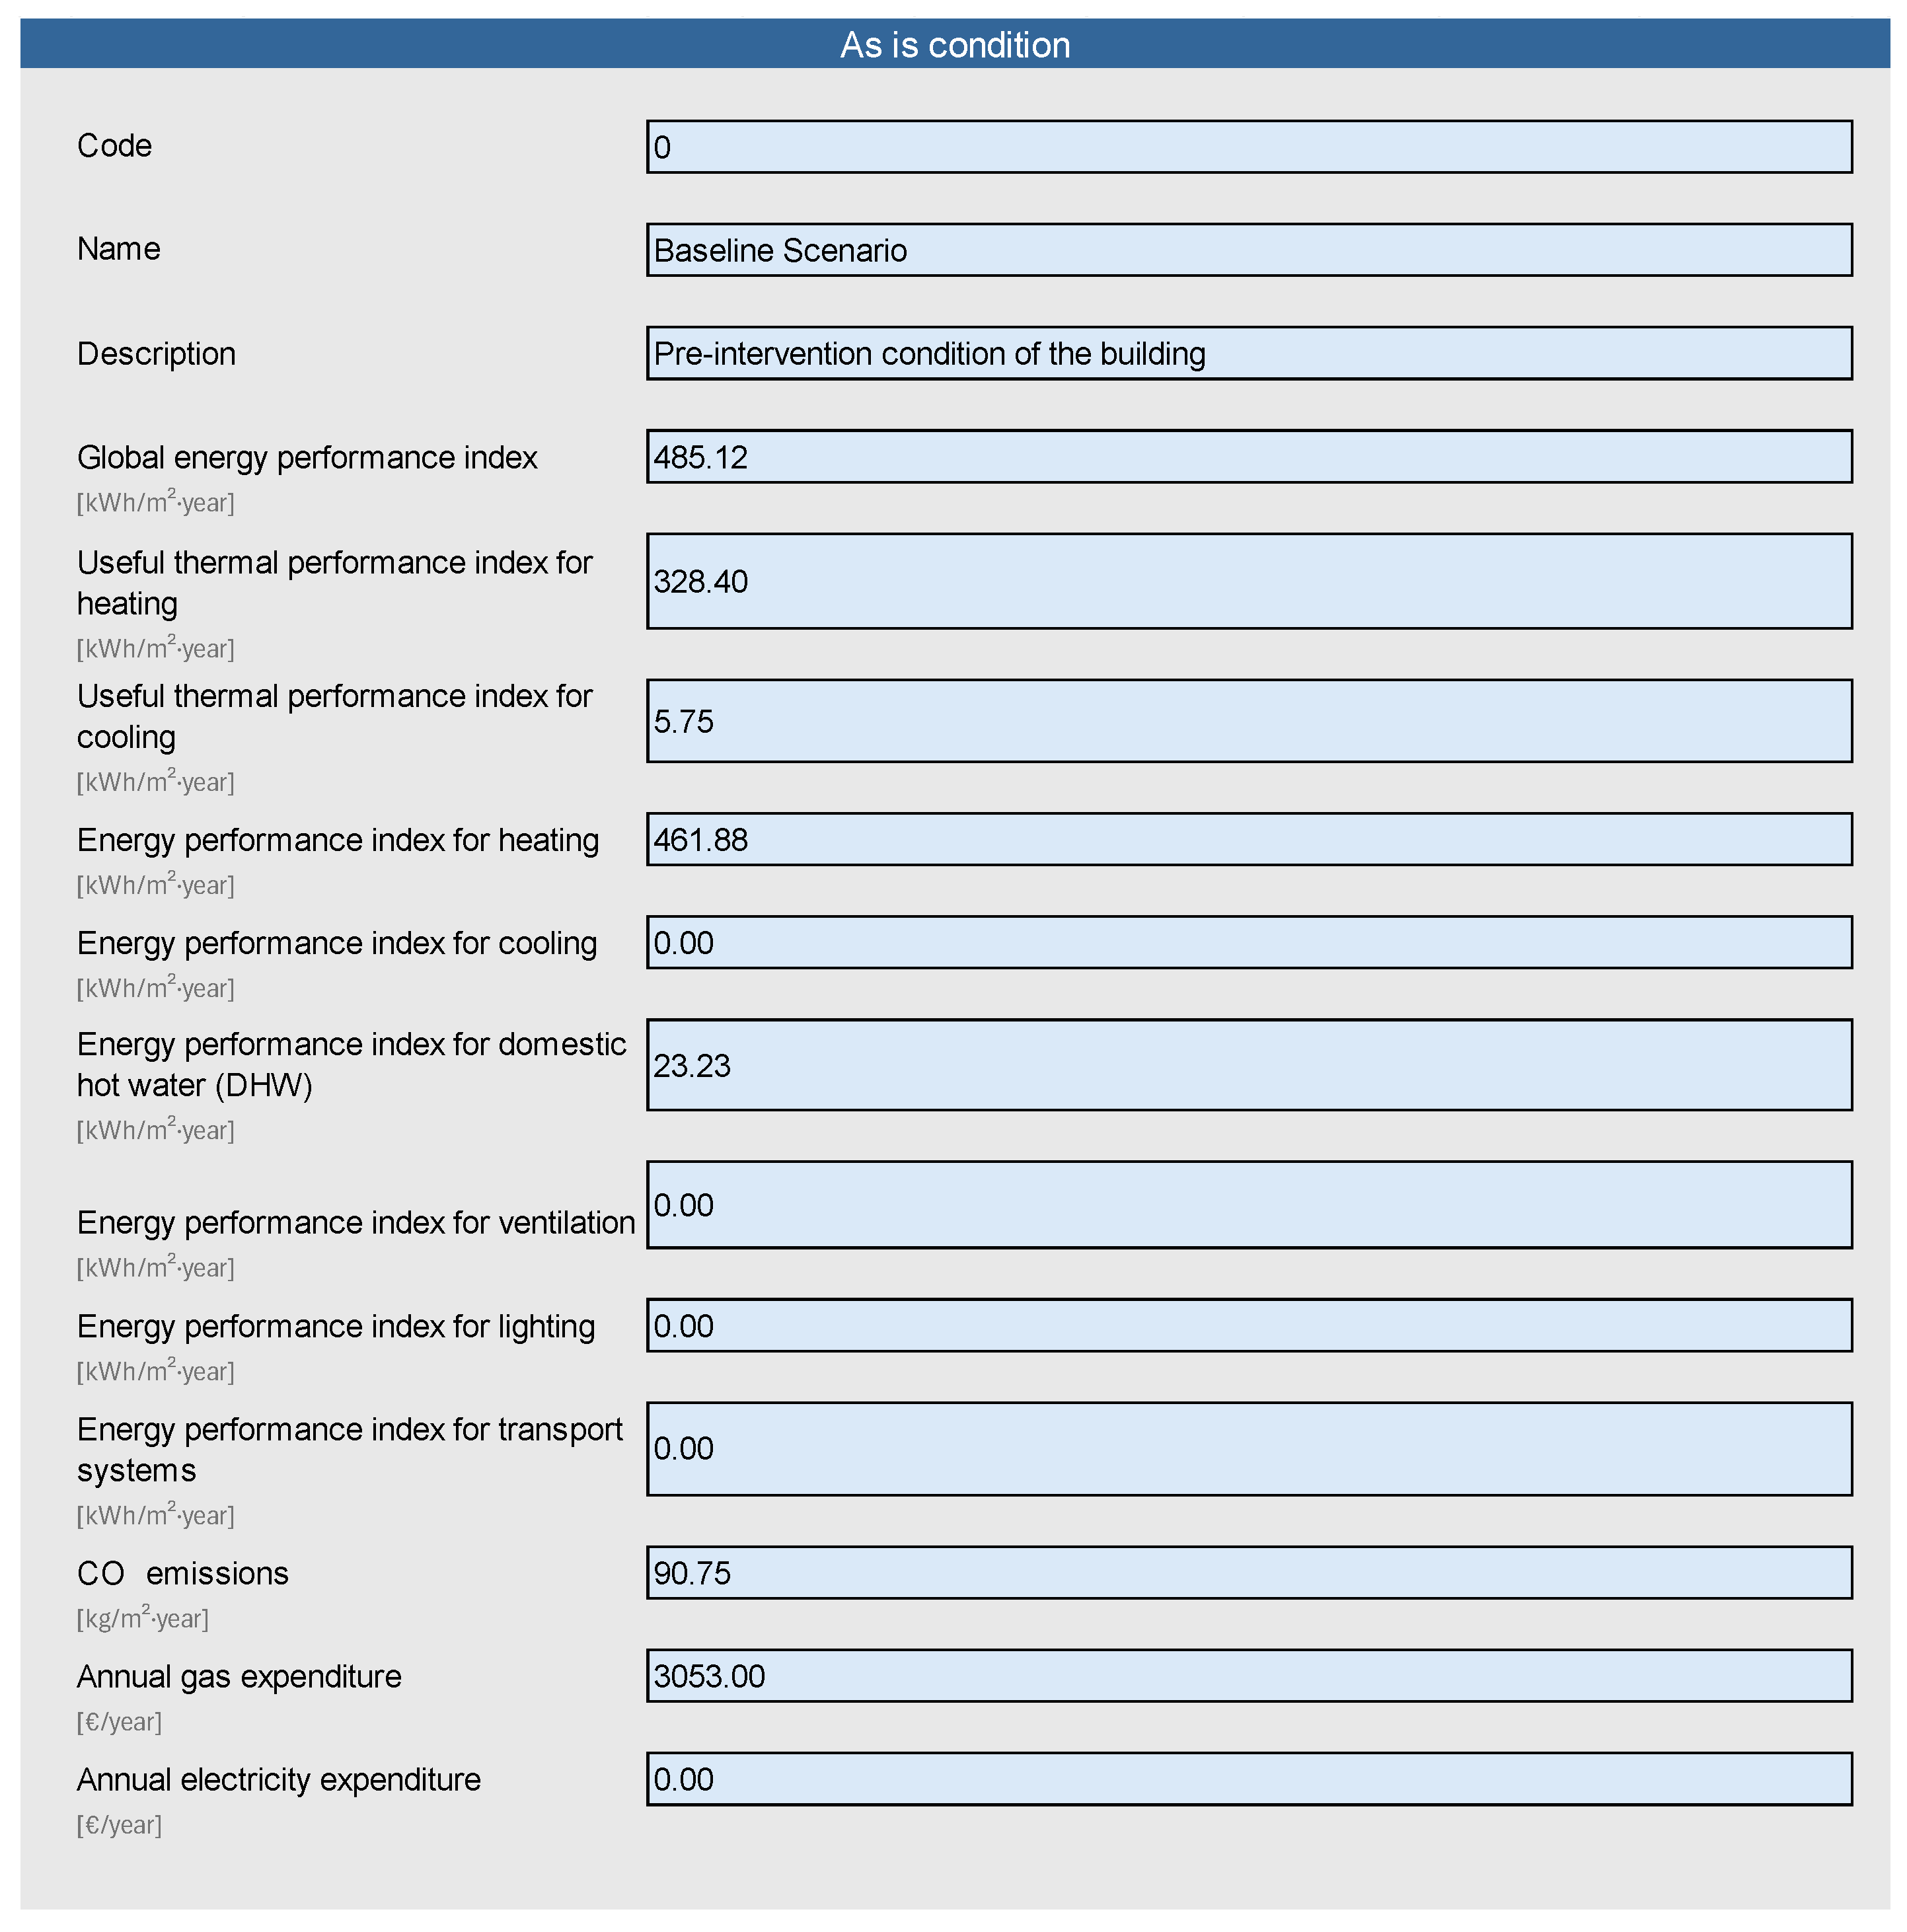
3. Case Study

To evaluate the operational capabilities of the proposed tool, a simulation was conducted on a selected case study, the details of which are provided in Supplementary File S2.
The validation of the BEST tool was performed using a single-storey residential building with a net usable floor area of 61.23 m2, located in Trevignano Romano, in the province of Rome. Constructed in 1950, the building falls within Climate Zone D (Figure 5).
The vertical external wall (EW) of the dwelling consists of a functional layer composed of 21 cm of solid brick masonry, flanked on both sides by 2.5 cm of plaster, resulting in a total thickness of 25 cm. The lower horizontal closure (LHC) is characterized by a functional layer composed of a 25 cm reinforced concrete slab, a 6 cm concrete screed, a 1 cm cement mortar bedding layer, and a 2 cm ceramic tile floor finish, for a total thickness of 34 cm. The upper horizontal closure consists of a functional stratigraphy composed of a 16 cm hollow-block and concrete slab, a 4 cm layer of reinforced concrete, a 1 cm cement mortar bedding layer, and a final layer of terracotta tiles, with a total thickness of 25.5 cm. The window frames are made of wood and equipped with single glazing. In the first section of the tool, the province and municipality in which the building is located can be selected via a dropdown menu. This step is essential for the automatic retrieval of degree days and the corresponding climate zone, which are crucial for the subsequent identification of potential energy efficiency solutions. After identifying the construction period of the building, the tool suggests the most likely technical elements defining the building envelope, based on the national residential building stock matrix.
For the case study under analysis, the technical components most representative of the existing envelope (Figure 6) are as follows:
  • EW05: uninsulated solid brick masonry, typical of the period 1900–1950, with a steady-state thermal transmittance (U-value) of 1.95 W/m2K;
  • LHC07: concrete ground floor slab, typical until 1975, with a steady-state thermal transmittance of 1.96 W/m2K;
  • UHC05: pitched roof in hollow-block concrete, typical from 1930 to 1975, with a steady-state thermal transmittance of 1.82 W/m2K.
The simulation of the building’s current condition performed using the tool produced results related to thermal and energy performance indicators, annual CO2 emissions, and energy-related operating costs (Figure 7).

4. Results

The matrix provided by the tool identifies nine insulation solutions for the roof: three non-ventilated external insulation systems (applied to the upper surface), four ventilated roof solutions, and two internal insulation options (applied to the underside).
For the vertical envelope, six solutions are proposed: two external thermal insulation composite systems, two ventilated façade types, and two internal insulation options. Given that the building is not subject to any heritage or urban planning constraints, all insulation solutions can be applied externally.
The solutions selected for the case study correspond to those with the simplest installation processes that also result in the lowest steady-state thermal transmittance values for both the roof and vertical envelope.
The tool allows users to download technical datasheets (Supplementary File S3), which include:
  • The code of the roof and vertical wall typologies, the historical period in which they were most prevalent, and the stratigraphy to which the proposed solution is applicable;
  • The code of the selected insulation solution;
  • The type, thickness, and thermal conductivity of the proposed insulating material;
  • A drawing of the insulation stratigraphy, along with a description of its individual layers;
  • Thermo-physical properties of the existing building components (walls and roof) and the proposed insulation layers;
  • Calculated performance values under both winter and summer conditions;
  • Surface condensation risk assessment (isotherm analysis);
  • Interstitial condensation risk assessment (Glaser diagram—critical month);
  • A radar chart comparing key performance parameters, including steady-state transmittance (U-value), time lag (Φ), internal surface periodic thermal capacity (Cip), dynamic transmittance (Yie), and insulation thickness;
  • Verification of compliance with regulatory limits for both heating and cooling seasons.
For the case study, three different retrofit interventions aimed at improving the thermal performance of the opaque envelope were selected: INT.1, INT.2, and INT.3, the latter being a combination of the first two.
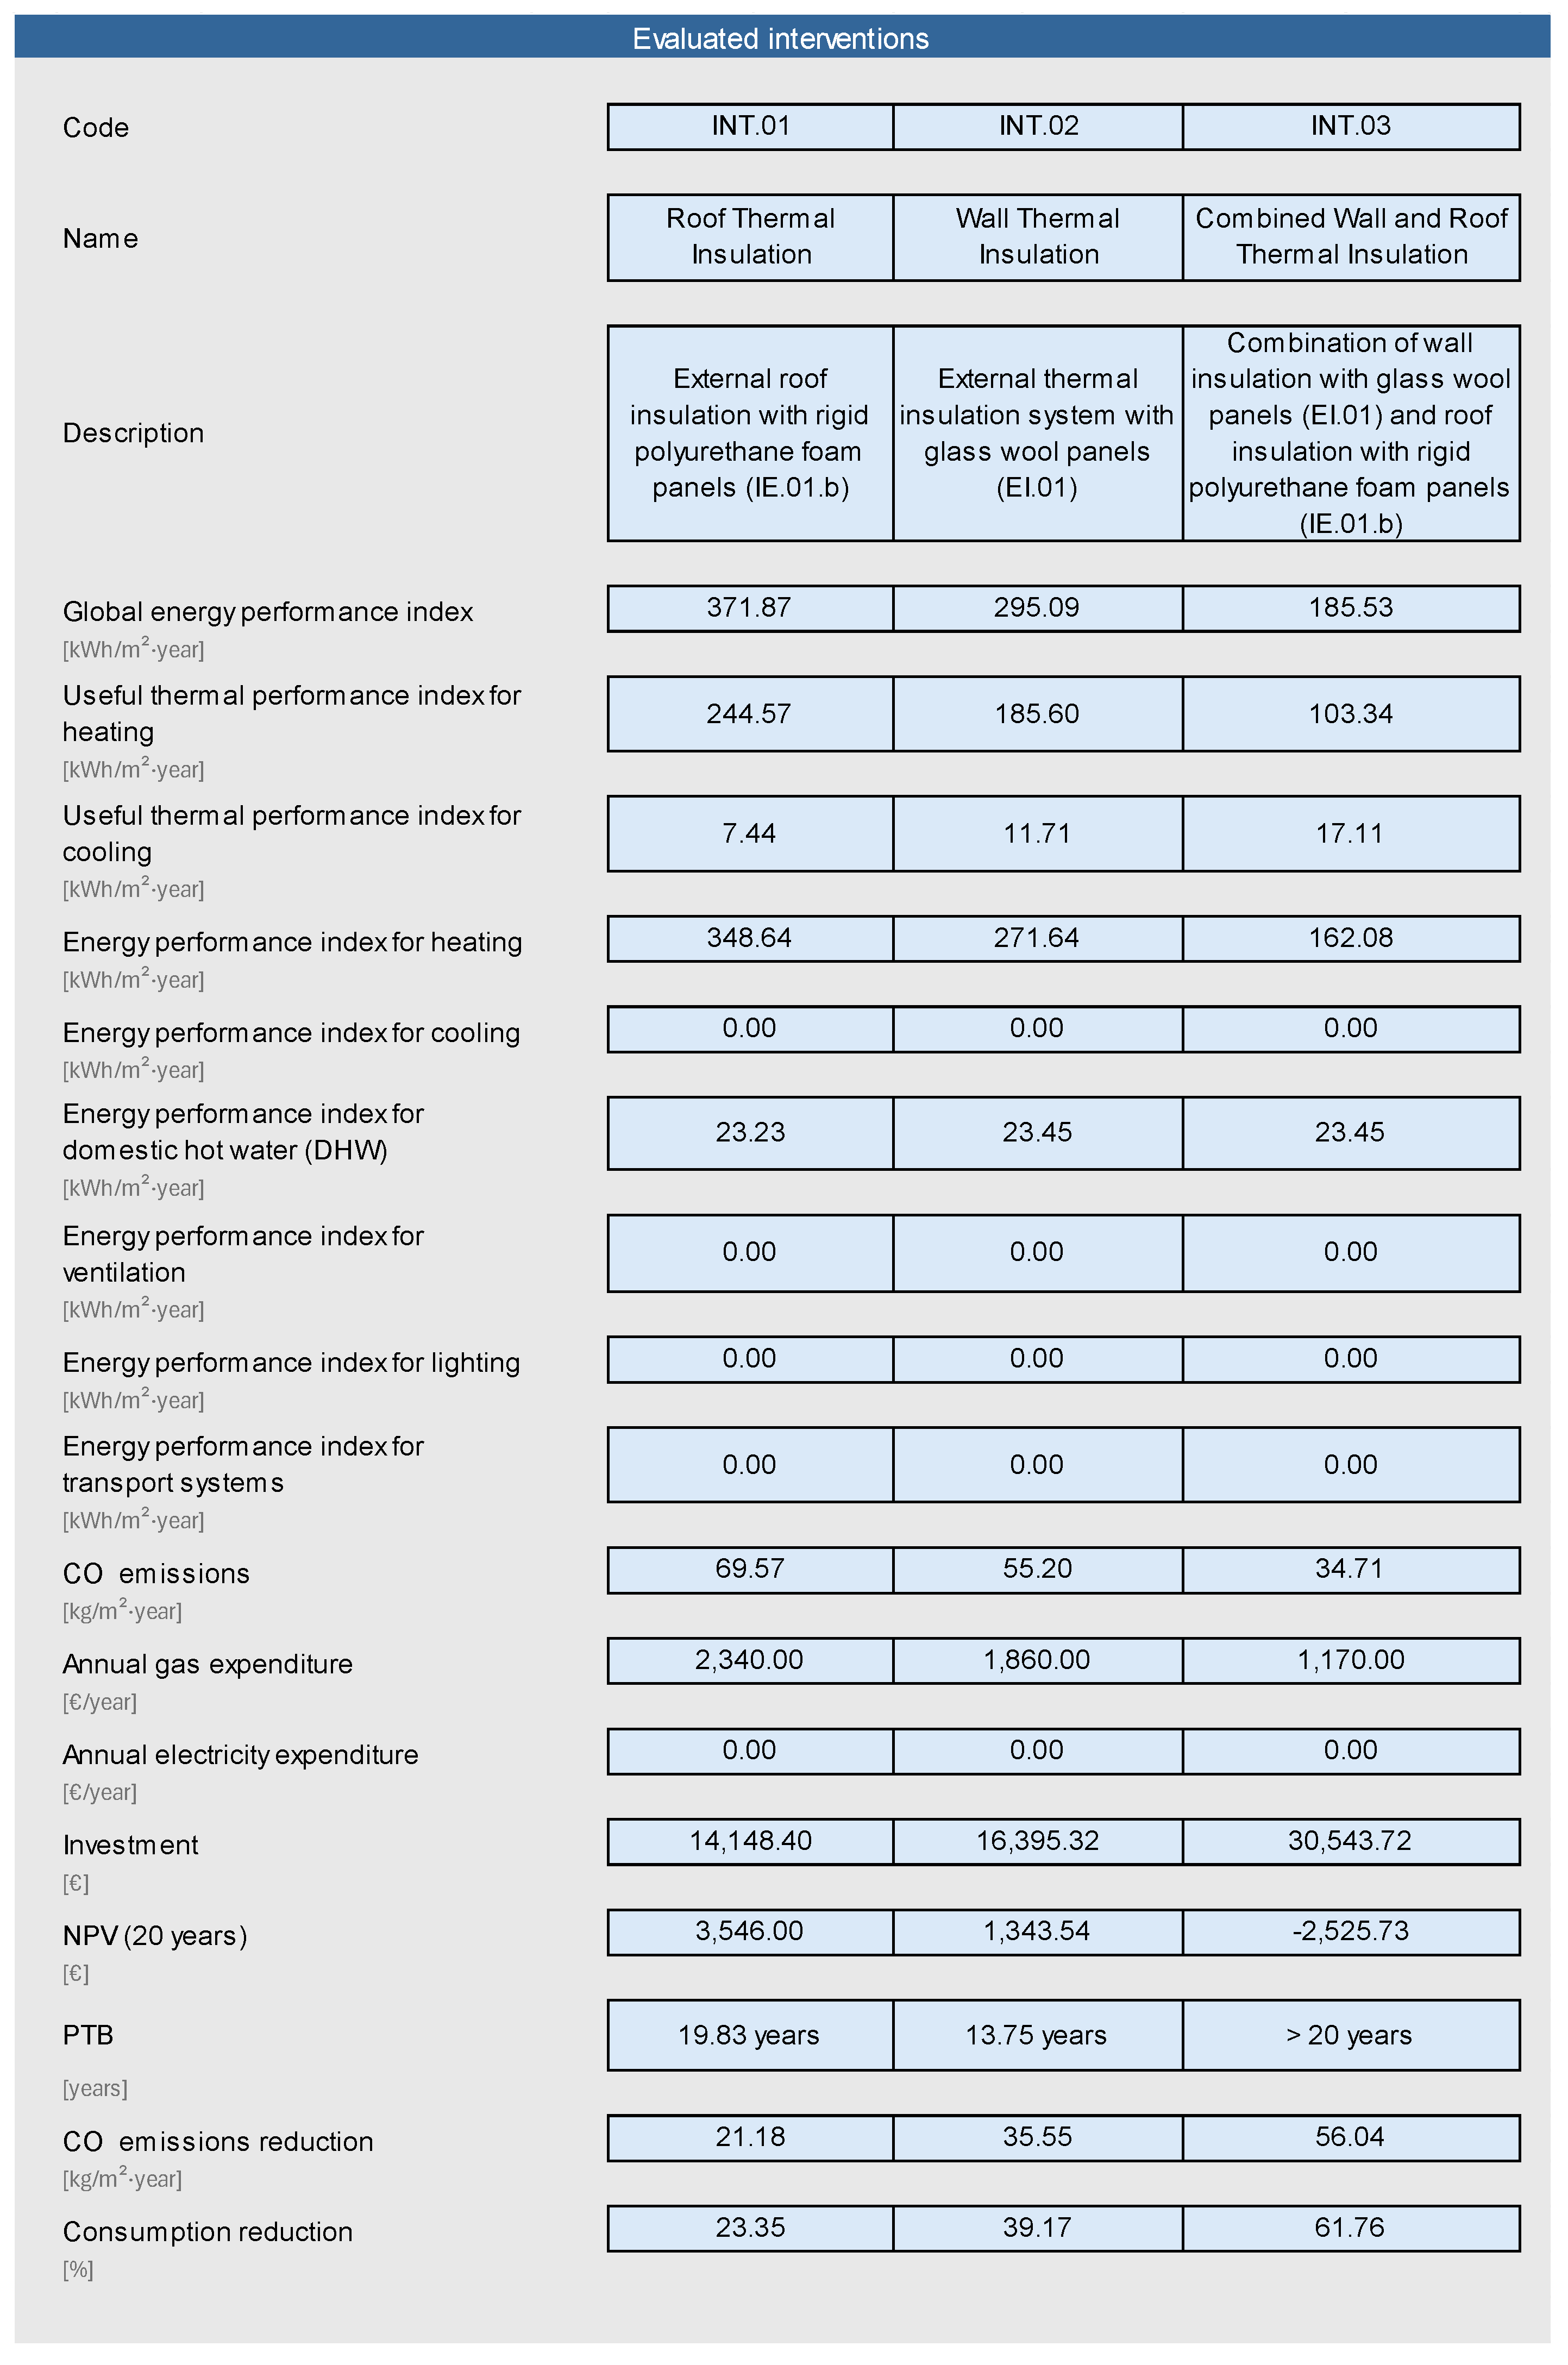
  • INT.1: The first energy retrofit intervention involves external insulation of the roof using solution IE.01.b, which consists of 10 cm thick rigid polyurethane foam panels with a thermal conductivity of 0.023 W/mK. This measure reduces the steady-state U-value to 0.20 W/m2K, complying with the maximum transmittance limits set out in Annex E—Thermal Insulation Requirements, which refers to the UNI EN ISO 6946 standard [44] for calculating the thermal transmittance of opaque structures (excluding thermal bridges).
  • As shown by the results, this intervention requires an investment of €14,148.40, achieves a CO2 emissions reduction of 21.18 kg/m2·year, a yearly energy cost saving of €713.00, and yields a positive 20-year NPV of €3546.00, corresponding to a Payback Time (PBT) of 19 years and 10 months. The PBT does not account for interest, inflation, or variations in gas prices.
  • INT.2: The second intervention targets thermal insulation of the vertical envelope using an ETICS system identified as SC.01, consisting of 12 cm thick rigid hydrophobic glass wool panels with low vapor permeability and a thermal conductivity of 0.032 W/mK. This reduces the steady-state U-value to 0.233 W/m2K, also in compliance with Annex E.
  • According to the results, this intervention requires an investment of €16,395.32, achieves a CO2 emissions reduction of 35.55 kg/m2·year, a yearly saving of €1193.00, and yields a positive 20-year NPV of €1343.54, corresponding to a PBT of 13 years and 9 months.
  • INT.3: The third intervention combines both previous strategies (INT.1 + INT.2). This combined solution, with a total investment of €30,543.72, achieves a CO2 emissions reduction of 56.04 kg/m2·year, a yearly cost saving of €1883.00, but results in a negative 20-year NPV of −€2525.73, indicating a PBT exceeding 20 years. This means that under a 3% discount rate, the investment cannot be fully recovered within the 20-year analysis period.
Figure 8 shows an excerpt of the simulation results generated by the BEST tool.

5. Discussion

5.1. Strengths and Practical Applications

The result described enables the achievement of significant benefits for the national electrical system and its users, such as:
  • Reduction in energy consumption: The support provided for optimizing energy efficiency interventions in national residential buildings leads to a decrease in energy demand at the national level, contributing to the overall improvement of the electrical system’s efficiency.
  • Improvement of system stability: The widespread implementation of energy efficiency interventions positively impacts the stability of the national electrical system by mitigating energy demand peaks and promoting a more rational and sustainable use of available resources.
  • Economic benefits for users: The cost-benefit analysis provided by the tool ensures the identification of targeted and optimized solutions, capable of maximizing the cost-benefit ratio. This leads to a significant reduction in energy costs for citizens and families, improving the economic sustainability of the interventions.
  • Promotion of environmental sustainability: The large-scale implementation of energy efficiency interventions contributes to reducing CO2 emissions, supporting the achievement of sustainability goals set at both European and national levels. This approach produces positive effects on both the environment and the quality of life within communities.
  • Support for the spread of innovative technologies: The tool promotes prefabricated and optimized technological solutions, encouraging the growth of the advanced and sustainable technology market. This dynamic stimulates innovation in the construction sector and strengthens the competitiveness of the businesses involved.
  • Strategic planning tool for institutions: The tool enables the creation of priority rankings for interventions, providing a valuable resource for energy and urban planning at the territorial level. This allows institutions to plan targeted actions, ensuring efficient resource allocation and a positive impact on the management of building stock.
To ensure broad accessibility and ease of use, a structured web-based application was developed.
The interface is organized into clearly defined sections that, in a sequential manner, describe the building–plant system based on its key characteristics. Particular emphasis was placed on minimizing the need for technical input from users. Where input is required, data entry is facilitated through guided, multiple-choice menus designed to streamline the process and support non-expert users.

5.2. Limitations and Challenges

At present, the developed tool is exclusively applicable to the residential sector. It was designed to streamline user input by accepting only data that meet predefined specifications, with constraints in place to prevent the entry of values outside the acceptable ranges established by the system.
In many instances, data input is limited to selections from predefined options available through dropdown menus. Consequently, expert users and technical professionals may experience limitations due to these predefined choices.
Regarding building systems, the tool’s structure is inherently rigid, as it does not support the integration of systems beyond those currently embedded in its internal database.
The estimation of intervention costs is based on targeted evaluations derived from regional price lists or analyses of market trends, leading to the identification of characteristic parametric costs depending on the type of intervention (€/kW, €/m2, €/m3). These costs are inclusive of VAT and cover materials, components, and installation. These costs require annual updating.
Currently, the tool does not allow users to simulate interventions involving the replacement of the existing heating and cooling systems; instead, it focuses exclusively on measures related to the building’s opaque envelope.

6. Conclusions and Future Developments

The current condition of the European residential building stock is marked by widespread obsolescence, inadequate thermal insulation, and high energy consumption, making it one of the primary contributors to greenhouse gas emissions in the built environment [5]. Energy retrofitting buildings within the European Union would result in substantial energy savings and a 26% reduction in energy consumption [45].
In Italy, the initial regulation aimed at reducing energy consumption in buildings was introduced in 1976 (Law 373/1976) [46]; however, it was characterized by limited restrictions and was frequently neglected due to insufficient enforcement mechanisms. It was not until 1991 (Law 10/1991) that the first comprehensive code targeting thermal performance standards was established, by which time more than 80% of the existing residential building stock was already constructed [47]. As a result, a substantial portion of Italy’s residential properties continues to exhibit high energy consumption levels [20]. Therefore, a significant portion of the residential building stock is in urgent need of deep renovation to meet current energy performance standards and contribute to the EU’s decarbonization goals. Renovation efforts must prioritize thermal insulation, modernization of HVAC systems, and the integration of renewable energy sources in order to reduce both energy demand and greenhouse gas emissions [48]. These buildings are often characterized by outdated construction techniques, inefficient HVAC systems, and poorly performing building envelopes. This context highlights the pressing need for scalable, accessible, and standardized retrofit strategies capable of supporting the transition toward nearly zero-energy buildings (nZEBs) and, in the longer term, positive energy buildings.
In response to this challenge, the BEST was developed as a decision-support instrument designed to simplify the preliminary energy analysis and the selection of retrofit solutions for residential buildings.
Through the classification of typical building envelope components and the integration of optimized, pre-calculated interventions, the tool offers practical guidance to designers and stakeholders, significantly reducing the complexity usually associated with energy performance assessments. Its application to a representative case study from the Italian residential context demonstrated the tool’s effectiveness in identifying sustainable and cost-efficient interventions, with measurable benefits in terms of energy savings, CO2 emissions reduction, and economic return. Future developments aim to extend the application of the tool to other building typologies, thereby broadening its scope and enhancing its contribution to the sustainability of the built environment as a whole.
The potential of the tool extends beyond individual building analysis. Upcoming developments of BEST will include the integration of geo-referencing functionalities, enabling the spatial mapping of energy performance levels across the national building stock. The integration with GIS platforms will allow the identification of territorial clusters with poor energy performance, supporting data-driven decision-making and the strategic allocation of public resources. This approach may serve as an effective instrument for urban and energy planning at the municipal or regional scale.
Moreover, the scope of the tool will be expanded to simulate interventions on building systems, particularly the replacement or upgrading of existing HVAC systems. Given that these systems account for a substantial portion of a building’s overall energy consumption, their inclusion will enable a more holistic assessment of retrofit strategies. This evolution will enhance the tool’s capacity to estimate comprehensive energy savings and provide a more robust basis for investment decisions.
To ensure long-term applicability, future versions of the tool will incorporate automatic update mechanisms for energy prices, material costs, and incentive schemes, thereby ensuring the reliability of economic assessments and alignment with evolving regulations and market conditions.
The BEST tool represents a significant step toward operationalizing the objectives of the European Green Deal in the residential sector. Its adaptability, user-friendliness, and analytical capacity make it a valuable resource for both professionals and policymakers, facilitating a broad transition toward energy-efficient and low-carbon buildings.
The integration of geo-referenced data and the inclusion of building system interventions will further enhance its impact, enabling comprehensive assessments at both the building and territorial levels.

Supplementary Materials

The following supporting information can be downloaded at: https://www.mdpi.com/article/10.3390/app15126817/s1, Supplement S1: National residential building stock matrix (Excel file); Supplement S2: Operational manual of the BEST Tool (PDF); Supplement S3: Technical sheet of Thermal Insulation Solutions (PDF).

Author Contributions

Conceptualization, M.C., F.C., E.P., C.R. and C.Z.; methodology, E.P. and C.Z.; software, M.C.; validation, E.P., C.R. and C.Z.; formal analysis, E.P. and C.Z.; investigation, E.P. and C.Z.; resources, E.P. and C.Z.; data curation, E.P., C.R. and C.Z.; writing—original draft preparation, E.P. and C.Z.; writing—review and editing, E.P., C.R. and C.Z.; visualization, F.C., E.P., C.R. and C.Z.; supervision, C.R.; project administration, F.C. and E.P.; funding acquisition, F.C. and E.P. All authors have read and agreed to the published version of the manuscript.

Funding

This research was funded by the Ministry of Economic Development, in the program for “Research of the Electricity System” in cooperation with ENEA on the project “High-Efficiency Buildings for the Energy Transition”, 2022–2024, Director’s decree of 15 September 2022.

Institutional Review Board Statement

Not applicable.

Informed Consent Statement

Not applicable.

Data Availability Statement

Conflicts of Interest

The authors declare no conflicts of interest.

References

  1. Alhazmi, H.; Alduwais, A.K.; Tabbakh, T.; Aljamlani, S.; Alkahlan, B.; Kurdi, A. Environmental Performance of Residential Buildings: A Life Cycle Assessment Study in Saudi Arabia. Sustainability 2021, 13, 3542. [Google Scholar] [CrossRef]
  2. Hong, J.; Shen, G.Q.; Guo, S.; Xue, F.; Zheng, W. Energy use embodied in China’s construction industry: A multi-regionalinput-output analysis. Renew. Sustain. Energy Rev. 2016, 53, 1303–1312. [Google Scholar] [CrossRef]
  3. Wang, T.; Seo, S.; Liao, P.C.; Fang, D. GHG emission reduction performance of state of-the-art green buildings: Review of two case studies. Renew. Sustain. Energy Rev. 2016, 56, 484–493. [Google Scholar] [CrossRef]
  4. Shad, R.; Khorrami, M.; Ghaemi, M. Developing an Iranian green building assessment tool using decision making methods and geographical information system: Case study in Mashhad city. Renew. Sustain. Energy Rev. 2017, 67, 324–340. [Google Scholar] [CrossRef]
  5. Economidou, M.; Todeschi, V.; Bertoldi, P.; D’Agostino, D.; Zangheri, P.; Castellazzi, L. Review of 50 years of EU energy efficiency policies for buildings. Energy Build. 2020, 225, 110322. [Google Scholar] [CrossRef]
  6. European Commission. EU Energy in Figures. Statistical Pocketbook 2018. Available online: https://euneighbourseast.eu/wp-content/uploads/2021/07/mjab18001enn.en_.pdf (accessed on 28 May 2025).
  7. European Commission. European Green Deal. Available online: https://commission.europa.eu/strategy-and-policy/priorities-2019-2024/european-green-deal_it (accessed on 6 February 2025).
  8. European Parlament. Ridurre le Emissioni di Anidride Carbonica: Obiettivi e Politiche dell’UE. Available online: https://www.europarl.europa.eu/pdfs/news/expert/2018/3/story/20180305STO99003/20180305STO99003_it.pdf (accessed on 6 February 2025).
  9. Tucci, F.; Amadei, F.; Pani, M.M.; Romano, G. Verso la Neutralità Climatica di Architetture e Città Green: Sperimentazioni e Casi di Studio nel Nord e Mittel Europa, 1st ed.; FancoAngeli: Milano, Italy, 2023; pp. 9–34. [Google Scholar]
  10. Fiore, P.; Donnarumma, G.; Falce, C. A Tool for the Evaluation of Energy-Environmental Retrofit Interventions on Opaque Walls Using ETICS. Sustainability 2021, 13, 4063. [Google Scholar] [CrossRef]
  11. Senate of the Republic. Attuazione Della Direttiva (UE) 2018/844 Concernente la Prestazione Energetica Nell’edilizia e L’efficienza Energetica Atto del Governo 158. Available online: https://www.senato.it/service/PDF/PDFServer/BGT/01143499.pdf (accessed on 6 February 2025).
  12. Magrini, A.; Lentini, G.; Cuman, S.; Bodrato, A.; Marenco, L. From nearly zero energy buildings (NZEB) to positive energy buildings (PEB): The next challenge—The most recent European trends with some notes on the energy analysis of a forerunner PEB example. Dev. Built Environ. 2020, 3, 100019. [Google Scholar] [CrossRef]
  13. Poli, I.; Ravagnan, C.; Ricci, L. A Planning Framework for Urban Resilience toward Climate Adaptation and Mitigation: Potentials and Limits of “Eco-Districts”. Urban Sci. 2022, 6, 49. [Google Scholar] [CrossRef]
  14. Nematchoua, M.K.; Sadeghi, M.; Reiter, S. Strategies and scenarios to reduce energy consumption and CO2 emission in the urban, rural and sustainable neighborhoods. Sustain. Cities Soc. 2021, 72, 103053. [Google Scholar] [CrossRef]
  15. Hafez, F.S.; Sa’di, B.; Safa-Gamal, M.; Taufiq-Yap, Y.H.; Alrifaey, M.; Seyedmahmoudian, M.; Stojcevski, A.; Horan, B.; Mekhilef, S. Energy Efficiency in Sustainable Buildings: A Systematic Review with Taxonomy, Challenges, Motivations, Methodological Aspects, Recommendations, and Pathways for Future Research. Energy Strategy Rev. 2023, 45, 101013. [Google Scholar] [CrossRef]
  16. Sala Lizarraga, J.M.P.; Picallo-Perez, A. 12—Design and optimization of the envelope and thermal installations of buildings. In Exergy Analysis and Thermoeconomics of Buildings. Design and Analysis for Sustainable Energy Systems; Butterworth-Heinemann: Oxford, UK, 2020; pp. 911–1005. [Google Scholar]
  17. Poel, B.; Cruchten, G.; Balaras, C.A. Energy performance assessment of existing dwellings. Energy Build. 2007, 39, 393–403. [Google Scholar] [CrossRef]
  18. Paraschiv Lizica, S.; Paraschiv, I.S.; Ion, V.I. Increasing the energy efficiency of buildings by thermal insulation. Energy Procedia 2017, 128, 393–399. [Google Scholar]
  19. Santos, P.; Abrantes, D.; Lopes, P.; Mateus, D. Experimental and Numerical Performance Evaluation of Bio-Based and Recycled Thermal Break Strips in LSF Partition Walls. Buildings 2022, 12, 1237. [Google Scholar] [CrossRef]
  20. Ali, A.; Issa, A.; Elshaer, A. A Comprehensive Review and Recent Trends in Thermal Insulation Materials for Energy Conservation in Buildings. Sustainability 2024, 16, 8782. [Google Scholar] [CrossRef]
  21. Jezierski, W.; Sadowska, B.; Pawłowski, K. Impact of Changes in the Required Thermal Insulation of Building Envelope on Energy Demand, Heating Costs, Emissions, and Temperature in Buildings. Energies 2021, 14, 56. [Google Scholar] [CrossRef]
  22. Bazzocchi, F.; Ciacci, C.; Di Naso, V. Evaluation of Environmental and Economic Sustainability for the Building Envelope of Low-Carbon Schools. Sustainability 2021, 13, 1702. [Google Scholar] [CrossRef]
  23. Amani, N. Energy efficiency of residential buildings using thermal insulation of external walls and roof based on simulation analysis. Energy Storage Sav. 2025, 4, 48–55. [Google Scholar] [CrossRef]
  24. Imane, S.Z.; Benoudjafer, I.; Benoudjafer, I. Towards the use of natural thermal insulation on the exterior of vertical building walls in desert regions: A case study in the city of Bechar, Algeria. J. Therm. Eng. 2024, 10, 308–320. [Google Scholar]
  25. Häkkinen, T. Systematic method for the sustainability analysis of refurbishment concepts of exterior walls. Constr. Build. Mater. 2012, 37, 783–790. [Google Scholar] [CrossRef]
  26. Sdei, A.; Tittelein, P.; Lassue, S.; McEvoy, M.E. Dynamic Thermal Modeling of Retrofitted Social Housing in England and France. In Proceedings of the CLIMA 2013: 11th REHVA World Congress and the 8th International Conference on Indoor Air Quality, Ventilation and Energy Conservation in Buildings, Prague, Czech Republic, 16–19 June 2013; Karel Kabele, M.U., Suchý, K., Lain, M., Eds.; Society of Environmental Engineering (STP): Prague, Czech Republic, 2013; p. 6882. [Google Scholar]
  27. Ballarini, I.; Corgnati, S.P.; Corrado, V. Use of reference buildings to assess the energy saving potentials of the residential building stock: The experience of TABULA project. Energy Policy 2014, 68, 273–284. [Google Scholar] [CrossRef]
  28. Flourentzou, F.; Genre, J.-L.; Roulet, C.-A. Epiqr-tobus: A new generation of refurbishment decision aid methods. In Towards Sustainable Building; Maiellaro, N., Ed.; Springer Science + Business Media: Dordrecht, The Netherlands, 2001; Volume 61, pp. 161–169. [Google Scholar]
  29. Konstantinou, T. Facade Refurbishment Toolbox: Supporting the Design of Residential Energy Upgrades, 1st ed.; A + BE|Architecture and the Built Environment: Delft, The Netherlands, 2014; pp. 1–420. [Google Scholar]
  30. Jradi, M. A Decision-Making Tool for Sustainable Energy Planning and Retrofitting in Danish Communities and Districts. Energies 2025, 18, 692. [Google Scholar] [CrossRef]
  31. Garufi, D.; de Vries, B. Decision support tool for sustainable renovation projects in the dutch housing corporations. In Proceedings of the CISBAT 2015, International Conference, Lausanne, Switzerland, 9–11 September 2015; Future Buildings & Districts—Sustainability from Nano to Urban Scale. Centre de Recherches en Physique des Plasmas: Lausanne, Switzerland, 2015; pp. 987–992. [Google Scholar]
  32. Dall’O’, G.; Galante, A.; Torri, M. A methodology for the energy performance classification of residential building stock on an urban scale. Energy Build. 2012, 48, 211–219. [Google Scholar] [CrossRef]
  33. Deng, Z.; Chen, Y.; Yang, J.; Causone, F. AutoBPS: A tool for urban building energy modeling to support energy efficiency improvement at city-scale. Energy Build. 2023, 282, 112794. [Google Scholar] [CrossRef]
  34. Godoy-Rangel, C.; Gijon-Rivera, M.; Belmont, Z.V.C.; Mousavi, N.; Rivera-Solorio, C.I.; Mousavi, S. An energy efficiency tool to evaluate energy consumption and emissions in buildings in northern Mexico. In Proceedings of the XXVIII Congreso Internacional Anual de la SOMIM, Bogotà, Colombia, 21–23 September 2022. [Google Scholar]
  35. Godoy-Rangel, C.; Rivera-Solorio, C.I.; Gijón-Rivera, M. TecSB: An Open Web Tool of Energy Efficiency and Solar Energy Integration in Mexican Buildings. Sustainability 2023, 15, 3630. [Google Scholar] [CrossRef]
  36. Arab, Y.; Hassan, A.S.; Al-Absi, Z.A.; Achour, H.; Witchayangkoon, B.; Qanaa, B. Retrofitting of a High-Rise Residential Building for Energy Efficiency with OTTV as an Assessment Tool. J. Adv. Res. Fluid Mech. Therm. Sci. 2023, 102, 110–119. [Google Scholar] [CrossRef]
  37. Pennacchia, E.; Romeo, C.; Zylka, C. Towards High-Efficiency Buildings for Sustainable Energy Transition: Standardized Prefabricated Solutions for Roof Retrofitting. Sustainability 2024, 16, 3850. [Google Scholar] [CrossRef]
  38. UNI 10349-1:2016; Heating and Cooling of Buildings—Climatic Data—Part 1: Monthly Means for Evaluation of Energy Need for Space Heating and Cooling and Methods for Splitting Global Solar Irradiance into the Direct and Diffuse Parts and for Calculate the Solar Irradiance on Tilted Planes. UNI: Milan, Italy, 2016.
  39. UNI 10339:1995; Impianti Aeraulici al Fini di Benessere. Generalità, Classificazione e Requisiti. Regole per la Richiesta D’offerta, L’offerta, L’ordine e la Fornitura. UNI: Milan, Italy, 1995.
  40. UNI EN ISO 13786:2008; Prestazione Termica dei Componenti per Edilizia—Caratteristiche Termiche Dinamiche—Metodi di Calcolo. UNI: Milan, Italy, 2008.
  41. UNI/TS 11300-1; Energy Performance of Buildings—Part 1: Evaluation of Energy Need for Space Heating and Cooling. Ente Nazionale Italiano di Unificazione: Milan, Italy, 2014.
  42. UNI/TS 11300-2; Energy Performance of Buildings—Part 2: Determination of Primary Energy Demand and Efficiencies for Space Heating, Domestic Hot Water Production, Ventilation, and Lighting. Ente Nazionale Italiano di Unificazione: Milan, Italy, 2019.
  43. UNI/TS 11300-4; Energy Performance of Buildings—Part 4: Use of Renewable Energy Sources and Other Generation Methods for Space Heating and Domestic Hot Water Production. Ente Nazionale Italiano di Unificazione: Milan, Italy, 2016.
  44. ISO 6946:2017; Building Components and Building Elements—Thermal Resistance and Thermal Transmittance—Calculation Methods. ISO: Geneva, Switzerland, 2017.
  45. Biere-Arenas, R.; Spairani-Berrio, S.; Spairani-Berrio, Y.; Marmolejo-Duarte, C. One-Stop-Shops for Energy Renovation of Dwellings in Europe—Approach to the Factors That Determine Success and Future Lines of Action. Sustainability 2021, 13, 12729. [Google Scholar] [CrossRef]
  46. Ministry for Ecological Transition. Strategy for Energy Retrofitting of National Building Stock. Available online: https://energy.ec.europa.eu/system/files/2021-12/2020_ltrs_italy_-_en.pdf (accessed on 28 May 2025).
  47. Georgescu, E.-S.; Georgescu, M.S.; Macri, Z.; Marino, E.M.; Margani, G.; Meita, V.; Pana, R.; Cascone, S.M.; Petran, H.; Rossi, P.P.; et al. Seismic and Energy Renovation: A Review of the Code Requirements and Solutions in Italy and Romania. Sustainability 2018, 10, 1561. [Google Scholar] [CrossRef]
  48. Babiarz, B.; Krawczyk, D.A.; Siuta-Olcha, A.; Manuel, C.D.; Jaworski, A.; Barnat, E.; Cholewa, T.; Sadowska, B.; Bocian, M.; Gnieciak, M.; et al. Energy Efficiency in Buildings: Toward Climate Neutrality. Energies 2024, 17, 4680. [Google Scholar] [CrossRef]
Figure 1. Methodology flowchart for tool development.
Applsci 15 06817 g001
Figure 2. Example of Achievable Winter and Summer Psychrometric Transformations.
Applsci 15 06817 g002
Figure 3. Explicit finite difference scheme used for solving the dynamic heat exchange of walls. On the x-axis, the thicknesses are represented, and on the y-axis, the times are plotted.
Applsci 15 06817 g003
Figure 4. Equivalent electrical circuit for thermal modeling of the wall.
Applsci 15 06817 g004
Figure 5. Floor plan of the case study, three-dimensional model, and detailed data.
Applsci 15 06817 g005
Figure 6. Extract from the National Residential Building Stock Matrix, highlighting the most representative technical components of the existing envelope for the case study.
Applsci 15 06817 g006
Figure 7. Extract from the BEST tool with the as-is condition of the case study building.
Applsci 15 06817 g007
Figure 8. Extract from the BEST tool with summarized data for the three different intervention solutions related to the thermal efficiency of the opaque envelope.
Applsci 15 06817 g008
Table 1. A comparison of the various tools for energy efficiency.
ToolObjectiveStrengthsWeaknesses
SUSREF
(Sustainable refurbishment of building façades and external walls)
Provides a systematic method for the sustainability refurbishment of building façades and external walls, combining environmental impact assessment, life-cycle cost analysis, and functional performance evaluation to guide the design and implementation of energy-efficient and environmentally responsible retrofit solutions.Comprehensive environmental assessment; supports multi-criteria decision-making.Focused mainly on external walls;
limited scope beyond envelope elements;
Requires specialized expertise.
IFORE
(Innovation for Renewal)
Applies dynamic thermal modeling to evaluate retrofit scenarios in social housing.Detailed thermal simulations; context-specific applications in UK and France.Requires accurate input data;
limited generalizability to other regions.
TABULA
(Typology Approach for Building Stock Energy Assessment)
Standardized methodology for assessing the energy performance of the residential building stock in Europe.Standardized approach; applicable at national and EU levels.Simplified models may not capture all building-specific variables;
does not provide the payback period.
EPIQR
(Energy Performance Indoor environment Quality Retrofit)
These methods assist experts in conducting a comprehensive building diagnosis that encompasses building deterioration, energy performance, indoor environmental quality, and compliance with relevant standards and regulations.User-friendly interface;
includes economic and technical factors.
Requires regular data updates;
limited integration with modern sustainability metrics.
Façade Refurbishment ToolboxSupports design decisions in the energy upgrade of building façades.Design-oriented; includes aesthetic and technical criteria.Focused mainly on façade;
lacks broader system-level assessment.
DanCTPlan energy planning toolDecision-Making tool for sustainable energy planning and retrofitting in Danish communities and districts.Scalable from building to district level;
integrates planning tools.
Complex implementation;
high data requirements.
Dutch Decision-Support ToolFacilitates decision-making for sustainable renovation in social housing.Considers environmental and social benefits;
scenario analysis.
Context-specific;
requires detailed and updated data.
Urban-scale Classification ToolClassifies energy performance of residential stock at urban scale.Supports urban energy planning;
integrative data use.
Dependent on data availability;
needs regulatory updates.
AutoBPS
(Automated Building Performance Simulation)
Automates urban building energy modeling using public data.Minimizes manual input;
suitable for large-scale simulations.
High computational needs; sensitive to data resolution.
TecSB Sustainable Building CalculatorA free virtual platform that evaluates energy efficiency measures applicable to building roofs and windows, as well as the potential for on-site energy generation in Mexico.Free accessibility and ease of use;
integrated assessment of energy efficiency and solar energy generation;
estimates of avoided greenhouse gas emissions and payback periods for investments.
Limited geographical applicability;
requirement for detailed input data;
limitations in efficiency strategies.
OTTV
(Overall Thermal Transfer Value Tool)
Assesses energy efficiency of high-rise buildings using OTTV index.Applicability in tropical climates.Energy efficiency improvements limited to walls and windows;
restricted geographical applicability;
lack of economic analysis of the interventions.
Table 2. Functionalities of the tool and their descriptions.
Tool FunctionalityDescription
Development of the pre-retrofit energy modelEnables the creation of an energy model of the building in its current configuration
Assessment of current energy performanceAnalyzes the building’s energy performance using synthetic indicators
Selection of optimized retrofit solutionsIdentifies the most effective retrofit measures based on consolidated data and technical criteria
Construction of the post-retrofit model and analysis of benefitsSimulates the behavior of the retrofitted building and evaluates both economic and technical benefits
Comparison of solutions and prioritization of interventionsAllows for the comparison of alternative scenarios to establish a hierarchy of improvement actions
Table 3. Minimum required data and associated simplifying assumptions adopted in the first module of the BEST tool for preliminary energy analysis.
DataSimplifying Assumptions
LocationClimatic data derived from UNI 10349 standard [38]
Building use typeSetpoint temperature data, system operation schedules, occupancy levels, air flow rates, domestic hot water demand, and internal loads derived from UNI TS 11300-1 and UNI 10339 [39] standards
Thermal envelope characteristicsOnly one type of opaque or transparent surface per orientation is considered
Type of thermal generators for heating/cooling/DHW and renewable energy systemsLimited selection options with standardized efficiencies as defined by UNI TS 11300 standards
Installation period of building systemsEfficiency values for subsystems are selected based on assumed installation periods
Disclaimer/Publisher’s Note: The statements, opinions and data contained in all publications are solely those of the individual author(s) and contributor(s) and not of MDPI and/or the editor(s). MDPI and/or the editor(s) disclaim responsibility for any injury to people or property resulting from any ideas, methods, instructions or products referred to in the content.

