1. Introduction
In applications such as gaming and virtual and augmented reality, the goal is to provide the user with an immersive experience, both visual and auditory. In terms of audio, spatial sound reproduction enables such immersion through the physically and perceptually accurate reproduction of a virtual sound field. One primary objective of multichannel audio systems is to create precise directional effects that accurately reproduce the intended spatial image, comparable to the spatial image created by real sound sources. This work provides an insight into the Minimum Audible Angle (MAA), a metric that is part of spatial resolution and is linked to the perception of sound-source localisation [
1,
2].
Two principal methods for reproducing auditory events can be identified in spatial audio systems. The first involves creating a real sound source by reproducing a signal through a specific loudspeaker, resulting in the perception of sound emanating from that loudspeaker’s position. The second method distributes the signal between multiple loudspeakers to create virtual sound sources, a process known as panning [
3]. These virtual sources are perceived between physical loudspeakers, with their perceived position dependent on amplitude relationships. Amplitude panning primarily exploits the Interaural Level Difference (ILD), a fundamental auditory localisation mechanism [
2]. The manipulation of the gain between two loudspeakers creates a phantom source between them, with its position determined by the specific gain ratios [
3].
Among different spatial sound reproduction techniques, Ambisonics is commonly used due to its “first-person” perspective, as well as the ease of audio-scene translation, such as rotation [
4,
5,
6]. It therefore allows for the use of head-tracking for the purpose of natural navigation in the virtual scene and increased localisation accuracy. Ambisonic technology represents a scene-based approach to spatial audio reproduction, distinct from channel-based and object-based methodologies. It does not rely on a predefined playback system, offering greater flexibility [
6]. It enables the encoding of directional information about sound sources in a three-dimensional space and facilitates reproduction through spherical harmonic representation. It is also used as a foundation for an emerging open-source Immersive Audio Model and Format [
7] known also as Eclipsa Audio [
8], which makes Ambisonics more commercially accessible for a wider audience and therefore the perceptual evaluation is even more justified.
Auditory spatial sound location is a complex phenomenon, highly dependent on the environment, the acoustics of the room, and the familiarity with the sound source, among others [
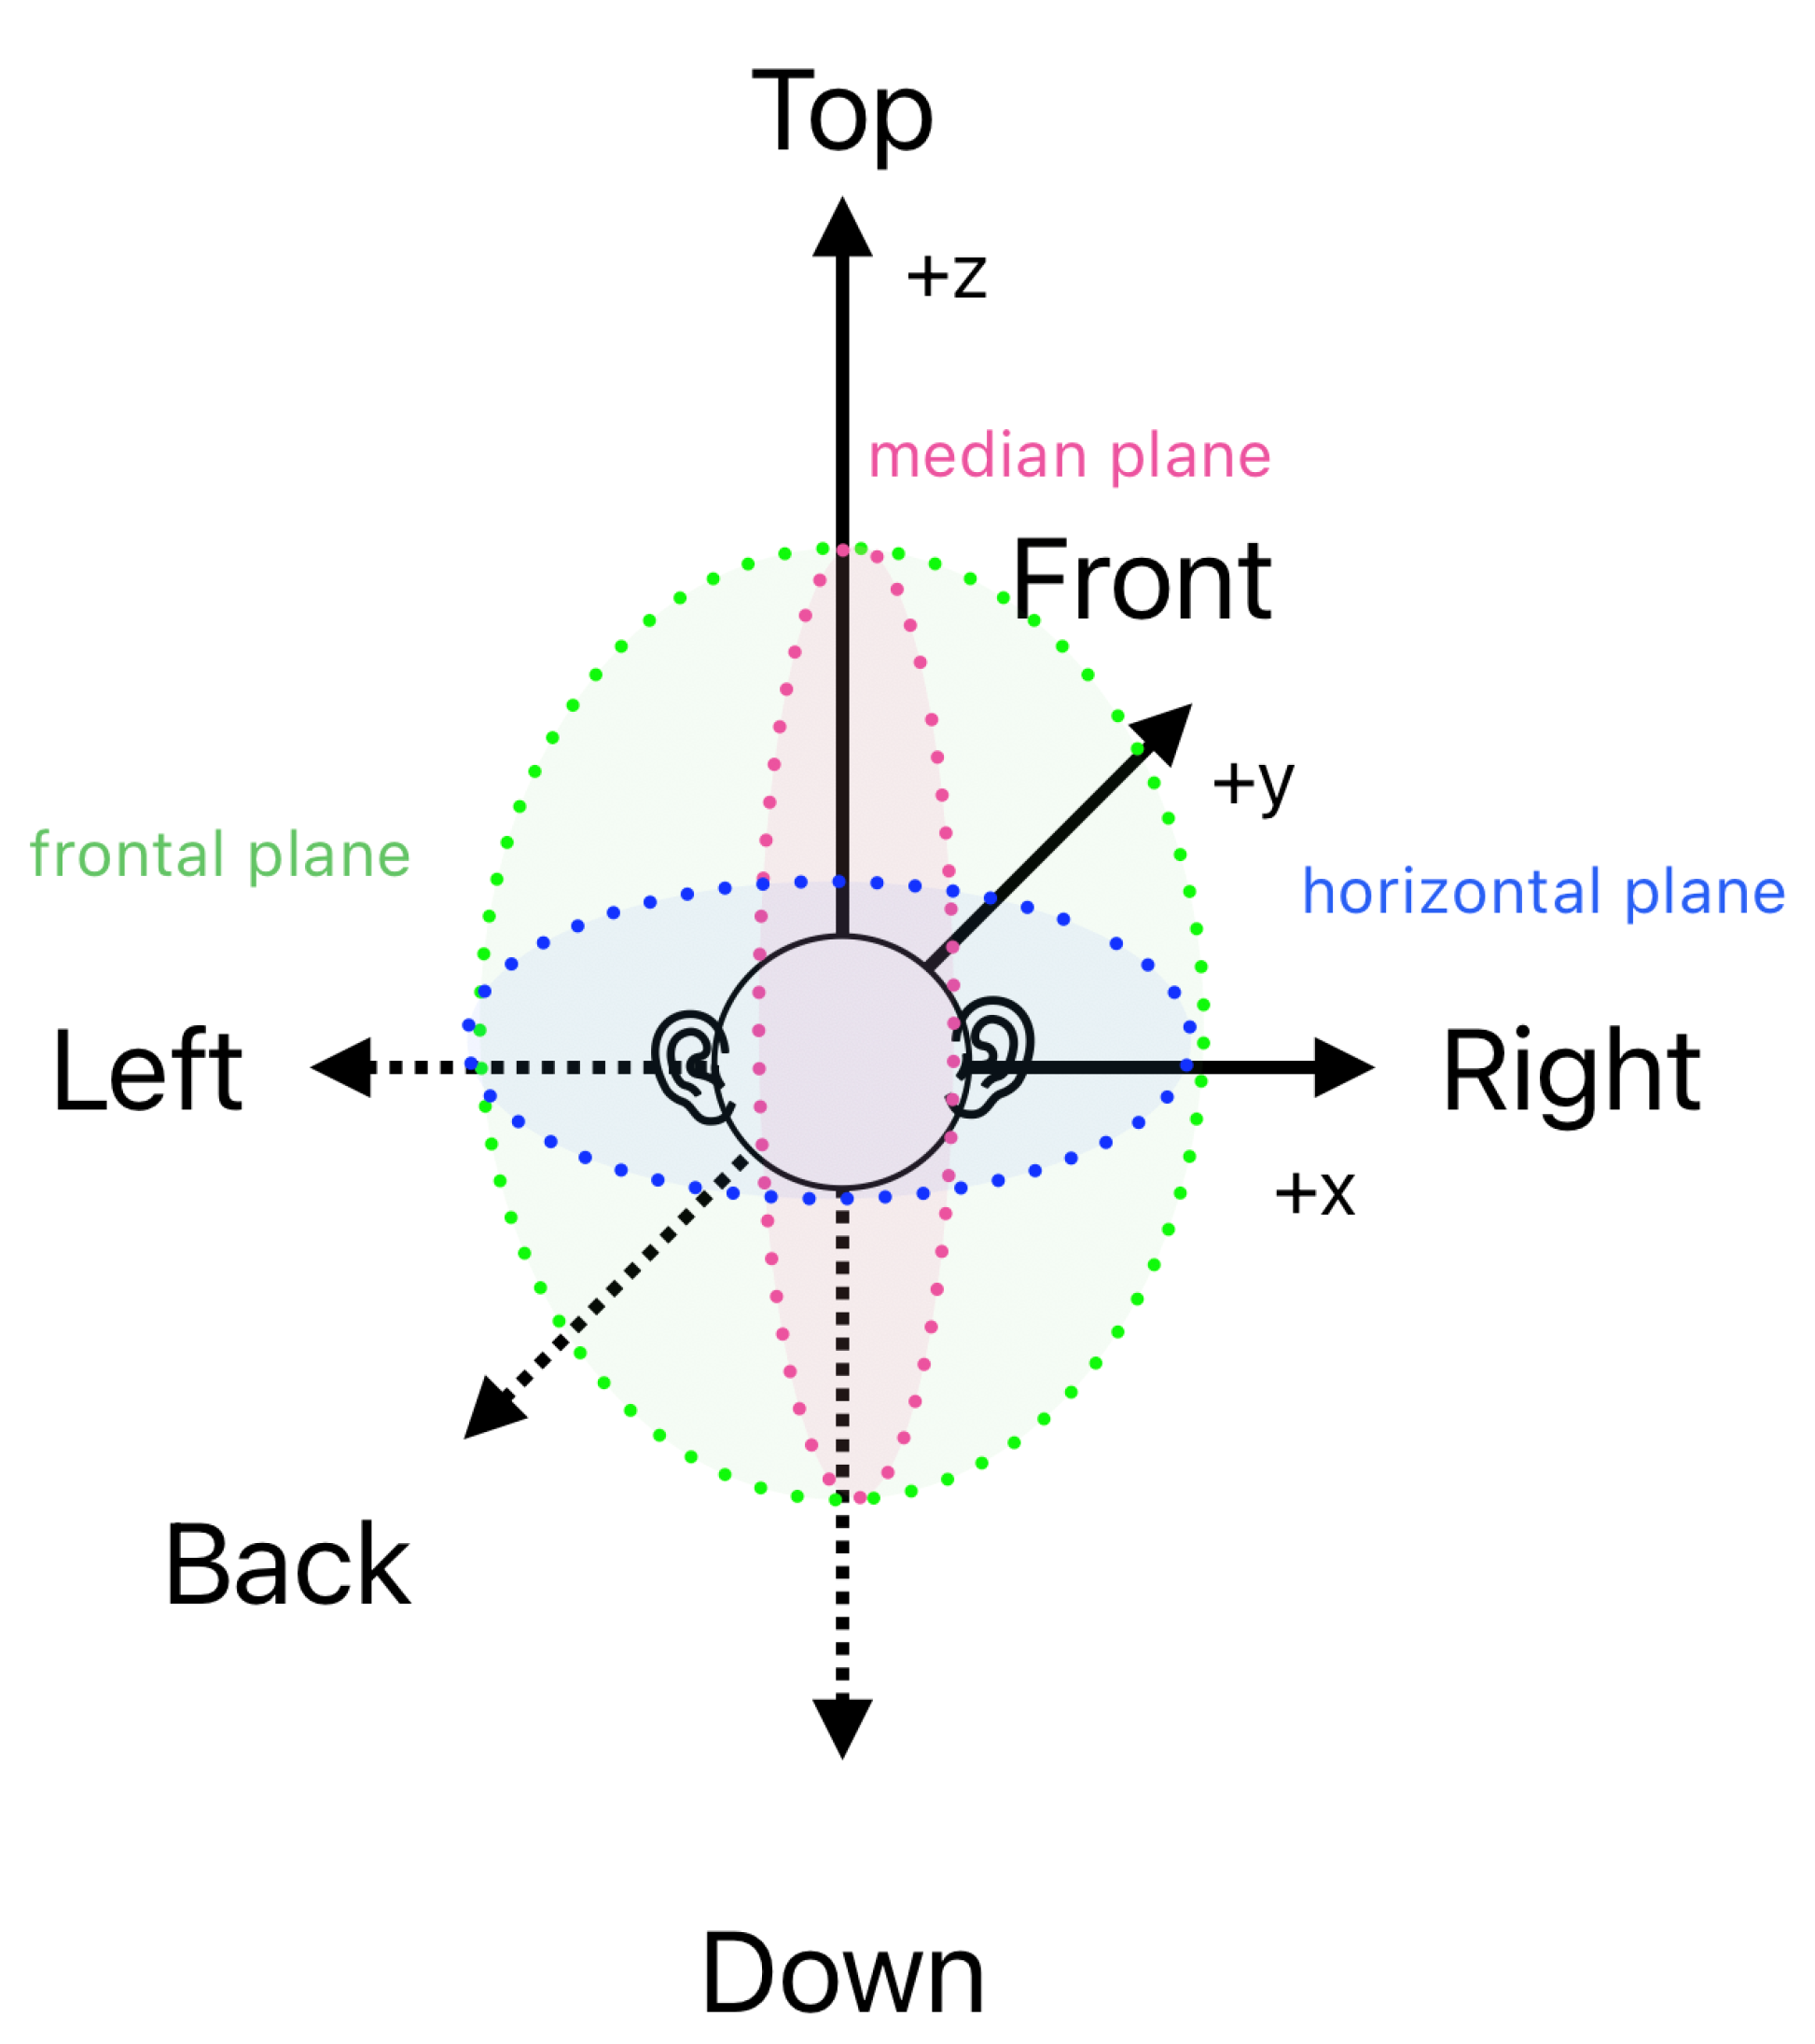
2]. It varies significantly within individual cases and changes with age. Of the three planes depicted in
Figure 1, the accuracy of localisation is the highest on the horizontal plane (azimuthal angle), which also exhibits less inter-subject variability.
Several different measures refer to the acuity of sound localisation in a three-dimensional space. Quantitative metrics include localisation, localisation blur, MAA [
9], and Minimum Audible Moving Angle (MAMA) [
10]. On the other hand, qualitative measures comprise locatedness (ease of localisation) or the source image spread [
11]. The focus of this study is the MAA, defined as the smallest angle at which a listener can discriminate between two successively presented stationary sound sources [
2]. It is part of the spatial resolution attribute, is relatively easy to measure, and can provide useful insight into the perceptual quality of the system and the decoder.
Several studies have investigated the localisation of sound sources in ambisonic scenes reproduced using virtual or real microphones [
12]; at times studies also included synthesised scenes [
13]. Ref. [
14] explored the MAA in the context of reverberation, establishing that reverberation impairs the MAA threshold. The spatial resolution, however, is understudied. The MAA was determined for the Vector Base Amplitude Panning (VBAP) method [
15]. A ninth-order ambisonic reproduction system has been shown to produce spatial blurring that remains below the threshold of human spatial auditory acuity [
16]. Ref. [
17] compared mode matching and pseudoinverse methods on a horizontal layer with AllRAD rendering, proving that there is no statistical difference in the MAA between horizontal and periphonic rendering methods on that layer. However, to the authors’ best knowledge, no study has looked into the differences in the MAA due to sound field reproduction discrepancies caused by ambisonic decoders while looking at both objective metrics and subjective evaluation.
This work focuses on studying the MAA in the horizontal plane for three commonly used ambisonic decoders: the SAD, EPAD, and AllRAD. The rationale behind selecting these three decoders was a comparison between the simplest approach without perceptual consideration and the two most popular perceptual approaches. The objective evaluation of the decoder is relatively easy to perform; however, further evaluation is needed to fully determine its perceptual performance. The localisation accuracy across the decoders is evaluated in a listening test using third-order Ambisonics, focusing on the MAA and its dependency on a specific decoder design.
The structure of this paper is as follows.
Section 2 presents the motivation behind investigating the MAA in ambisonic technology and the context of existing studies on the MAA.
Section 3 describes the investigated ambisonic decoders, including their objective metrics.
Section 4 elaborates on the methodology and experimental design, followed by a comprehensive description of the results in
Section 5. In the discussion in
Section 6, some additional factors are raised that are beyond the scope of this study but are worth considering in future research.
Section 7 offers concluding remarks.
2. Background
In spatial sound reproduction, an ambisonic decoder is responsible for the conversion of encoded spatial information and its distribution to loudspeakers. Gerzon [
4], credited with developing ambisonic technology, noted that designing a decoder that would account for all psychoacoustic variables would require extensive computational resources. However, with current technological advancements, this limitation is no longer considered significant [
6].
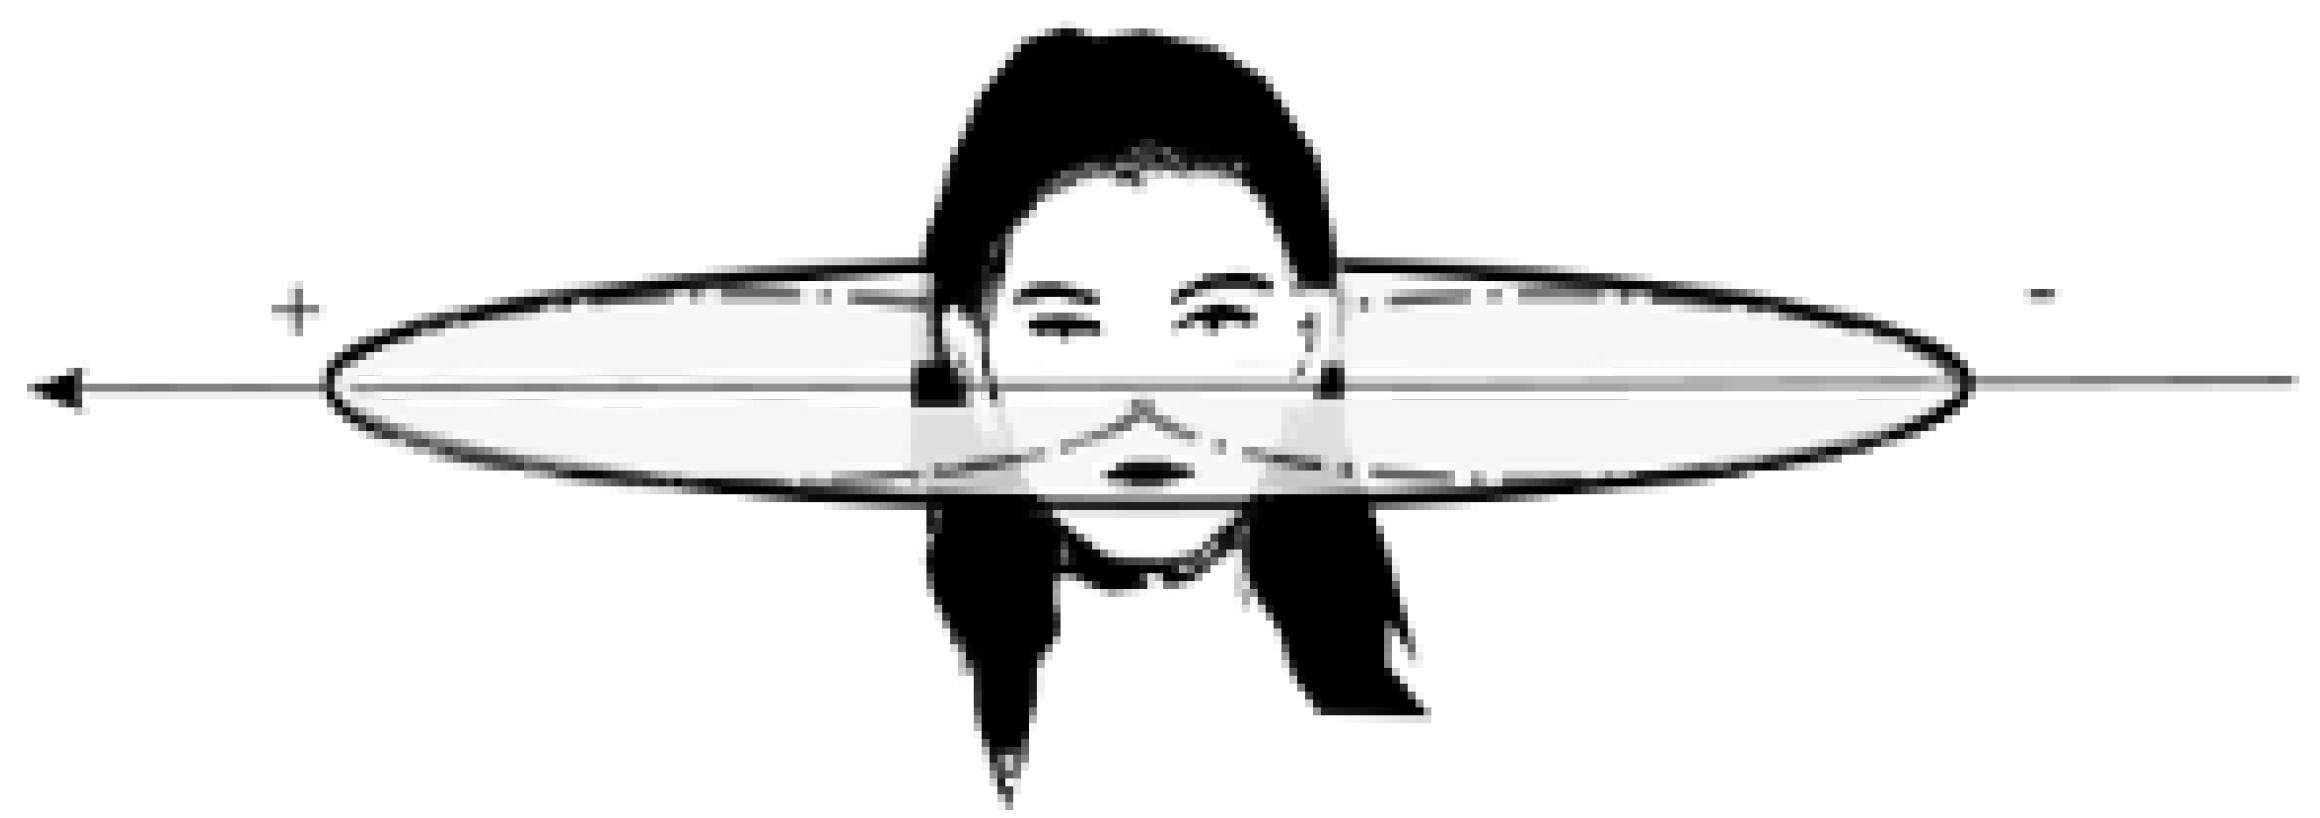
In the theory of localisation in the ambisonic decoder design, the internal auditory system is treated as a black box, while external mechanisms can be conceptualised as analogous to pressure and gradient-pressure microphones [
4], as schematically depicted in
Figure 2.
These simplifications allow for choosing reduced parameter sets while enabling the design of perceptually effective decoders. Gerzon introduced two critical models for these mechanisms: the velocity model and the energy model. In practical implementation, both the velocity vector
, sometimes referred to as Makita localisation, and the energy vector
must be addressed. Further enhancements of perceptual performance are possible to achieve but are not fundamental to basic functionality. To construct perceptually accurate sound fields, decoders should follow these principles (in order of importance) [
4]:
High frequencies must converge in the source direction (energy vector);
Maintain constant amplitude gains for all directions;
Ensure equivalence in the perceived direction for both high and low frequencies;
Provide constant energy gain for all directions;
Accurately reproduce wavefront direction and velocity at low frequencies (velocity vector).
Gerzon’s vector models characterise sound field properties at the listener’s position. All aforementioned aspects should be integrated into the decoder design to successfully implement the “majority verdict”—an auditory direction resolving mechanism in which the human auditory system localises the sound source based on many available cues, choosing the ones that are in agreement [
4]. Decoders fulfilling these requirements are classified as “two-band” or “Vienna decoders” [
5]. The complexity of the implementation varies according to the specific loudspeaker configuration. The spherical
t-designs are considered optimal [
19], as they offer simplifications to numerical integration on a sphere for polynomials of degree
[
20]. The investigation in this study, however, focuses on a system that does not constitute a
t-design configuration, in which case certain decoder implementations may exhibit equivalent performance characteristics [
6].
4. Selected Ambisonic Decoders
Ambisonic decoding plays a crucial role in spatial audio reproduction, influencing sound localisation and perceived immersion [
24]. Various decoding approaches exist, each with different trade-offs in terms of energy distribution, spatial accuracy, and computational complexity. This section examines three selected ambisonic decoders: the SAD, EPAD, and AllRAD. Their principles, performance characteristics, and practical implications for playback system configurations are analysed in detail.
The
Sampling Ambisonic Decoder (SAD) represents the most fundamental algorithm among those investigated in this study. Its core principle involves sampling virtual panning functions at the directions of
L loudspeakers [
6]. For spherical reproduction systems, the decoder matrix is simply
The factor
reflects that each loudspeaker contributes a fraction of the energy (
E measure) distributed across the surrounding directional unit sphere.
is a transposed vector of the sampled spherical harmonics at the loudspeaker directions. This method provides an even distribution of objective metrics for uniform loudspeaker layouts. However, in non-uniform configurations, energy mismatches result in attenuation in varying degrees [
6].
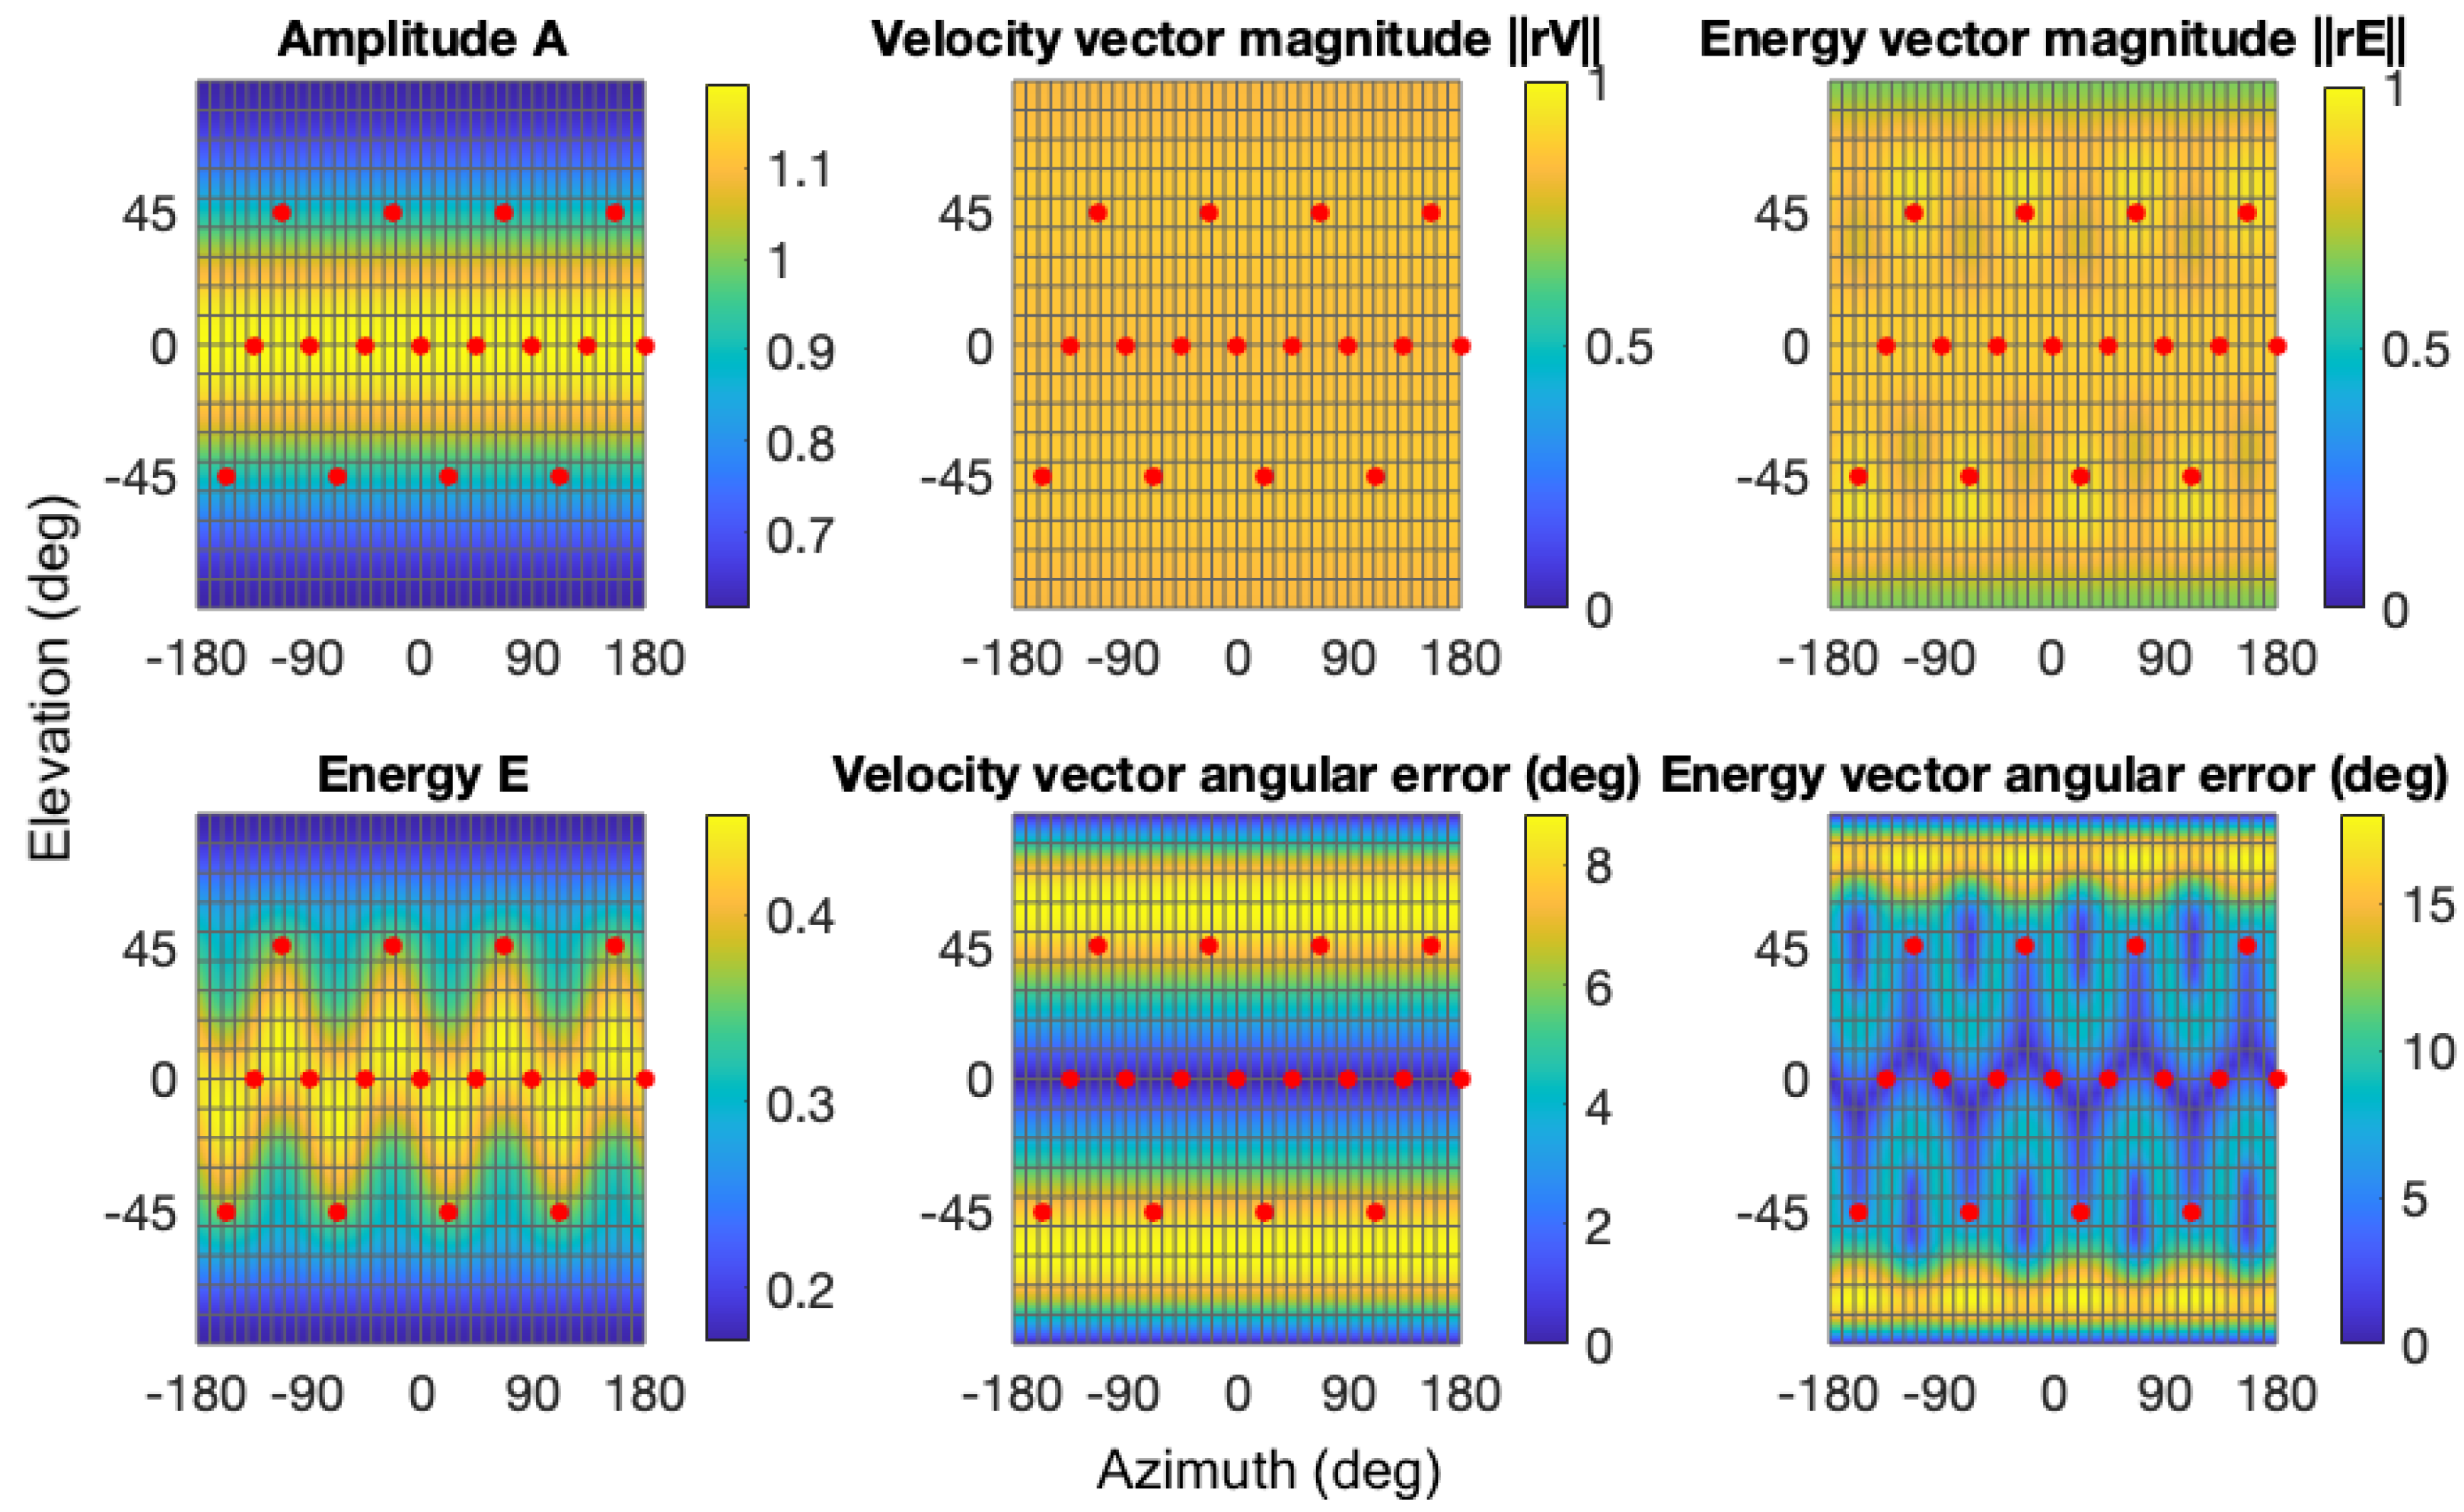
Figure 3 illustrates the distributions of amplitude, velocity, and energy for the investigated setup. Even distribution of all the measures can be observed on the horizontal plane, with fluctuations occurring above and below it. They reveal a strong dependence between the placement of the speaker and the energy measures. The uniformity of the distributions can be improved with mode-matching design (MMD), the primary objective of which is to align the spherical harmonic modes corresponding to loudspeaker signals with those of the sound field decomposed in Ambisonics. However, both the SAD and MMD share a significant limitation: when the playback system is not a
t-design, that is, when there is some non-uniformity in the loudspeaker arrangement [
6], the objective criteria of energy and the energy vector are not preserved (see
Section 2). This limitation inspired researchers [
25] to develop a more robust decoding approach.
The
Energy-Preserving Ambisonic Decoder (EPAD) maintains the MMD approach but eliminates energy scaling factors. This design is accurate for frequencies above 200 Hz and enables panning-invariant loudness. This preservation occurs for any loudspeaker configuration, provided that the number of spherical harmonics remains adequate [
25].
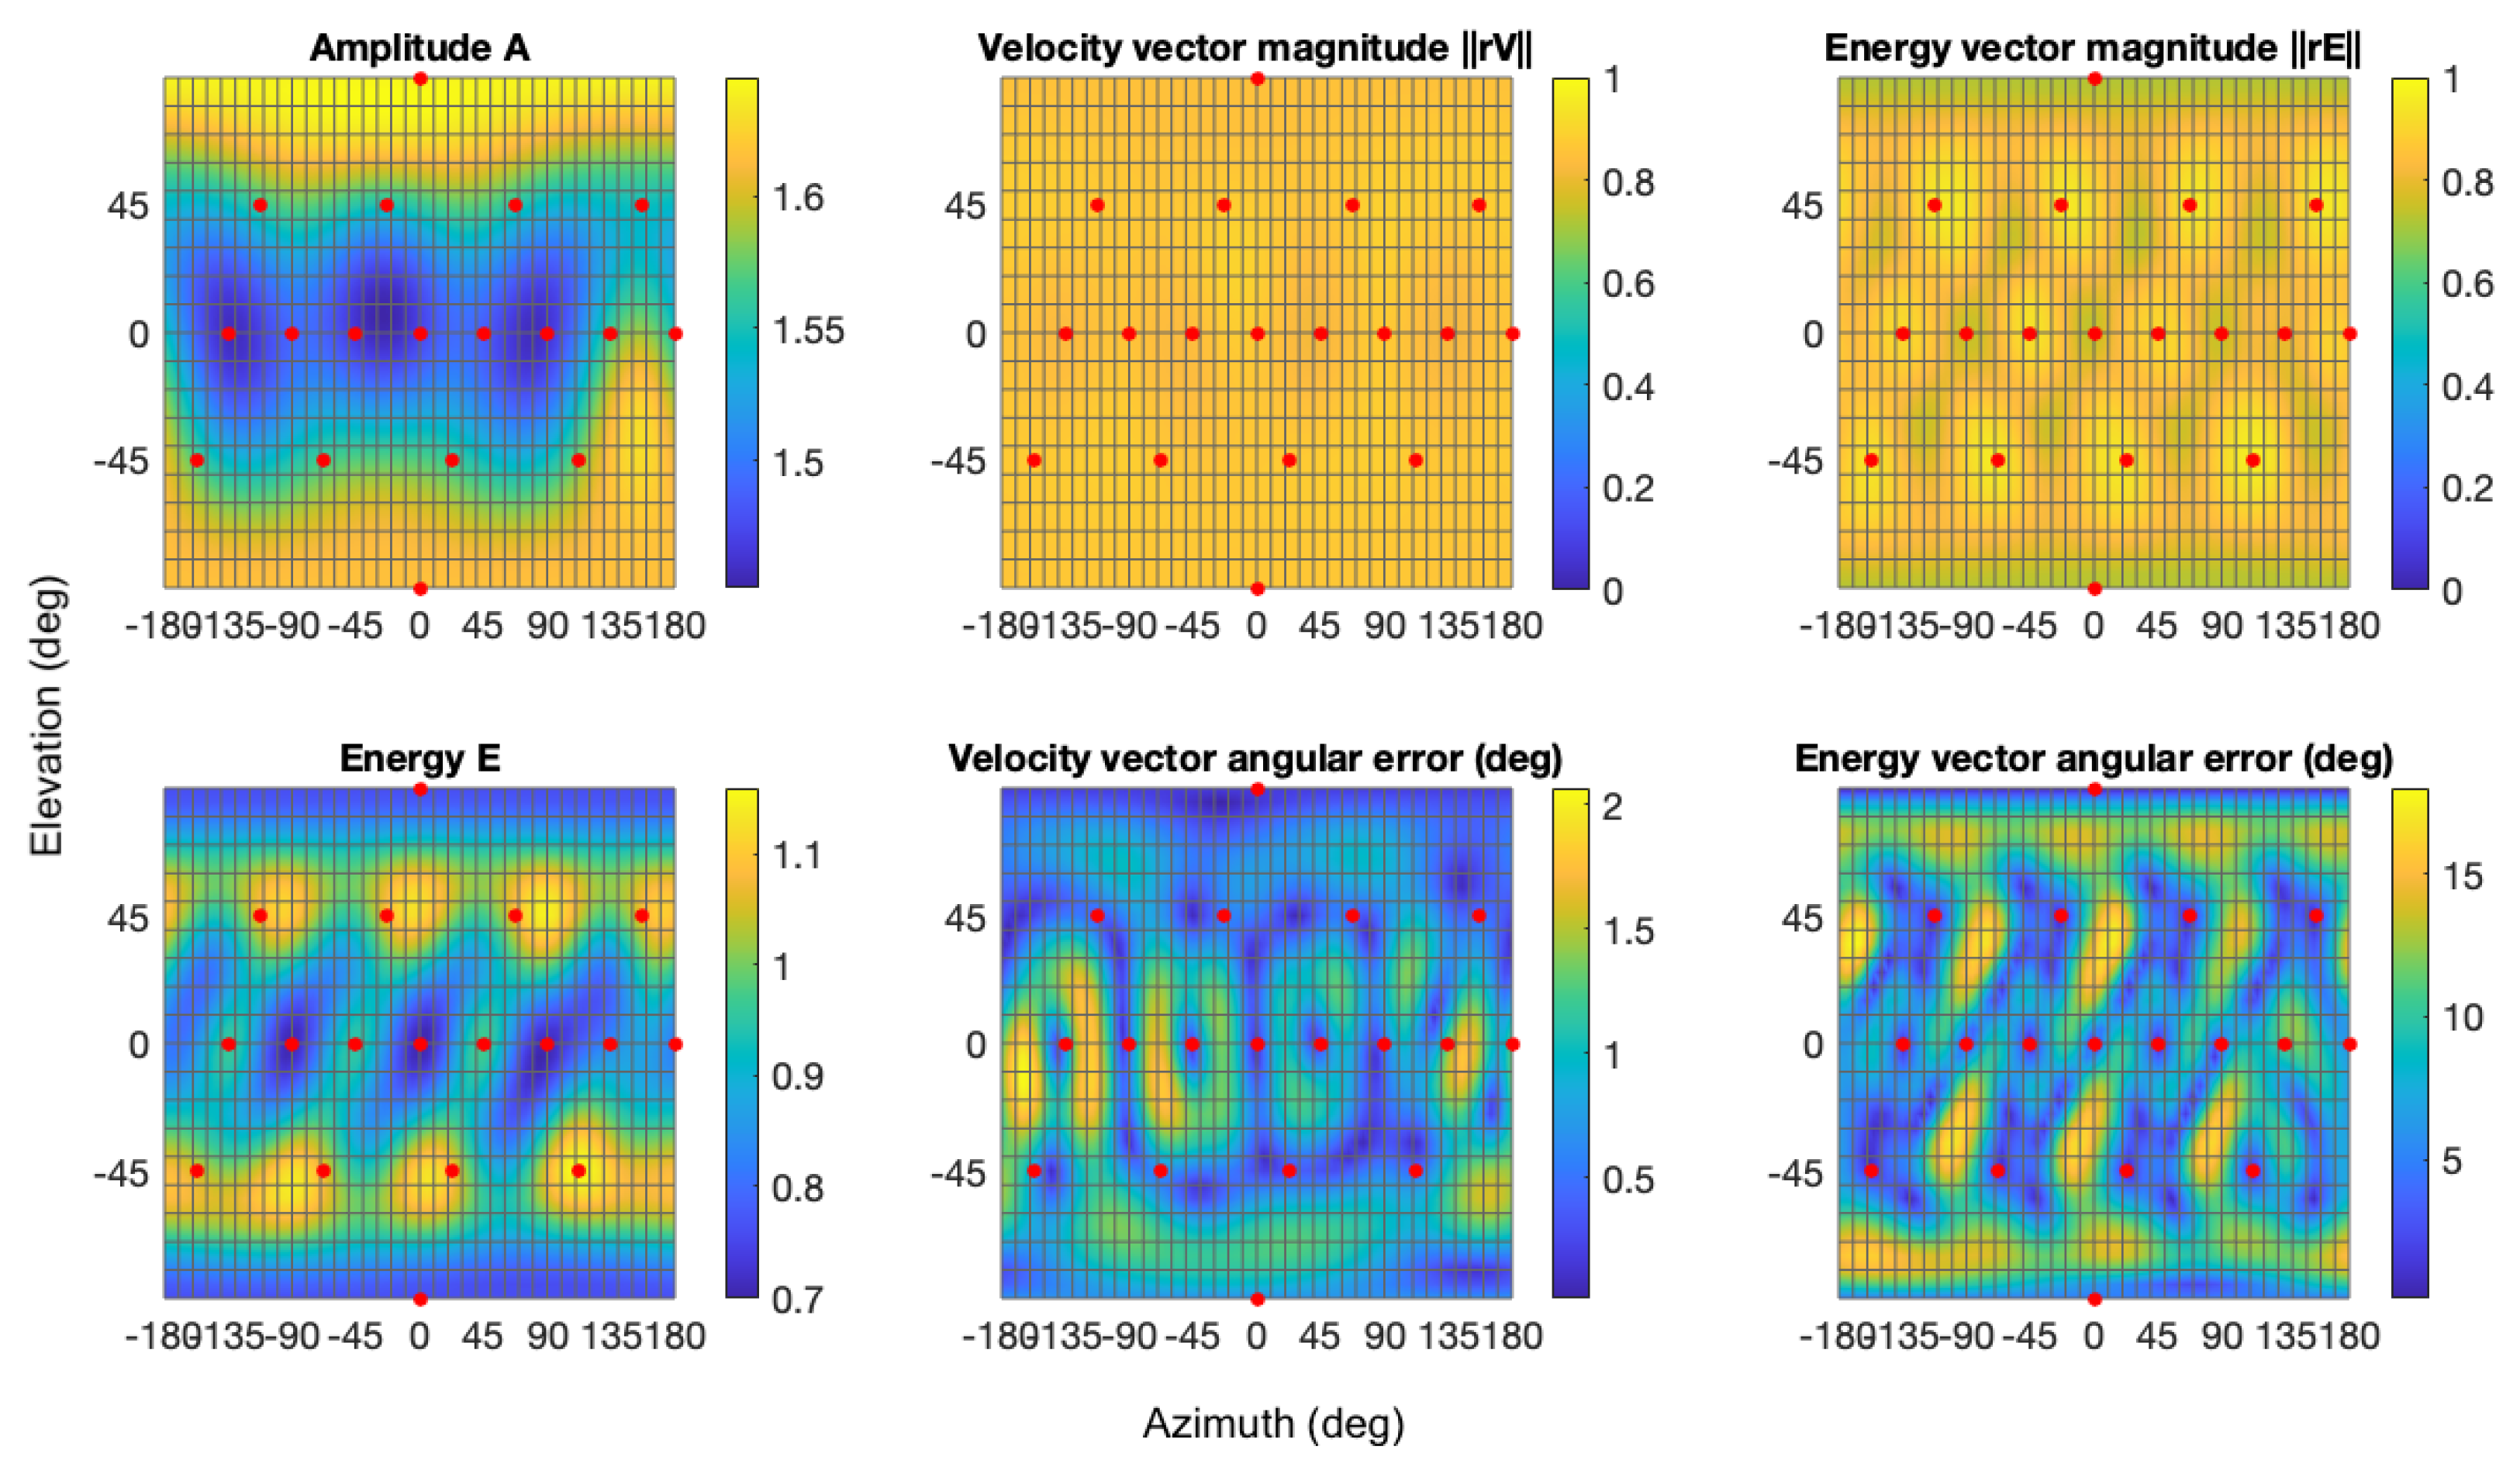
Figure 4 demonstrates the uniform energy distribution alongside other numerical measures, showing significant improvement compared to the SAD algorithm: equalised energy on the whole surface and reduced
angular error. It is worth noting that if the loudspeaker arrangement was perfectly uniform, both the SAD and EPAD would be numerically equivalent [
6].
The
All-Round Ambisonic Decoder (AllRAD) represents a hybrid approach that integrates VBAP with SAD principles [
26]. This methodology implements a sequential signal processing chain in which sound sources undergo
t-design panning before transmission to loudspeakers on a virtual
t-design layout and subsequent routing to physical loudspeakers via VBAP transformation matrices. AllRAD implementation requires computational discretisation through implementing a triangular grid between each of the three loudspeakers [
6].
This framework accommodates four distinct reproduction scenarios: (1) a virtual source positioned within a speaker triplet, activating all three loudspeakers; (2) a virtual source positioned between two loudspeakers, activating both; (3) a virtual source coincident with a physical loudspeaker position, activating only that speaker; and (4) a virtual source positioned outside the convex hull, resulting in null reproduction. To address the limitations of Scenario 4, Zotter et al. [
24] proposed the implementation of “imaginary loudspeakers” to preserve VBAP functionality in non-uniform configurations where the condition
cannot be satisfied. These virtual elements facilitate continuous spatial reproduction across otherwise discontinuous regions of the sound field.
The AllRAD maintains numerical stability across diverse loudspeaker configurations while satisfying Gerzon’s objective measures of energy distribution, energy vector (
), and vector magnitude. The algorithm demonstrates superior performance in non-
t-design reproduction systems, providing efficient signal distribution for arbitrary multichannel configurations [
27].
Quantitative analysis, illustrated in
Figure 5, confirms significantly reduced spatial errors and enhanced uniformity in amplitude and energy distribution compared to alternative decoding methodologies. The angular errors of the velocity and energy vectors of the AllRAD are the smoothest among the three decoders. Fluctuations of Amplitude
A and Energy
E are also negligible. The velocity vector angular error’s overall value spans from less than
to
for the horizontal plane with the highest value around
. Irregular fluctuations can be observed across all measures.
4.1. Experimental Setup
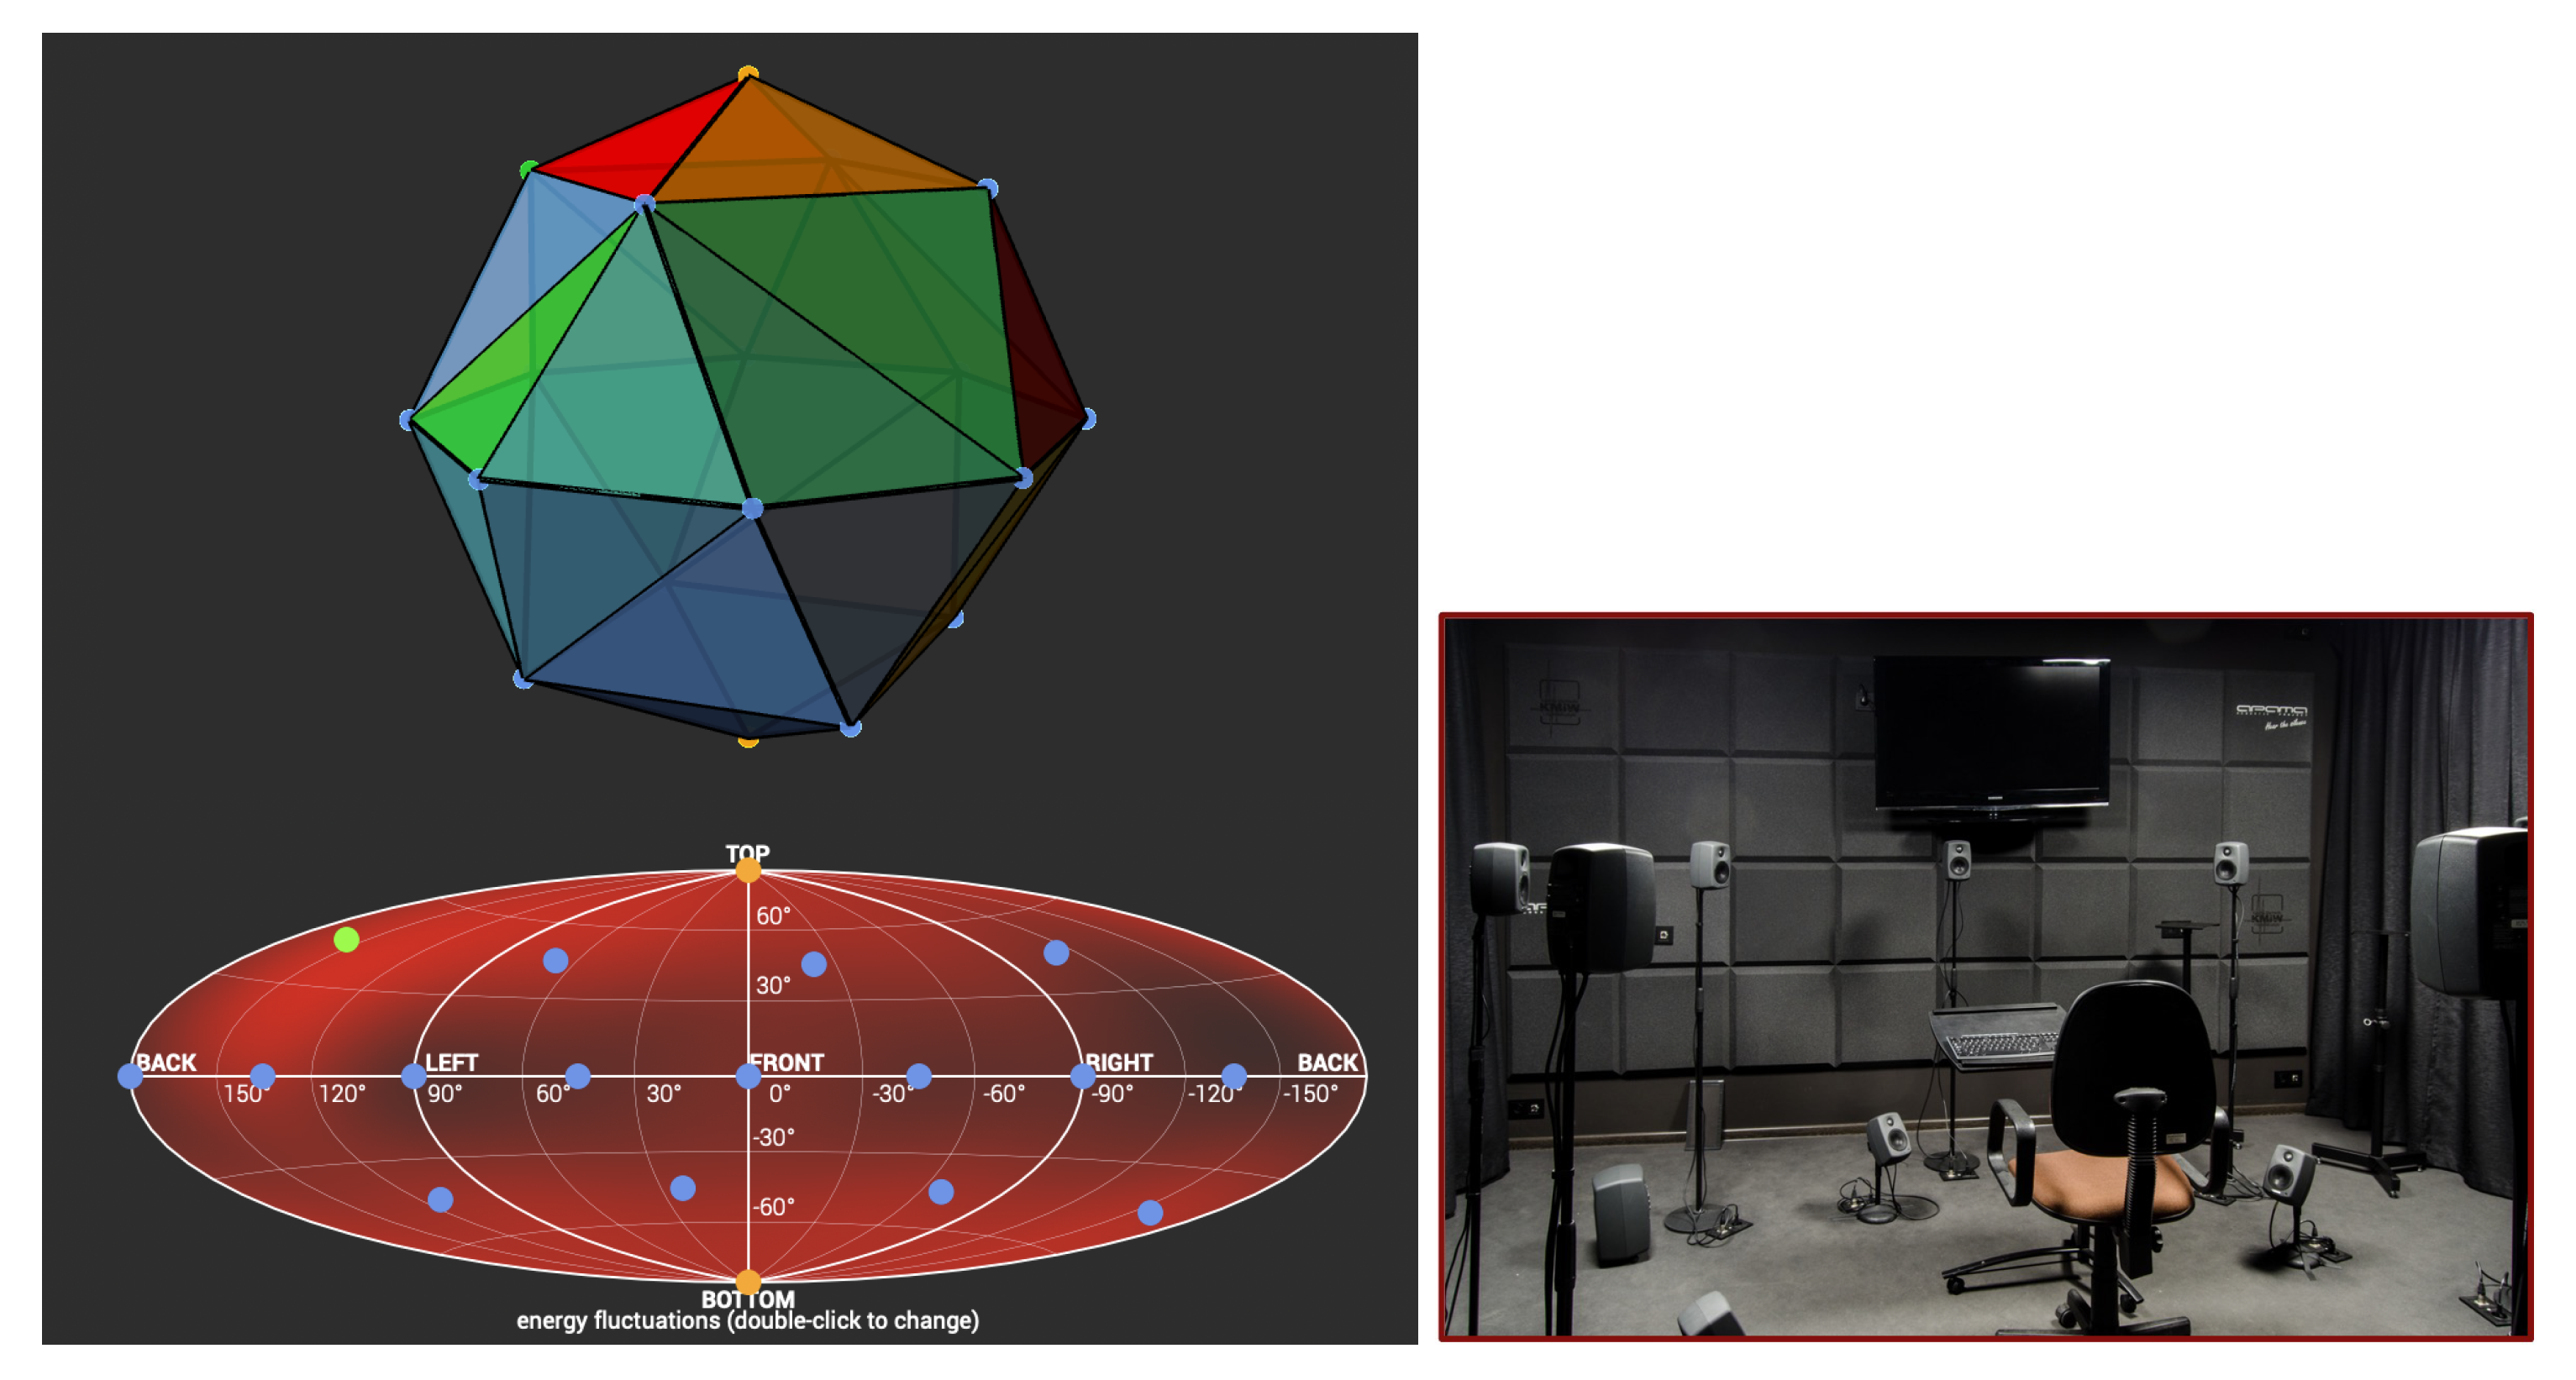
The focus of this study is on the accuracy of the sound field reproduction on a horizontal plane of the 3rd-order ambisonic playback system, consisting of 16 Genelec 6010 loudspeakers on a surface of a sphere, as illustrated in
Figure 6. The 3rd order is the highest available resolution in the laboratory used for the evaluation and the most popular order to work with in music production at the moment of writing [
28]. In the three-dimensional space, the operational system is a spherical coordinate system with a radius of
m, and azimuth and elevation angles, as specified in
Table 1. In the AllRAD case, two additional imaginary loudspeakers were included for correct decoder calculations (yellow dots in
Figure 6).
The primary objective of this experimental series was to investigate the MAA values for three ambisonic decoders: the EPAD, AllRAD, and SAD. All listening tests were conducted at the Laboratory of Auralisation, AGH University of Science and Technology (UST), which is an acoustically treated room of dimensions 3.9 m × 6.7 m × 2.8 m (length, width, and height, respectively), with an average reverberation time of 0.15 s.
4.2. Participants
The listening panel comprised 15 subjects (6 female, 9 male) in the age group of 23–37 years old, with varying levels of experience in working with stereophonic and/or spatial audio. The
medium experienced participants included students of the Acoustic Engineering course, while the
highly experienced participants consisted of Acoustic Engineering teachers and professional audio engineers with at least 10 years of field experience. Four subjects—three highly experienced teachers and researchers and one student with a low level of experience—took more than one listening test to facilitate the analysis of the individual perceptual differences between the decoders. The choice of repeated participants was motivated by their level of experience as well as availability. No audiometric test was performed; however, all participants confirmed that they had normal hearing. Based on prior work conducted at our institute [
29], demonstrating that listeners with lower hearing thresholds do not necessarily perform better in challenging listening tasks, the approach adopted in this study—using stimuli at a level of 80 dB(A)—is considered methodologically justified.
4.3. Listening Test Procedure
Prior to the presented research, preliminary listening experiments were conducted. This process helped identify methodological optimisations, particularly regarding session duration based on the adaptive method in the context of the MAA [
30]. This study implemented a non-parametric adaptive up–down method, which estimates thresholds without explicitly characterising the psychometric function’s shape beyond monotonicity assumptions. Although threshold estimation typically involves averaging stimulus intensities from final reversals [
31], this research used a hybrid-adaptive approach [
32] that allows data to be matched to an assumed psychometric function. Various transformed up–down procedures are used in psychoacoustics. The Mean Group Length (MGL) parameter characterises procedural complexity—larger values necessitate more reversals before test termination. The optimal measurement point on the psychometric function (the “sweet point”) for minimising threshold estimate variance is generally considered to fall within the X80–X94 confidence range [
33]. The research from Levitt [
31] determines the X71 rule or X75 rule as the mid-point. The X71 rule (MGL = 1.71) executes approximately 50% faster than the X75 rule and was therefore chosen for the purposes of the presented research.
Based on the aforementioned studies, the adaptive procedure implemented the following parameters:
Decrementing/incrementing step sequence: .
Initial angular displacement: from reference position (100% recognition accuracy baseline).
A 2-up/1-down procedure with 7 reversal limits. The first reversal was excluded from the calculations.
A 75% recognition threshold determined using the Bayesian psignif algorithm.
The frontal plane (–) and rear plane () were examined separately to prevent systematic errors.
The experimental framework maintained consistency across all tests regarding the interface design, psychoacoustic method, loudspeaker configuration, and ambisonic order. The testing environment used MATLAB 2020b connected to REAPER (digital audio workstation) through the Open Sound Control protocol. Open-source plugins were used for decoding: IEM AllRAD for the AllRAD and Aalto Sparta Decoder [
34] for both the SAD and EPAD. The implementation utilised Schmidt semi-normalisation (SN3D) with max-
weighting, as recommended in the literature [
35,
36]. The stimulus used in the experiment was a white Gaussian noise burst of 500 ms, with 20 ms fade-in and fade-out and a frequency range 20 Hz–20 kHz. This range was selected to match both the effective operating frequency range of the ambisonic decoder’s energy vector and the human auditory system’s use of spatial localisation cues. Frequencies above approximately 200 Hz are known to contribute significantly to directional hearing, with low frequencies supporting Itearaural Time Difference (ITD)-based localisation and higher frequencies supporting ILD-based localisation mechanisms. A MATLAB-based interface facilitated the execution of the test.
Participants were placed in the sweet spot and instructed to maintain visual focus on a screen behind the central loudspeaker to minimise head movements. The test sequences began with a reference sample played from predetermined azimuthal positions:
, and
(frontal plane);
, and
(rear plane). Symmetry was assumed between the left and right hemispheres, while the
and
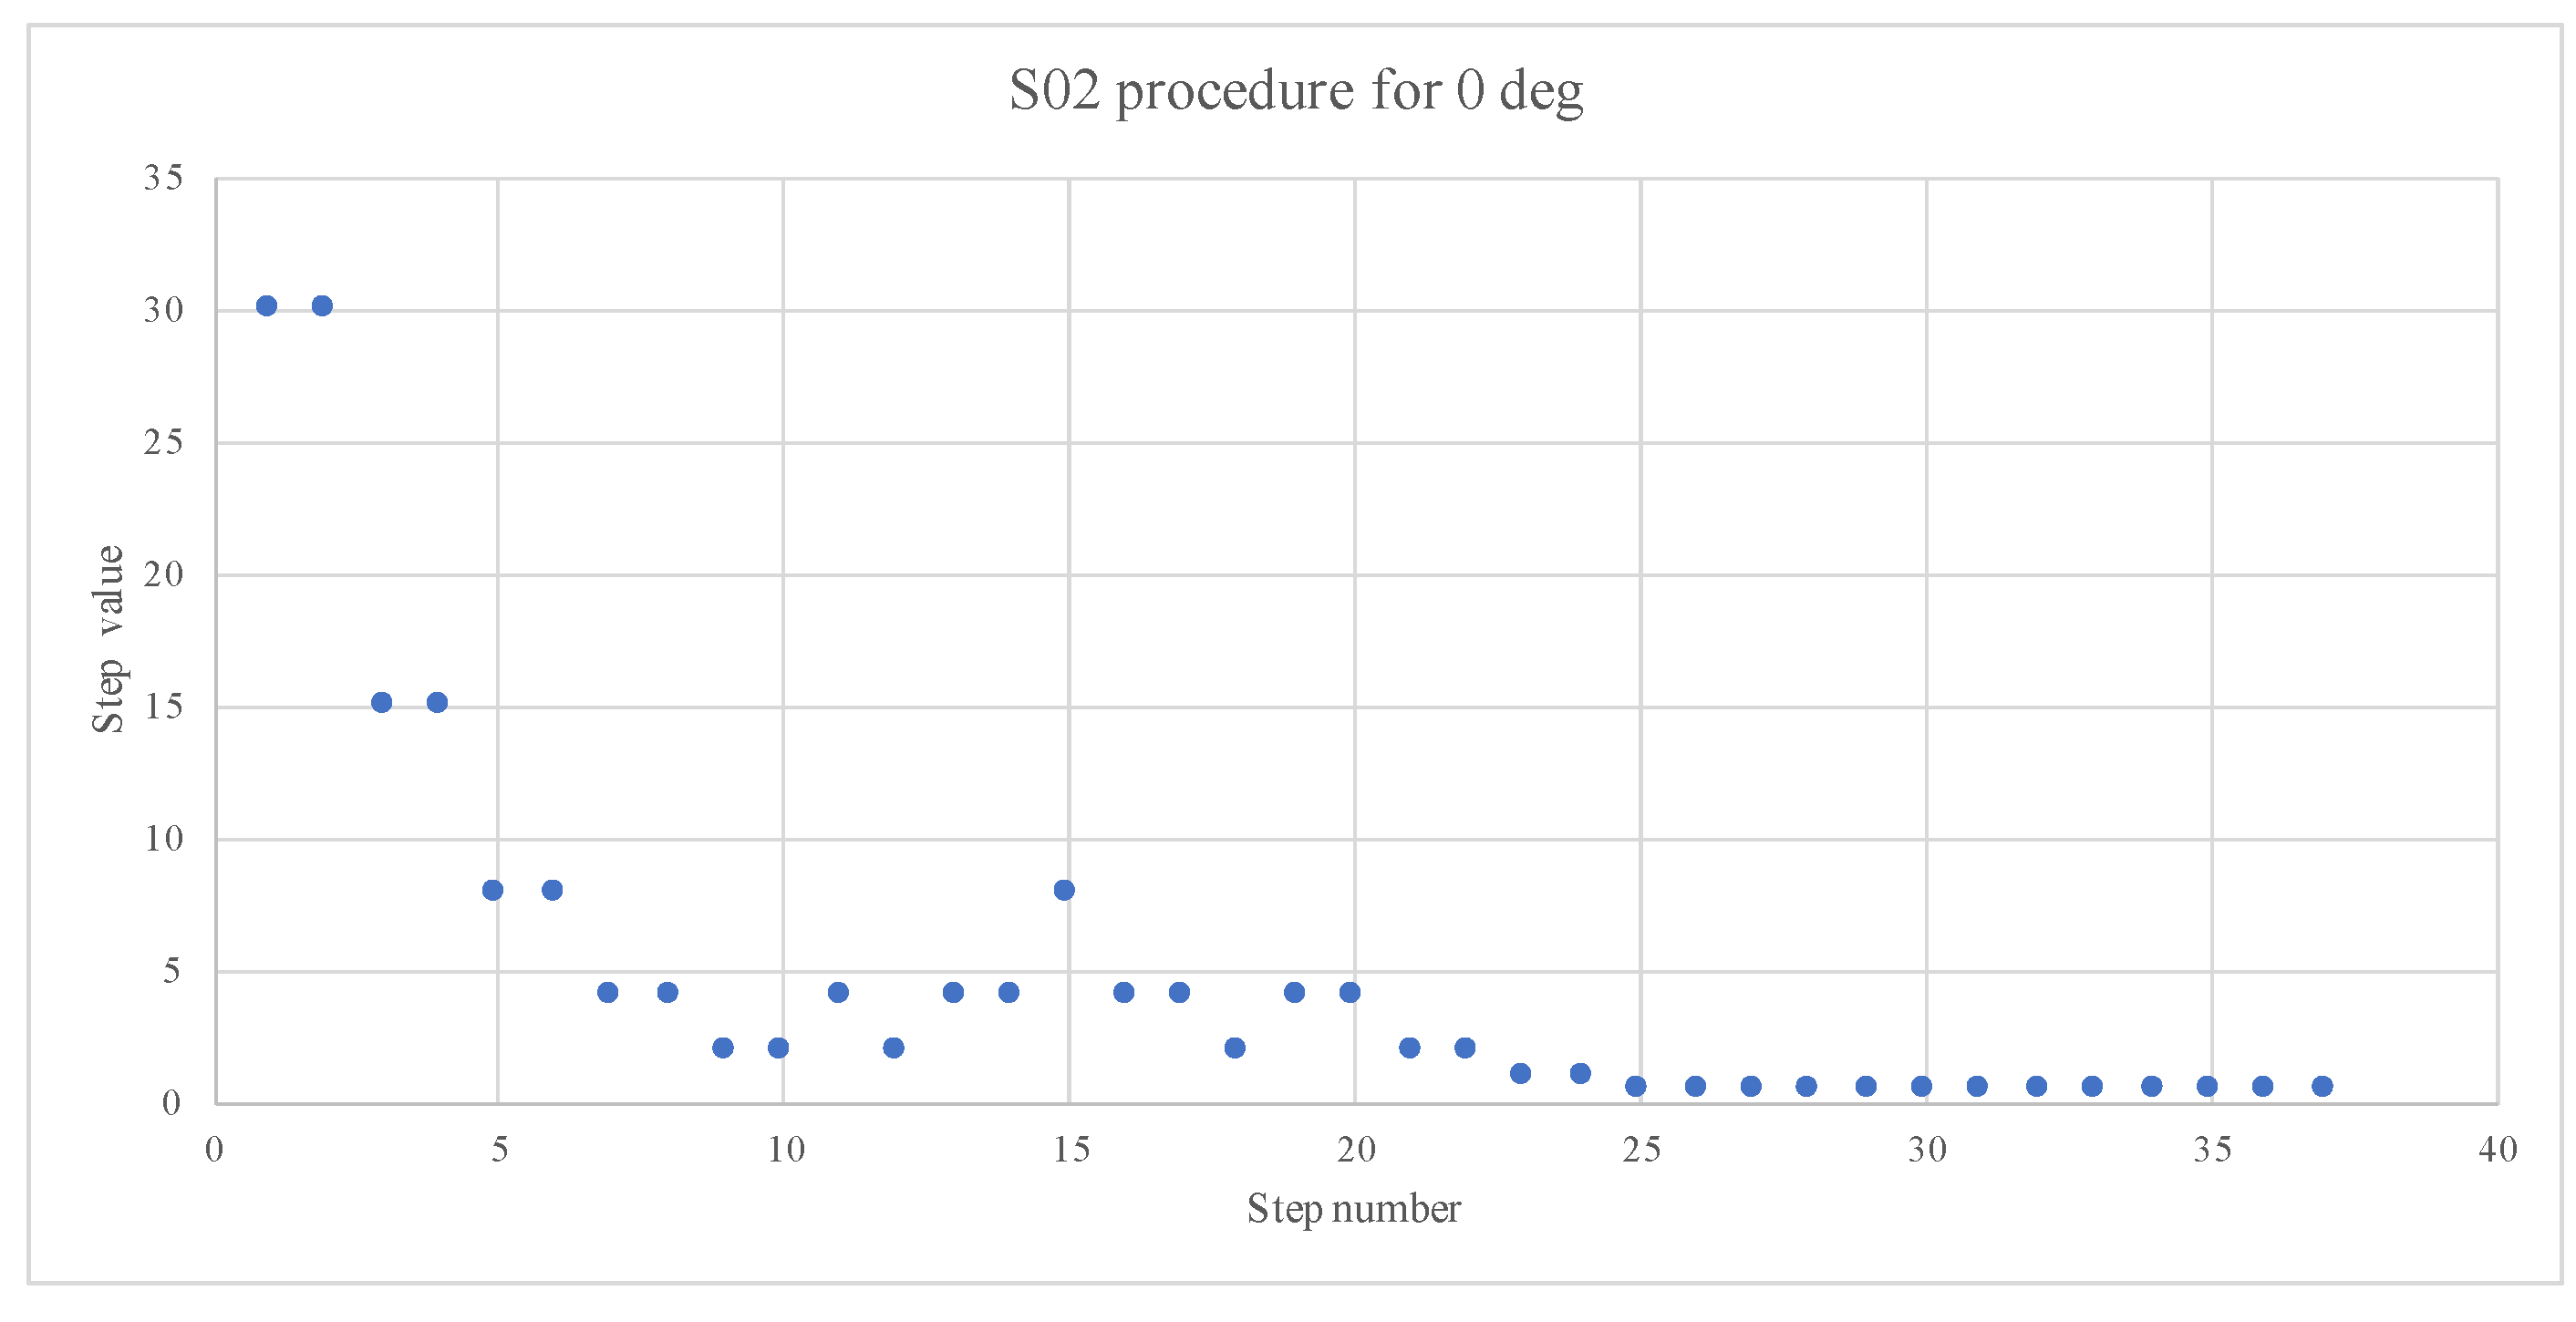
positions were specifically tested. A second sample was presented with an angular displacement (randomly left or right) equivalent to the initial step size. The participants indicated the perceived displacement direction by choosing the appropriate button with the mouse click. An example of the course of the experiment is presented in
Figure 7.
The duration of the procedure varied with the reference position, with the longest at
, as shown in
Figure 7 and the shortest within the
region, which corresponds to the cone of confusion. Based on the results of the staircase procedure, the psychometric function threshold at 75% recognition was calculated for each reference angle. MATLAB script [
37] was used to predict and plot the functions.
5. Results
The comparative analysis of the SAD, EPAD, and AllRAD revealed large variations in spatial reproduction parameters. For all the results, the highest step in the adaptive procedure——is assumed to be the recognition threshold. Above that value, the MAA was not determined and the plots are limited on the Y-axis.
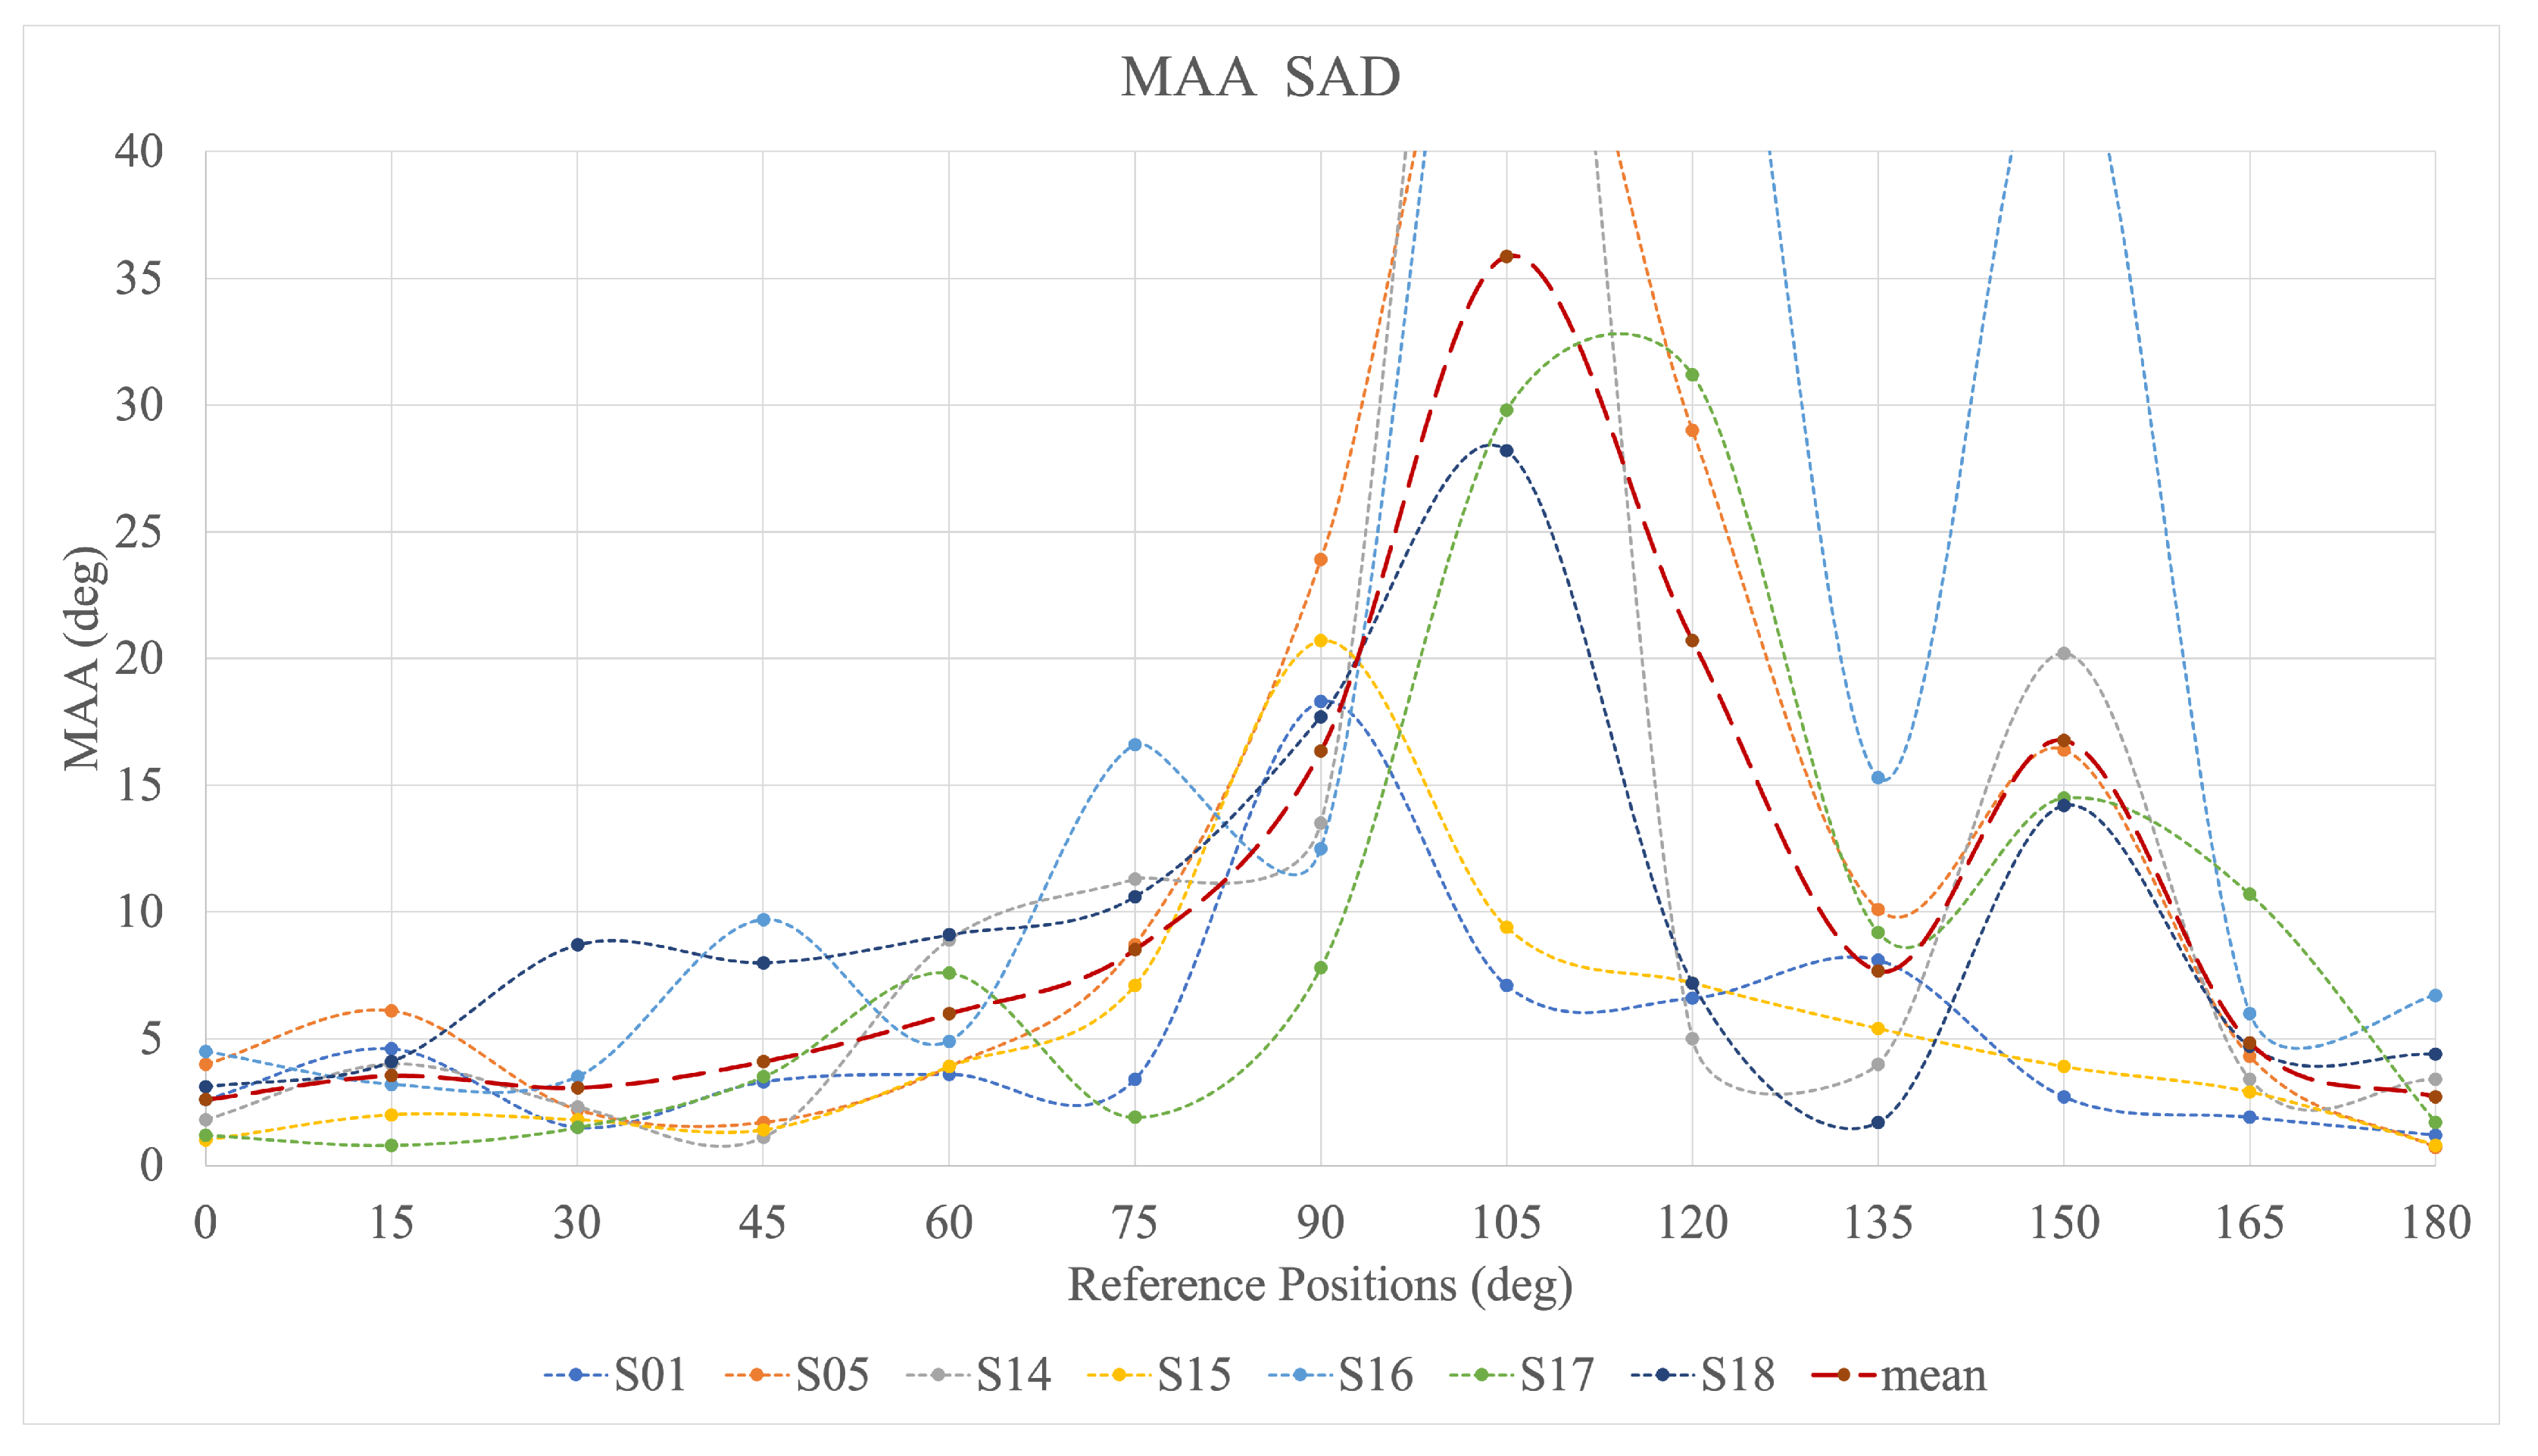
Figure 8 shows the MAA across the subjects for the SAD case. For most of the participants, two significant peaks are revealed: around
and at
. The high values of the MAA at
are preceded by a slow rise starting around
. For subjects S01 and S15, the first peak is shifted towards
, while the second peak is shifted to
for S01 and does not occur at all for S15. The MAA values across the subjects show considerable variability, with three of them (for subjects S05, S14, and S16) extended beyond the maximum analysed range of
.
Figure 9 shows the outcome of the listening experiment for the EPAD. Similar to the SAD, the variability of the results across the subjects is high, with a few MAA values exceeding the analysis threshold of
(subjects S03, S05, and S11). The trends in the MAA are also not as visible as in the case of the SAD. However, the majority of the results show a significant peak at
, implying a higher MAA in that area. In general, all the results exhibit higher MAA values between
and
.
The MAA values obtained for the EPAD are generally lower than those for the SAD, cf.
Figure 8. This may be a consequence of low fluctuations in amplitude and energy metrics for the EPAD, as shown in
Figure 4.
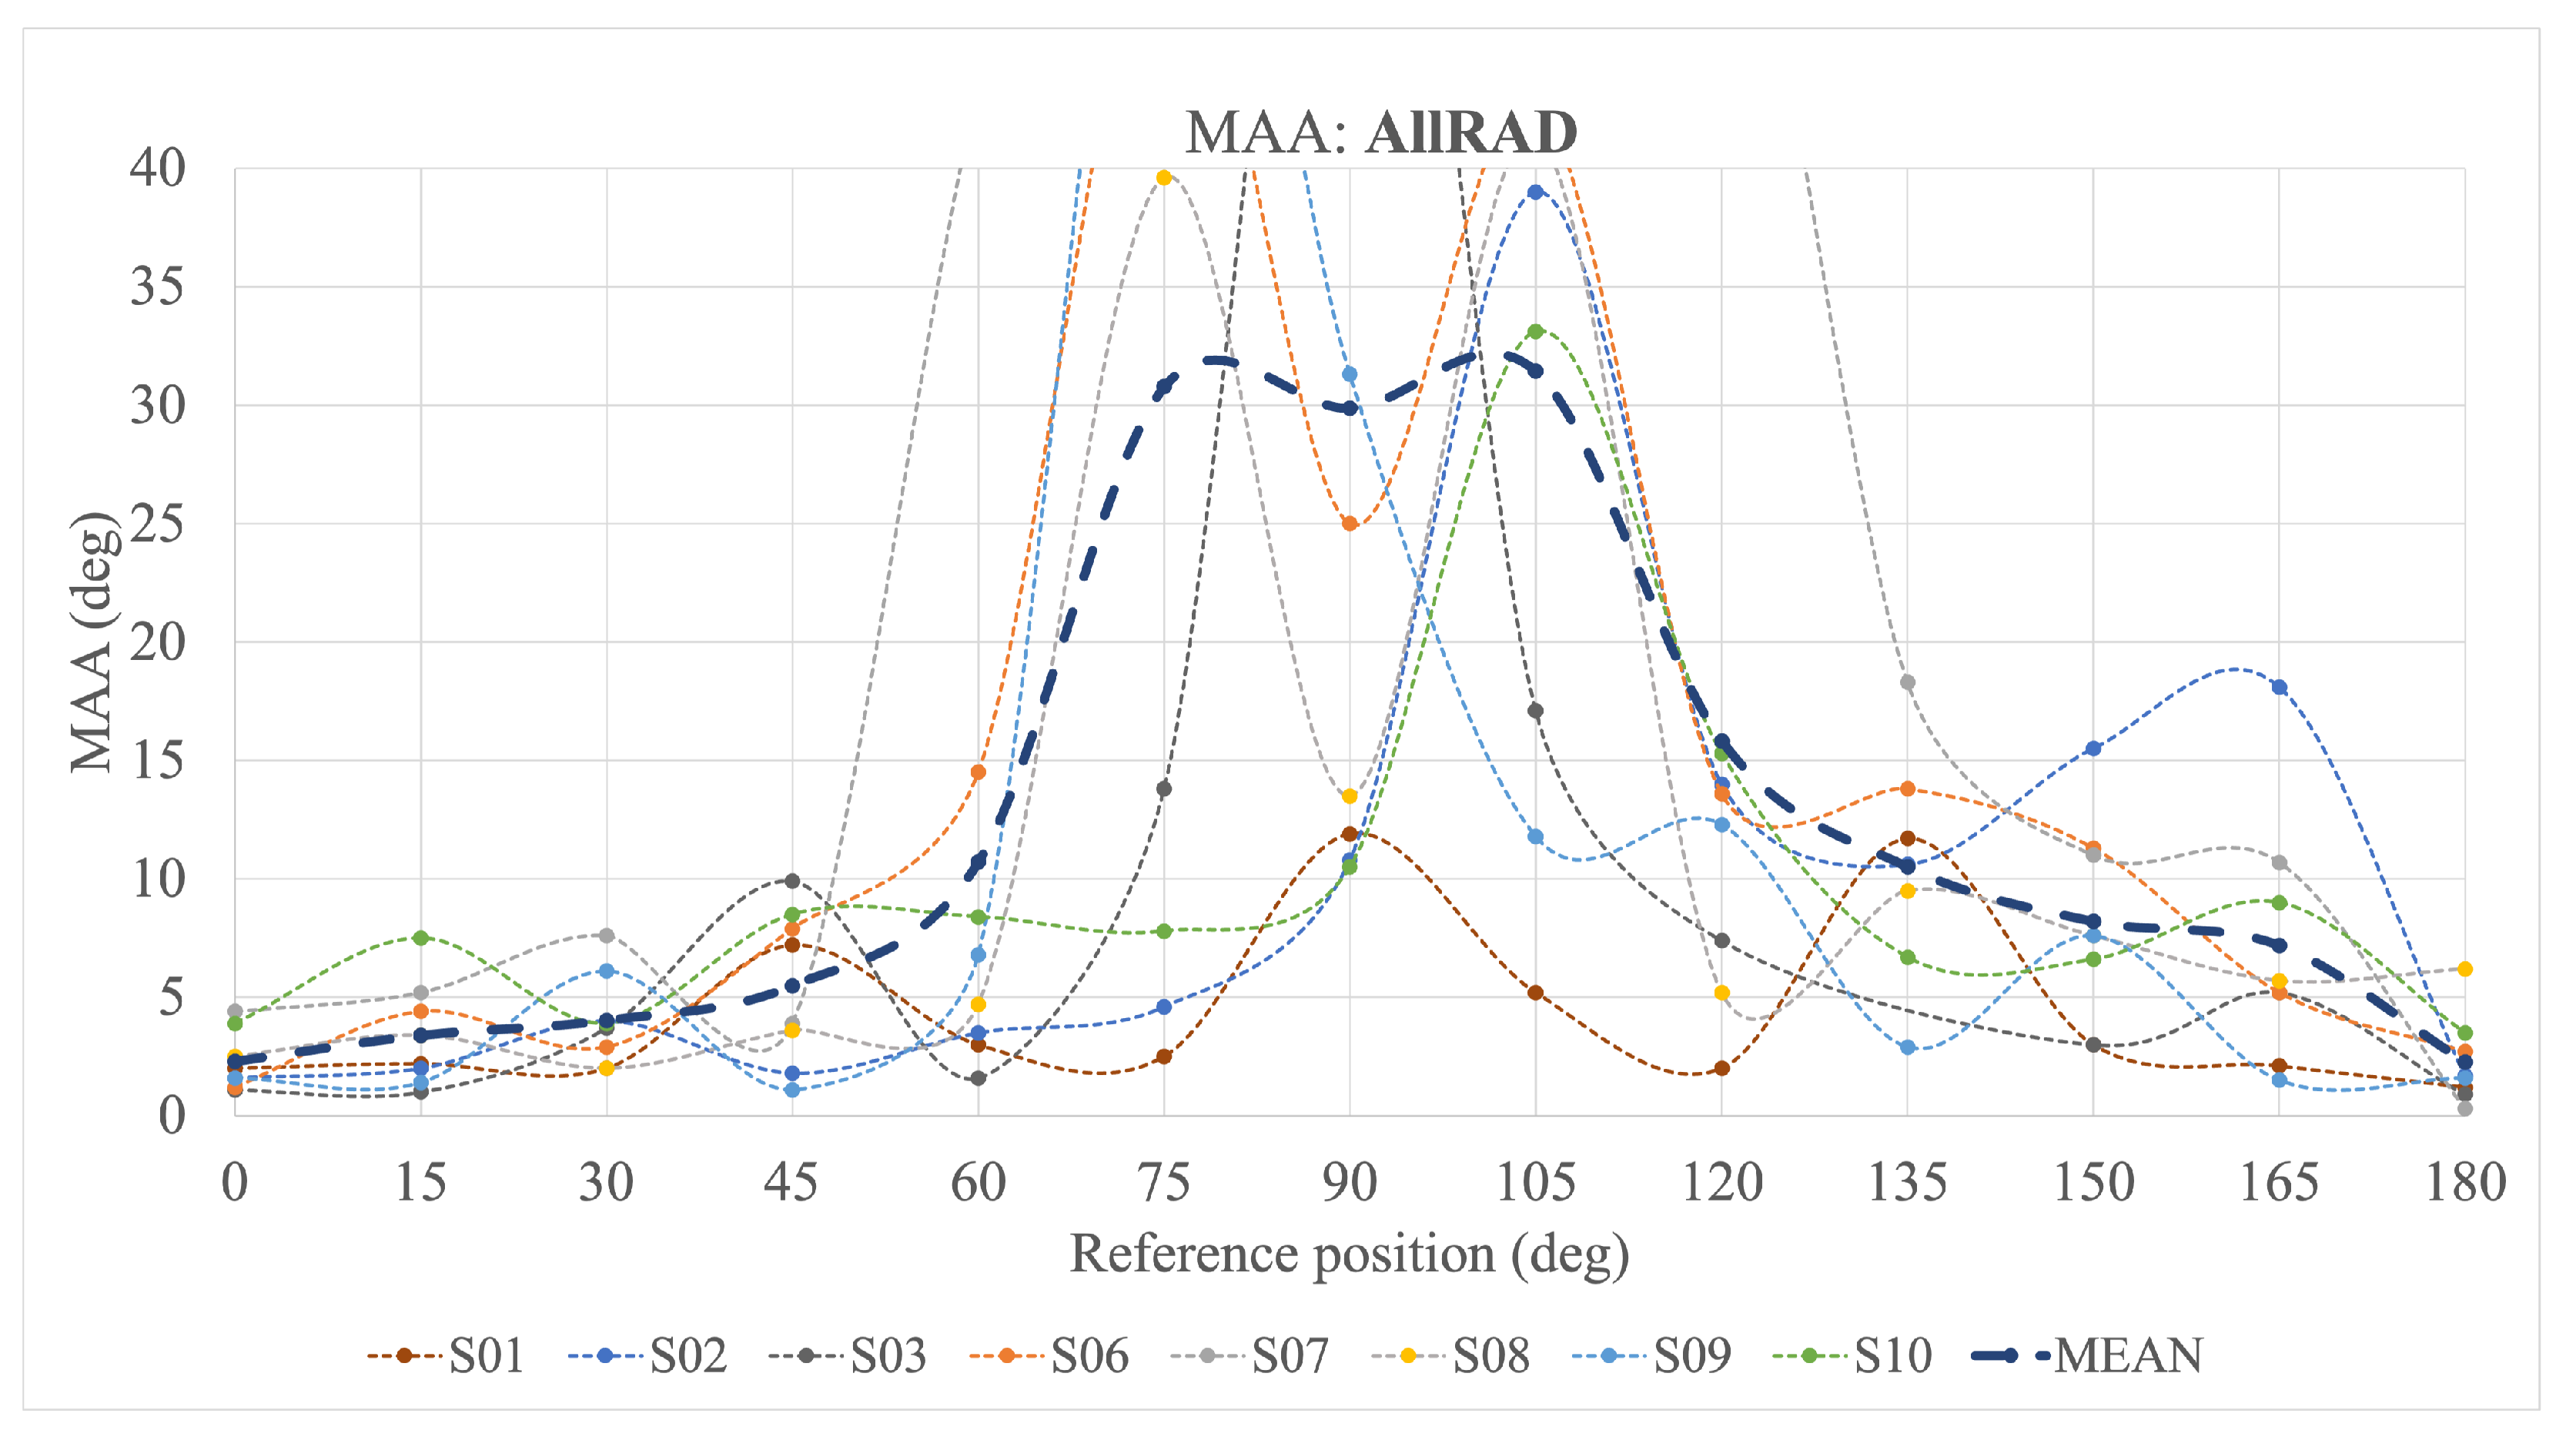
The MAA values for the AllRAD are depicted in
Figure 10. They show that the MAA grows considerably between
and
. For subjects S06 and S08, the MAA increases symmetrically with respect to the
azimuth angle, forming two peaks at
and
separated by a trough. Other results exhibit only one peak, either at
(S09) or
(S02 and S10). Conversely, the MAA for S01 and S03 is the highest at
.
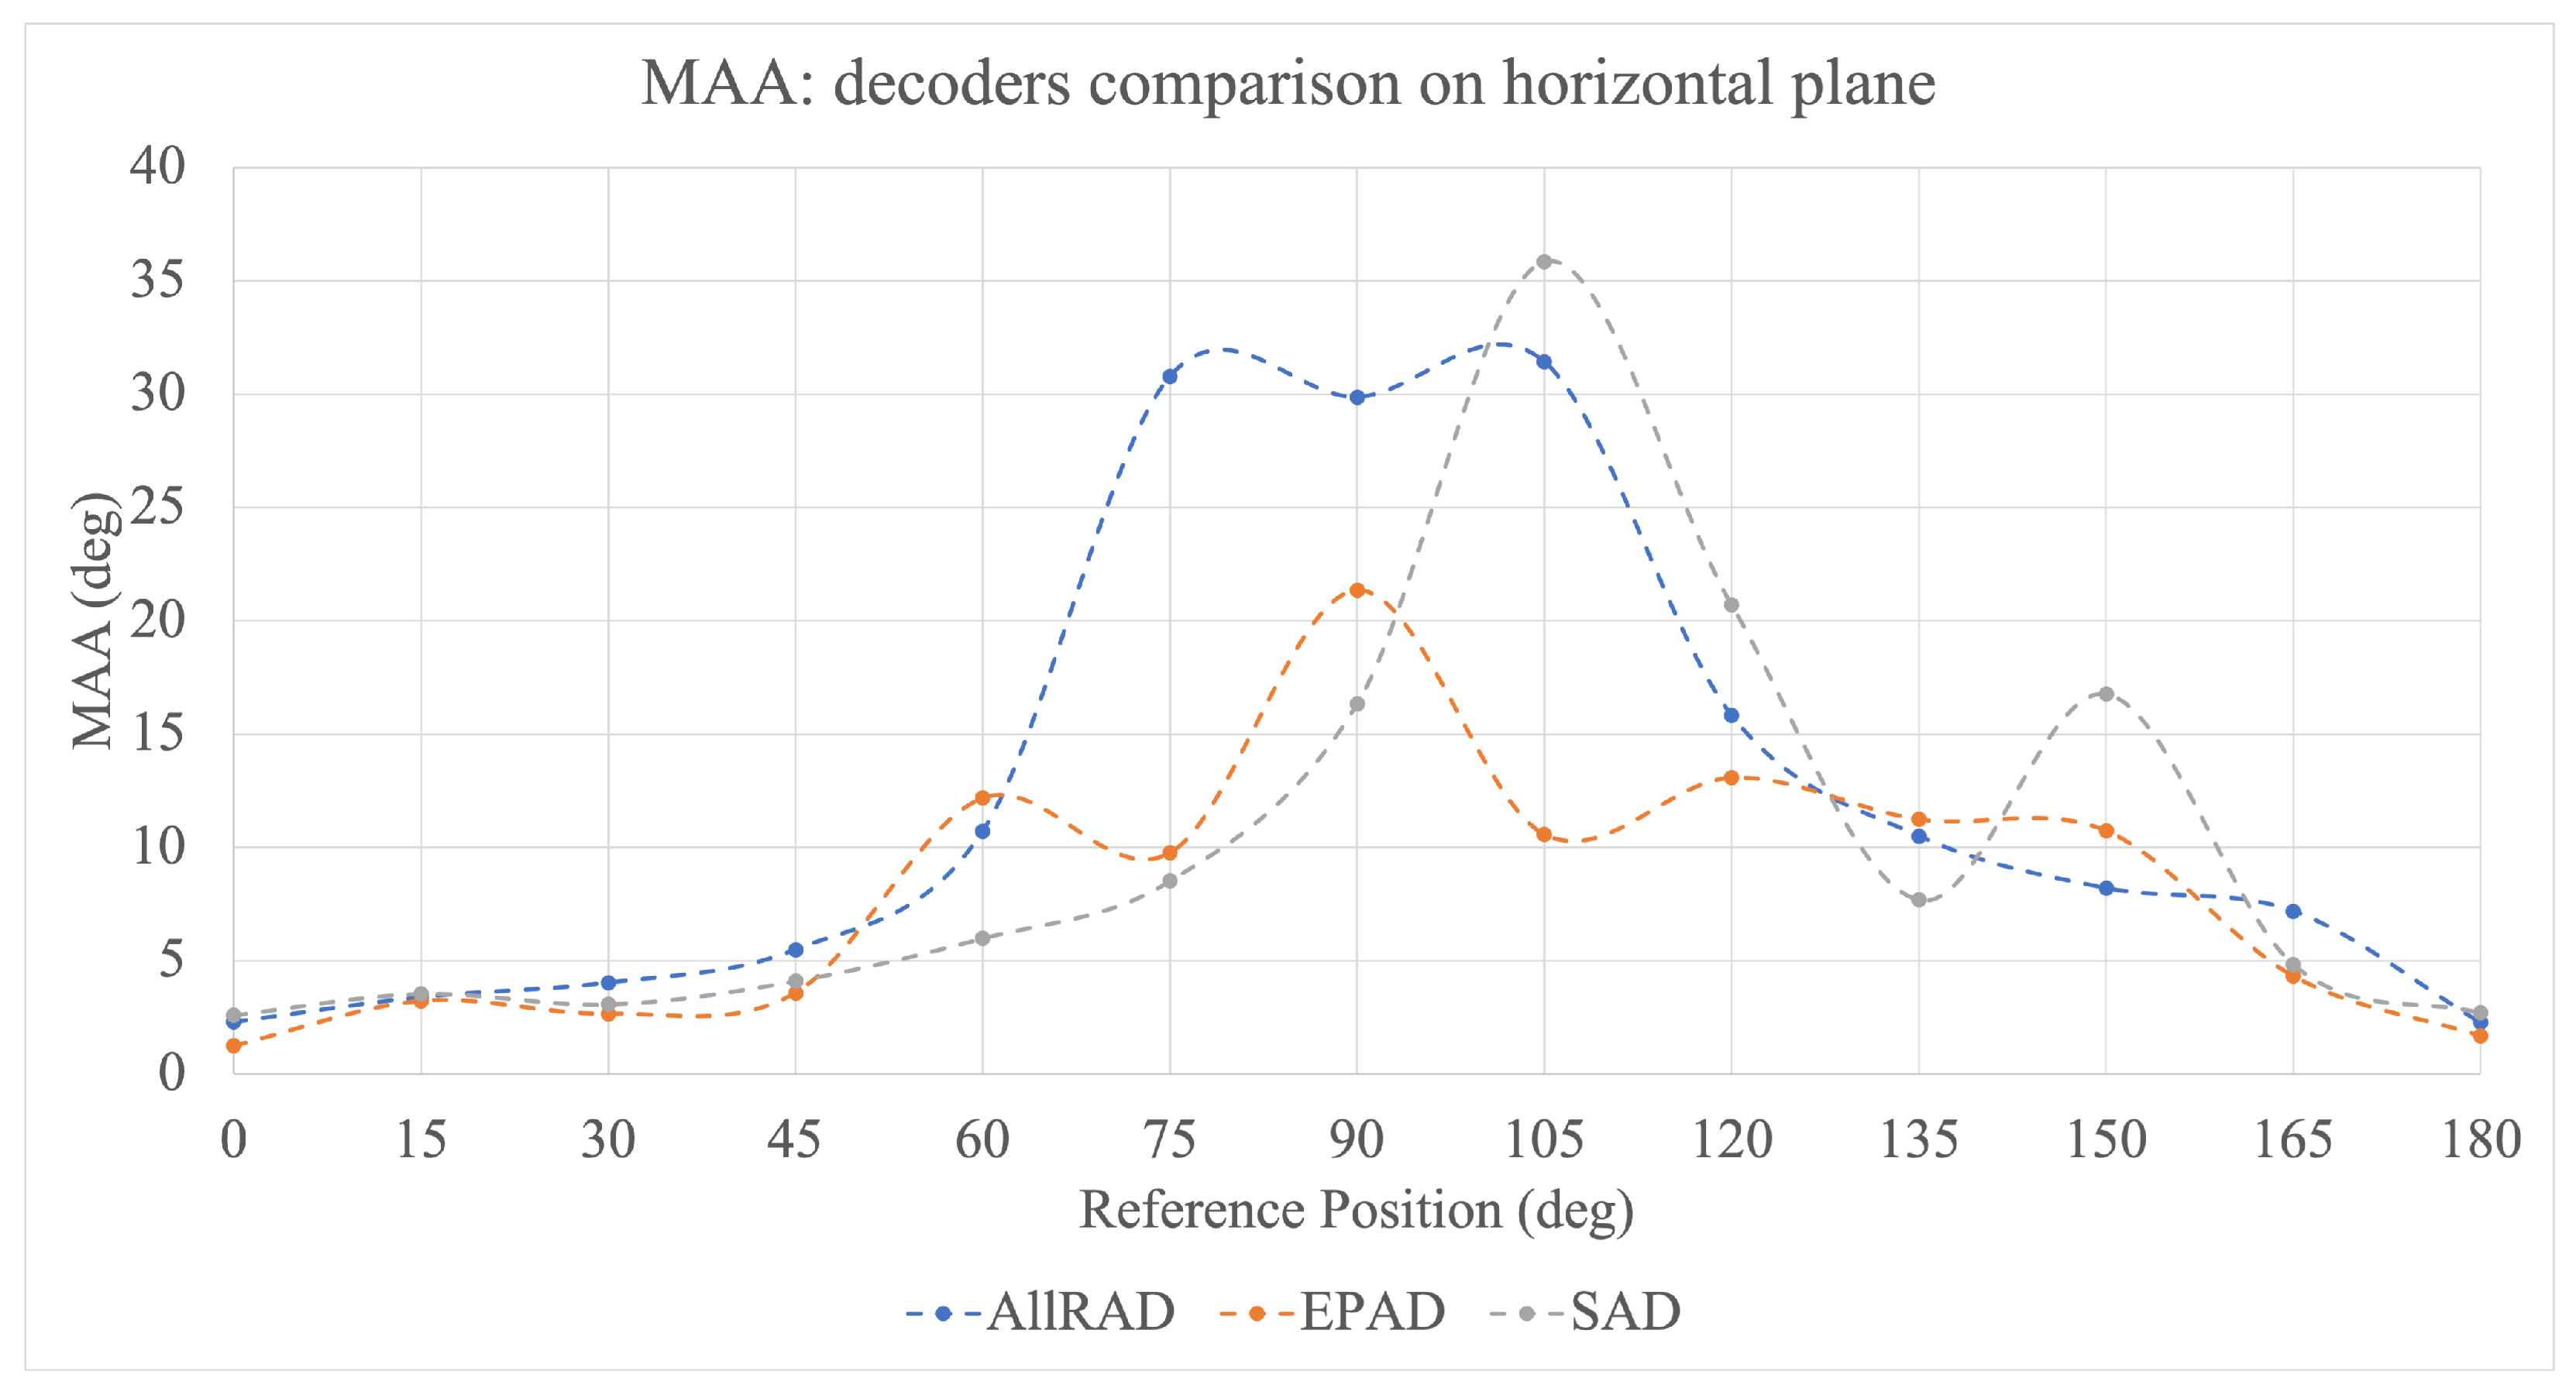
The mean values of the MAA parameter determined for all three decoders are shown in
Figure 11. The values remain coherent below
. Overall, the EPAD produces the lowest MAA values in relation to the horizontal plane of all the investigated decoders. Furthermore, for reference
, the MAA threshold was the lowest for the EPAD and equalled
, which is a value corresponding to those of the investigations with the physical sound source [
2].
Overall, the MAA values for all the investigated decoders show a significant increase in the angular range between
and
. Such a tendency is in line with similar results from the literature [
21] and corresponds to the region of indeterminate sound localisation, referred to as the cone of confusion [
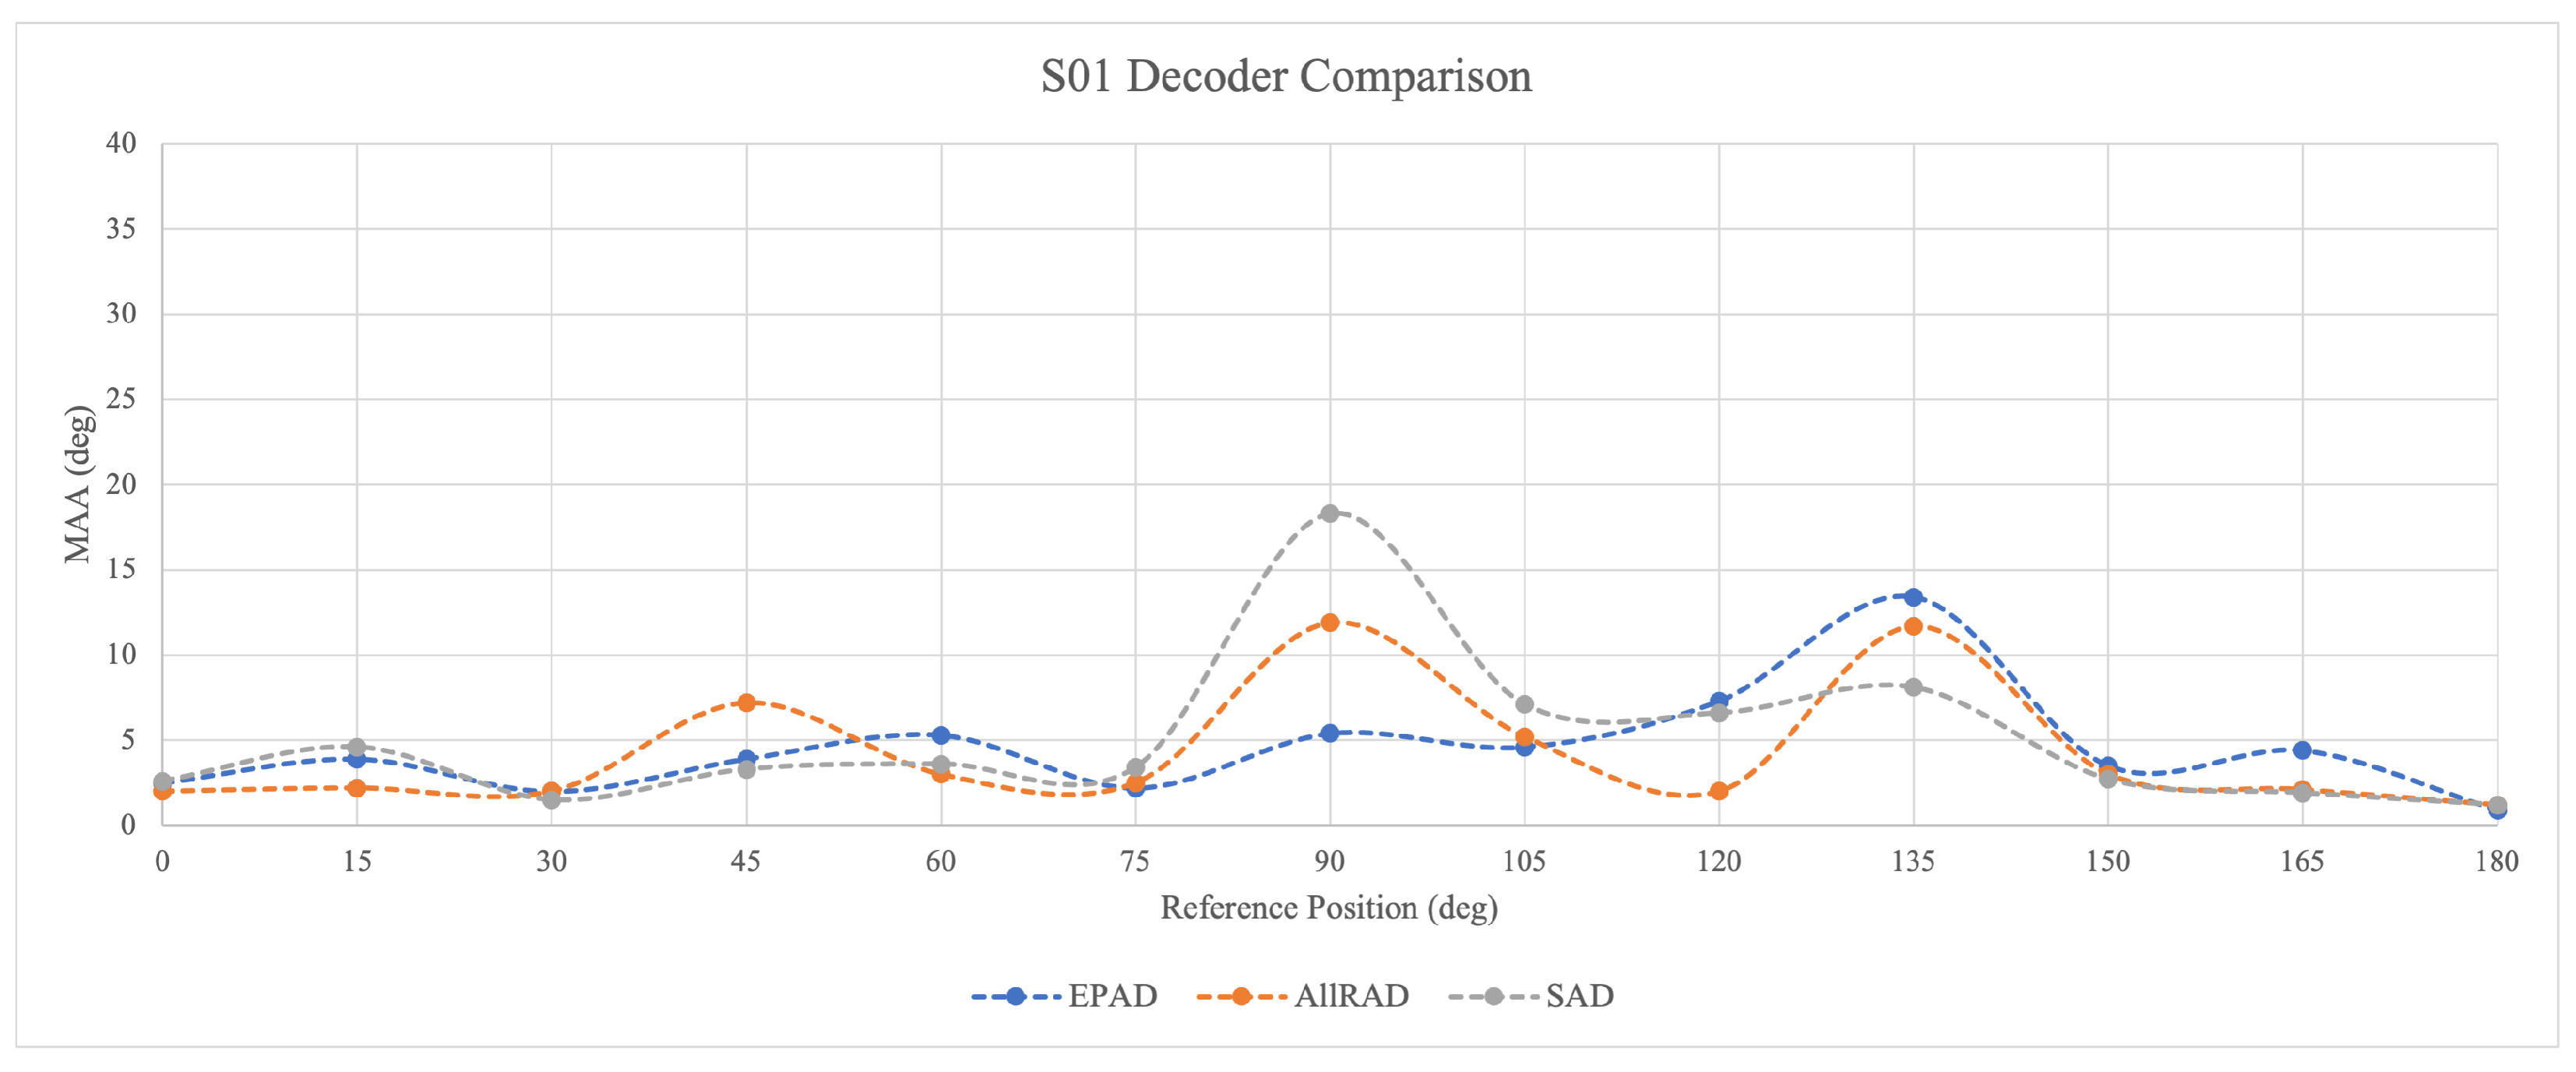
38].
Figure 12 shows isolated results for subject S01, who is highly familiar with the ambisonic system. For such an experienced person, the MAA values are within a similar range for all investigated decoders. There is a visible peak in the cone of confusion area at
and then another smaller one at
. The second peak might be caused by the fact that the shift from the loudspeaker position always appears as a phantom source in between two loudspeakers, causing small fluctuations in energy vector angular errors. The same phenomenon, although on a smaller scale, is observed in the MAA values for
.
The results for subject S05, who is highly experienced in audio engineering, with medium familiarity with the playback system used in the experiment, are shown in
Figure 13. For the rear plane in the case of the AllRAD algorithm, the reoccurring systematic errors in the answers made detecting the MAA threshold impossible. As the subject had extensive experience with stereo systems, the low resolution above
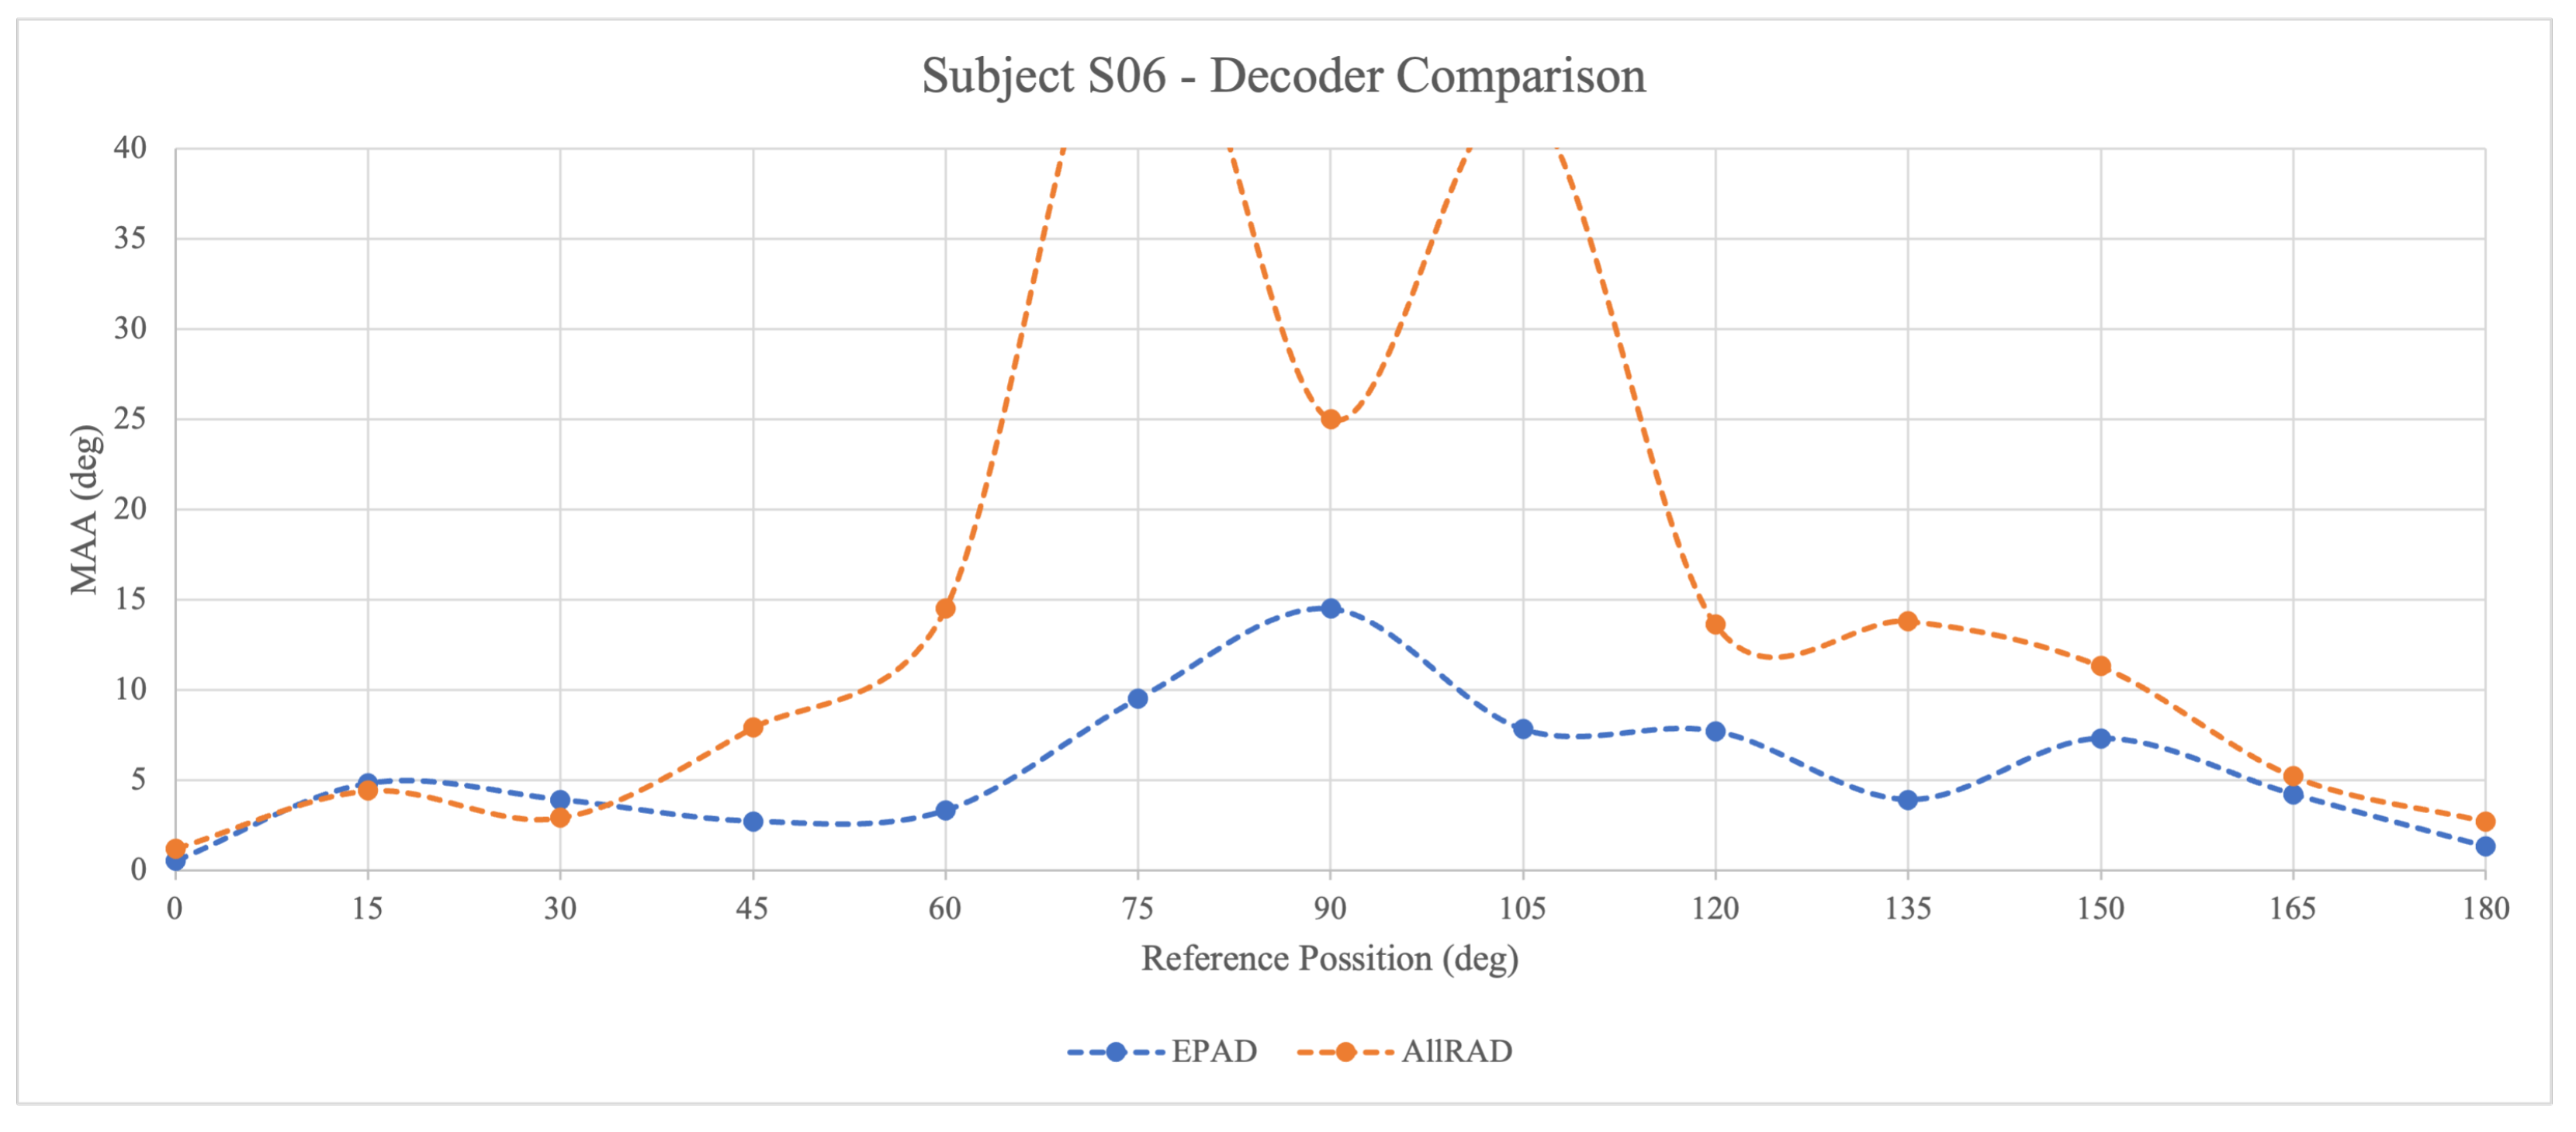
may suggest difficulties with perception above the stereophonic range due to the contrast in the high familiarity with the stereo range and unfamiliarity beyond it.
Figure 14 shows the results for subject S06, who has the lowest familiarity with the ambisonic system. In this case, only the data from two listening tests was available. For the range of the stereophonic scene, which is up to
, there is no significant difference in perception between the two decoders. However, above that reference value, the MAA remains lower for the EPAD.
6. Discussion
In this study, the arithmetic mean was employed as a measure of central tendency for the analysed parameters, with full awareness of the methodological limitations inherent to its application in small-sample research. To address these limitations and ensure transparency, the steps were implemented as follows:
This approach aligns with recommendations for small-sample studies in the psychoacoustic literature [
33], where descriptive statistics remain valid when accompanied by rigorous transparency about data dispersion and reproducibility constraints.
The ANOVA results indicate that decoder performance varies significantly across spatial positions; however, the main effect of the decoder alone is not significant (). Notably, pairwise comparisons between the AllRAD and SAD show a significant difference () only at and . The overall effect size is small ().
Additional observations within the subjects are captured, suggesting a possible dependency on familiarity with the playback system and the stereophony experience and offering direction for further research. For subjects highly familiar with the system, the differences between the decoders remain within the same order of magnitude. For listeners with high experience in stereophonic sound, the resolution within the stereo base (up to ) remains very high for the VBAP-based decoders. For the subjects without experience, the EPAD produces better results than any other decoder for the whole range of the horizontal plane. That may suggest the overall importance of stable energy distribution and minimising the energy vector angular error to produce the best perceptual results. The results of the three subjects (S01, S05, S06) with varied experience with stereophonic and spatial audio may suggest that, unless the listener is highly familiar with the playback system, the particular experience in stereophony may cause increased alertness in phase differences. This, in turn, may reduce the perceptual resolution of the MAA.
7. Conclusions
This paper provides insight into the directional auditory location in Ambisonics by investigating the MAA for three different ambisonic decoders: the SAD, EPAD, and AllRAD. It describes all considered decoders and discusses the differences in the sound field reproduction when applied to the non-t-design of the loudspeaker layout.
The perceptual evaluation of the MAA reveals different results for each of the decoders, suggesting that the method of sound field reproduction influences the MAA. In particular, the EPAD, which prioritises equal energy distribution, produced the lowest mean values of the MAA. This may be motivated by the more uniform reproduction of amplitude and energy across the sound field compared to the SAD and AllRAD. However, the localisation perception may also be influenced by the familiarity with ambisonic systems and with audio reproduction systems in general. The effect size is too small in this particular study; to better understand potential trends, particularly regarding individual differences related to experience with spatial or stereophonic playback, which show the potential to contribute to the results, future studies should include a larger number of participants.
The white noise stimulus was band-limited to 20 Hz–20 kHz, which broadly encompasses the frequency ranges relevant to ITD and ILD-based localisation cues. However, the precise relationship between the spectral content of the stimulus, auditory spatial mechanisms, and the frequency response characteristics of the energy vector decoder remains a subject for further investigation and systematic analysis.
In the future, the insights regarding the MAA can be useful in research on the human perception of sound in virtual and extended reality environments, where sound reproduction is most often ambisonic-based. The MAA can also provide guidelines for sound design and music production capable of reproduction that meets the creator’s intention in terms of sound-source localisation.


 ,
, 


