1. Introduction
As key core equipment in the field of precision machining, rotating machinery plays an irreplaceable role in various key industries such as aerospace, energy, and transportation and is an essential driving force for developing related technologies [
1,
2]. Eccentricity failure is a critical factor affecting rotor stability and reliability during its operation [
3,
4]. Currently, existing methods rely on detecting signals such as current, vibration, and noise, as well as analyzing the frequency spectrum of the signals to monitor eccentricity faults [
5,
6]. Researchers also detect eccentricity faults by measuring magnetic field strength and unbalanced magnetic pulling force [
7,
8,
9]. Most of these methods are based on spectral analysis, are susceptible to environmental influences, and are not conducive to generalization to other rotating machinery. Therefore, proposing a reliable and easily generalizable method to separate the eccentricity error is the current direction of work.
As precision rotary machining equipment, the rotational accuracy of the spindle of a Computer Numerical Control (CNC) machine tool is determined by the assembly accuracy. High-precision measuring equipment is often used to control the spindle assembly accuracy during installation [
10,
11]. However, these detection devices have high costs and are not conducive to promotion. The rotational accuracy of the spindle is inevitably affected by installation eccentricity errors [
12,
13]. The common accuracy detection method is to install a standard ball or cylinder at the machining end of the spindle and measure its displacement signal during rotation to evaluate the rotational accuracy of the spindle [
14,
15]. In its operation, the installation eccentricity error of the workpiece exhibits the same frequency characteristics as the first harmonic component of the spindle motion error, which affects the extraction of the true vibration of the spindle [
16]. During the installation process of standard equipment, it is inevitable to introduce installation eccentricity errors, which will be detrimental to the measurement of rotational accuracy. In addition, the installation eccentricity error of the workpiece can also cause cutting force fluctuations, accelerate tool wear, and reduce the surface integrity of the workpiece [
17,
18,
19]. Researchers have also attempted to embed some sensors inside the spindle, but the internal space is limited, and the working conditions are complex, making it unsuitable for installing precision instruments [
20,
21,
22]. Accurately separating the installing eccentricity errors is a prerequisite for compensation [
23]. Based on this, there is an urgent need to propose a low-cost and computationally simple method for separating installation eccentricity errors.
In addition, the angle measurement system, as a key subsystem in the advanced manufacturing ecosystem, is also affected by installation eccentricity errors [
24,
25]. As the core of the angle measurement system, the installation eccentricity error of the grating encoder can lead to a deviation between the actual and ideal angular positions, reducing the measurement accuracy. Although encoders can achieve sub-arc second resolution, measurement errors caused by eccentricity during installation are still difficult to eliminate through traditional calibration methods [
26,
27]. Although researchers have proposed many methods to compensate for installation eccentricity errors, such as adaptive methods and neural network methods [
28,
29,
30], further research and improvement are needed to detect such errors effectively. Therefore, this article proposes a calculation method that combines PSO and the LSM to separate installation eccentricity errors.
To solve the above problems, the research content of this article is arranged as follows: The second part derives the motion law based on the geometric relationship between installation eccentricity error and the first harmonic of spindle motion. The third part proposes a method for separating installation eccentricity error from the first harmonic of spindle motion. The fourth part verifies the accuracy and reliability of the proposed separation method using numerical simulation methods. The fifth part studies and discusses the effects of spindle speed, axial distance, and workpiece shape on the experimental separation results. The results indicate that the method proposed in this work can separate the amplitude and phase of both the first harmonic of the radial runout error of the spindle and the eccentricity error of the workpiece installation error. This work is significant for improving product quality, reducing waste, and enhancing productivity in the production environment.
2. The Motion Law of the First Harmonic of the Spindle and the Eccentricity of the Workpiece Installation
In this section, the combined motion law of the first harmonic of the spindle and the eccentricity of the workpiece installation is derived. To prevent displacement during workpiece processing, the clamping torque between the chuck and the workpiece is relatively high, so the distance between the workpiece center and the spindle center is kept constant, that is, the installation eccentricity and phase are both fixed values. The eccentric motion of the workpiece is a circle in the Cartesian coordinate system, and its trajectory is projected on the
x- and
y-axes as the first harmonic, which is equal in amplitude and has a phase difference of π/2, that is:
where
xw(
θ) and
yw(
θ) are components of eccentric motion at the
x- and
y-axis, respectively.
R1 is the eccentricity.
λ is the initial phase of eccentric motion.
The first harmonic motion of the spindle can be expressed by the parametric equation
where
xs(
θ) and
ys(
θ) are first harmonic components of spindle motion error at the
x- and
y-axis, respectively.
a and
b are the amplitude of the first harmonic at the
x-and
y-axes, respectively.
ϕ1 and
ϕ2 are the initial phases of the first harmonic.
The motion form of the first harmonic of the radial runout error of the spindle exists in various forms. If
ϕ1 = ϕ2, the initial phase is consistent, it is a linear vibration, and its expression is
If the difference between
ϕ1 and
ϕ2 is π/2 and
a =
b, then the first harmonic component is circular motion, that is:
If none of the above conditions are met, the first harmonic component is a general elliptical motion centered around the coordinate origin.
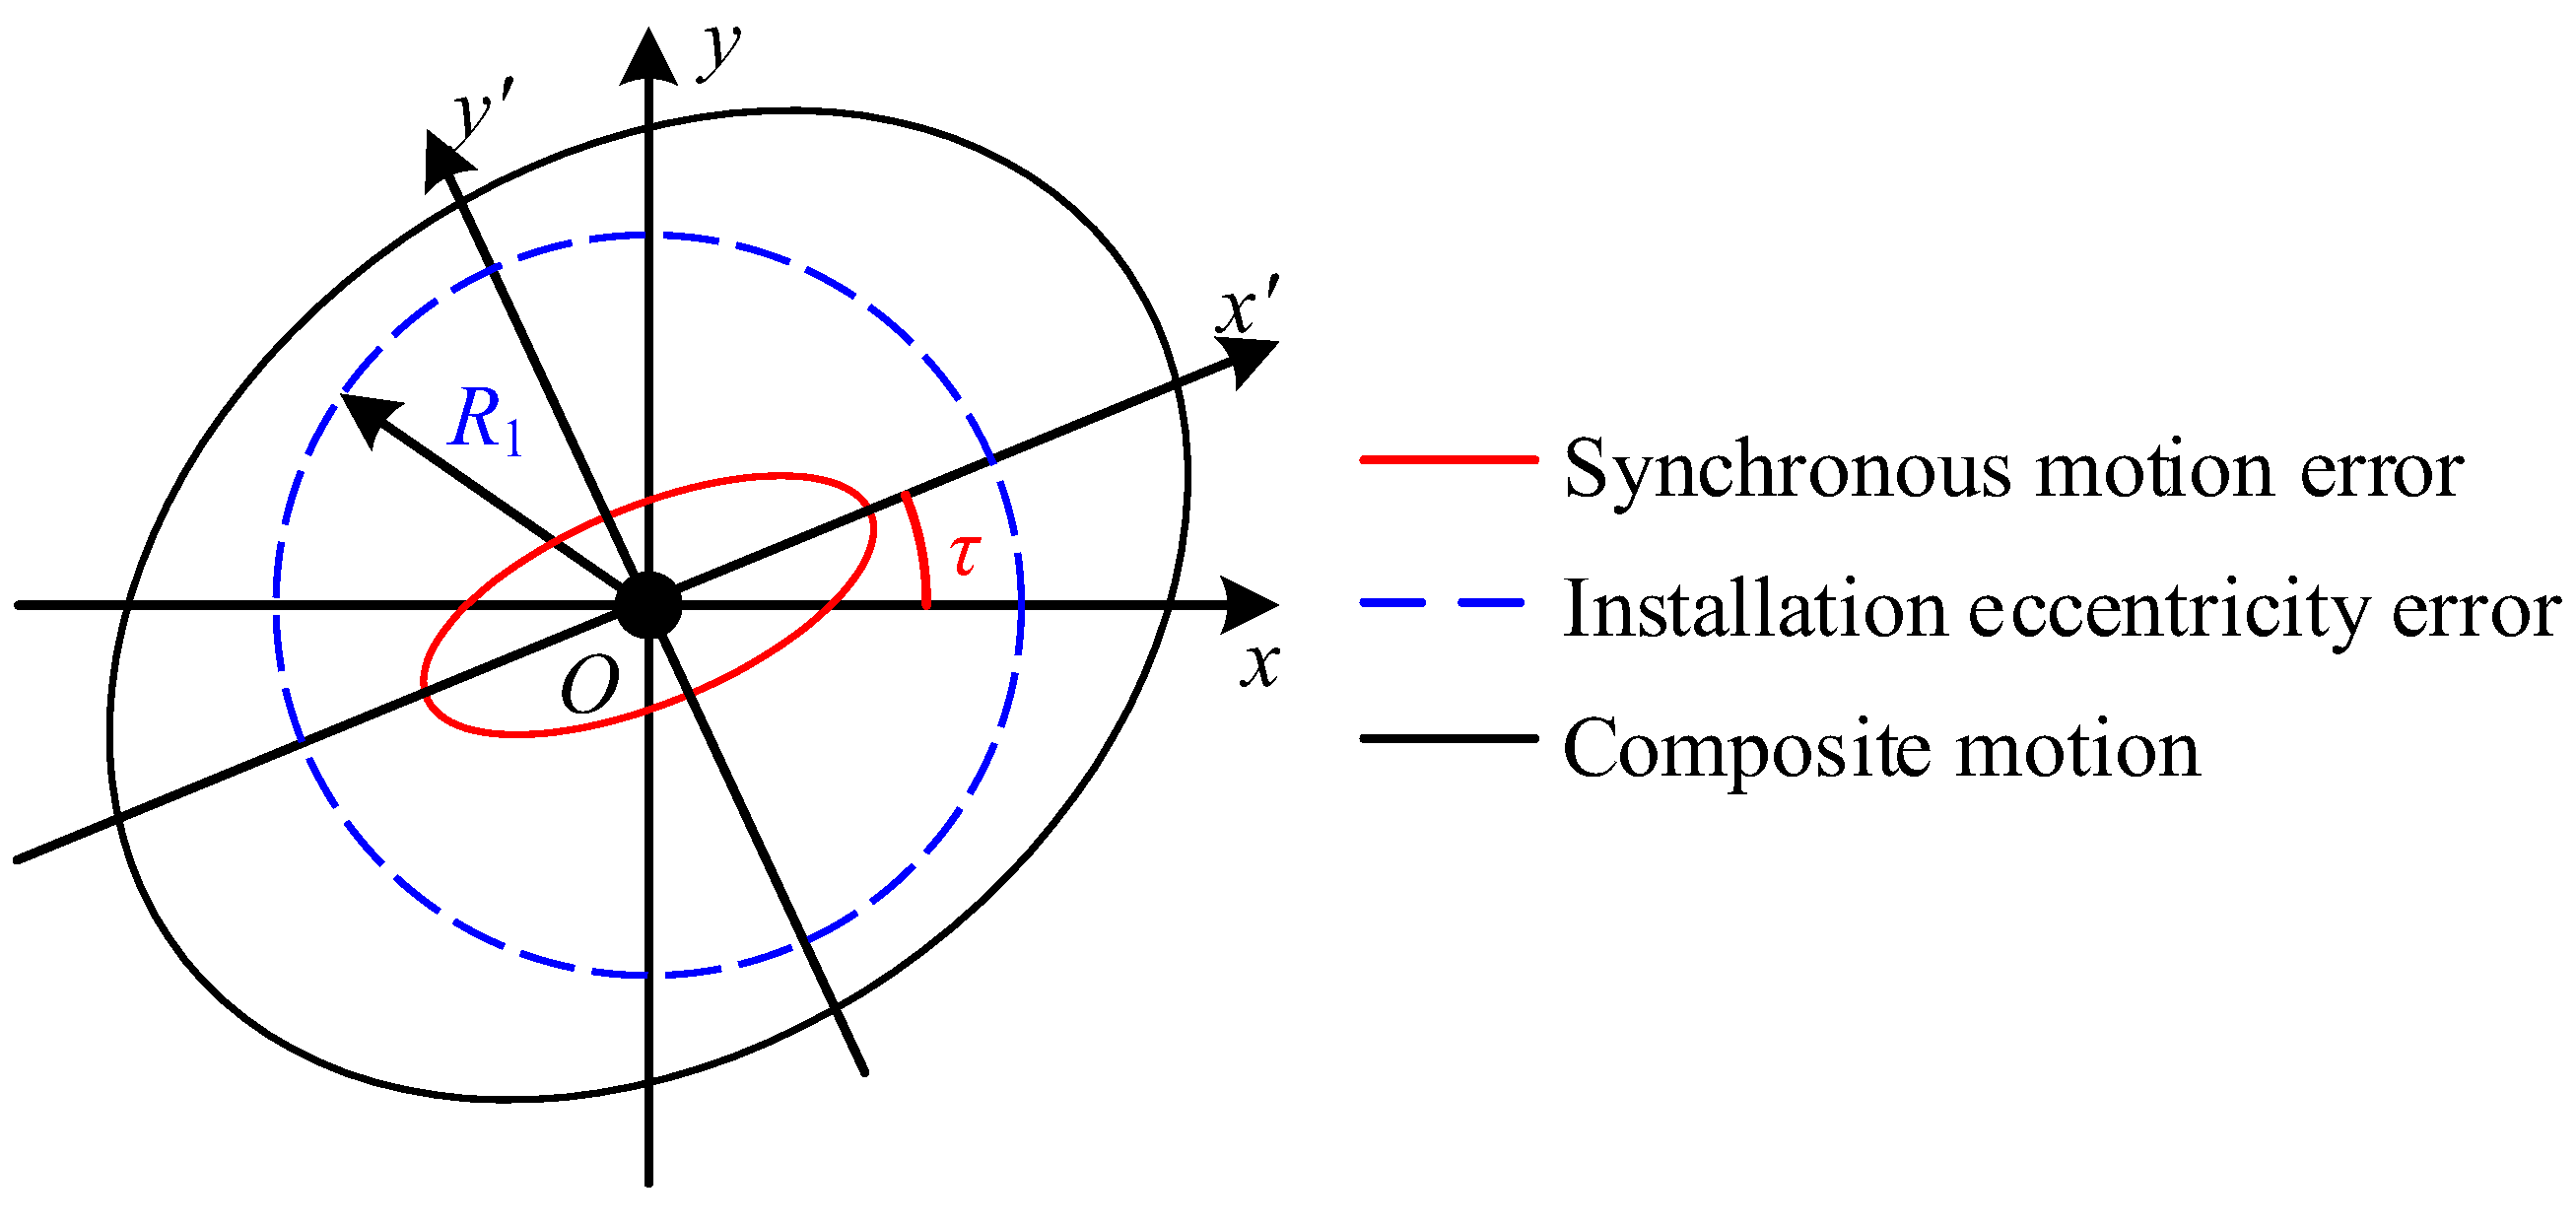
Therefore, the trajectory of the synthesized motion of the first harmonic of the spindle and the eccentricity of the workpiece are generally elliptical and can be expressed as
Equation (5) is a system of nonlinear equations. In this case, the trajectory image of the synthesized motion is shown in
Figure 1, where
O is the center of the spindle,
R1 is the eccentricity error of the workpiece installation, and
τ is the angle between the long half-axis and the
x-axis.
Assuming that the motion form of the first harmonic component of the radial runout error of the spindle is circular motion, and the combined motion with the installation eccentricity error of the workpiece is still circular motion, that is, the initial phase of the eccentricity of the spindle and workpiece installation is the same, Equation (5) can be written as follows:
In Equation (6), there are three unknown variables, a, R1, and t1, and only two equations. Therefore, the amplitude R1 of the workpiece installation eccentricity error cannot be separated from the amplitude a of the first harmonic component of the spindle vibration.
In addition, when the first harmonic component of the radial runout error of the spindle is still circular motion, but is different from the initial phase of the installation eccentricity error of the workpiece, Equation (6) can be rewritten as Equation (7), that is:
In Equation (7), there are four unknown parameters, including a, R1, t1, and λ, but the number of equations is still only two. Obviously, in this case, the amplitude a of the first harmonic component of the spindle vibration and the amplitude R1 of the workpiece installation eccentricity error, as well as the phase λ of the first harmonic component of the spindle vibration and the phase t1 of the workpiece installation eccentricity error, cannot be separated.
Furthermore, when the first harmonic motion component of the radial runout error of the spindle is elliptical motion, that is, in the general case described in Equation (5), the equation system contains six unknown parameters: a, b, R1, t1, t2, and λ. However, the number of equations used for solving is still less than six. Therefore, it is impossible to separate the first harmonic component of the spindle radial runout error from the workpiece installation eccentricity error in this case.
3. Separation Method of Workpiece Installation Eccentricity Error
In this section, a separation method was proposed to solve the problem of inseparability between the first harmonic caused by the nonlinear vibration of the spindle and the installation eccentricity error in Equations (5)–(7).
The combined motion of the first harmonic of the radial runout error of the spindle and the installation eccentricity error of the workpiece is generally elliptical motion, as shown in Equation (5). The correspondence between the radial runout error separated from experimental data using the reversal method and the variables in Equation (5) is as follows:
Assuming the spindle rotates once and uniformly samples
N points, when the spindle angular velocity is Ω
l, the discrete Equation (5) at position
φi and time
ti can be expressed as
Therefore, there are three coefficients and three initial phases to be determined.
If Equation (9) is rearranged, it can be expressed as
with
Equation (10) can be expressed in matrix form as follows:
with
As shown in Equation (12), 3N equations can be obtained. In addition, the phase λ of the radial runout error of the spindle and the initial phases ϕ1 and ϕ2 of the workpiece installation eccentricity error are also unknown. Currently, the number of equations should be greater than the number of unknowns. In Equations (10)–(13), index l denotes the experiment results at rotational speed .
All the experiment results can be expressed as
with
where matrix
C and vector
h are constructed by vertically stacking matrices and vectors obtained from experiments under different operating conditions (such as multiple spindle speeds).
If the least squares method is applied to determined vector
χ, one has
Due to the nonlinear parameters of the phase
λ of the radial runout error of the spindle and the initial phases
ϕ1 and
ϕ2 of the workpiece installation eccentricity error, they cannot be directly solved. To determine the value of the phase angle, a particle swarm optimization (PSO) search method was developed to obtain the optimal value of the phase angle
γl (
l = 1, 2, ...,
Jl). Next, we assume the residual error vector of Equation (14) is
The optimization process is to find the parameters
γl (
l = 1, 2, …,
Jl) that minimize the value of the following objective function:
The computational procedure of the PSO search method is shown below:
Step 1: Particle swarm initialized, including population size
M, maximum iteration times
Imax, position
uj, and velocity
vj of each particle. The random number function
rand within the phase angle interval
is applied to generate
N sets of particle positions, where the position
uj of each particle represents the phase angle
γl, that is:
At this point, a combination of M sets of parameters can be obtained.
Step 2: Substituting the spindle speed Ω
l and
M groups of particles into Equation (18) to obtain vector
C and then calculating the initial objective function value based on Equations (16)–(18). The function value of each particle can be expressed as
where the parameters
are denoted by
, respectively.
Step 3: The individual extremum
and global extremum
gbest are updated. Compare the current objective function value
pj of each particle with its individual optimal value. If the current function value is better than the individual optimal value, replace the individual optimal value with the current function value of the particle. The individual optimal value in the
k-th iteration can be expressed as
Next, compare the current function value
pj of the particle with the global optimal value
gbest. If the current function value is better than the global optimal value, replace the global optimal value with the current function value of the particle. The global optimal value of the entire particle swarm can be expressed as
where the corresponding parameters of
gbest are represented by
.
Step 4: The velocity
vj and position
uj of the particles are updated. The update formula for speed
vj can be expressed as [
31,
32]:
where
w is the inertia weight, typically set as 0.5;
c1 and
c2 are acceleration constants, commonly set to 2.0;
r1 and
r2 are randomly generated random numbers uniformly distributed within [0, 1] in each iteration.
The update formula for position
uj can be written as
Step 5: Equation (25) is the condition for determining whether the search program has ended. If the termination condition is met, terminate the calculation and output the optimal phase angle combination. Otherwise, return to Step 2 to proceed to the next iteration.
By substituting the parameter
γl* (
l = 1, 2, …,
Jl) into Equations (11)–(16), the amplitudes
a and
b of the first harmonic component of the spindle vibration and the amplitude
R1 of the workpiece installation eccentricity error can be calculated. A flowchart of the algorithm is illustrated in
Figure 2.
4. Simulation Verification
In this section, the accuracy and reliability of the proposed separation method in this investigation are verified through numerical simulation. Numerical simulation verification is divided into three steps:
Step 1: Determine the parameters for simulating synthetic motion. Synthetic motion is generally elliptical motion and consists of two parts, one of which is the elliptical motion of the first harmonic component in the nonlinear vibration of the main axis, and the other is the circular motion caused by installation eccentricity error. The simulation parameters of the first harmonic of the radial runout error of the spindle and the eccentricity error of the workpiece installation are shown in
Table 1.
Step 2: As shown in
Figure 3, simulation trajectories are constructed based on the parameters of ellipse 1 to ellipse 3 in
Table 1 for the primary harmonic component of the spindle and the eccentricity error of the workpiece installation, as well as their composite motion. The sampling frequency is 1000 Hz, and the rotational speed is 20π rad/s. The simulation motion of the first harmonic of the spindle radial runout error, the workpiece installation eccentricity simulation motion, and their combined motion are shown in
Figure 3a–f, respectively.
Figure 3a,b show the simulated motion trajectory of the nonlinear vibration of the first harmonic component of the spindle along the
x and
y directions, where the amplitudes are
a,
b and phases are
ϕ1,
ϕ2, directly affecting the shape and direction of the ellipse.
Figure 3c,d depict the circular motion with installation eccentricity error, where the eccentricity
R1 determines the radius of the circular motion, and the phase
λ controls the direction of the center’s offset. Finally,
Figure 3e,f show the superposition results of the synthesized motion along the
x and
y directions, which are determined by the combination of nonlinear parameters.
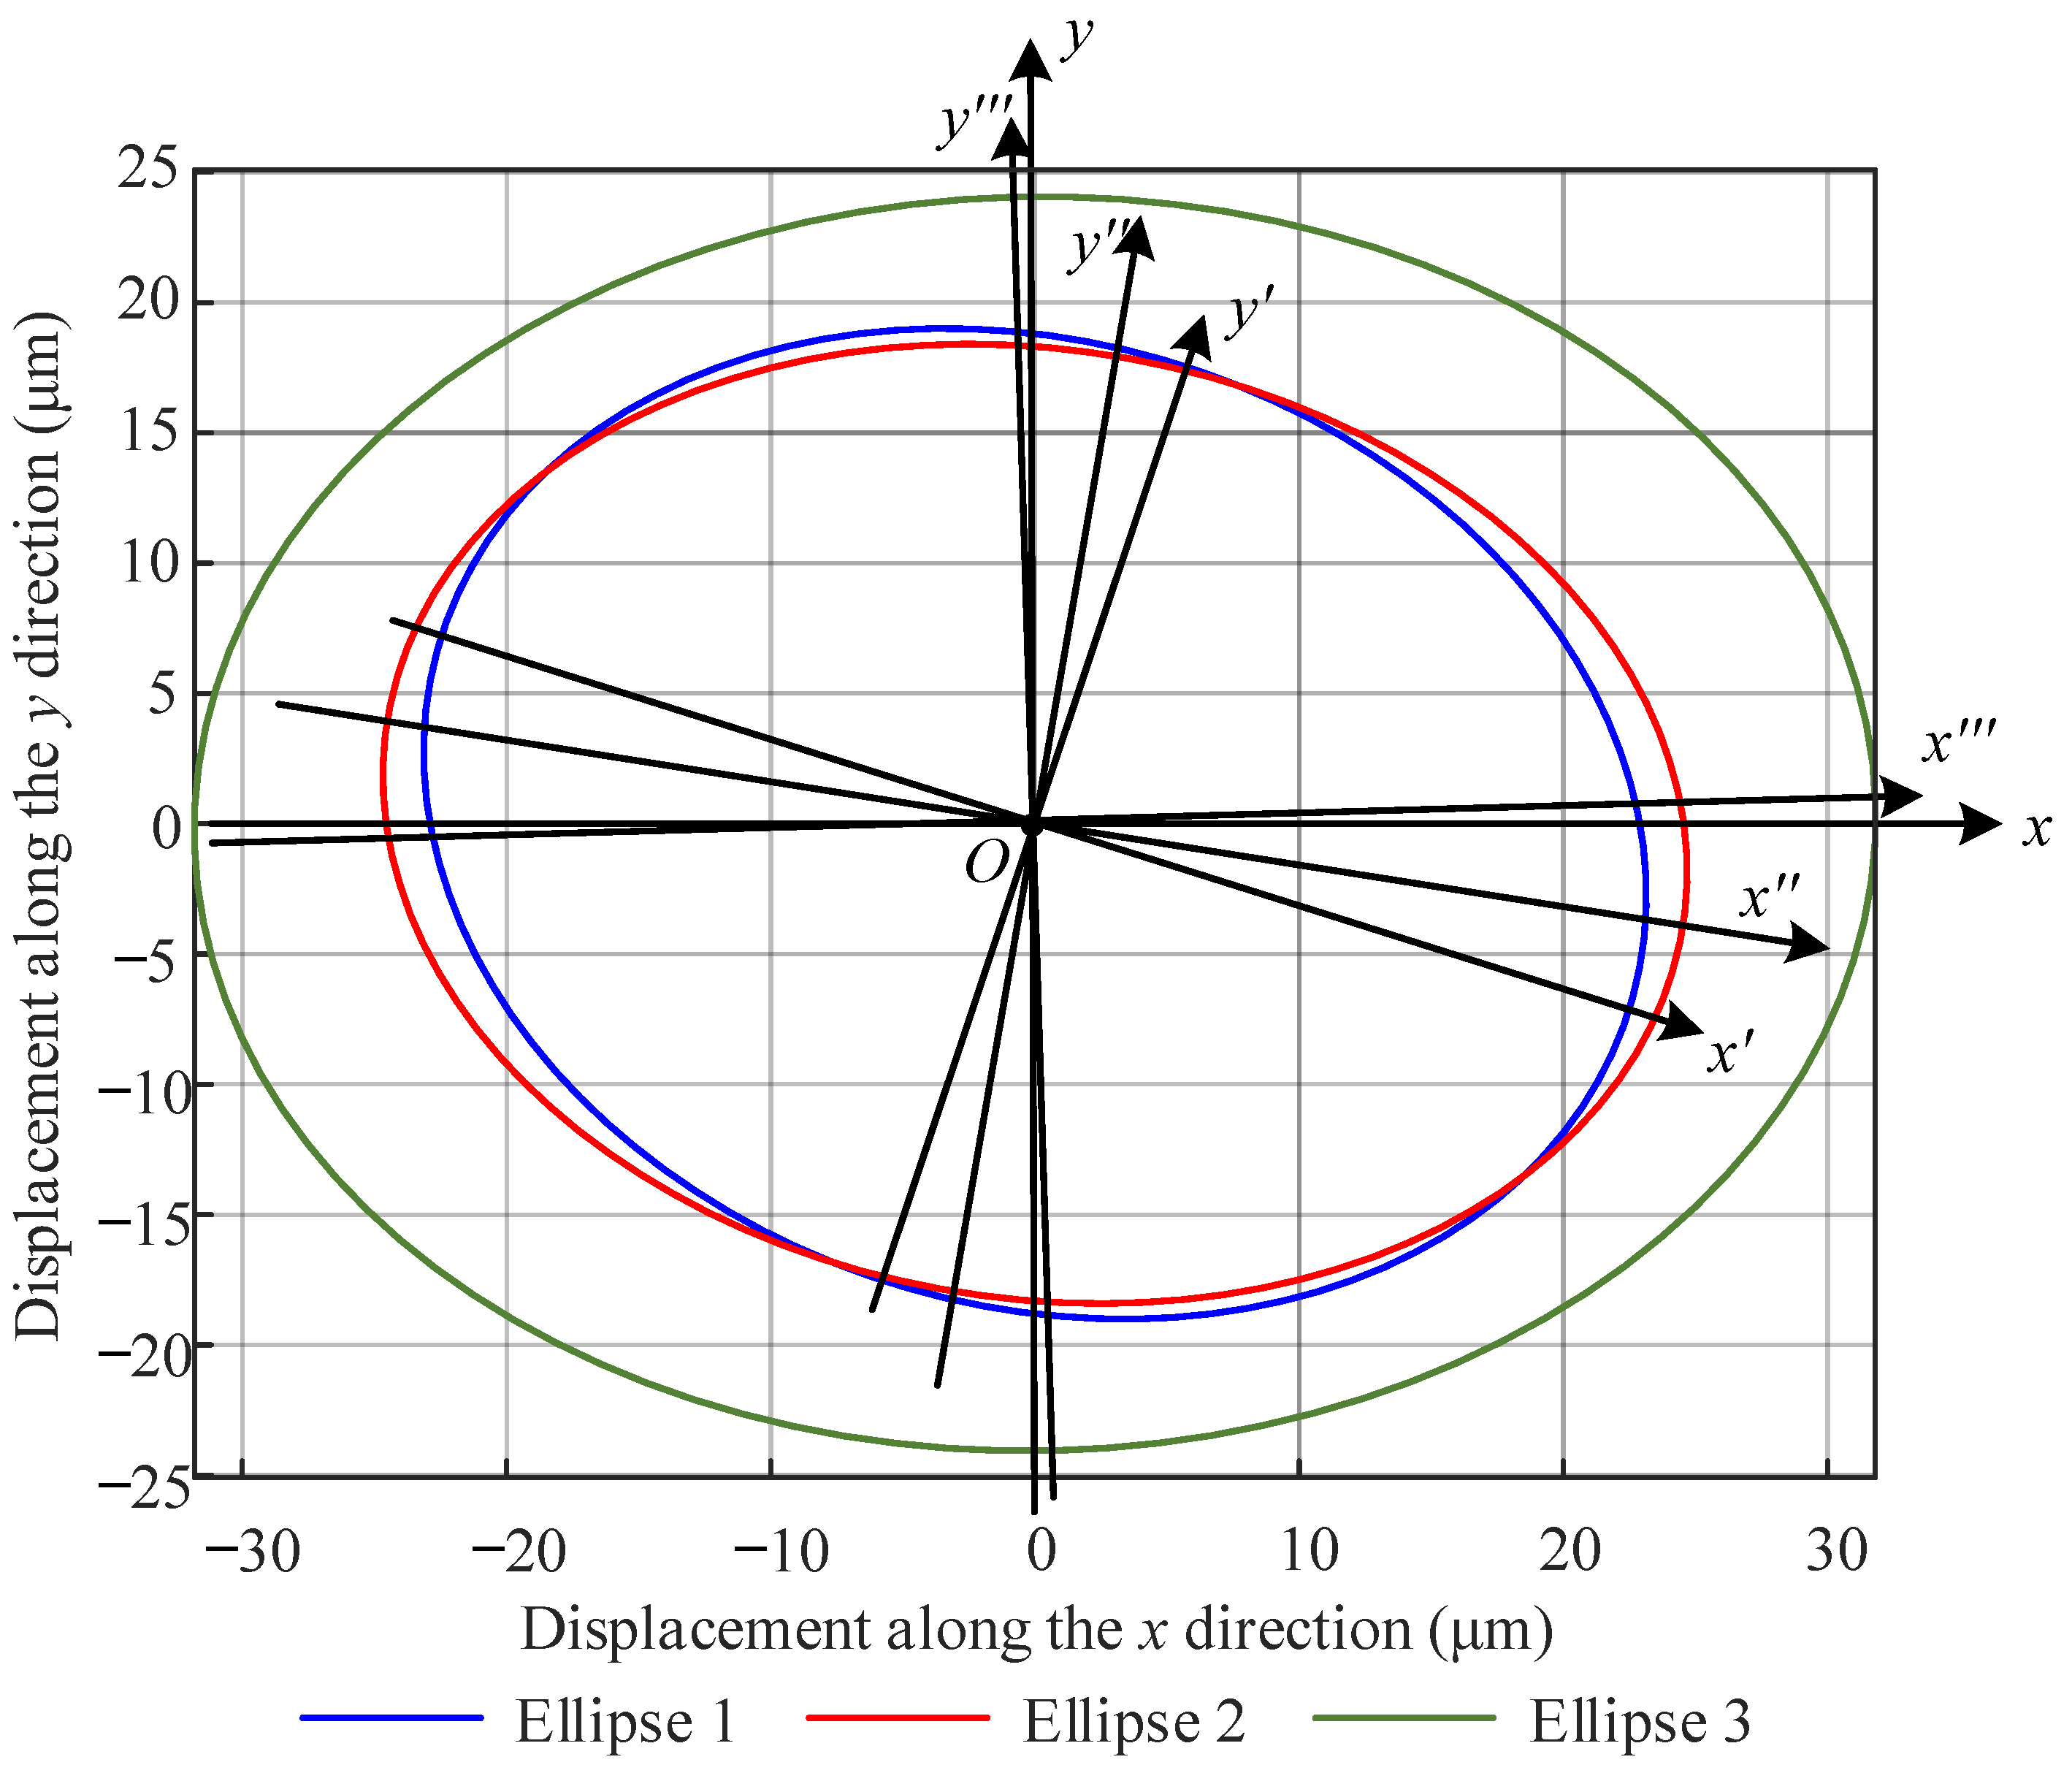
The elliptical trajectory of composite motion in space is shown in
Figure 4. In the figure,
Oxy is a fixed coordinate system, and
Ox′
y′,
Ox″
y″, and
Ox″′
y″′ are new coordinate systems established along the three major and minor axes of the ellipse. Comparing the size parameters of three ellipses, as the amplitude of both the spindle’s first harmonic component and the workpiece installation eccentricity error increase, the long and short axes of the synthesized ellipse also increase. Meanwhile, due to the increase in the phase of both the spindle’s first harmonic component and the workpiece installation eccentricity error, the angle between the long half-axis and the
x-axis of the synthesized elliptical trajectory is also different. In summary, composite motion is determined by the amplitude and phase of the spindle’s first harmonic component and the workpiece installation’s eccentricity error.
Step 3: The simulated synthesized motion is substituted into the vector h in Equation (14). Next, the PSO search method proposed in the previous section is applied to find the phase angles that minimize the residual v. After substituting the phase angles into matrix C, Equation (16) is used to calculate the amplitude of the first harmonic component a and b of the spindle and the amplitude R1 of the workpiece installation eccentricity error. Afterward, the computational accuracy of the proposed separation method is evaluated.
The calculation results of different ellipse parameters are shown in
Table 2, including the calculation results and errors of amplitudes
R1,
a, and
b, and phases
λ,
ϕ1, and
ϕ2. For ellipse 1, the theoretical and calculated values are very close, with errors within 0.07%, indicating that the calculation results of ellipse 1 parameters have high accuracy. The data of ellipse 2 are also similar, with a small error between the theoretical and calculated values, further verifying the reliability of the calculation method. The data of ellipse 3 exhibit a high degree of consistency, with minor errors arising from truncation errors in numerical calculations or limitations in calculation accuracy. These data indicate that the calculation error between the calculated and theoretical values is very small, further confirming the high accuracy and promising application prospects of the proposed separation method for workpiece installation eccentric error in this investigation.
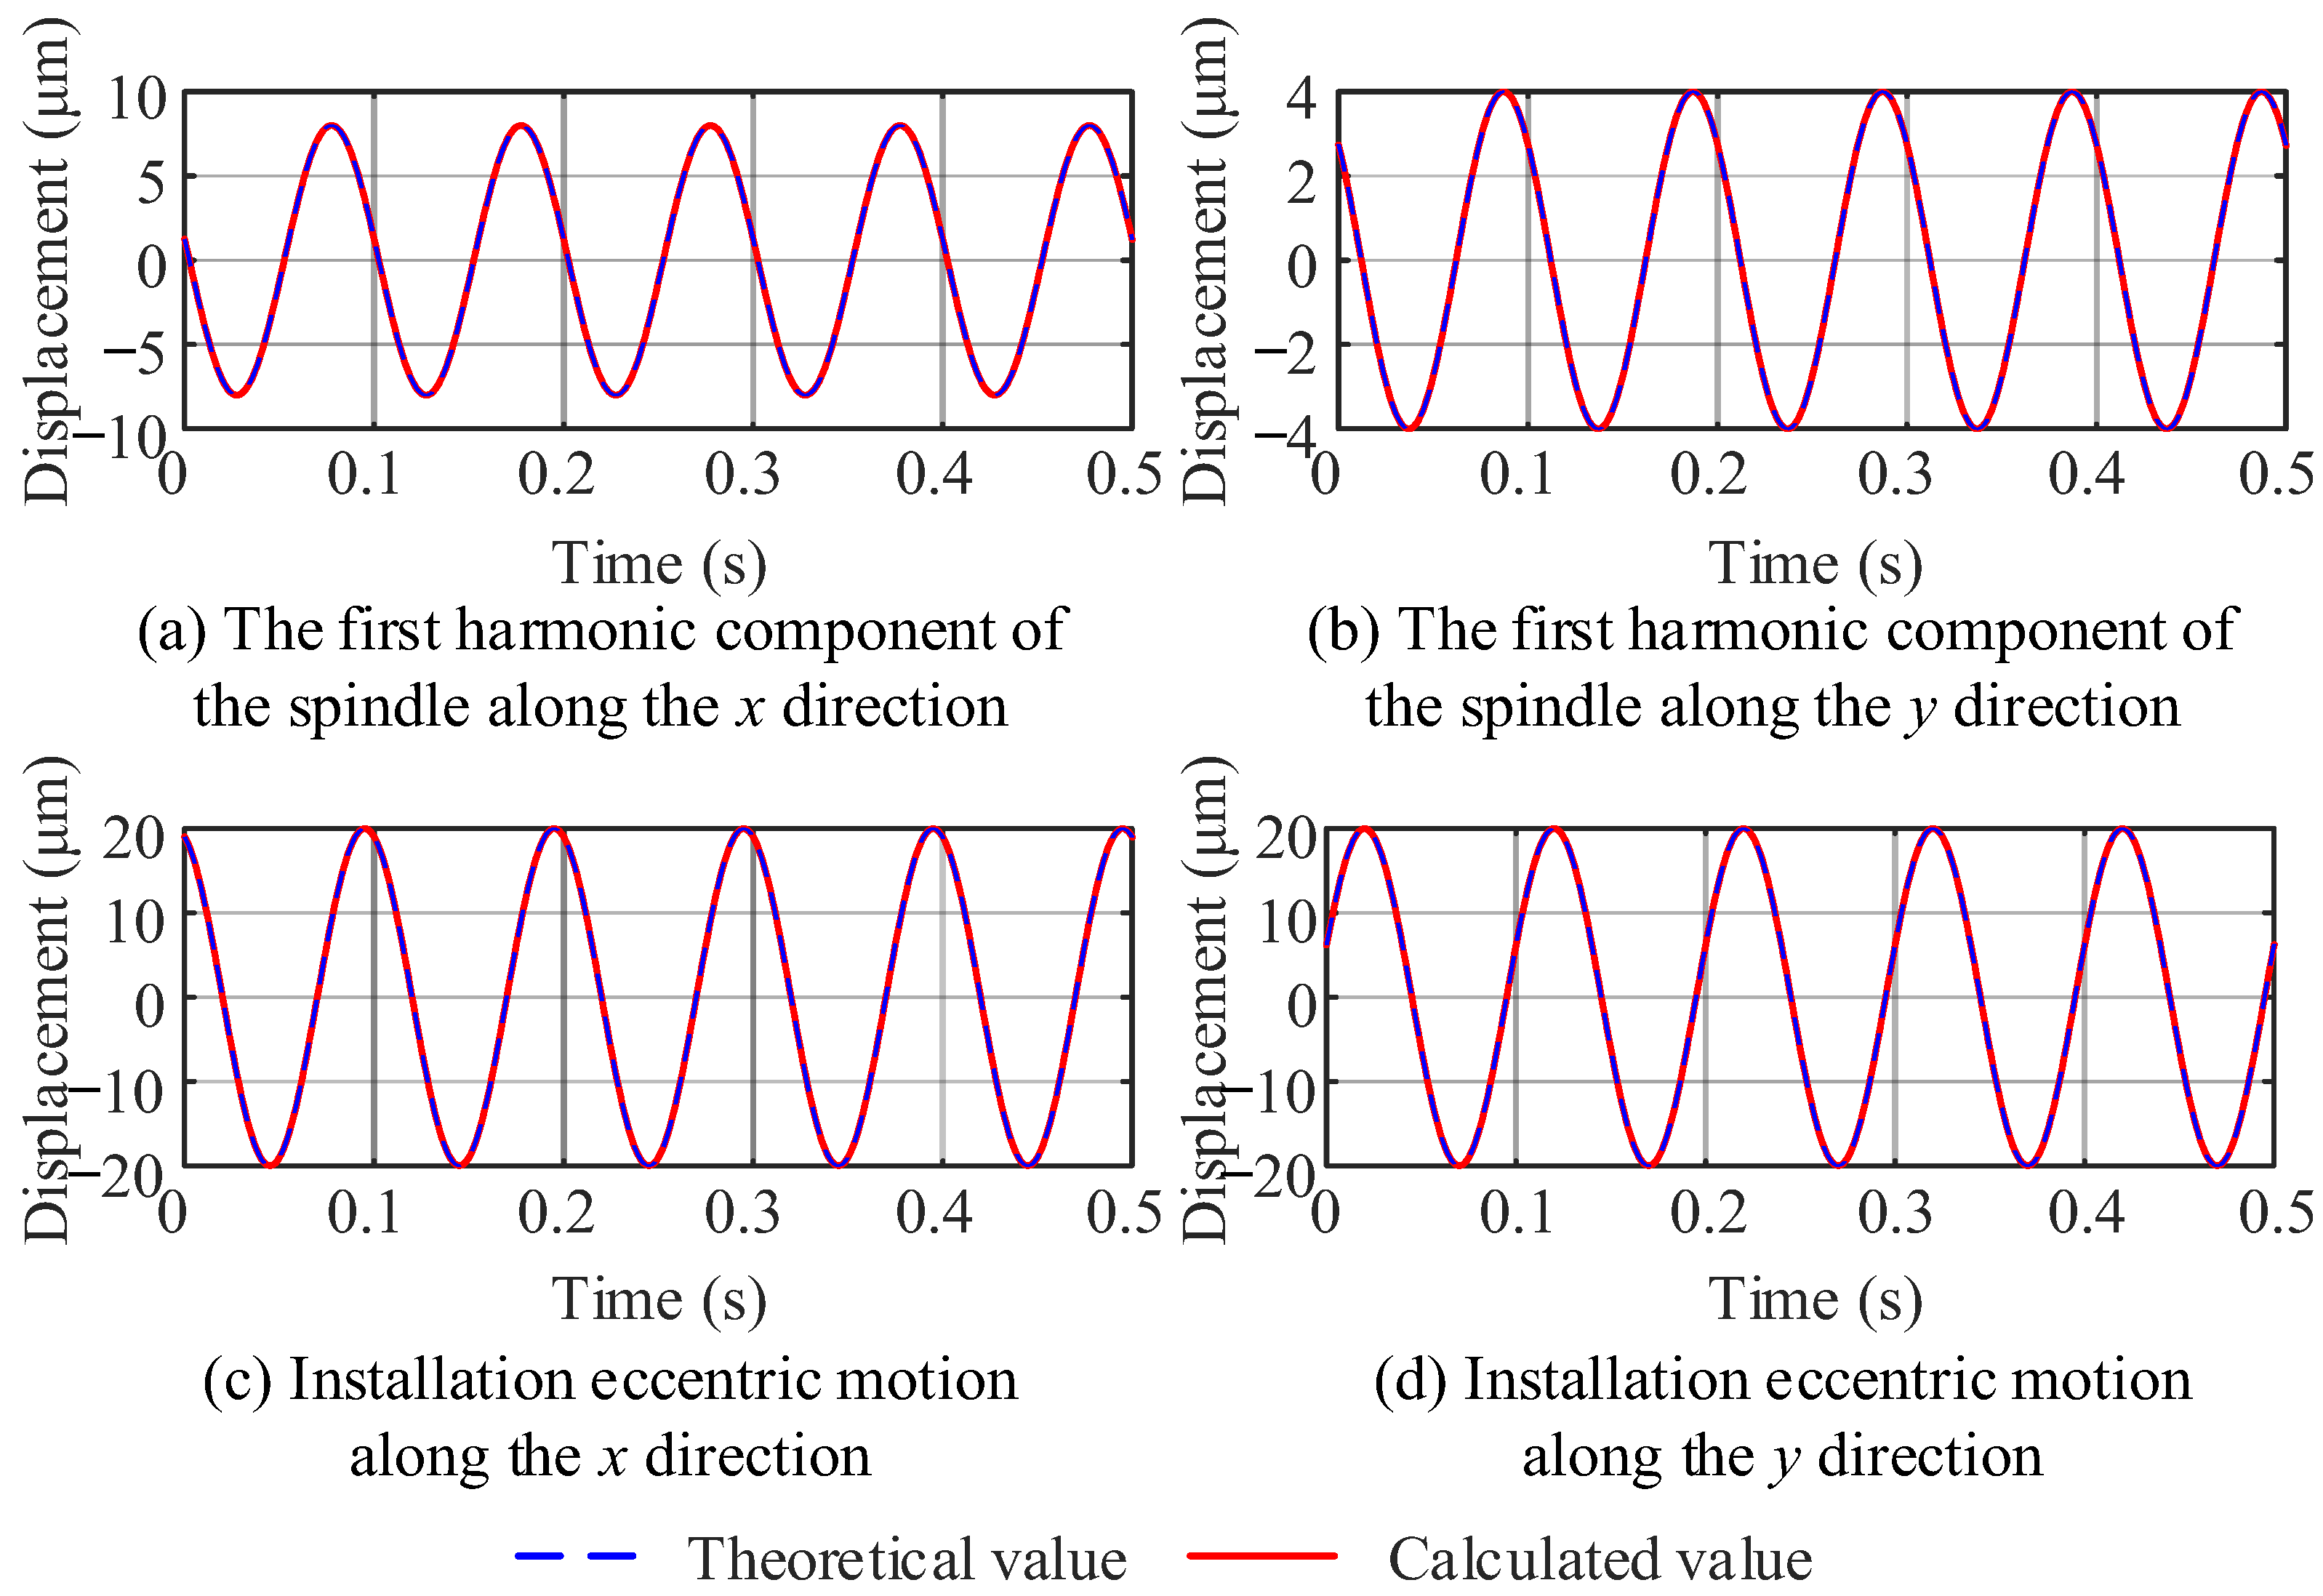
As shown in
Figure 5, based on the parameters of ellipse 2 from
Table 1 and
Table 2, the theoretical and calculated trajectories of the spindle’s first harmonic component and the workpiece installation eccentricity error were obtained. Furthermore, the sum of squared errors (SSE), root mean square error (RMSE), and mean absolute error (MAE) were used as evaluation index to quantitatively evaluate the computational accuracy of the proposed error separation method.
Table 3 shows the calculation errors between the calculated values and theoretical values of both the spindle’s first harmonic component and the workpiece installation eccentricity error along different directions under different error indicators, where
x and
y represent directions. The slight values of each error indicate the high accuracy and reliability of the separation method proposed in this investigation for the first harmonic component of the spindle and the installation eccentricity error of the workpiece.
In summary, the proposed separation method for workpiece installation eccentric error exhibits high computational accuracy and stability when dealing with the nonlinear vibration form of the first harmonic component of the spindle radial runout error. In addition, when the first harmonic component of the spindle radial runout error is in the form of linear vibration, that is, when the amplitude of the first harmonic component of the spindle radial runout error in the x or y direction is zero, the calculation results of the separation method also maintain high calculation accuracy and stability.
5. Experimental Study
In this section, an experimental testing system is built to collect displacement signals of the workpiece through sensors. Subsequently, the proposed separation method for workpiece installation eccentric error is used to obtain detection results under different workpieces, spindle speeds, and axial distance conditions, and the detection results are analyzed and discussed.
5.1. Experimental Equipment
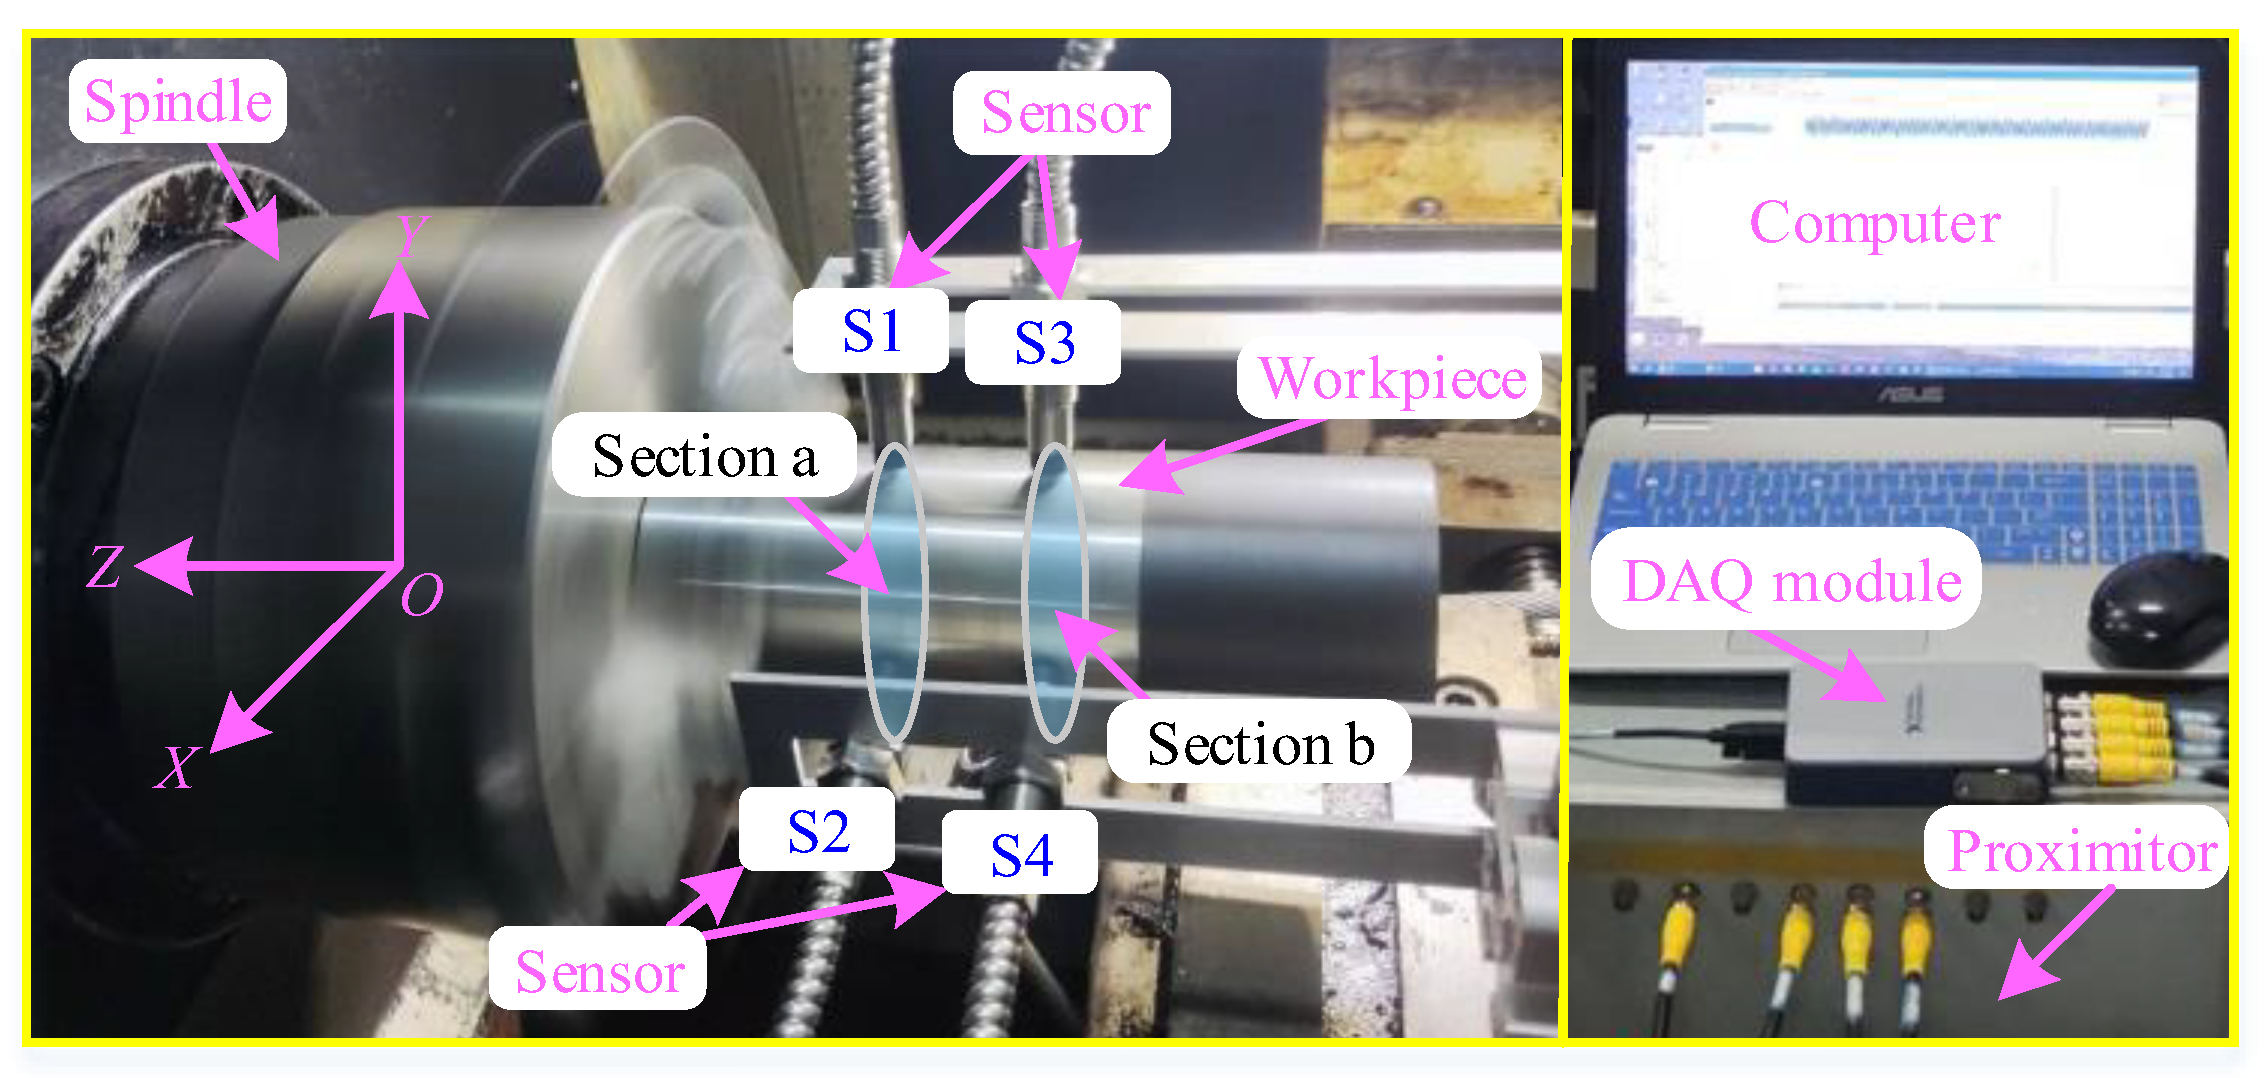
The experimental machine model is a commercial CNC6130 lathe (Yingtai Machine Tool, Wenling, China), equipped with four eddy current sensors (ML33-01-00-03, MIRAN, Shenzhen, China) for detecting displacement signals on the workpiece, as shown in
Figure 6. Sensors S1 and S2 detect section a of the workpiece, while S3 and S4 detect section b. S1 and S3 detect the displacement signal in the
y direction, while S2 and S4 detect the displacement signal in the
x direction. The distance between the chuck end face and sensor S1 is 80 mm, while the distance between sensor S1 and S3 is 50 mm. After the spindle is started, the data acquisition card (NI-DAQ) inputs the sensor signal into the computer with a sampling frequency of 25.6 kHz.
Eddy current displacement sensors save more than 80% in hardware costs compared to laser interferometers and coordinate measuring instruments while ensuring detection accuracy. Furthermore, the proposed algorithm does not require a dedicated computing platform, a factor that significantly reduces software costs. At the same time, detection can be carried out during processing, offering fast detection speed and reducing downtime cost in industrial production. Thus, this method balances detection accuracy and cost efficiency, making it suitable for cost-sensitive manufacturing scenarios.
The specifications of workpieces 1 to 3 are shown in
Figure 7. Workpieces 1 and 2, as shown in
Figure 7a,b, are cylindrical parts with different radius. Workpiece 3, as seen in
Figure 7c, has a blind hole machined into it. All workpieces are made of 45# steel with a bright machining surface on the outer surface. The mass of workpieces 1 to 3 are 2.56 kg, 3.22 kg, and 1.49 kg, respectively. The depth
lh of the blind hole of the workpiece 3 is 120 mm. The wall thickness
h of workpiece 3 is 5 mm. The front face of the workpiece is in contact with the chuck, and the clamping mechanism of the chuck fixes the machining surface of the workpiece to ensure that each jaw has the same contact area with the workpiece.
In subsequent experiments, displacement signals were measured under various operating conditions. Subsequently, the Donaldson reversal method was used to extract radial runout errors from the displacement signal [
15]. This method obtains spindle motion error by adding or subtracting two sets of signals before and after reversing 180 degrees. Afterward, the separation method proposed in this study was applied to calculate the amplitude and phase of both workpiece installation eccentricity and the spindle’s first harmonic component. Finally, the separation results under different operating conditions are discussed next.
5.2. Experimental Results and Discussions
The results for when the spindle speed is set to 300 r/min and the displacement signal is obtained by detecting workpiece 1 through four sensors (S1, S2, S3, and S4) are shown in
Figure 8. The calculation of radial runout error requires measuring the displacement signals of the workpiece before and after reversal. The displacement measurement signal of the initial position of the workpiece is shown in
Figure 8a. The displacement measurement signal of the workpiece after being loosened, reversed 180 degrees, and re-clamped is shown in
Figure 8b.
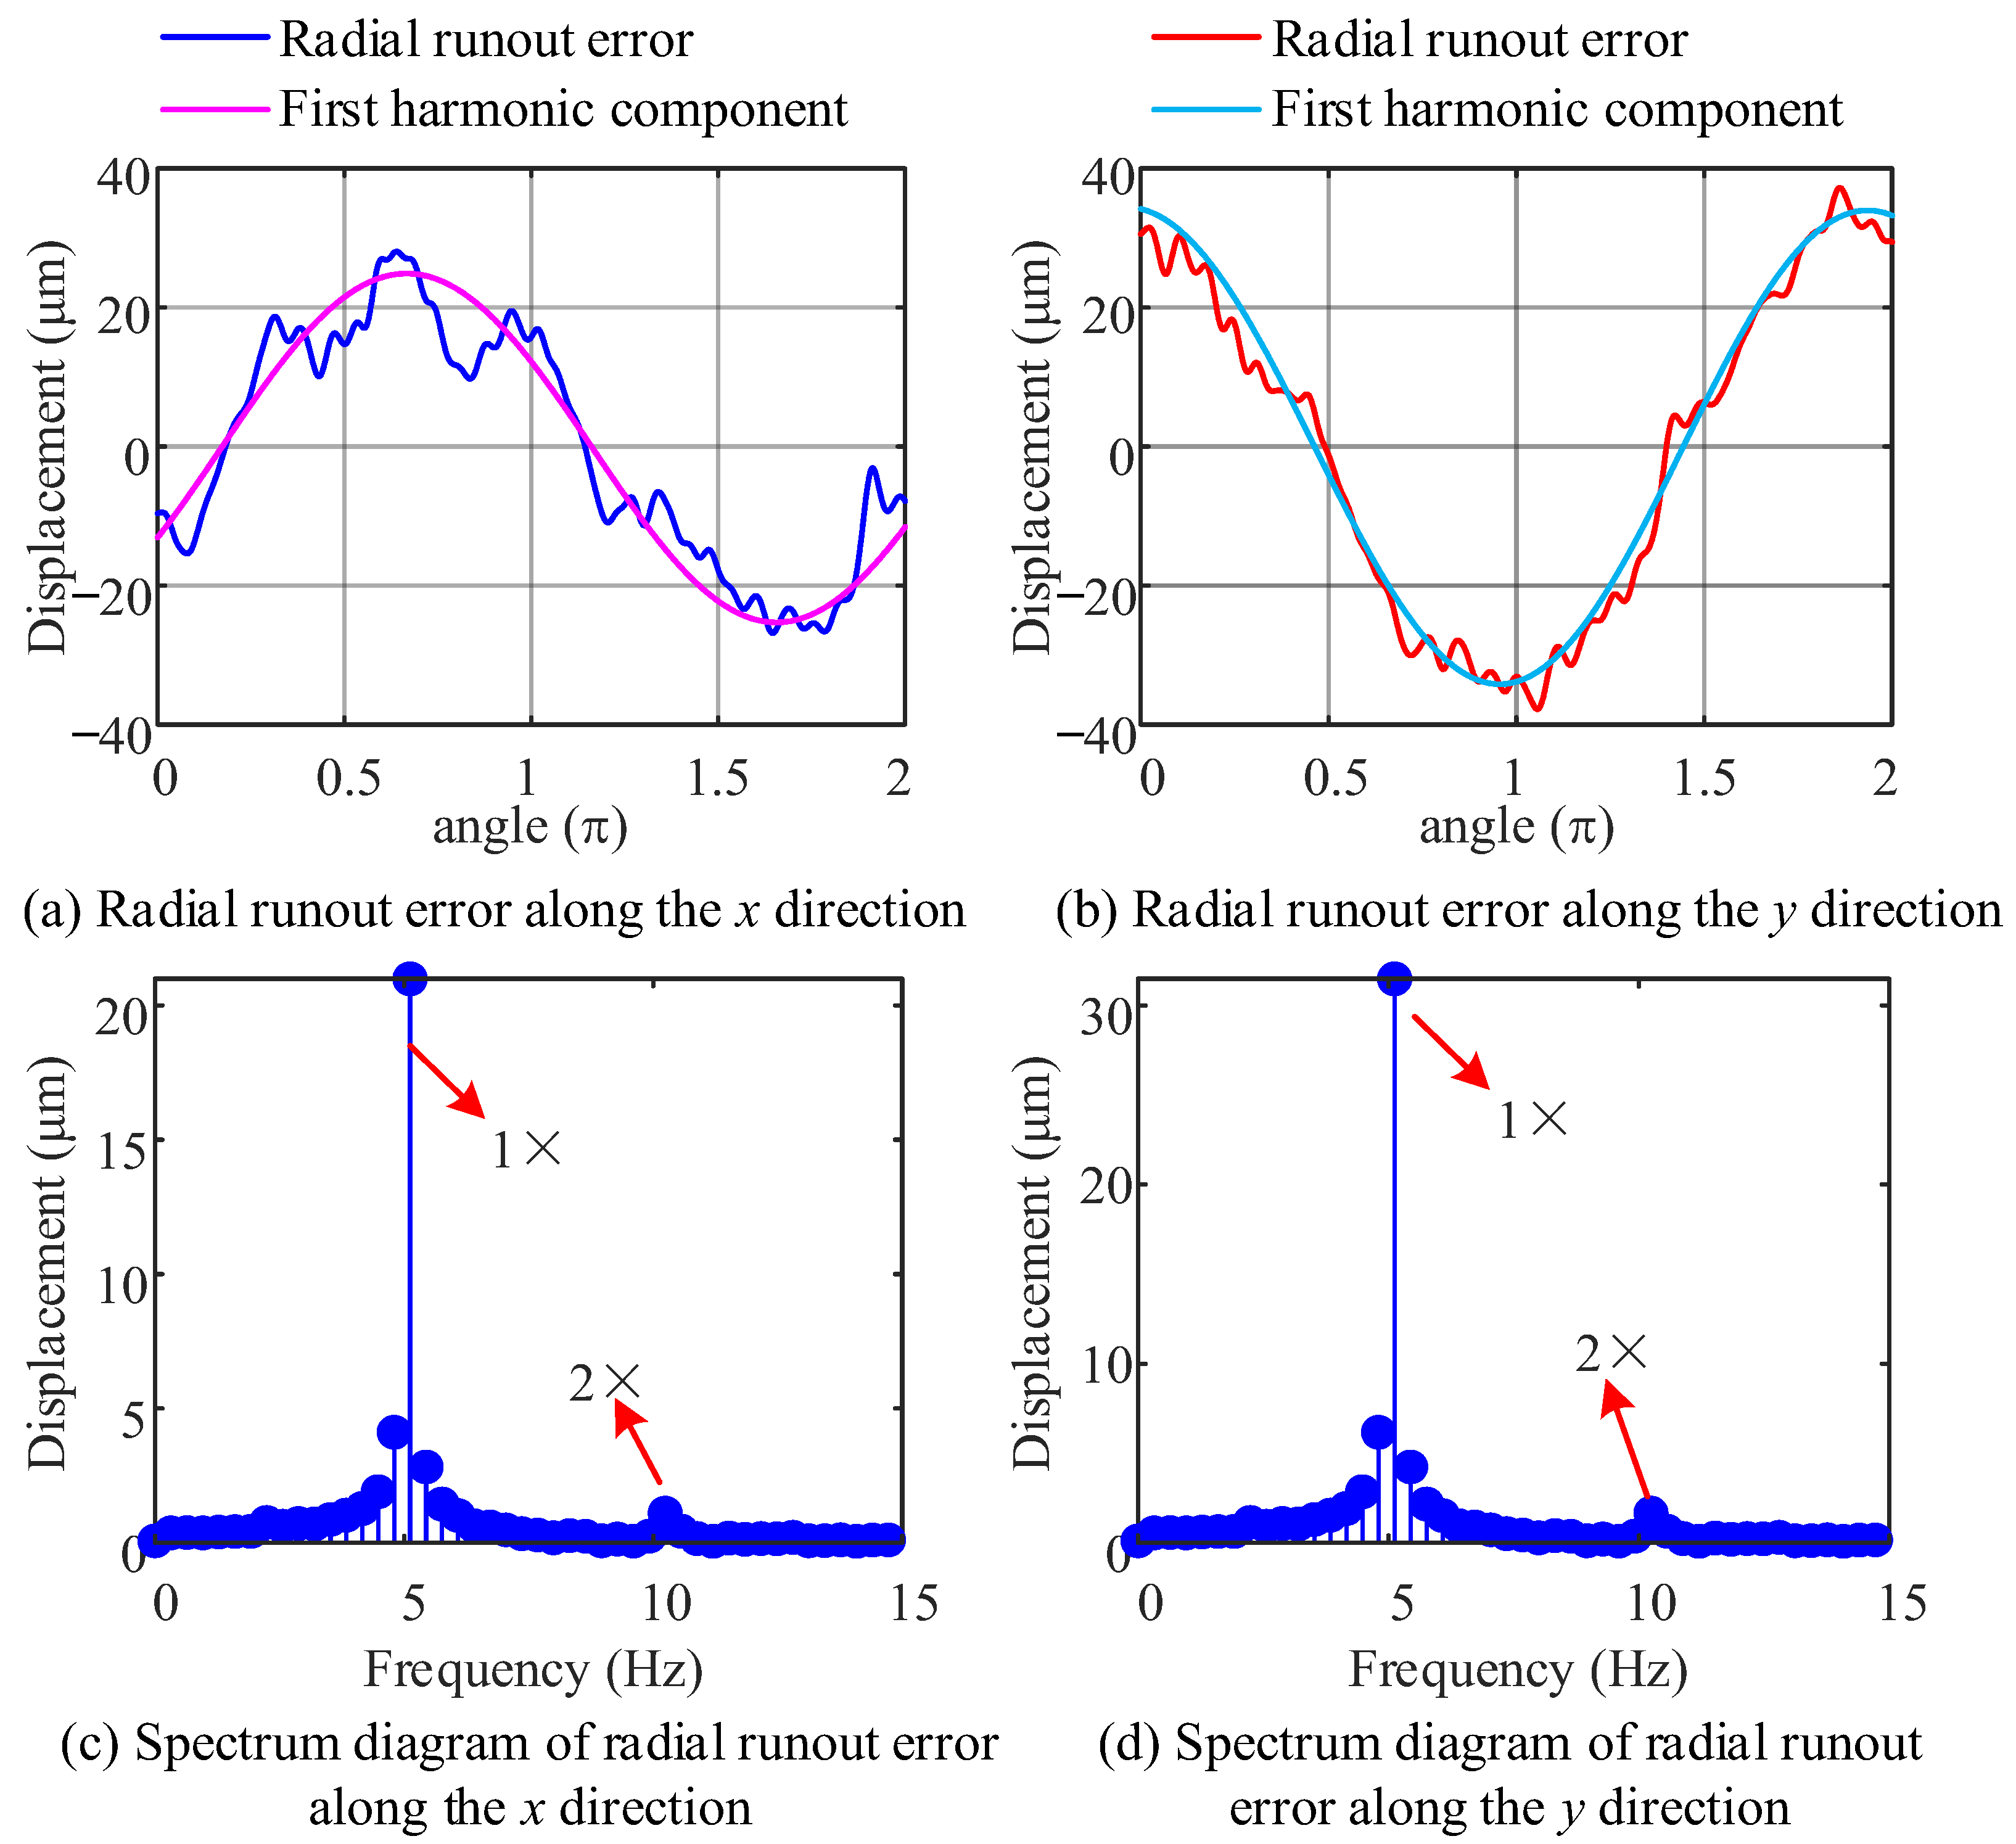
During the experiment, a working speed with fewer interfering frequency components other than the fundamental frequency was deliberately selected to reduce the interference of other frequency components on the separation results, thereby improving the accuracy and reliability of subsequent calculations. The radial runout error obtained from the original data of the displacement sensor is shown in
Figure 9. Among them, the radial runout error along the
x direction and its first harmonic component are shown in
Figure 9a, and their frequency spectrum is shown in
Figure 9c. The first harmonic component includes the first harmonic component of spindle vibration and the installation eccentricity error of the workpiece. The radial runout error along the
y direction and its first harmonic component are shown in
Figure 9b, and their frequency spectrum is shown in
Figure 9d. Based on the spectral analysis results of
Figure 9c,d, it can be observed that the radial runout errors along the
x and
y directions contain rich frequency components, including integer multiples of the operating frequency and other harmonic frequencies.
Next, the first harmonic component of the radial runout error of the spindle and the spindle speed were substituted into the proposed separation method. The parameters of the PSO algorithm are set as follows: population size
M is 500; the max iterations
Imax is 200.
Table 4 shows the calculated results of amplitudes
R1 and phase
λ of the installation eccentricity error separated from the first harmonic component of the radial runout error, as well as the amplitudes
a,
b, and phases
ϕ1,
ϕ2 of the spindle’s radial runout error. Based on the above results, it is necessary to use the separated parameters to construct simulation signals and compare them with experimental measurements to verify the accuracy of the separation results.
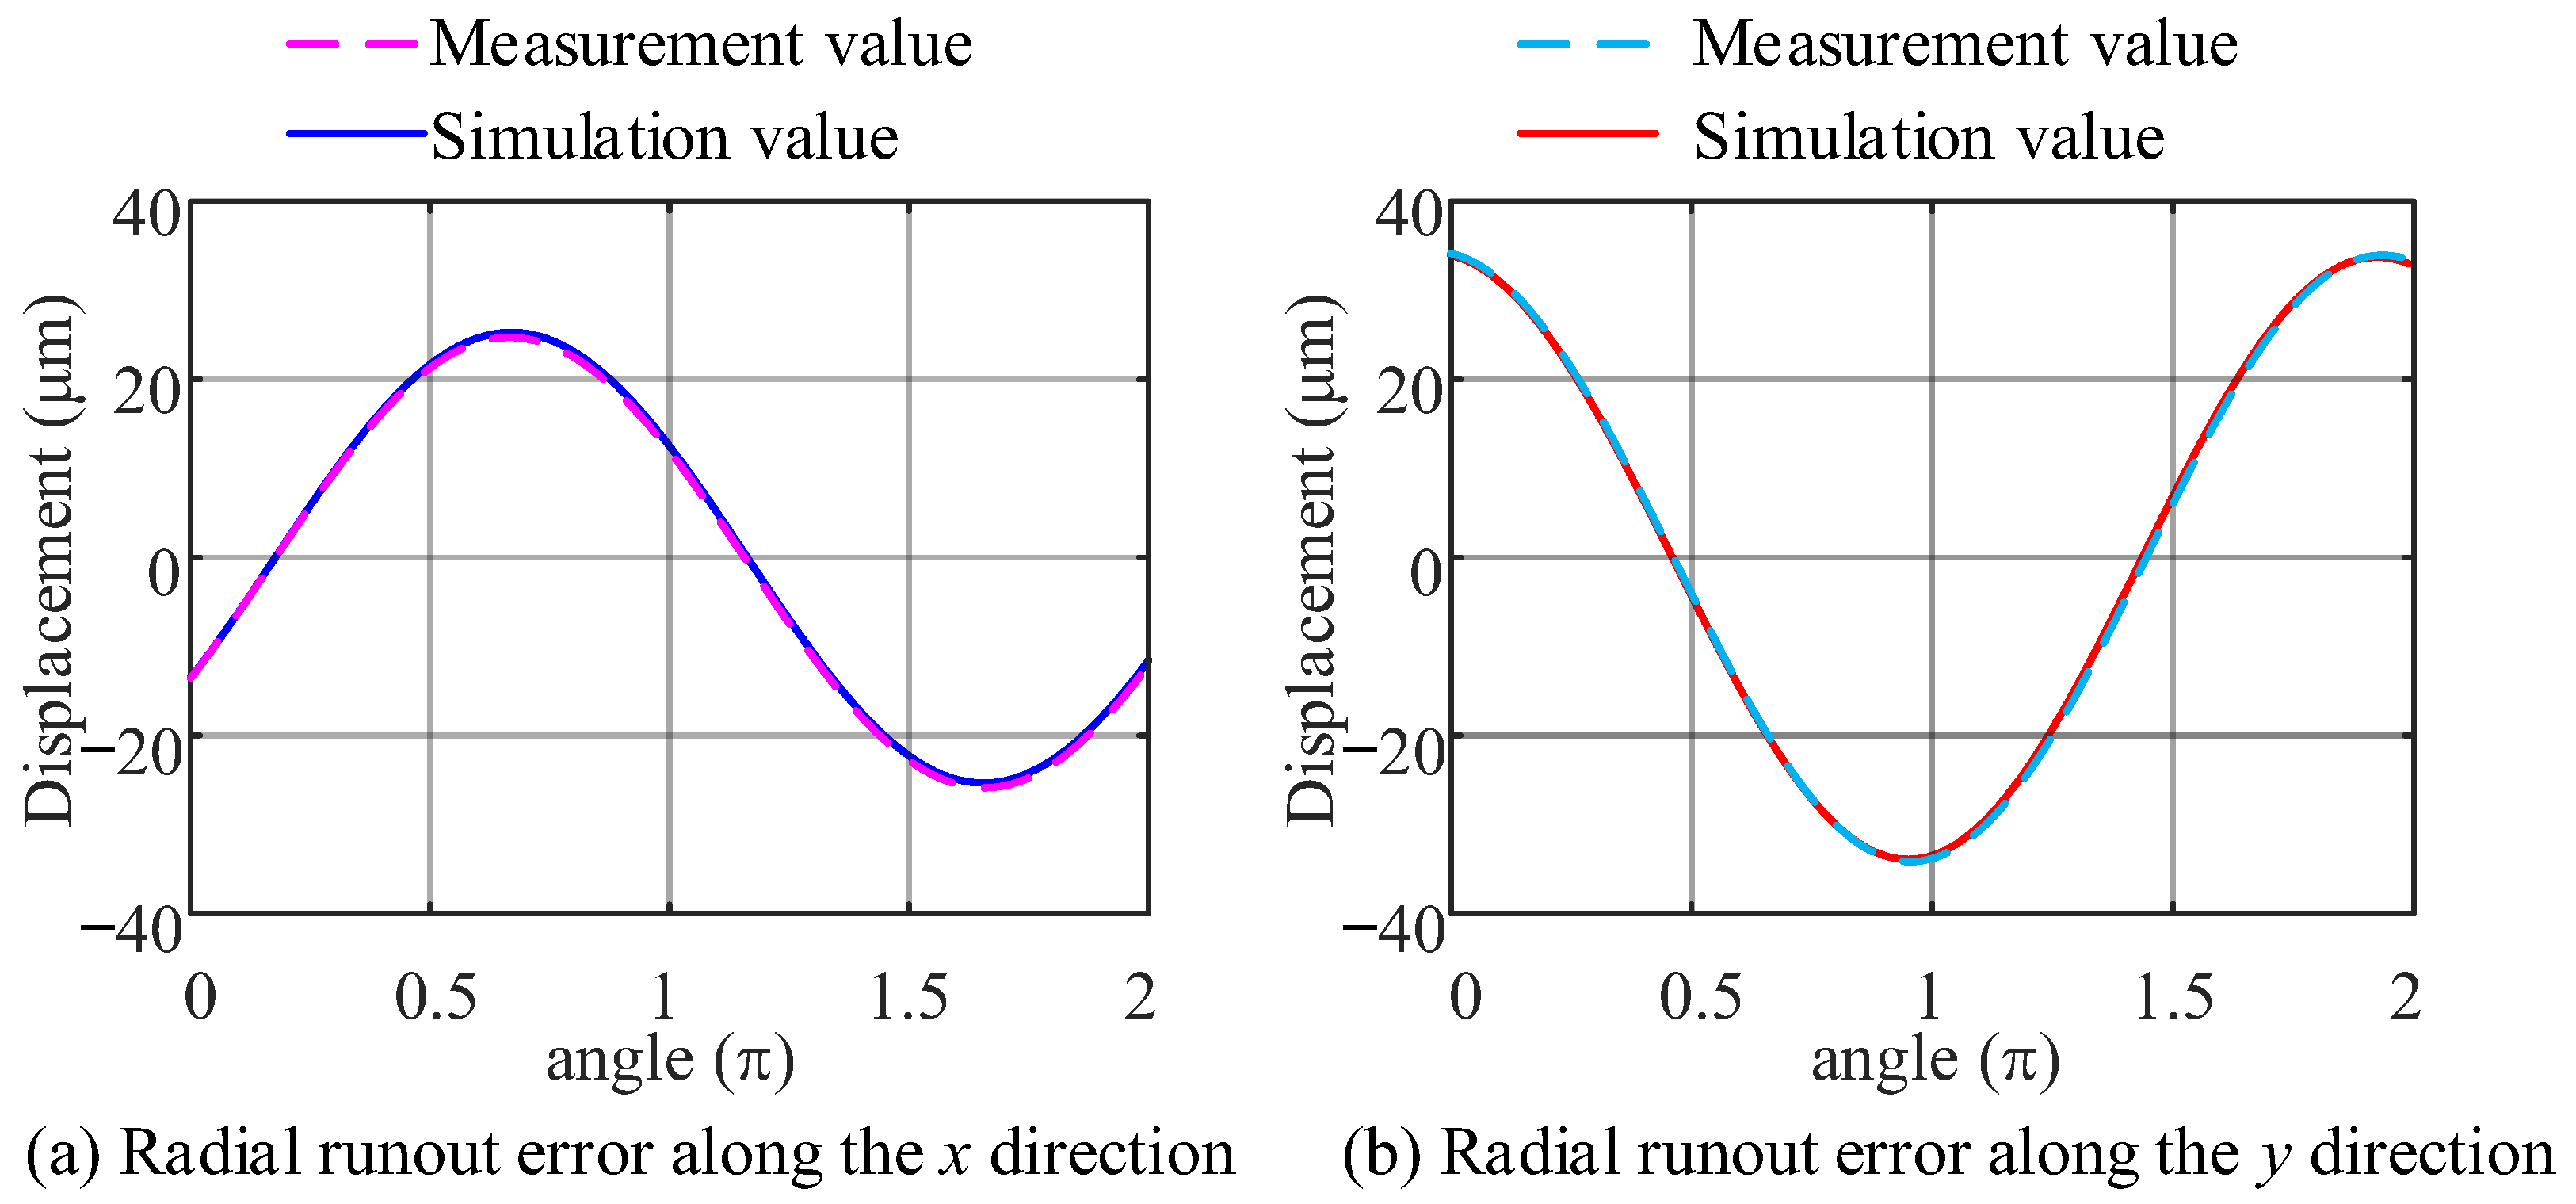
Figure 10 compares the experimentally measured value of the radial runout error of the spindle measured by different sensors and the simulation signal, where the simulation signal is constructed according to the parameters in
Table 4. It can be clearly observed that the simulated values have a high degree of coincidence with the measured values.
Due to the presence of low amplitude interference harmonics in the radial runout error of the spindle, error indicators such as SSE, RMSE, and MAE are inevitably affected by them, which in turn affects the quantitative evaluation of the calculation results. In this work, the coefficient of determination
R2 is applied as the quantitative evaluation index to evaluate the separation results [
33,
34]. In regression analysis,
R2 is commonly used to measure the fit of a model. The model fits the data better as the indicator value approaches 1, and conversely, the model fits the data the worse as the value nears 0. The expression for the coefficient of determination is
where
ξi denotes the experimentally measured values,
denotes the simulated values, and
denotes the mean values of experimentally measured values.
Table 5 shows the values of
R2 between experimentally measured values and the simulation values of spindle radial runout errors. The results showed that the
R2 was close to 1, indicating that curve similarity exceeds 97%, further verifying the high accuracy and reliability of the separation method proposed in this work.
5.2.1. The Influence of Different Spindle Speeds
In this section, the influence of different spindle speeds on the separation results of workpiece installation eccentricity errors is investigated. This experiment collects displacement data of workpiece 1 measured by four displacement sensors at the same position at spindle speeds of 300 r/min, 600 r/min, and 900 r/min.
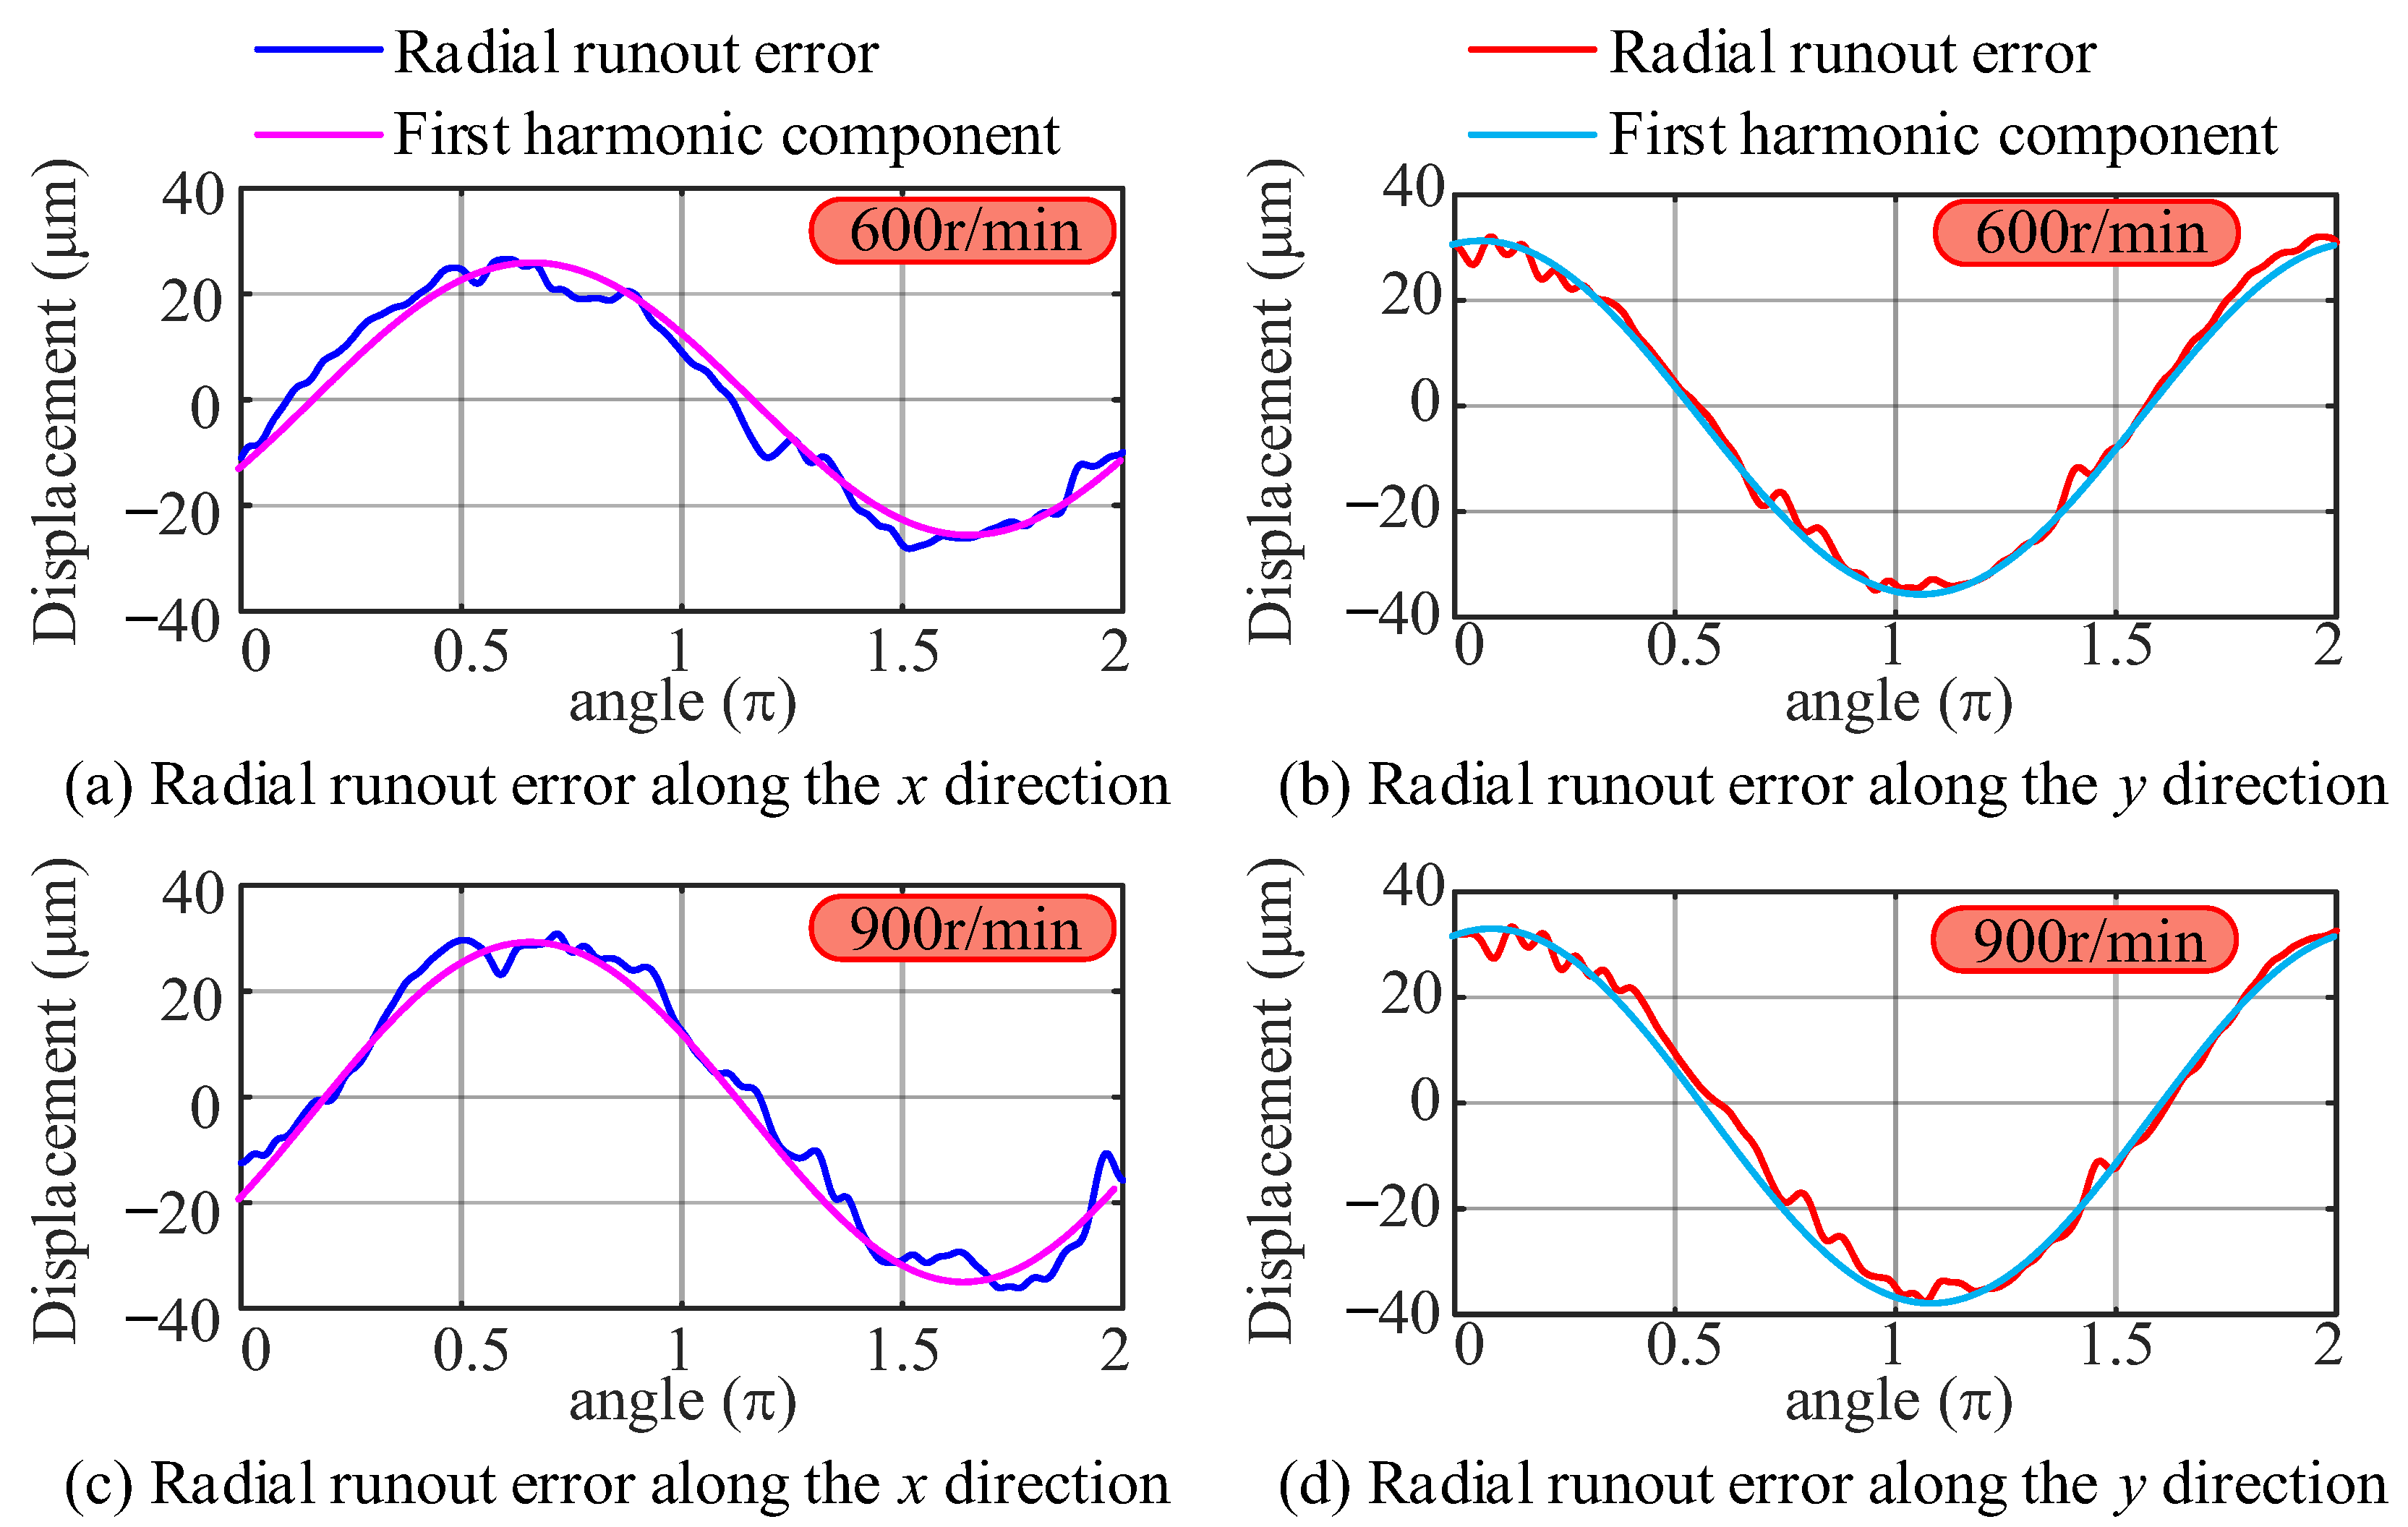
The radial runout error of the spindle before separation at different speeds is shown in
Figure 11. Each figure consists of two parts: experimental measurement values and their first harmonic components. The separation results at a speed of 300 r/min were provided earlier. It is obvious that although there are differences in the local characteristics of radial runout errors, their first harmonic components demonstrate a high degree of similarity by comparing the first harmonic components of radial runout errors in the same direction in
Figure 11.
The first harmonic component of the spindle radial runout error at different speeds was substituted into the proposed separation method, and the separation results at three different speeds were obtained.
Table 6 shows the results of both amplitude
R1 and phase
λ of the installation eccentricity error, and amplitudes
a,
b, and phases
ϕ1,
ϕ2 of the spindle radial runout error at different speeds. As the rotational speed increases, the variation in the installation eccentricity error parameters becomes less than 0.3%, indicating that increased spindle speed minimally impacts the amplitude and phase of workpiece installation eccentricity error.
The parameters in
Table 6 exhibit that the workpiece installation eccentricity calculated at different speeds is consistent, indicating that the workpiece installation eccentricity always exists and does not vary with speed. Subsequently, it is necessary to use the parameters in the table to construct simulation signals and compare them with experimental measurements to verify the accuracy of the separation results.
Figure 12 compares the experimentally measured value of spindle motion error measured by different sensors and the simulation signal.
Figure 12 can be clearly observed that the simulated values show a high degree of coincidence with the measured values.
Table 7 shows the
R2 between experimental measurement values and simulation signals at different speeds. The results show that the
R2 is close to 1, indicating that curve similarity exceeds 97%, further verifying the high accuracy and reliability of the separation method proposed in this work.
5.2.2. The Influence of Different Axial Distances
In this section, the influence of different axial distances on the separation of eccentricity errors in a workpiece installation is studied. This experiment collected displacement data from four displacement sensors when the axial distance between sensor S1 and the chuck end face was 80 mm, 90 mm, and 100 mm, respectively, at a spindle speed of 300 r/min.
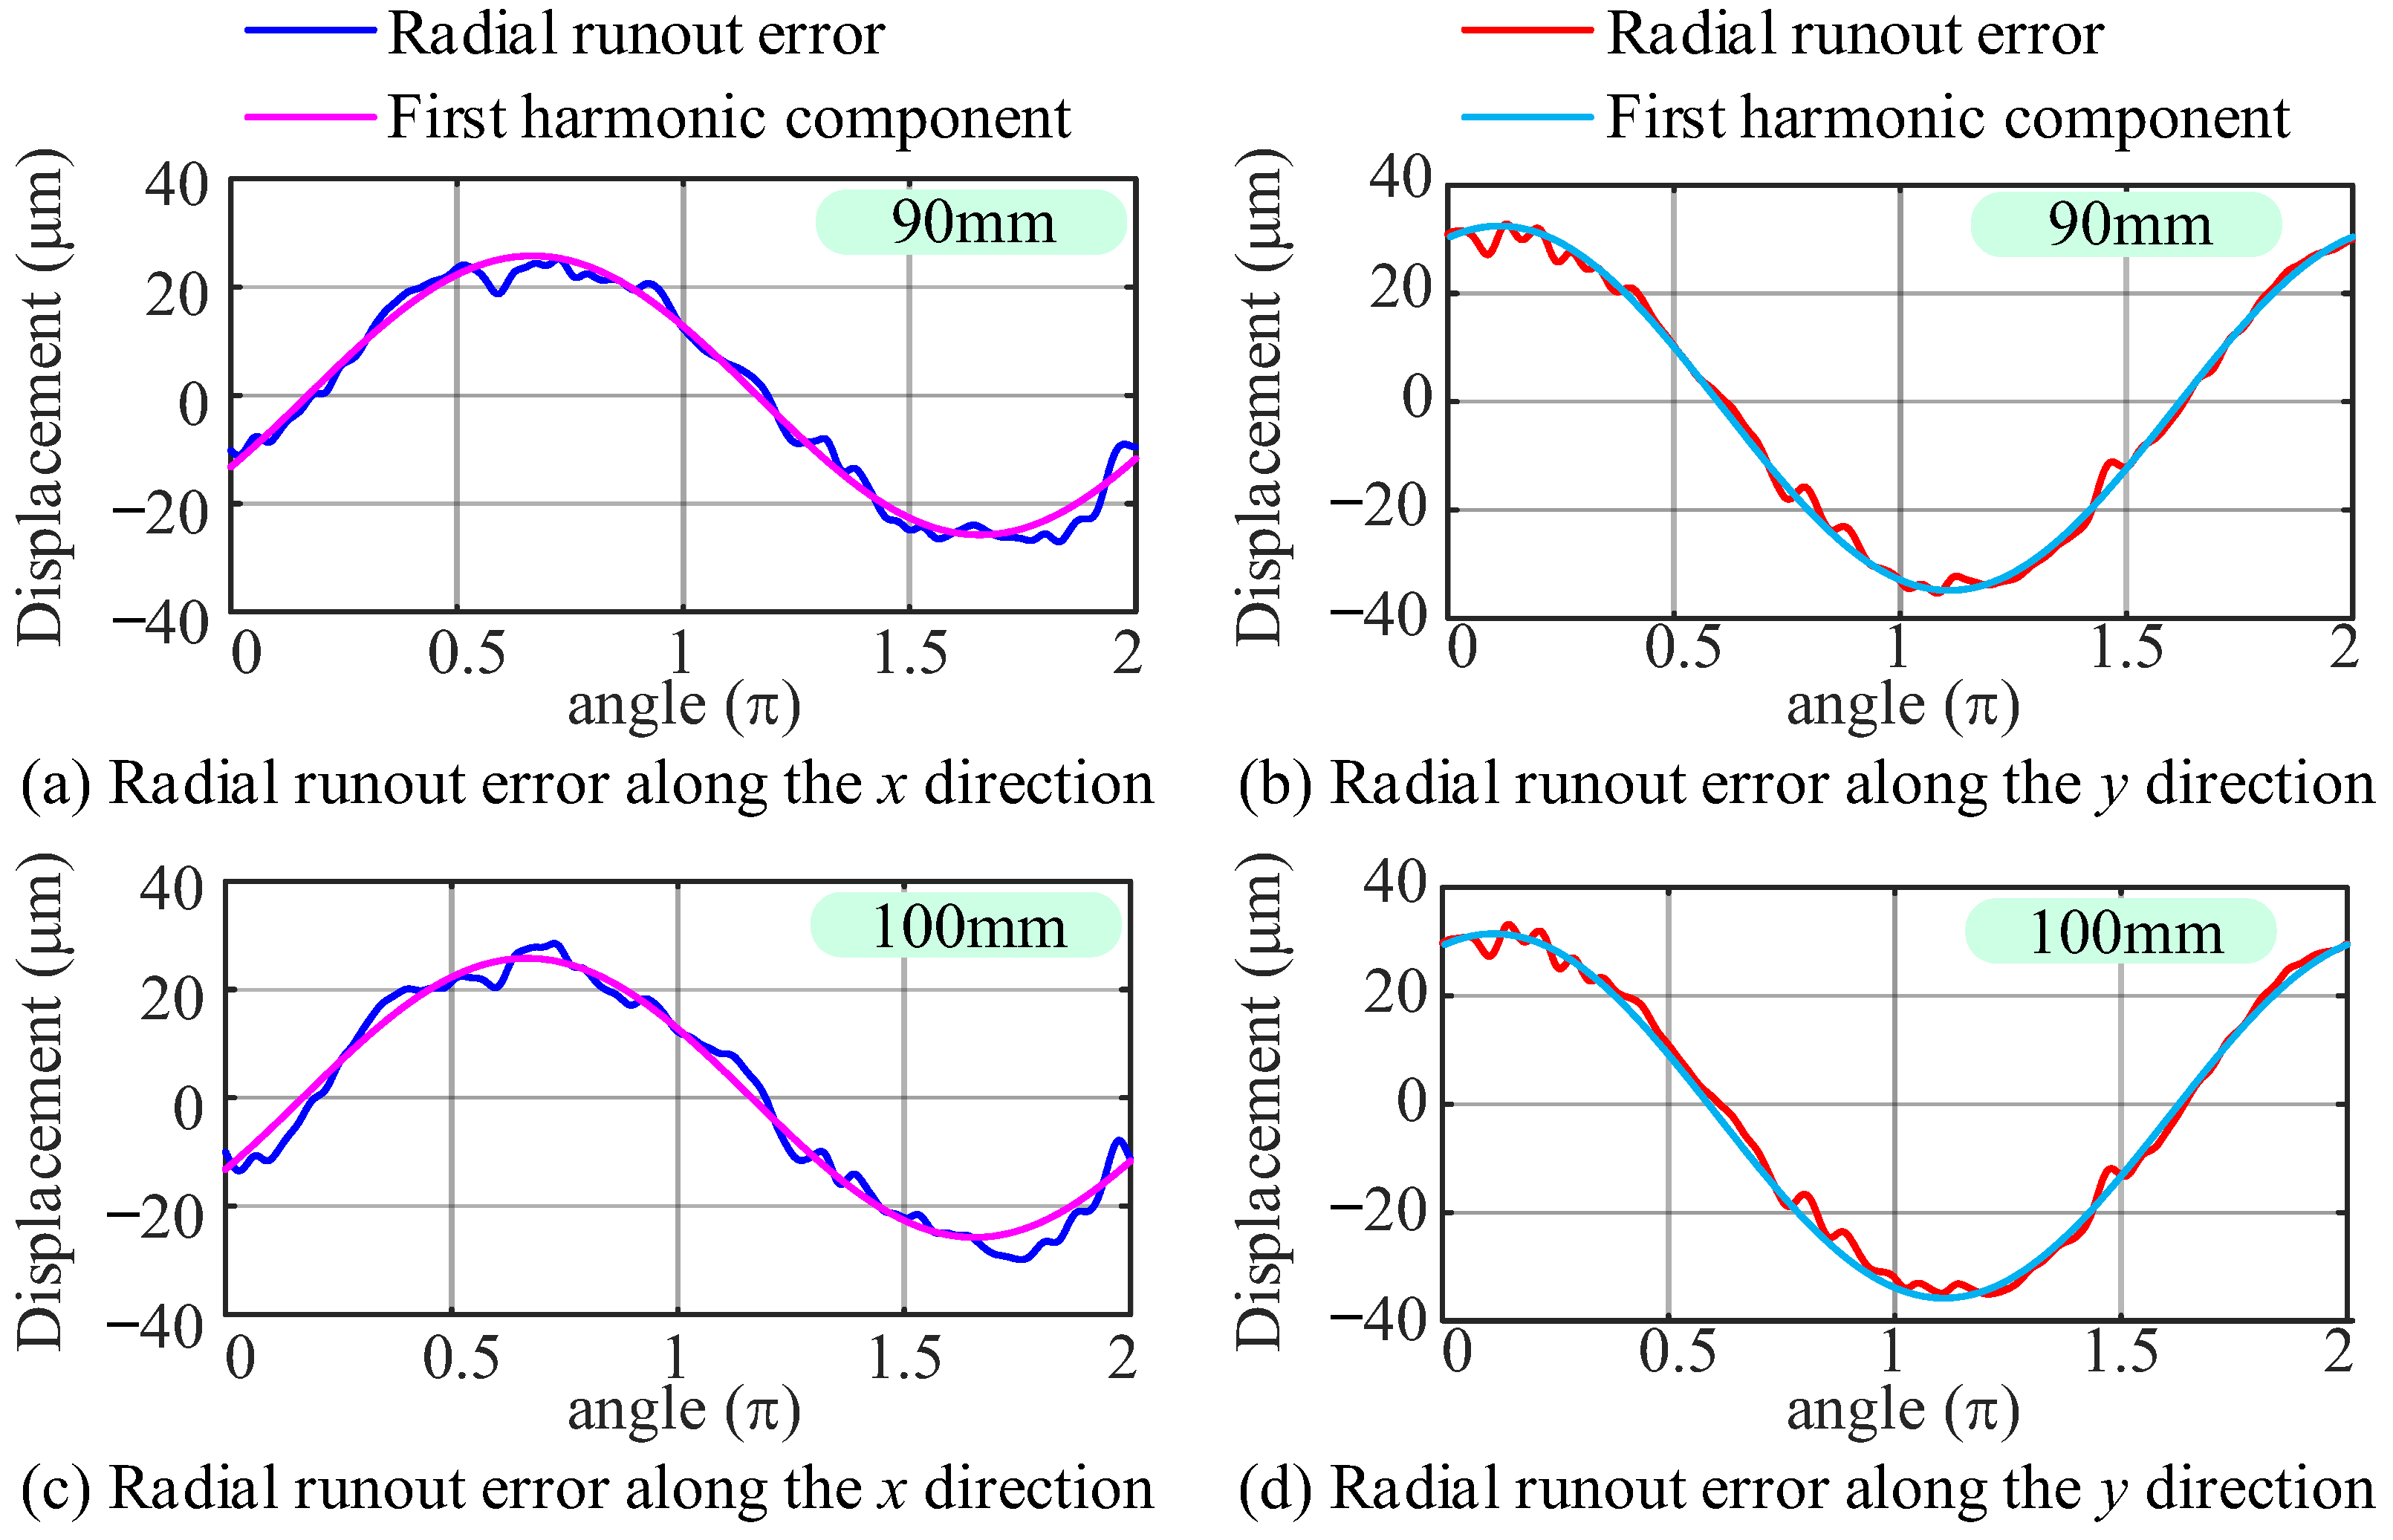
The radial runout error of the spindle before separation at different axial distances is shown in
Figure 13. Each figure consists of two parts: experimental measurement values and their first harmonic components. The separation results at an axial distance of 80 mm were provided earlier. Here are the radial runout errors and their first harmonic components measured at two other positions. The curve in the figure shows that the radial runout error and its first harmonic component at different axial positions are highly similar.
Next, the first harmonic component of the radial runout error of the spindle at different axial distances was substituted into the proposed method for separating eccentricity errors in workpiece installation, and the separation results of eccentricity errors in the workpiece installation at different axial distances were obtained.
Table 8 shows results of both amplitude
R1 and phase
λ of the installation eccentricity error separated from the first harmonic component of the radial runout error, as well as the amplitudes
a,
b and phases
ϕ1,
ϕ2 of the spindle radial runout error. As the axial distance increases, the variation in the installation eccentricity error parameter becomes less than 0.5%, indicating that the increase in tilt angle swing error will not affect the calculation and separation of workpiece installation eccentricity error.
Subsequently, the parameters in the table above were used to construct simulation signals and compared with experimental measurements to verify the accuracy of the separation results.
Figure 14 compares experimental measurements and simulated signals of the first harmonic component of the spindle motion error measured at different axial distances. The curve in the figure clearly shows that the simulated values exhibit a high degree of coincidence with the measured values.
Table 9 shows the
R2 between measured values and simulated signals at different axial distances, which are close to 1, indicating that the separation method proposed in this work demonstrates high accuracy and reliability.
5.2.3. The Influence of Different Workpieces
In this section, the influence of different workpieces on workpiece installation eccentricity separation results at the same spindle speed is studied. This experiment collected displacement data obtained by measuring three different workpieces at fixed positions using four displacement sensors at a spindle speed of 300 r/min with an axial distance of 80 mm and calculated the installation eccentricity error.
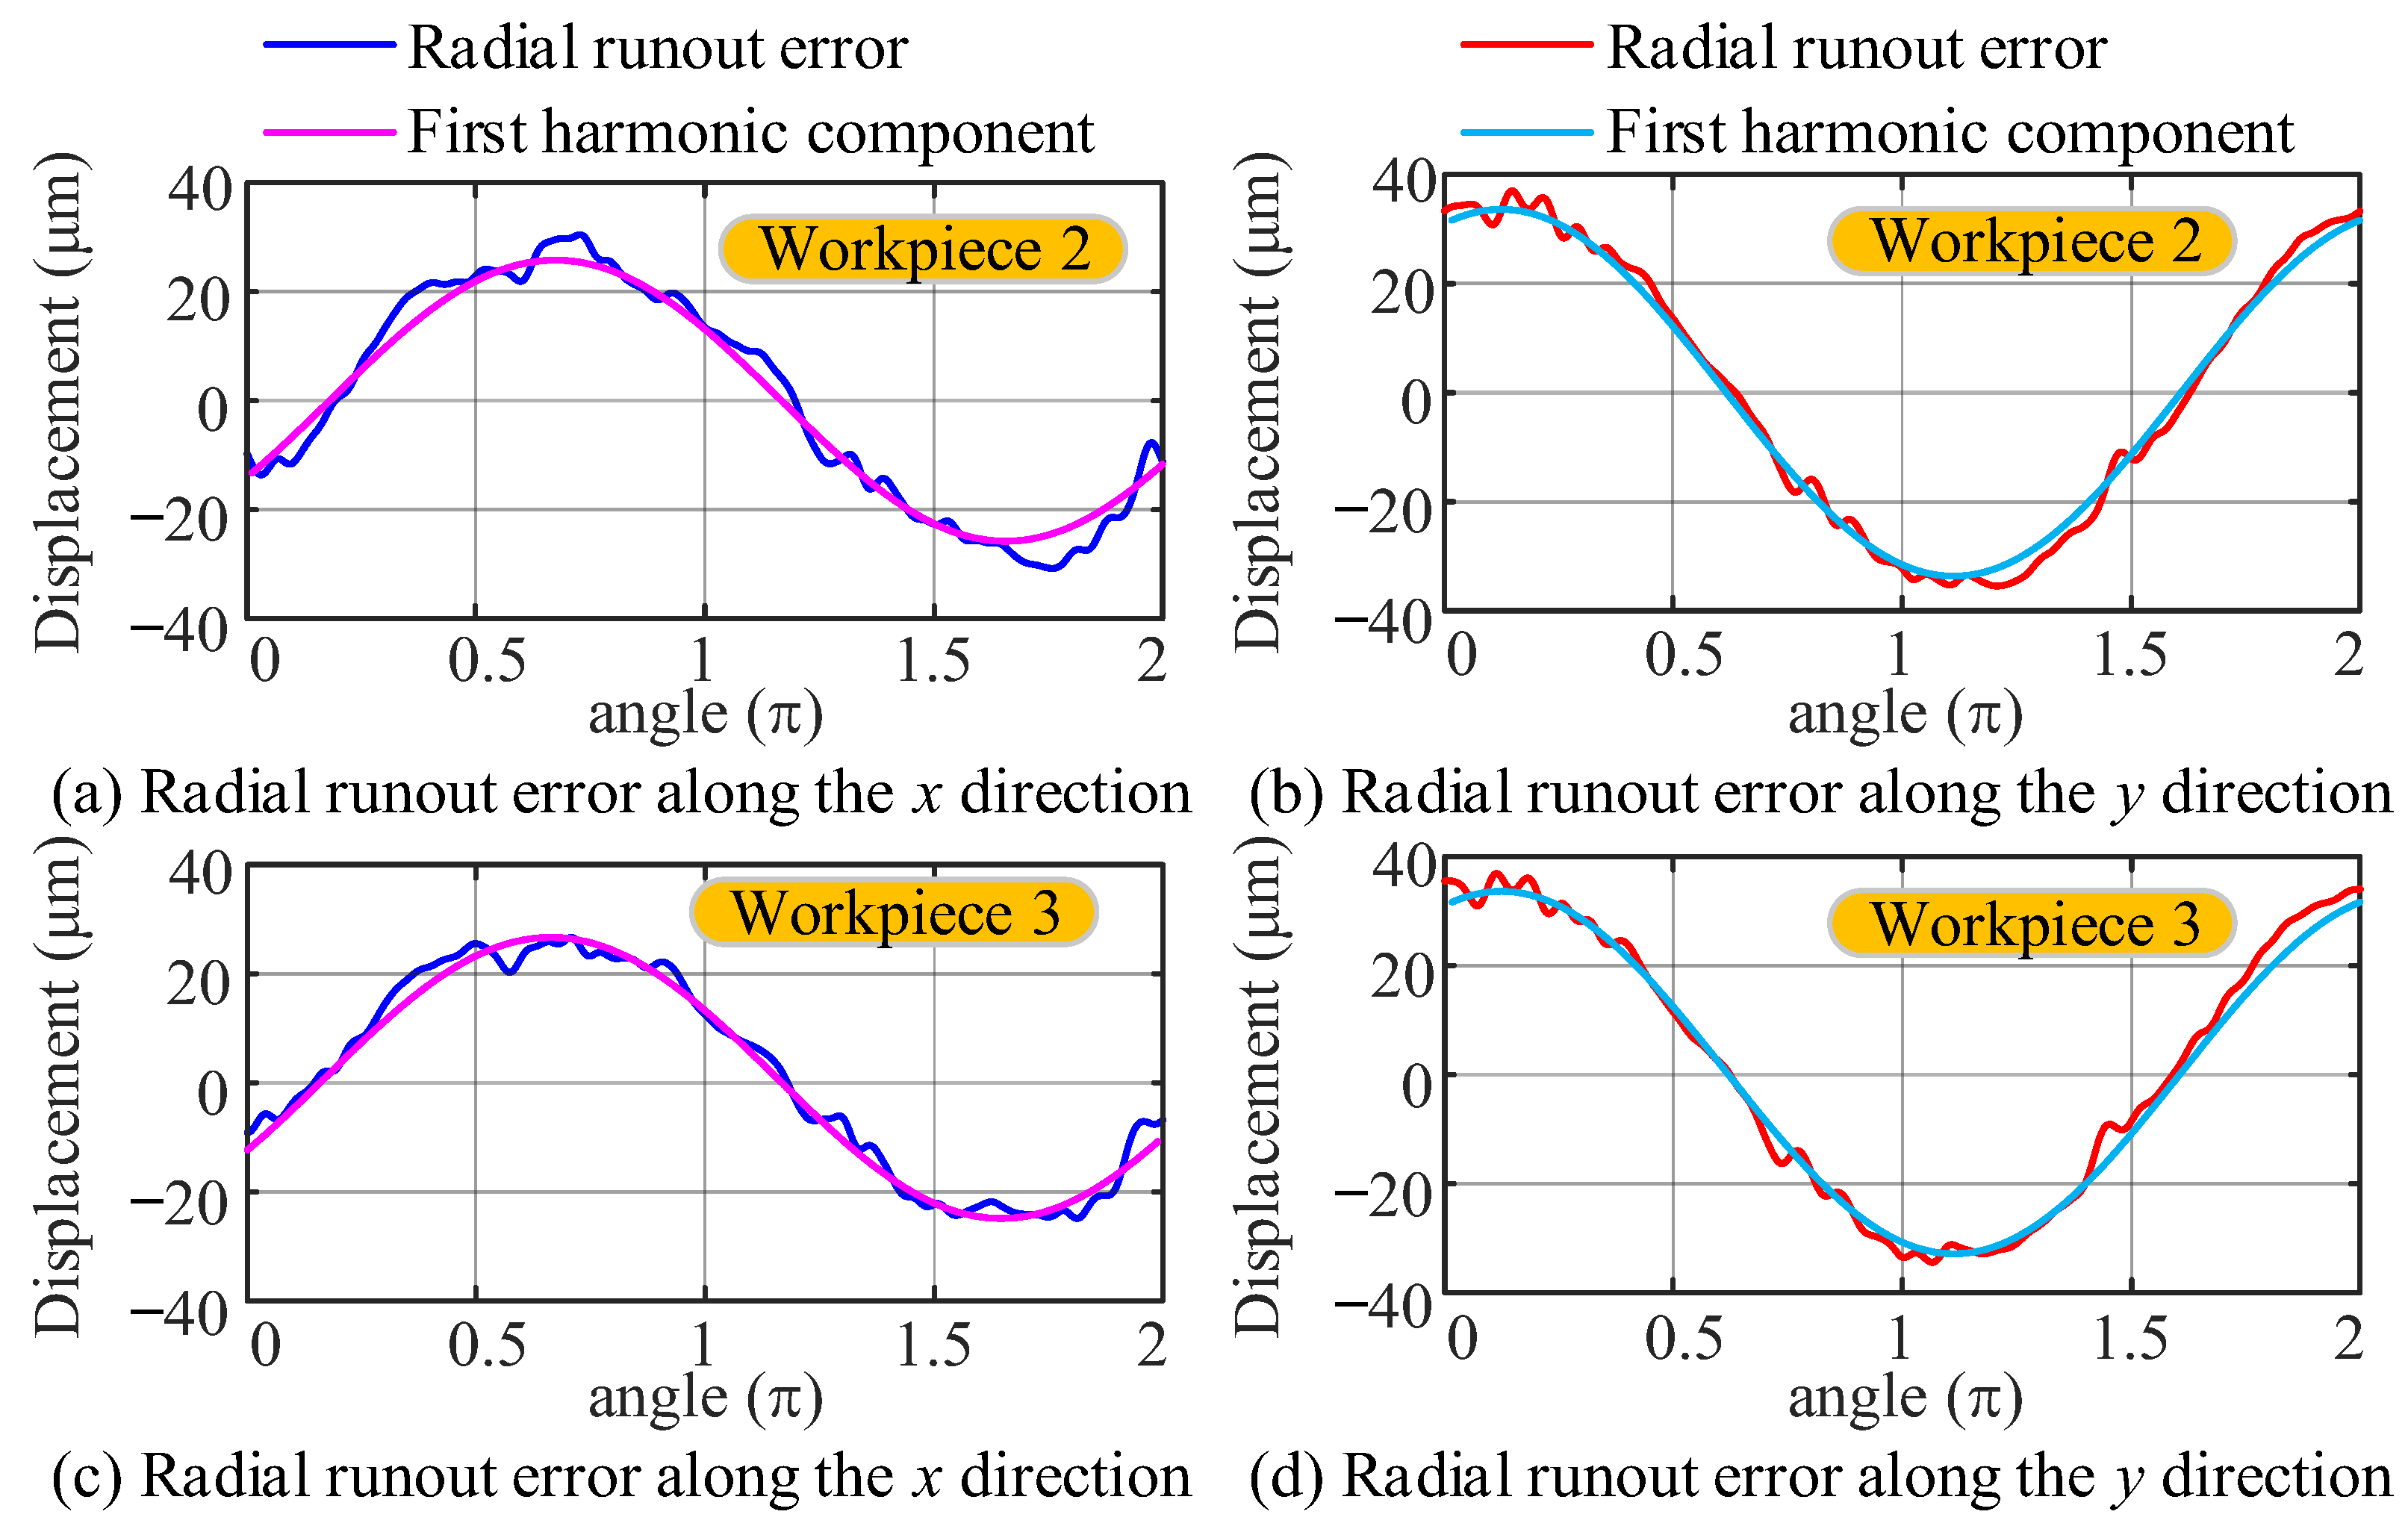
The radial runout error of the spindle before the separation of different workpieces is shown in
Figure 15. Each figure consists of two parts: experimental measurement values and their first harmonic components. The separation result of workpiece 1 is given in the previous section. The first harmonic component of the spindle radial runout error measured during the installation of different workpieces was substituted into the proposed separation method, and the separation results of workpiece installation eccentricity error at three different axial distances were obtained.
Table 10 shows the results of both amplitude
R1 and phase
λ of the installation eccentricity error separated from the first harmonic component of the radial runout error at different axial distances, and the amplitudes
a,
b and phases
ϕ1,
ϕ2 of the spindle radial runout error. The calculation error of installation eccentricity error for different workpieces is less than 0.6%, indicating that the surface morphology of different workpieces will not affect the calculation and separation of installation eccentricity error. Meanwhile, this also indicates that the installation eccentricity error is not introduced during the workpiece clamping process but stems from the misalignment between the chuck rotation center and the spindle geometric center.
Subsequently, the separated parameters were used to construct simulation signals, which were compared and analyzed with experimental measurements to verify the accuracy of the separation results.
Figure 16 compares experimental measurements and simulated signals at different axial distances. It can be clearly observed that the simulated values have a high degree of coincidence with the measured values.
Table 11 shows the
R2 between the experimental measurement values and simulated signals at different axial distances. The results showed that the
R2 was close to 1, indicating that curve similarity exceeds 97%, further displaying the high accuracy and reliability of the installation eccentricity error separation method proposed in this investigation.
The results in
Table 11 further confirm that the method maintains high consistency (
R2 > 0.97) across different workpiece geometries, with the calculation errors of installation eccentricity error varying by less than 0.6%. This insensitivity to the shape of the workpiece, coupled with the negligible influence of spindle speed (variation < 0.3%,
Table 6) and axial distance (variation <0.5%,
Table 8), collectively demonstrates the method’s generalizability. Unlike traditional approaches that rely on specific machine parameters or workpiece types, the proposed method achieves robust separation performance by combining PSO with the least squares method. This enables its application in diverse CNC machining scenarios and eccentricity detection of rotating machinery. Thus, the proposed method exhibits a certain degree of generalizability.
6. Conclusions
In this work, a mathematical model of spindle first order harmonics and workpiece installation eccentricity error motion was established. A separation method combining PSO and the least squares method was proposed. It can separate the first order harmonic of spindle radial runout error from workpiece installation eccentricity error, which is crucial for improving machine tool accuracy. Then, numerical simulations validated the method’s accuracy and effectiveness. The effects of different speeds, axial distances, and workpieces were analyzed and discussed in detection experiments. The similarity between the simulated signal generated using identification parameters and the first harmonic of the measured signal exceeded 97%. The conclusions are as follows:
Workpiece installation eccentricity error remains consistent at different spindle speeds. As the speed increases, the spindle radial motion error amplitude rises, but the variation of amplitude and phase of the separated workpiece installation eccentricity error varies less than 0.3%. This indicates that the error does not vary with spindle speed, and increased spindle vibration response does not affect its calculation and separation.
The workpiece installation eccentricity error separated at different axial distances is completely the same. When the detection section of the workpiece gradually moves away from the chuck end face, the variation in the separation result of the workpiece installation eccentricity error is less than 0.5%. This indicates that the increase in tilt swing error will not affect the calculation and separation of workpiece installation eccentricity error, further verifying the effectiveness of the proposed installation eccentricity error separation method.
The variation in workpiece installation eccentricity error calculated when installing different workpieces is within 0.6%. This indicates that the installation eccentricity error introduced when clamping different workpieces is very small. The surface morphology of different workpieces will not affect the calculation and separation of installation eccentricity errors. The installation eccentricity error stems from the misalignment between the chuck rotation center and the spindle geometric center.
The proposed method demonstrates robust generalizability across diverse machining conditions, with calculation errors of installation eccentricity error remaining below 0.6% under varying spindle speeds, axial distances, and workpiece geometries. This enables its application in diverse CNC machining scenarios and eccentricity detection of rotating machinery and provides a reliable and easily adoptable solution for precision manufacturing applications.
In summary, this investigation proposes a separation method for workpiece installation eccentricity error that combines PSO algorithm and least squares method. The advantages of this method are that it only requires displacement sensors, resulting in low cost, and that it eliminates the need for complex spectral processing, thereby ensuring high computational efficiency. At varying speeds, the fluctuation in error calculations of this method remains below 0.3%, significantly enhancing its engineering applicability. This study is significant for improving product quality, reducing waste, and enhancing productivity in the production environment.


