
Incorporating Street-View Imagery into Multi-Scale Spatial Analysis of Ride-Hailing Demand Based on Multi-Source Data


Abstract
1. Introduction
2. Literature Review
2.1. Ride-Hailing Services and Data Sources
2.2. Built Environment and Travel Behavior
2.3. Spatial Analysis Methods
2.4. Research Gaps
3. Data and Methodology
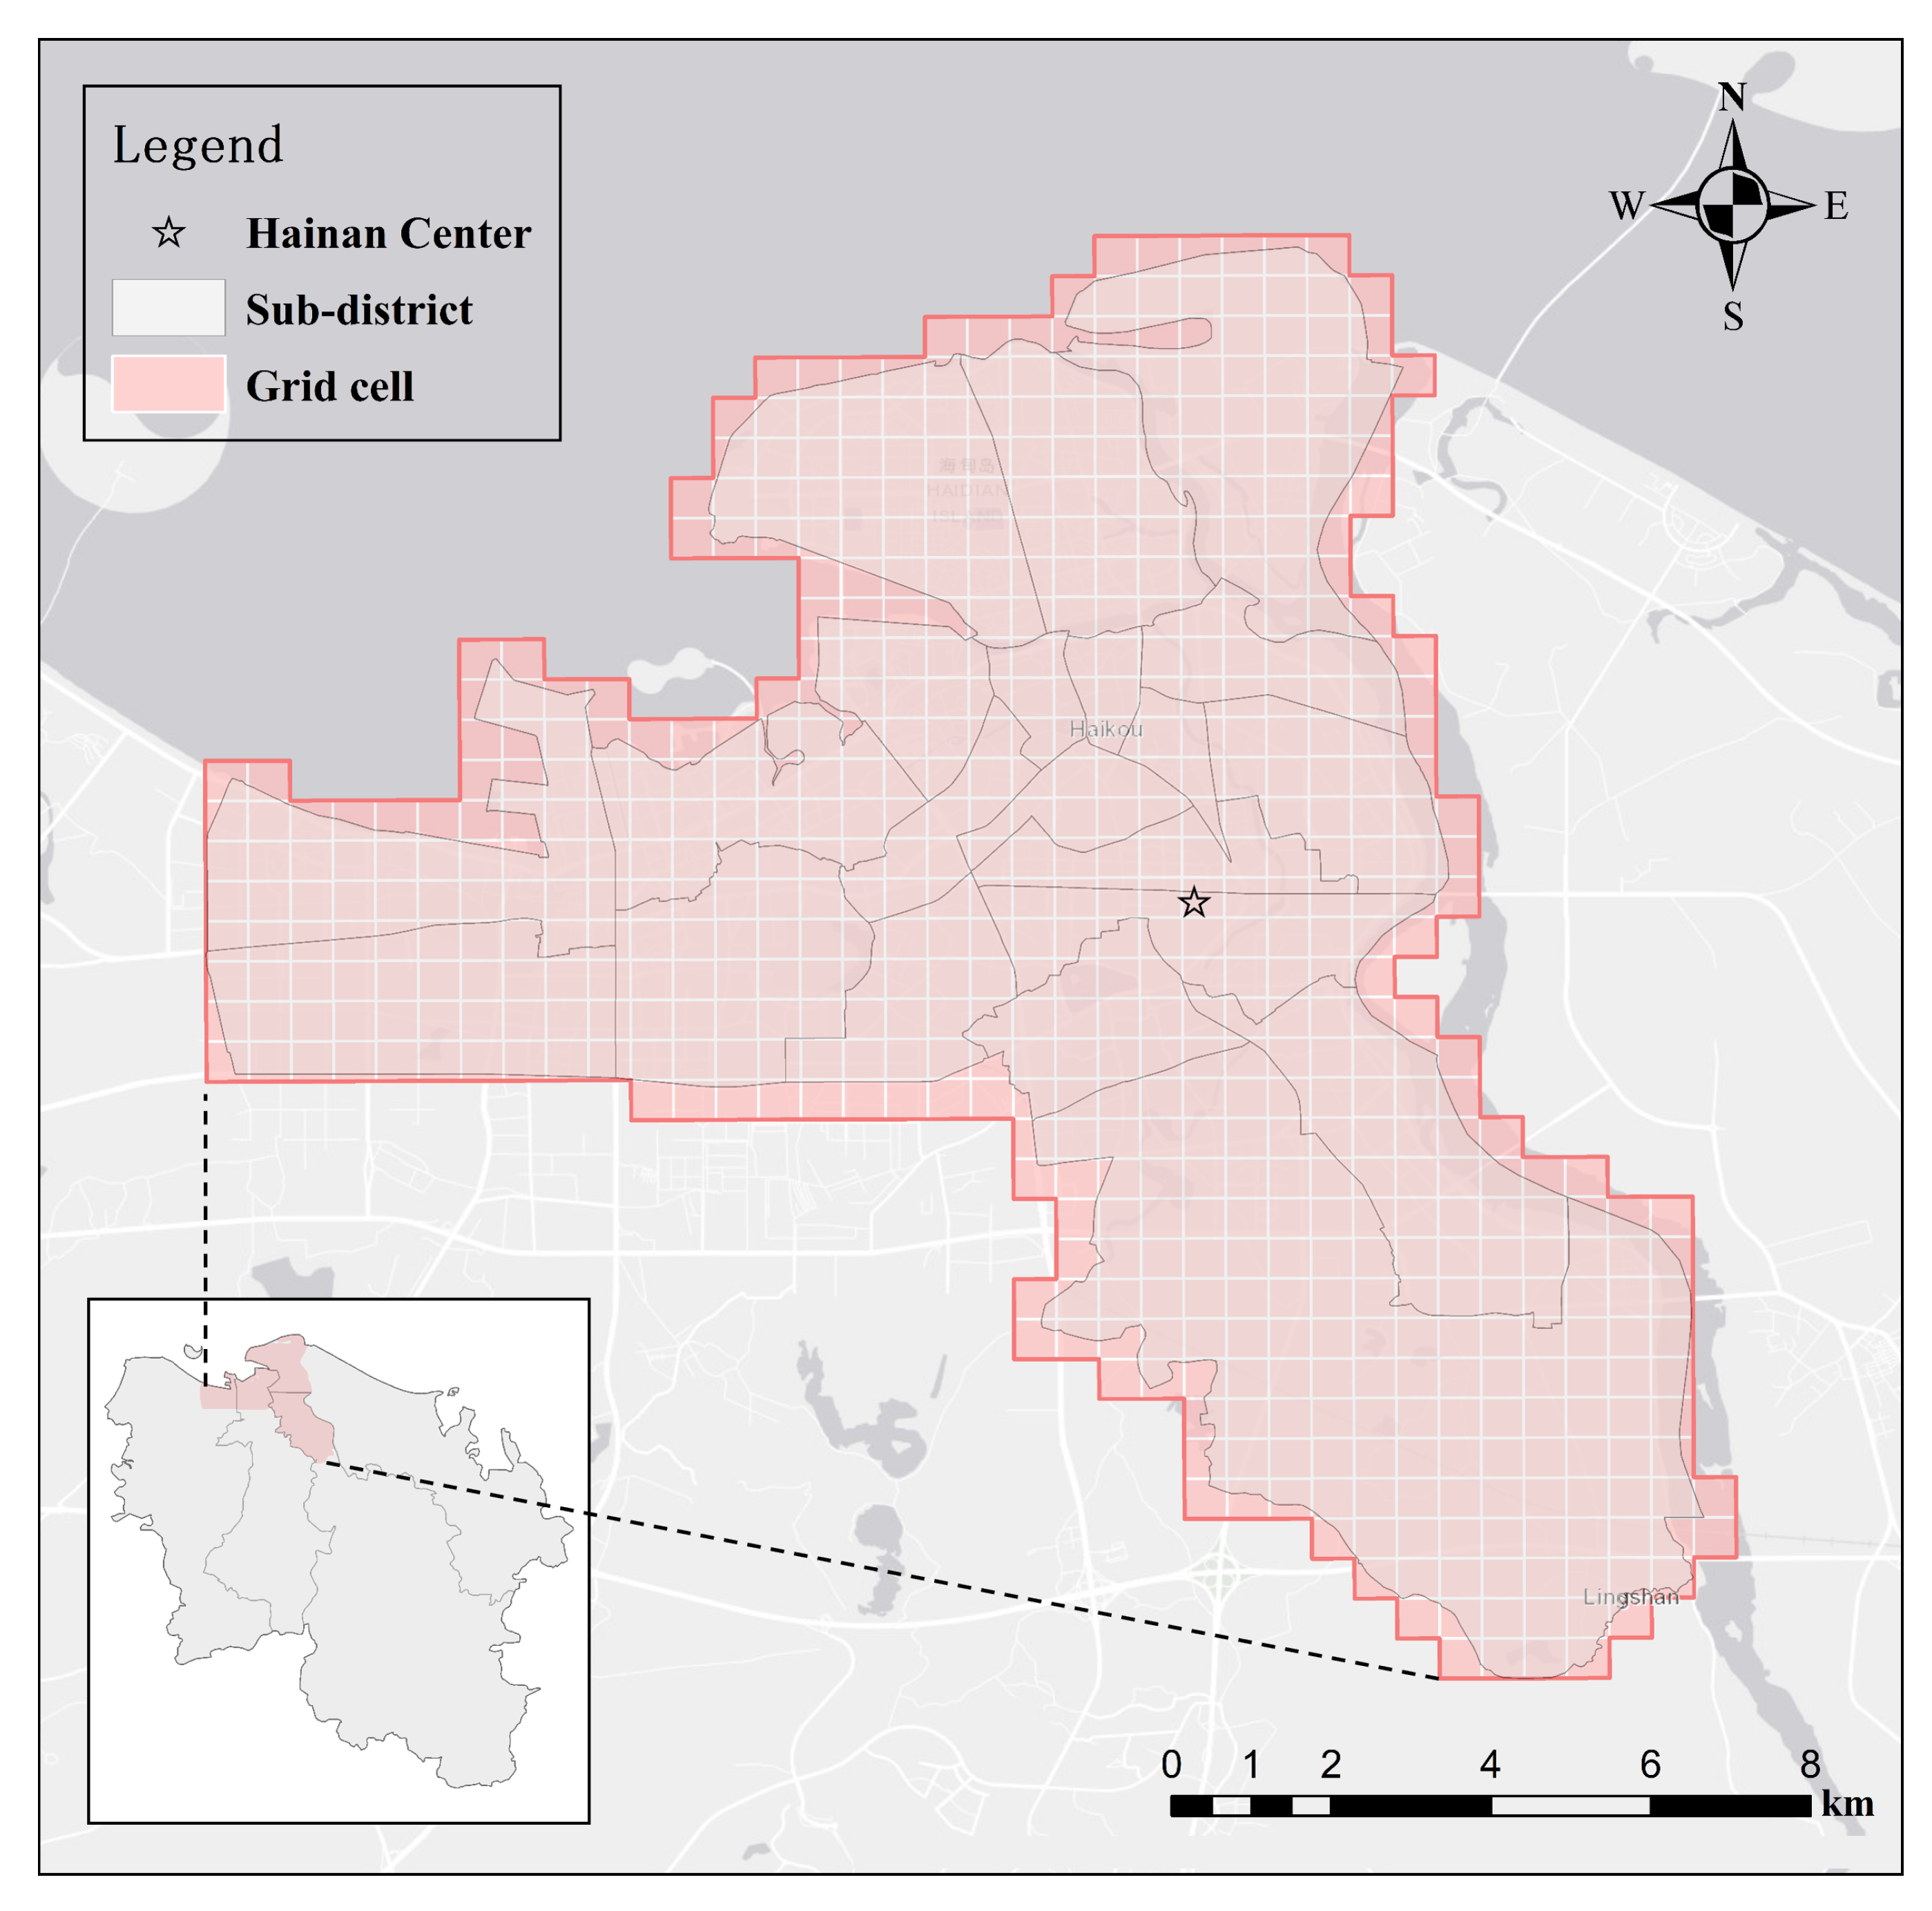
3.1. Study Area, Time Span, and Dependent Variables
3.2. Explanatory Variables
3.2.1. Socioeconomic and Transportation Accessibility Variables
3.2.2. Land-Use Variables
3.2.3. Streetscape Feature Variables
3.2.4. Variable Description and Classification
3.3. Methodology
3.3.1. Variable Selection
Linear Correlation
Spatial Autocorrelation
3.3.2. Global Models
Ordinary Least Squares
Spatial Error Model
Spatial Lag Model
3.3.3. Local Models
GWR Model
MGWR Model
| Algorithm 1: Back-Fitting Procedure for MGWR Bandwidth Optimization |
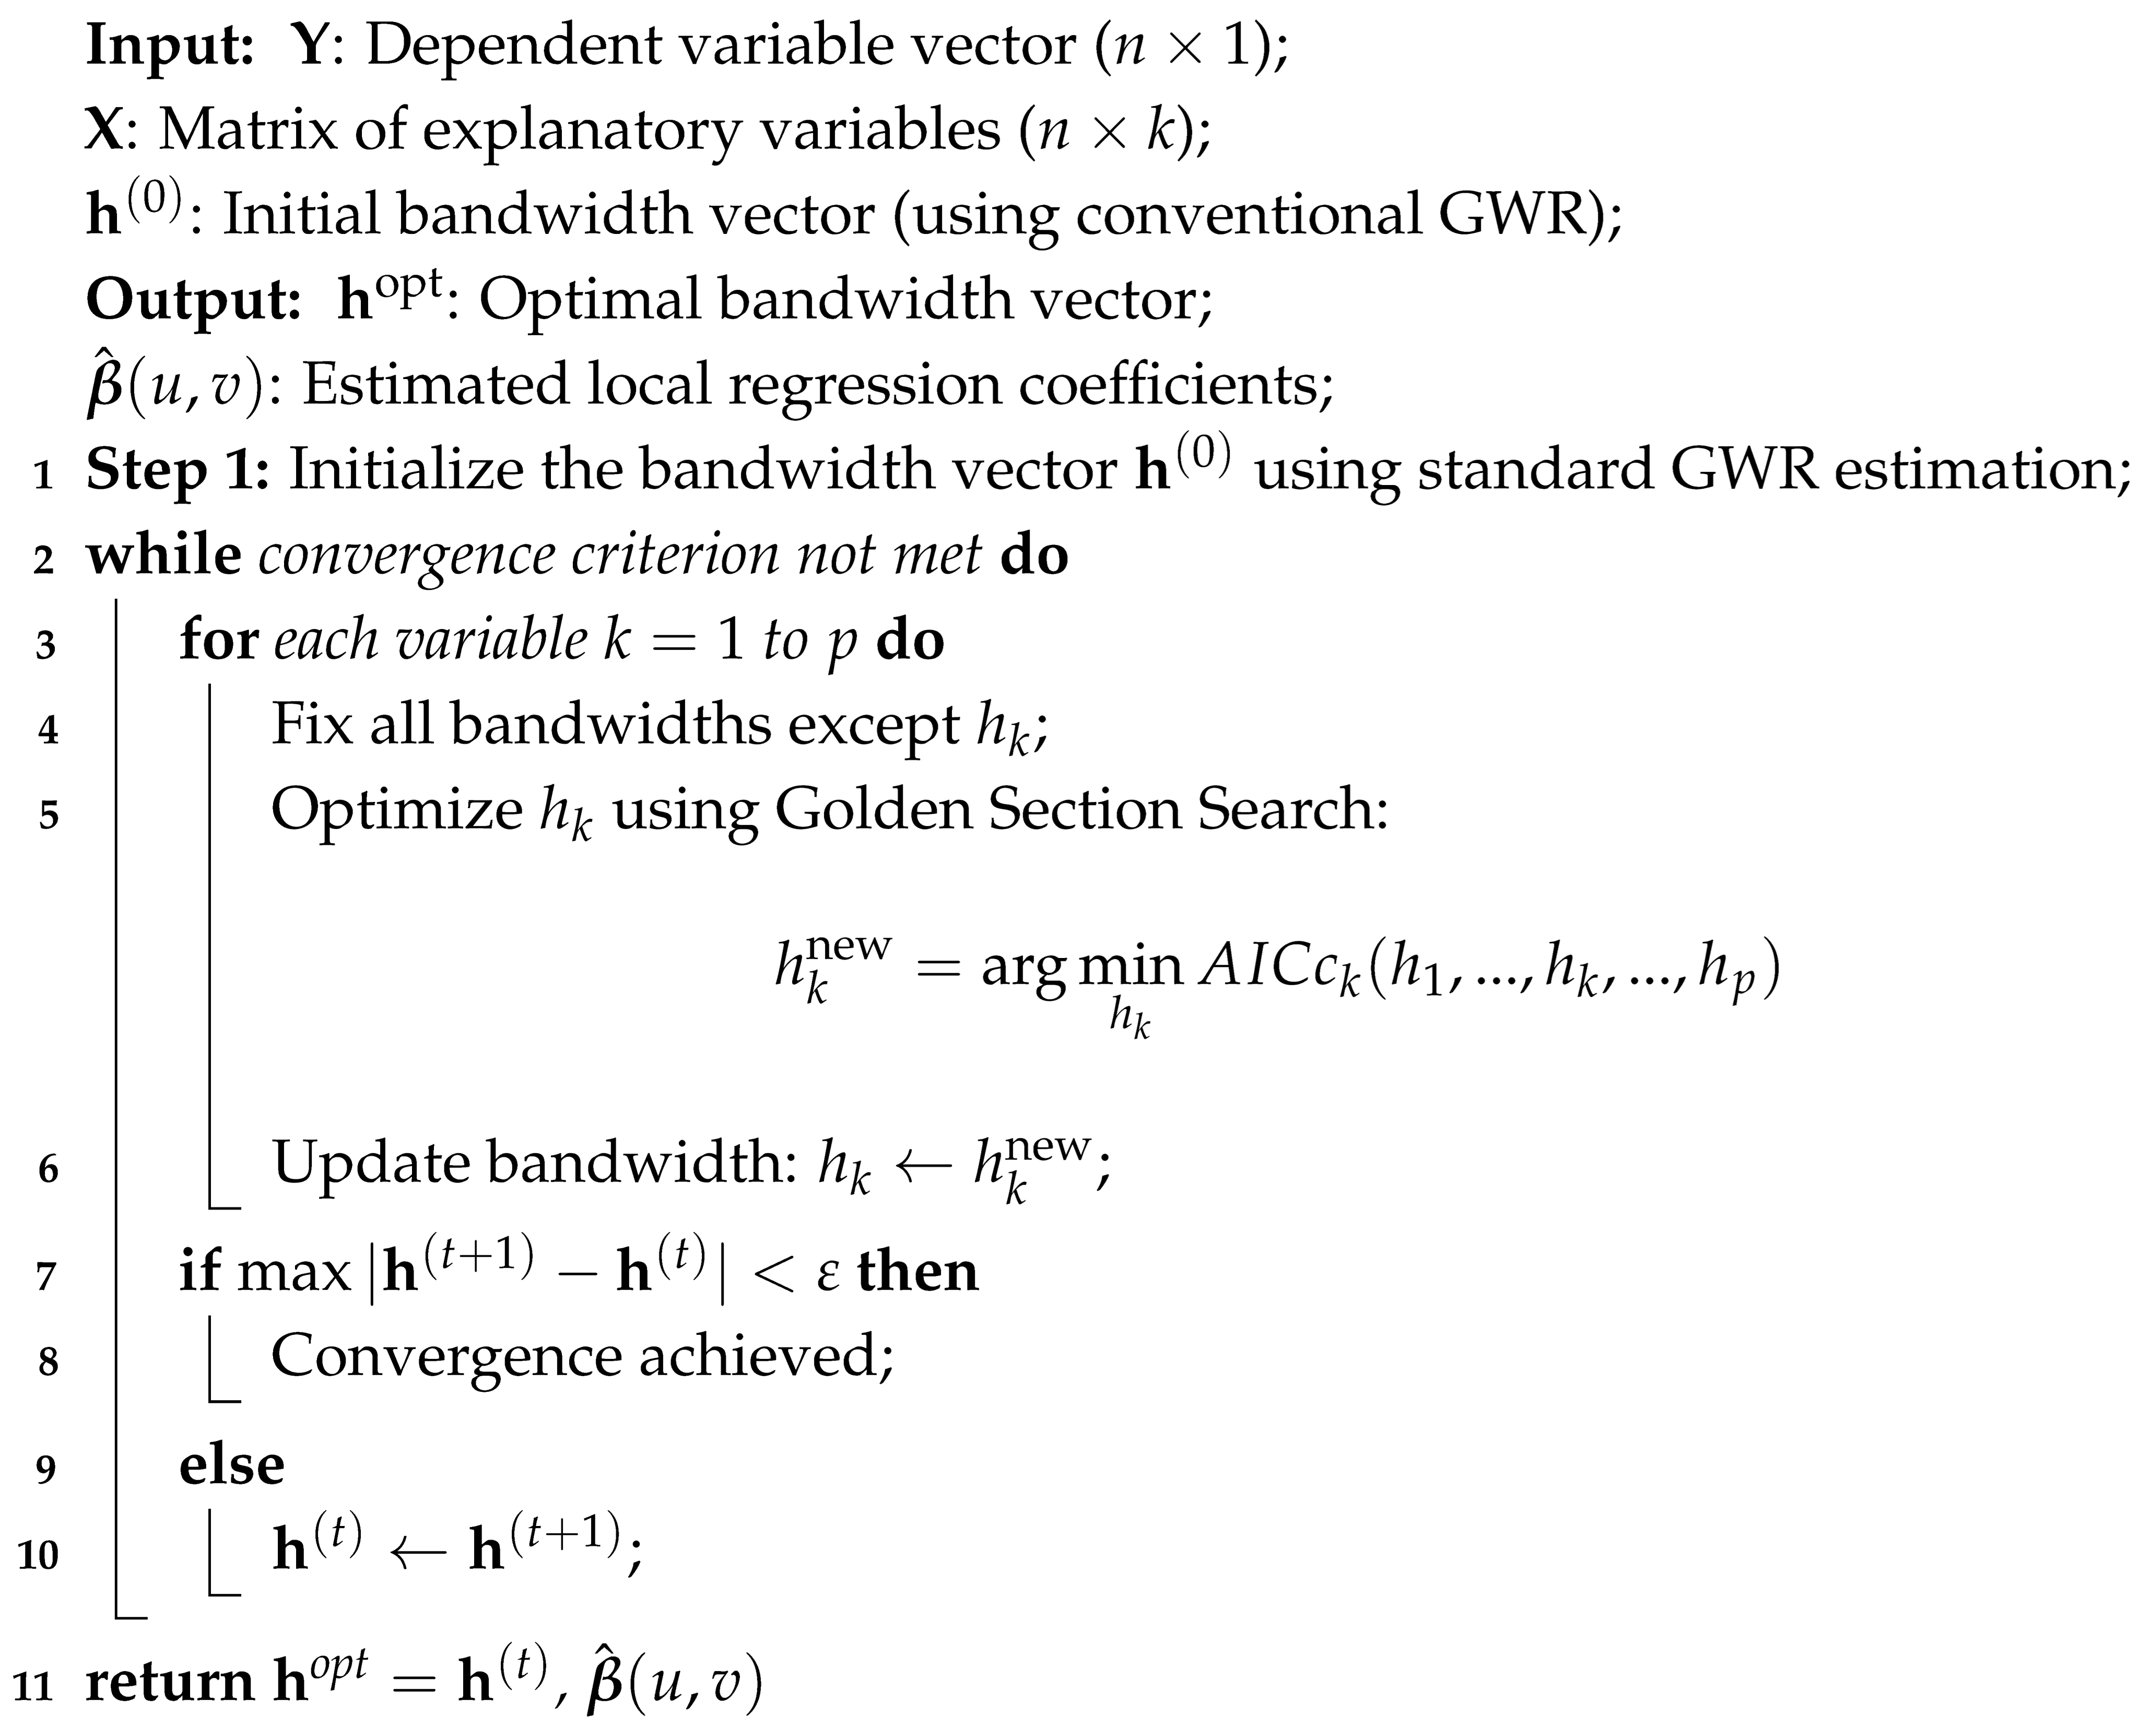 |
4. Results
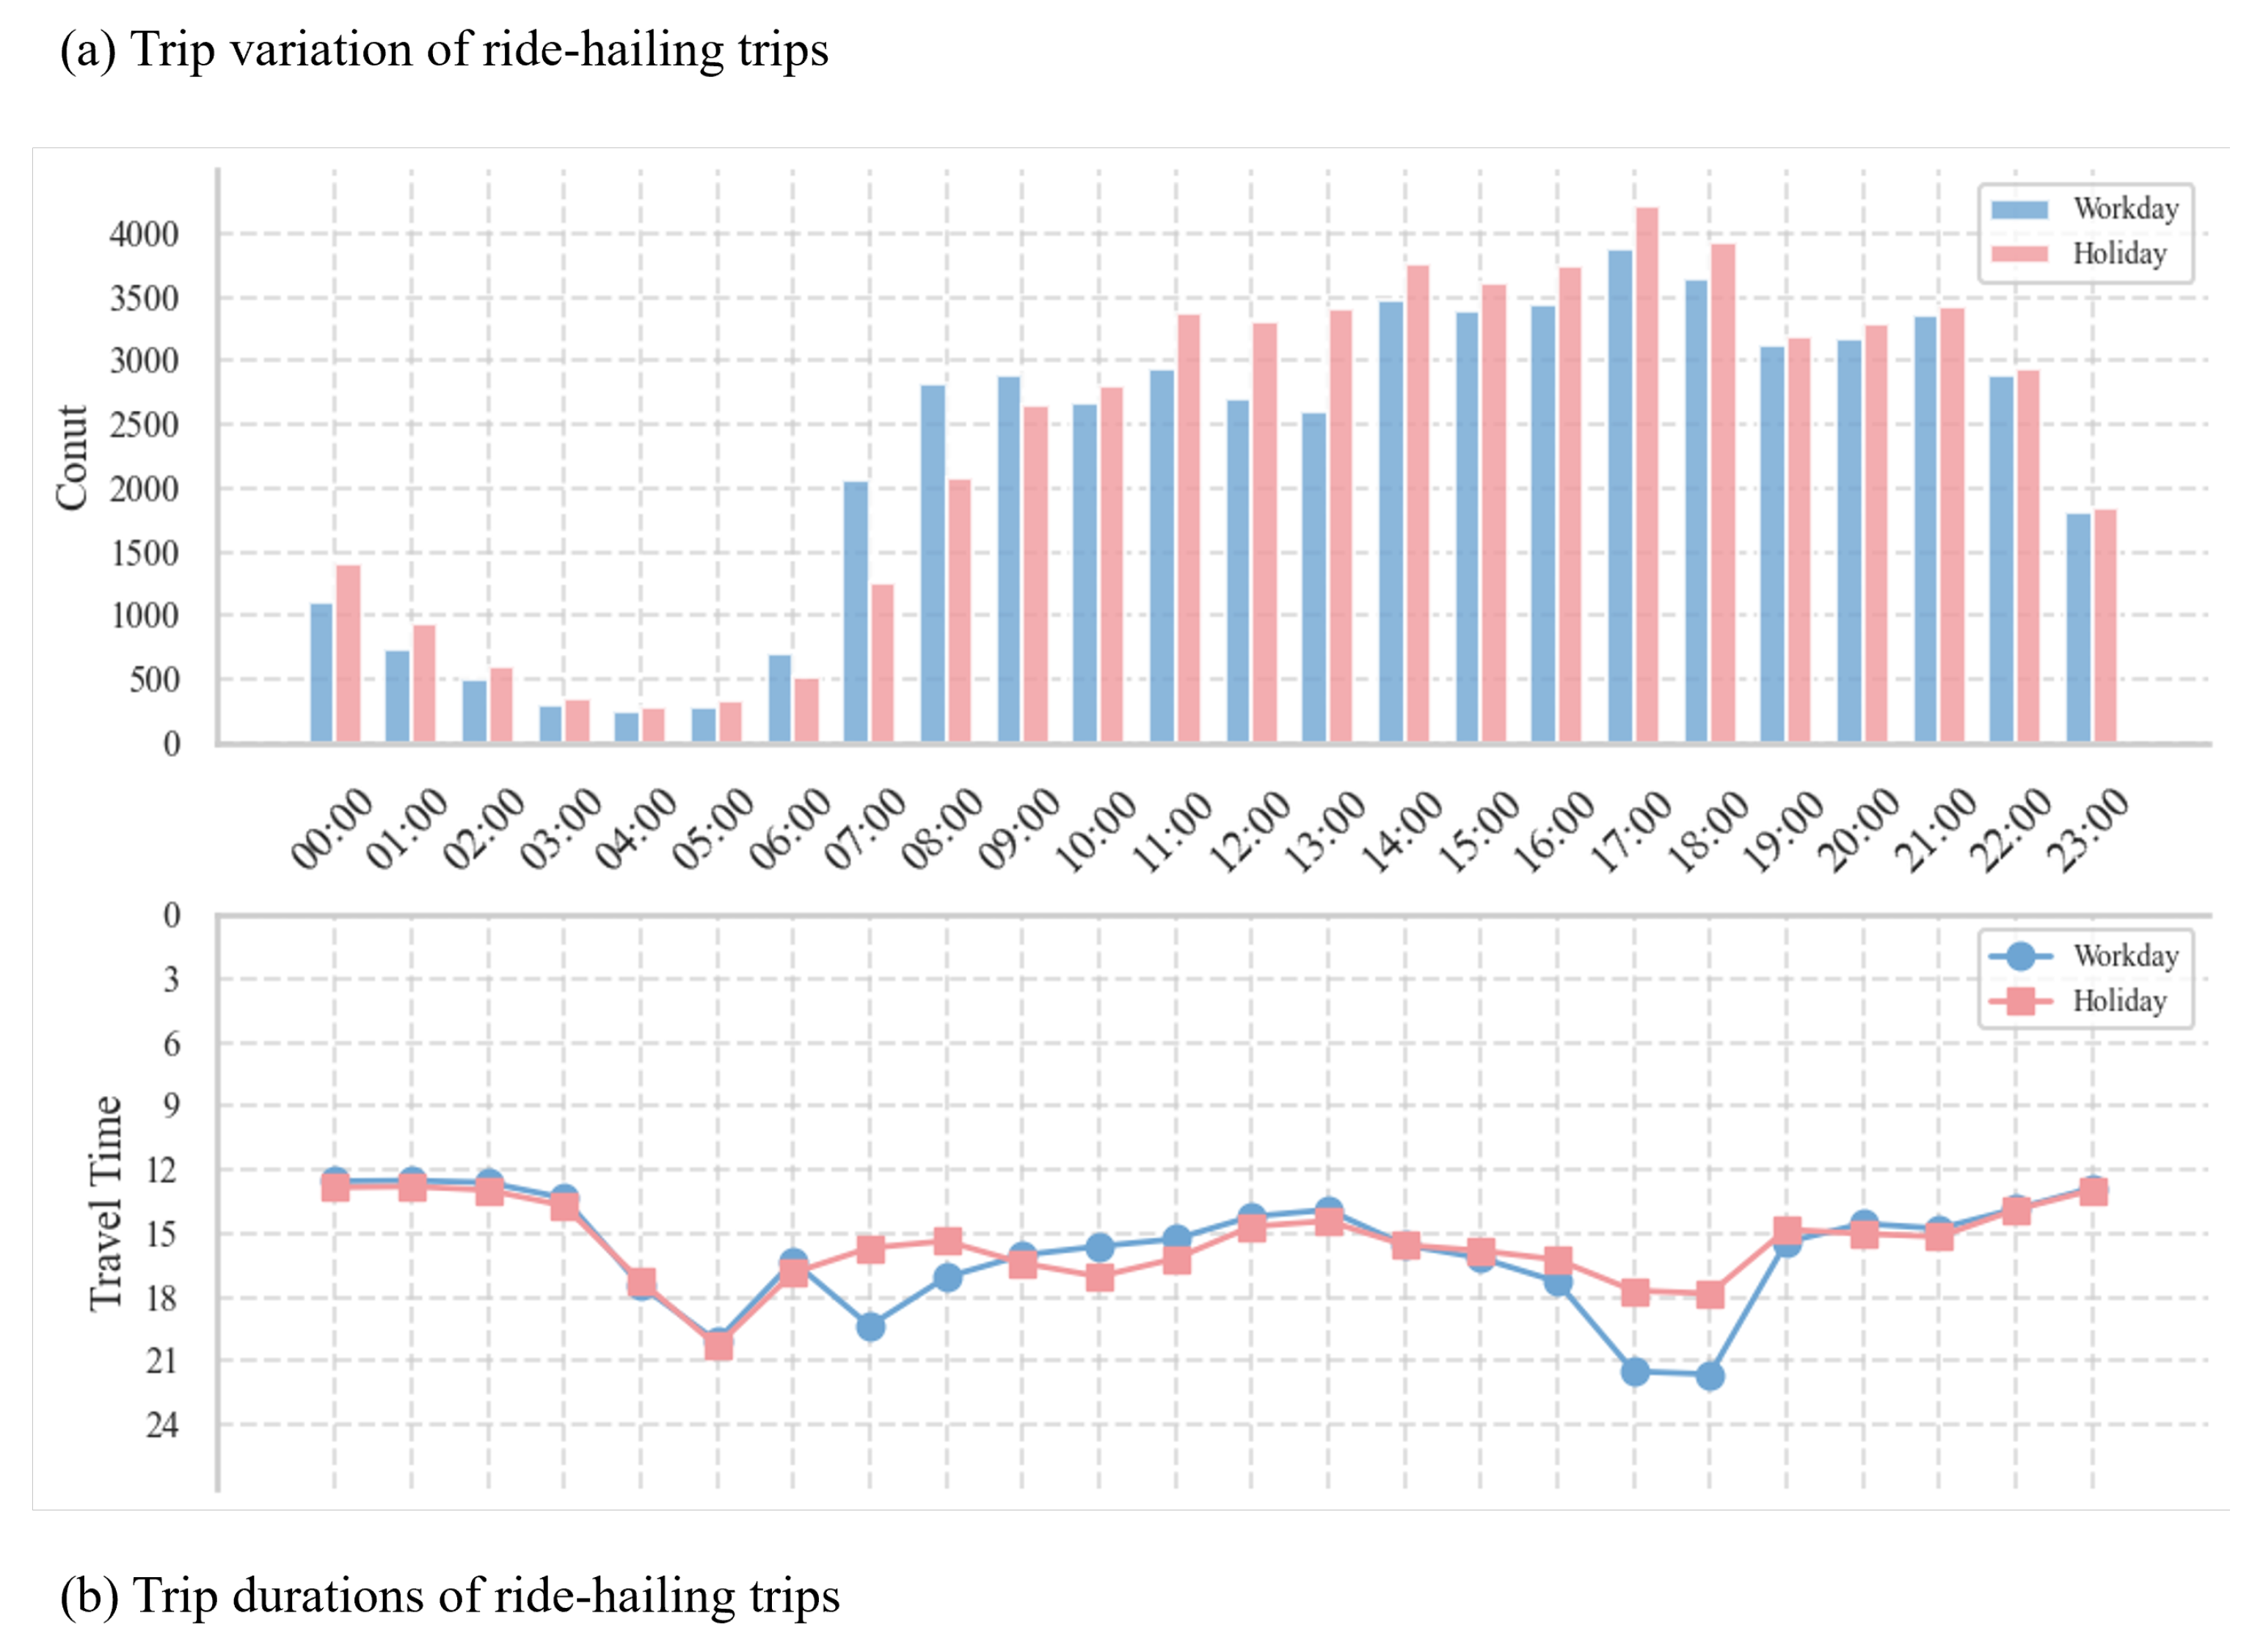
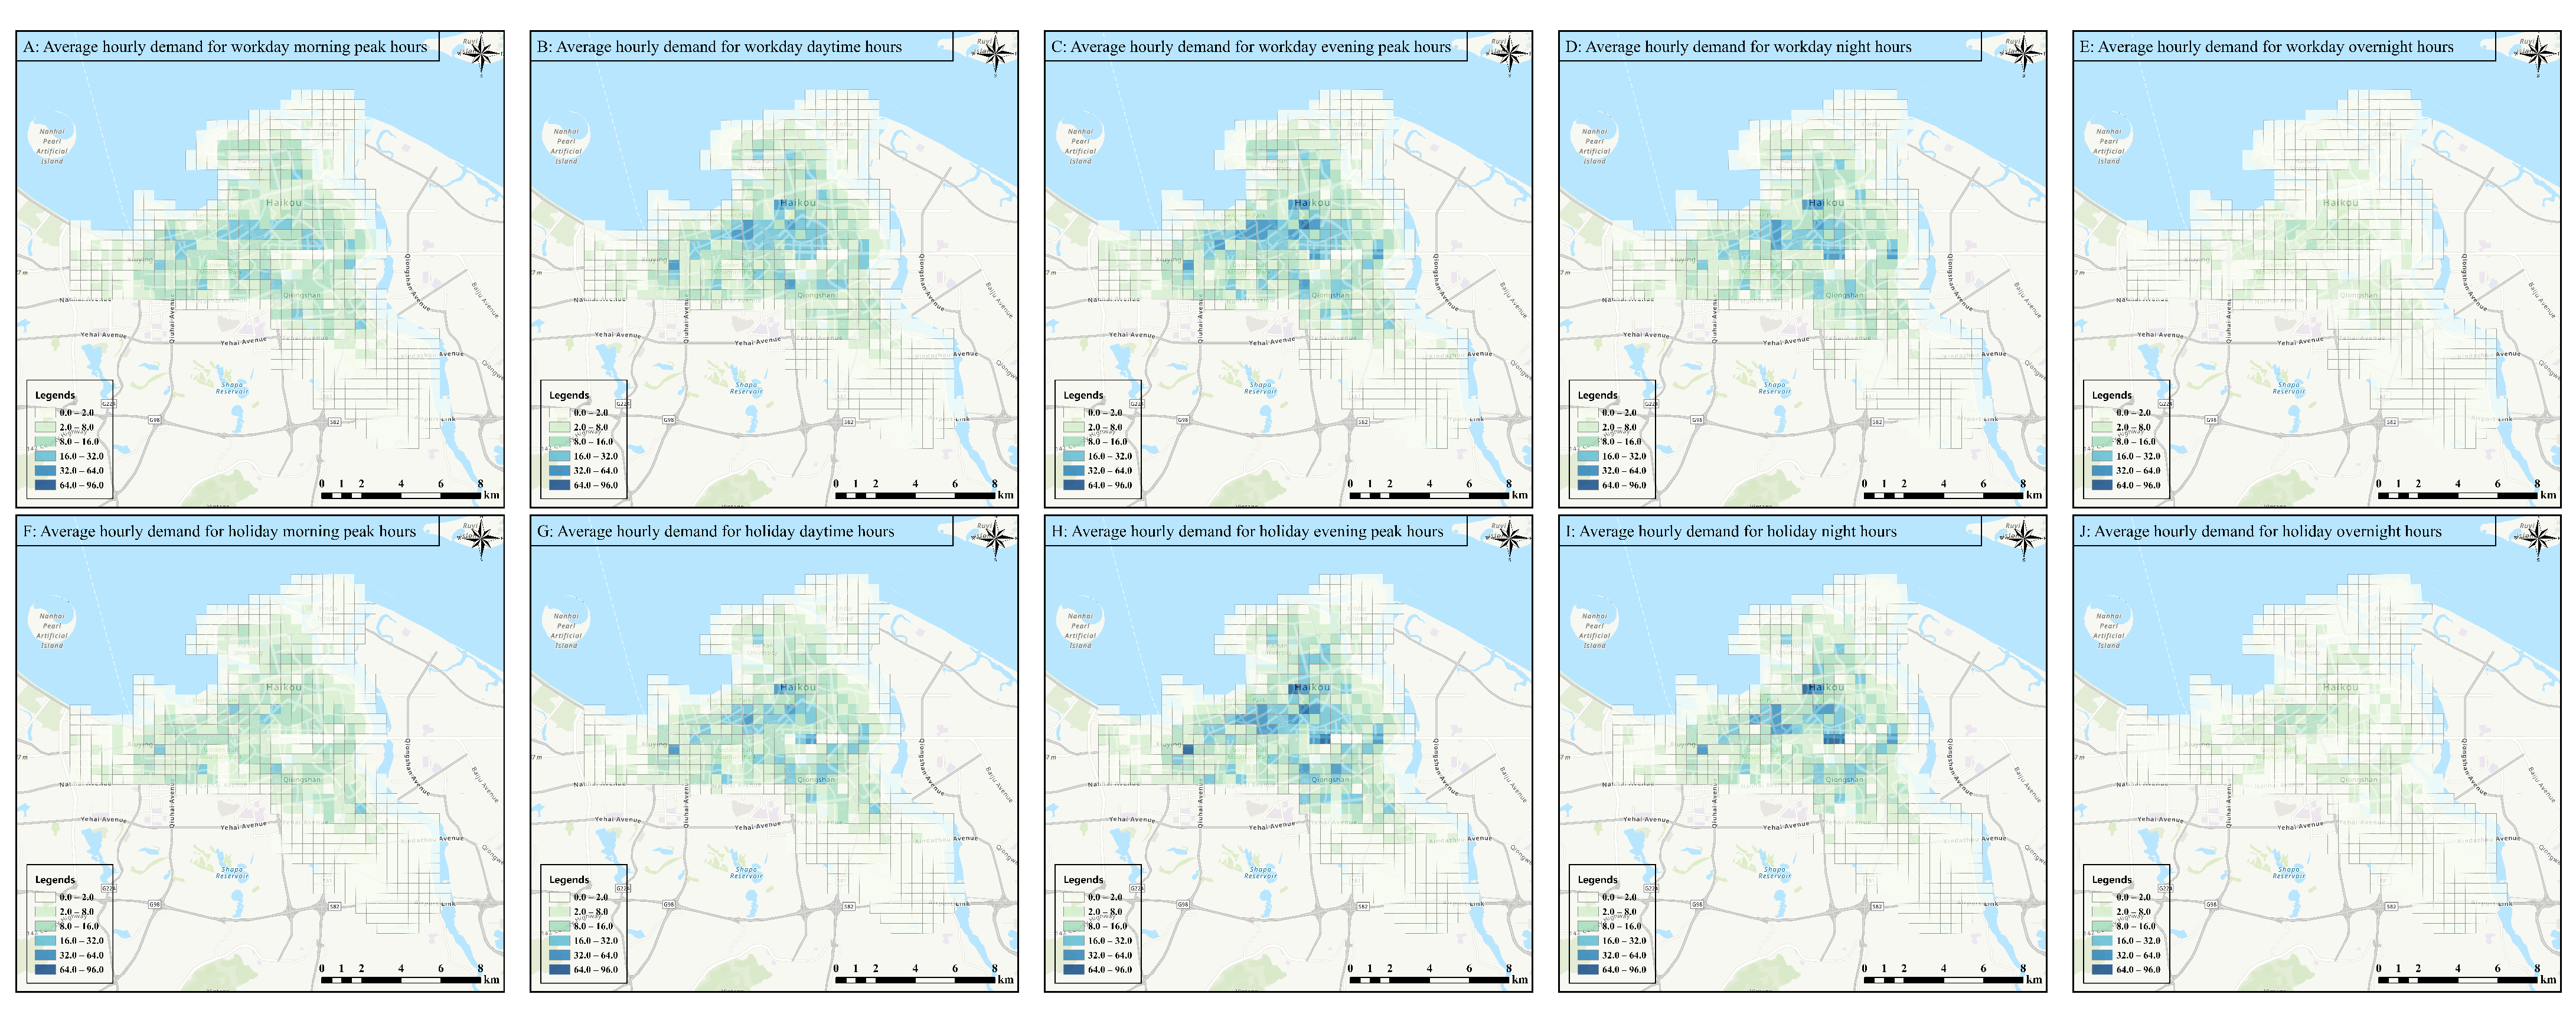
4.1. Temporal and Spatial Pattern of Ride-Hailing Services in Haikou’s Urban Area
4.2. Variable Selection Results
4.3. Results of Spatial Autocorrelation Test
4.4. Model Performance Comparison
4.4.1. Global Model Results
4.4.2. Local Model Results
4.5. Local Estimates in the MGWR Model
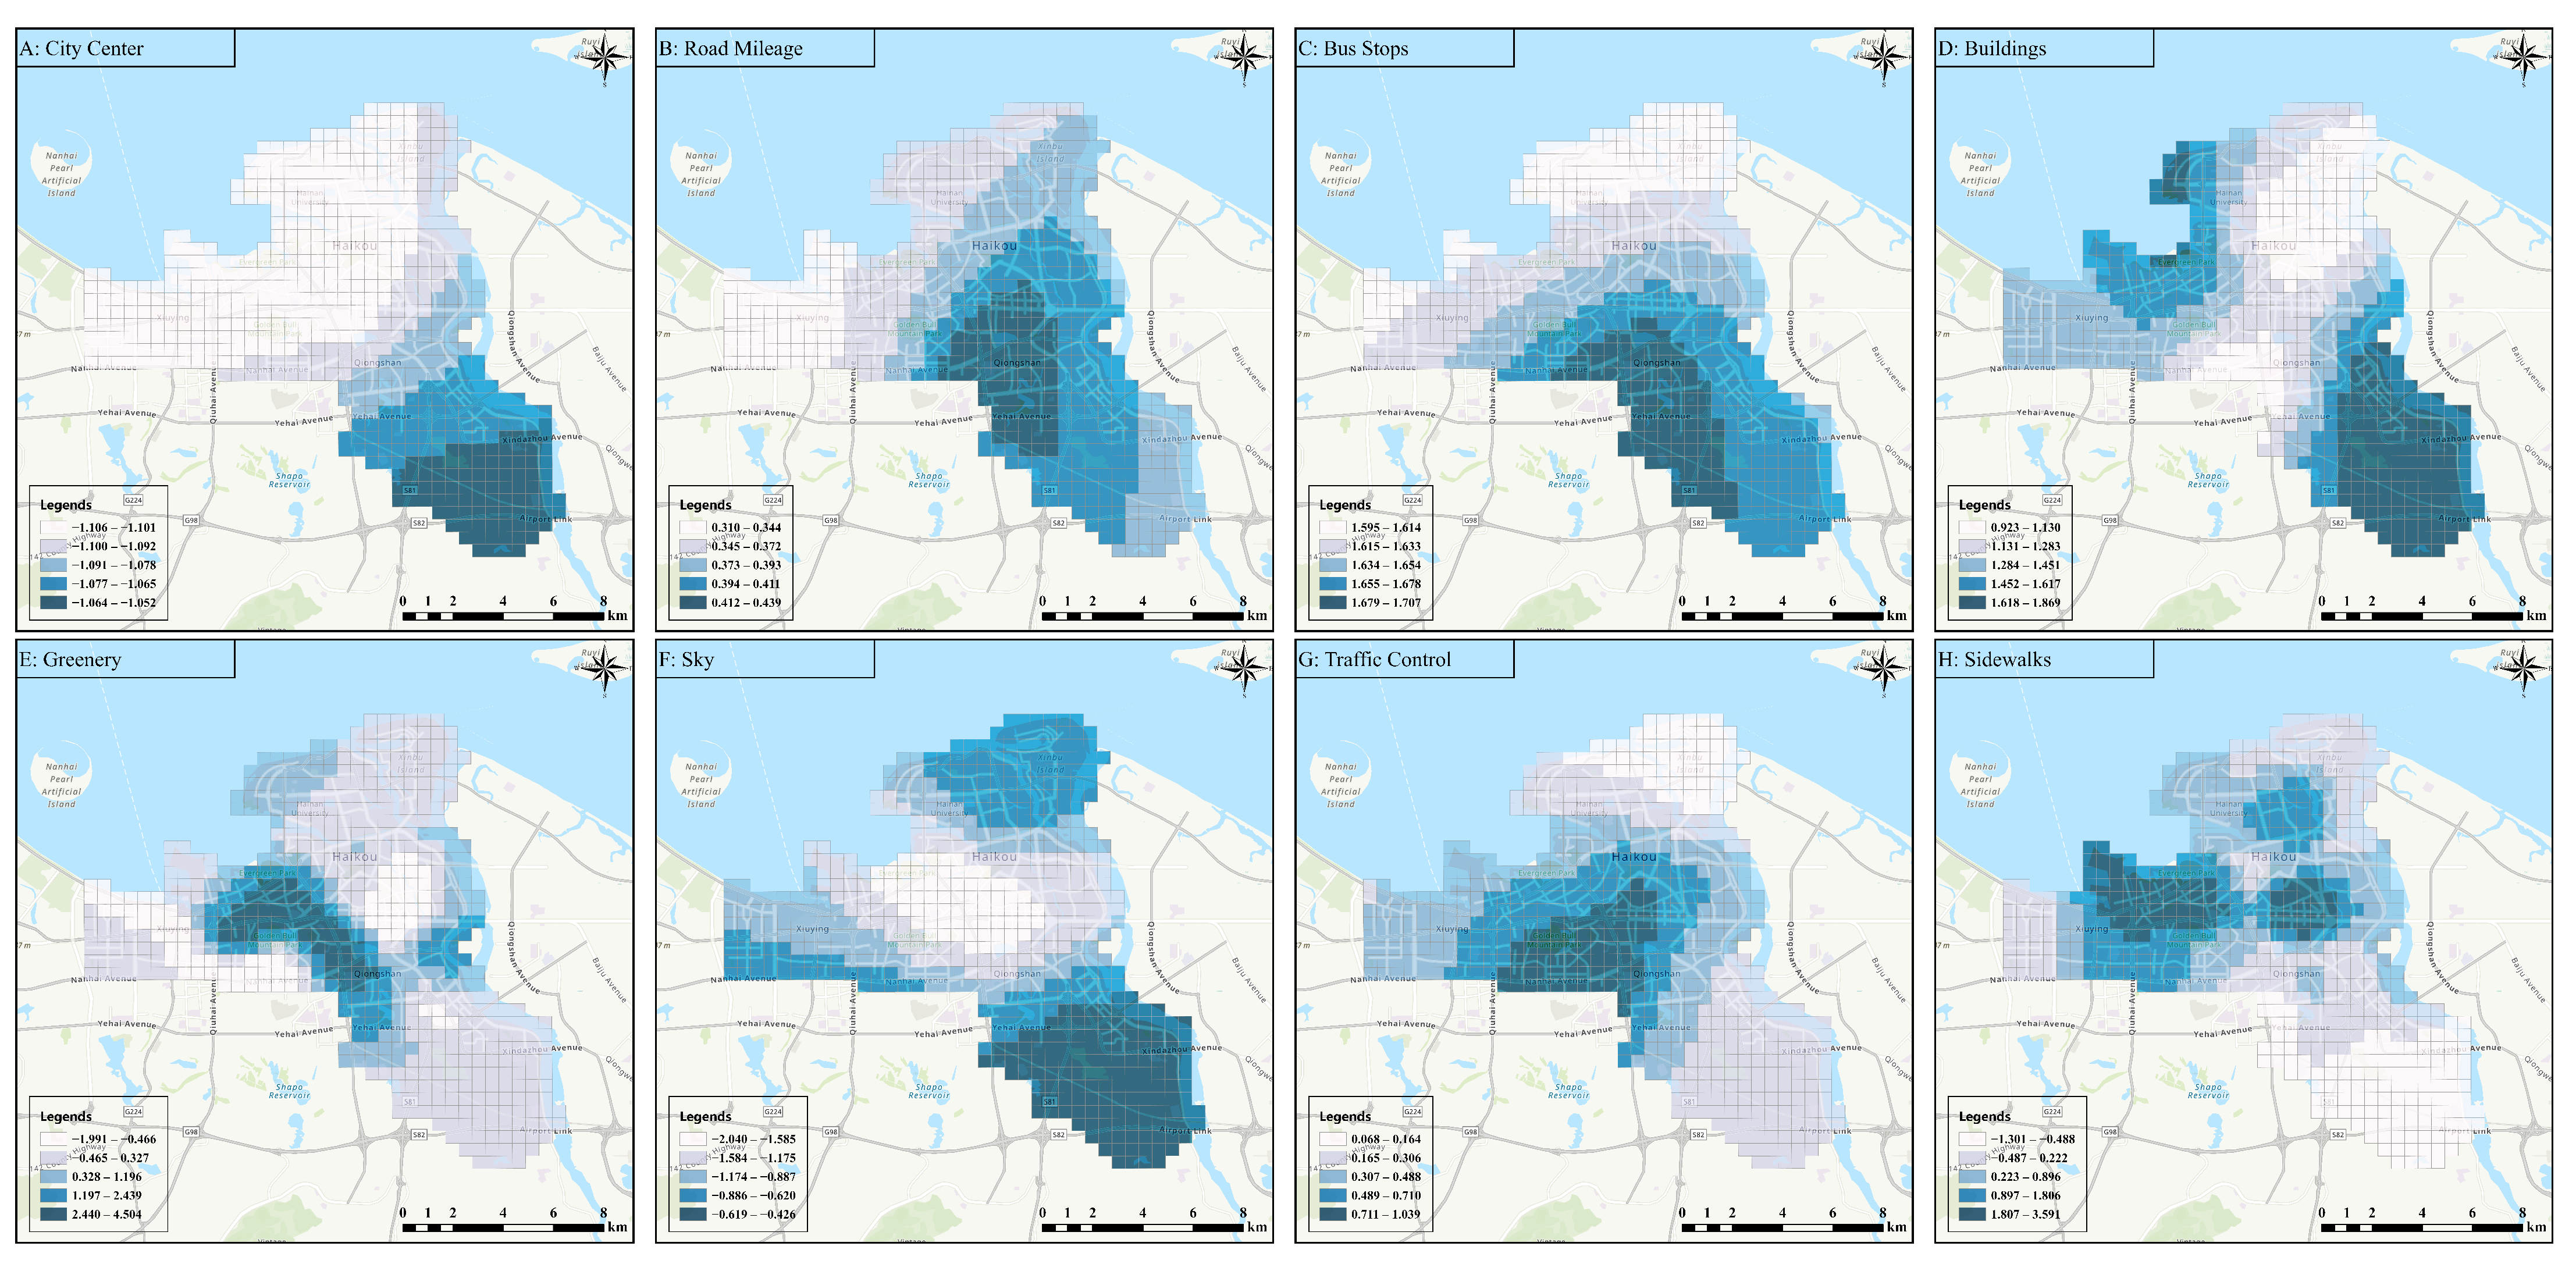
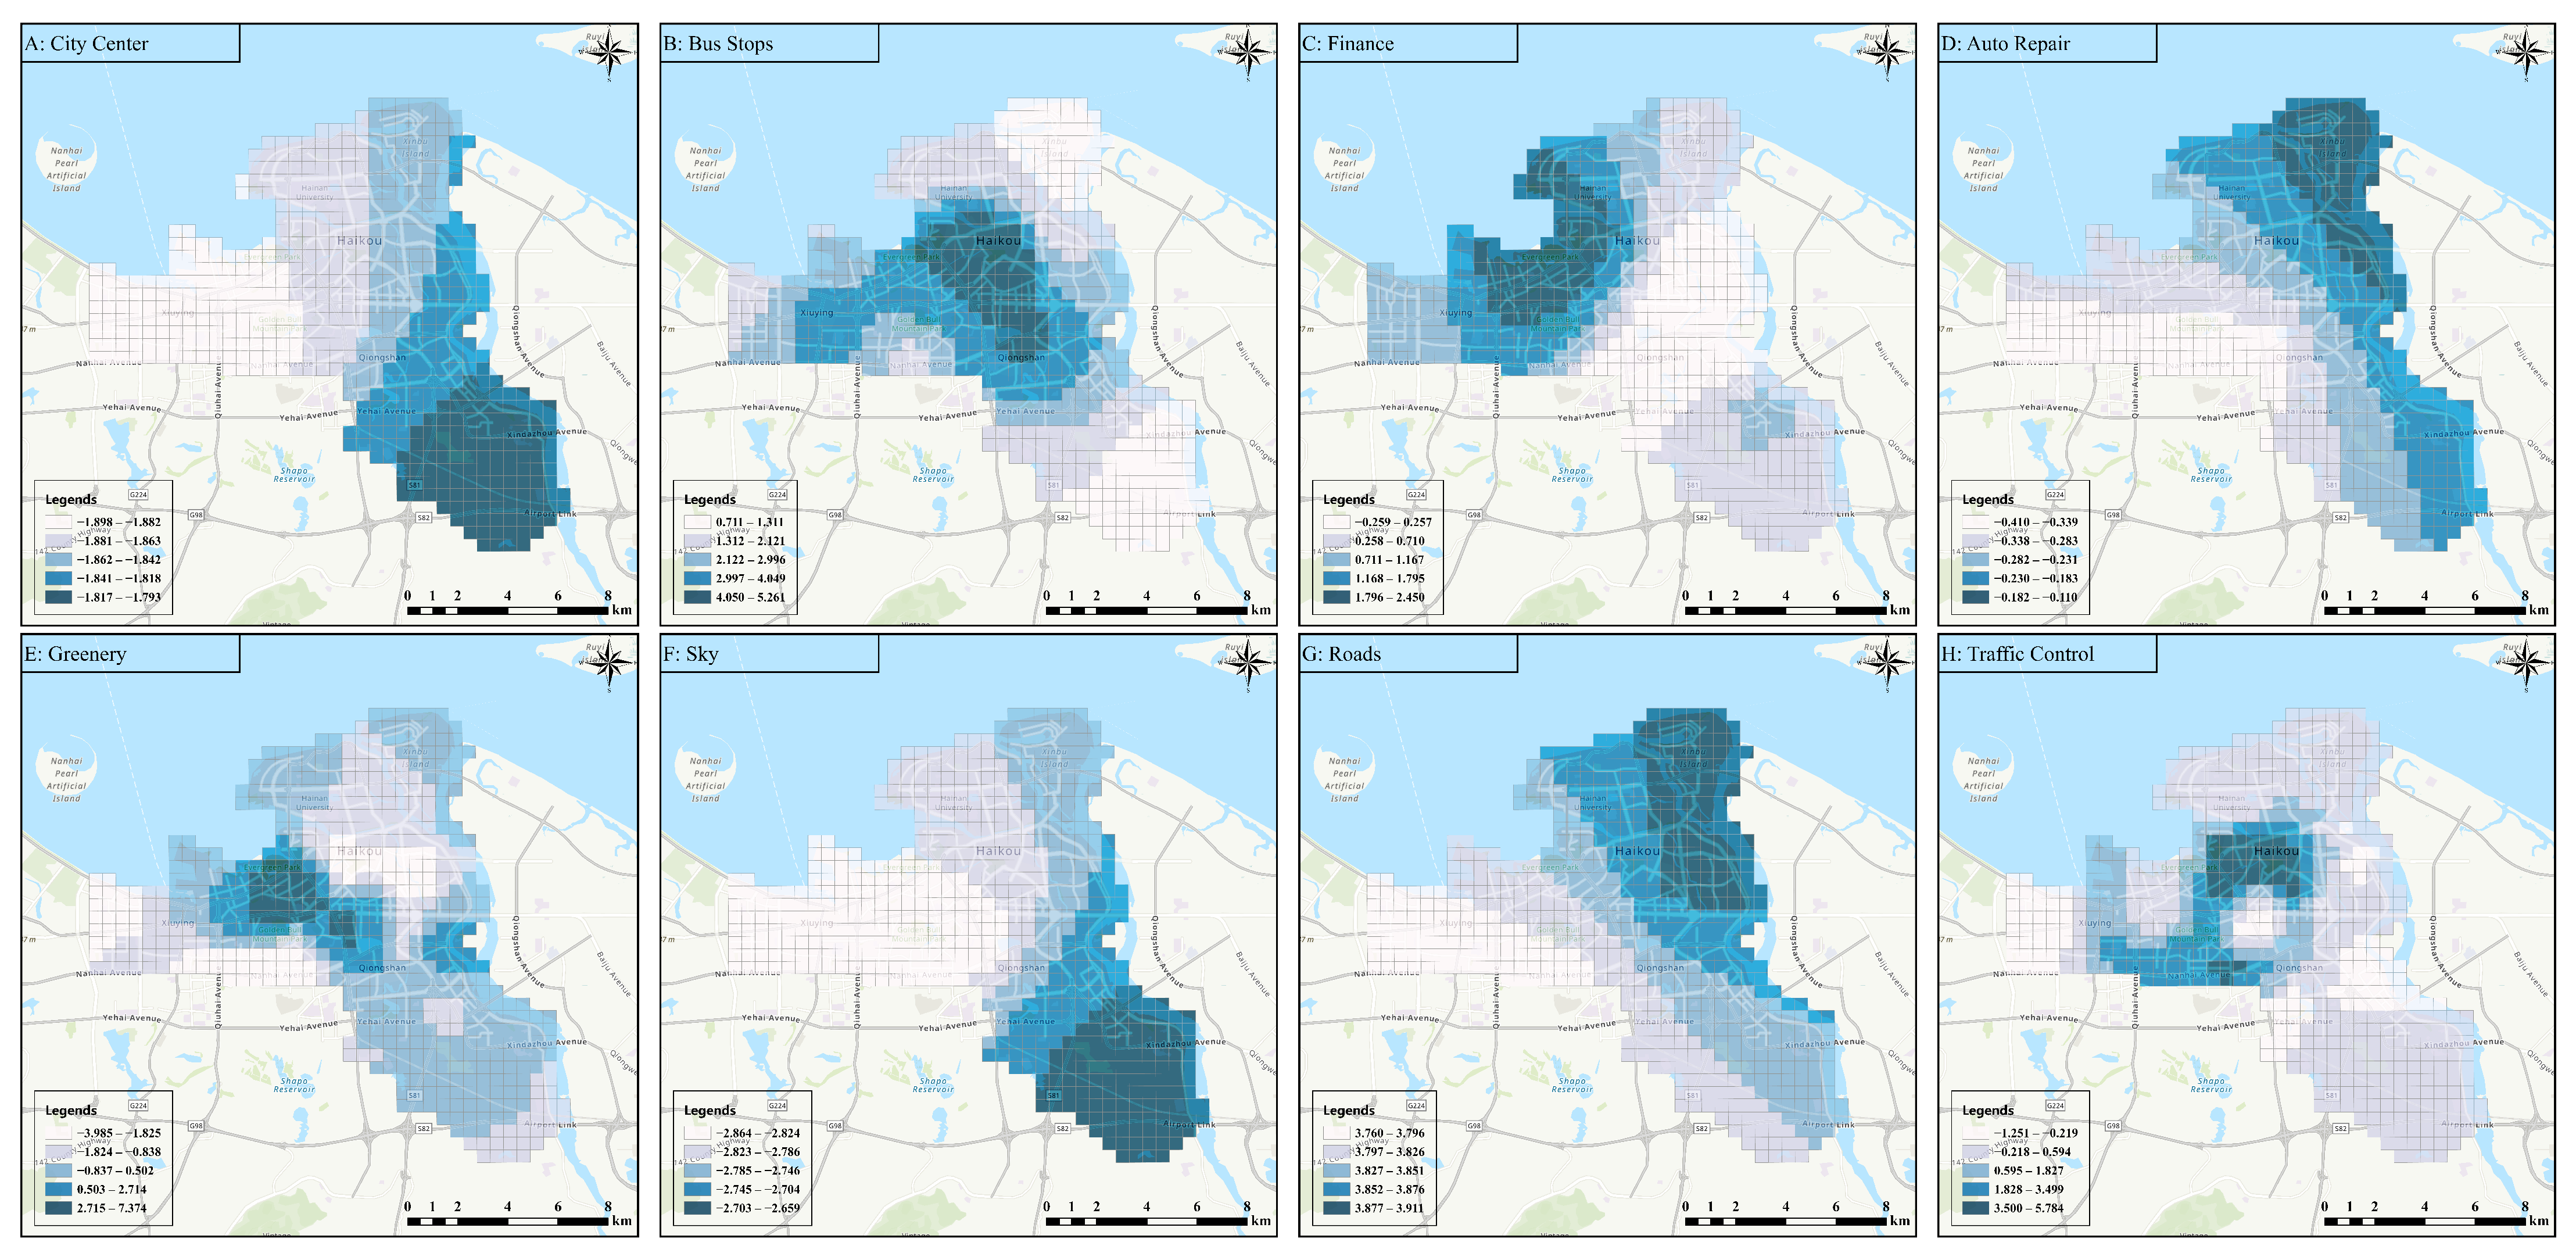
4.5.1. Workdays
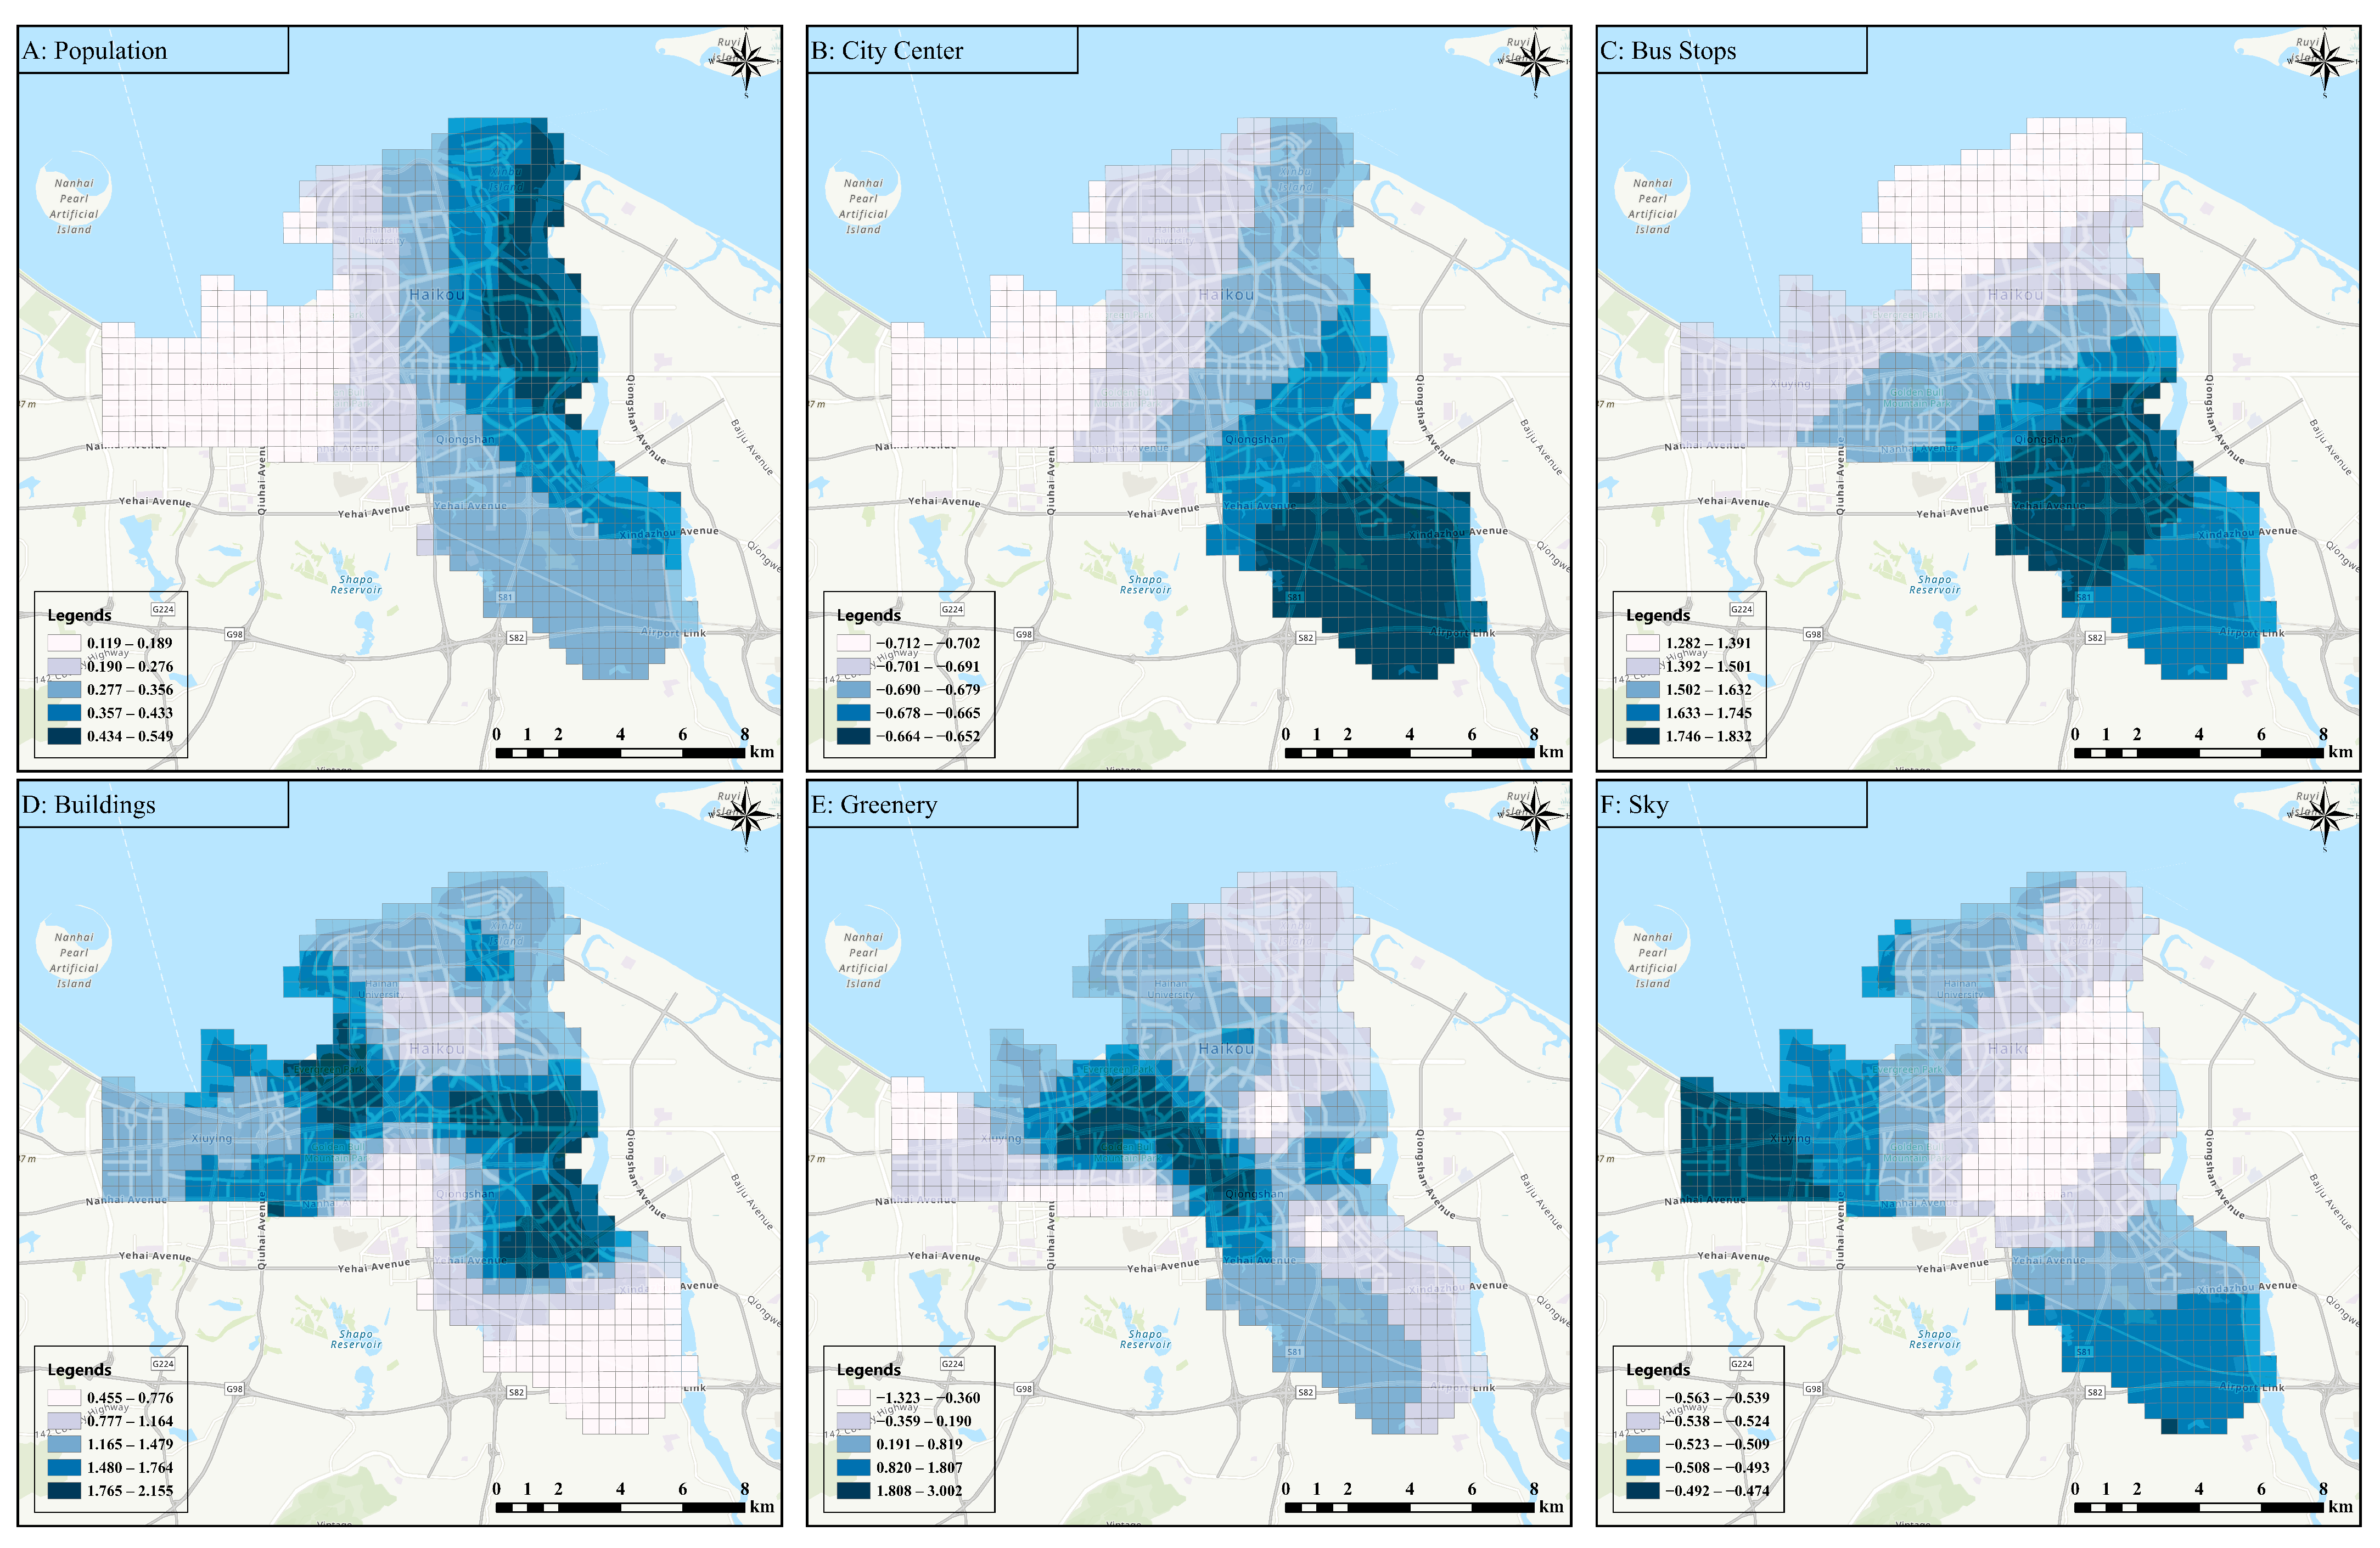
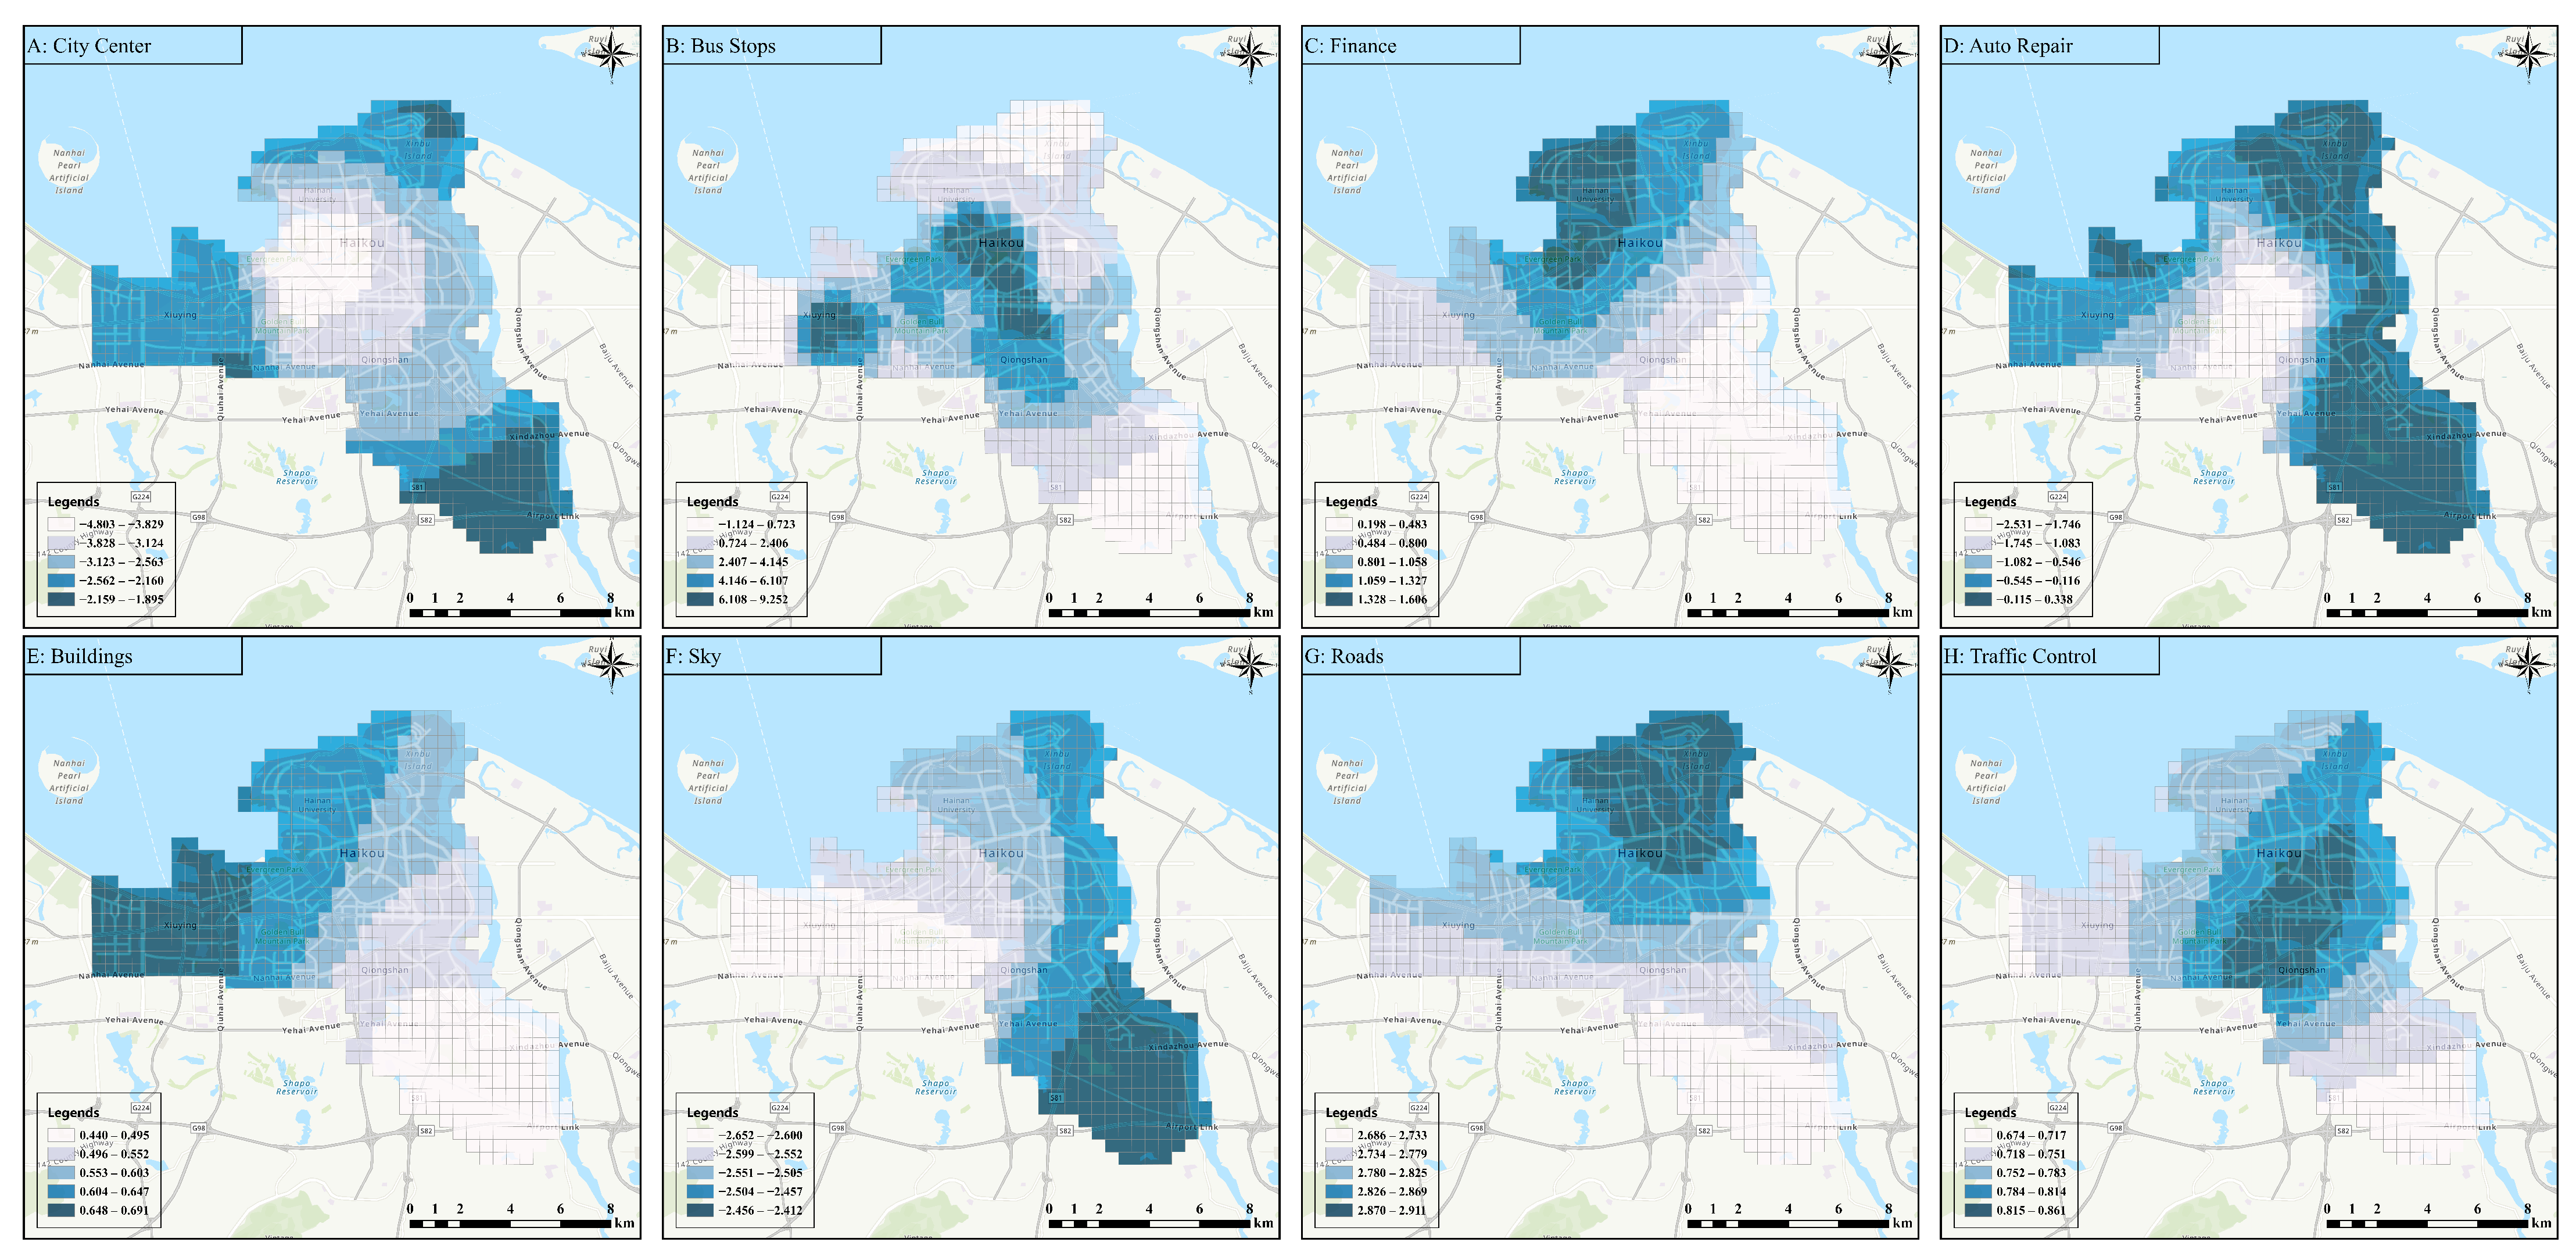
4.5.2. Holidays
5. Discussion and Conclusions
Author Contributions
Funding
Institutional Review Board Statement
Informed Consent Statement
Data Availability Statement
Acknowledgments
Conflicts of Interest
References
- Wang, F.Y.; Lin, Y.; Ioannou, P.A.; Vlacic, L.; Liu, X.; Eskandarian, A.; Lv, Y.; Na, X.; Cebon, D.; Ma, J.; et al. Transportation 5.0: The DAO to safe, secure, and sustainable intelligent transportation systems. IEEE Trans. Intell. Transp. Syst. 2023, 24, 10262–10278. [Google Scholar] [CrossRef]
- Erhardt, G.D.; Roy, S.; Cooper, D.; Sana, B.; Chen, M.; Castiglione, J. Do transportation network companies decrease or increase congestion? Sci. Adv. 2019, 5, eaau2670. [Google Scholar] [CrossRef]
- Li, W.; Pu, Z.; Li, Y.; Ban, X.J. Characterization of ridesplitting based on observed data: A case study of Chengdu, China. Transp. Res. Part C Emerg. Technol. 2019, 100, 330–353. [Google Scholar] [CrossRef]
- Zhong, J.; Zhou, H.; Lin, Y.; Ren, F. The impact of ride-hailing services on the use of traditional taxis: Evidence from Chinese urban panel data. IET Intell. Transp. Syst. 2022, 16, 1611–1622. [Google Scholar] [CrossRef]
- Qiao, S.; Yeh, A.G.O. Is ride-hailing competing or complementing public transport? A perspective from affordability. Transp. Res. Part D Transp. Environ. 2023, 114, 103533. [Google Scholar] [CrossRef]
- Wang, Z.; Zhang, Y.; Jia, B.; Gao, Z. Comparative Analysis of Usage Patterns and Underlying Determinants for Ride-hailing and Traditional Taxi Services: A Chicago Case Study. Transp. Res. Part A Policy Pract. 2024, 179, 103912. [Google Scholar] [CrossRef]
- Liu, Y.; Jia, R.; Ye, J.; Qu, X. How machine learning informs ride-hailing services: A survey. Commun. Transp. Res. 2022, 2, 100075. [Google Scholar] [CrossRef]
- Bredikhina, O.A.; Rafique, S.; Fisher, J.W.; Penmetsa, P.; Wheeler, L.M.; Li, X.; Polunsky, S.M. Ride-hailing with kids: Who’s got their back? J. Saf. Res. 2021, 79, 117–124. [Google Scholar] [CrossRef]
- Chen, X.; Gu, X.; Li, T.; Liu, Q.; Xu, L.; Peng, B.; Wu, N. Factors influencing smoking behaviour of online ride-hailing drivers in China: A cross-sectional analysis. BMC Public Health 2021, 21, 1326. [Google Scholar] [CrossRef]
- Naumov, S.; Keith, D. Optimizing the economic and environmental benefits of ride-hailing and pooling. Prod. Oper. Manag. 2023, 32, 904–929. [Google Scholar] [CrossRef]
- Wei, K.; Vaze, V.; Jacquillat, A. Transit planning optimization under ride-hailing competition and traffic congestion. Transp. Sci. 2022, 56, 725–749. [Google Scholar] [CrossRef]
- Barnes, S.J.; Guo, Y.; Borgo, R. Sharing the air: Transient impacts of ride-hailing introduction on pollution in China. Transp. Res. Part D Transp. Environ. 2020, 86, 102434. [Google Scholar] [CrossRef]
- Xu, Z.; Yin, Y.; Ye, J. On the supply curve of ride-hailing systems. Transp. Res. Part B Methodol. 2020, 132, 29–43. [Google Scholar] [CrossRef]
- Jin, G.; Cui, Y.; Zeng, L.; Tang, H.; Feng, Y.; Huang, J. Urban ride-hailing demand prediction with multiple spatio-temporal information fusion network. Transp. Res. Part C Emerg. Technol. 2020, 117, 102665. [Google Scholar] [CrossRef]
- Zheng, Z.; Zhang, J.; Zhang, L.; Li, M.; Rong, P.; Qin, Y. Understanding the impact of the built environment on ride-hailing from a spatio-temporal perspective: A fine-scale empirical study from China. Cities 2022, 126, 103706. [Google Scholar] [CrossRef]
- Nguyen-Phuoc, D.Q.; Su, D.N.; Tran, P.T.K.; Le, D.T.T.; Johnson, L.W. Factors influencing customer’s loyalty towards ride-hailing taxi services–A case study of Vietnam. Transp. Res. Part A Policy Pract. 2020, 134, 96–112. [Google Scholar] [CrossRef]
- Loa, P.; Habib, K.N. Examining the influence of attitudinal factors on the use of ride-hailing services in Toronto. Transp. Res. Part A Policy Pract. 2021, 146, 13–28. [Google Scholar] [CrossRef]
- Li, X.; Du, M.; Zhang, Y.; Yang, J. Identifying the factors influencing the choice of different ride-hailing services in Shenzhen, China. Travel Behav. Soc. 2022, 29, 53–64. [Google Scholar] [CrossRef]
- Nguyen-Phuoc, D.Q.; Su, D.N.; Nguyen, M.H.; Vo, N.S.; Oviedo-Trespalacios, O. Factors influencing intention to use on-demand shared ride-hailing services in Vietnam: Risk, cost or sustainability? J. Transp. Geogr. 2022, 99, 103302. [Google Scholar] [CrossRef]
- Lee, C.K.H.; Wong, A.O.M. Antecedents of consumer loyalty in ride-hailing. Transp. Res. Part F Traffic Psychol. Behav. 2021, 80, 14–33. [Google Scholar] [CrossRef]
- Dias, F.F.; Lavieri, P.S.; Garikapati, V.M.; Astroza, S.; Pendyala, R.M.; Bhat, C.R. A behavioral choice model of the use of car-sharing and ride-sourcing services. Transportation 2017, 44, 1307–1323. [Google Scholar] [CrossRef]
- Barajas, J.M.; Brown, A. Not minding the gap: Does ride-hailing serve transit deserts? J. Transp. Geogr. 2021, 90, 102918. [Google Scholar] [CrossRef]
- Ghaffar, A.; Mitra, S.; Hyland, M. Modeling determinants of ridesourcing usage: A census tract-level analysis of Chicago. Transp. Res. Part C Emerg. Technol. 2020, 119, 102769. [Google Scholar] [CrossRef]
- Sikder, S. Who uses ride-hailing services in the United States? Transp. Res. Rec. 2019, 2673, 40–54. [Google Scholar] [CrossRef]
- Ma, S.; Long, Y. Functional urban area delineations of cities on the Chinese mainland using massive Didi ride-hailing records. Cities 2020, 97, 102532. [Google Scholar] [CrossRef]
- Qiao, S.; Yeh, A.G.O. Is ride-hailing a valuable means of transport in newly developed areas under TOD-oriented urbanization in China? Evidence from Chengdu City. J. Transp. Geogr. 2021, 96, 103183. [Google Scholar] [CrossRef]
- Etminani-Ghasrodashti, R.; Hamidi, S. Individuals’ demand for ride-hailing services: Investigating the combined effects of attitudinal factors, land use, and travel attributes on demand for app-based taxis in Tehran, Iran. Sustainability 2019, 11, 5755. [Google Scholar] [CrossRef]
- Dean, M.D.; Kockelman, K.M. Spatial variation in shared ride-hail trip demand and factors contributing to sharing: Lessons from Chicago. J. Transp. Geogr. 2021, 91, 102944. [Google Scholar] [CrossRef]
- Ngo, N.S.; Götschi, T.; Clark, B.Y. The effects of ride-hailing services on bus ridership in a medium-sized urban area using micro-level data: Evidence from the Lane Transit District. Transp. Policy 2021, 105, 44–53. [Google Scholar] [CrossRef]
- Sunitiyoso, Y.; Rahayu, W.A.; Nuraeni, S.; Nurdayat, I.F.; Pambudi, N.F.; Hadiansyah, F. Role of ride-hailing in multimodal commuting. Case Stud. Transp. Policy 2022, 10, 1283–1298. [Google Scholar] [CrossRef]
- Marquet, O. Spatial distribution of ride-hailing trip demand and its association with walkability and neighborhood characteristics. Cities 2020, 106, 102926. [Google Scholar] [CrossRef]
- Martin, C.J. The sharing economy: A pathway to sustainability or a nightmarish form of neoliberal capitalism? Ecol. Econ. 2016, 121, 149–159. [Google Scholar] [CrossRef]
- Cohen, B.; Kietzmann, J. Ride on! Mobility business models for the sharing economy. Organ. Environ. 2014, 27, 279–296. [Google Scholar] [CrossRef]
- Mouratidis, K.; Peters, S.; van Wee, B. Transportation technologies, sharing economy, and teleactivities: Implications for built environment and travel. Transp. Res. Part D Transp. Environ. 2021, 92, 102716. [Google Scholar] [CrossRef]
- Mouratidis, K. Bike-sharing, car-sharing, e-scooters, and Uber: Who are the shared mobility users and where do they live? Sustain. Cities Soc. 2022, 86, 104161. [Google Scholar] [CrossRef]
- Alemi, F.; Circella, G.; Handy, S.; Mokhtarian, P. What influences travelers to use Uber? Exploring the factors affecting the adoption of on-demand ride services in California. Travel Behav. Soc. 2018, 13, 88–104. [Google Scholar] [CrossRef]
- Acheampong, R.A.; Siiba, A.; Okyere, D.K.; Tuffour, J.P. Mobility-on-demand: An empirical study of internet-based ride-hailing adoption factors, travel characteristics and mode substitution effects. Transp. Res. Part C Emerg. Technol. 2020, 115, 102638. [Google Scholar] [CrossRef]
- Alemi, F.; Circella, G.; Mokhtarian, P.; Handy, S. What drives the use of ridehailing in California? Ordered probit models of the usage frequency of Uber and Lyft. Transp. Res. Part C Emerg. Technol. 2019, 102, 233–248. [Google Scholar] [CrossRef]
- Young, M.; Farber, S. The who, why, and when of Uber and other ride-hailing trips: An examination of a large sample household travel survey. Transp. Res. Part A Policy Pract. 2019, 119, 383–392. [Google Scholar] [CrossRef]
- Tirachini, A.; Gomez-Lobo, A. Does ride-hailing increase or decrease vehicle kilometers traveled (VKT)? A simulation approach for Santiago de Chile. Int. J. Sustain. Transp. 2020, 14, 187–204. [Google Scholar] [CrossRef]
- Mucci, R.; Erhardt, G.D. Understanding ride-hailing sharing and matching in Chicago using travel time, cost, and choice models. Transp. Res. Rec. 2024, 2678, 293–306. [Google Scholar] [CrossRef]
- Tirachini, A.; Del Río, M. Ride-hailing in Santiago de Chile: Users’ characterisation and effects on travel behaviour. Transp. Policy 2019, 82, 46–57. [Google Scholar] [CrossRef]
- Henao, A.; Marshall, W.E. The impact of ride-hailing on vehicle miles traveled. Transportation 2019, 46, 2173–2194. [Google Scholar] [CrossRef]
- Lee, Y.; Chen, G.Y.H.; Circella, G.; Mokhtarian, P.L. Substitution or complementarity? A latent-class cluster analysis of ridehailing impacts on the use of other travel modes in three southern US cities. Transp. Res. Part D Transp. Environ. 2022, 104, 103167. [Google Scholar] [CrossRef]
- Rafiq, R.; McNally, M.G. An exploratory analysis of alternative travel behaviors of ride-hailing users. Transportation 2023, 50, 571–605. [Google Scholar] [CrossRef]
- Loginova, O.; Wang, X.H.; Liu, Q. The Impact of Multi-Homing in a Ride-Hailing Market; SSRN: Rochester, NY, USA, 2017. [Google Scholar]
- Wang, F.; Zhu, H.; Liu, X.; Lu, R.; Li, F.; Li, H.; Zhang, S. Efficient and privacy-preserving dynamic spatial query scheme for ride-hailing services. IEEE Trans. Veh. Technol. 2018, 67, 11084–11097. [Google Scholar] [CrossRef]
- Zhan, X.; Szeto, W.; Shui, C.; Chen, X.M. A modified artificial bee colony algorithm for the dynamic ride-hailing sharing problem. Transp. Res. Part E Logist. Transp. Rev. 2021, 150, 102124. [Google Scholar] [CrossRef]
- Wang, S.; Noland, R.B. Variation in ride-hailing trips in Chengdu, China. Transp. Res. Part D Transp. Environ. 2021, 90, 102596. [Google Scholar] [CrossRef]
- Dey, B.K.; Tirtha, S.D.; Eluru, N.; Konduri, K.C. Transformation of ridehailing in New York City: A quantitative assessment. Transp. Res. Part C Emerg. Technol. 2021, 129, 103235. [Google Scholar] [CrossRef]
- Mohamed, M.J.; Rye, T.; Fonzone, A. Operational and policy implications of ridesourcing services: A case of Uber in London, UK. Case Stud. Transp. Policy 2019, 7, 823–836. [Google Scholar] [CrossRef]
- Zhu, Y.; Chen, F.; Wang, Z.; Deng, J. Spatio-temporal analysis of rail station ridership determinants in the built environment. Transportation 2019, 46, 2269–2289. [Google Scholar] [CrossRef]
- Liu, Q.; Ding, C.; Chen, P. A panel analysis of the effect of the urban environment on the spatiotemporal pattern of taxi demand. Travel Behav. Soc. 2020, 18, 29–36. [Google Scholar] [CrossRef]
- Lim, C.; Kim, K.J.; Maglio, P.P. Smart cities with big data: Reference models, challenges, and considerations. Cities 2018, 82, 86–99. [Google Scholar] [CrossRef]
- Wang, Z.; Liu, S.; Zhang, Y.; Gong, X.; Li, S.; Liu, D.; Chen, N. Exploring the relative importance and interactive impacts of explanatory variables of the built environment on ride-hailing ridership by using the optimal parameter-based geographical detector (OPGD) model. Appl. Sci. 2023, 13, 2180. [Google Scholar] [CrossRef]
- Xie, Y.; Fu, X.; Long, Y.; Pei, M. Identifying Urban functional regions: A multi-dimensional framework approach integrating metro smart card data and car-hailing data. Environ. Plan. Urban Anal. City Sci. 2024, 52, 23998083241267370. [Google Scholar] [CrossRef]
- Ye, Q.; Chen, X.; Zhang, H.; Ozbay, K.; Zuo, F. Public concerns and response pattern toward shared mobility security using social media data. In Proceedings of the 2019 IEEE Intelligent Transportation Systems Conference (ITSC), Auckland, New Zealand, 27–30 October 2019; pp. 619–624. [Google Scholar]
- Morshed, S.A.; Khan, S.S.; Tanvir, R.B.; Nur, S. Impact of COVID-19 pandemic on ride-hailing services based on large-scale Twitter data analysis. J. Urban Manag. 2021, 10, 155–165. [Google Scholar] [CrossRef]
- Chen, L.; Huang, J.; Jing, P.; Wang, B.; Yu, X.; Zha, Y.; Jiang, C. Changing or unchanging Chinese attitudes toward ride-hailing? A social media analytics perspective from 2018 to 2021. Transp. Res. Part A Policy Pract. 2023, 178, 103881. [Google Scholar] [CrossRef]
- Yu, H.; Peng, Z.R. Exploring the spatial variation of ridesourcing demand and its relationship to built environment and socioeconomic factors with the geographically weighted Poisson regression. J. Transp. Geogr. 2019, 75, 147–163. [Google Scholar] [CrossRef]
- Cervero, R.; Kockelman, K. Travel demand and the 3Ds: Density, diversity, and design. Transp. Res. Part D Transp. Environ. 1997, 2, 199–219. [Google Scholar] [CrossRef]
- Zhao, G.; Li, Z.; Shang, Y.; Yang, M. How does the urban built environment affect online car-hailing ridership intensity among different scales? Int. J. Environ. Res. Public Health 2022, 19, 5325. [Google Scholar] [CrossRef]
- Gao, J.; Ma, S.; Peng, B.; Zuo, J.; Du, H. Exploring the nonlinear and asymmetric influences of built environment on CO2 emission of ride-hailing trips. Environ. Impact Assess. Rev. 2022, 92, 106691. [Google Scholar] [CrossRef]
- Yin, J.; Zhao, F.; Tang, W.; Ma, J. The Nonlinear and Threshold Effect of Built Environment on Ride-Hailing Travel Demand. Appl. Sci. 2024, 14, 4072. [Google Scholar] [CrossRef]
- Ewing, R.; Cervero, R. Travel and the built environment: A synthesis. Transp. Res. Rec. 2001, 1780, 87–114. [Google Scholar] [CrossRef]
- Cordera, R.; Coppola, P.; dell’Olio, L.; Ibeas, Á. Is accessibility relevant in trip generation? Modelling the interaction between trip generation and accessibility taking into account spatial effects. Transportation 2017, 44, 1577–1603. [Google Scholar] [CrossRef]
- Sohn, K.; Shim, H. Factors generating boardings at Metro stations in the Seoul metropolitan area. Cities 2010, 27, 358–368. [Google Scholar] [CrossRef]
- Zhang, W. Does compact land use trigger a rise in crime and a fall in ridership? A role for crime in the land use–travel connection. Urban Stud. 2016, 53, 3007–3026. [Google Scholar] [CrossRef]
- Sun, B.; Ermagun, A.; Dan, B. Built environmental impacts on commuting mode choice and distance: Evidence from Shanghai. Transp. Res. Part D Transp. Environ. 2017, 52, 441–453. [Google Scholar] [CrossRef]
- Yin, C.; Shao, C.; Wang, X.; Xiong, Z. Influence of built environment on commuting mode choice considering spatial heterogeneity. J. Jilin Univ. (Eng. Technol. Ed.) 2020, 50, 543–548. [Google Scholar]
- Yu, H.; Peng, Z.R. The impacts of built environment on ridesourcing demand: A neighbourhood level analysis in Austin, Texas. Urban Stud. 2020, 57, 152–175. [Google Scholar] [CrossRef]
- Du, M.; Cheng, L.; Li, X.; Liu, Q.; Yang, J. Spatial variation of ridesplitting adoption rate in Chicago. Transp. Res. Part A Policy Pract. 2022, 164, 13–37. [Google Scholar] [CrossRef]
- Bi, H.; Ye, Z.; Zhu, H. Examining the nonlinear impacts of built environment on ridesourcing usage: Focus on the critical urban sub-regions. J. Clean. Prod. 2022, 350, 131314. [Google Scholar] [CrossRef]
- Bi, H.; Gao, H.; Li, A.; Zhu, H.; Ye, Z. Urban Spatial Aggregation Issues in Transportation: A New Homogeneity-Related Zone System. IEEE Trans. Intell. Transp. Syst. 2024, 26, 1717–1727. [Google Scholar] [CrossRef]
- Cao, Y.; Tian, Y.; Tian, J.; Liu, K.; Wang, Y. Impact of built environment on residential online car-hailing trips: Based on MGWR model. PLoS ONE 2022, 17, e0277776. [Google Scholar] [CrossRef]
- Vega-Gonzalo, M.; Aguilera-García, Á.; Gomez, J.; Vassallo, J.M. Traditional taxi, e-hailing or ride-hailing? A GSEM approach to exploring service adoption patterns. Transportation 2024, 51, 1239–1278. [Google Scholar] [CrossRef]
- Chang, H.-W.; Tai, Y.-C.; Yung-Jen Hsu, J. Context-aware taxi demand hotspots prediction. Int. J. Bus. Intell. Data Min. 2010, 5, 3–18. [Google Scholar] [CrossRef]
- Jun, M.J.; Choi, K.; Jeong, J.E.; Kwon, K.H.; Kim, H.J. Land use characteristics of subway catchment areas and their influence on subway ridership in Seoul. J. Transp. Geogr. 2015, 48, 30–40. [Google Scholar] [CrossRef]
- Ding, C.; Cao, X.J.; Næss, P. Applying gradient boosting decision trees to examine non-linear effects of the built environment on driving distance in Oslo. Transp. Res. Part A Policy Pract. 2018, 110, 107–117. [Google Scholar] [CrossRef]
- Brunsdon, C.; Fotheringham, A.S.; Charlton, M.E. Geographically weighted regression: A method for exploring spatial nonstationarity. Geogr. Anal. 1996, 28, 281–298. [Google Scholar] [CrossRef]
- Chen, C.; Feng, T.; Ding, C.; Yu, B.; Yao, B. Examining the spatial-temporal relationship between urban built environment and taxi ridership: Results of a semi-parametric GWPR model. J. Transp. Geogr. 2021, 96, 103172. [Google Scholar] [CrossRef]
- Choi, D.J.; Suh, Y.C. Geographically weighted regression on the environmental-ecological factors of human longevity. J. Korean Soc. Geospat. Inf. Sci. 2012, 20, 57–63. [Google Scholar]
- Kang, L.; Di, L.; Deng, M.; Shao, Y.; Yu, G.; Shrestha, R. Use of geographically weighted regression model for exploring spatial patterns and local factors behind NDVI-precipitation correlation. IEEE J. Sel. Top. Appl. Earth Obs. Remote Sens. 2014, 7, 4530–4538. [Google Scholar] [CrossRef]
- Videras, J. Exploring spatial patterns of carbon emissions in the USA: A geographically weighted regression approach. Popul. Environ. 2014, 36, 137–154. [Google Scholar] [CrossRef]
- Ribeiro, M.C.; Sousa, A.J.; Pereira, M.J. A coregionalization model to assist the selection process of local and global variables in semi-parametric geographically weighted poisson regression. Procedia Environ. Sci. 2015, 26, 53–56. [Google Scholar] [CrossRef]
- Yang, S.H.; Liu, F.; Song, X.D.; Lu, Y.Y.; Li, D.C.; Zhao, Y.G.; Zhang, G.L. Mapping topsoil electrical conductivity by a mixed geographically weighted regression kriging: A case study in the Heihe River Basin, northwest China. Ecol. Indic. 2019, 102, 252–264. [Google Scholar] [CrossRef]
- Oshan, T.M.; Li, Z.; Kang, W.; Wolf, L.J.; Fotheringham, A.S. mgwr: A Python implementation of multiscale geographically weighted regression for investigating process spatial heterogeneity and scale. ISPRS Int. J. Geo-Inf. 2019, 8, 269. [Google Scholar] [CrossRef]
- Liu, Z.; Li, Y.; Gruyer, D.; Zargayouna, M.; Tu, M. Exploring the spatial relationship between urban built environment and green travel: An improved semi-parametric GWR approach. Int. J. Transp. Sci. Technol. 2024, in press. [CrossRef]
- Haikou Municipal Bureau of Statistics. Statistical Communiqué of Haikou on the 2017 National Economic and Social Development. 2018. Available online: https://tjj.haikou.gov.cn/hkstjj/ndgb/201802/6818040818794c838dcf21e322e6264d.shtml (accessed on 30 January 2024).
- Li, Y.; Zhao, Q.; Wang, M. Understanding urban traffic flows in response to COVID-19 pandemic with emerging urban big data in Glasgow. Cities 2024, 154, 105381. [Google Scholar] [CrossRef]
- Chen, J.; Gao, M.; Cheng, S.; Hou, W.; Song, M.; Liu, X.; Liu, Y. Global 1 km × 1 km gridded revised real gross domestic product and electricity consumption during 1992–2019 based on calibrated nighttime light data. Sci. Data 2022, 9, 202. [Google Scholar] [CrossRef]
- Crane, K.; Livesu, M.; Puppo, E.; Qin, Y. A survey of algorithms for geodesic paths and distances. arXiv 2020, arXiv:2007.10430. [Google Scholar]
- Liu, W.; Yue, A.; Shi, W.; Ji, J.; Deng, R. An automatic extraction architecture of urban green space based on DeepLabv3plus semantic segmentation model. In Proceedings of the 2019 IEEE 4th International Conference on Image, Vision and Computing (ICIVC), Xiamen, China, 5–7 July 2019; pp. 311–315. [Google Scholar]
- Liu, M.; Fu, B.; Xie, S.; He, H.; Lan, F.; Li, Y.; Lou, P.; Fan, D. Comparison of multi-source satellite images for classifying marsh vegetation using DeepLabV3 Plus deep learning algorithm. Ecol. Indic. 2021, 125, 107562. [Google Scholar] [CrossRef]
- Wang, H.; Yu, F.; Xie, J.; Zheng, H. Road extraction based on improved DeepLabV3 plus in remote sensing image. Int. Arch. Photogramm. Remote Sens. Spat. Inf. Sci. 2022, 48, 67–72. [Google Scholar] [CrossRef]
- Sutter, J.M.; Kalivas, J.H. Comparison of forward selection, backward elimination, and generalized simulated annealing for variable selection. Microchem. J. 1993, 47, 60–66. [Google Scholar] [CrossRef]

| Categories | Variable | Description |
|---|---|---|
| Socioeconomic and Transportation Accessibility Variables | GDP | GDP Density |
| Population | Population Density | |
| Housing Price | Average housing price of the community | |
| City Center | Distance from the center point to the city center | |
| Road Mileage | Total mileage of arterial, major, minor roads, and urban branch roads | |
| Bus Stops | Number of bus stops | |
| Land-Use Variables | Healthcare | value for general hospitals, specialty hospitals, clinics, etc. |
| Companies | value for enterprises, companies, factories, etc. | |
| Education | value for universities, high schools, libraries, etc. | |
| Shopping | value for shopping centers, department stores, etc. | |
| Catering | value for restaurants, snack bars, coffee houses, etc. | |
| Living | value for post offices, courier logistics, laundromats, etc. | |
| Sports | value for fitness centers, stadiums, swimming pools, etc. | |
| Auto Repair | value for car sales, maintenance, car rentals, etc. | |
| Hotels | value for star-rated hotels, chain hotels, aparthotels, etc. | |
| Tourism | value for parks, zoos, botanical gardens, museums, etc. | |
| Entertainment | value for cinemas, game centers, dance halls, KTV, etc. | |
| Finance | value for banks, ATMs, financial companies, etc. | |
| Residential | value for office buildings, residential areas, communities, etc. | |
| Transportation | value for airports, train stations, bus stops, parking lots, etc. | |
| Streetscape Feature Variables | Buildings | Proportion of buildings in streetscape images |
| Greenery | Proportion of vegetation/green coverage in streetscape images | |
| Sky | Proportion of sky area in streetscape images | |
| Roads | Proportion of visible roads in streetscape images | |
| Traffic Control | Proportion of traffic lights, traffic signs, guardrails, etc. | |
| Sidewalks | Proportion of sidewalks in streetscape images |
| Variable | Workday | Holiday | ||||||||||||||||||
|---|---|---|---|---|---|---|---|---|---|---|---|---|---|---|---|---|---|---|---|---|
| Morning Peak | Morning Day | Evening Peak | Evening | Overnight | Morning Peak | Morning Day | Evening Peak | Evening | Overnight | |||||||||||
| Coeff. | VIF | Coeff. | VIF | Coeff. | VIF | Coeff. | VIF | Coeff. | VIF | Coeff. | VIF | Coeff. | VIF | Coeff. | VIF | Coeff. | VIF | Coeff. | VIF | |
| Population | — | — | — | — | — | — | — | — | — | — | 0.404 ** | 1.482 | 0.570 ** | 1.458 | — | — | — | — | — | — |
| Housing Price | — | — | −0.503 * | 1.114 | — | — | −0.391 | 1.115 | −0.130 ** | 1.124 | — | — | −0.480 * | 1.119 | — | — | — | — | −0.163 ** | 1.124 |
| City Center | −0.853 *** | 1.341 | −0.926 *** | 1.401 | −1.257 *** | 1.250 | −1.322 *** | 1.313 | −0.191 *** | 1.395 | −0.615 *** | 1.357 | −1.041 *** | 1.421 | −1.793 *** | 1.341 | −1.659 *** | 1.340 | −0.248 *** | 1.395 |
| Road Mileage | 0.648 ** | 1.999 | — | — | — | — | — | — | 0.214 *** | 2.031 | — | — | — | — | — | — | — | — | 0.280 *** | 2.031 |
| Bus Stops | 1.663 *** | 1.906 | 3.191 *** | 1.560 | 3.589 *** | 1.652 | 3.025 *** | 1.652 | 0.458 *** | 1.834 | 1.667 *** | 1.469 | 3.312 *** | 1.447 | 4.334 *** | 1.652 | 3.686 *** | 1.447 | 0.569 *** | 1.834 |
| Finance | — | — | 0.868 *** | 1.229 | 1.210 *** | 1.223 | 0.994 *** | 1.244 | 0.142 ** | 1.203 | — | — | 0.517 ** | 1.202 | 0.902 ** | 1.220 | 1.122 *** | 1.163 | 0.192 ** | 1.203 |
| Auto Repair | — | — | −0.455 * | 1.032 | −0.553 * | 1.032 | −0.524 * | 1.034 | −0.093 * | 1.030 | — | — | −0.441 * | 1.033 | −0.592 * | 1.032 | −0.508 | 1.025 | −0.120 * | 1.030 |
| Buildings | 1.935 *** | 2.026 | 1.928 *** | 1.707 | — | — | — | — | 0.461 *** | 1.671 | 1.678 *** | 1.817 | 1.547 *** | 1.889 | 1.100 * | 2.604 | 1.098 ** | 1.635 | 0.473 *** | 1.671 |
| Greenery | 0.499 * | 1.917 | 0.452 | 1.578 | −1.407 *** | 2.863 | −1.074 ** | 2.870 | — | — | 0.381 ** | 1.594 | — | — | — | — | — | — | — | — |
| Sky | −1.283 *** | 1.540 | −1.375 *** | 1.363 | −4.046 *** | 3.121 | −2.967 *** | 3.165 | −0.327 *** | 1.404 | −0.618 *** | 1.259 | −1.083 *** | 1.221 | −2.728 *** | 3.621 | −1.103 *** | 1.219 | −0.402 *** | 1.404 |
| Roads | — | — | — | — | 5.248 *** | 7.905 | 3.606 *** | 8.034 | — | — | — | — | — | — | 2.120 ** | 6.748 | — | — | — | — |
| Traffic Control | 0.541 ** | 1.420 | 0.953 *** | 1.408 | 0.892 ** | 1.451 | 0.716 ** | 1.451 | 0.130 * | 1.421 | — | — | 0.597 ** | 1.415 | 0.847 * | 1.423 | 0.820 ** | 1.407 | 0.150 * | 1.421 |
| Sidewalks | 0.498 * | 2.319 | — | — | — | — | — | — | — | — | — | — | — | — | — | — | — | — | — | — |
| Variable | Moran’s Index | Z-Score |
|---|---|---|
| Population | 0.665 | 31.559 *** |
| Housing Price | 0.878 | 41.208 *** |
| City Center | 0.983 | 46.047 *** |
| Road Mileage | 0.351 | 16.533 *** |
| Bus Stops | 0.333 | 15.723 *** |
| Finance | 0.286 | 13.593 *** |
| Auto Repair | 0.203 | 9.679 *** |
| Buildings | 0.573 | 26.911 *** |
| Greenery | 0.481 | 22.571 *** |
| Sky | 0.303 | 14.263 *** |
| Roads | 0.614 | 28.783 *** |
| Traffic Control | 0.246 | 11.697 *** |
| Sidewalks | 0.433 | 20.339 *** |
| Time Period | Moran’s Index | Z-Score | ||||
|---|---|---|---|---|---|---|
| OLS | SEM | SLM | OLS | SEM | SLM | |
| Workday | ||||||
| Morning Peak | 0.179 | 0.007 | 0.018 | 8.437 *** | 0.425 | 0.899 |
| Morning Day | 0.160 | −0.008 | −0.020 | 7.569 *** | −0.318 | −0.865 |
| Evening Peak | 0.183 | −0.005 | 0.001 | 8.635 *** | −0.159 | 0.111 |
| Evening | 0.142 | −0.001 | −0.006 | 6.737 *** | 0.040 | −0.183 |
| Overnight | 0.254 | 0.006 | 0.016 | 11.972 *** | 0.343 | 0.843 |
| Holiday | ||||||
| Morning Peak | 0.144 | 0.003 | 0.004 | 6.821 *** | 0.221 | 0.261 |
| Morning Day | 0.118 | −0.002 | −0.014 | 5.618 *** | −0.014 | −0.600 |
| Evening Peak | 0.109 | 0.000 | −0.009 | 5.158 *** | 0.057 | −0.338 |
| Evening | 0.105 | 0.001 | −0.008 | 5.033 *** | 0.108 | −0.286 |
| Overnight | 0.284 | 0.006 | 0.015 | 13.388 *** | 0.342 | 0.792 |
| Metrics | Models | Workday | Holiday | ||||||||
|---|---|---|---|---|---|---|---|---|---|---|---|
| Morning Peak | Morning Day | Evening Peak | Evening | Overnight | Morning Peak | Morning Day | Evening Peak | Evening | Overnight | ||
| R2 | OLS | 0.631 (0.478) | 0.595 (0.516) | 0.585 (0.508) | 0.550 (0.493) | 0.525 (0.430) | 0.647 (0.542) | 0.598 (0.548) | 0.535 (0.484) | 0.453 (0.425) | 0.493 (0.416) |
| SEM | 0.621 (0.437) | 0.583 (0.483) | 0.574 (0.480) | 0.543 (0.477) | 0.503 (0.391) | 0.644 (0.520) | 0.593 (0.539) | 0.532 (0.475) | 0.450 (0.419) | 0.464 (0.377) | |
| SLM | 0.700 (0.662) | 0.667 (0.646) | 0.659 (0.640) | 0.609 (0.592) | 0.653 (0.632) | 0.695 (0.659) | 0.644 (0.626) | 0.575 (0.560) | 0.498 (0.488) | 0.645 (0.631) | |
| GWR | 0.684 (0.498) | 0.714 (0.644) | 0.700 (0.642) | 0.692 (0.661) | 0.695 (0.646) | 0.684 (0.558) | 0.711 (0.696) | 0.708 (0.645) | 0.637 (0.604) | 0.672 (0.642) | |
| MGWR | 0.708 (0.670) | 0.730 (0.720) | 0.743 (0.718) | 0.743 (0.636) | 0.739 (0.677) | 0.753 (0.685) | 0.734 (0.707) | 0.767 (0.640) | 0.699 (0.583) | 0.721 (0.695) | |
| AIC | OLS | 3249.423 (3451.825) | 3659.376 (3760.662) | 3895.186 (3991.313) | 3733.924 (3798.738) | 1810.895 (1916.714) | 2886.347 (3040.225) | 3570.258 (3635.601) | 4100.249 (4156.637) | 4007.649 (4032.723) | 2098.582 (2179.379) |
| SEM | 3176.105 (3272.187) | 3598.441 (3642.488) | 3823.250 (3867.748) | 3688.120 (3716.736) | 1677.416 (1725.665) | 2841.113 (2929.767) | 3536.945 (3566.437) | 4073.787 (4098.941) | 3982.385 (3990.883) | 1942.843 (1974.013) | |
| SLM | 3150.248 (3238.794) | 3564.797 (3607.279) | 3801.391 (3837.524) | 3669.210 (3694.423) | 1660.456 (1706.378) | 2817.123 (2897.291) | 3513.789 (3545.224) | 4060.329 (4081.269) | 3970.760 (3980.266) | 1928.569 (1959.647) | |
| GWR | 3227.244 (3453.368) | 3601.558 (3718.567) | 3831.804 (3933.904) | 3653.714 (3719.302) | 1694.277 (1815.345) | 2877.098 (3040.669) | 3517.803 (3581.691) | 3991.538 (4074.240) | 3914.372 (3950.603) | 1987.015 (2070.072) | |
| MGWR | 3194.350 (3252.818) | 3538.801 (3547.899) | 3757.113 (3775.209) | 3575.447 (3667.173) | 1616.246 (1746.544) | 2824.211 (2894.910) | 3446.273 (3476.958) | 3893.158 (4026.761) | 3829.960 (3921.047) | 1903.229 (1905.268) | |
| Log-likelihood | OLS | −1615.712 (−1721.912) | −1819.688 (−1874.330) | −1938.593 (−1990.657) | −1856.962 (−1893.369) | −895.448 (−951.357) | −1436.174 (−1516.113) | −1775.129 (−1810.800) | −2041.125 (−2073.318) | −1995.825 (−2011.361) | −1039.291 (−1082.690) |
| SEM | −1579.052 (−1632.094) | −1789.220 (−1815.244) | −1902.625 (−1928.874) | −1834.060 (−1852.368) | −828.708 (−855.832) | −1413.556 (−1460.884) | −1758.472 (−1776.218) | −2027.893 (−2044.471) | −1983.192 (−1990.442) | −961.422 (−980.006) | |
| SLM | −1565.124 (−1614.397) | −1771.398 (−1796.639) | −1890.695 (−1912.762) | −1823.605 (−1840.212) | −819.228 (−845.189) | −1400.562 (−1443.645) | −1745.895 (−1764.612) | −2020.165 (−2034.634) | −1976.380 (−1984.133) | −953.284 (−971.824) | |
| GWR | −1568.097 (−1709.922) | −1713.791 (−1780.320) | −1839.837 (−1893.544) | −1740.765 (−1770.456) | −760.038 (−805.903) | −1402.475 (−1505.392) | −1674.759 (−1689.950) | −1898.747 (−1958.875) | −1870.498 (−1897.056) | −906.407 (−933.267) | |
| MGWR | −1544.608 (−1581.570) | −1695.489 (−1707.230) | −1792.590 (−1820.405) | −1685.285 (−1792.032) | −713.168 (−777.449) | −1327.596 (−1401.283) | −1649.221 (−1678.633) | −1829.961 (−1963.374) | −1813.594 (−1912.874) | −856.773 (−884.729) | |
| Time Period | LM-Error | LM-Lag | RLM-Error | RLM-Lag | ||||
|---|---|---|---|---|---|---|---|---|
| Value | p | Value | p | Value | p | Value | p | |
| Workday | ||||||||
| Morning Peak | 69.079 | 0.000 | 110.439 | 0.000 | 0.842 | 0.3590 | 42.201 | 0.000 |
| Morning Day | 55.470 | 0.000 | 113.420 | 0.000 | 0.981 | 0.3221 | 58.931 | 0.000 |
| Evening Peak | 72.385 | 0.000 | 112.630 | 0.000 | 0.363 | 0.5468 | 40.608 | 0.000 |
| Evening | 43.843 | 0.000 | 77.088 | 0.000 | 0.457 | 0.4991 | 33.702 | 0.000 |
| Overnight | 139.838 | 0.000 | 182.903 | 0.000 | 3.042 | 0.0811 | 46.107 | 0.000 |
| Holiday | ||||||||
| Morning Peak | 44.950 | 0.000 | 79.194 | 0.000 | 0.056 | 0.8126 | 34.300 | 0.000 |
| Morning Day | 30.343 | 0.000 | 66.847 | 0.000 | 1.365 | 0.2426 | 37.869 | 0.000 |
| Evening Peak | 25.515 | 0.000 | 47.373 | 0.000 | 0.874 | 0.3498 | 22.733 | 0.000 |
| Evening | 24.279 | 0.000 | 43.471 | 0.000 | 1.324 | 0.2498 | 20.515 | 0.000 |
| Overnight | 165.068 | 0.000 | 209.493 | 0.000 | 3.276 | 0.0703 | 47.700 | 0.000 |
| Variable | Workday | Holiday | ||||||||||||||||||
|---|---|---|---|---|---|---|---|---|---|---|---|---|---|---|---|---|---|---|---|---|
| Morning Peak | Morning Day | Evening Peak | Evening | Overnight | Morning Peak | Morning Day | Evening Peak | Evening | Overnight | |||||||||||
| MGWR | GWR | MGWR | GWR | MGWR | GWR | MGWR | GWR | MGWR | GWR | MGWR | GWR | MGWR | GWR | MGWR | GWR | MGWR | GWR | MGWR | GWR | |
| Population | — | — | — | — | — | — | — | — | — | — | 61 | 305 | 418 | 187 | — | — | — | — | — | — |
| Housing Price | — | — | 602 | 182 | — | — | 276 | 184 | 609 | 181 | — | — | 267 | 187 | — | — | — | — | 604 | 181 |
| City Center | 601 | 305 | 604 | 182 | 496 | 189 | 281 | 184 | 610 | 181 | 601 | 305 | 267 | 187 | 195 | 151 | 195 | 151 | 610 | 181 |
| Road Mileage | 610 | 305 | — | — | — | — | — | — | 125 | 181 | — | — | — | — | — | — | — | — | 125 | 181 |
| Bus Stops | 610 | 305 | 54 | 182 | 54 | 189 | 54 | 184 | 49 | 181 | 54 | 305 | 54 | 187 | 54 | 151 | 54 | 151 | 49 | 181 |
| Finance | — | — | 102 | 182 | 76 | 189 | 76 | 184 | 115 | 181 | — | — | 151 | 187 | 76 | 151 | 76 | 151 | 114 | 181 |
| Auto Repair | — | — | 610 | 182 | 610 | 189 | 610 | 184 | 610 | 181 | — | — | 610 | 187 | 421 | 151 | 610 | 151 | 610 | 181 |
| Buildings | 597 | 305 | 256 | 182 | — | — | — | — | 125 | 181 | 213 | 305 | 247 | 187 | 159 | 151 | 182 | 151 | 132 | 181 |
| Greenery | 418 | 305 | 353 | 182 | 343 | 189 | 594 | 184 | — | — | 310 | 305 | — | — | — | — | — | — | — | |
| Sky | 511 | 305 | 421 | 182 | 506 | 189 | 506 | 184 | 420 | 181 | 540 | 305 | 599 | 187 | 588 | 151 | 574 | 151 | 416 | 181 |
| Roads | — | — | — | — | 604 | 189 | 311 | 184 | — | — | — | — | — | — | 579 | 151 | — | — | — | |
| Traffic Control | 238 | 305 | 189 | 182 | 182 | 189 | 189 | 184 | 353 | 181 | — | — | 193 | 187 | 76 | 151 | 193 | 151 | 353 | 181 |
| Sidewalks | 93 | 305 | — | — | — | — | — | — | — | — | — | — | — | — | — | — | — | — | — | |
| Variable | Workday | Holiday | ||||||||||||||||||
|---|---|---|---|---|---|---|---|---|---|---|---|---|---|---|---|---|---|---|---|---|
| Morning Peak | Evening Peak | Morning Peak | Evening Peak | |||||||||||||||||
| Mean | Std | Min | Median | Max | Mean | Std | Min | Median | Max | Mean | Std | Min | Median | Max | Mean | Std | Min | Median | Max | |
| Population | – | – | – | – | – | – | – | – | – | – | 0.304 | 0.111 | 0.119 | 0.322 | 0.549 | – | – | – | – | – |
| City Center | −1.091 | 0.017 | −1.106 | −1.101 | −1.052 | −1.852 | 0.032 | −1.898 | −1.857 | −1.793 | −0.684 | 0.018 | −0.712 | −0.686 | −0.652 | −2.745 | 0.665 | −4.803 | −2.597 | −1.895 |
| Road Mileage | 0.382 | 0.029 | 0.310 | 0.388 | 0.439 | – | – | – | – | – | – | – | – | – | – | – | – | – | – | – |
| Bus Stops | 1.645 | 0.031 | 1.595 | 1.644 | 1.707 | 2.426 | 1.202 | 0.711 | 2.303 | 5.261 | 1.563 | 0.164 | 1.282 | 1.542 | 1.832 | 2.546 | 2.292 | -1.124 | 1.986 | 9.252 |
| Finance | – | – | – | – | – | 0.810 | 0.702 | −0.259 | 0.646 | 2.450 | – | – | – | – | – | 0.798 | 0.421 | 0.198 | 0.814 | 1.606 |
| Auto Repair | – | – | – | – | – | −0.258 | 0.071 | −0.410 | −0.246 | −0.110 | – | – | – | – | – | −0.396 | 0.396 | −2.531 | −0.095 | 0.338 |
| Building | 1.391 | 0.236 | 0.923 | 1.379 | 1.869 | – | – | – | – | – | 1.318 | 0.421 | 0.455 | 1.384 | 2.155 | 0.569 | 0.075 | 0.440 | 0.583 | 0.691 |
| Greenery | 0.409 | 1.086 | −1.991 | 0.124 | 4.504 | −0.447 | 1.541 | −3.985 | −0.650 | 7.374 | 0.413 | 0.739 | −1.323 | 0.287 | 3.002 | – | – | – | – | – |
| Sky | −0.972 | 0.425 | −2.040 | −0.895 | −0.426 | −2.775 | 0.062 | −2.864 | −2.785 | −2.659 | −0.518 | 0.019 | −0.563 | −0.518 | −0.474 | −2.524 | 0.070 | −2.652 | −2.518 | −2.412 |
| Roads | – | – | – | – | – | 3.838 | 0.036 | 3.760 | 3.839 | 3.911 | – | – | – | – | – | 2.801 | 0.065 | 2.686 | 2.798 | 2.911 |
| Traffic Control | 0.391 | 0.224 | 0.068 | 0.353 | 1.039 | 0.641 | 1.285 | −1.251 | 0.222 | 5.784 | – | – | – | – | – | 0.768 | 0.768 | 0.674 | 0.772 | 0.861 |
| Sidewalks | 0.393 | 1.002 | −1.301 | 0.277 | 3.591 | – | – | – | – | – | – | – | – | – | – | – | – | – | – | – |
Disclaimer/Publisher’s Note: The statements, opinions and data contained in all publications are solely those of the individual author(s) and contributor(s) and not of MDPI and/or the editor(s). MDPI and/or the editor(s) disclaim responsibility for any injury to people or property resulting from any ideas, methods, instructions or products referred to in the content. |
© 2025 by the authors. Licensee MDPI, Basel, Switzerland. This article is an open access article distributed under the terms and conditions of the Creative Commons Attribution (CC BY) license (https://creativecommons.org/licenses/by/4.0/).
Share and Cite
Bao, J.; Li, Y. Incorporating Street-View Imagery into Multi-Scale Spatial Analysis of Ride-Hailing Demand Based on Multi-Source Data. Appl. Sci. 2025, 15, 6752. https://doi.org/10.3390/app15126752
Bao J, Li Y. Incorporating Street-View Imagery into Multi-Scale Spatial Analysis of Ride-Hailing Demand Based on Multi-Source Data. Applied Sciences. 2025; 15(12):6752. https://doi.org/10.3390/app15126752
Chicago/Turabian StyleBao, Jingjue, and Ye Li. 2025. "Incorporating Street-View Imagery into Multi-Scale Spatial Analysis of Ride-Hailing Demand Based on Multi-Source Data" Applied Sciences 15, no. 12: 6752. https://doi.org/10.3390/app15126752
APA StyleBao, J., & Li, Y. (2025). Incorporating Street-View Imagery into Multi-Scale Spatial Analysis of Ride-Hailing Demand Based on Multi-Source Data. Applied Sciences, 15(12), 6752. https://doi.org/10.3390/app15126752