1. Introduction
Perovskites with the general formula Re
1−xA
xMnO
3 (Re—Nd, A—alkali metals) are materials with unique physical properties. These properties include colossal magnetoresistance (CMR), phase transitions, as well as unusual magnetic and electrical phenomena. The effect of colossal magnetoresistance is characterized by a sharp change in the material’s electrical resistance under an external magnetic field. This effect is associated with transitions between different electronic states in manganites, induced by interactions among electrons, spins, and the crystal lattice. The perovskite structure promotes these phenomena due to the complex interactions between Mn
3+ and Mn
4+ ions and their spin states, as well as the ratio between rare-earth and alkali ions. By varying the composition and content of rare-earth and alkali elements, the physical properties of these materials can be controlled, making them promising for applications in spintronics, sensors, and other electronic devices [
1,
2,
3,
4].
The study [
5] describes the synthesis and investigation of Nd
2NiMnO
6, a representative of the double perovskite family, known for its complex structural and magnetic properties. Sample preparation via the solid-state reaction method allows for the control of the phase composition and stoichiometry, which is crucial for studying its physical properties. A combination of X-ray and neutron diffraction provides detailed insights into the crystal structure, while X-ray photoelectron spectroscopy (XPS) delivers information on the valence state and chemical environment of the atoms. XPS results reveal the presence of mixed valence states of the transition metal ions in the samples, leading to intricate interactions between Ni and Mn. This, in turn, can influence the material’s magnetic properties, such as the Curie temperature and magnetic anisotropy. Furthermore, the mixed valence states may contribute to electron transfer, which is essential for understanding the conductivity and magnetoresistance of Nd
2NiMnO
6.
The synthesis of the double perovskite La
1.95Ca
0.05BMnO
6 (where B = Ni and Co) via the sol–gel method yielded samples with a monoclinic crystal structure, confirmed through X-ray diffraction and Rietveld analysis. The lattice parameters, unit cell volume, and crystallite size increase with the ionic radius of the B-site ion, potentially influencing magnetic properties and phase transition behavior. The observed phase transitions from the paramagnetic (PM) to ferromagnetic (FM) state at 275 K and 201 K for La
1.95Ca
0.05NiMnO
6 and La
1.95Ca
0.05CoMnO
6, respectively, indicate the significant impact of the type of transition metal on the material’s magnetic ordering [
6].
The compound La
0.67Ca
0.33Mn
1−xNixO
3 (0 ≤ x ≤ 0.3) was synthesized via a solid-state reaction at low temperatures, followed by annealing in air. The resulting materials were analyzed using thermogravimetry and differential scanning calorimetry, X-ray powder diffraction, and scanning electron microscopy [
7].
The study [
8] conducted an in-depth investigation of the impact of monovalent doping on the magnetocaloric properties of manganites Nd
0.6Sr
0.4−xM
xMnO
3 (x = 0.0, 0.1; M = K, Na), synthesized via the sol–gel method. The charge differences among Sr, K, and Na influence the Mn
4+/Mn
3+ ratio, causing significant fluctuations in Nd
0.6Sr
0.4MnO
3 manganite. Various approaches were used to obtain critical parameters, which were shown to align with values predicted by the tricritical mean field. A second-order phase transition from ferromagnetic to paramagnetic was observed at the Curie temperature. The study highlights that substances doped with monovalent ions show promise for magnetic refrigeration near room temperature.
The authors synthesized and investigated the structural, magnetic, and magnetocaloric properties of nickel-doped La
0.67Ba
0.33Mn
1−xNi
xO
3 (x = 0, 0.025, and 0.075) using the sol–gel method. Nickel doping leads to a systematic decrease in the transition temperature, with a near-room-temperature T
C (302 K) achieved at the composition x = 0.075, making it a promising candidate for magnetic refrigeration near room temperature [
9].
The ceramics La
0.6Ba
0.2Sr
0.2Mn
1−xNi
xO
3 (x = 0.00, 0.05, and 0.1) were synthesized via the sol–gel method in [
10]. The Rietveld method identified a rhombohedral phase with space group R c. Based on isothermal magnetization measurements at T
C, the magnetocaloric effects (MCE) were calculated, with maximum entropy change values (−ΔSM) of 7.40 J kg
−1K
−1, 5.6 J kg
−1K
−1, and 4.48 J kg
−1K
−1. The La
0.6Ba
0.2Sr
0.2Mn
1−xNi
xO
3 (0 ≤ x ≤ 0.1) samples are proposed for use in magnetic refrigeration technology at temperatures above room temperature.
In the system of solid solutions Pr
0.9(Na
1−xK
x)
0.1MnO
3, the effect of cation size mismatch at the A-site with constant manganese valence on the structural and magnetic properties of the perovskite-type rare-earth manganite (0 ≤ x < 1) was studied. The influence of mixed alkali metal substitution on the structural and magnetic properties of Pr
0.9(Na
1−xK
x)
0.1MnO
3 manganites was analyzed. The results indicate that an increase in potassium (K) content leads to an increase in unit cell volume and a reduction in static Jahn–Teller distortion [
11].
The advantages of perovskites include their low cost and non-toxic nature, making compounds with a perovskite structure promising materials. The introduction of a dopant, such as nickel oxide, into the manganite structure opens up possibilities for creating new materials with multifunctional properties, which can serve as a basis for the development of novel technical applications.
Nickel manganite rare-earth metals are complex oxide compounds in which rare-earth elements (e.g., Nd) are combined with nickel (Ni) and manganese (Mn) in a perovskite-like crystal structure. These materials have garnered attention due to their unique physical properties, including magnetic, electrical, and catalytic characteristics. The introduction of various cations can distort the structure, affecting the material’s physical properties. This approach opens up new opportunities for the application of these materials in advanced technological devices. Moreover, the use of modern synthesis and analysis techniques enables the acquisition of detailed information about the structure and properties of perovskites.
Nickel manganites exhibit metallic or semiconducting conductivity depending on their composition and temperature. Their electrical properties can be tuned through cation substitution and oxygen stoichiometry control, making them promising candidates for applications in electronics and spintronics.
The study focuses on investigating the physicochemical properties of perovskites doped with alkali metals Na and K, with an emphasis on thermodynamic and electrophysical parameters under phase transition conditions, as well as on examining the processes underlying anomalies in heat capacity and electrical conductivity.
Thus, research in the field of nickel manganites of rare-earth metals is actively progressing, and the synthesis of new compounds with various cation combinations opens up opportunities for obtaining materials with tailored properties, which is crucial for their potential application in modern technologies. Due to their diverse properties, nickel manganites of rare-earth metals are considered for use as catalysts, materials for fuel cells, sensors, and memory elements.
Similar compounds based on lanthanum(III) oxide, LaMe
I2NiMnO
5 (Me
I—Li, Na, K), were synthesized in the study [
12].
There are numerous technologies for synthesizing perovskite manganite samples, among which the traditional solid-state ceramic technology stands out. This method typically results in functional ceramics with specific electrical, magnetic, optical, and other properties [
13,
14]. It allows the production of materials with controlled chemical composition without the release of harmful by-products during the process.
2. Experimental Part
The purpose of this work is to obtain compounds with a set of specific physicochemical properties by performing a step-by-step synthesis of new phases from initial substances over a wide temperature range of 600–1200 °C. This involves multiple “firing–grinding” operations to ensure complete solid-phase interaction, while “removing” the reaction-inhibiting product layer from the surface of the reagents.
The initial substances, Nd2O3 (“puriss. spec.” grade, TU 48-4-523-90, 99.5%, Chem Craft, Kaliningrad, Russia), NiO (“p.a.” grade, TU 6-09-4125-80, 99.0%, LLC Granchem, Chelyabinsk, Russia), Mn2O3 (“p.a.” grade, TU 6-09-2165-77, 99%, Yugraaktiv, Rostov-on-Don, Russia), Na2CO3 (“p.a.” grade, GOST 83-79, 99.8%, BETATRADE, Ufa, Republic of Bashkortostan), and K2CO3 (“puriss.” grade, GOST 4221-76, 99.0%, RossPolymer, Moscow, Russia) were pre-calcined at 400 °C for dehydration. The stoichiometric amounts, calculated to form the final product NdMeI2NiMnO5 (MeI—Na, K), were carefully mixed and ground in an agate mortar. The thermal processing of mixtures to obtain nickel manganites includes the following steps. Transfer to crucibles and initial annealing: the mixtures are placed in alumina crucibles, pre-calcined at 600 °C, and annealed at the same temperature for 10 h. Annealing at various temperatures: 800 °C for 15 h; 1000 °C for 15 h; 1200 °C for 15 h. Cooling and reprocessing: after each temperature stage, the mixtures are cooled to room temperature. Then, mixing and grinding are performed to ensure uniform composition distribution. Low-temperature annealing: the samples are subjected to low-temperature annealing at 400 °C for 10 h. This multi-step process aims to achieve a stable structure and composition for samples of NdO-MeI2O-NiO-Mn2O3 (MeI—Na, K) for further research. As a result of the reactions occurring through direct interaction between the particles of the initial solid substances, NdNa2NiMnO5 and NdK2NiMnO5 were obtained.
The samples of nickel manganites NdNa
2NiMnO
5 and NdK
2NiMnO
5 are studied using experimental and computational X-ray diffraction methods. The identification of substances in the mixture was conducted based on their sets of interplanar spacings (d) and the relative intensities (I) of the corresponding lines on the X-ray diffractogram (
Figure 1).
As a result of X-ray analysis performed to study the phase composition using the DRON-2.0 X-ray diffractometer (Manufacturer: NPP Burevestnik, St. Petersburg, Russia, 1989) and the X-ray diffractogram indication method, the type of crystal symmetry (syngony) and lattice parameters of the target products, neodymium nickel manganites NdNa2NiMnO5 and NdK2NiMnO5, were determined.
The synthesized neodymium nickel manganites crystallize in a cubic syngony. Based on the analysis of the X-ray diffractograms of the samples, the following crystal lattice parameters were determined: NdNa
2NiMnO
5 − a = 14.26 ± 0.02 Å, V
0 = 2899.74 ± 0.06 Å
3, a number of formula units in the cell Z = 4, volume of a lattice cell per formula unit V
0 = 724.93 ± 0.01 Å
3, a calculated X-ray density ρ
roent. = 3.52 g/cm
3, a pycnometric density ρ
pick. = 3.48 ± 0.02 g/cm
3, determined using an organic liquid component as an indifferent liquid [
15]. NdK
2NiMnO
5 − a = 15.19 ± 0.02 Å, V
0 = 3504.05 ± 0.07 Å
3, Z = 4, V
0 = 876.01 ± 0.02 Å
3, ρ
roent. = 3.15 g/cm
3, ρ
pick. = 3.14 ± 0.01 g/cm
3. The reliability of the measurements is confirmed by the excellent agreement between experimental and calculated values of the parameter 10
4/d
2, as well as the consistency between theoretical and experimental density values (both pycnometric and X-ray) and the unit cell parameters. This agreement demonstrates the high accuracy of the performed studies and validates the correctness of the methodology (
Table 1).
The analysis of X-ray diffraction data for NdNa2NiMnO5 and NdK2NiMnO5 shows that the accuracy of the experimental data lies in the fact that the difference between the calculated and experimental values of 104/d2exp. and 104/d2calc. is minimal in most cases, indicating high data precision. The maximum discrepancies do not exceed 1.49% for NdNa2NiMnO5 and 1.05% for NdK2NiMnO5, which is acceptable in crystallographic studies. The most intense peaks (I/I0 = 100) are observed for NdNa2NiMnO5 at d = 2.723 Å (hkl = 731) and NdK2NiMnO5 at d = 2.723 Å (hkl = 821). This indicates a similarity in their structures and the preferential orientation of atomic planes. A comparison of the parameters for the two compounds shows similar d-values and Miller indices (hkl), confirming structural relatedness. However, slight discrepancies in d-values and intensities are noted, possibly due to the difference in atomic radii of Na and K, which affects the lattice parameters. These findings confirm the high consistency between experimental and calculated values, demonstrating the accuracy of the applied data processing methodology.
To evaluate the quality of the experimental data, parameter refinement was performed using the Rietveld method. The calculated quality factors indicate agreement between the model and the experimental data. Since the DRON-2.0 diffractometer does not support automatic calculation of these factors, the calculations were conducted manually based on experimental intensities. For NdNa
2NiMnO
5, the weighted quality factor is approximately 0.892 [
16].
The tolerance factor (tt) plays a key role in determining the stability of the crystal structure of perovskite-like compounds [
17]. The ionic radii were taken from [
18,
19]. The calculation is carried out using Goldschmidt’s formula:
where
is the effective radius of cations in the A-site position (Nd
3+, Na
+, or K
+),
is the effective radius of cations in the B-site position (Ni
2+ and Mn
3+),
is the radius of oxygen ions (O
2−), and
is the geometric coefficient for perovskite structures. The calculation of the tolerance factor according to Shannon and Goldschmidt is presented in
Table 2.
In both cases, NdNa
2NiMnO
5 and NdK
2NiMnO
5, the tolerance factor values indicate a cubic structure. The tolerance factor is a criterion for structural stability in perovskites and can range from 0.8 to 1.11 [
20].
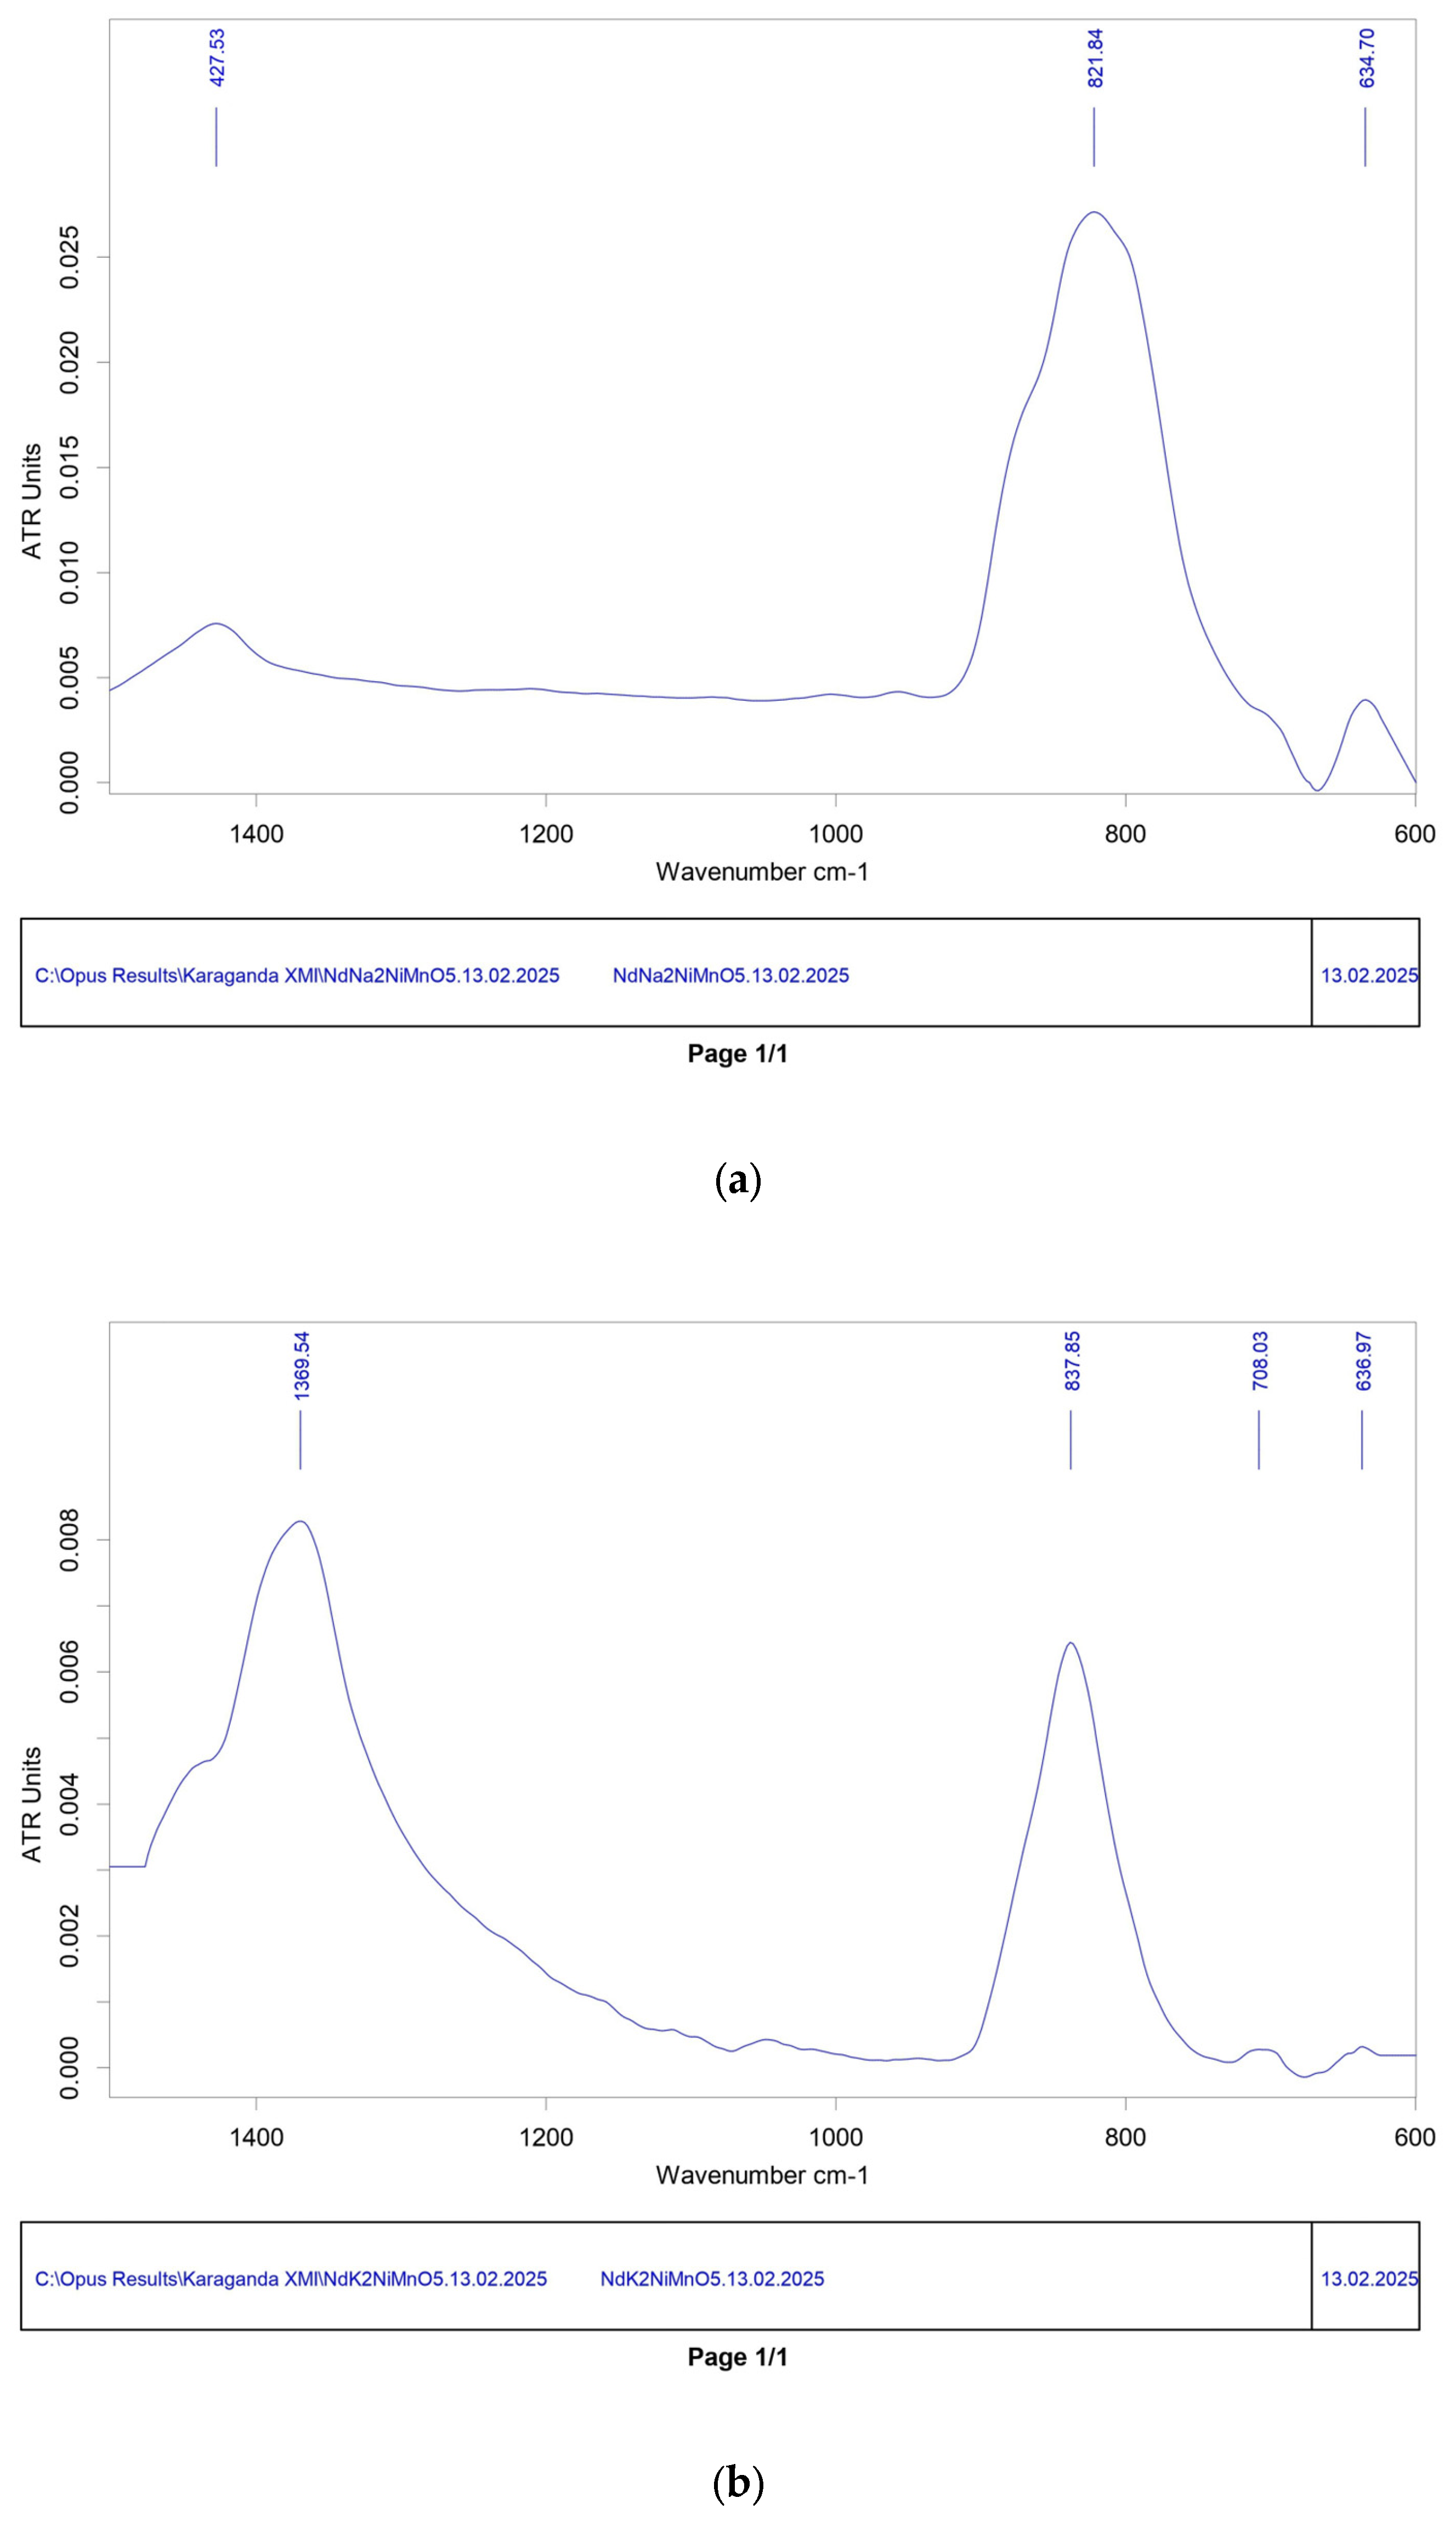
Infrared spectroscopic analysis of the compounds was carried out using the ALPHA Fourier spectrometer (Bruker, Berlin, Germany). IR spectroscopy revealed bond vibrations characteristic of Ni-O, Mn-O, Nd-O, and Na-O in NdNa2NiMnO5, as well as Ni-O, Mn-O, Nd-O, and K-O in NdK2NiMnO5, confirming the features of their crystal structures.
The IR spectrum of the NdNa
2NiMnO
5 compound: at 634.70 cm
−1, the peak may indicate vibrations of nickel–oxygen (Ni–O) or manganese–oxygen (Mn–O) bonds. Such vibrations are typically observed in the frequency range of 400 to 600 cm
−1 and might suggest deformation movements within the crystal structure. At 821.84 cm
−1, the peak could be associated with neodymium–oxygen (Nd–O) bond vibrations. Vibrations in this range often point to interactions between rare-earth elements and oxygen, potentially resulting from symmetric or asymmetric stretching within the crystal lattice. At 1427.70 cm
−1, the peak might arise from sodium–oxygen (Na–O) bond vibrations. Na–O vibrations are commonly found in higher frequency ranges and could indicate movements of light sodium ions within the crystal structure (
Figure 2a).
For the IR spectrum of the NdK
2NiMnO
5 compound, at 638.68 cm
−1, this peak may be associated with vibrations of nickel–oxygen (Ni–O) or manganese–oxygen (Mn–O) bonds. Such vibrations are typically observed in the range from 600 to 800 cm
−1 and may indicate deformation movements in the crystal structure. At 705.79 cm
−1, the peak could correspond to neodymium–oxygen (Nd–O) bond vibrations. Vibrations in this range often suggest interactions between rare-earth elements and oxygen and may involve symmetric or asymmetric stretching within the crystal lattice. At 837.85 cm
−1, this peak may also relate to Nd–O bond vibrations, potentially due to symmetric or asymmetric stretching. At 1370.25 cm
−1, the peak might indicate potassium–oxygen (K–O) bond vibrations. Such vibrations often appear in the higher frequency range, pointing to the movement of potassium ions within the crystal structure (
Figure 2b) [
21].
Thermal analysis (DTA/TGA) of NdNa
2NiMnO
5 and NdK
2NiMnO
5 was carried out using the Setaram Labsys™ Evo TG-DTA/DSC (Manufacturer: SETARAM Instrumentation, Caluire, France, 2022). This device enables simultaneous measurement of thermogravimetric (TG) and differential thermal analysis (DTA/DSC), which helps accurately determine the temperatures of phase transitions, decomposition, and other thermal effects for NdNa
2NiMnO
5 (
Figure 3).
For NdNa
2NiMnO
5,
Figure 3 presents the DTA curve of the mixture Na
2CO
3 + Nd
2O
3 + NiO + Mn
2O
3 during the formation of NdNa
2NiMnO
5. As shown in
Figure 3, the thermogravimetric curve reveals six characteristic mass-loss regions, each associated with specific processes (carbonate decomposition and target compound formation): at 30–220 °C, a gradual moisture loss (~4%) is observed, attributed to the removal of adsorbed moisture from the sample surface. At 220–400 °C, this stage involves more pronounced moisture loss (~4%). At 400–540 °C, interaction between Na
2CO
3 and oxides occurs, releasing CO
2, with a mass loss of approximately 5%. This stage also marks the initial interaction of Na
2CO
3 with oxides and possibly the formation of intermediate phases. At 540–760 °C, interaction continues with CO
2 release, leading to a 4.5% mass loss. The oxides begin reacting, initiating the formation of NdNa
2NiMnO
5. At 760–900 °C, the formation of NdNa
2NiMnO
5 progresses, accompanied by further CO
2 release and a mass loss of 5.5%. At 900–1100 °C, a sharp mass decrease is evident, corresponding to the main phase reaction for synthesizing NdNa
2NiMnO
5.
The data from differential thermal analysis (DTA) show that in the temperature range of 276–368 °C, a broad endothermic peak with a heat absorption of 110.98 J/g is observed, likely associated with the removal of adsorbed moisture. In the range of 420–510 °C (heat absorption: 34.46 J/g), the removal of residual moisture likely occurs. An endothermic peak in the range of 830–866 °C corresponds to the final stage of the formation of the target phase NdNa2NiMnO5, with heat absorption of 15.06 J/g. At this stage, the structure undergoes final ordering, resulting in the formation of the target phase. Subsequent peaks become less intense as the reaction completes its stages. These peaks align well with the mass losses observed in the TGA curve, particularly in the ranges of 220–400 °C and 760–900 °C.
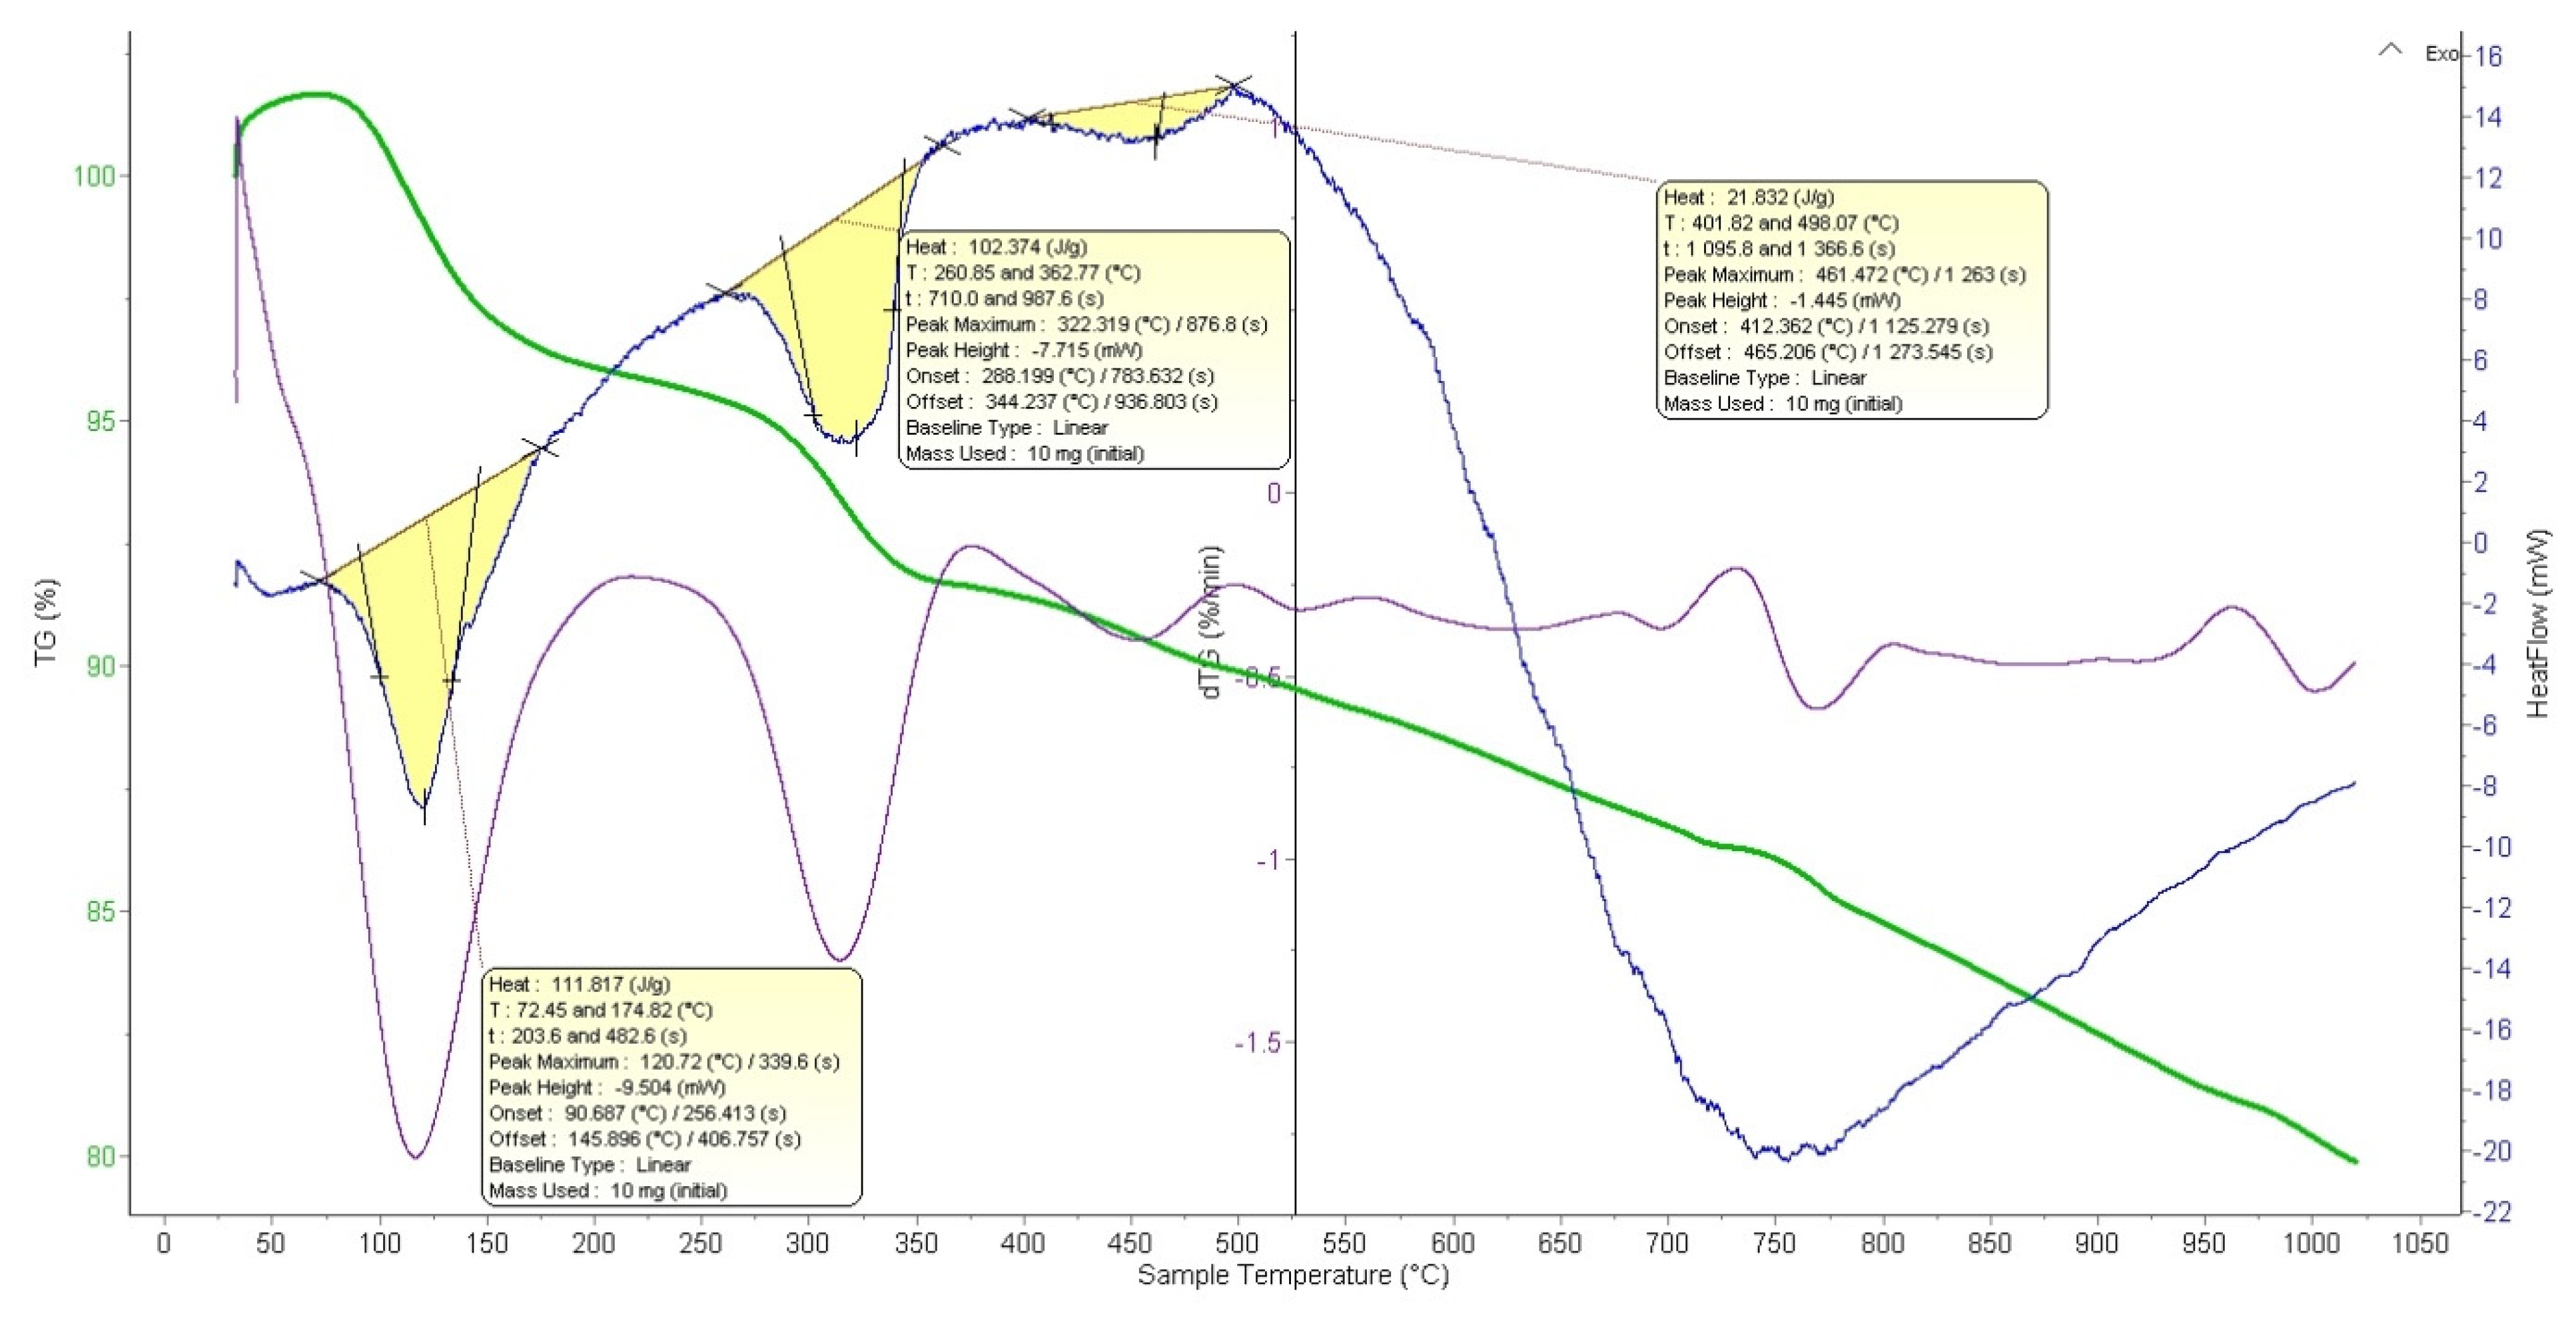
For NdK
2NiMnO
5, the thermogravimetric analysis of the reaction demonstrates that the primary mass loss occurs in several stages (
Figure 4). At 30–216 °C, a 4% total mass loss is observed, attributed to the removal of adsorbed moisture from the sample’s surface, which is typical in the initial heating stages. Up to 375 °C, decomposition of potassium carbonate (K
2CO
3) occurs with the release of CO
2, resulting in a 4.2% mass loss. At 374–500 °C (1.73%) and 500–560 °C (0.86%), the removal of crystallization moisture is completed. Up to 732 °C, active interaction of oxides (Nd
2O
3, NiO, Mn
2O
3) potentially leads to the formation of intermediate compounds and the initiation of the target phase, NdK
2NiMnO
5. A residual CO
2 release is possible, with a mass loss of approximately 2.78%. At 730–805 °C (1.67% mass loss), this likely marks the formation of NdK
2NiMnO
5. At 960 °C, the main stage of completing the solid-state reaction and final formation of the target phase occurs. This step may involve structural rearrangement and the removal of the last traces of CO
2.
The DTA curve shows three endothermic peaks associated with the main reaction processes: at 72–174 °C, a peak with an enthalpy of 111.87 J/g, corresponding to the removal of physically adsorbed and chemically bound water from the sample; at 260–362 °C, a peak with an enthalpy of 102.37 J/g, also associated with the removal of bound water; and at 401–498 °C, a peak with an enthalpy of 21.83 J/g, indicating the conclusion and initial stages of oxide interactions, resulting in the formation of intermediate phases. These endothermic processes align well with the mass losses observed in the TGA analysis.
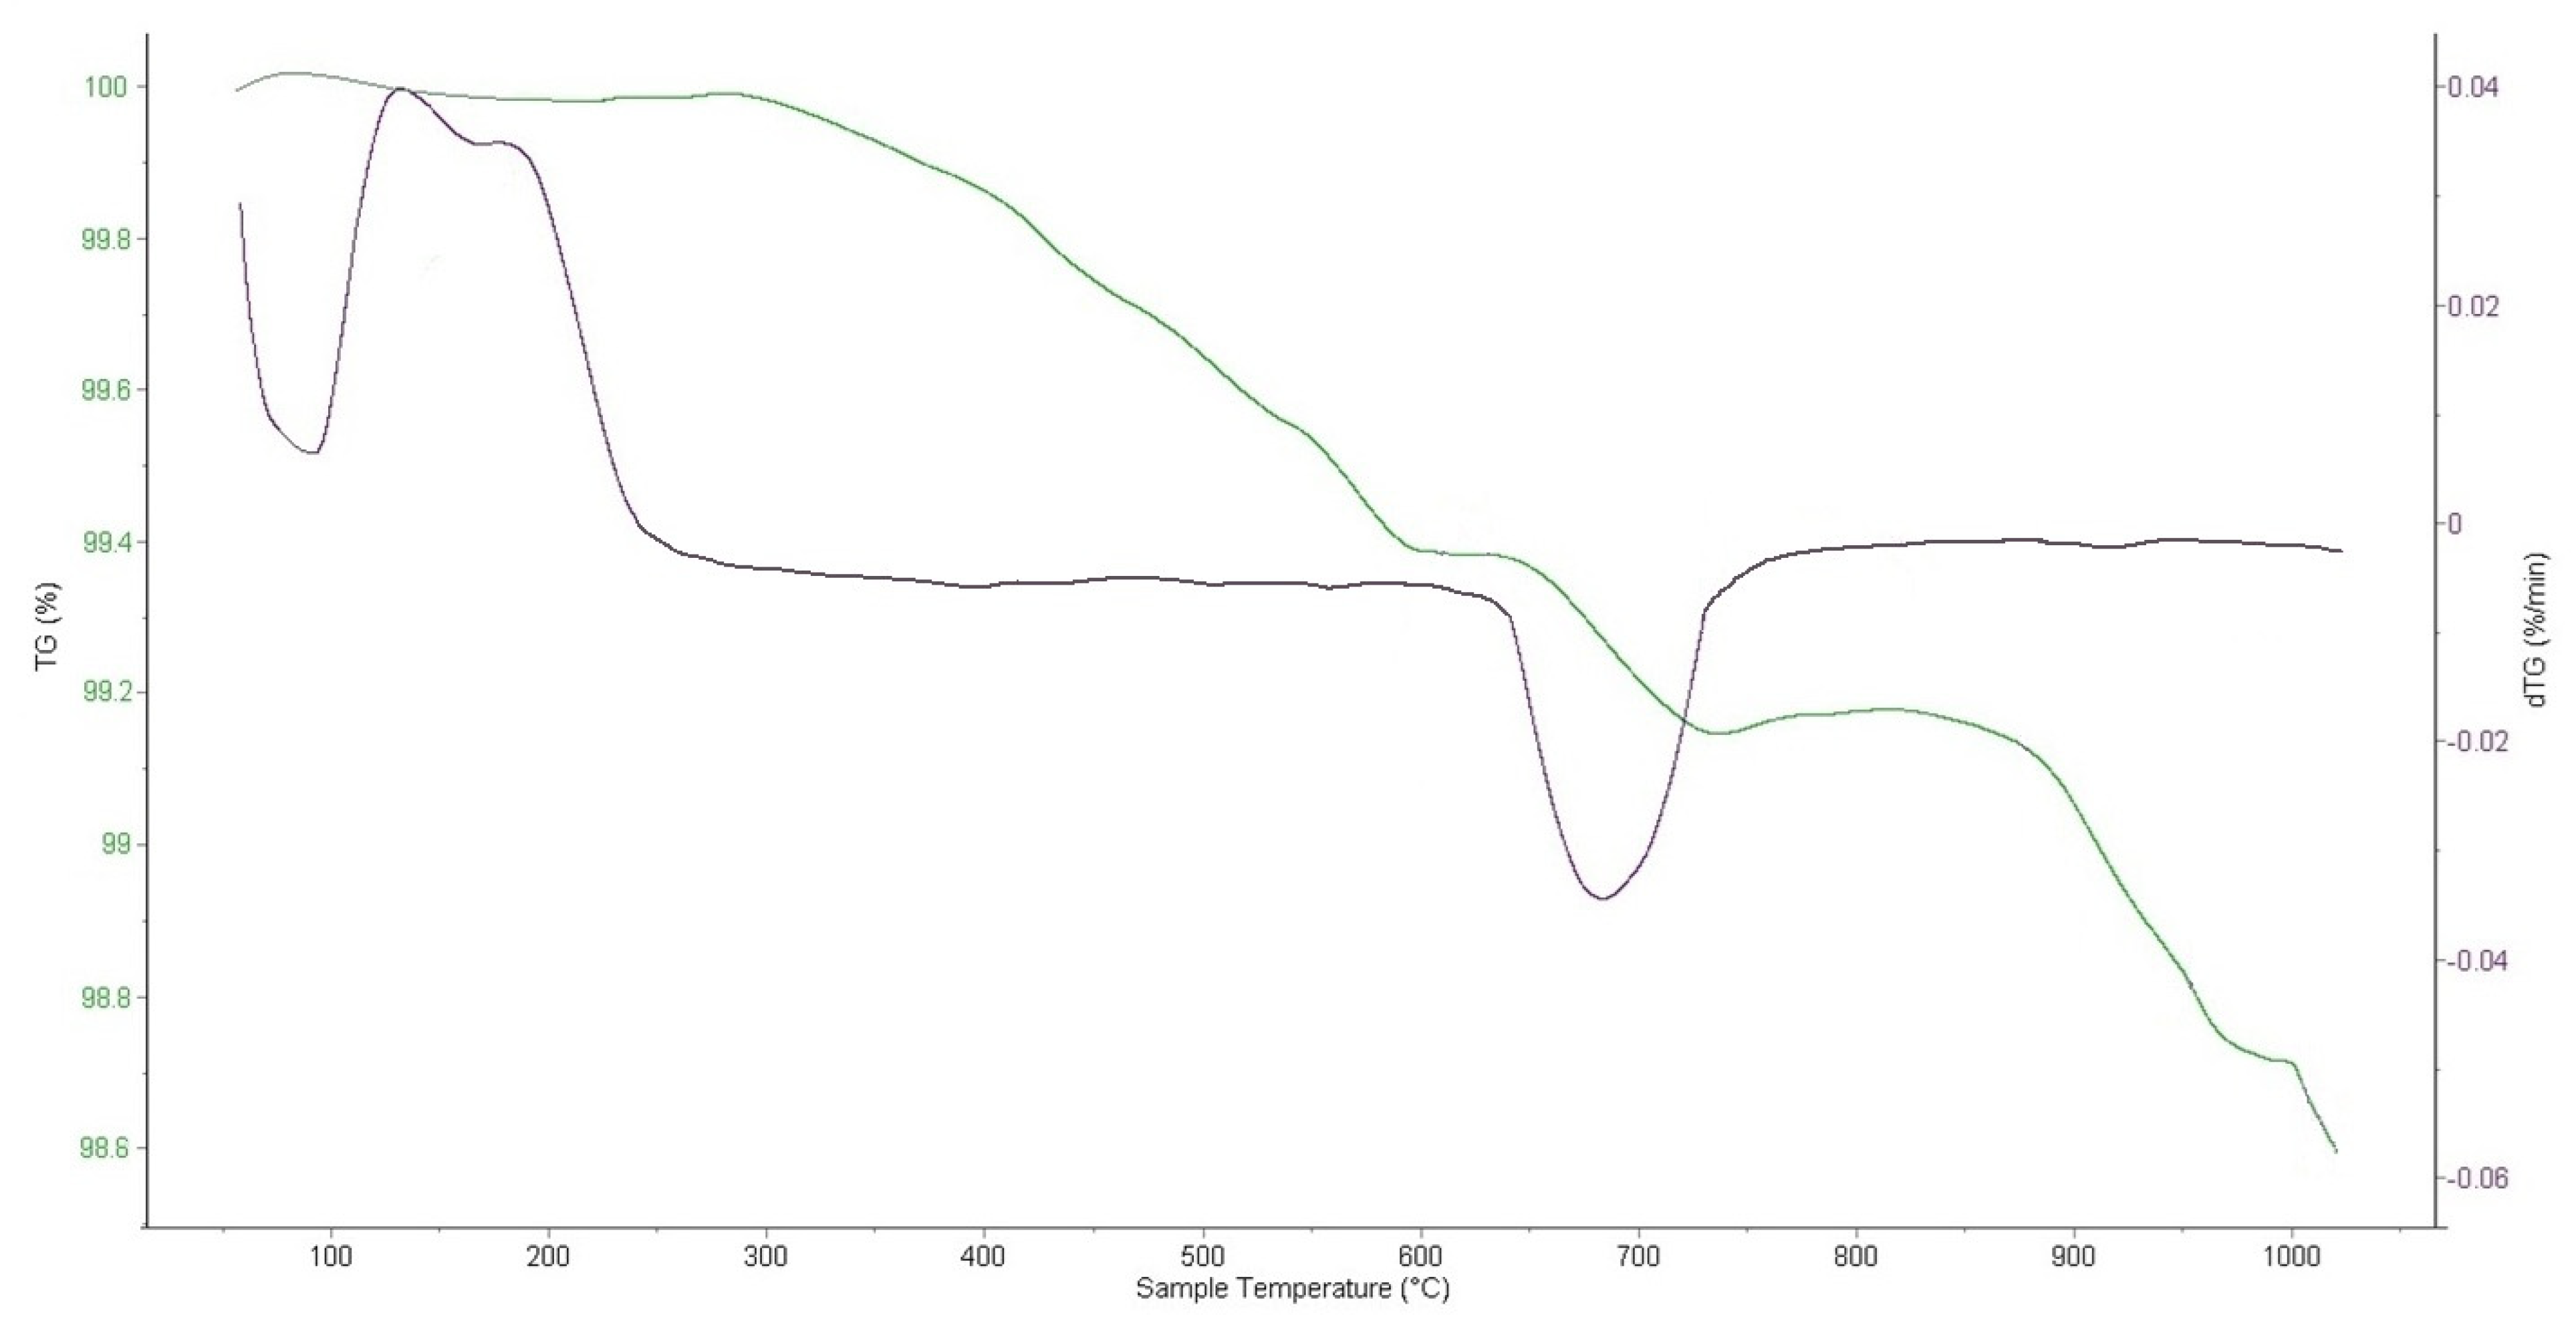
The graph in
Figure 5 presents the range between 100 and 98.6%, indicating that the weight loss compared to the total sample weight is very small, amounting to 1.4%. As shown in
Figure 5, for NdNa
2NiMnO
5, an endothermic peak is observed at 30–260 °C, associated with the removal of adsorbed water. At 620–756 °C, an exothermic effect is observed, likely corresponding to a first-order phase transition related to structural rearrangements. The compound does not decompose up to 1000 °C. A slight deviation of the TGA curve at high temperatures, around 1000 °C, is probably related to slow congruent or incongruent evaporation of the compound.
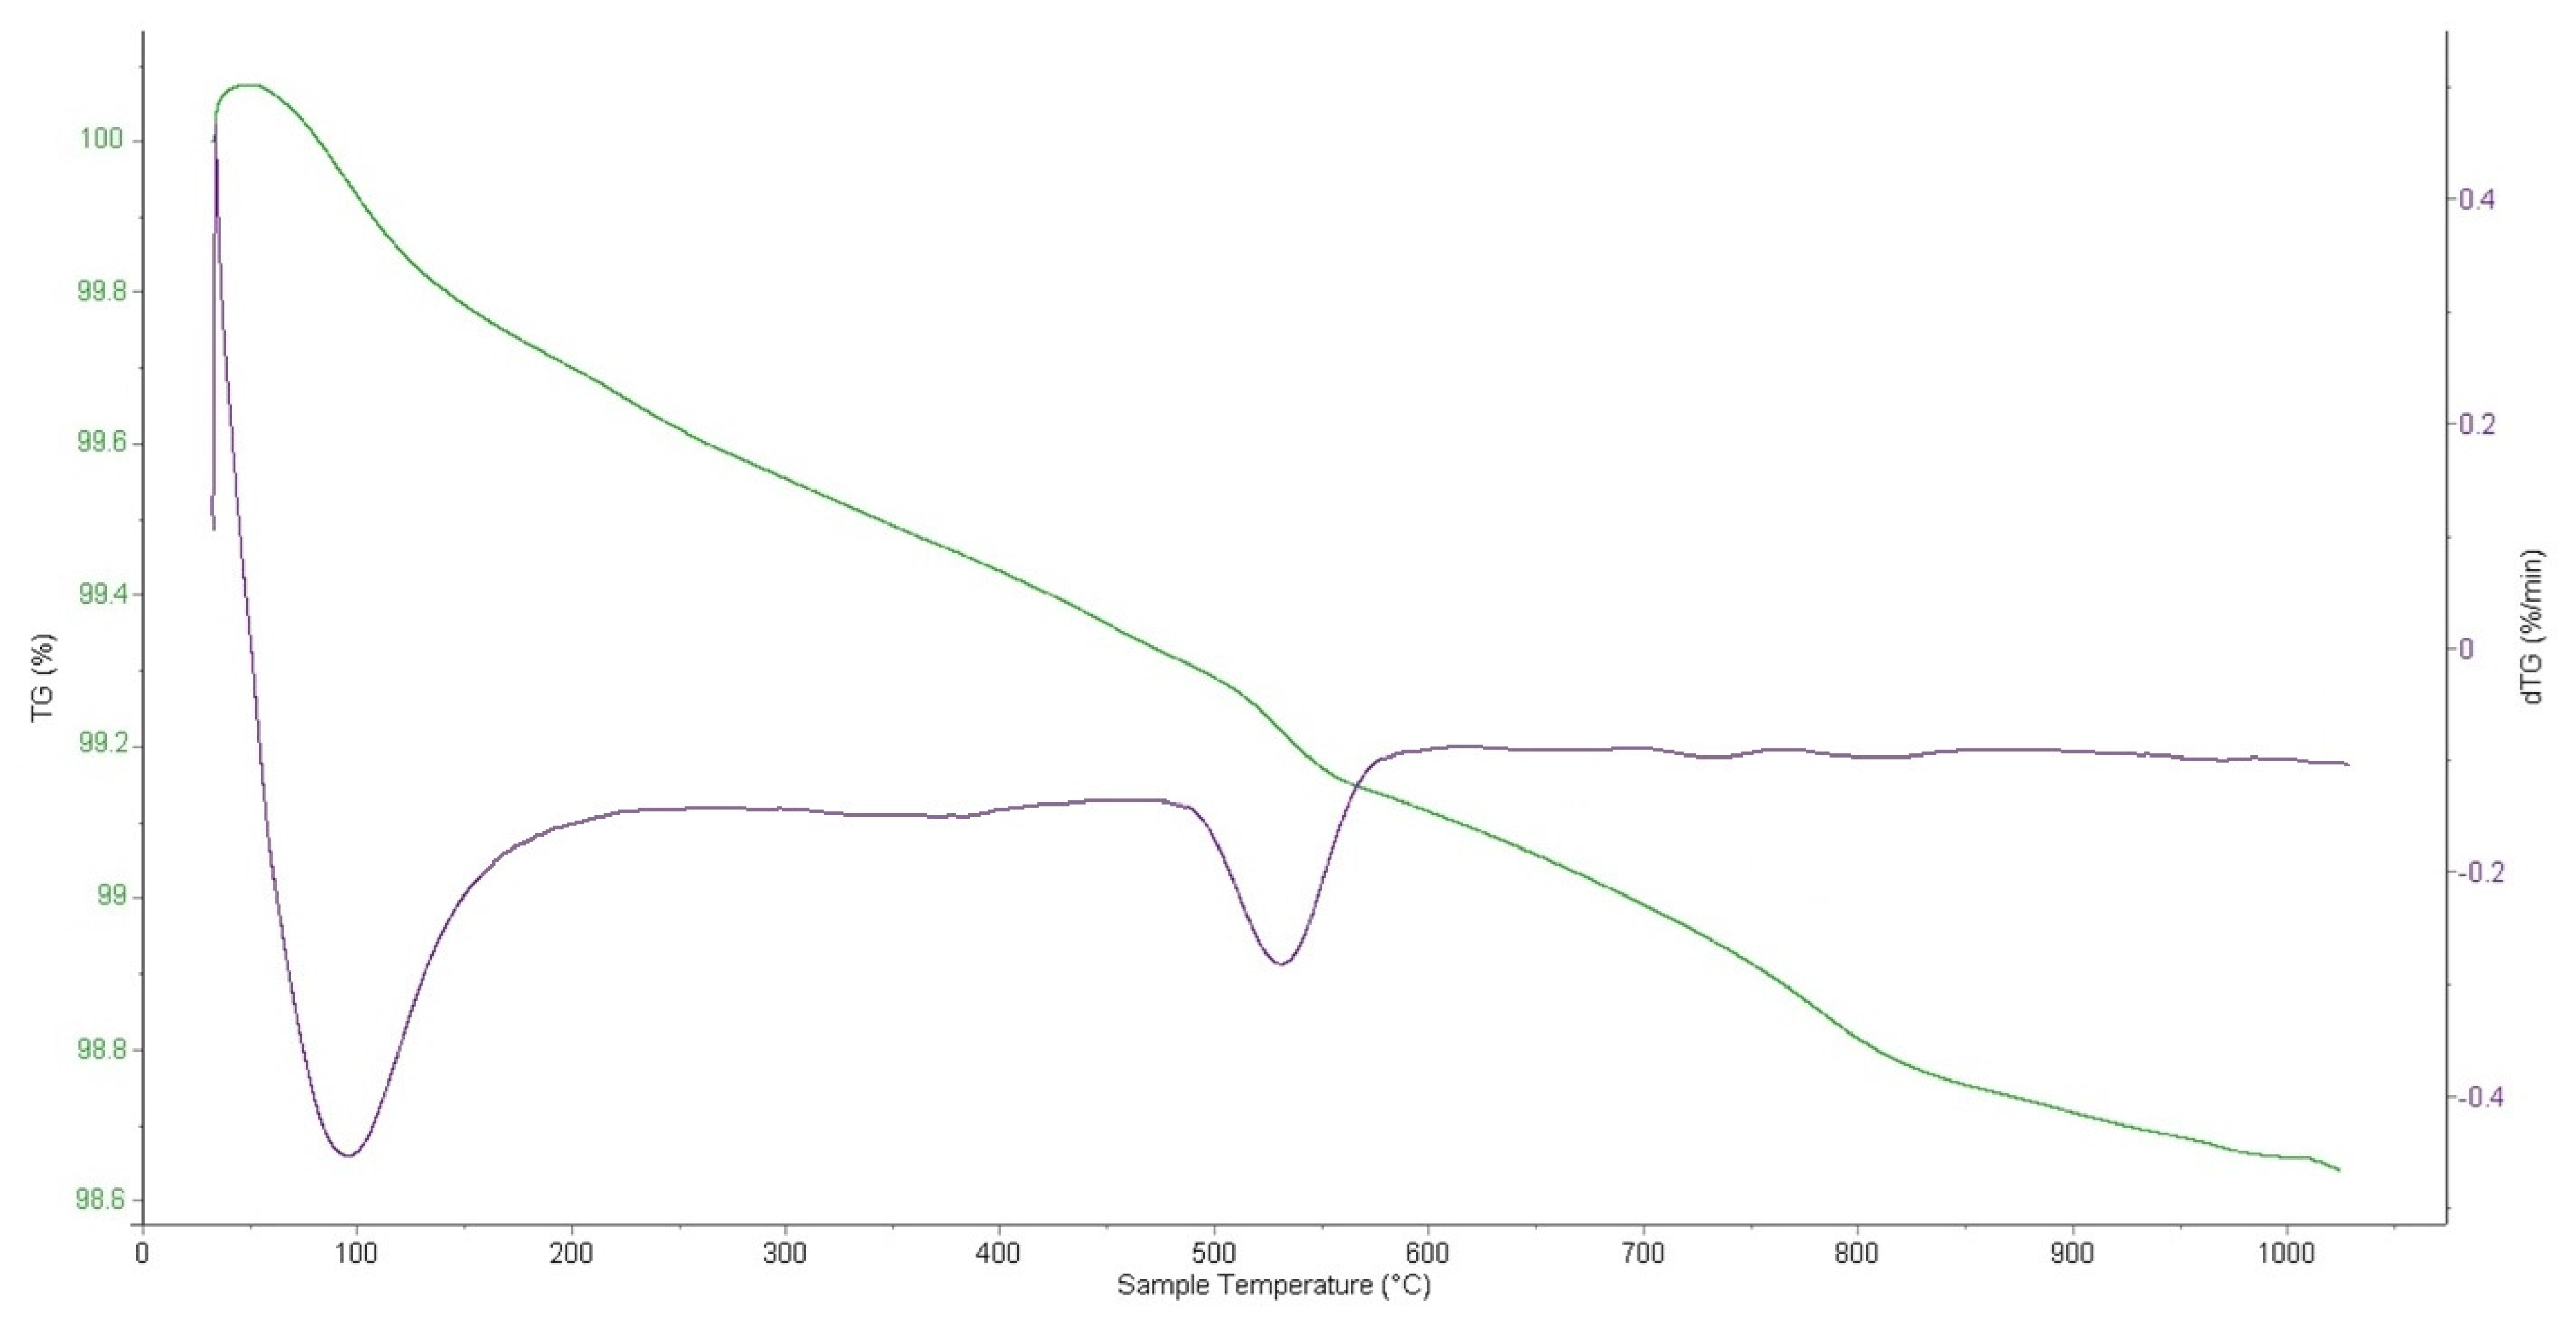
The graph in
Figure 6 presents the range between 100 and 98.6%, indicating that the weight loss compared to the total sample weight is very small, amounting to 1.4%. As shown in
Figure 6, for NdK
2NiMnO
5, a weight loss is observed in the range of 30–187 °C, caused by the removal of adsorbed moisture, accompanied by an endothermic effect. In the range of 483–581 °C, an exothermic effect is recorded, likely associated with a first-order phase transition involving structural rearrangements. The compound remains stable and does not decompose up to 1000 °C. A slight deviation of the TGA curve near this temperature is probably due to slow congruent or incongruent evaporation of the substance.
The relationship between temperature and heat capacity of NdNa
2NiMnO
5 and NdK
2NiMnO
5 compounds was studied using the IT-C-400 dynamic calorimeter (Manufacturer: Instrument-Building Plant, Aktobe, Kazakhstan, 1981). Measurements were conducted in the temperature range from 298.15 K to 673 K. It is worth noting that experimental dynamic calorimetry is a method for measuring thermal effects of chemical reactions or physical processes in real time. This technique is utilized to measure thermal effects occurring during chemical reactions or physical processes within materials. It involves continuous monitoring of the sample’s temperature during heating and cooling, allowing for the study of changes in heat capacity and other thermal properties of the material. This type of calorimetry is described in detail in [
22].
The IT-C-400 calorimeter operates based on the comparative method of dynamic calorimetry, which includes a thermocouple and an adiabatic shell. During the heating of the sample (in 25 °C increments), the F136 device and a stopwatch measure the time delay of the ampoule’s temperature relative to the base temperature. This unique feature of the instrument enables heat capacity measurements only at every 25 K up to a maximum temperature of 673 K. The initial measurement temperature (298.15 K) allows for determining the standard heat capacity of the compound, which is an important fundamental constant. The measurement range for volumetric heat capacity is no less than 1 × 10⁶ J/(K·m3), and the entire measurement process, including data processing, takes no more than 2.5 h. The measurement error does not exceed ±10%, according to the calorimeter’s technical specifications. Calibration of the instrument was performed based on the thermal conductivity data of the KT thermocouple.
The molar heat capacity was calculated based on the specific heat capacity and the molar mass. At each temperature increment of 25 K, five parallel experiments were conducted. The results were averaged and processed using methods of mathematical statistics. For the averaged values of specific heat capacity at each temperature, the standard deviation
was evaluated as described in [
23]
where
n is the number of experiments,
Ci is the measured value of specific heat capacity, and
is the arithmetic mean of the measured specific heat capacity values.
To calculate the molar heat capacity of the samples, data on specific heat capacity, along with the molar mass, were utilized. At each temperature increment of 25 K, five parallel measurements were conducted. The results were averaged and processed using mathematical statistical methods.
For the averaged values of molar heat capacity, the random component of error was calculated according to [
24]
where
is the random component of error in %, and
tp is the Student’s coefficient (for n = 5,
tp = 2.75 at a confidence interval of
p = 0.95).
Systematic errors and data reproducibility are critical aspects of scientific research. Systematic errors (e.g., weighing errors of ±0.5 × 10
−4 g, with an average relative error of approximately 1.36% in repeated calibrations with a copper sample, including instrument verification using a standard, etc.) in our case were negligible compared to the random component. According to error theory, when the random error is significantly greater than the sum of the systematic error and the instrument scale error, the accuracy of the instrument measurements will be determined by the random error [
24,
25].
Repeated calibration, error evaluation, comparison with existing results, and monitoring the stability of sample properties—all these measures not only minimize systematic errors but also ensure high data reproducibility in our studies.
Additionally, the device was tested for determining the heat capacity of α-Al2O3 (“p.a.”, TU 6.09-426-75, LenReaktiv, St. Petersburg, Russia) over a wide temperature range. The verification was carried out by conducting repeated parallel measurements in the temperature range of 173–673 K, with increments of 25 K. At each temperature point, five parallel measurements were performed. The results were then averaged and processed using statistical methods to improve accuracy. Liquid nitrogen was used as a coolant to achieve the required low temperatures and ensure stable experimental conditions.
Table 3 presents the results of calorimetric studies, showing the experimental values of the heat capacity of α-Al
2O
3 obtained during the measurements. These data provide a clear representation of the temperature dependence of heat capacity within the studied range and enable comparison with literature data [
26], confirming the accuracy and reliability of the conducted experiments.
The results of heat capacity measurements for α-Al
2O
3 in the temperature range of 173–673 K showed good agreement with the literature data [
26], taking into account the accuracy of the IT-C-400 calorimeter. To facilitate the comparison of experimental data with those in [
26], interpolation of measurements was performed. The original data from our work were presented in 25 K increments, while in [
26], the values of C
0p (heat capacity at constant pressure) are provided in increments of 10 and 50 K. Consequently, the experimental results were expressed with these intervals using the derived equation for the dependence of C
0p on temperature (C
0p~f(T)). It was also demonstrated that the actual measurement errors are significantly lower than the maximum allowable accuracy of the device, not exceeding 10%. This highlights the high reliability of the obtained data.
To study phase transitions on the C°
p~f(T) curve in neodymium manganites, the temperature dependence of the heat capacity of the standard substance barium titanate (BaTiO
3) was investigated using the same IT-C-400 calorimeter. BaTiO
3 was used in the “p.a.” qualification (TU 6-09-3963-84, LLC VitaReaktiv, Dzerzhinsk, Russia). To confirm compliance with standards, BaTiO
3 underwent X-ray phase analysis using the DRON-2.0 setup. The diffraction maxima of BaTiO
3 obtained during the experiment (4.04; 2.87; 2.35; 2.05; 1.83; 1.66; 1.44 Å) completely matched the reference values from the ASTM database [
27], indicating a high degree of purity and phase identity of the sample. The results of the heat capacity study of BaTiO
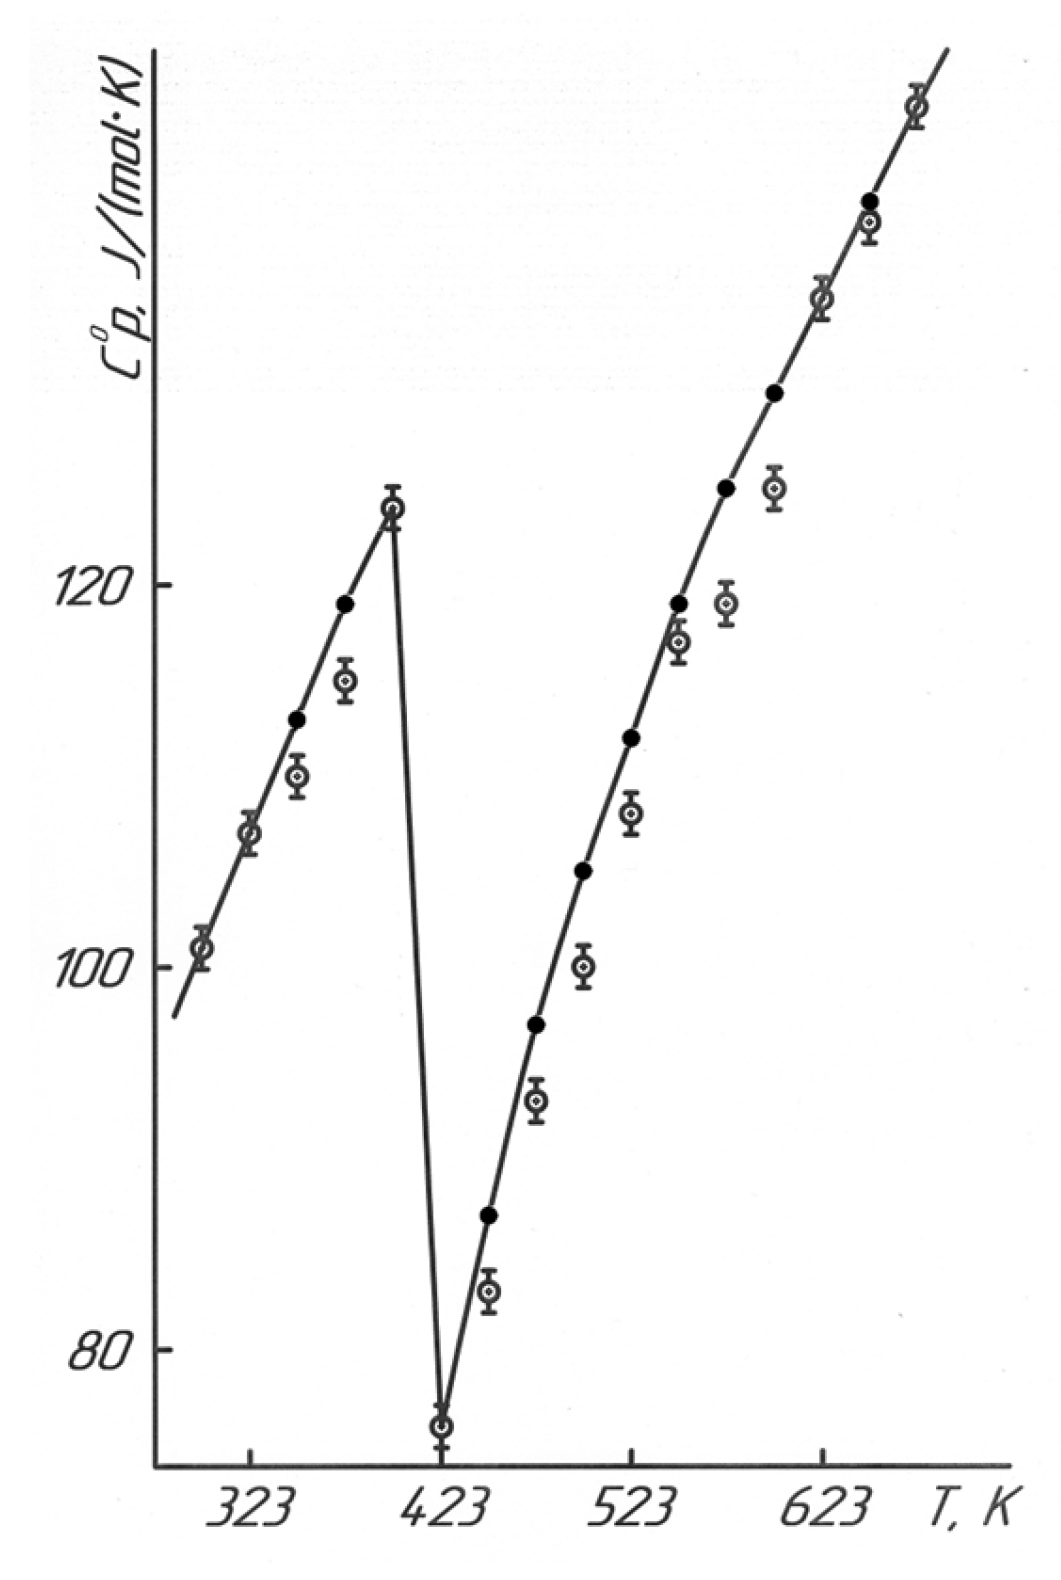
3, presented in
Table 4 and
Figure 7, cover the temperature range of 298.15–673 K. These data allow the comparison of phase transitions in BaTiO
3 with similar processes in neodymium manganites, evaluating the similarities and differences in heat capacity behavior and structural transitions between these materials.
It should be noted that the experimentally obtained standard heat capacity value for BaTiO
3, equal to 101 ± 7 J/(mol·K), aligns well with the reference value of 102.45 J/(mol·K), calculated based on the temperature dependence equation for heat capacity [J/(mol·K)] [
28]:
The experimental value of C
0p(298.15) for BaTiO
3 aligns well with its calculated value of 100.3 J/(mol·K), determined using the method of ionic entropy increments [
29] according to the scheme:
where S
iBa
2+ and S
iTiO
32− are the ionic entropy increments, equal to 28.4 and 71.9 J/(mol·K), respectively [
29].
As shown in
Figure 7 and
Table 4, BaTiO
3 exhibits a phase transition at 398 K (125 °C). According to the literature data [
19], this transition occurs at 393 K (120 °C), where the tetragonal modification of BaTiO
3 transforms into a cubic structure, reaching the Curie point. In [
19], the temperature dependence of the specific heat capacity of BaTiO
3 was also studied at heating rates of 1, 3, and 5 K/min, where the phase transition was observed at 395 K, 394.1 K, and 390.9 K, respectively. Given that the IT-C-400 calorimeter measures heat capacity in increments of only 25 K (within the range of 373–398 K), the phase transition temperature of 398 K appears to be accurate. Based on the phase transition temperature (398 K), equations were derived describing the temperature dependence of heat capacity in [J/(mol·K)].
The study of the isobaric heat capacity of NdNa
2NiMnO
5 and NdK
2NiMnO
5 samples in the range of 298.15–673 K allows for determining how the heat capacity changes at constant pressure within this temperature interval (
Table 5 and
Figure 8). This helps to refine the thermodynamic characteristics of the materials, which is essential for their practical applications and for comparison with other research data.
3. Results and Discussion
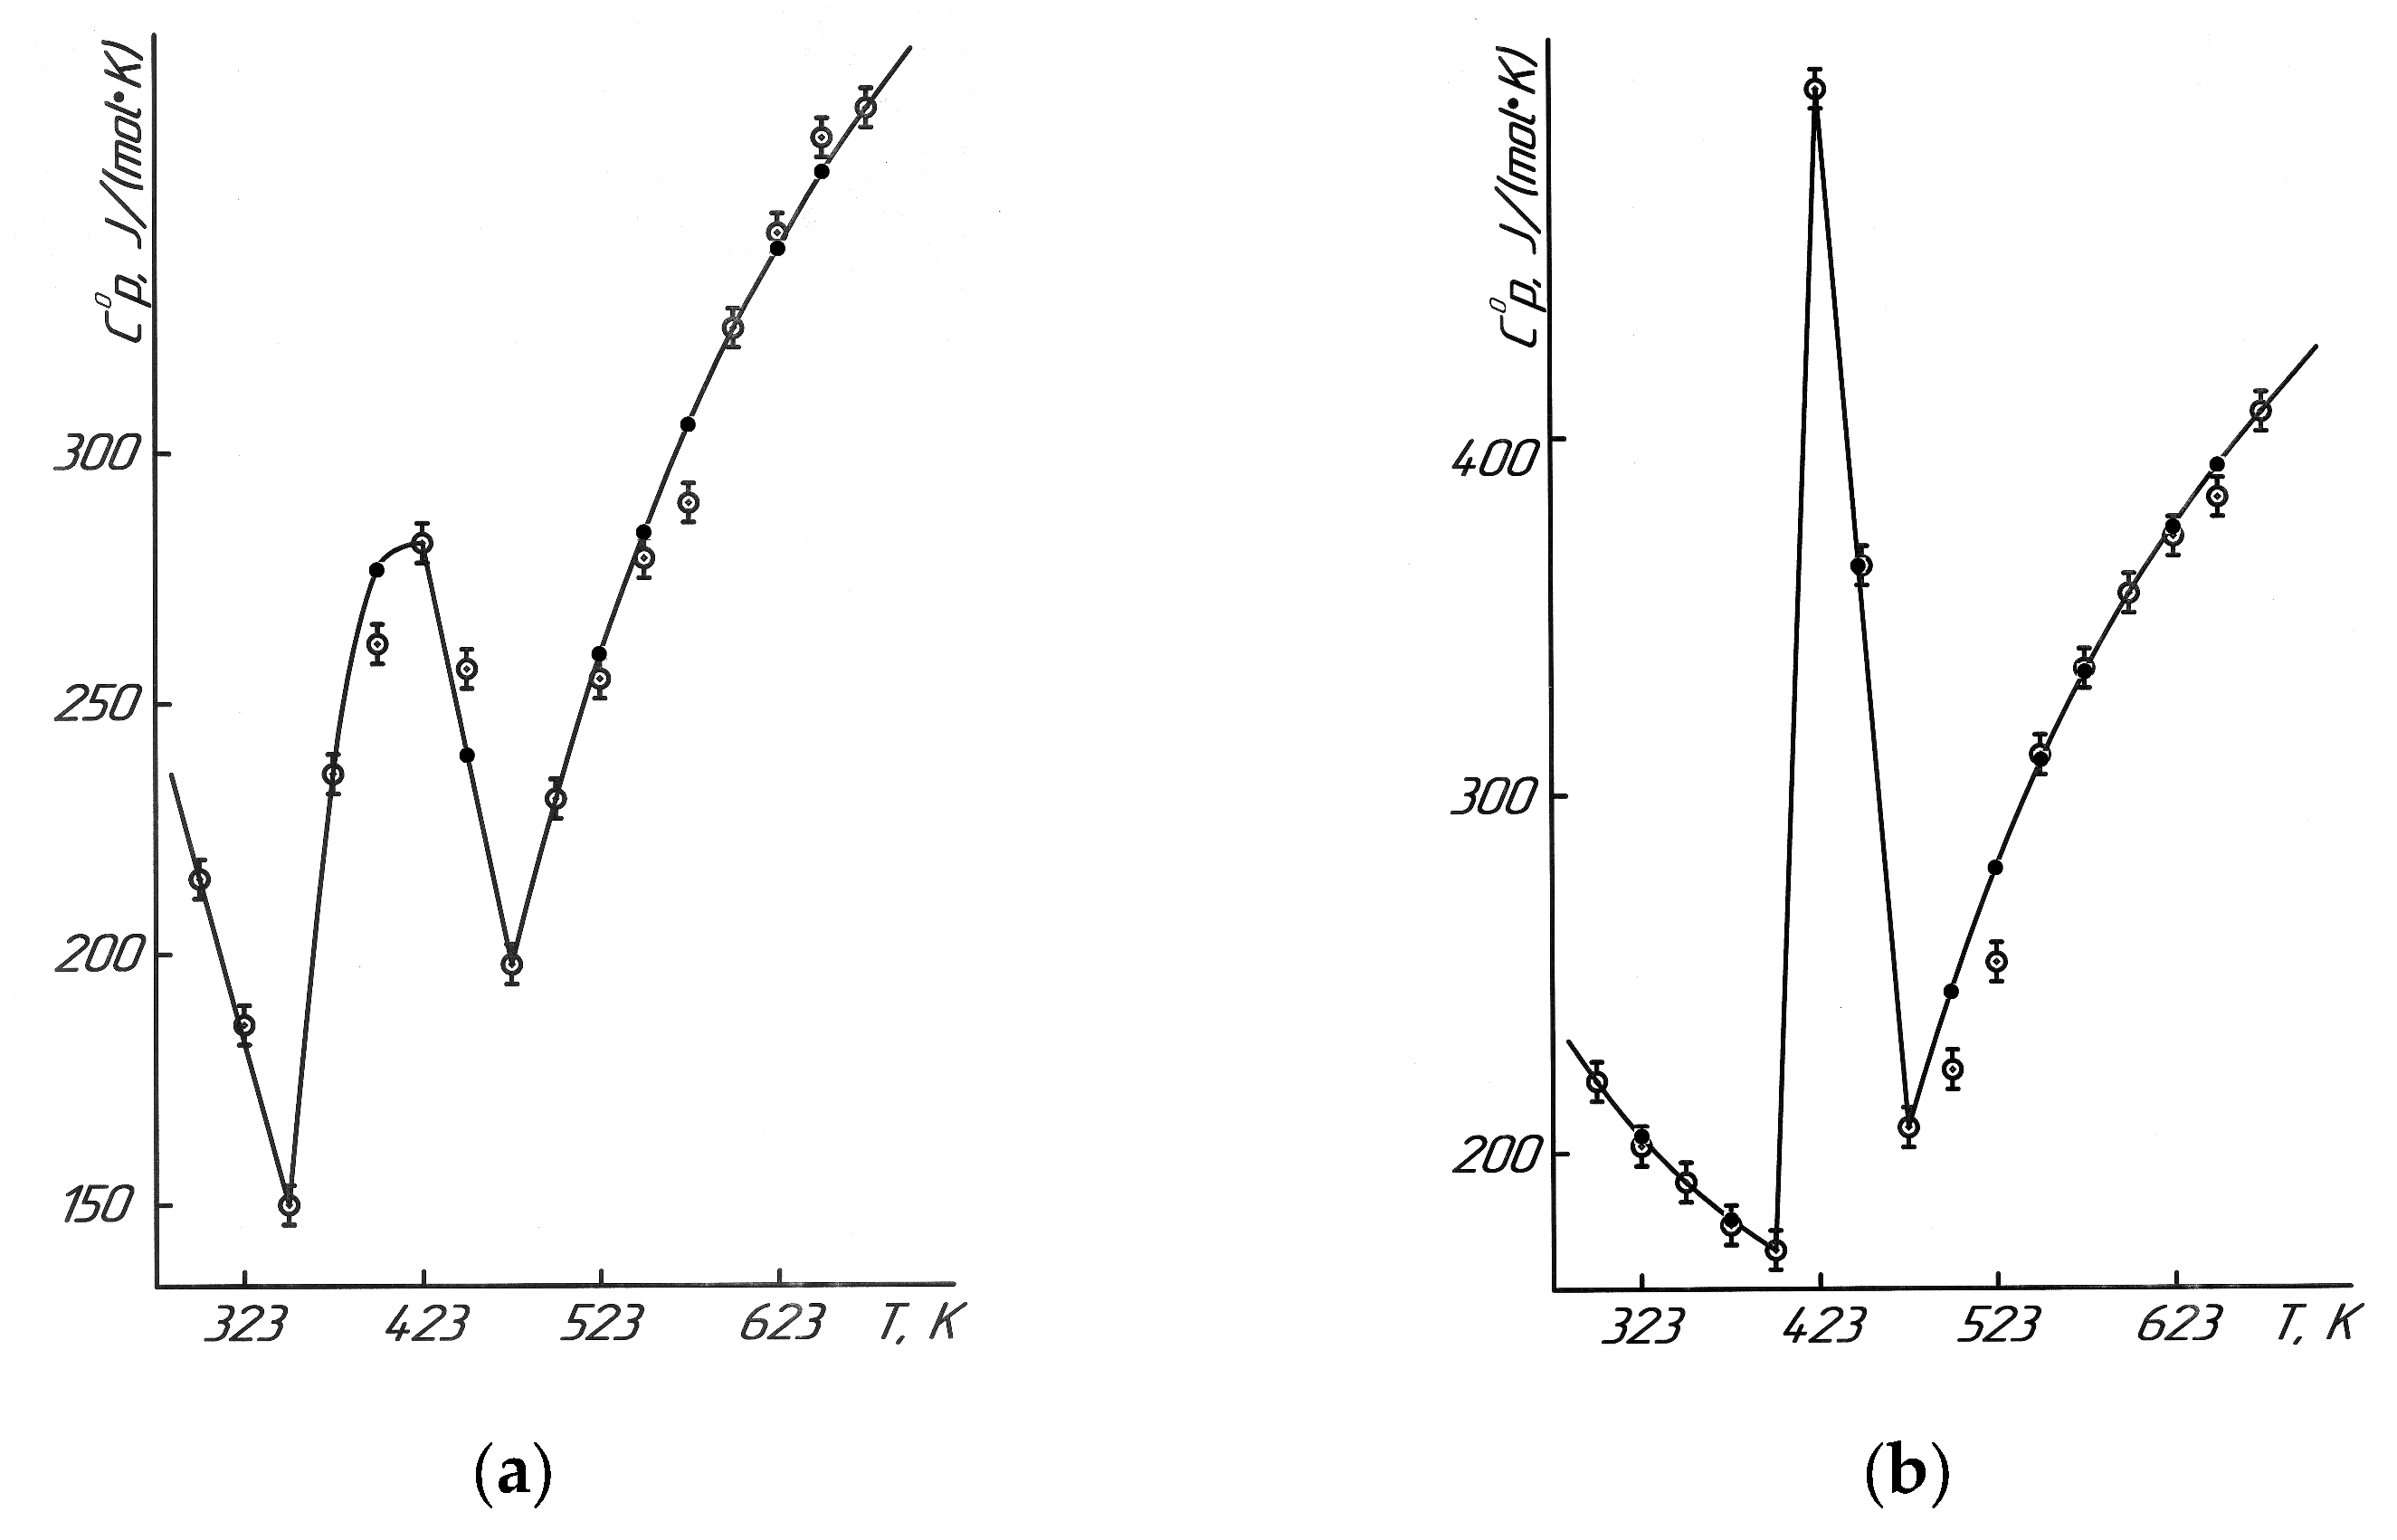
The discussion highlights that the C0p~f(T) graph for NdNa2NiMnO5 and NdK2NiMnO5 shows an anomalous jump in heat capacity at a temperature of 423 K. This jump indicates potential second-order phase transitions, which may be associated with Curie points, Néel points, or other structural changes that significantly influence the magnetic, electrical, and dielectric properties of the materials.
To ensure the accuracy of the analysis, both experimental and calculated heat capacity values are presented on the graphs, confirming their reliability.
Based on the temperatures of second-order phase transitions, equations describing the temperature dependence of heat capacity for the compounds, as detailed in
Table 6, were derived. These equations enable more precise modeling of the heat capacity behavior of the material within the studied temperature range, taking into account the phase transitions and their impact on thermodynamic properties.
The experimental data obtained were processed using the least squares method. The graphs presented in
Figure 8, illustrating the C
0p~f(T) dependence, demonstrate a good correlation between the experimental and calculated heat capacity values, confirming the adequacy of the derived equations.
The equations describing the C0p~f(T) dependencies do not all merge smoothly; some intersect sharply, forming distinct peaks. For NdNa2NiMnO5, the equations C0p(1)~f(T1) and C0p(2)~f(T2) intersect at 348 K, as this temperature corresponds to the values of both Equations (9) and (10), where C0p(1) and C0p(2) are equal. At 423 K, C0p(2)~f(T2) and C0p(3)~f(T3) intersect, with C0p(2) and C0p(3) having identical values, and so on. These graphs were generated using the “COMPAS-3D LT V12” software, which enabled the integration of experimental and calculated data for more accurate visualization of the results.
To estimate the standard entropies of the compounds, the method of ionic entropy increments [
29] was employed, yielding values of 239 ± 7 J/(mol·K) for NdNa
2NiMnO
5 and 264 ± 8 J/(mol·K) for NdK
2NiMnO
5. The following equations [
30] were used to calculate the heat capacity dependence at constant pressure (C
0p(T)) and thermodynamic functions (S
0(T), H
0(T) − H
0(298.15), and Φ
xx(T)).
A function of Φ
xx(T) has been calculated on the basis S
0(T) and H
0(T) − H
0(298.15):
These equations make it possible to calculate changes in thermodynamic properties with temperature variations based on the experimental data of heat capacity C
0p(T) (
Table 7).
The provided data represent the results of calculations for heat capacity C0p(T), entropy S0(T), enthalpy change H0(T) − H0(298.15), and the function Φxx(T) within the temperature range of 298.15–675 K. Let us consider the key conclusions drawn from these data.
At heat capacity C0p(T), for both compounds, C0p(T) increases with rising temperature, which is typical for solids. The C0p(T) value for NdNa2NiMnO5 shows minor fluctuations (phase transition temperature at 423 K) but generally rises with temperature, reaching up to 408 ± 20 J/(mol·K) at 675 K. In contrast, NdK2NiMnO5 exhibits a sharp increase at 423 K (524 ± 25 J/(mol·K)). These jumps likely indicate a second-order phase transition.
The entropy S0(T) increases with temperature for both compounds, reflecting the growing disorder in the system as it is heated. The initial values at 298.15 K are 239 ± 7 J/(mol·K) for NdNa2NiMnO5 and 264 ± 8 J/(mol·K) for NdK2NiMnO5.
The enthalpy change H0(T)−H0(298.15) increases with rising temperature, as expected, since the system absorbs energy during heating. The values of H0(T)−H0(298.15) for NdK2NiMnO5 grow faster compared to NdNa2NiMnO5.
The values of the function Φxx(T) also increase with rising temperature, indicating changes in the thermodynamic stability or reactivity of the compounds. For both compounds, this function shows a steady growth; however, the difference between the values for NdNa2NiMnO5 and NdK2NiMnO5 is minimal.
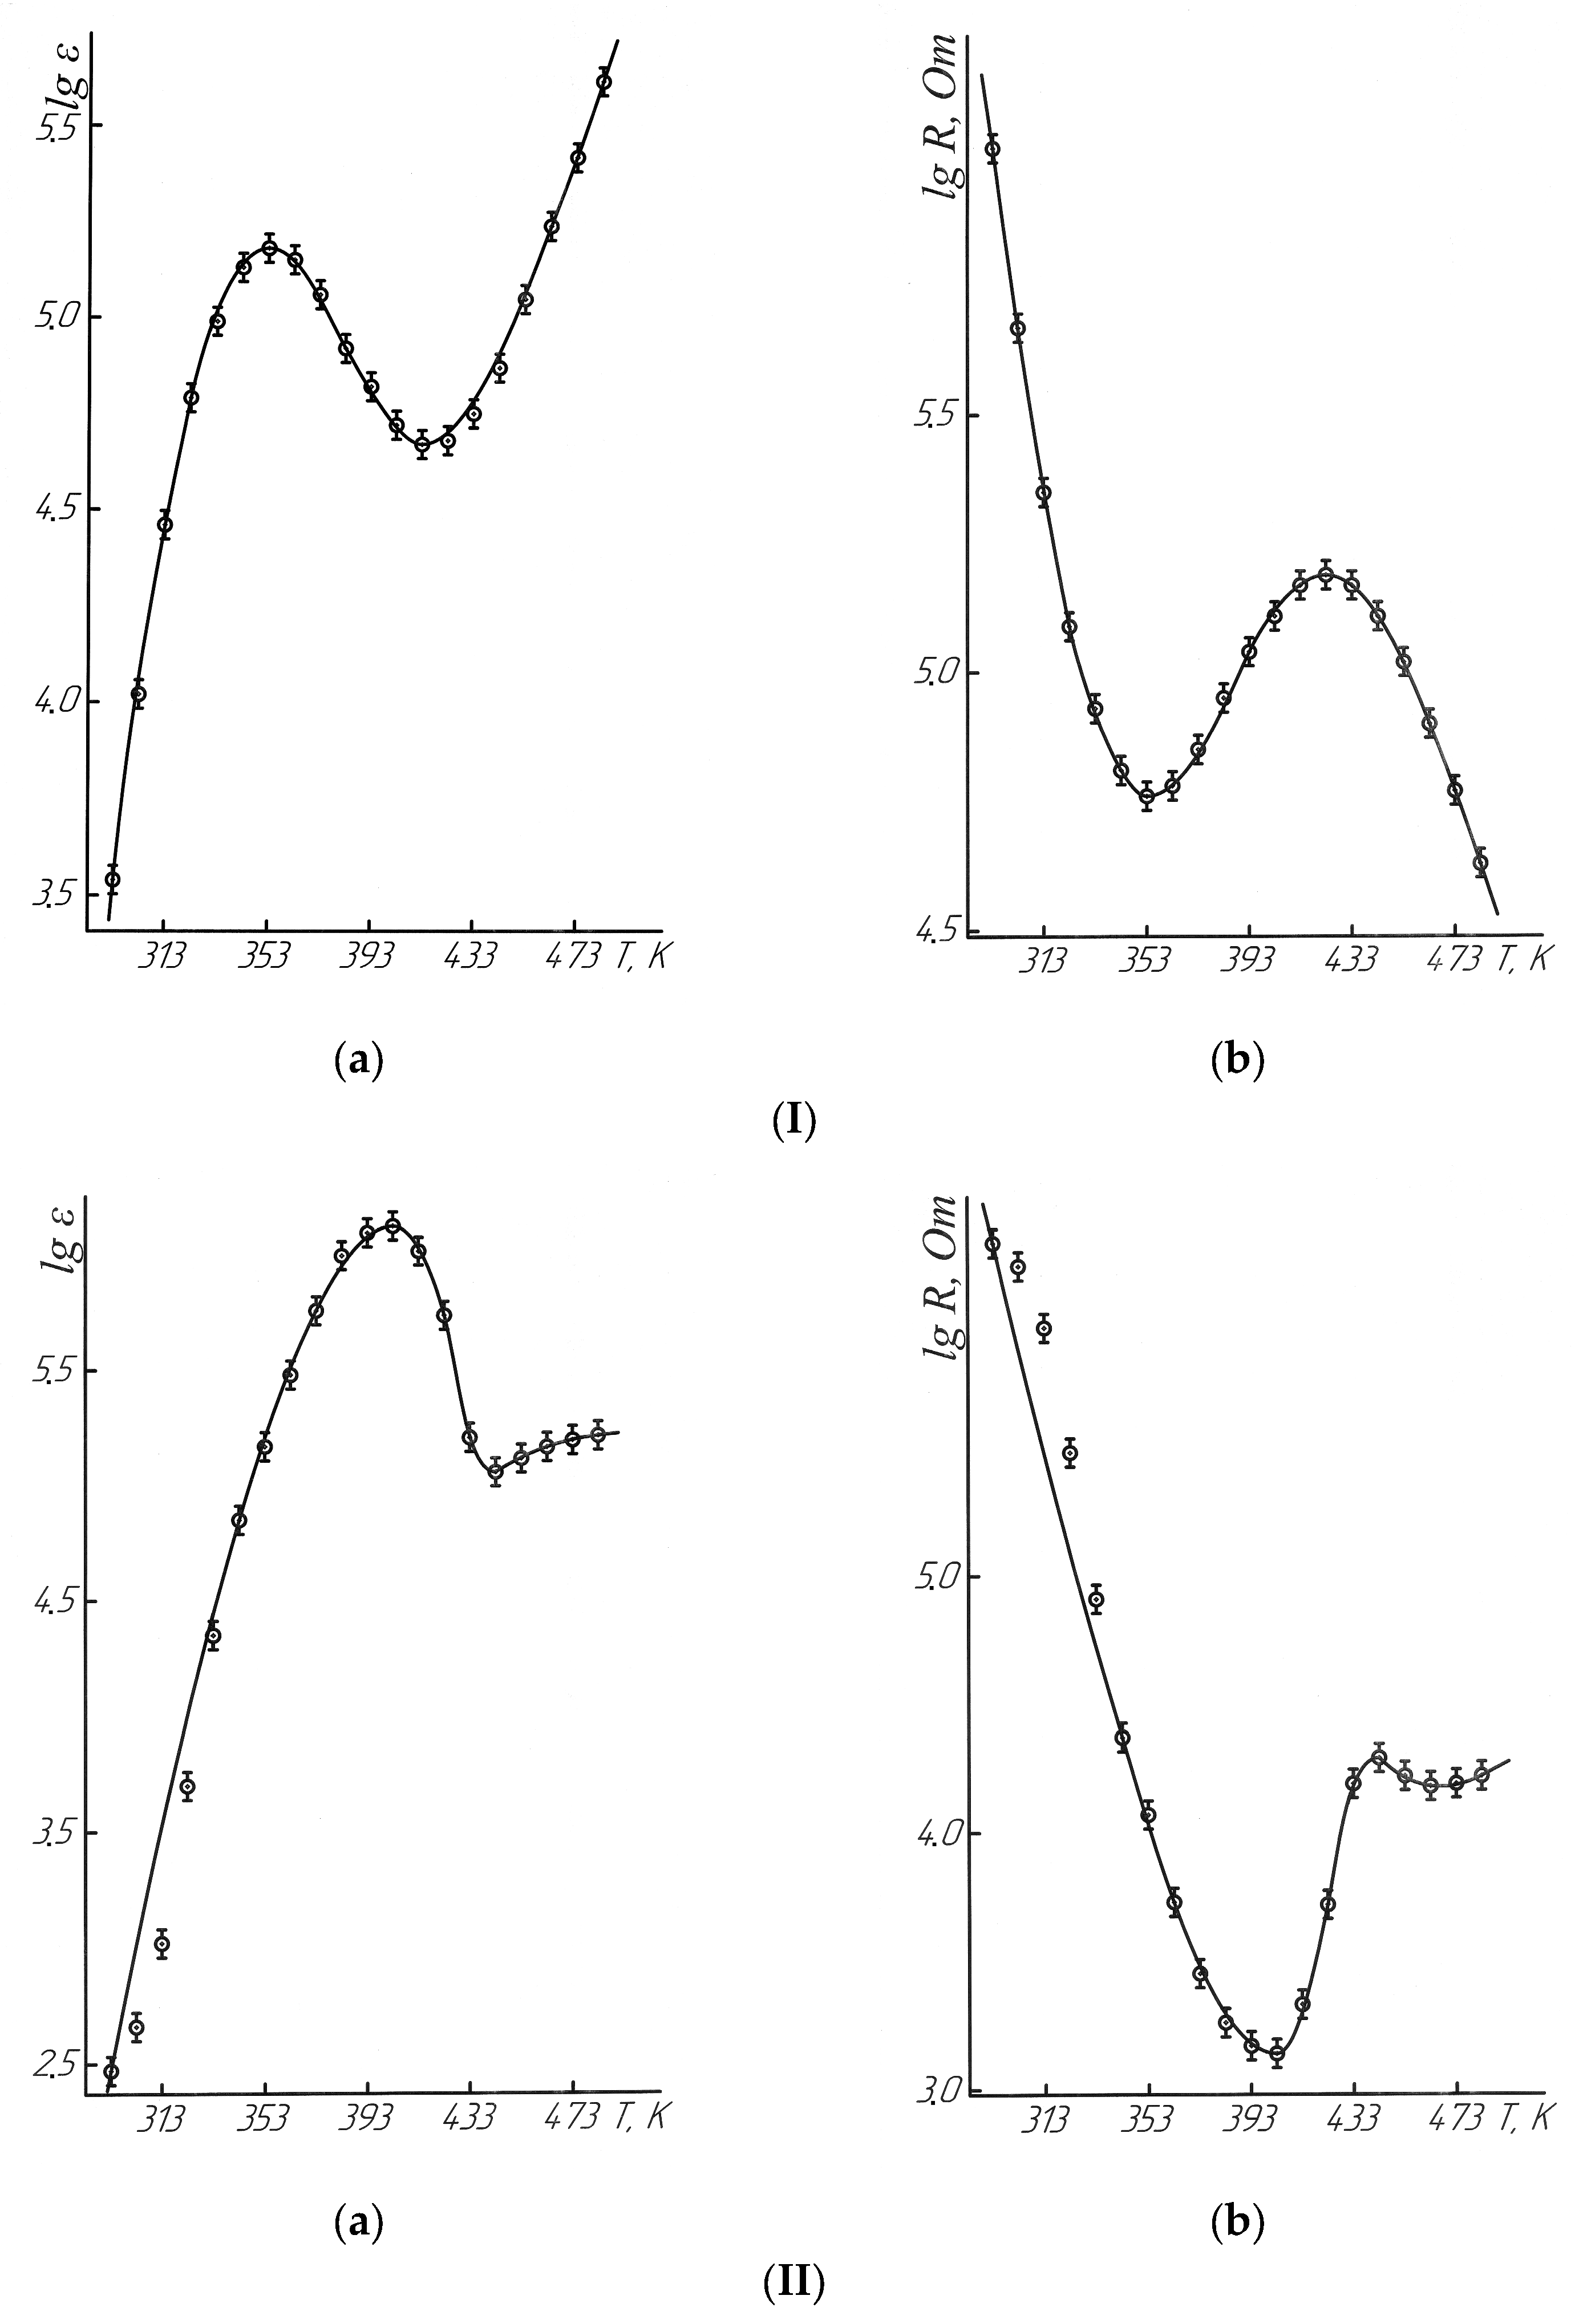
After thermodynamic investigations, electrophysical studies were conducted to clarify the nature of the identified second-order phase transitions. The studies of the electrophysical properties of NdNa
2NiMnO
5 and NdK
2NiMnO
5 in the temperature range of 293–483 K with 10 K increments, carried out using the LCR-781 device (Good Will Instrument Co., Ltd., New Taipei City, Taiwan) at a frequency of 1 kHz, demonstrate high measurement accuracy and rigorous methodology [
31,
32,
33]. According to the specifications, the accuracy of measuring permittivity (ε) and electrical resistance (R) is ±0.05%, which ensures the reliability of the obtained data. A comparative analysis with the permittivity of the standard substance (BaTiO
3) confirms the validity of the measurements, as the obtained value at 293 K (1296) aligns well with the recommended value of 1400 ± 250 [
34,
35,
36,
37].
Such studies help establish the relationship between changes in heat capacity and electrophysical characteristics, which is essential for determining the nature of second-order phase transitions. Measurements of dielectric permittivity and electrical resistance in this context can reveal structural anomalies, such as ferroelectric or paraelectric transitions, which are often accompanied by jumps in heat capacity.
The results of the electrophysical measurements, presented in
Table 8 and
Figure 9, will likely provide deeper insights into how the properties of the material change within the studied temperature range and how these changes correlate with thermodynamic parameters.
The activation energies of conductivity were calculated, representing the minimum energy required for a reaction to occur or a process to be activated.
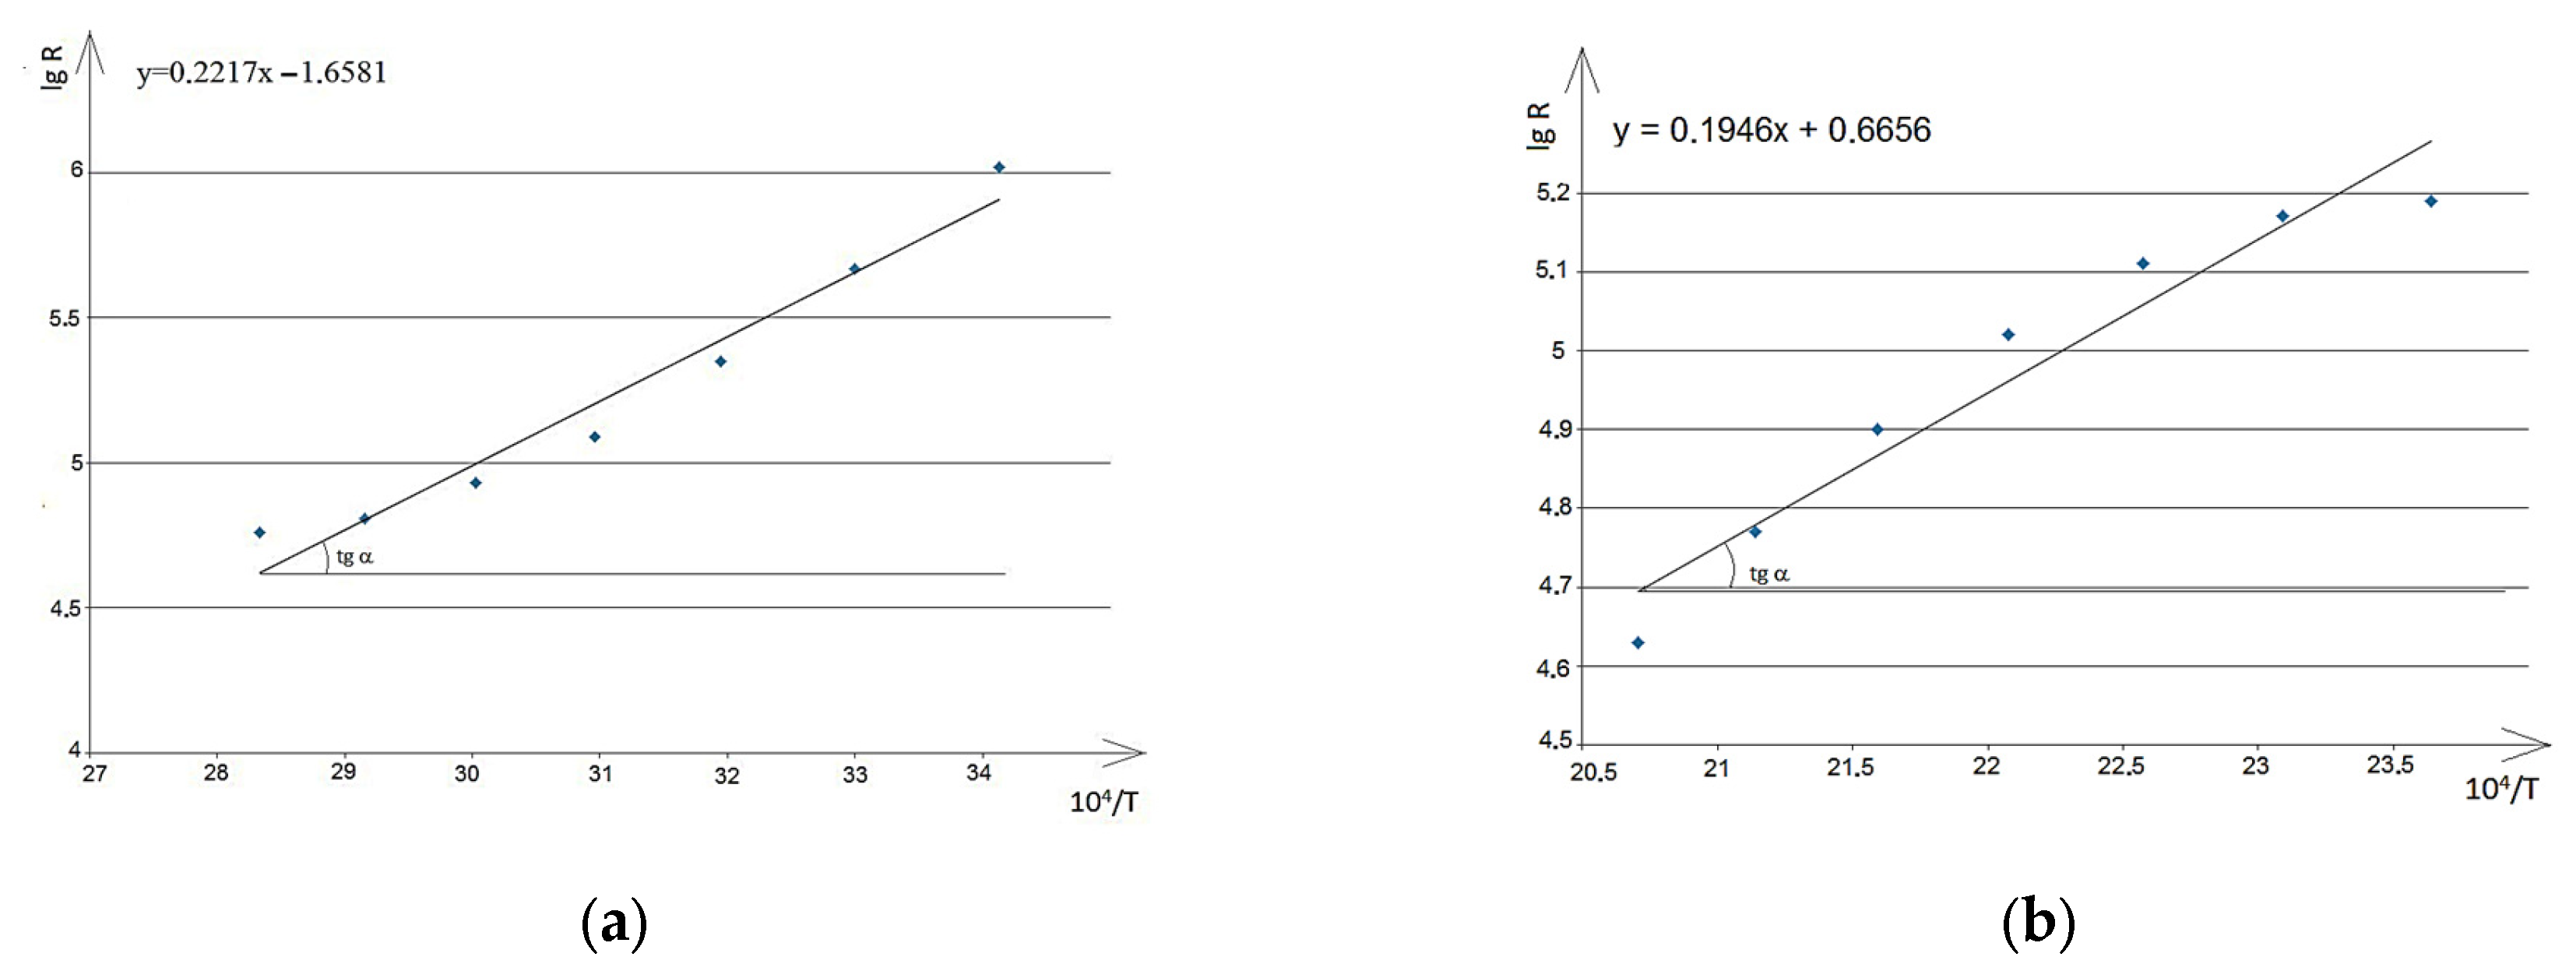
The calculation of the activation energy of electrical conductivity (Δ
Ea) was carried out as follows [
38]. Based on the experimental data for
T and
R, a scatter plot was constructed using a set of markers. By adding an “exponential” trendline, it was verified that the experimental graph could be described by a function of the form:
By plotting a scatter diagram of lg
Rnn versus 10
4 T
−1 based on the experimental data in MS Excel, a linear trendline can be added, or a system of equations can be formed: lgy = a + bx, where y = lg
R and x = 10
4/T (
Figure 10 and
Figure 11).
For NdNa
2NiMnO
5 in the temperature range of 293–353 K, the dependence lg
R~f(1/T) (
Figure 10a) is described by the equation:
and compared with the form:
then, with ∆
E/2k = 2217 K and lg
R0 = −1.6581, we derive:
where
k = 1.38 × 10
−23 J·K
−1 is the Boltzmann constant, and e = 1.6 × 10
−19 C is the elementary charge.
Next, the dependence lg
R~f(1/
T) shown in
Figure 10b for NdNa
2NiMnO
5 in the temperature range of 423–483 K is described by the equation:
then, taking Equation (12) into account, the activation energy of conductivity (Δ
Ea) is equal to 0.336 eV.
The linear dependence lg
R~f(1/
T) for NdK
2NiMnO
5 is shown in
Figure 11.
The dependence lg
R~f(1/
T), shown in
Figure 11a for NdK
2NiMnO
5 in the temperature range of 293–403 K, is described by the equation:
Taking Equation (12) into account, the activation energy of conductivity (ΔEa) for NdK2NiMnO5 was found to be 0.683 eV.
The dependence lg
R~f(1/
T), shown in
Figure 11b for NdK
2NiMnO
5 in the temperature range of 443–463 K, is described by the equation:
From this, considering Equation (12), the activation energy of conductivity (ΔEa) is calculated to be 0.191 eV.
The analysis of the calculated activation energies of conductivity for NdNa2NiMnO5 and NdK2NiMnO5 offers insights into the processes taking place in these materials across different temperature ranges. For NdNa2NiMnO5, in the temperature range of 293–353 K, the activation energy is 0.382 eV; in the range of 423–483 K, the activation energy decreases to 0.336 eV. This decrease in activation energy with increasing temperature might indicate a transition to another conductivity regime, characterized by the dominance of a different conduction mechanism. It could also be linked to changes in defect types or the occurrence of second-order phase transitions. For NdK2NiMnO5, in the range of 298–403 K, the activation energy is 0.683 eV; at higher temperatures (443–463 K), the activation energy significantly decreases to 0.191 eV. The higher activation energy observed in the 298–403 K range compared to NdNa2NiMnO5 may suggest greater resistance to electrical conductivity at lower temperatures, likely involving polaronic or ionic conduction mechanisms. The sharp drop in activation energy in the higher temperature range could indicate structural changes or a transition to another phase, reducing the energy barrier for charge transfer. Comparative observations: NdNa2NiMnO5 exhibits smaller variations in activation energy across the studied temperature ranges, implying a more stable conduction structure. In contrast, NdK2NiMnO5 shows more pronounced changes in activation energy, highlighting significant structural or phase transformations. These differences could be attributed to the distinct nature of the cations (Na and K) and their effects on the lattice structure and defect states. A higher activation energy reflects a greater energy barrier for charge transport, while its reduction may signify shifts in conduction mechanisms or phase transitions.
The bandgap widths (Δ
Eg) for NdNa
2NiMnO
5 and NdK
2NiMnO
5 were calculated. The bandgap width of the studied substances was determined using the formula:
where
k is the Boltzmann constant equal to 8.617302 × 10
−5 eV. K
−1,
R1 is the resistance at
T1, and
R2 is the resistance at
T2. For example, for LaNa
2NiMnO
5 semiconductor regions in the range 293–353 K,
T1 = 293 K,
T2 = 353 K;
R1 = 6.02, and
R2 = 4.76 Om. For compound LaNa
2NiMnO
5, in the range 293–353 K, the bandgap width is 0.87 eV; at 423–483 K, the bandgap width increases to 1.53 eV. An increase in the band gap during the transition to a higher temperature range may indicate a phase transition or changes in the electronic structure of the material. An increase in the value of Δ
Eg may mean that the material becomes less conductive and requires more energy to excite electrons in the conduction band.
The widths of the forbidden regions for LaK2NiMnO5 are calculated in the same way. For the LaK2NiMnO5 compound, in the range of 293–403 K, the band gap is 0.96 eV; at 443–463 K, the band gap increases sharply to 4.17 eV. A significant increase in the band gap during the transition to a higher temperature range may be associated with profound changes in the structure of the material, such as the transition from a conductive state to an insulating one. This may be the result of a change in the electronic structure, the formation of new phases, or other significant structural changes.
It should be noted that the literature often states that the activation energy of conductivity is equal in magnitude to the bandgap width. However, by definition, the activation energy represents the minimum energy required to excite charge carriers (e.g., electrons or holes) for conduction. This value describes the energy barrier from the valence band to the conduction band and directly influences the material’s electrical conductivity. On the other hand, the bandgap width (Eg) refers to the energy difference between the valence band and the conduction band in semiconductors. It determines whether a material behaves as an insulator, semiconductor, or conductor under different temperatures and conditions.
When impurity atoms in the crystal lattice substitute for the atoms of the main component, the nature of electrical conductivity changes. The activation energy of conductivity (ΔEa) becomes smaller than the bandgap width of the semiconductor (ΔEg). In this case, the impurity atom is Ni. This observation aligns with the obtained data: ΔEa NdNa2NiMnO5 (0.382 eV) < ΔEg NdNa2NiMnO5 (0.87 eV) ΔT = 293–353 K; ΔEa NdNa2NiMnO5 (0.336 eV) < ΔEg NdNa2NiMnO5 (1.53 eV) ΔT = 423–483 K; ΔEa NdK2NiMnO5 (0.685 ϶B) < ΔEg NdK2NiMnO5 (0.96 eV) ΔT = 293–403 K; ΔEa NdK2NiMnO5 (0.195 eV) < ΔEg NdK2NiMnO5 (4.17 eV) ΔT = 443–463 K.
Let us consider the possible mechanism of conductivity when manganese atoms (trivalent, Mn
3+) are partially substituted by nickel atoms (divalent, Ni
2+), which have one less valence electron. The mechanism of excitation of electrical conductivity in this case differs from that of an n-type semiconductor. Nickel atoms form two covalent bonds with neighboring manganese (III) atoms using their own electrons. However, the third covalent bond cannot form in the unexcited crystal due to the absence of a stable electronic configuration for nickel within the lattice. Upon heating, the bonds between manganese atoms weaken, allowing an electron to transfer from one of the neighboring manganese atoms to the nickel atom, thereby forming a third covalent bond. The energy (Δ
Ea) required for this transition is much lower than the energy (Δ
Eg) needed to promote an electron into the conduction band. As the electron moves to the nickel atom, the nickel atom becomes negatively charged, while a hole forms near the manganese atom from which the electron departed. This impurity (Ni) is referred to as an acceptor. The energy level of the acceptor atom is located within the forbidden energy gap, near the top of the valence band, and is separated from the valence band by an activation energy gap (acceptor activation energy). The excitation of electrical conductivity is associated with the capture of a manganese (III) valence electron by the acceptor impurity Ni (II), resulting in the formation of a hole in the valence band. In this scenario, no electrons are present in the conduction band. Under an external electric field, the holes in the valence band move due to the hopping transitions of electrons, similar to the behavior in intrinsic semiconductors. A semiconductor doped with an acceptor impurity (nickel atoms, in this case) exhibits only hole conductivity and thus belongs to p-type semiconductors [
39].
Thus, NdNa2NiMnO5 exhibits a moderate increase in the bandgap width as temperature rises, which may indicate the stability of its structure within these temperature intervals. On the other hand, NdK2NiMnO5 demonstrates a significantly sharper increase in the bandgap width, which could suggest phase transitions or more pronounced changes in its electronic structure. The differences in the behavior of these compounds might be attributed to the distinct roles of sodium (Na) and potassium (K) ions in the crystal lattice, their influence on electronic interactions, and defect states. An increase in the bandgap width with rising temperature may point to reduced conductivity and a transition to a state with more pronounced insulating properties.
The classification of a semiconductor (narrow bandgap or wide bandgap) depends on the bandgap width. For NdNa2NiMnO5, in the range of 293–353 K, it falls into the category of narrow-bandgap semiconductors; in the range of 423–483 K, it transitions closer to the medium bandgap category. For NdK2NiMnO5, in the range of 293–403 K, it also belongs to the narrow-bandgap semiconductor category; at 443–463 K, as the temperature increases, its characteristics shift to those typical of wide-bandgap semiconductors. These materials exhibit a temperature-dependent bandgap width, making them potentially useful for applications that require conductivity variations with temperature changes.
It should be emphasized that there is a correlation between the temperature of the second-order phase transition of NdNa2NiMnO5 on the curve C0p~f(T) at 423 K and the transition temperature from metallic conductivity to semiconductor conductivity on the curve lgR~f(T) also at 423 K. This, to some extent, indicates the nature of the second-order phase transition.
For a comparison of the electrophysical properties of NdNa
2NiMnO
5 and NdK
2NiMnO
5 with the reference BaTiO
3 perovskite, we present its electrophysical characteristics measured using the LCR-781 instrument in the temperature range of 293–483 K at a frequency of 1 kHz (
Table 9).
As shown in
Table 9, the dielectric permittivity (ε) of NdNa
2NiMnO
5 at 293 K exceeds that of BaTiO
3 at 293 K by 2.7 times, at 353 K by 106 times, and at 483 K by 193 times. Similarly, the dielectric permittivity of NdK
2NiMnO
5 at 403 K exceeds that of BaTiO
3 by 870 times. The dielectric permittivity values of NdNa
2NiMnO
5 at 783 K and NdK
2NiMnO
5 at 403 K approach levels close to giant dielectric constants (ε), making them of interest as memory materials for data storage devices.
The reliability of the experimental results presented in this study is substantiated by the following measures. Recalibration of equipment minimizes systematic errors and ensures measurement accuracy throughout the experiment. Conducting a thorough error analysis enhances the interpretation of the results and demonstrates transparency in the experimental approach. Comparing the findings with existing results under similar conditions strengthens the validity of the conclusions by confirming their consistency with established outcomes. Monitoring the stability of the sample properties ensures that any observed data changes are attributed to experimental factors rather than the deterioration or alteration of the samples themselves. These measures confirm that the results provided in the study are well-founded and reliable, contributing to the scientific significance of the research and rendering its conclusions trustworthy.


 —experimental data, ●—calculated data.
 —experimental data, ●—calculated data.
 —experimental data, ●—calculated data.
 —experimental data, ●—calculated data.
 —experimental data.
 —experimental data.