Article

A Study on the Pantograph Slide Wear Model Based on Energy Dissipation

1
School of Electrical Engineering, Liaoning University of Technology, Jinzhou 121001, China
2
State Grid Baiyin City Power Supply Company, Baiyin 730900, China
3
School of Electrical and Control Engineering, Liaoning Technical University, Huludao 125100, China
*
Author to whom correspondence should be addressed.
Appl. Sci. 2025, 15(12), 6748; https://doi.org/10.3390/app15126748
Submission received: 16 May 2025 / Revised: 6 June 2025 / Accepted: 13 June 2025 / Published: 16 June 2025
(This article belongs to the Section Electrical, Electronics and Communications Engineering)

Abstract

During train operations, the contact surface between the pantograph slide and the catenary wire is subjected to mechanical friction and an electrical current, leading to an increase in the wear of the pantograph slide and a reduction in the service life of the pantograph–catenary friction pair. Therefore, the study of pantograph slide wear modeling and prediction is of great significance. This paper proposes a method to quantitatively characterize the wear of the pantograph slide by analyzing the energy dissipated through current-carrying friction in the pantograph–catenary system, from the perspective of the work done by the system. This study finds a significant linear relationship between the wear of the pantograph slide and the energy dissipated by current-carrying friction and establishes a mathematical model for pantograph slide wear based on energy dissipation, validating the effectiveness of the model. Furthermore, the relationship between the dissipated energy, contact current, contact pressure, and sliding speed is explored using experimental data, providing a quantitative explanation of the interaction between electrical and mechanical wear from an energy perspective. The wear morphology of the pantograph slide surface is further examined using metallographic microscopy, and the wear mechanism is analyzed. The applicability of the wear model is discussed, and it can be used for further studies on the current-carrying wear mechanisms in pantograph–catenary systems.

1. Introduction

The pantograph slide and the catenary wire form a typical sliding electrical contact friction pair, which provides the necessary energy for the stable operation of electric locomotives through sliding contact. Compared to the pantograph slide, the catenary wire, as a power transmission line, has higher hardness and is difficult to replace, requiring a longer service life. Therefore, the current-carrying wear between the pantograph and catenary system is mainly borne by the pantograph slide [1]. Under sliding electrical contact conditions, the wear mechanism of the pantograph slide is complex, involving both mechanical and electrical wear, as well as the coupling effects between them. The interaction of these two types of wear accelerates the overall degradation [2]. As a consumable friction pair, if the pantograph slide is worn beyond its limit without timely replacement, it will affect the safety of train operations [3,4]. Therefore, developing a friction and wear model for the pantograph slide is of significant theoretical and practical value in predicting the lifespan of the friction pair and guiding the friction design of the pantograph–catenary system.
In recent years, scholars both domestically and internationally have made significant contributions to the modeling of pantograph slide wear. Based on the relevant literature, there are currently two main approaches to predicting the wear of the pantograph slide and catenary wire. One approach is to calculate the correlation coefficients between various influencing factors and wear and derive a fitting formula for wear. For example, Shi Guang et al. [5] studied the wear of the pantograph slide under different current, speed, and fluctuating load conditions and developed a regression prediction model for the wear of the pantograph slide. Hu Yan et al. [6] investigated the effects of the catenary contact pressure, contact current, sliding speed, and operating time on the wear of pure carbon pantograph slides, using partial least squares regression to establish a wear prediction model, and analyzed the influence of each parameter on wear. Xu Wenwen et al. [7] established a support vector regression-based model to predict the wear trends of subway pantograph slides, enabling the prediction of wear based on the operational mileage. Xie Baozhi et al. [8] developed a wear prediction model for the pantograph slide by analyzing the variation in wear with the operational temperature under different parameters, incorporating the effect of the temperature. The second approach is to analyze the wear evolution and mechanisms under various influencing factors and derive a mathematical wear model. For example, Chen Zhonghua et al. [9] considered both mechanical and electrical wear, as well as the coupling wear between them, and used the Archard wear model to establish a mathematical expression for the wear rate. S. Derosa et al. [10] proposed a heuristic wear model for the pantograph slide and catenary wire, which can be used in conjunction with a numerical model of the pantograph–catenary interaction to predict wear over long periods. Some scholars have established related wear prediction models based on the wear mechanisms proposed by Lim and Ashby [11]. For example, G. Bucca et al. [12] proposed an adaptive wear prediction method through pantograph–catenary coupling dynamic simulations combined with experimental data. Wei Xiukun et al. [13], based on the Lim and Ashby theory, established a wear prediction model for the pantograph slide and catenary wire by combining actual maintenance data from subway lines. However, in most of the models established through the aforementioned methods, the influence of the friction coefficient on wear is not considered. When the operating conditions change, the friction coefficient also changes, and, due to the complex evolution and mechanisms of pantograph–catenary wear, these models cannot accurately represent the wear of the pantograph–catenary system, making it difficult to predict wear precisely using any single method.
In mechanical friction systems, wear is often analyzed from the perspective of energy dissipation. Zhang Gaolong et al. [14] found that, under dry friction, the wear rate of graphite exhibits a significant linear relationship with the frictional dissipation power of the mating surfaces. J. Abdo developed a mathematical model that relates the wear volume of materials in sliding contact to the dissipated energy, which can be used to predict the component’s service life [15]. Additionally, studies [16,17,18,19] have shown that surface friction wear is related to its dissipated energy. By investigating the relationship between friction wear and dissipated energy, the wear mechanism and related energy dissipation can be analyzed, linking dissipated energy to the wear volume and proposing a wear calculation method based on energy dissipation theory. Although the energy dissipation method has been used to study material wear in mechanical friction systems, there is still limited research in the field of sliding electrical contact, particularly in the pantograph–catenary system. No studies have been reported on the prediction of pantograph slide wear from the perspective of energy dissipation in the pantograph–catenary system.
In the interdisciplinary research of AI-assisted predictive modeling and thermoelectric systems, remarkable progress has been achieved in recent years. Jinjiang Wang et al. [20] proposed a physics-guided neural network (PGNN), integrating wear mechanism knowledge with data-driven learning to provide a novel paradigm for high-precision and interpretable wear prediction in pantograph–catenary systems. Wang, H et al. [21] developed a multi-agent reinforcement learning (MARL) algorithm based on the Nash equilibrium framework, enabling heterogeneous agents to collaborate under global value function guidance for proactive pantograph control and enhanced system stability. Guangshuai Han et al. [22] constructed a “data-driven–model prediction–experimental validation” closed-loop framework, integrating material descriptors such as matrix encoding and radial distribution analysis to achieve >90% accuracy in predicting the thermoelectric figure of merit (ZT) and accelerate the development of novel thermoelectric materials. These studies have advanced interdisciplinary applications of AI in thermoelectric systems from the perspectives of modeling, control, and material design.
This paper presents a novel method based on energy dissipation to predict the wear of the pantograph slide and explain its wear mechanism. The wear of the pantograph slide is quantitatively characterized by the current-carrying frictional energy dissipation in the pantograph–catenary system. Based on the significant linear relationship between the wear of the pantograph slide and the current-carrying frictional energy dissipation, a basic mathematical model for pantograph slide wear based on energy dissipation is established. The variation in the current-carrying frictional energy dissipation with the operational parameters is studied, providing a quantitative explanation of the interaction between electrical wear and mechanical wear from an energy perspective. This method offers a new approach and insights for the lifetime prediction of the pantograph–catenary friction pair and the study of current-carrying wear mechanisms.

2. Calculation of Current-Carrying Frictional Energy Dissipation in the Pantograph–Catenary System

For the pantograph–catenary current-carrying friction pair, the tribological behavior of the pantograph slide is influenced by the combined effects of electrical and mechanical factors. Specifically, the Joule heating effect and frictional heating effect primarily influence the wear of the pantograph slide through the work done by the current and the frictional force [12]. During the wear process, these two effects counterbalance each other and are interrelated. Therefore, the occurrence of pantograph slide wear is inevitably accompanied by the consumption of system energy. By relating the current-carrying friction in the pantograph–catenary system to wear through energy, the wear process can be viewed as an energy dissipation process. This process consumes energy in the form of heat generation at the contact surface, electromagnetic noise, the wear of the pantograph slide surface, and the extrusion of abrasive particles, among other forms. The sum of the work done by the current and the work done by the frictional force is defined as the total dissipated energy, referred to as the pantograph–catenary current-carrying frictional energy dissipation.

2.1. Energy Generated by the Work Done by the Current

For the rough surface of the sliding electrical contact in the pantograph–catenary system, it is assumed that there are n conductive spots between the pantograph slide and the contact wire. The contact resistance of the pantograph–catenary system can be calculated using the following equation [23]:
R = ρ l A r = ρ l n π a 2
In the equation, A r denotes the actual contact area of the pantograph–catenary system; ρ is the sum of the resistivities of the pantograph slide and the contact wire materials; l represents the contact length, i.e., the width of the pantograph slide; and a is the average radius of a single conductive spot.
The hardness of the materials affects the actual contact area and the shape of the conductive spots in the pantograph–catenary system. Considering the contact pressure and material hardness, the contact hardness H is defined as [24]
H = F A r = F n π a 2
In the equation, H denotes the contact hardness of the pantograph slide.
By combining Equations (1) and (2), the expression for the pantograph–catenary contact resistance can be derived as
R = ρ l H F
When a current flows through the contact resistance, the work done by the current can be derived from Joule’s law. The energy generated by the work done per unit contact area is given by
E 1 = Q A = I 2 R t A = I 2 t A ρ l H F
In the equation, Q denotes the energy dissipated by the Joule effect; A represents the nominal contact area of the pantograph–catenary system, i.e., the rectangular area of the contact surface; and t is the sliding time.

2.2. Energy Generated by the Work Done by the Frictional Force and Current-Carrying Frictional Energy Dissipation in the Pantograph–Catenary System

During the pantograph–catenary contact friction process, relative sliding motion occurs between the pantograph slide and the contact wire. The energy generated by the work done by the frictional force per unit contact area is given by
E 2 = 0 x F f d x A = 0 t μ F v d t A = μ F v t A
In the equation, F f denotes the pantograph–catenary frictional force; μ is the coefficient of friction; and x is the sliding distance.
Therefore, the pantograph–catenary current-carrying frictional energy dissipation can be calculated as the sum of Equations (4) and (5). The expression for the current-carrying frictional energy dissipation per unit contact area is given by
E = E 1 + E 2 = t A ρ l H I 2 F + μ F v

3. Design of Pantograph–Catenary Current-Carrying Friction Wear Experiment

3.1. Experimental Setup and Materials

The current-carrying friction wear experiment was conducted using a self-developed sliding electrical contact test machine, as shown in Figure 1. This machine is capable of applying a maximum current of 800 A between the pantograph slide and the contact wire, with a contact pressure of up to 300 N and a maximum relative sliding speed of 350 km/h. The wear morphology of the pantograph slide surface was observed using an XJP-6A inverted metallographic microscope (The equipment is produced by Suliang Instrument Technology Co., Ltd., Suzhou, China), and image acquisition and processing were performed using the accompanying OPT Pro professional metallographic analysis software (2022 Edition).
The experiment used copper-impregnated carbon pantograph slides and copper contact wires. The length, width, and height of the pantograph slide were 250 mm, 36 mm, and 27 mm, respectively, while the cross-sectional area of the copper contact wire was 120 mm². The physical parameters of the copper-impregnated carbon pantograph slide and copper contact wire are shown in Table 1 (at a temperature of 20 °C).

3.2. Experimental Protocol

The contact currents were set to 100 A, 150 A, 200 A, and 250 A, while the contact pressures were set to 80 N, 90 N, 100 N, and 110 N, and the sliding speeds were set to 60 km/h, 80 km/h, 100 km/h, and 120 km/h. Each experiment lasted for 20 min. The pantograph–catenary current-carrying frictional energy dissipation was calculated using Equation (6). The wear of the pantograph slide was defined as the difference in mass before and after the experiment. The average wear of the left and right pantograph slides was taken, and the mass of the pantograph slides was measured using a BSM electronic balance with accuracy of 0.1 mg.

3.3. Correlation Analysis

To analyze the degree of correlation between pantograph–catenary current-carrying frictional energy dissipation and pantograph slide wear, a correlation analysis is conducted. The Pearson correlation coefficient, r, is introduced, and its expression is given as follows:
r = i = 1 n x i x ¯ y i y ¯ i = 1 n x i x ¯ 2 i = 1 n y i y ¯ 2
In the equation, x i and y i represent the sample values of pantograph–catenary current-carrying frictional energy dissipation and pantograph slide wear, respectively; x ¯ and y ¯ represent the mean values of pantograph–catenary current-carrying frictional energy dissipation and pantograph slide wear, respectively.
The relationship between pantograph–catenary current-carrying frictional energy dissipation and wear under different sliding speed conditions, with a contact pressure of 100 N and a contact current of 200 A, is shown in the curve in Figure 2.
As shown in Figure 2, when the pantograph–catenary current-carrying frictional energy dissipation is low, the pantograph slide wear is also small. As the pantograph–catenary current-carrying frictional energy dissipation increases, the wear of the pantograph slide also increases. The calculation results indicate that the correlation coefficient between pantograph–catenary current-carrying frictional energy dissipation and pantograph slide wear is 0.989396, which suggests a significant correlation between the two. The greater the pantograph–catenary current-carrying frictional energy dissipation, the greater the wear of the pantograph slide.

4. Development of a Pantograph Slide Wear Model

4.1. Rationality Assumptions for Model Establishment

This paper proposes rationality assumptions for the pantograph–catenary current-carrying friction–wear model by integrating engineering practice and research validity, as follows.
  • Material Homogeneity Assumption: The pantograph slide is assumed to exhibit a uniform composition and microstructure during frictional processes, eliminating localized defects that could induce abnormal wear.
  • Environmental Stability Assumption: The ambient parameters (temperature: 20–25 °C; relative humidity: 40–60% RH) are assumed to remain constant throughout the experiments to exclude interference from environmental fluctuations and other undefined variables.
  • Scope Limitation Statement: The model does not account for critical factors such as arc discharge and thermal expansion effects, which may significantly influence the system behavior and prediction accuracy under harsh conditions (e.g., high voltage or elevated temperatures).
  • Wear–Energy Linear Relationship: During the steady-state wear phase, the wear volume is assumed to be linearly proportional to the dissipated energy from electrical friction, with a positive correlation [25].

4.2. Mathematical Model of the Friction Coefficient

As shown in Equation (6), the friction coefficient directly affects the pantograph–catenary current-carrying frictional energy dissipation. To accurately calculate the pantograph slide wear under varying friction coefficients, the influence of the friction coefficient on the wear performance of the pantograph slide is considered. Based on the research findings on pantograph–catenary frictional forces [26], a mathematical model for the pantograph–catenary frictional force, incorporating the current density, sliding speed, and contact pressure, is introduced under the same experimental conditions, as shown in Equation (8):
F f = 0.072 3 × 10 8 J v + 0.101 3 × 10 8 J F
In the equation, F f denotes the pantograph–catenary frictional force; J is the current density; v represents the sliding speed; and F is the contact pressure.
The relationship between the current density J and the current intensity I in the experiment is given by
J = 3.34 × 10 3 I
According to Coulomb’s law, the mathematical expression for the frictional force is given by
F f = μ F
Therefore, by combining Equations (8) to (10), the mathematical model for the pantograph slide friction coefficient is derived as
μ = 0.072 1.002 × 10 4 I v F 1.002 × 10 4 I + 0.101
The model’s applicability is strictly constrained to the validated operational range: current intensity 100 A < I < 250 A, normal force 80 N < F < 110 N, and operation speed 60 km/h < v < 120 km/h. Experimental data indicate that the model prediction accuracy may decline or even fail when the variables exceed this range, primarily due to the nonlinear characteristics of the thermo-mechanical coupling at the contact interface and material frictional behavior, which evolve with parameter variations. It is worth emphasizing that statistical analysis shows that this defined range covers more than 90% of the train’s actual normal operating conditions, including typical scenarios such as startup acceleration, uniform cruising, and conventional braking. Thus, the model provides effective support for the analysis of pantograph–catenary sliding friction characteristics.

4.3. Pantograph Slide Wear Prediction Model

The least squares method is a flexible and widely used mathematical approach, characterized by its simplicity, fast convergence, and ease of implementation. Its fundamental principle is to minimize the sum of the squared differences between the model’s predicted values and the actual data, making it suitable for data with random errors that exhibit a linear relationship [27].
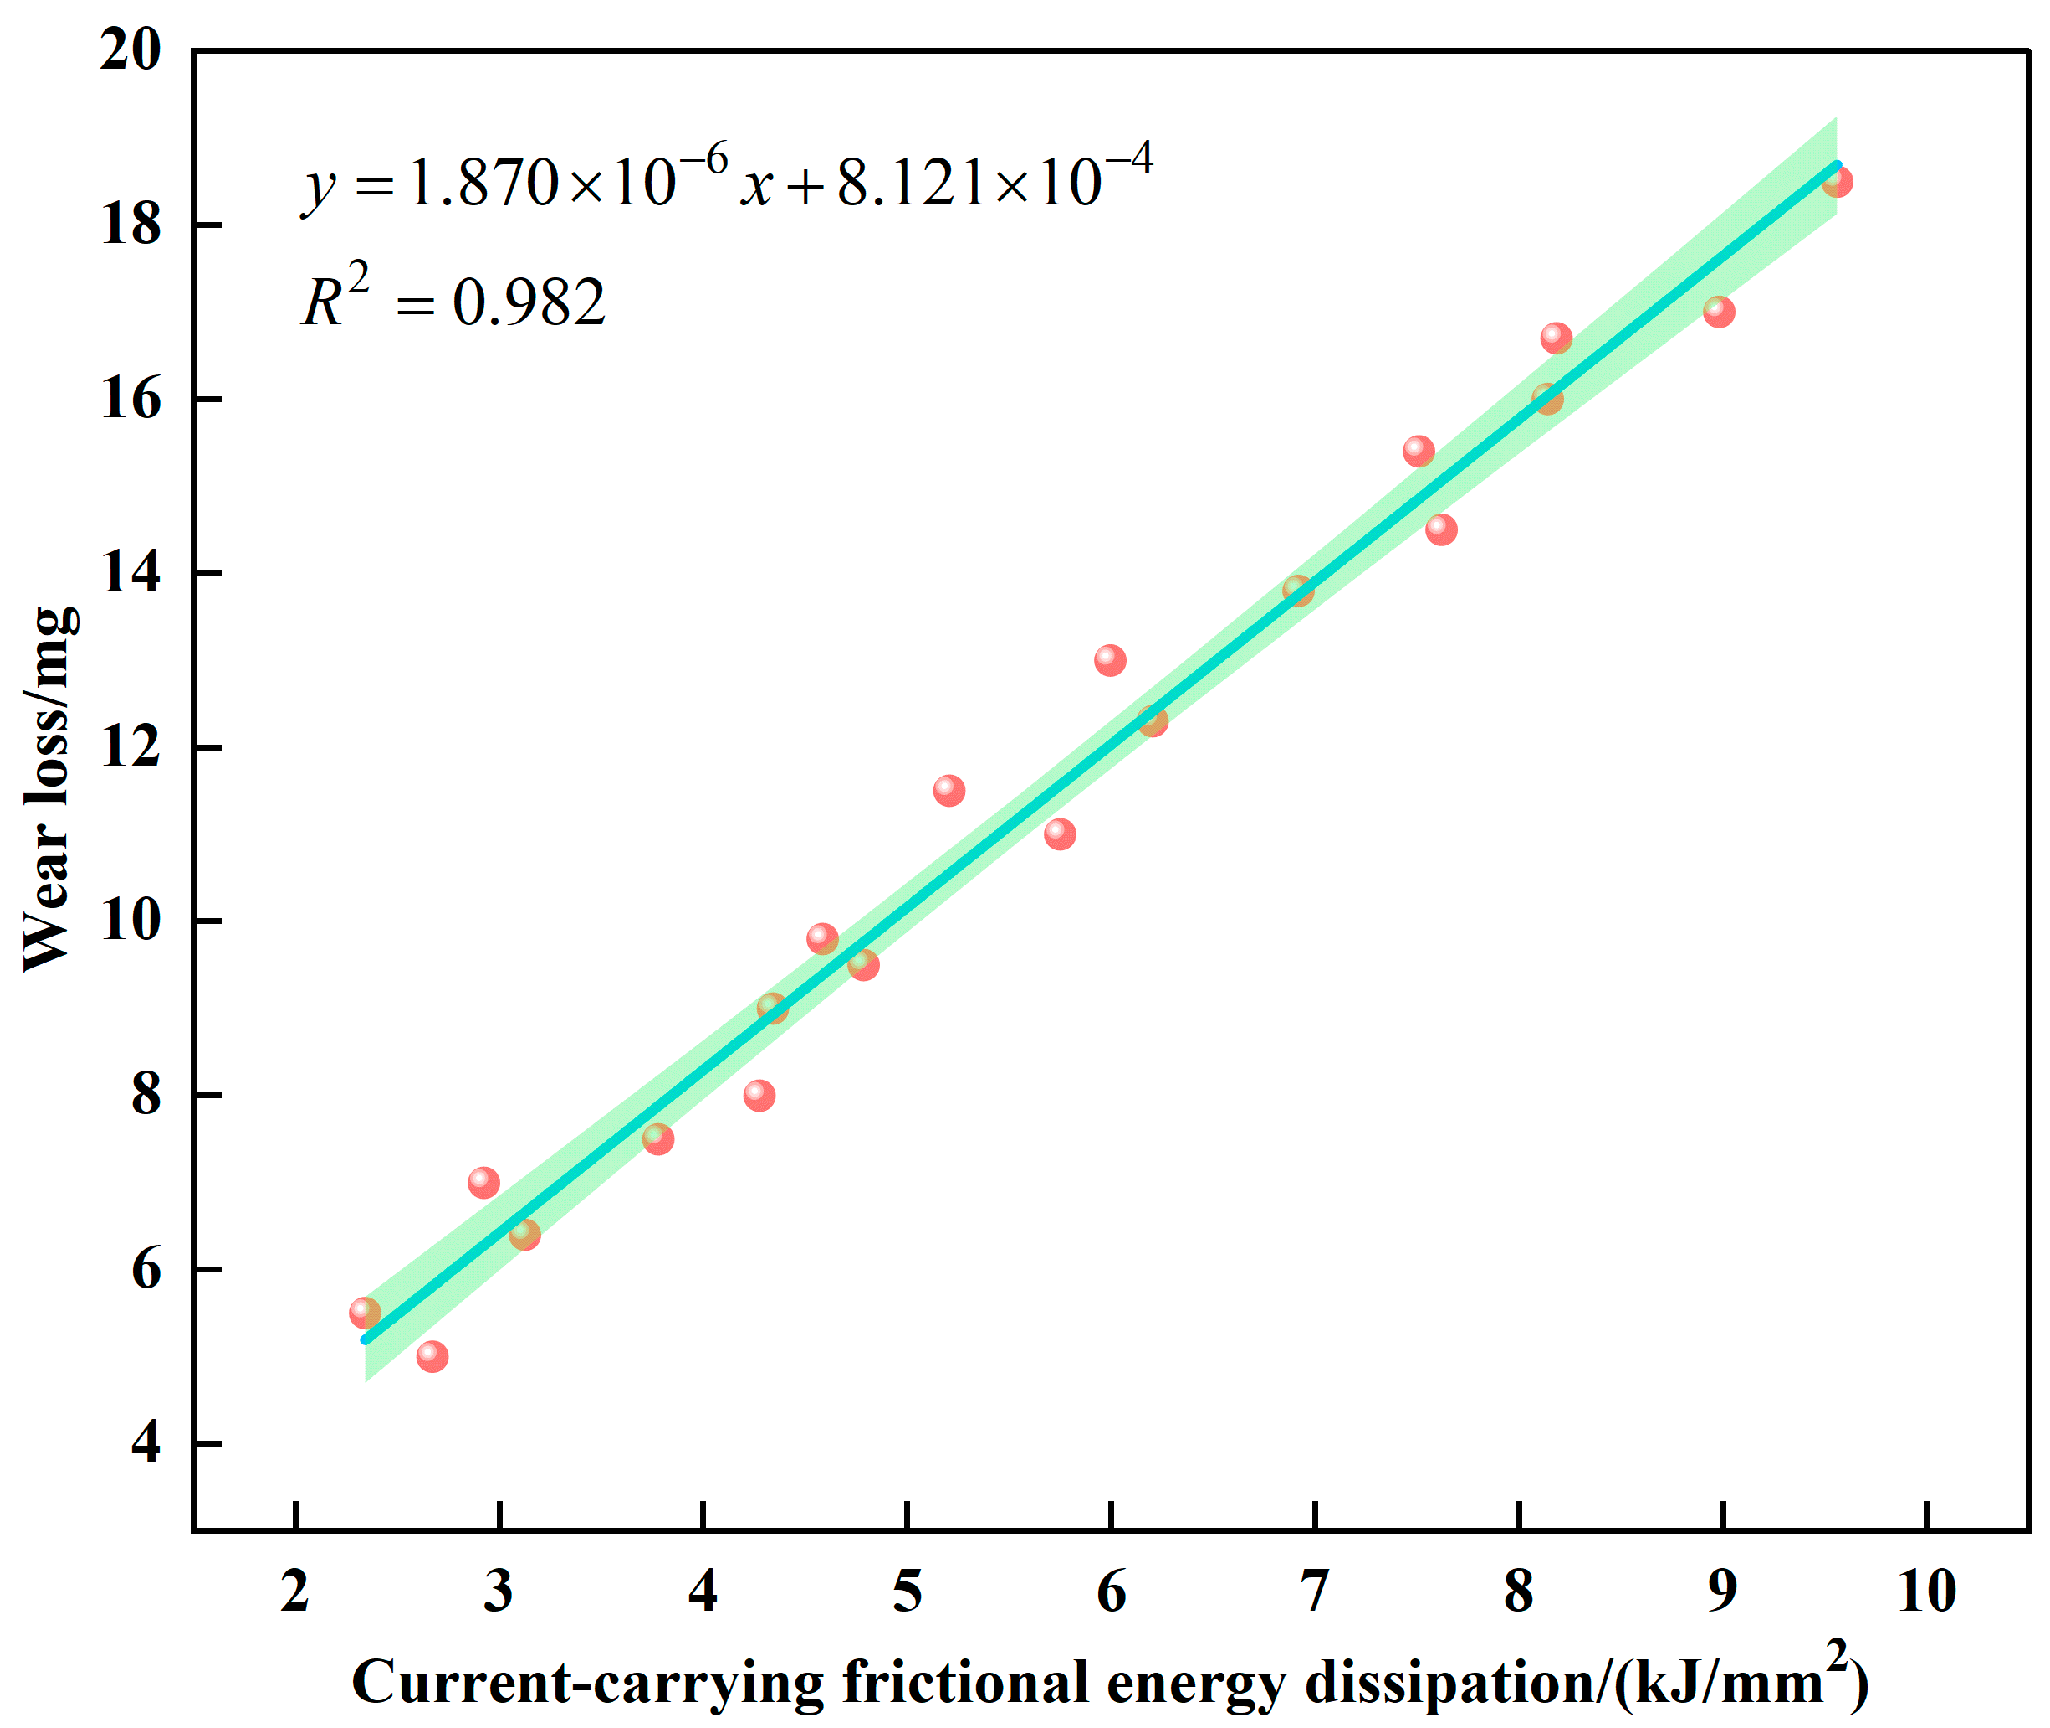
The contact currents were set to 100 A, 150 A, 200 A, and 250 A, with twenty data points collected under different pressure and speed conditions. The least squares method was used to establish a linear model between pantograph–catenary current-carrying frictional energy dissipation and pantograph slide wear. The fitting relationship between pantograph–catenary current-carrying frictional energy dissipation and pantograph slide wear is shown in Figure 3. At a confidence level of 95%, the coefficient of determination (R2) is 0.982. Meanwhile, the p-value of the correlation coefficient, calculated via the t-test, yields p < 0.05, indicating that this correlation is highly statistically significant.
The relationship between pantograph–catenary current-carrying frictional energy dissipation E and pantograph slide wear m is expressed as
m = 1.870 × 10 6 E + 8.121 × 10 4
According to the above expression, a significant correlation between the wear volume and energy dissipation rate is observed (r = 0.989396, p < 0.05). However, it is critical to emphasize that this correlation only reflects a covariant relationship between the variables, as causal inference methods have not yet been used to prove that energy dissipation directly induces wear. In fact, external variables such as the electric current, the evolution of the material surface topography, the contact stress distribution, and ambient temperature fluctuations may independently affect both the wear process and energy dissipation mechanism, forming mediating effects.
In actual train operations, the contact current, contact pressure, sliding speed, and operating time are readily measurable. Based on the experimental conditions, parameters A , H , ρ , and l are predetermined. Therefore, by obtaining the value of the friction coefficient μ , the pantograph–catenary current-carrying frictional energy dissipation E can be calculated, enabling the prediction of the pantograph slide wear m .
Therefore, by substituting the friction coefficient from Equation (11) into Equation (6) and combining it with Equation (12), the mathematical model to predict the wear of the pantograph slide can be obtained, as shown in Equation (13):
m = 1.870 × 10 6 A [ ρ l H I 2 F ( 1.002 × 10 4 I 0.072 ) v 2 ( 1.002 × 10 4 I 0.101 ) F v ] t + 8.121 × 10 4

5. Data Analysis of Pantograph Slide Wear Model

5.1. Validation of Pantograph Slide Wear Model

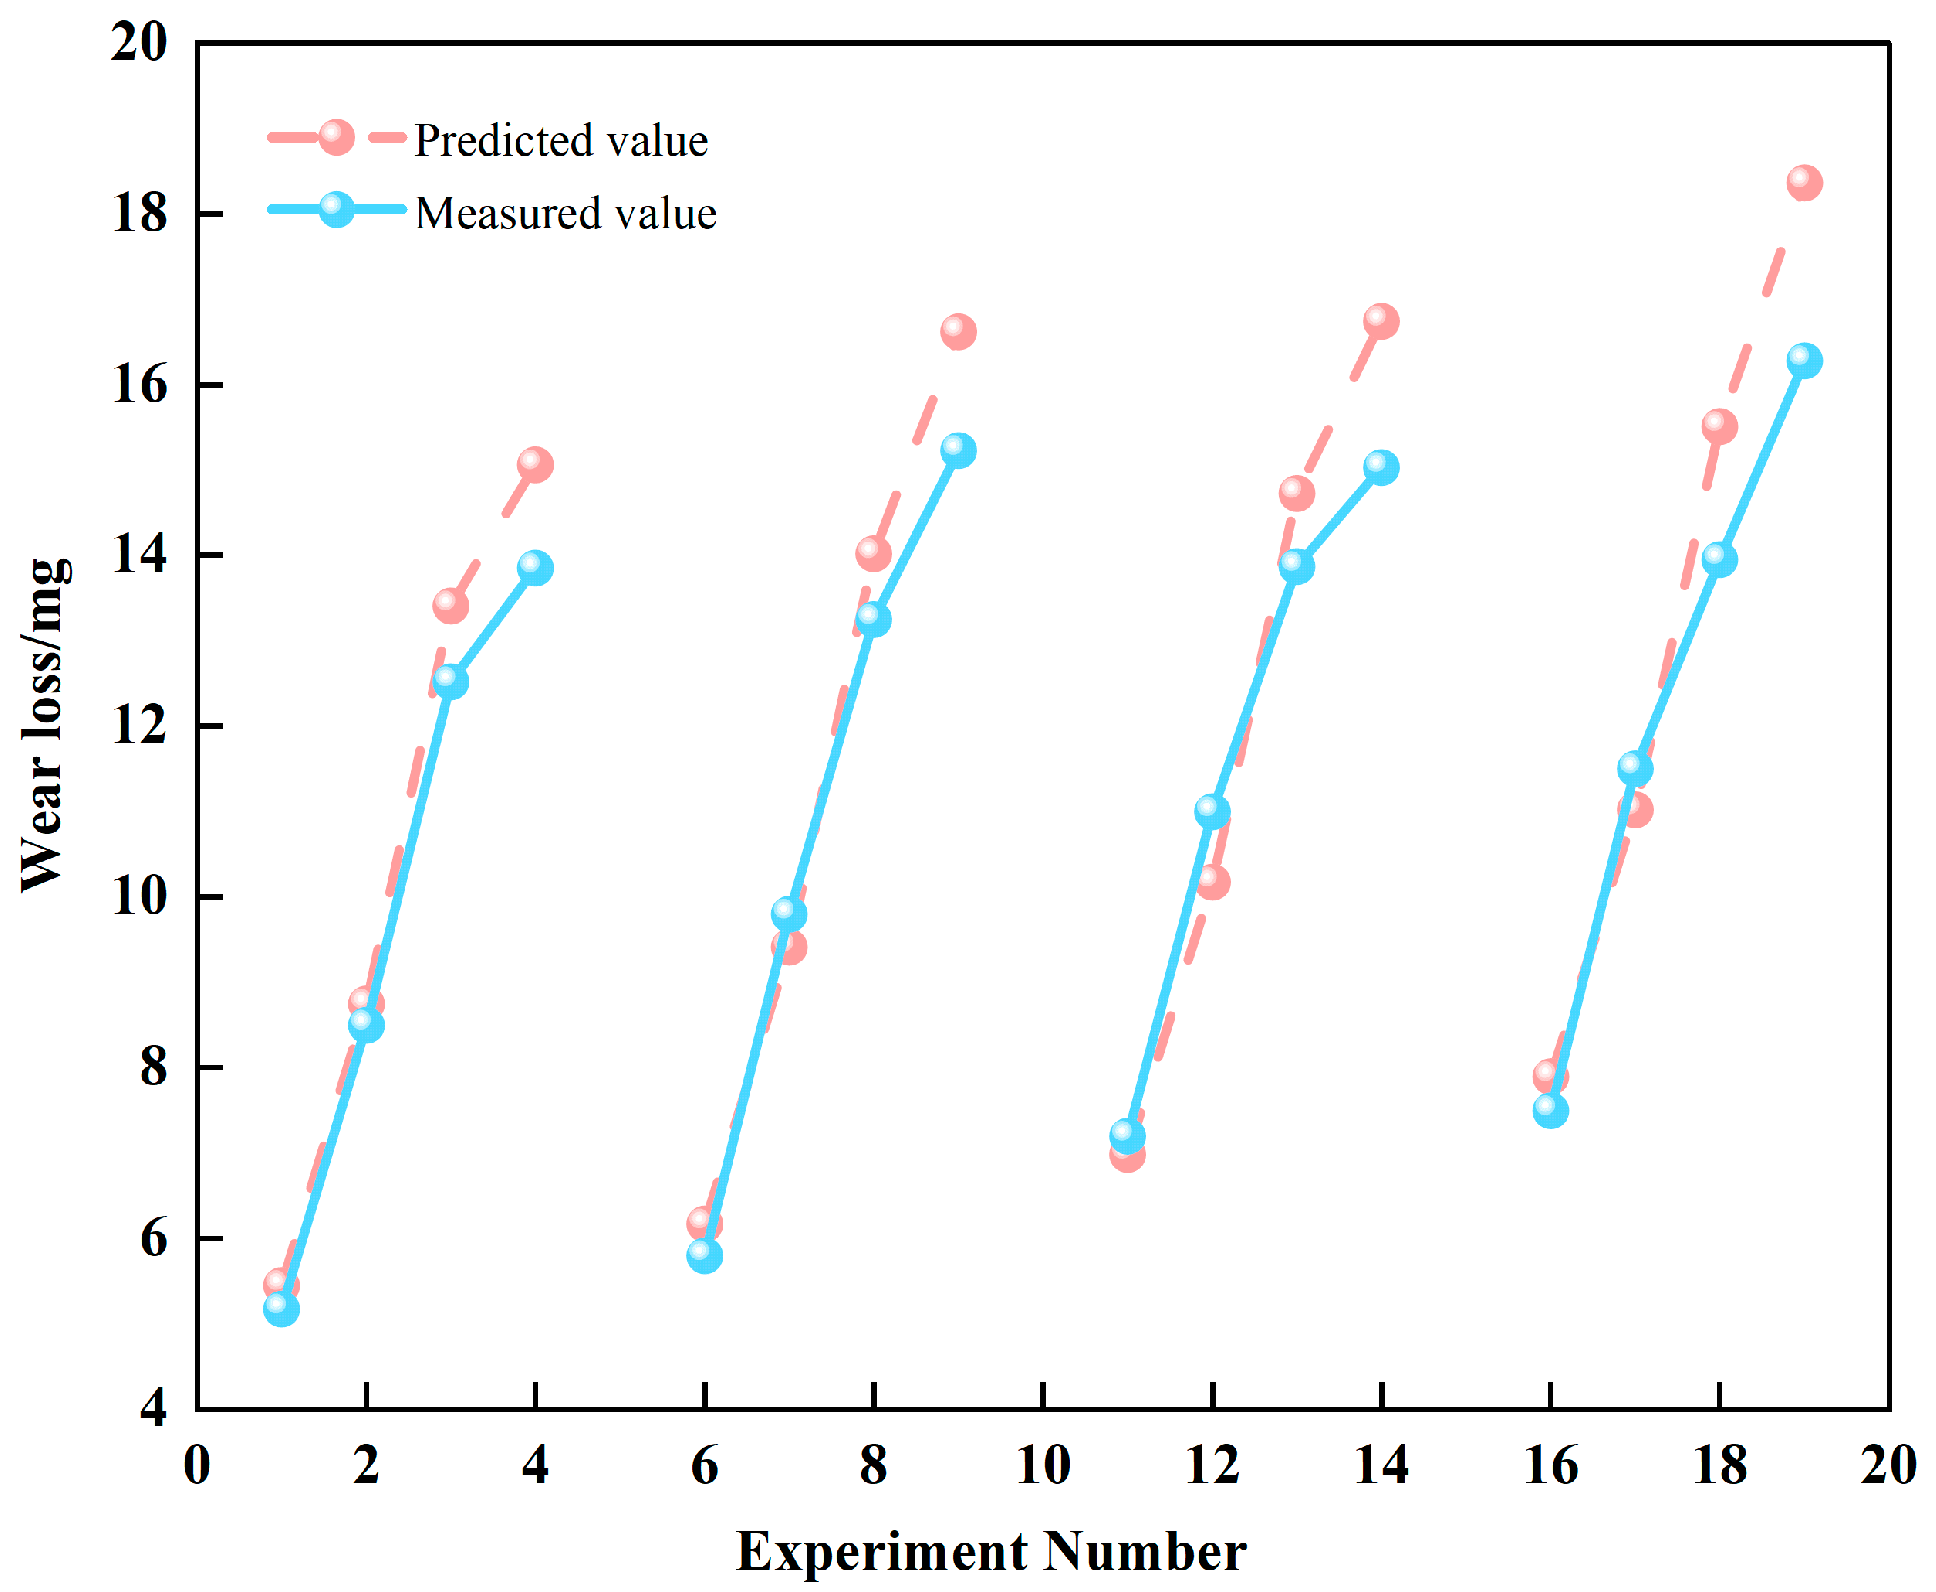
To verify the accuracy and reliability of the proposed wear model, an additional set of comparative validation experiments was conducted. The experimental conditions were set with a contact pressure of 90 N; contact currents of 100 A, 150 A, 200 A, and 250 A; and sliding speeds of 70 km/h, 90 km/h, 110 km/h, and 130 km/h. Under these varying conditions, the actual wear values of the pantograph slide were measured. Meanwhile, the corresponding predicted wear values were calculated by substituting the experimental conditions into the wear model.
The comparative validation experiments were divided into four unit groups, numbered (1, 2, 3, 4), (6, 7, 8, 9), (11, 12, 13, 14), and (16, 17, 18, 19). Within each unit group, the sliding speed was kept constant while the contact current increased sequentially. Between the different unit groups, the test points with the same position in the sequence were set to the same contact current, while the sliding speed increased progressively. The comparison between the predicted and actual wear values of the pantograph slide is shown in Figure 4.
As shown in Figure 4, the wear values of the pantograph slide calculated using the developed wear model closely approximate the experimentally measured values; however, there is still a certain degree of deviation between the predicted and actual wear values.
The relative errors between the predicted and actual wear values, as well as the average relative error, are presented in Table 2.
According to the distribution of the error data, the relative errors between the model predictions and the actual values are primarily concentrated below 10%, accounting for 81.25% of the validation data. The proportion of relative errors exceeding 10% is 18.75%, with the maximum relative error being 12.776% and the average relative error only 4.611%. Therefore, the model is considered effective and can be used to predict the wear of the pantograph slide.

5.2. Sensitivity Analysis of Pantograph Slide Wear Model

To quantify the impact of key parameter fluctuations on the model output and more accurately evaluate the model’s stability under real-world operations, this study included a local sensitivity analysis on the wear model (Equation (13)). Three core parameters—the contact pressure P, current I, and sliding speed v—were selected for ±10% perturbations around the baseline operating conditions (P = 90 N, I = 200 A, v = 100 km/h), with variations in the predicted wear rate calculated as follows:
S x = Δ m / m Δ x / x
Here, S x denotes the sensitivity coefficient of parameter x (dimensionless), Δm represents the variation in the predicted wear volume (unit: mg), m is the predicted wear volume under baseline conditions, Δx is the perturbation of parameter x, and x is the baseline value of parameter x (where x takes the values of F, I, or v).
The results, derived from the calculations, are presented in Table 3.
As shown in Table 3, the sensitivity coefficient of the current intensity I (0.97) exceeds that of the contact pressure F (0.79) and sliding speed v (0.93), indicating that the model is most sensitive to current perturbations. When the current fluctuates in practical scenarios, the model outputs may exhibit significant deviations, reflecting poor anti-interference capabilities for this parameter. Secondly, the low sensitivity of the contact pressure F suggests strong model robustness to withstand moderate perturbations. Using average sensitivity <1 as the benchmark for anti-interference capabilities, all parameters (I, F, v) meet the criterion. Overall, the model demonstrates strong anti-interference capabilities and good stability.

6. Discussion

6.1. Relationship Between Pantograph–Catenary Current-Carrying Frictional Energy Dissipation and Contact Current, Contact Pressure, and Sliding Speed

Under a sliding speed of 80 km/h and a contact pressure of 90 N, the characteristic curve of pantograph slide wear with respect to the frictional force under varying current conditions was obtained, as shown in Figure 5.
As shown in Figure 5, when the contact current is set to 100 A, 150 A, 200 A, and 250 A, the pantograph–catenary frictional force decreases, while the wear of the pantograph slide increases as the frictional force decreases. Under a constant sliding speed and contact pressure, the wear of the pantograph slide exhibits a negative correlation with the frictional force as the contact current increases. This is because, with an increasing contact current, the energy generated by the current increases, resulting in a rise in the surface temperature of the pantograph slide. This temperature rise causes the softening of the contact surface material, reduces the mechanical interlocking between micro-asperities, and lowers the shear resistance at the contact points. Consequently, the surface material and wear debris are more easily sheared and extruded, leading to increased pantograph slide wear. Additionally, the elevated temperature promotes oxidation reactions on the sliding electrical contact surface, forming an oxide film that provides a certain degree of lubrication. This reduces the friction coefficient and, in turn, the frictional force, which explains the observed decrease in the frictional force with increasing currents [28].
The variations in pantograph–catenary current-carrying frictional energy dissipation under different contact currents at a sliding speed of 80 km/h and a contact pressure of 90 N are shown in Figure 6.
As shown in Figure 6, with the increase in the contact current, there is a significant change in the energy contributions from the work done by friction and by the current. The energy generated by frictional work decreases, while the energy generated by electrical work increases gradually. At a contact current of 150 A, the energies contributed by both mechanisms are approximately equal. As the contact current continues to increase, the total dissipated energy increases accordingly. Combined with the analysis of Figure 5, it can be observed that, when the contact current is between 0 and 150 A, the pantograph–catenary frictional force remains relatively high, and the energy from frictional work exceeds that from electrical work, indicating that mechanical wear is dominant. When the contact current reaches 150 A, the energies from both sources are nearly balanced, suggesting a relative equilibrium between mechanical and electrical wear. At 200 A, electrical work produces more energy than frictional work, and, at 250 A, the energy from electrical work is approximately 3.35 times that from frictional work, indicating that electrical wear becomes the predominant wear mechanism for the pantograph slide.
The variations in pantograph–catenary current-carrying frictional energy dissipation under different contact pressures at a contact current of 150 A and a sliding speed of 100 km/h are shown in Figure 7.
As shown in Figure 7, with the increase in contact pressure, the energy generated by frictional work increases, while the energy generated by electrical work decreases, with the rate of decrease gradually slowing. During high-speed relative sliding between the pantograph slide and the catenary wire, the contact surface is rough and uneven, and only a limited number of microscopic contact spots are in actual contact. According to Hertzian elastic contact theory [29], when the contact pressure increases, elastic deformation occurs in the contact region, leading to an increase in the radius of the contact spots and a reduction in contact resistance. As a result, the energy generated by electrical work decreases. When the contact pressure reaches a certain level, the radius of the contact spots no longer increases significantly, and the variation in contact resistance stabilizes within a certain range, causing the decrease in electrical energy dissipation to slow down. Since the frictional force is directly proportional to the contact pressure, an increase in contact pressure leads to a greater frictional force and thus higher frictional energy dissipation. As the contact pressure continues to rise, the contact performance between the pantograph and catenary improves, resulting in reduced electrical wear and increased mechanical wear. Consequently, the total wear of the pantograph slide increases, and the dominant wear mechanism transitions to mechanically enhanced wear driven by Joule heating.
The variations in pantograph–catenary current-carrying frictional energy dissipation under different sliding speeds at a contact current of 200 A and a contact pressure of 90 N are shown in Figure 8.
As shown in Figure 8, both the energy generated by frictional work and the energy generated by electrical work gradually increase with rising sliding speeds. At a relatively high contact current, the electrical work causes a rapid temperature rise on the contact surface. Meanwhile, the increase in sliding speed enhances frictional heating, resulting in a further rise in frictional energy dissipation and an elevated surface temperature of the pantograph slide. The high temperature reduces the adhesive strength of the pantograph slide surface, thereby increasing adhesive wear. Additionally, as the sliding speed increases, the contact performance between the pantograph and catenary deteriorates, leading to higher inertial and aerodynamic forces induced by frictional vibrations. This increases the likelihood of multiple detachments between the pantograph slide and the contact wire. The resulting arc discharges during these detachments cause surface ablation, further intensifying the wear of the pantograph slide.
With the simultaneous increase in energy from both frictional and electrical work, the surface temperature of the pantograph slide continues to rise. The combined effects of temperature elevation and arc ablation contribute to increased electrical wear. At this stage, the dominant wear mechanism transitions to electrical wear characterized primarily by mild arc ablation. The erosive effect of arcing on the surface material of the pantograph slide becomes more pronounced, accelerating the wear.
Although the energy required to remove a unit mass of material remains constant, the prevailing wear mechanism changes as the wear process evolves. Different wear mechanisms involve different material removal modes, each requiring varying energy inputs. This shift in mechanism is a primary factor contributing to increased model prediction errors.

6.2. Wear Morphology of the Pantograph Slide Surface

The wear morphology of the pantograph slide surface was observed using a metallographic microscope to further analyze the wear mechanism of the strip and to clarify the applicability of the proposed wear model. Figure 9 presents the surface wear morphology of the pantograph slide under different operating conditions. Figure 9a shows the original surface morphology of the copper-impregnated carbon pantograph slide, where the black regions represent carbon and the small white particles correspond to metallic copper. The original surface appears relatively smooth, with copper particles randomly embedded within the carbon matrix.
As shown in Figure 9b, under a sliding speed of 80 km/h, contact pressure of 90 N, and contact current of 100 A, distinct plowing marks aligned with the sliding direction are observed, indicating that the dominant wear mechanism is abrasive wear. As seen in Figure 9c, when the contact current increases to 150 A, flake-like adhesive material and metal oxides of varying sizes are found on the worn surface. This is attributed to the increased energy generated by electrical work, which, in combination with frictional effects, rapidly raises the surface temperature. The elevated temperature induces the oxidation of the contact surface material, and, under sliding friction, material transfer occurs, leading to adhesive wear.
When the contact current reaches 200 A, as suggested by the energy diagram in Figure 6, the energy generated by electrical work increases significantly, initiating arc-induced ablation on the pantograph slide surface. In Figure 9d, arc erosion pits are observed; these pits are irregular in shape, with uneven edges, rougher than the surrounding unaffected areas, and exhibit signs of material melting. Additionally, cracks are present on the surface. Under the combined effects of mechanical action and thermal stress concentration, these cracks tend to propagate, further accelerating material loss and intensifying wear. This also indicates that, with an increasing contact current, the erosive effect of arc discharges on the pantograph slide surface becomes more pronounced and should not be neglected.
Due to the high energy contained in arc discharges during loss of contact, the ablation effect on the pantograph slide material is significant, leading to deviations between the predicted and actual wear values. The mathematical model for pantograph slide wear was developed under conditions where the contact current is below 250 A and does not account for the influence of arc energy. Clearly, neglecting the impact of arc discharges reduces the model’s predictive accuracy. In future work, parameters representing arc energy will be introduced to develop a segmented wear model for the pantograph slide, aiming to achieve more accurate predictions. Therefore, the wear model proposed in this study is applicable for the prediction of wear dominated by abrasive wear, adhesive wear, and mild arc ablation wear.
From the perspective of energy dissipation, the proposed wear model for the pantograph slide is characterized by using a single variable—pantograph–catenary current-carrying frictional energy dissipation—to represent the wear amount. This results in a simpler model structure. Since the energy dissipation is directly related to operational parameters such as the contact current, contact pressure, and sliding speed, the computational process is significantly simplified. Moreover, most conventional wear models do not consider the influence of the friction coefficient on pantograph slide wear. However, during the sliding electrical contact process, the friction coefficient varies across different wear stages, leading to different degrees of wear on the pantograph slide [30]. The energy dissipation-based wear model proposed in this study incorporates the variation in the friction coefficient, resulting in smaller prediction errors and improved accuracy in estimating pantograph slide wear.

7. Conclusions

From the perspective of system work, this study investigates the relationship between the wear of the pantograph slide and the current-carrying frictional energy dissipation in the pantograph–catenary system. A mathematical wear model for the pantograph slide based on energy dissipation is established and validated. Within the parameter ranges considered in this study, the main conclusions are as follows.
(1)
A method is proposed to quantitatively characterize the wear of the pantograph slide using the current-carrying frictional energy dissipation in the pantograph–catenary system. The study demonstrates a significant linear relationship between pantograph slide wear and current-carrying frictional energy dissipation.
(2)
A mathematical wear model for the pantograph slide based on energy dissipation was developed. The predicted results from the proposed model show good agreement with the experimental measurements, with a maximum relative error of 12.776% and an average relative error of only 4.611%, demonstrating its applicability in engineering practice.
(3)
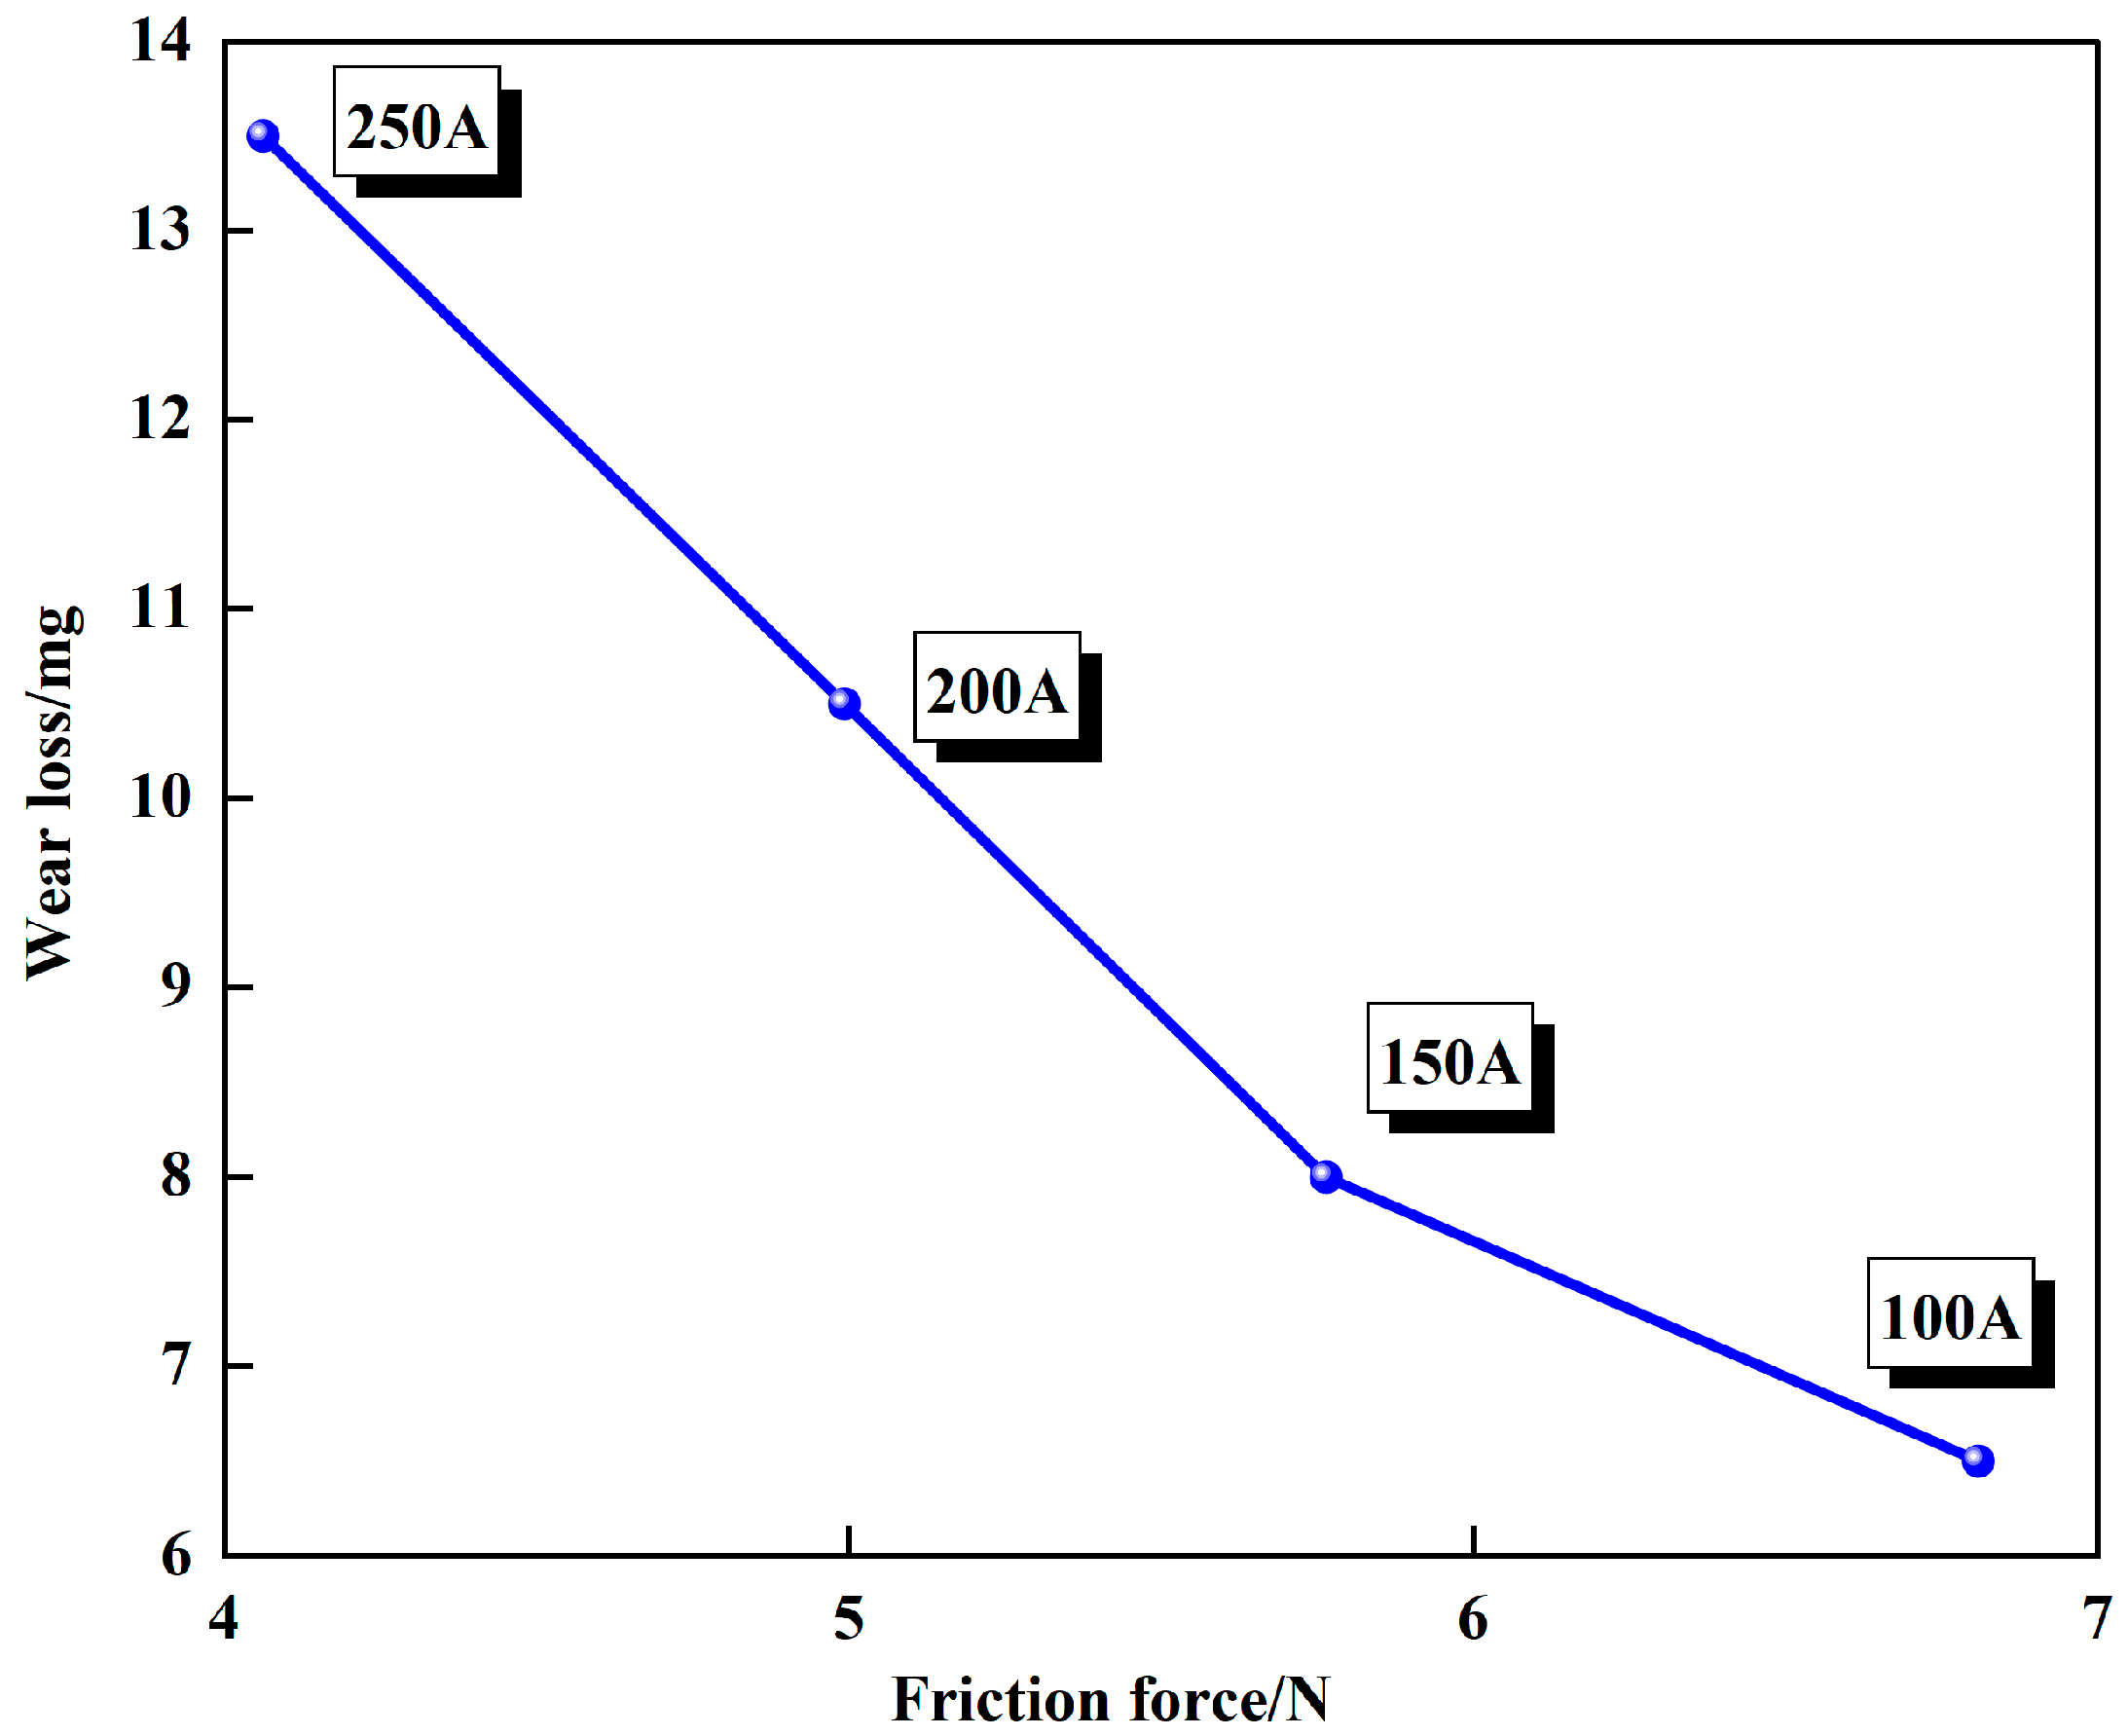
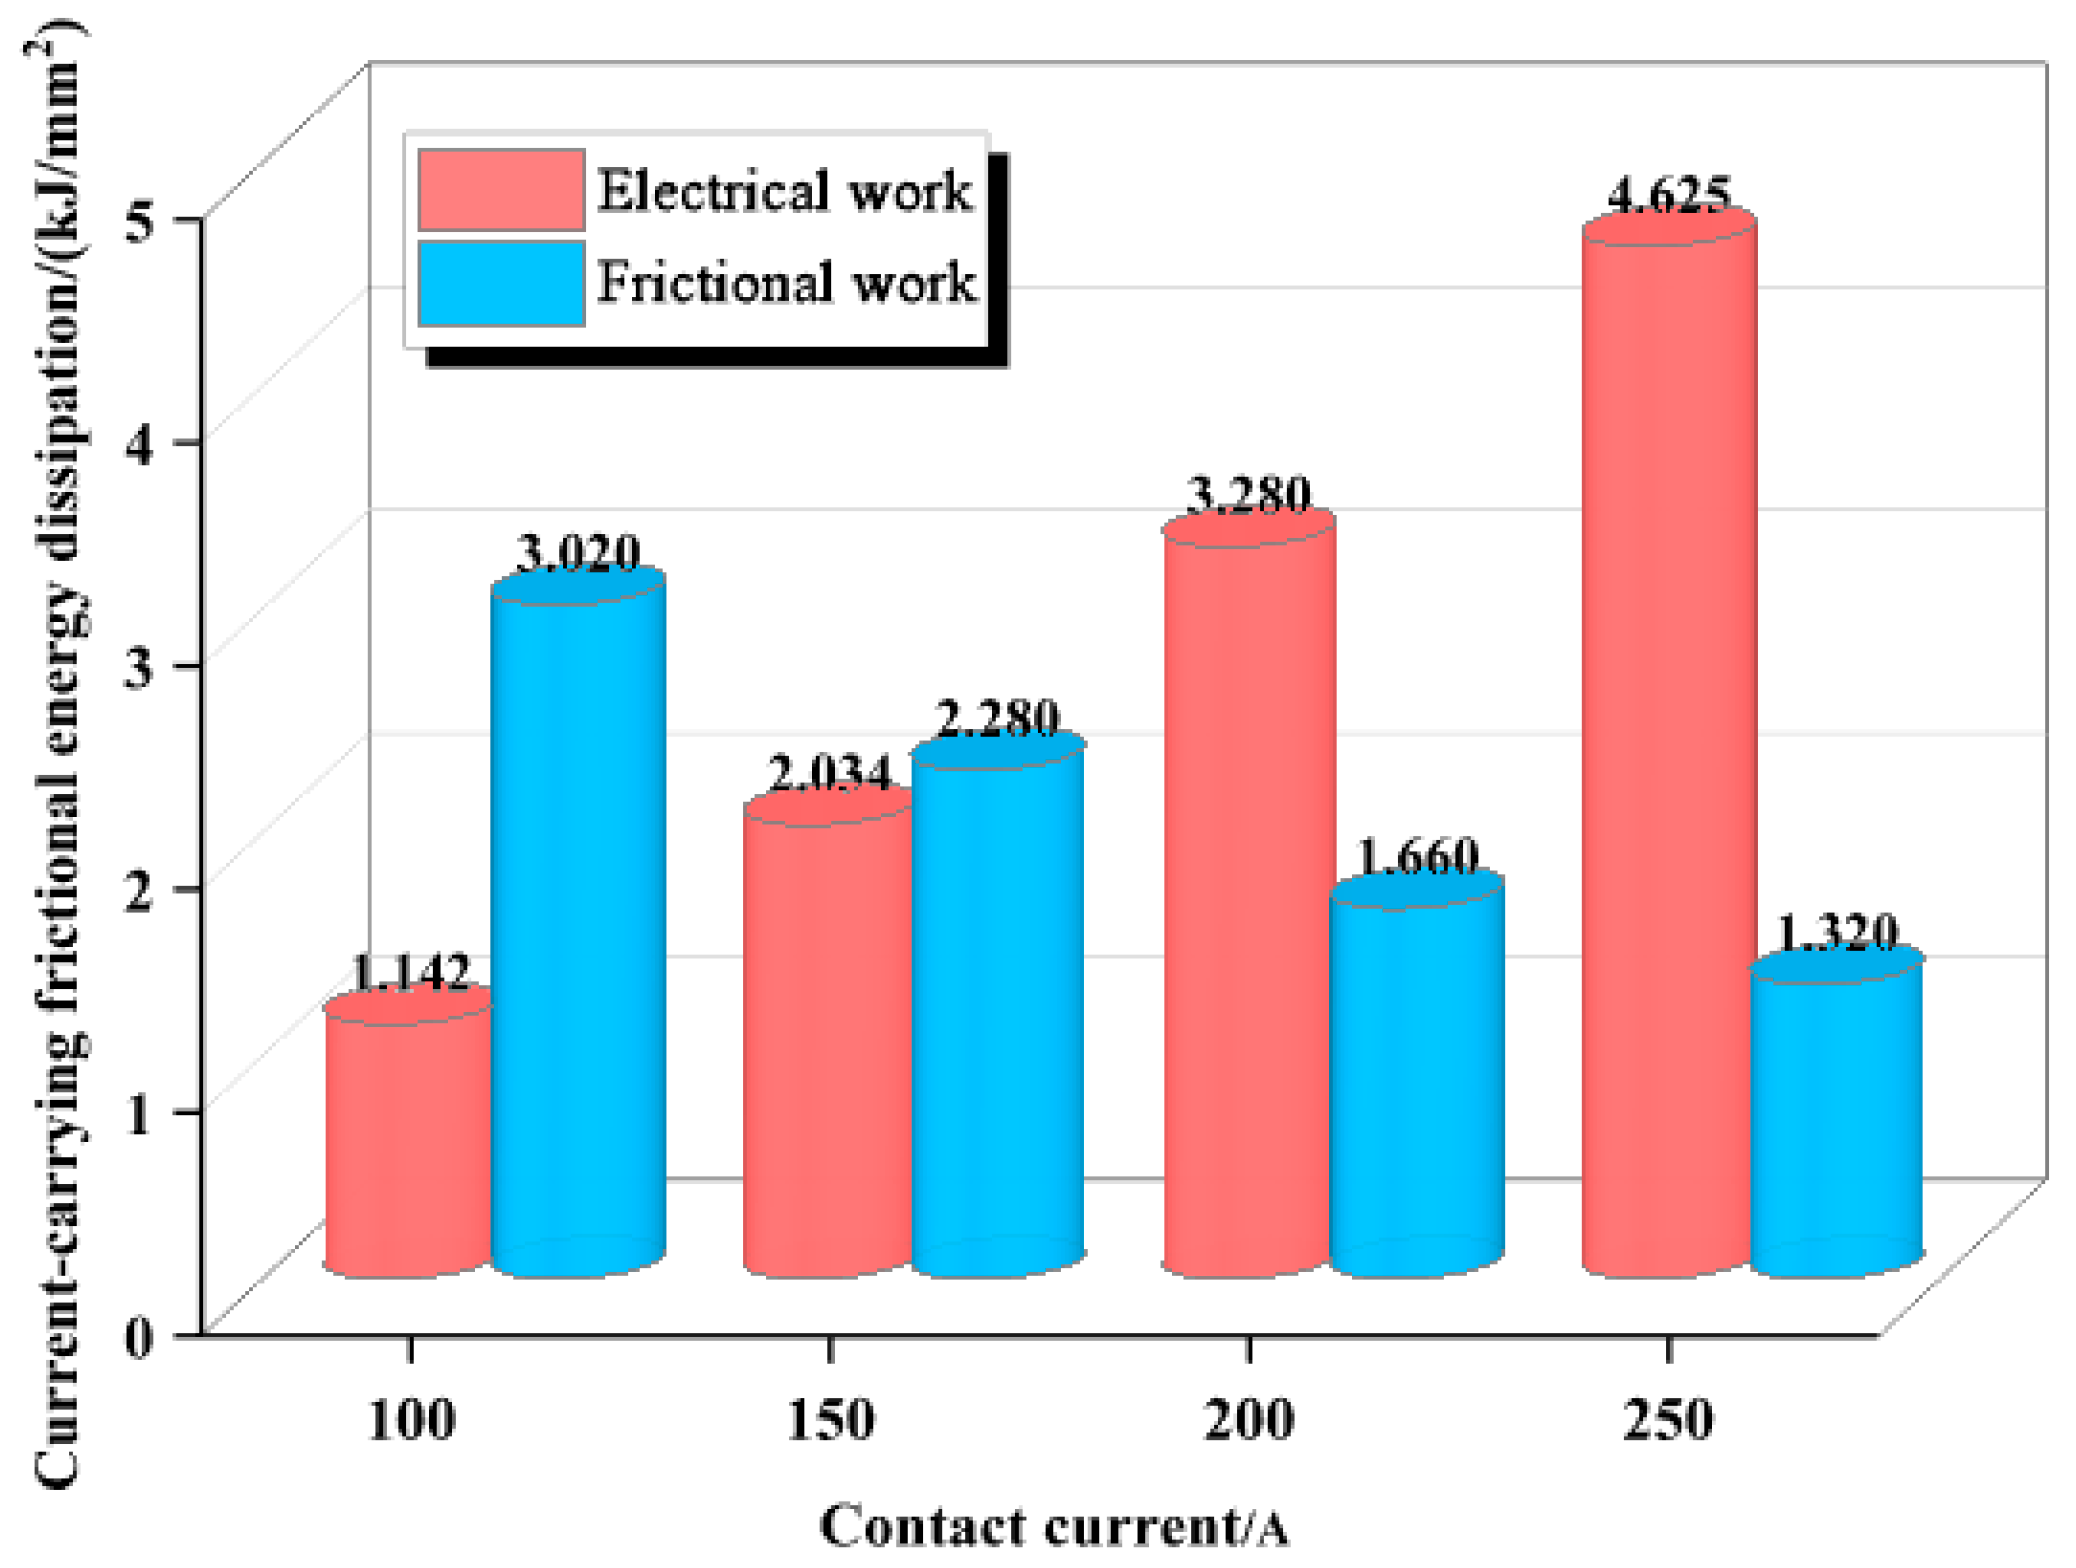
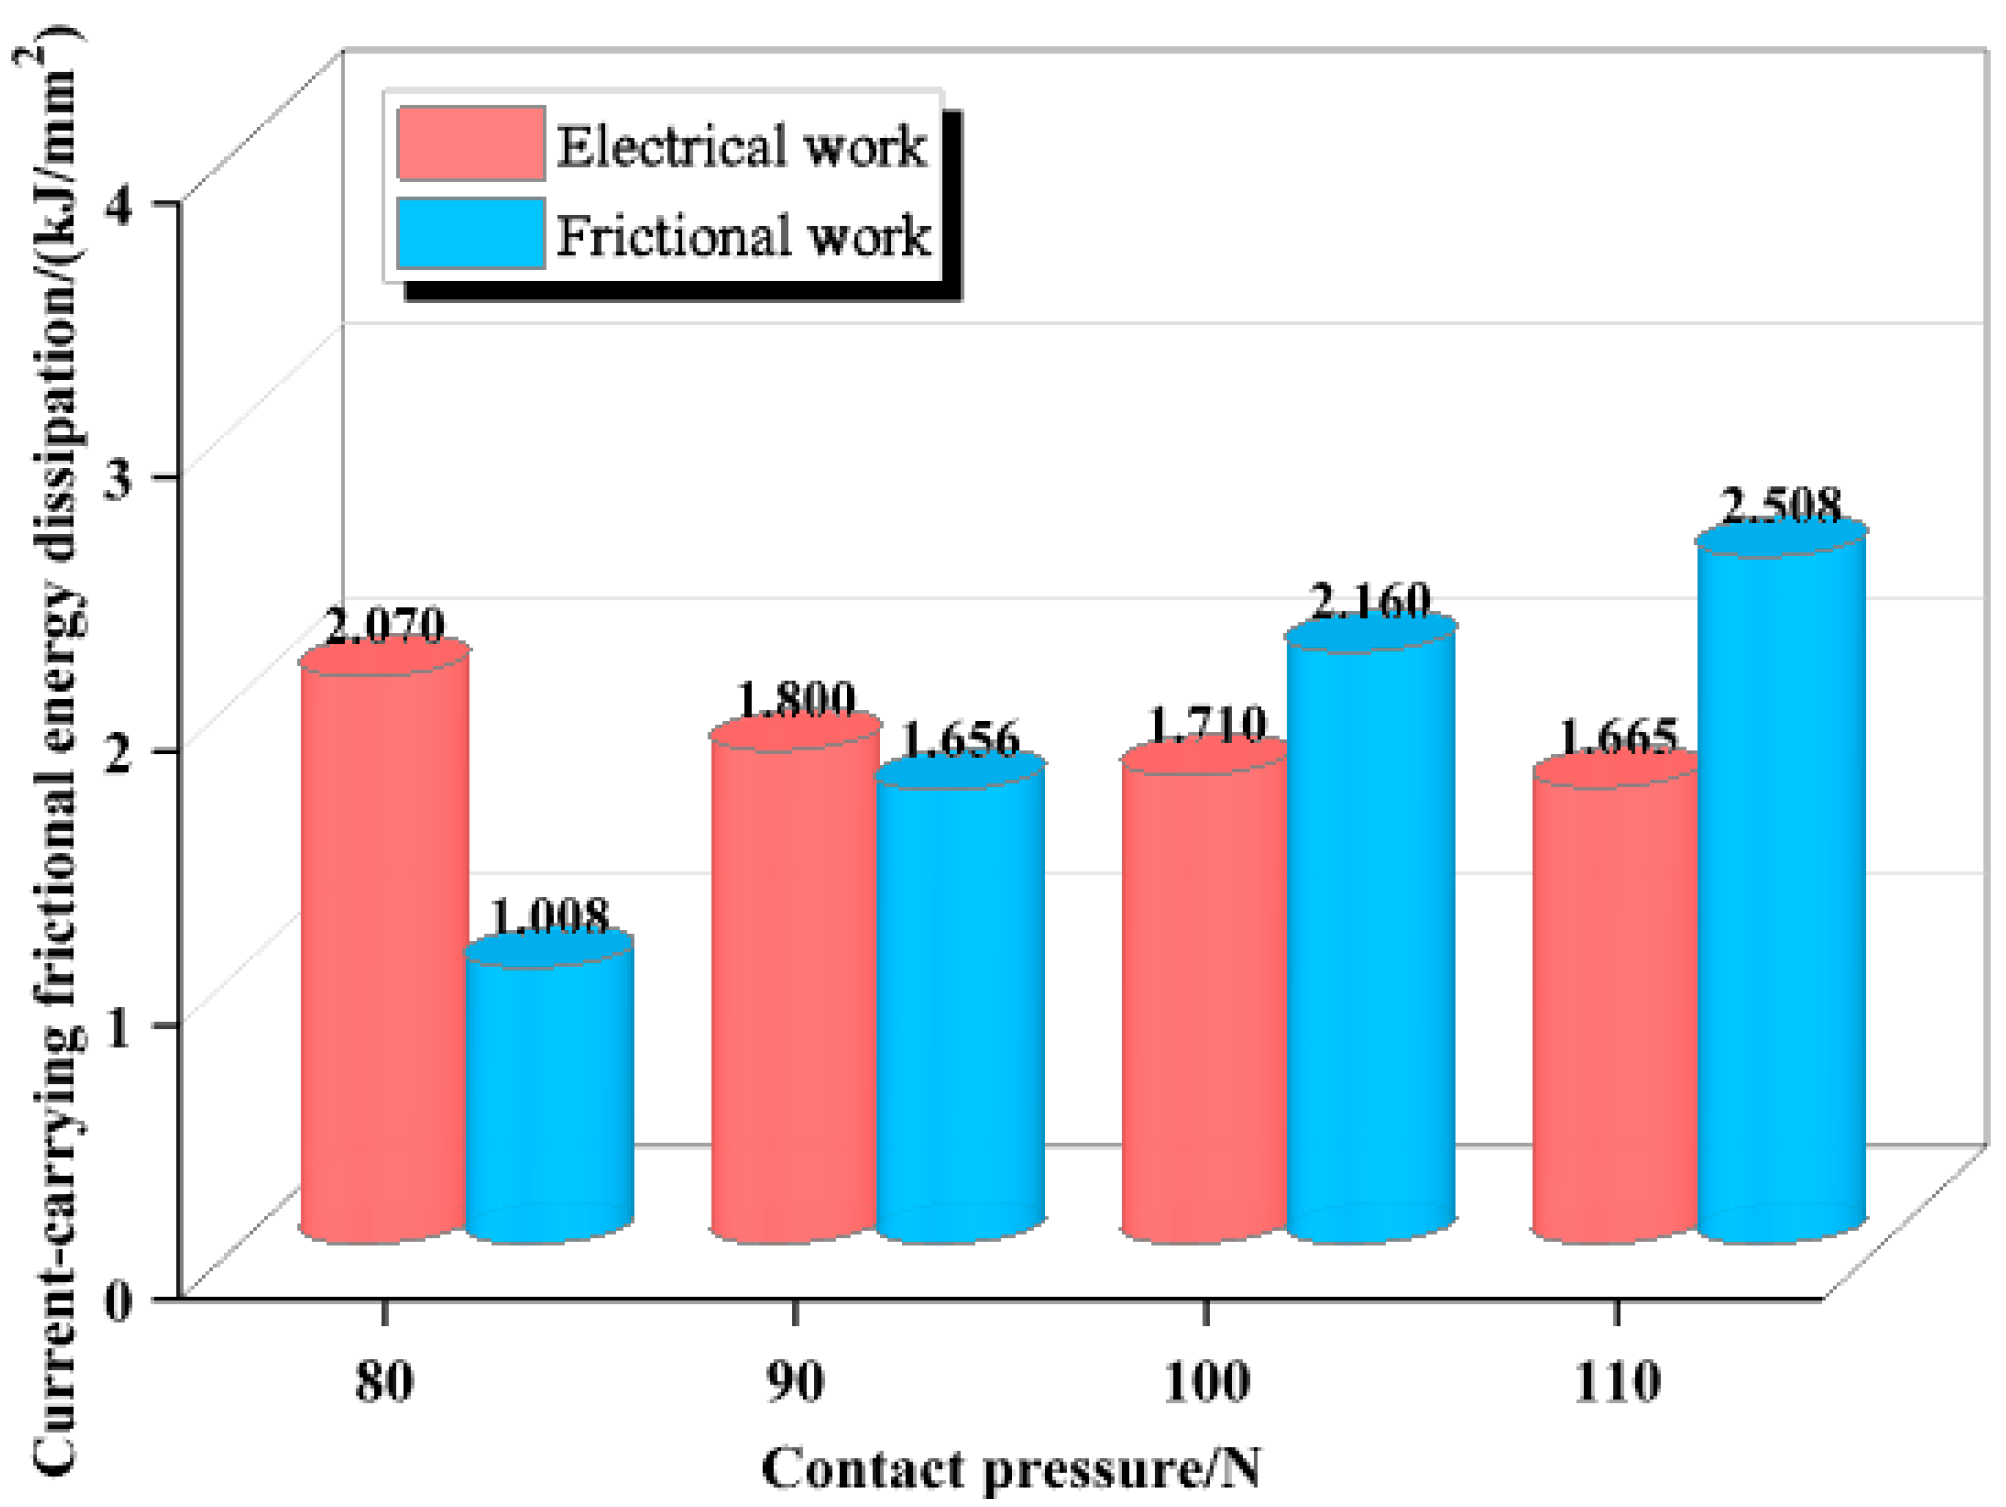
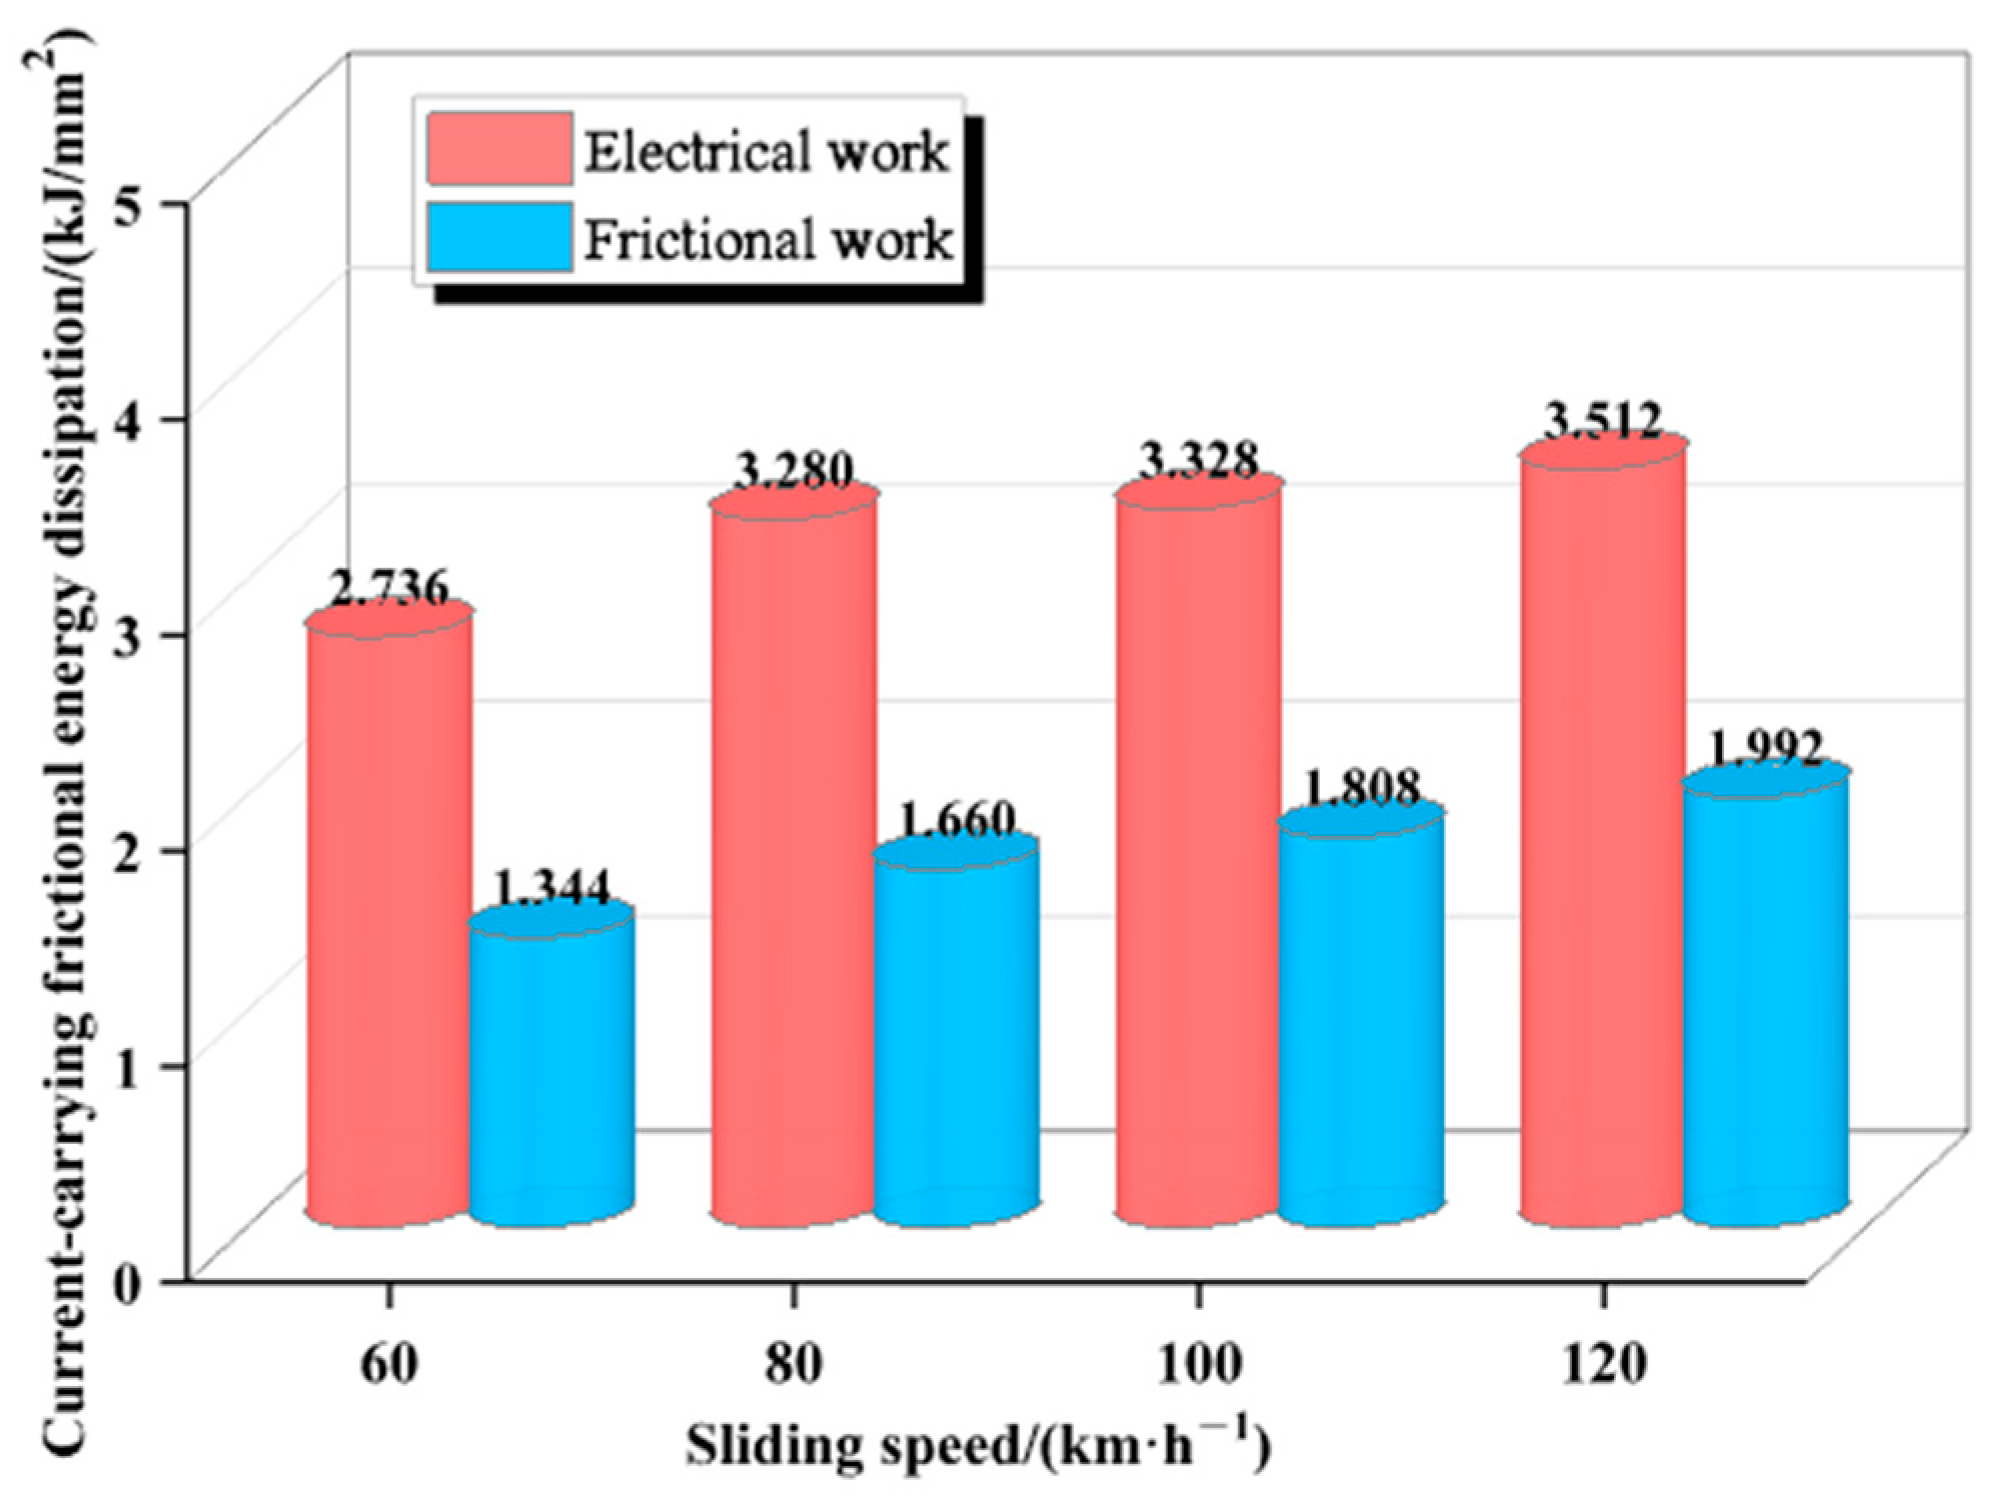
When the sliding speed and contact pressure are constant, the pantograph slide wear shows a negative correlation with the frictional force as the contact current increases; the energy generated by frictional work decreases, while the energy generated by electrical work increases. When the contact current and sliding speed are constant, an increase in contact pressure leads to an increase in the energy generated by frictional work and a decrease in the energy generated by electrical work, with the rate of decrease gradually slowing. When the contact current and contact pressure are constant, both the energy generated by frictional work and that generated by electrical work increase with rising sliding speeds.
The pantograph slide wear prediction model established in this study, as a foundational exploration, currently does not account for key uncertainty factors such as arcing energy during off-contact and environmental temperature–humidity fluctuations. Recognizing this limitation, future research will focus on the following directions to enhance the model’s prediction accuracy and applicability: (1) incorporation of uncertainty factors—based on the existing model framework, probabilistic characterization parameters for arcing energy and correction factors for environmental influences are planned to be introduced, aiming to construct a wear prediction model that more comprehensively reflects the complexity of the actual operating conditions; (2) deepening of physical model foundations—the simplifying conditions (e.g., linear assumptions) relied upon by the current model may become invalid beyond the specific operating conditions defined in this study. Thus, future work will explore modeling approaches for nonlinear effects and wear threshold behaviors to enhance the model’s physical rigor and broaden its applicability. It is important to emphasize that, despite the aforementioned limitations—including the exclusion of arcing and environmental uncertainties—the model proposed herein, as a novel research methodology, offers significant exploratory value in revealing the fundamental mechanisms of current-carrying tribo-wear in pantograph–catenary systems. This study lays the foundation for the development of more refined models in subsequent research.

Author Contributions

Conceptualization, B.L.; Methodology, Z.C.; Software, Y.D.; Formal analysis, H.W.; Investigation, H.W.; Resources, Z.C.; Data curation, Y.D.; Visualization, H.Z. All authors have read and agreed to the published version of the manuscript.

Funding

This research received no external funding.

Institutional Review Board Statement

Not applicable.

Informed Consent Statement

Not applicable.

Data Availability Statement

The data presented in this study are available on request from the corresponding author. The data are not publicly available due to the data in this study were obtained through dynamic loading tests and other measurements using a self-developed sliding electrical contact testing machine. These data involve the core technical details of our laboratory. Public disclosure of such data may pose significant risks to the operation of the custom-built testing equipment developed by the researchers.

Conflicts of Interest

Author Binghong Li was employed by the company State Grid Baiyin City Power Supply Company. The remaining authors declare that the research was conducted in the absence of any commercial or financial relationships that could be construed as a potential conflict of interest.

References

  1. Kuźnar, M.; Lorenc, A. A method of predicting wear and damage of pantograph sliding strips based on artificial neural networks. Materials 2022, 15, 98. [Google Scholar] [CrossRef]
  2. Bucca, G.; Collina, A. Electromechanical interaction between carbon-based pantograph strip and copper contact wire: A heuristic wear model. Tribol. Int. 2015, 92, 47–56. [Google Scholar] [CrossRef]
  3. Kuźnar, M.; Lorenc, A.; Kaczor, G. Pantograph sliding strips failure—Reliability assessment and damage reduction method based on decision tree model. Materials 2021, 14, 5743. [Google Scholar] [CrossRef]
  4. Zhou, N.; Cheng, Y.; Zhang, X.; Zhi, X.; Zhang, W. Wear rate and profile prediction of Cu-impregnated carbon strip for high-speed pantograph. Wear 2023, 530–531, 205056. [Google Scholar] [CrossRef]
  5. Shi, G.; Chen, Z.; Guo, F. Optimal normal load of sliding electrical contacts under high current. Trans. China Electrotech. Soc. 2014, 29, 23–30. [Google Scholar]
  6. Hu, Y.; Dong, B.; Zhou, P.; Chen, G. Study and application of the prediction formula of arc discharge energy and wear volume of pantograph-OCS system. Lubr. Eng. 2015, 40, 66–70. [Google Scholar]
  7. Xu, W.; Peng, J.; Qiu, C. Prediction model of subway pantograph slide pan wear trend based on LSSVR. Railw. Comput. Appl. 2020, 29, 77–81. [Google Scholar]
  8. Xie, B.; He, Z.; Deng, L.; Yin, C.; Ni, Z.; Lin, G.; Yang, Z. Wear prediction of metal-impregnated carbon strip considering temperature effect. Railw. Stand. Des. 2022, 66, 179–184. [Google Scholar]
  9. Chen, Z.; Li, J.; Xing, Z.; Wang, X.; Shi, G. Analysis and modeling of wear characteristics of pantograph-catenary sliding electrical contact under high current. J. Liaoning Tech. Univ. (Nat. Sci.) 2023, 42, 740–747. [Google Scholar]
  10. Derosa, S.; Nåvik, P.; Collina, A.; Bucca, G.; Rønnquist, A. A heuristic wear model for the contact strip and contact wire in pantograph–Catenary interaction for railway operations under 15kV 16.67Hz AC systems. Wear 2020, 456–457, 203401. [Google Scholar]
  11. Lim, S.C.; Ashby, M.F. Wear-mechanism maps. Acta Metall. 1987, 35, 1–24. [Google Scholar] [CrossRef]
  12. Bucca, G.; Collina, A. A procedure for the wear prediction of collector strip and contact wire in pantograph–catenary system. Wear 2009, 266, 46–59. [Google Scholar] [CrossRef]
  13. Wei, X.K.; Meng, H.F.; He, J.H.; Jia, L.M.; Li, Z.G. Wear analysis and prediction of rigid catenary contact wire and pantograph strip for railway system. Wear 2020, 442–443, 203118. [Google Scholar] [CrossRef]
  14. Zhang, G.; Liu, Y.; Wang, Y.; Liu, X. A friction-dissipation based method for quantity model and prediction of graphite/WC-Ni wear under dry sliding. Tribology 2019, 39, 221–227. [Google Scholar]
  15. Abdo, J. Materials sliding wear model based on energy dissipation. Mech. Adv. Mater. Struct. 2015, 22, 298–304. [Google Scholar] [CrossRef]
  16. Jahangiri, M.; Hashempour, M.; Razavizadeh, H.; Rezaie, H.R. A new method to investigate the sliding wear behaviour of materials based on energy dissipation: W–25wt%Cu composite. Wear 2012, 274–275, 175–182. [Google Scholar] [CrossRef]
  17. Myśliński, A.; Chudzikiewicz, A. Power dissipation and wear modeling in wheel–rail contact. Appl. Sci. 2024, 14, 165. [Google Scholar] [CrossRef]
  18. Smerdova, O.; Mazuyer, D.; Cayer-Barrioz, J. Links between energy dissipation and wear mechanisms in solid epoxy/epoxy sliding contact. Tribol. Int. 2014, 77, 148–159. [Google Scholar] [CrossRef]
  19. Zhang, L.; Wang, H.; Liu, D.; Zhang, Q.; Guo, W.; Yang, N.; Xu, J.; Fu, S.; Yang, B.; Liu, S.; et al. Research on wear detection mechanism of cylinder liner-piston ring based on energy dissipation and AE. Wear 2022, 508–509, 204472. [Google Scholar] [CrossRef]
  20. Wang, J.; Li, Y.; Zhao, R. Physics guided neural network for machining tool wear prediction. Journal of Manufacturing Systems. 2020, 57, 298–310. [Google Scholar] [CrossRef]
  21. Wang, H.; Han, Z.; Liu, W. A Reinforcement Learning-Based Pantograph Control Strategy for Improving Current Collection Quality in High-Speed Railways. IEEE Trans. Neural Networks Learn. Syst. 2022, 33, 5915–5928. [Google Scholar] [CrossRef] [PubMed]
  22. Han, G.; Sun, Y.; Feng, Y. Artificial Intelligence Guided Thermoelectric Materials Design and Discovery. Advanced Electronic Materials 2023, 9, 8. [Google Scholar] [CrossRef]
  23. Wang, Y.; Liu, Z.; Huang, K.; Gao, S. Pantograph-catenary surface heat flow analysis and calculations based on mechanical and electrical characteristics. J. China Railw. Soc. 2014, 36, 36–43. [Google Scholar]
  24. Wu, J. Pantograph and Catenary System; Southwest Jiaotong University Press: Chengdu, China, 2010. [Google Scholar]
  25. Ramalho, A.; Miranda, J. The relationship between wear and dissipated energy in sliding systems. Wear 2006, 4–5, 361–367. [Google Scholar] [CrossRef]
  26. Chen, Z.; Sun, G.; Shi, G.; Hui, L. Study on characterization and model of friction of sliding electrical contact of pantograph-catenary system. In Proceedings of the 43rd Annual Conference of the IEEE Industrial Electronics Society, Beijing, China, 29 October–1 November 2017; IEEE: Piscataway, NJ, USA, 2017; pp. 2312–2317. [Google Scholar]
  27. Lao, Z.; Xia, B.; Wang, W.; Sun, W.; Lai, Y.; Wang, M. A novel method for lithium-ion battery online parameter identification based on variable forgetting factor recursive least squares. Energies 2018, 11, 1358. [Google Scholar] [CrossRef]
  28. Wang, Y.A.; Li, J.X.; Yan, Y.; Qiao, L.J. Effect of surface film on sliding friction and wear of copper-impregnated metallized carbon against a Cu–Cr–Zr alloy. Appl. Surf. Sci. 2012, 258, 2362–2367. [Google Scholar] [CrossRef]
  29. Greenwood, J.A.; Johnson, K.L.; Matsubara, E. A surface roughness parameter in Hertz contact. Wear 1984, 100, 47–57. [Google Scholar] [CrossRef]
  30. Ding, T.; Xuan, W.; He, Q.; Wu, H.; Xiong, W. Study on friction and wear properties of pantograph strip/copper contact wire for high-speed train. Open Mech. Eng. J. 2014, 8, 125–128. [Google Scholar] [CrossRef]
Figure 1. Sliding electrical contact experimental machine.
Applsci 15 06748 g001
Figure 2. Curve of pantograph–catenary current-carrying friction dissipation energy and wear volume.
Applsci 15 06748 g002
Figure 3. Relationship between pantograph–catenary current-carrying friction dissipation energy and wear volume.
Applsci 15 06748 g003
Figure 4. Comparison between predicted values and actual values of wear volume.
Applsci 15 06748 g004
Figure 5. Characteristic curve of wear volume with friction under variable current.
Applsci 15 06748 g005
Figure 6. The variation law of the pantograph–catenary current-carrying friction dissipation energy under different contact currents.
Applsci 15 06748 g006
Figure 7. The variation law of the pantograph–catenary current-carrying friction dissipation energy under different contact pressure.
Applsci 15 06748 g007
Figure 8. The variation law of the pantograph–catenary current-carrying friction dissipation energy under different sliding speeds.
Applsci 15 06748 g008
Figure 9. Wear morphology of pantograph slide surface: (a) original surface morphology of pantograph slide; (b) 80 km/h, 90 N, 100 A; (c) 80 km/h, 90 N, 150 A; (d) 80 km/h, 90 N, 200 A.
Applsci 15 06748 g009
Table 1. Physical parameters of slide and contact wire.
Parameter NameContact WireContact Slide
Brinell hardness /(N/mm2)96.249.4
Electrical resistivity /(Ω·mm)2.4 × 10−50.01
Thermal conductivity /(W/mm·°C)0.3980.006
Modulus of elasticity /(GPa)11913
Poisson’s ratio0.3260.425
Table 2. Prediction error values of wear model.
Experiment IDRelative Error (%)Mean Relative Error (%)
15.3914.611
22.929
37.109
48.736
66.397
7−3.908
85.811
99.127
11−2.958
12−7.500
136.164
1411.364
165.333
17−4.174
1811.183
1912.776
Table 3. Sensitivity coefficients of key parameters.
Parameter+10% Variation Rate−10% Variation RateAverage Sensitivity
Contact Pressure (F)+8.2%−7.5%0.79
Electricity (I)+10.1%−9.3%0.97
Sliding Speed (v)+9.7%−8.9%0.93
Disclaimer/Publisher’s Note: The statements, opinions and data contained in all publications are solely those of the individual author(s) and contributor(s) and not of MDPI and/or the editor(s). MDPI and/or the editor(s) disclaim responsibility for any injury to people or property resulting from any ideas, methods, instructions or products referred to in the content.

