1. Introduction
Today, minimizing the total cost and maximizing customer satisfaction have become the primary goals for companies in the service industry. Delivering the service to the customer when the customer needs it is the most decisive criterion of customer satisfaction. Especially in the banking sector, where continuous development and change are experienced, institutions must improve their competitive conditions in terms of performance evaluations [
1]. The fact that banks focus on technological investments and offer innovative products and services further increases the competition in the sector. For this purpose, banks are investing more in mobile applications and the Internet. ATMs are one of the most prominent examples of these investments.
ATMs play a significant role for banks as they contribute to sustainability in the banking industry and reduce transaction costs. ATMs are the first alternative node of service delivery that enables faster delivery of banking services. ATMs have many advantages, such as serving customers in a broader geography, reducing the density of bank branches, and additional commission income. Due to the increasing speed of digitalization and globalization, the number of ATMs is increasing daily [
2].
On the other hand, ATM management is a complex process with many variables and outsourced companies such as customers, headquarters, branches, and CIT operations. However, cash management consists of many sub-processes, such as distribution, security, and maintenance. The location of the ATM plays a significant role in the distribution process, which is included in these processes. The location of ATMs is vital because it affects profitability, customer satisfaction, and possible losses [
3]. If banks install ATMs in inappropriate places, problems such as the machines not being used optimally by customers and an increase in operating costs arise. Accordingly, ATMs have to be moved or reactivated due to wrong decisions. As customers can perceive this situation, it may result in a loss of reputation for the bank.
Several studies use different methods to determine the best location for ATMs. Li et al. developed a model combining the Geographic Information System (GIS) and a mathematical model. In the model, they make predictions by investigating the factors in the location planning of ATMs, thanks to the particle swarm optimization algorithm [
4]. On the other hand, Min and Melachrinoudis discuss the location selection problem hierarchically, such as ATMs, bank branch offices, and central banks, and propose a stochastic model for solving the problem. The proposed model can work with different dynamically changing scenarios and can balance conflicting objectives such as profit and risk depending on the bank’s strategies according to the changing situations. The model also considers the uncertainty and stochasticity caused by the variability of criteria such as taxes, interest rates, and inflation [
5], and in their study using GIS, Wang and Wang developed an area density and linear population carrying capacity model based on the people, economic situation, and existing ATM network in the district they examined. In this way, ATM distribution imbalances could be eliminated, and the coverage area could be maximized [
6]. In another GIS study, potential ATM locations were determined by considering existing ATM locations, customer density, road network, and other facilities [
7]. In another study, Bilginol et al. addressed the ATM location problem with regression analysis, one of the statistical methods. After determining the criteria affecting site selection by correlation analysis, optimum ATM locations were found with least squares regression analysis [
8].
Several studies have utilized decision trees, clustering algorithms, and statistical models to determine optimal ATM locations based on criteria such as population density, competition, or rent costs [
9,
10,
11]. Since the ATM location decision has criteria that can be measured or expressed with subjective evaluations, it has also been the subject of studies on multi-criteria decision-making (MCDM) methods. Genevois et al. determined the quantitative and qualitative criteria to be considered in ATM site selection and obtained the importance levels of these criteria with the Analytic Network Process (ANP). According to the results of the study, while the most important criterion in the selection of the place is the salary payment point, it is observed that the average age of the population, the number of credit cards from other banks, the salary amount, and the number of employees in the company do not affect the selection [
12]. Shahhoseini and Attari proposed a new model consisting of the fuzzy AHP and fuzzy ELECTRE III to find the optimal location for newly installed ATMs. Fuzzy AHP was used to find the criterion weights in the model, and the most important criterion was available ATM locations, including competing banks. A ranking of alternative ATM locations was obtained with ELECTRE III [
13].
Turkoglu et al. (2018) [
14] proposed, on the other hand, a new methodology consisting of ANP and goal programming to solve the site selection problem and support the methodology with a case study. In the proposed hybrid approach, ANP was used to obtain the weights of the criteria that were effective in site selection. With goal programming, they found the most suitable number of ATMs and their locations, minimizing the total number of ATMs and the distance between ATMs and customers and maximizing the total weighted score of the locations [
14]. In their study, Yıldız et al. used the Modified Delphi method to evaluate experts’ criteria in ATM location problems. In the study, criterion weights were found by Pythagorean Fuzzy AHP, and the best alternative was found by Pythagorean Fuzzy Technique for Order Preference by Similarity to Ideal Solution (TOPSIS). The sensitivity analysis also discussed the study’s results [
15]. Syahputra et al. determined the criteria and alternatives based on the customer data collected through the survey and chose the best ATM location using the AHP method. The study results showed the advantage of the AHP method in making quick decisions by considering customer requests among many alternatives in the ATM location problem [
16].
When the studies in the literature are examined, a limited number of studies are found in which the ATM location problem is handled with GIS, data mining algorithms, heuristic algorithms, goal programming, and MCDM methods. In the existing studies, the problem of ATM location selection has been chiefly addressed regarding accessibility, customer satisfaction, and profitability. However, unlike the literature in this study, the safety risk is emphasized in the ATM location selection problem.
Although the ATM location selection problem is generally addressed in terms of accessibility, satisfaction, and profitability in the existing literature, the operational efficiency of ATMs cannot be evaluated only by the correct location. For effective ATM management, cash-handling processes must also be optimized. Therefore, studies on routing between ATMs and CIT processes are becoming increasingly important.
Bozkaya et al. (2017) [
17] proposed an adaptive algorithm for optimizing CIT routes to minimize transport costs and safety risks. In the proposed model, the capacitated vehicle routing problem with time windows was considered to reduce the re-use of the route with high safety risk by considering the routes used in the past days. The model was tested with the data of a real CIT provider for different risk and cost scenarios, and it was observed that the model minimized the security risk and increased efficiency [
17]. Jin et al. applied a two-stage algorithm with economic and environmental objectives to the cash transport vehicle routing problem. A real case study using the Nearest Neighbor-First Iterated Local Search-Second Algorithm (NN-ILS) and real-time traffic data was discussed, and it was proved that lower cost, operational risk, and environmental impact were achieved compared to classical methods [
18]. Ge et al. (2023) [
19] addressed the cash transport risk-constrained routing problem with multiple depots for cash transport vehicles with two models aiming at economic and environmental optimization. In the first model, emission and total distance minimization were performed, while in the second model, goal programming was used to optimize the objectives the decision-maker set. While the first model focused on minimizing total distance and emissions by providing a dual-objective optimization framework, the second model aimed to find optimal solutions to decision-makers’ objectives using a goal-programming approach. Two different algorithms, the Hybrid Genetic Algorithm (HGAI) and the Self-Constraining Hybrid Genetic Algorithm (SHGA), were proposed in the study. The accuracy of these models was tested with real-time traffic data. One of the most important contributions of the study was developing a dynamic route update strategy sensitive to traffic flow and creating routes that minimized risks [
19,
20].
In this study, a two-stage approach is proposed for ATM location selection and routing optimization that primarily considers security risk. In the first [
19,
20] stage, districts are evaluated based on safety risk, and the most suitable ATM location within high-risk areas is determined using a novel methodology that combines clustering with interval-valued Fermatean fuzzy AHP (IVFF-AHP). In the second stage, the CIT routing problem is addressed using Deep Reinforcement Learning (DRL), which enables adaptive and cost-effective route planning. This integrated framework offers a unique contribution by simultaneously addressing strategic location planning and operational logistics within a risk-aware structure.
Accordingly, the study aims to answer the following research question: “How can banks optimize the placement of ATMs and the routing of cash transfers to ensure the efficient and secure delivery of services?”.
Although many previous studies have focused on ATM location selection using GIS, clustering, MCDM, or statistical methods, they have primarily emphasized accessibility, customer density, or profitability. In contrast, this study introduces a novel perspective by incorporating security risk as a core factor in location decisions and further combines this with operational routing optimization, creating an integrated and realistic approach that is largely absent in the existing literature. The proposed approach demonstrates innovative applicability by addressing both strategic planning (location selection) and operational execution (cash-in-transit routing) within a unified framework. This dual-focus design enhances the real-world relevance of the study, especially for banks seeking to optimize both placement and logistics under safety constraints.
The main contributions of this paper are as follows:
- (1)
It introduces a two-stage hybrid framework that combines clustering and IVFF-AHP for ATM location selection that primarily considers security risk.
- (2)
It is the first study to apply the IVFF-AHP method in this domain, offering improved handling of uncertainty in multi-criteria decision-making.
- (3)
It integrates DRL into the ATM cash-routing problem—an approach not previously explored in the literature.
- (4)
It provides a realistic solution structure that banks can implement in practice to enhance both efficiency and security in ATM operations.
The remainder of the article is organized as follows:
Section 2 includes the main and sub-criteria considered in ATM location selection.
Section 3 presents the proposed methodology.
Section 4 contains a real case study applying the proposed method.
Section 5 summarizes the results of this study and presents its limitations. The last section presents the results of this study and future research directions.
2. The Criteria Selection
The criteria for the ATM location problem are determined based on the literature and classified into four main criteria: traffic, demographic, commercial and financial, and environmental (
Table 1).
ATMs located on busy streets and roads with heavy traffic are mostly used. For this reason, traffic density [
12,
13,
14,
22], number of traffic lights, number of cameras, and average vehicle speed [
21] are collected for traffic criteria.
Since ATM demand will be affected by the district’s population, population density is an essential criterion in site selection [
6,
9,
11,
12,
14,
22,
23]. The average age and education level of the population affect ATM usage habits. Other ATMs located close to the ATM may adversely affect the demand for the relevant ATM [
14,
21]. On the other hand, in some cases, the existing ATMs are not enough to meet the district’s needs. For this reason also, the number of ATMs in the district is an important criterion in site selection [
9,
14]. In addition, ATMs are used more often in districts with high socioeconomic status and urbanization rates [
15] than in districts with low socioeconomic status [
11,
21,
23].
A certain income is expected from those performing transactions at ATMs [
14,
21]. In addition, if there are no ATMs of other banks in the district where the ATM will be installed, the customers of those banks will also use the ATM to be installed. For this reason, the relevant bank charges a transaction commission fee for providing services to the other bank’s customers. However, banks incur a certain setup and operational cost to operate their ATMs [
14,
21].
The usage rate of ATMs close to buildings with high population density, such as business centers, schools, hospitals, and shopping malls, may increase ATMs [
21]. Since the ATMs of foreign banks will be frequently used by tourists using the same bank abroad, tourist destinations should be considered when choosing an ATM location [
12,
14].
Customers prefer ATMs located in safe places due to the risk of theft. The murder rate and armed action [
15] can provide information about the district’s security. The usage rate of ATMs located in places that customers can easily reach is increasing. Likewise, ATMs in high-visibility areas have a higher usage rate [
21,
23].
3. The Proposed Methodology
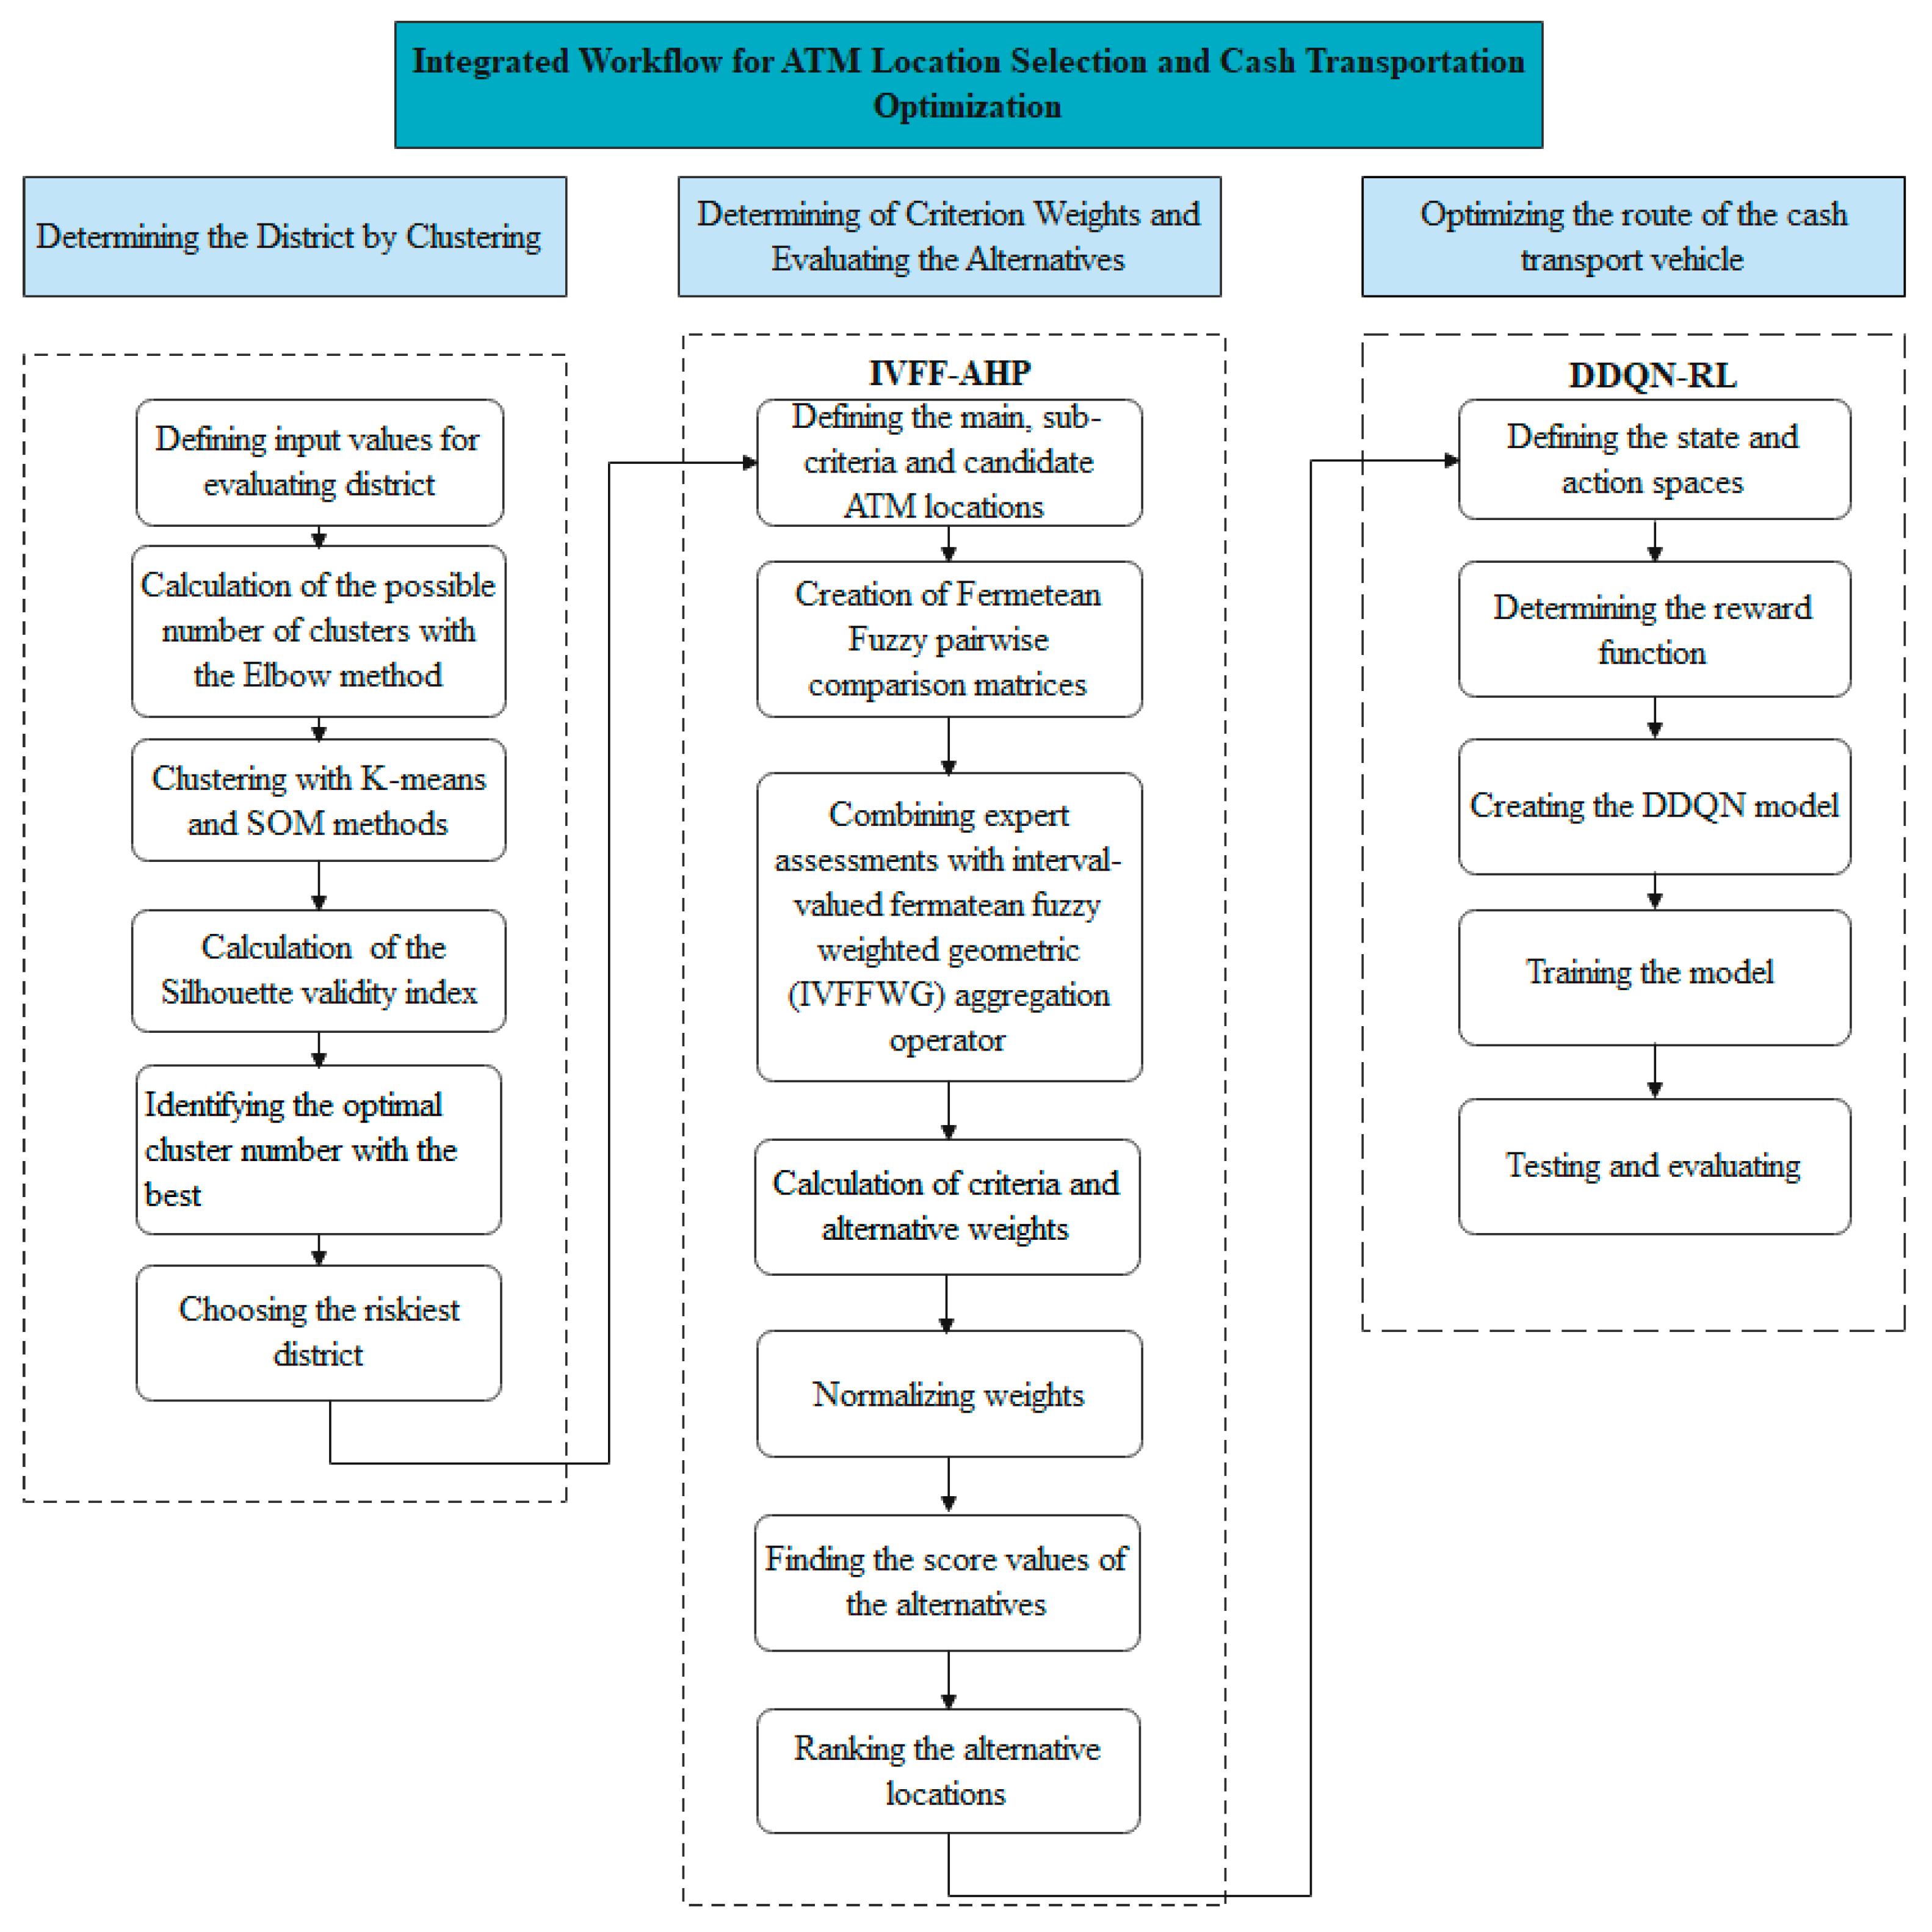
This section discusses a hybrid methodology based on IVFF-AHP and deep reinforcement learning to determine ideal ATM locations for Istanbul districts and to plan the optimum route between the determined ATM locations. This methodology aims to provide a reliable and easily accessible ATM location in a risky environment by integrating the clustering approach with the IVFF-AHP approach. The clustering approach determines the risks in the districts and the needs to be addressed, and the IVFF-AHP approach is used to obtain the criterion weights and ranking alternatives. In the last stage, the Double Deep Q-Network Reinforcement Learning (DDQN-RL) approach is applied, enabling vehicle routing between the locations determined by IVFF-AHP. Combining these two methodologies is unique to this paper and makes the methodology innovative. First, the clustering approaches used in the study are presented in the following subsection. In the second subsection, the preliminary concepts for Fermatean Fuzzy Sets are given, and then the steps of the IVFF-AHP methodology are given. In the last subsection, the proposed hybrid methodology is presented in
Figure 1.
The proposed methodology offers a comprehensive, risk-based, data-driven approach to supporting decisions on ATM location selection and cash-handling processes within the banking sector. Dynamic and adaptive solutions have been developed at strategic and operational levels through the combined use of clustering, IVFF-AHP, and DDQN-RL methods. Real-life conditions have been considered in the model by incorporating public safety data into the location selection process, and safe routes have been obtained using the risk matrix created with real traffic data during the routing phase. Therefore, the study provides both theoretical contributions compared to classical models in the literature and proposes an original method with high applicability for the sector.
3.1. Clustering
Clustering is a useful data science tool. It is a method of discovering the cluster structure in a dataset that is distinguished by the highest similarity within the same cluster and the most remarkable dissimilarity between different clusters [
24]. The proposed methodology uses K-means and self-organizing maps (SOM) methods to cluster the districts.
3.1.1. K-Means
In the K-means algorithm, one of the most common clustering methods, the data is divided into k-data groups by including each data point in the cluster with the closest mean [
25]. First, the k centroids of the data are calculated, and in the next step, each data point is directed from the relevant data point to the cluster with the nearest centroid. Different distance metrics are used while finding the closest centroid; the most widely used method is the Euclidean distance. After clustering, the center of gravity of each cluster is recalculated. Considering this center, the new Euclidean distance between each data point and the center is calculated, and the points with the minimum Euclidean distance in the clusters are determined. Each cluster is defined together with the data in the cluster and its centroid. The centroid of each cluster is the point where the sum of the distances to all the data in the related cluster is minimized. In this case, K-means can be defined as an iterative and non-hierarchical algorithm in which the sum of the distances of the data in the cluster from the cluster center is minimized for each cluster. The minimum square error can stop the algorithm, or the optimum set can be determined by trial and error.
3.1.2. SOM
Kohonen’s SOM is an unsupervised neural network consisting of the input layer, output layer, and neurons to which the inputs are connected. It maps the n-dimensional input in a two-dimensional lattice [
26]. It is an SOM algorithm based on competitive learning. In the SOM algorithm, the training of the network begins with the random assignment of the weight vectors of the output neurons. The distance between the initial weight values and the input vectors is then measured based on the Euclidean distance. According to this measurement, the neuron best-matched unit (BMU) closest to the input vector is selected. The weights of the selected neuron and its neighboring neurons are updated to approach the input vector, while the other neurons are not updated. The further away the neighboring neurons are from the BMU, the less the magnitude of the weight changes. Weight updates are made by calculating the distance for all input vectors. By reducing the learning rate iteratively, the neighborhood will get smaller with each iteration.
3.2. Fermatean Fuzzy Analytic Hierarchy Process
Fuzzy logic is an effective strategy for process control when the information is complex, nonlinear, and challenging to model and when the nature of the knowledge is ambiguous or uncertain. To deal with fuzziness and uncertainty in information, various fuzzy sets can be used to create linguistic expressions [
27]. As a result, Atanassov generalized the fuzzy set theory and established the intuitionistic fuzzy (IF) set theory [
28]. An element in IF sets is defined using the non-membership function
and the membership function
, subject to the constraint
. Yager defined Pythagorean fuzzy (PF) sets developed from IF sets. In PF sets, the total of the membership and non-membership degrees can be more than 1, but their square sums are not allowed to be greater than 1 [
29,
30]:
Senapati and Yager defined the Fermatean fuzzy (FF) set as an extension of IF and PF sets [
31,
32]. This set can be regarded as a new technique to express unreliable, unclear, and uncertain information in a fuzzy environment [
33]. In Equation (2), an FF number in fixed set X is represented as
[
32].
where
and
denote the Pythagorean membership and non-membership degrees of an element
x, respectively. Compared to IF sets, this condition allows for more detailed uncertainty modeling, especially when the hesitation component is present. The degrees of membership and non-membership of the element
to
are defined by
and
. Equation (3) defines the main constraint of Fermatean Fuzzy sets and ensures that the sum of the cubes of membership and non-membership degrees remains between 0 and 1.
The degree of uncertainty is calculated using Equation (4) and represents the portion of uncertainty that cannot be determined as either membership or non-membership. A higher uncertainty value indicates greater indecision or uncertainty in expert assessments. The degree of hesitancy is determined:
Furthermore, for each x ϵ X,
and
are closed intervals, and their lower and upper limits are represented by
,
,
, and
, respectively. To better reflect the uncertainty in expert judgments, membership and non-membership degrees are delivered in closed intervals, as in Equations (5)–(7):
In IVFFSs, the hesitancy degree is defined as
for every x ϵ X, as in Equations (8) and (9), which allows for a more flexible representation of uncertainty compared to traditional fuzzy sets:
Saaty developed AHP, one of the literature’s most widely used MCDM approaches. The method has a specific format for weight criteria and decision-making in complicated MCDM problems. However, judgments of decision-makers in unclear situations cannot be represented using the traditional AHP technique. To define the uncertainty in human judgment and preference, traditional AHP has been extended to fuzzy AHP. Fuzzy AHP has been used in many MCDM problems in the literature in different ways, such as intuitionistic fuzzy AHP [
34], interval-valued intuitionistic fuzzy AHP [
35], hesitant fuzzy AHP [
36], neutrosophic AHP [
37], and interval-valued neutrosophic AHP [
38]. Alkan and Kahraman developed IVFF-AHP by combining their method with the IVFF set and AHP to determine the best digital transformation strategy [
20].
The following are the steps of the IVFF-AHP approach suggested by Alkan and Kahraman:
Step 1: The criteria and alternatives are determined before constructing the hierarchical structure.
An objective, decision criteria, and alternatives are decided for the given situation. The set
, which has
alternatives, is assessed by
m decision criteria from the set
, which has
. Let
be the vector set used to define the criterion weights, where
> 0 and
.
Table 2 lists linguistic terms and their associated interval-valued Fermatean fuzzy numbers (IVFFNs).
Step 2: The pairwise comparison matrix Z =
is created using the expert views in
Table 2. The pairwise comparison between criterion
i and criterion
j is represented as an interval-valued Fermatean fuzzy judgment
, defined by the membership interval
and non-membership interval
, as shown in Equation (10):
Step 3:
Table 2 determines the consistency in the pairwise comparison matrix created according to expert judgments. After matching the numbers obtained from defuzzification with the IVFFNs in
Table 2, Saaty’s classical consistency steps are followed.
Step 4: Expert opinions are gathered.
The pairwise comparison matrices generated for each expert are combined using the interval-valued Fermatean fuzzy weighted geometric (IVFFWG) aggregation operator. This step involves aggregating the judgements of multiple experts into a single fuzzy pairwise comparison, using the IVFFWG aggregation operator. This ensures that the influence weights of individual experts are preserved and that uncertainty is properly propagated in the aggregation process. Let Ek =
,
,…,
, with
, representing the set of experts with influence weights
;
.
Step 5: The differences matrix,
, representing the strength of preference between criteria
i and
j, is determined between the lower and upper points of the membership and non-membership functions using Equations (12) and (13).
Step 6: The interval multiplicative matrix
is calculated using Equations (14) and (15). As a result, the
matrix, which indicates the relative dominance between criterion pairs, is obtained using the distance matrix.
Step 7: Applying Equation (16), the indeterminacy value
of
is calculated. The degree of indeterminacy is represented by
, which reflects the uncertainty between the bounds of membership and non-membership values.
Step 8: Applying Equation (17), the indeterminacy degrees are multiplied by the matrix
to create the matrix of unnormalized weights
. It combines the average interval multiplicative matrix (s) and the indeterminacy value (t), reflecting both preference strength and uncertainty.
Step 9:
, which represents the normalized priority weights for criterion
i, is calculated by dividing the relative weight of the criterion by the sum of all non-normalized weights, as shown in Equation (18):
Step 10: The alternatives are ranked based on the priority weight values calculated in the previous step.
3.3. DDQN-RL for Adaptive Route Optimization with Static Traffic-Aware Distance Matrix
This study proposes a DDQN-RL approach to optimize the route of an ATM cash transport vehicle. In contrast to traditional approaches, a predetermined traffic-adjusted distance matrix is integrated, which allows the reinforcement learning agent to optimize its route, taking into account traffic congestion at a single-period granularity. The developed model uses DDQN-RL to optimize vehicle route decisions under static but realistic traffic constraints. To achieve this, a predetermined traffic-adjusted distance matrix is integrated into the model, which allows the RL agent to internalize the cost structure of high traffic routes and make optimized decisions accordingly. This approach enables the ATM service agent to dynamically adapt to various real-world operational scenarios, including the addition or removal of ATM locations, sudden changes in demand, and real-time re-routing requests.
The ATM vehicle routing problem is formulated as a Markov Decision Process (MDP), where the state space represents the current vehicle position, ATM demand levels, and vehicle capacity, while the action space corresponds to selecting the next ATM location to visit. Let S denote the state space, where each state is represented as
, where
is the ATM demand vector at time
t,
is the vehicle’s remaining cash capacity, and
is the current vehicle location. The action space A is defined as the set of all possible next ATM locations, and the transition function
dictates the movement of the vehicle based on the selected action
. The agent receives a reward signal
after executing action
, designed to encourage efficient routing while penalizing unnecessary detours and high-traffic routes. The reward function is defined as follows:
where
represents the precomputed shortest distance between two locations based on the NetworkX-generated distance matrix, and
represents the traffic-adjusted cost of traveling between these locations. The parameter λ is a weighting factor to balance travel distance and traffic congestion. The agent aims to maximize the discounted cumulative reward, defined as
where γ is the discount factor, ensuring future rewards are considered while maintaining computational stability. The DDQN architecture consists of two neural networks: a primary (online) network
, responsible for action selection, and a target network
, that stabilizes training by providing updated Q-value estimates. The Bellman update equation for Double DQN is given by
where the online network determines the next action
, but the value is estimated using the target network to mitigate overestimation bias. Training follows an experience replay mechanism, where past transitions are stored in a buffer and randomly sampled for training to improve stability.
4. A Real Case Study
CIT activities performed by a security provider include transporting cash by vehicles or on foot. It is important to place ATMs in low-risk areas to reduce the risk in CIT activities, which have many troubles, such as the potential for armed robbery. As a result, potential ATM locations in Esenyurt are identified in this study. With the help of the pre-clustering investigation, this area was chosen as one of Istanbul’s extremely dangerous. The choices are selected from among them based on the specified standards in
Table 1. The better of these places, which is chosen based on certain features, is determined using the IVFF-AHP combination. The decision-making application uses Fermatean fuzzy logic and AHP to select the ideal placement for an ATM.
The clustering process determines the most appropriate district for this purpose. The literature research and expert interviews are used to construct the criteria. Three highly skilled professionals have been collected for the expert group to share their insights. When choosing experts, several factors are taken into account: (i) including extensive education (ideally post-graduate, but at least undergraduate); (ii) familiarity with location selection problem and/or CIT; (iii) experience in related fields (5 years at a minimum); and (iv) prior involvement in MCDM research. Expert-1 is a professor with 18 years of academic experience and numerous publications in Artificial Neural Networks and MCDM. Expert-2 is an Industrial Engineering Ph.D. student with 6 years of work experience in the related field. Expert-3 is an academician with a Ph.D. in Industrial Engineering and 8 years of experience in the field. The reasons for needing an expert team for this study are (i) determining the main and sub-criteria (see
Section 2); (ii) evaluating the criteria to determine their weights (see
Section 4.2); and, finally, (iii) determining which of the alternative points is the most appropriate one (see
Section 4.3).
4.1. Determining the District with Clustering
A new decision-making methodology is proposed, including clustering, Fermatean, fuzzy logic, and MCDM approaches, to select the most suitable ATM location in a risky district. First, the clustering algorithm chooses the districts with the highest risk among the 23 districts of Istanbul. For this selection, 12 input variables (Population, Socioeconomic status (SES) score, Number of vehicles, Average speed, Traffic density, Number of traffic lights, Number of traffic cameras, Urban function index, Education level, Annual income, Intentional murder rate, and Armed incident rate) are considered [
12,
13,
14,
21]. ATMs in densely populated areas provide access to more users, increase transaction volume, and increase revenue. Additionally, traffic density may make people who want to use the ATM less vulnerable to theft or attack. Crime rates in the settlement can be an important indicator of ATM security. In areas with high crime rates, ATMs may be at greater risk, and the risk of theft or assault may increase. Missing security measures can indicate that the ATM is at risk. The social and economic situation of the region is important for the security of the ATM. Factors such as low income levels, poverty, and unemployment may cause an increase in ATM theft and other crimes. If ATM theft, assault, or other security incidents have occurred in the settlement before, it may indicate that this location is risky. ATMs in densely urbanized areas generally offer more security measures and higher quality of service. The numerical values are compiled from publicly available sources.
Possible cluster values are calculated with the Elbow method, as seen in
Figure 2. The most convenient values for k are found as 3, 4, and 5. For clustering, K-means and SOM algorithms with different cluster values are used. As seen in
Table 3, the Silhouette validity index of both algorithms is calculated, and the cluster belonging to the algorithm with the optimal Silhouette index is selected. The Silhouette index is one of the internal clustering validation criteria in the literature [
22]. This index assesses the clustering findings by averaging the cluster validity of a single sample and potentially ignoring the shared traits of all items.
The Silhouette indexes obtain the optimal cluster number 4 in the K-means algorithm in
Figure 3.
Therefore, the classification given in
Table 4 has been accepted. All districts in the clusters are also shown on the district map of the European side of Istanbul in
Figure 4.
After clustering, which clusters to be selected are decided by looking at the average values of risk factors (
Table 5). The experts decide that for a district to be considered particularly high-risk, it should have the lowest SES score, a high Intentional murder rate, and a high rate of Armed incidents. It is emphasized that other risk factors would have the same effect on selecting the district with high risk. Therefore, the focus is on these three risk factors.
The lowest cluster total SES score of 29.75, the highest cluster total Intentional murder rate of 0.08%, and the cluster total Armed incident rate of 25.9% belongs to Cluster 3: Bağcılar, Esenyurt. This district has been selected as a highly risky district. Because low social and economic status and high crime rates may lead to increased ATM theft and other crimes in the region, one of these districts must be selected for the ATM location selection problem. For this reason, by comparing the two districts, it is decided that Esenyurt is the riskiest area with a 31.1 SES Score, 0.09% Intentional murder rate, and 29.43% Armed incident rate.
4.2. Determining Criteria Weights
In this sub-section, the IVFFN approach ranks the importance of the primary and secondary parameters that influence where ATMs are located. The IVFFN steps are applied to determine the weights of the criteria.
Figure 5 illustrates this hierarchical structure involving the main criteria, sub-criteria, and alternatives. Banks prefer to locate ATMs in hotels to meet their guests’ needs, increase their satisfaction, and acquire their loyalty. Health centers and hospitals are places where people urgently need cash. Therefore, ATMs in such areas can be helpful in health crises. Having ATMs near the town hall is important to meet the cash needs of visitors and employees and to increase the variety of services. Shopping centers, markets, and other commercial areas are ideal locations for ATMs because people often go to these areas to withdraw money or make other financial transactions. In principle, when determining alternative locations, the aim is to increase user access and transaction volume by selecting areas with heavy foot traffic. The three experts evaluate these alternatives and criteria by constructing pairwise comparison matrices through linguistic terms in
Table 2.
First, the weights of the main criteria are calculated. For this purpose, the following calculation procedure is applied. After converting the pairwise comparison matrices into IVFFNs with the corresponding scale, the expert assessments are combined with the IVFFWG operator using Equation (11). Equations (12) and (13) calculate the difference matrix
between the lower and upper values of the membership and non-membership degrees. Then the interval product matrix
is found based on Equations (14) and (15). The unnormalized weight matrix is found by using the indeterminacy value calculated using Equation (17) and the interval product matrix. In the last step, each criterion’s priority weight value is obtained using Equation (18), and the criteria weights are presented in
Table 6. Final criteria weights are obtained by multiplying the relevant main and sub-criteria weights.
4.3. Evaluating the Alternative Locations
Within the scope of the study, the Istanbul/Esenyurt district is chosen as a real-case study area. Some features have been considered while selecting alternative locations: the number of people visiting the locations during the day, being a protected area by security guards, and closeness to public transportation. The four candidate locations given in
Figure 6 that may be the most suitable for placing ATMs in this district have been selected as follows: A-1: Hotel Sheraton Esenyurt, A-2: Esenyurt Hospital, A-3: Esenyurt Town Hall, and A-4: Torium Mall. Hotel Sheraton is the largest hotel in the district, Esenyurt Hospital is the most visited hospital in the district, Esenyurt Town Hall is a state institution where many people work, and Torium Mall is the district’s largest shopping center.
Based on the obtained criterion weights, the alternative locations are evaluated. First, the same experts are requested to assess potential locations using the linguistic terms given in
Table 2. As a result, each expert’s alternative evaluation matrix is created, and the overall criteria weights are obtained by multiplying the weights of the related main criteria and sub-criteria. The criteria weights are calculated, and an alternative evaluation matrix is constructed. Then, these weights and the matrix are used to compare the alternative locations, as given in
Table 7. Finally, the ranking of the alternatives according to score value is shown in
Table 8.
According to the proposed methodology, the best alternative for an ATM location is A-1: Hotel Sheraton Esenyurt, and the ranking results are given in
Table 8. This location has less traffic and easier access. Because it is a hotel, it is a district frequently visited almost every hour of the day and has a high population density. In addition, security guards provide security at the place. A-2: Esenyurt Hospital is the second-best alternative, while A-4: Torium Mall is the worst option for an ATM location among the four alternatives. The main reasons for the Torium ATM location being the worst are the high setup, operating costs, and traffic density compared to the other options. Another reason is that there are already many ATMs in the mall.
4.4. Sensitivity Analysis
A sensitivity analysis emphasizes the effectiveness of the alternative evaluation methodology due to weight changes. This analysis based on altering the criteria weights is carried out to show the stability of the suggested method. For this analysis, four weight scenarios are created by changing the weights found with the IVFF-AHP method. Sensitivity aims to see the impact of changing the criteria weights.
Table 9 shows the final weights of the alternatives according to each scenario.
As
Table 10 shows, the best (rank 1) and worst (rank 4) examples remain the same for all weighting scenarios. Therefore, the ranking results of the proposed methodology are very stable, even when the criteria weights are changed.
4.5. ATM Routing Network
In this part of the study, a routing is planned for ATMs in the selected region. Reinforcement Learning (RL) is used in this study to determine the optimal route between ATM locations. This method has several advantages, including recognizing the best route based on real-time traffic conditions, adapting to changing road and traffic situations, and self-improvement through trial and error. In contrast to the conventional paradigms, RL can interpret real-time traffic patterns and process long-term route planning. This is emerging as an adaptive and intelligent solution. Therefore, a dynamic routing system is established to improve ATM operational efficiency in terms of time and fuel savings.
Figure 7 is created using Folium and NetworkX libraries and is designed to route between four key ATM points in the Esenyurt region. Folium is a powerful library that allows the creation of interactive maps using Python 3.10.14 It is widely used to visualize geographic data, make visualizations on maps, and make analyses interactive. It helps to make sense of data by adding markers, lines, and various layers to maps. Maps saved in HTML format can be interactively viewed and analyzed via web browsers.
In this study, for ease of display and operation, the 30 most central points were selected instead of all intersections, thus creating a network of hubs that provide connectivity for all roads. Four of these centers are where ATM points are located; the node numbers of Hotel Sheraton Esenyurt, Esenyurt Hospital, Esenyurt City Hall, and Torium Mall are 911, 110, 127, and 228, respectively. On the map, the road structure of the entire network is shown with blue lines so that the existing connections are visible. The red circles represent the nodes to be used for possible routing. By determining the most suitable paths between these nodes, routing between ATM points can be realized.
The ATM vehicle (agent) was trained using the DDQN-RL algorithm, enabling it to learn the optimal route based on traffic density variations. Unlike conventional Q-learning methods, DDQN-RL provides more stable and accurate decision-making capabilities as a deep reinforcement learning approach. This model continuously determines the shortest and most efficient route based on traffic conditions, dynamically updates the distance matrix to generate optimized paths for each time interval, and enables the ATM vehicle to learn the most effective route by making decisions according to temporal and traffic variations. Such an approach is particularly critical in cash-in-transit (CIT) operations, where high traffic density has been shown to correlate with increased vulnerability to robbery attempts. Therefore, directing CIT vehicles through lower traffic density regions not only enhances operational efficiency but also significantly reduces the likelihood of ambushes and security breaches. This finding is consistent with recent studies emphasizing the integration of real-time traffic data into route planning to mitigate robbery risks [
39,
40,
41]. The result is that this study develops an optimized routing system for ATM vehicles by leveraging traffic data. The proposed approach provides a practical solution suitable for logistics, urban distribution systems, and transportation planning where dynamic routing optimization is necessary to enhance operational efficiency.
NetworkX was utilized to compute the shortest paths between these locations, forming a distance matrix as the foundation for routing optimization. A traffic-adjusted distance matrix was generated based on historical traffic data corresponding to the ATM vehicle’s operational period. By keeping this matrix fixed during training, the model was able to incorporate realistic travel constraints while avoiding the computational overhead associated with real-time updates. During the training phase, the model was not restricted to ATM locations alone but was trained on all 30 central locations, with each location (except for the starting point) assigned an artificial demand. This approach ensured that the model effectively learned the complete road network topology, allowing it to navigate to any designated ATM location during deployment efficiently. This also enabled it to adapt to changes in the network, such as the addition or removal of ATM sites, without requiring re-training and handle unexpected routing modifications, such as last-minute ATM insertions or removals, thereby increasing the model’s flexibility and robustness in real-world applications.
The proposed DDQN-RL model was extensively evaluated to measure its performance, adaptability, and robustness under various ATM deployment scenarios. Following a training phase of 10,000 episodes, the model underwent a series of 100-episode test runs to assess the efficiency of the optimized routing policy. To enhance adaptability, the RL agent was trained on all 30 central locations, rather than restricting learning to pre-selected ATM sites. By assigning artificial demand levels to these locations during training, the agent effectively internalized the entire network structure, enabling it to generalize efficiently to any ATM configuration. This means that when new ATMs are introduced or existing ones are removed, the model can adjust without requiring re-training. Additionally, the learned policy supports real-time modifications, allowing mid-route updates such as last-minute ATM additions or cancellations to be incorporated seamlessly.
The reward convergence curve, shown in
Figure 8, indicates that the model rapidly stabilized after the early episodes and maintained consistent performance throughout. Following the training phase, seven different test scenarios were constructed to simulate practical variations in ATM network configurations, including node additions and removals. For each scenario, 100 independent test runs were performed. Remarkably, all test runs yielded identical outputs for each scenario, indicating that the trained model exhibits highly stable behavior and robust generalization performance. Additionally, in each test case, the trained model generated a near-optimized routing solution in under 3 s without any additional set-up, showcasing its suitability for real-time or near-real-time deployment in operational environments.
During training, the distance matrix remained fixed, reflecting the traffic-adjusted travel costs for the designated operational period. The model was trained for 10,000 episodes, ensuring robust convergence of the Q-values. The epsilon-greedy strategy was used to balance exploration and exploitation, with an initial exploration rate of ε = 0.7 that gradually decayed to ε = 0.01. The final trained model successfully demonstrated optimal ATM servicing strategies, effectively minimizing total travel distance, maximizing vehicle utilization, and dynamically responding to operational changes in real-world deployment scenarios.
The designated ATM locations in the first experimental setup were set to nodes 127, 228, 110, and 911, respectively. The reinforcement learning model successfully optimized the vehicle’s route, ensuring efficient service to these locations. The final learned route consistently followed across 100 test episodes was as follows (
Figure 9).
Final route: [911, 882, 239, 110, 127, 482, 175, 228] with an average total travel distance of 9.38 km (±0 standard deviation). To mitigate the traffic congestion commonly experienced along Doğan Araslı Boulevard, the current route was designed to incorporate an alternative path. While it remains feasible to traverse Doğan Araslı Boulevard, its propensity for congestion introduces significant delays, rendering it less desirable. Consequently, despite a slight increase in distance, this alternative route was selected for its smoother traffic flow, ensuring uninterrupted and timely travel for the vehicle.
The performance of the proposed DDQN-RL model was benchmarked against Gurobi’s solver with its built-in heuristic strategies (e.g., Improved RINS, Feasibility Pump, Relaxation Induced Neighborhood Search, and Heuristic Solutions from Relaxed Problems). The comparison results, summarized in
Table 11, show that the DDQN-RL model consistently achieved shorter total distances across all scenarios. For example, in the baseline case (Scenario 1), the DDQN model found a route with a total distance of 9.38 km, while Gurobi’s Heuristic Solution resulted in 16.31 km. Even in the most complex scenario involving 30 ATM nodes (Scenario 7), DDQN produced a stable solution of 43.84 km, significantly outperforming Gurobi’s 53.10 km result. These findings highlight the model’s ability to adaptively generate high-quality routes in dynamically changing environments.
These results indicate that the model converged to a stable and optimal routing policy, producing highly consistent routing decisions without deviation across all test runs. This stability underscores the effectiveness of the proposed approach in delivering reliable and efficient ATM servicing routes under dynamic urban conditions.
5. Discussion and Implications
As in all sectors, it is possible to see the impact of information technologies in banking and finance. In the banking sector, informatics is important in determining the business structure. The information network, which enables the products to reach the buyer easily after the marketing stage, positively affects the banking sector if used correctly and efficiently. For banks operating in the field of banking to become more robust in terms of competition, they should closely follow the technological innovations of the sector and adapt them to themselves. The development of the technological infrastructure and the banking sector’s automation system provide advantages in many ways. ATMs are the most prominent form of retail banking equipment. They are critical in any retail bank’s efforts to employ technology as a quality weapon against competitors. This facility is important in providing convenient, quick, and round-the-clock services [
42]. ATMs can perform balance and transaction inquiries, withdrawals, deposits, and account transfers.
As a result of the MCDM analysis, “demographic” is determined to be the most important main criterion. ATM locations should be placed in an area with a high population density based on the customer profile. If ATMs are placed in inappropriate areas, customers cannot use them optimally. In this context, customer profile data can provide information about ATM usage at the relevant location. Traffic density is determined as the most important sub-criteria among twenty sub-criteria. Therefore, decision-makers should choose easily accessible locations with low traffic density for ATMs. Especially in a city with high traffic density such as Istanbul, people need to access ATMs quickly and efficiently to perform their transactions. However, visibility is also a vital sub-criterion in ATM location selection. Although the population density is high and the traffic is low, the relevant ATM cannot be used effectively enough if the visibility is low. Traffic density plays a major role not only in ATM location selection but also in the efficient, safe, and dynamic management of cash transportation processes. Furthermore, as supported by the literature, high traffic density increases exposure time on the road, thereby elevating the risk of theft. In response, real-time traffic data were collected and normalized to construct a risk matrix. This matrix was then integrated into the distance matrix to simultaneously account for both travel cost and security risk. As a result, the proposed methodology offers a comprehensive solution that goes beyond classical distance-based optimization by incorporating real-world security concerns into the decision-making process. In this direction, dynamic-based route planning was made using real traffic data with the DDQN-RL-based vehicle routing model, and security and efficiency increases were achieved in CIT operations.
The results of the study provide significant contributions in academic and sectoral terms. Unlike the literature, they propose an innovative methodology that combines ATM location selection with IVFF-AHP and cash transportation route optimization with DDQN-RL. Unlike the heuristic method applications in the literature, the application of DRL in the routing of cash transportation vehicles provides the advantage of adapting to changes in ATM distribution networks without requiring retraining and flexibility and sustainability in cash transportation operations. Its sectoral contribution is aimed at banks and logistics service providers. With the proposed methodology, banks optimize ATM location selection and improve customer satisfaction and operational costs, while logistics companies optimize cash transportation routes, increasing security and efficiency.
6. Conclusions and Further Research
As a result, this study proposes a hybrid approach to evaluate ATM locations and plan vehicle routing between these locations to provide the most reliable transportation operations for the CIT process. One of the research topics of this study is the ATM location selection problem and which criteria should be considered in ATM location selection. Another topic is the route optimization of cash transportation vehicles. A real-life study is conducted in Istanbul, the most populous city of Turkey, to demonstrate the procedure for solving ATM location selection and vehicle routing problems. Therefore, the problem is initially modeled as a decision-making problem and the criteria are established based on literature review and expert opinions. Clustering approaches determine the high-risk district and then determine the most suitable location according to the weights obtained by the IVFF-AHP method. The most suitable location is determined by the clustering approaches according to the weights determined by the IVFF-AHP method. According to the clustering approach, the riskiest district of Istanbul is selected as Esenyurt, and the most suitable ATM location in this district is determined. Of the four main criteria for location selection, the most important one is “demographic”, and the least important one is “commercial and financial”. In the decision-making research for Istanbul, Esenyurt Hospital was determined to be the most suitable location, with a final score of 0.27. This alternative is followed by Hotel Sheraton Esenyurt, with a final score of 0.26. When the main and sub-criteria are considered and more than one expert evaluates the final findings, the Esenyurt Hospital location, which ranks first in terms of low traffic density, high population density, and security, seems quite reasonable. Besides optimizing ATM placement, the proposed methodology also enables CIT vehicle routing using DDQN-RL. A dynamic routing system is developed by integrating real traffic data into the route optimization of the located ATMs to improve operation efficiency. Unlike traditional vehicle routing methods, the proposed DDQN-RL model enables the CIT vehicle to adapt to demand changes, traffic fluctuations, and ATM network changes, thus providing service with minimum cost and delay. This study contributes to the literature on location selection decision-making problems. The contributions of this study to the literature are as follows: (i) The most detailed criteria structure was developed to analyze alternative ATM locations, considering the risks associated with CIT operations; (ii) In this study, the IVFF-AHP method was used for the first time in the ATM location selection problem; (iii) For the first time in the literature, a clustering approach was integrated into the IVFF-AHP methodology to limit and prioritize the district to be selected for ATM locations; (iv) The location selection was furthered by applying the DDQN-RL model using real traffic data to make the cash transportation procedure more efficient; (v) In order to demonstrate the applicability of the proposed hybrid methodology, four alternatives were tested in Istanbul, and the optimum route was selected for the alternatives.
Future research can investigate the integration of alternative MCDM approaches, such as TOPSIS and VIKOR, into the IVFF set. In addition, the solution model can be divided into location selection and cash management. These decisions are interdependent because cash management strategies should be established according to the priority order depending on the ATM locations. Static traffic data can be fed into the DDQN-RL model for vehicle routing, and, also, the routing problem of multiple CIT vehicles can be optimized. Furthermore, the proposed methodology can be extended to other location selection problems such as shopping malls, restaurants/cafes, hotels, and accommodation facilities, especially bank branches and financial institutions, where customer satisfaction, security, and accessibility factors are at the forefront.


