Featured Application
The CFSs of lactic acid bacteria can be proposed as an eco-friendly biopreservative for minimally processed fruit with a clean label.
Abstract
The global market for fresh, ready-to-eat products has grown rapidly, leading to some microbiological safety concerns. Lactic acid bacteria (LAB), along with their metabolites, represent a green alternative to chemical preservatives. For this purpose, the cell-free supernatant of LAB strains previously isolated from fruits and their potential antibacterial effects against pathogens commonly found in minimally processed fruit were evaluated. Based on the preliminary results, a mix of cell-free supernatants (CFSs) was applied as a postbiotic solution in minimally processed orange slices packed in a passive atmosphere. Different pathogenic strains were intentionally inoculated to evaluate their antimicrobial effect, and their trend was monitored. Microbiological and physico-chemical analyses were carried out at different times (3, 8, and 10 days) during cold storage. The CFSs obtained from Lactiplantibacillus plantarum and Leuconostoc mesenteroides strains highlighted an antibacterial activity against Escherichia coli and Staphylococcus aureus in both in vitro and in vivo tests, showing a reduction of 1 Log CFU/mL for E. coli and the disappearance of vital S. aureus. In conclusion, the CFSs can be proposed as an eco-friendly biopreservative for orange slices with a clean label, although their stability needs to be evaluated and their limits of application need to be ruled by specific legislation.
1. Introduction
In accordance with consumption trends, the demand for ready-to-eat fresh-cut produce has grown significantly, especially in Europe [1]. The term ready-to-eat fresh produce refers to ‘any food normally consumed in its raw state or any other food, including processed food, for which it is reasonably foreseeable that the food will be consumed without further processing that would significantly minimise biohazards’ [2]. The growth of this global market segment, and specifically of ready-to-eat vegetables and fruits, has led to some concerns related to microbiological safety, as these products represent a favourable matrix for the growth of pathogens that can lead to product spoilage and health risks for consumers [3]. Currently, chemical agents, including chlorine; organic acids; or physical treatments, such as heat treatments, ultraviolet light, and ozone, have been widely used to reduce the microbial density in fruits and vegetables [4]. Cheap green alternatives to chemical preservatives, provided by microorganisms or their metabolites, are known as ‘postbiotics’ and are recognised as biopreservatives. In detail, postbiotics represent a complex mixture of different substances, such as organic acids, bacteriocins, exopolysaccharides, peptides, enzymes, etc. [5], that are suitable as biopreservatives, protective cultures, or food additives in various forms (dipping, coating, spraying, edible films, and wrapping) due to their interesting traits [6]. When postbiotics are obtained from lactic acid bacteria (LAB), which are included in the Generally Recognised as Safe (GRAS) species, they can be considered as safe for human health [7]. In particular, when cells are grown in a liquid medium, the derived metabolites and residual nutrients constitute the cell-free supernatant (CFS), a complex matrix characterised by a high antimicrobial activity [8].
Citrus is among the most significant tree fruit crops globally, both in terms of economic value and total production, with approximately 140 million tons/year produced. The Italian production is about 3 million tons, concentrated mainly in Sicily, where Citrus fruits, especially blood oranges, represent an important source of income. Oranges exhibit a high nutraceutical value thanks to the high content of vitamin C and flavonoids, the most abundant phenolic compounds in Citrus fruit [9]. Oranges suitable for processing can be valorised as juice or ready-to-eat orange slices, complying with market demands.
Therefore, this study aimed to evaluate the functional and antibacterial effects of LAB strains isolated from minimally processed fruit. The mix of the CFS from the most promising strains was applied to minimally processed oranges to assess its impact on shelf-life extension. Orange fruits were chosen for their global economic relevance and, as an ideal matrix for harbouring a poor native microbiota, due to their intrinsic characteristics, which make them a suitable model for evaluating the efficacy of antimicrobial postbiotic compounds.
2. Materials and Methods
2.1. Isolation and Identification of LAB Strains
LAB were isolated from endocarp of Tarocco orange cultivar (named as AS1, AS3, and AS4), white melon (Cucumis melo L. Indorus group) (named as MEL1 and MEL3), and fruit salad (named as MAC1). All sampling products were purchased at a local market in Sicily. The isolates were phenotypically and biochemically characterised by conventional tests (microscopic observation, catalase test, and Gram stain) and API 50 CHL Medium kit (BioMerieux, Florence, Italy), respectively. Subsequently, the isolates were stored at −80 °C in Man, Rogosa, and Sharpe (MRS) broth (Oxoid, Milan, Italy) supplemented with 20% (w/v) glycerol (AppliChem, Darmstadt, Germany).
2.1.1. Molecular Identification of LAB Isolates
The presumptive L. plantarum and Ln. mesenteroides isolates were identified through PCR colony analysis. Briefly, each colony was picked up and diluted in 20 µL of distilled water, which served as DNA template. Two separate reaction mixes (25 µL) were prepared in 1.5 mL microcentrifuge tubes by combining DreamTaq™ Green PCR Master Mix 2X (Thermo Fisher Scientific, Waltham, MA, USA), the genus-specific primers Lu1r (CCACAGCGAAAGGTGCTTGCAC) and Lu2 (GATCCATCTCTAGGTGACGCCG), and the species-specific primers L. mesF (AACTTAGTGTCGCATGAC) and L. mesR (AGTCGAGTTACAGACTACAA), targeting the 16S rRNA gene, ultrapure water, and 2 µL of DNA template. The amplification programme for both genus- and species-specific identification was conducted as previously reported by Cenci-Goga and coworkers [10]. Similarly, the recA gene-based primers paraF (5′-GTC ACA GGC ATT ACG AAA AC-3′), pentF (5′-CAG TGG CGC GGT TGA TAT C-3′), planF (5′-CCG TTT ATG CGG AAC ACC TA-3′), and pREV (5′-TCG GGA TTA CCA AAC ATC AC-3′) were used in a multiplex PCR assay (25 µL) following the protocol of Torriani and coworkers [11]. Amplicons were visualised on a 1.5% TAE 1X agarose gel containing 3 μL of Red Nucleic Acid gel stain (Biotium, Fremont, CA, USA), and the DNA molecular weight marker 100 bp (Invitrogen-Life Technologies, Carlsbad, CA, USA) was used as a standard for DNA sizes.
2.1.2. Pulsed Field Gel Electrophoresis (PFGE) Analysis
The PFGE analysis was carried out using the protocol described by Coudeyras and coworkers [12] to analyse the clonal relationships among the Lactobacillus group and the protocol of Behare et al. [13] for Ln. mesenteroides isolates. Briefly, the digestion of the plugs, prepared as reported by Russo and coworkers [14], was carried out using 2 µL of SmaI restriction enzyme and AscI (New England Biolabs, Ipswich, MA, USA) for 16–20 h at 25 °C and 37 °C for Leuconostoc and Lactobacillus genus, respectively. DNA fragments were electrophoresed through a 1.0% agarose gel in 0.5X TBE buffer at 14 °C, using the CHEF-DR III system (Bio-Rad Laboratories, Hercules, CA, USA). The applied runtime was 17.5 h, with a constant voltage of 6 V/cm, using a linear pulse ramp of 1–20 s for Leuconostoc strains, and 18.8 h with an interpolation ramping from 1.6 to 20.9 s for lactobacilli. A lambda ladder (successively larger concatemers of 48.5 kb DNA fragments) was used as the molecular size marker, and PFGE patterns were visually compared according to the criteria of Tenover et al. [15].
2.2. Safety Evaluation
2.2.1. DNase, Gelatinase, and Hemolytic Assays
DNase agar medium (Merck KGaA, Darmstadt, Germany) was employed to assess the DNase activity of isolates. Specifically, each isolate was streaked in duplicate on the medium and incubated at 37 °C for 48 h [16,17]. The DNase production was indicated by the appearance of a clear pink zone surrounding the colonies following flooding with 1 N HCl.
Nutrient agar medium (Liofilchem, Teramo, Italy) supplemented with 3.0% (w/v) gelatine (Merck KGaA, Darmstadt, Germany) and Columbia agar medium (Biolife, Milan, Italy), enriched with 5.0% sheep blood, were used to assess the gelatinase and hemolytic activity, respectively. Each analysis was repeated twice. In the hemolysis assay, the absence of green zones (α-hemolysis) and clear zones (β-hemolysis) surrounding the inoculum was examined. Only γ-hemolysis, characterised by the absence of any hemolytic zone, was considered safe. The results were evaluated visually after incubation at 37 °C for 24 h.
2.2.2. Antimicrobial Susceptibility Test
Eight antimicrobial molecules (Oxoid, Basingstoke, Hampshire, UK), including ampicillin (15 μg), gentamicin (10 μg), kanamycin (30 μg), streptomycin (30 μg), erythromycin (15 μg), clindamycin (2 μg), tetracycline (30 μg), and chloramphenicol (30 μg), were used to assess the susceptibility of LAB strains by using the agar disc diffusion method. Briefly, single LAB colonies, previously streaked on Mueller–Hinton agar (Oxoid, Basingstoke, Hampshire, UK), were diluted in a saline solution to reach the final density of 0.5 McFarland (approx. 1.5 × 10⁸ CFU/mL). The suspension was then thickly swiped on the surface of agar plates through a cotton swab, and the antimicrobial discs were manually placed on the smear surface. The plates were anaerobically incubated for 24–48 h [18]. Susceptibility to antimicrobials was expressed in millimetres of inhibition zones, and based on EFSA criteria [18], for which a bacterial strain is considered phenotypically resistant when its growth is not affected by a specific antimicrobial concentration with reference to its breakpoint or epidemiological cut-off value (ECOFF).
2.3. Bacterial Growth and Cell Suspension Standardisation
LAB isolates were cultivated in MRS broth at 32 °C for 24 h. Following incubation, the bacterial cultures were centrifuged at 12,000 rpm for 2 min at 4 °C (Giorgio Bormac, Carpi, Italy). The resulting cell pellets were then resuspended in 0.9% (w/v) NaCl solution until the suspension reached a turbidity equivalent to the 0.5 McFarland standard (approximately 1.5 × 10⁸ CFU/mL). The standardised cell suspension was used for further tests. From the same growth conditions, the cell-free supernatant (CFS), separated from the pellet through a 0.22 µm cellulose acetate membrane filter (Merk, Darmstadt, Germany), was obtained.
2.4. Antibacterial Activity
The disc diffusion method was used to assess the antibacterial activity of both LAB isolates and their respective CFS against four target bacterial strains: Listeria innocua DSM 20649, Escherichia coli DSM 1103, Staphylococcus aureus DSM 30862, and Pseudomonas aeruginosa DSM 1117 (Leibniz-Institute DSMZ, German collection). All the target bacteria were revitalised in Muller Hinton (MH) broth (Liofichem, Roseto degli Abruzzi, Italy) at 37 °C. Specifically, LAB isolates in both single and mixed cultures were adjusted to a turbidity corresponding to 0.5 McFarland standard solution, while the target bacteria were diluted to a final concentration of approximately 1 × 10⁶ CFU/mL. Each MH agar plate was inoculated with 1 mL of target bacteria suspension and allowed to dry. Sterile cellulose discs (Ø 6 mm, Oxoid, Milan, Italy) soaked with each tested LAB cell or respective CFS, at different dilution rates, were placed on the surface. Distilled water served as a negative control. Plates were incubated at specific temperatures for 48 h, and the antibacterial effect was determined by measuring the diameter (mm) of the inhibition halo formed around the discs [9].
2.5. Evaluation of Functional Traits of Strains
2.5.1. Tolerance to Acidic Conditions and Low Temperatures
Each LAB isolate was inoculated into MRS broth adjusted to pH 3.0 and 4.0 (using citric acid) at a final concentration of 1.5 × 10⁸ CFU/mL and incubated at 4 and 8 °C. The growth kinetics of the isolates were monitored at specific time intervals (0, 4, 8, 24, and 48 h of incubation) by viable cell counting on MRS agar. Each experiment was conducted in triplicate, and results were reported as Log CFU/mL ± standard deviation.
2.5.2. Acidification Capacity Test
The acidifying potential of the selected strains was assessed. Specifically, 100 µL of the standardised cell suspension was inoculated into 5 mL of MRS broth. The pH variation (∆pH) was assessed by monitoring the pH value in triplicate at 2, 4, 6, 24, and 48 h of incubation at 37 °C, through a pH metre (MettlerDL25, Mettler-Toledo International Inc., Columbus, OH, USA).
2.5.3. Production of Organic Acids
The organic acid production was detected by filtering the samples (0.45 μm PTFE filters, Merk, Rome, Italy) and then injecting them into a Waters Alliance 2695 HPLC liquid chromatography, equipped with a Waters 996 photodiode array (PDA) set at 210 nm, and with Waters Empower software (Waters Corporation, Milford, MA, USA). A Rezex ROA Organic Acid H+ column (Phenomenex, Torrence, CA, USA) was used with 5 mN H2SO4 mobile phase at 0.6 mL/min in isocratic mode. Different pure external standards (lactic acid, citric acid, acetic acid, propionic acid, and butyric and isobutyric acid) at different concentrations were injected (all purchased from Sigma-Aldrich, Milan, Italy). All analyses were performed in triplicate. Limits of detection (LODs) and quantification (LOQs) were estimated from 5 replicated injections of a solution of the different organic acid standards. LOD and LOQ were calculated at signal-to-noise ratios of 3 and 10, respectively. LOD ranged from 0.15 to 1.0 ppm while LOQ ranged from 1.5 to 10.0 ppm for acetic acid and lactic acid, respectively.
2.6. Processing and Treatments of Orange Slices
2.6.1. Vegetal Matrix
The orange fruits of the Valencia cultivar, harvested in the summer of 2023, were kindly provided by the CREA experimental orchard, located in Palazzelli (Siracusa, SR, Italy). The fruits were immediately processed at the CREA laboratory (Acireale, CT, Italy).
2.6.2. Fruit Treatments
The oranges were washed with water, dried, peeled, and cut into slices under sterile conditions. Subsequently, the slices (100 g) were placed in containers under aseptic conditions, in an ordinary atmosphere (Figure S1), in PS 6 transparent polystyrene bags (code: V00501/OPS) with the following characteristics: L: 127 × 115 mm; 1: 45 mm; and 0.08 m3 [16]. The CFS was used as a mix (obtained from a cell growth of each tested LAB at 1.5 × 10⁸ CFU/mL), while the target bacteria were inoculated immediately after CFS, at a final density of 1 × 10⁶ CFU/mL on 100 g slices, with a 2:1 ratio (CFS: target bacteria), based on in vitro antibacterial test results. Therefore, 10 trials were set up: 4 experimental treatments inoculated with each single target bacterium and 4 experimental treatments inoculated with the single target bacteria added with the CFS. In addition, one control (untreated) and one treated sample were prepared only with CFS. All samples were packaged and kept under refrigerated conditions (4 °C) and analysed at the following times: initial time (T0), after 3 (T3), 8 (T8), and after 10 (T10) days of storage. Physical, chemical, and microbiological analyses were carried out at each sampling time (Figure 1).
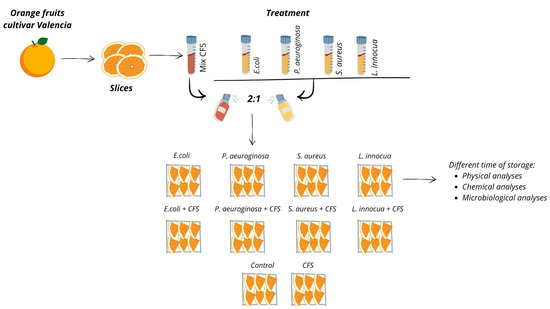
Figure 1.
Experimental design.
2.6.3. Physical Analyses
Weight loss (WL), colour, and texture were evaluated in all orange samples at different times. The WL of the samples was determined with an accuracy of two decimal places on a scale (Gibertini EU-C 2002 RS, Novate Milanese, Italy) and expressed with the following equation:
where W0 was the initial weight (g) and W1 the final weight (g).
WL = (W0 − W1)/W0 × 100
For orange slices, the firmness was determined using a texture machine (DO-FB0.5 TS 2002 model, ZwickRoell, Genova, Italy) and measured as the maximum force required for breaking the fruit skin. The instrument was provided with a 6.4 mm diameter cylinder probe (P8); the test parameters were set as follows: pre-test speed of 2 mm/s, test speed of 0.5 mm/s, and distance of 2 mm, post-test speed of 4 mm/s, and a maximum force threshold of 1 N. For each treatment, three replicates, each consisting of five orange slices, were measured. The maximum force peak recorded during orange tissue breakage was registered as a firmness indicator and expressed in Newton (N) [16].
In addition, colorimetric analysis was performed at different times of storage, according to the Commission Internationale de l’Éclairage (CIE). L* (brightness), a* (green–red component), and b* (blue–yellow component) coordinates were measured using a Minolta Spectrophotometer CM-2500d (Minolta, Milan, Italy), according to the CIELAB scale. The values were obtained by the average of three transmittance measurements per replicate.
2.6.4. Microbiological Analyses
For the microbiological analyses, the samples were first placed in sterile bags (BagMixer 400 model, Interscience, Puycapel in Cantal, France) and homogenised for 2 min. using a stomacher (LabBlender, Seward, Worthing, UK). The homogenates were then serially diluted and inoculated on different selective agar media and incubated in specific conditions, depending on the target microorganisms: mesophilic aerobic bacteria into Plate Count Agar (PCA, Oxoid, Milan, Italy), incubated for 48 h at 32 °C; yeasts and moulds into Sabouraud Agar, added with chloramphenicol (50 mg/L) (Bio-Rad, Milan, Italy), incubated for 48 h at 25 °C; MRS agar, supplemented with cycloheximide (5 mL/L), anaerobically incubated for 24–48 h at 32 °C, for LAB count; EC X-gluc (Biolife, Milan, Italy) for Escherichia coli count for 48–72 h at 37 °C; Staphylococcus spp. into Mannitol Salt Agar (MSA, Oxoid, Milan, Italy) incubated for 72 h at 32 °C; Agar Listeria Ottaviani Agosti (ALOA, Biolife, Milan, Italy) incubated for 24 ± 2 h at 37 °C for Listeria spp.; and Pseudomonas CN Agar Base (PAB) for enumeration of Pseudomonas aeruginosa for 44 ± 4 h at 36 ± 2 °C. Results were reported as the mean of Log CFU/mL ± standard deviation (SD), based on three independent replicates.
2.6.5. Chemical Analyses
At each sampling time, the pH of the orange slice juice was measured using a DL25 pH metre (Mettler-Toledo International Inc., Columbus, OH, USA). Additionally, total soluble solids (TSS) were measured in the differently treated samples using a refractometer (Atago, RX-5000, Fisher Scientific, Rodano, Italy), with results expressed as Brix degrees (°Brix).
The total phenolic content was assessed using the Folin–Ciocalteu (FC) colorimetric method. Briefly, 5 mL of FC reagent (Labochimica, Padova, Italy) and 4 mL of 7.5% sodium carbonate solution were added to each sample. The mixtures were then incubated at room temperature, protected from light. Absorbance was measured at 740 nm with a spectrophotometer (Cary 100 Scan UV–Visible, Agilent, CA, USA). The results were expressed as mg of gallic acid equivalents (GAEs)/L of sample. For the determination of organic acid content, the filtered samples were analysed by HPLC, following the procedure described in Section 2.5.3.
2.7. Statistical Analysis
Statistical analysis was performed using one-way analysis of variance (ANOVA) to evaluate differences among treatments, followed by Tukey’s HSD post hoc test for multiple comparison of means (at a significance level of p ≤ 0.05). The analyses were carried out using SPSS Statistics software for Windows, version 20 (IBM Corp., Armonk, NY, USA). Additionally, Pearson’s correlation analysis was conducted using R software (version 4.2.3, R Foundation for Statistical Computing, Vienna, Austria) to assess relationships among variables.
3. Results and Discussion
3.1. Phenotypic and Genotypic Characterisation of LAB Isolates
Overall, 20 g-positive bacilli-shaped bacteria were obtained from commercial ready-to-eat products. Based on phenotypic and biochemical tests, three isolates were identified as belonging to L. plantarum and three as Ln. mesenteroides species, with a 99.9% and 96.3% sequence similarity, respectively. For the remaining isolates, the exhibited features made them unattributable to the LAB group.
The species-specific PCR confirmed the membership of strains to Ln. mesenteroides species. Moreover, the results of the PFGE pattern provided evidence that one strain per species was unique, differing from the AS1 and AS4 clones for L. plantarum species and MEL1 and MEL3 clones for Ln. mesenteroides. Indeed, the PFGE pattern of the AS1 and AS4 strains showed a profile containing 15 distinct bands, with the first band located at about 194 kb. In contrast, the first band of the unique pulsotype was positioned at the beginning of the gel, suggesting the presence of a large DNA fragment. Regarding the Ln. mesenteroides strains, the unique pulsotype showed a profile with 13 bands, positioned much higher in the gel than the two clones, which displayed a higher number of bands.
3.2. Safety Evaluation Results
The tested strains did not exhibit hemolytic, DNase, or gelatinase activities. Additionally, although all isolates demonstrated a high susceptibility against the tested antimicrobials, a strain-dependent variability was detected for some antimicrobials, mainly for a L. plantarum strain that, based on EFSA criteria [18], shows a resistance to tetracycline (MIC ≥ 32 µg/mL). The same pattern of resistance was observed for Ln. mesenteroides strains, which showed a resistance against streptomycin (MIC > 64 µg/mL).
3.3. Antimicrobial Activity of LAB Isolates
The antimicrobial activity was evaluated against different target bacteria—including L. innocua DSM 20649, P. aeruginosa DSM 1117, E. coli DSM 1103, and S. aureus DSM 30862, the latter is known to produce biofilms in the food industry—on surfaces and equipment that come into contact with food [19]. In this study, the cells and CFS of the different strains were tested, both in single and in mixed cultures. Overall, the results of the antimicrobial activity showed that the CFS, used as it was, exhibited greater inhibitory activity compared to the cells. In detail, the CFS mix obtained from L. plantarum AS1 and AS3 showed the highest inhibitory activity against E. coli, P. aeruginosa, and S. aureus (Table S1). These results confirm the findings reported by Yolmeh and coworkers [20], who proposed the application of a CFS mix as a new approach to increase antimicrobial activity.
The antimicrobial activity of the CFS from LAB appeared to be mainly related to the acidic content and, in particular, to the lactic and acetic acid content. In addition, the antimicrobial activity could rely on the presence of other compounds, such as bioactive peptides and bacteriocins.
3.4. Evaluation of Functional Traits of Isolates
The strains were evaluated for their pro-technological aspects, such as their acidifying capacity, growth at different stresses (pH and temperature), and organic acid production. Regarding the acidifying test, all strains showed good acidifying properties (Figure 2).
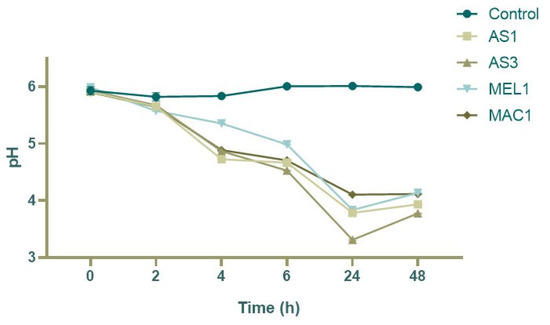
Figure 2.
The acidification capacity of the LAB isolates tested.
The highest acidifying activity was detected after 24 h for AS1 and AS3 L. plantarum strains, reaching pH values of 3.83 and 3.77, respectively. This result may be attributed to the high concentration of organic acids, mainly lactic acid (Figure 3). Indeed, while the concentration of acetic and citric acid was found to be similar among the tested strains, the concentration of lactic acid was significantly different between L. plantarum and Ln. mesenteroides strains, reaching concentrations of 13.76 g/L and 13.69 g/L in AS1 and AS3 and 6.25 g/L and 5.31 g/L in MEL1 and MAC1, respectively.
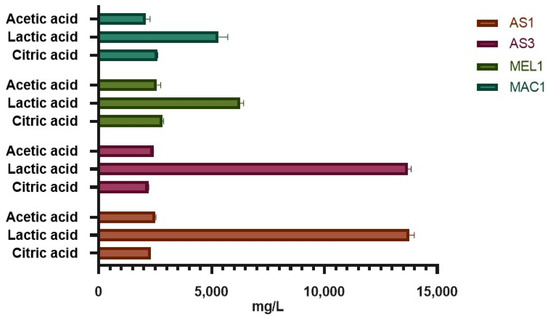
Figure 3.
Organic acids detected through HPLC analysis.
The type and level of organic acids produced are linked to the microbial species, the culture medium composition, and the growing conditions [21,22]. In addition, the different productions of organic acids, especially of lactic acid, are related to the metabolic pathway of LAB and whether it belongs to the homo- or heterofermentative group. As reported by Mani-Lòpez and coworkers [8], Leuconostoc, Pediococcus, Oneococcus, Weisella, and Lactibacillus genera induce the production of lactic acid isomers (D-, L-, or the racemic mixture) in relation to several factors, such as the growth phase, presence of specific substrates, nutrients, and oxygen. The generation time and lag phase are strongly influenced by the pH and temperature [23]. Therefore, the ability of the selected strains to tolerate different pH values (3.0 and 4.0) and their ability to grow at low temperatures (4 and 8 °C) (Figure 4) were tested.
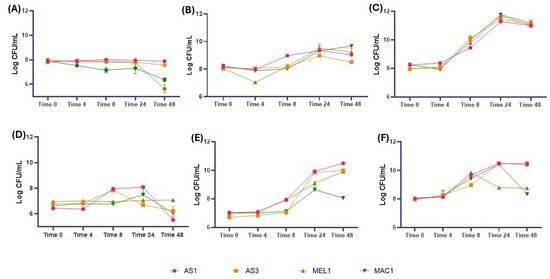
Figure 4.
Growth of strains under specific stress conditions: (A) MRS broth pH 3.0; (B) MRS broth pH 4.0; (C) MRS broth pH 6.0 (control); (D) temperature of 4 °C; (E) temperature of 8 °C; and (F) temperature of 32 °C (control). Data are reported as means of values and expressed as Log CFU/mL.
Several studies focused on L. plantarum species have already confirmed their high versatility, adaptability, and tolerance to acidic environments and different temperature values [24]. In this study, both L. plantarum strains showed a good resistance to both the tested pH and temperatures, highlighting a greater susceptibility for the lowest tested values (pH 3.0 and 4 °C). Specifically, concerning a pH of 3.0, the strains showed a stable cell density reaching the highest value after 8 h of incubation, reaching a density of 8.02 and 8.00 Log CFU/mL, respectively. A different trend was observed at a pH of 4.0, where both strains reached the highest cell density after 24 h of incubation, with values of 9.30 Log CFU/mL and 9.0 Log CFU/mL for AS1 and AS3, respectively. A similar trend was observed for the lowest tested temperature. Indeed, whereas AS1 showed a slight increase up to 24 h of incubation, a decrease in the cell density of AS3 was observed, reaching a value of 6.26 Log CFU/mL. On the contrary, an increase in viable cells at 8 °C was observed with a cell density of 10.5 Log CFU/mL and 10.0 Log CFU/mL after 48 h of incubation. Regarding Ln. mesenteroides (MEL1 and MAC1), the results showed that both strains were affected by the lowest tested pH value. A good adaptation was observed at a pH of 4.0, where an increase in cell density was observed, with values of 9.23 Log CFU/mL and 9.40 Log CFU/mL for MEL1 and MAC1, respectively. Regarding the effect of temperature, the cell density remains quite constant at the lowest tested temperature, while the cell density increased with the highest temperatures for both Ln. mesenteroides strains, reaching values of 9.90 and 8.06 Log CFU/mL after 48 h at 8 °C, respectively.
3.5. Physico-Chemical Analyses of Minimally Processed Orange Slices Treated Differently During Refrigerated Storage
During storage at refrigerated conditions (after 3, 8, and 10 days), physico-chemical analyses were performed. Looking at the results, in all samples, the weight of the orange slices constantly decreased (Figure 5), particularly starting from the third day. Notably, a difference in the percentage of WL was revealed after 8 days of storage in all samples between controls and samples treated only with the CFS. The graph shows that the sample inoculated with L. innocua differed greatly starting from the third day, showing a loss of 0.45% at the end of the refrigeration. Several authors have demonstrated how strains belonging to Listeria spp. can contribute to enhanced transpiration (water loss), increasing the metabolism of the fruit and the release of the ethylene content [25].
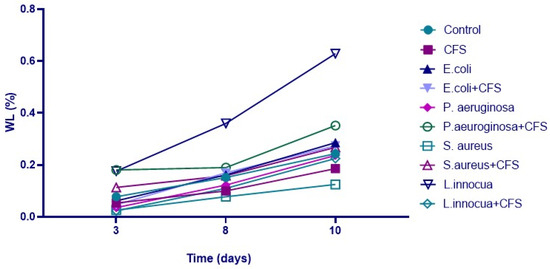
Figure 5.
Weight loss (%) in orange slice samples treated differently during storage at refrigerated conditions.
During the different refrigerated storage times, the physico-chemical parameters (Table 1 and Supplementary Table S2) of the samples were monitored.

Table 1.
Colour and texture coordinates of orange slice samples treated differently during refrigerated storage.
The pH value of the initial fresh oranges was 3.77, while in treated samples, it slightly varied between 3.45 and 4.00 (time 10 and time 3, respectively). No significance was found for total soluble solids during the first two times of refrigeration (times 3 and 8). Overall, the value of the TTS decreased in most samples, indicating that the treatment with pathogenic bacteria generally leads to a reduction in the TSS related to an increased consumption of available sugars. A significance was detected exclusively at time 10, showing the highest value around 12°Brix in the control, E. coli, P. aeruginosa, and P. aeruginosa with CFSs.
Overall, zooming in on the phenol content, it is interesting to highlight that samples treated with the CFS alone showed a significantly higher value than the controls, showing a phenol content of 779.09 mg/L. These results agree with those reported by Kho and coworkers [26], who established the antioxidant activity of the CFS produced by LAB. The authors demonstrated how the application of the CFS obtained from LAB and, in particular, from Pediococcus acidilactici in food packaging increased the antioxidant properties and inhibited the growth of pathogenic microorganisms, such as S. aureus and L. monocytogenes.
For the physical analysis (Table 1), the colour and texture showed only a slight variation between treated and control samples at any storage time. For the colour coordinates L* and b*, despite the statistical differences, no evident trend was detected between the different treatments and analysis time. For the a* coordinate (red to green indicator), a significant difference can be seen after 8 days of refrigeration, with a general value reduction in almost all samples at time 10 (from −5.12 to −3.10 for Listeria+CFS and S. aureus samples, respectively). Regarding the firmness of the orange slices, there was no significant difference among the samples after 3 and 8 days of storage. A slight difference was found only at the last sampling point (with a firmness ranging from 1.59 N for P. aeruginosa sample to 3.43 for L. innocua+CFS one), confirming that the consistency is not only related to the weight loss and the metabolism of the inoculated microorganisms [16].
Zooming in on the acid content, citric and lactic acids were the most prevalent compounds detected in all tested samples (Figure 6).
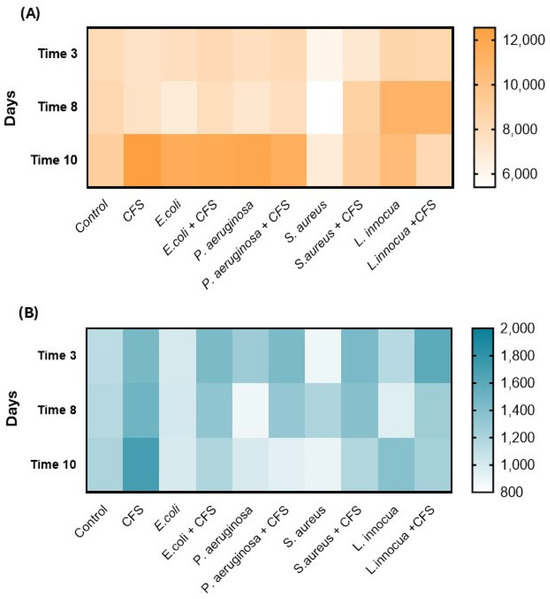
Figure 6.
Organic acids expressed as mg/L: (A) citric acid and (B) lactic acid. Data are expressed as mean (n = 3).
In detail, regarding citric acid, there was an increase in CFSs and E. coli and P. aeruginosa samples with and without CFSs, reaching values between 11 and 12 g/L. The citric acid content is related to the matrix, exhibiting values similar to those reported by Carballo et al. [27], as 9.7 and 15.1 g/L, and to the microbial metabolism, storage temperature, and transcription factors involved [28]. As far as lactic acid is concerned, the starting value was found to be between 0.8 and 1.5 g/L in all samples and remained slightly constant over time, with values between 0.9 and 1.6 g/L at the end of storage, with the lowest value in S. aureus and the highest in CFS samples, respectively.
3.6. Dynamics of the Main Microbial Groups in Minimally Processed Orange Slices Treated Differently During Storage at Refrigerated Conditions
Several pathogens are associated with the contamination of fresh fruit, such as E. coli, Listeria spp., Pseudomonas spp., and S. aureus [29]. Therefore, any proposal for new strategies must consider these microbiological risks to comply with hygienic parameters. In this scenario, the antagonistic effect of mixed CFSs, obtained from L. plantarum spp. and Ln. mesenteroides, was evaluated at different storage times (Figure 7).
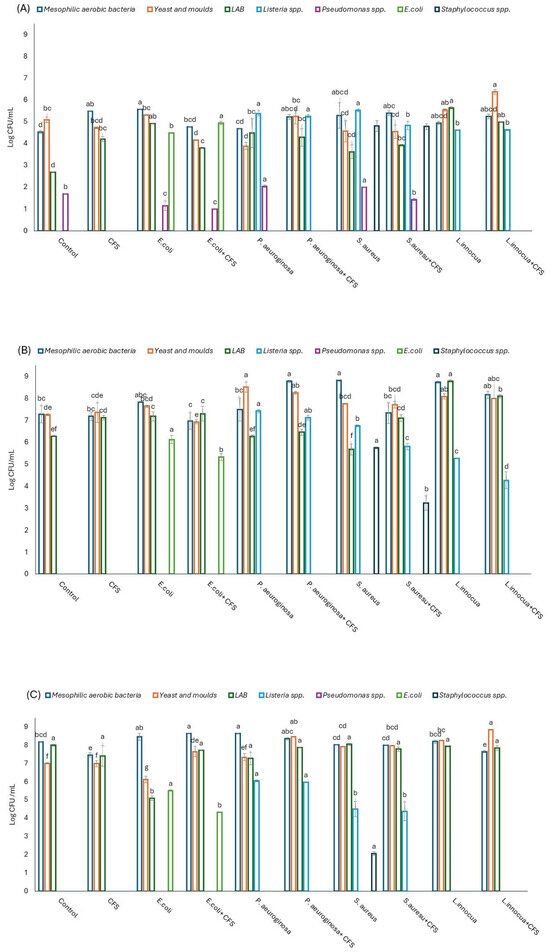
Figure 7.
Microbial counts (Log CFU/mL) detected at different times: (A) after 3 days of storage; (B) after 8 days of storage; and (C) after 10 days of storage. Different letters indicate statistical differences within the same microbial group (at p ≤ 0.05).
The just-peeled fresh fruit (time 0) showed a moderate microbial population composed of total aerobic mesophilic counts, yeasts, and LAB with a value of 4.71, 4.96, and 3.64 Log CFU/mL, respectively.
The results showed that at the end of the storage period, the applied CFS induced a decrease of 1.19 Log CFU/mL of E. coli, while S. aureus was not detected by conventional plating. These results confirmed the in vitro test findings, where the greatest antimicrobial activity of the mixed CFS was found with E. coli and S. aureus. These results align with those reported by several authors, underlining the importance of the pool of substances (organic acids, bacteriocin-like compounds, and other metabolites) in the antimicrobial activity against pathogens [30,31,32]. To better understand the correlation among the microbial groups, the Pearson correlation was calculated (Figure 8).
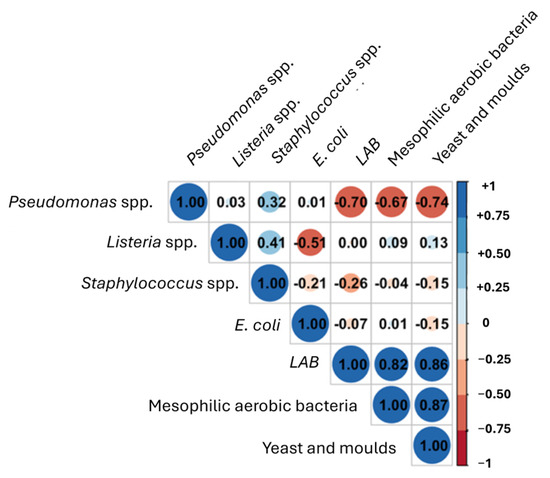
Figure 8.
Correlation plot between different microbial groups using Pearson correlation index.
A negative correlation was observed for LAB, mesophilic aerobic bacteria, and yeast against Pseudomonas spp. and, although to a lesser extent, versus Staphylococcus spp. Therefore, as already reported, the predominance of some microbial groups over others can inhibit the growth of pathogenic microorganisms, representing a promising bio-preservation strategy [33].
Furthermore, the correlations between the different microbial groups at different refrigeration times were analysed (Figure 9).
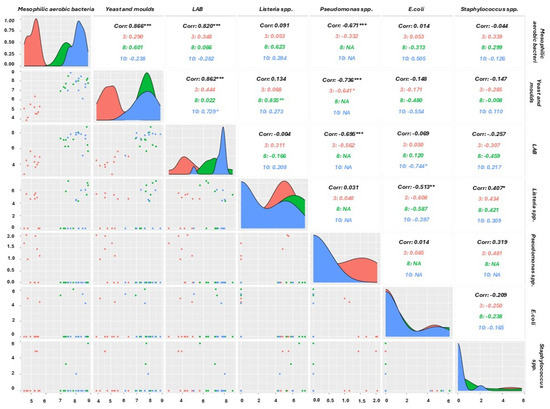
Figure 9.
Correlation plot of different microbial groups using Pearson correlation index at different times (* Significance at p ≤ 0.05; ** Significance at p ≤ 0.01; and *** Significance at p ≤ 0.001).
As shown in the graph, some correlations were very high, such as those with R2 values > 0.8 (0.866, 0.820, and 0.862), indicating a strong relationship between the variables’ total mesophilic aerobic load, LAB, yeasts, and moulds, indicating that their growth is linked to common or interacting factors. Furthermore, after 3 days, a positive correlation between Staphylococcus spp., Listeria spp., and Pseudomonas spp. was found, indicating that these target bacteria thrive under similar conditions, such as low-acidic environments or specific environmental stressors. In contrast, a strong negative correlation, R2 < −0.6, is observed, indicating an inverse association between Pseudomonas spp. and the total aerobic mesophilic load (−0.671), LAB (−0.695), and yeast (−0.736).
4. Conclusions
This study aimed to validate a new approach based on a postbiotic application on minimally processed orange slices. The results showed that the CFS mix obtained from L. plantarum and Ln. mesenteroides strains showed an antibacterial activity against S. aureus and E. coli in fresh-cut orange slices. Therefore, the application of the CFS as an antimicrobial exhibited an important potential as additives or ingredients in the food industry for prolonging the shelf-life of fruit products without modifying the main physico-chemical parameters of the final products or impacting the environment. This last aspect should increasingly guide the choice of food additives in the future.
In conclusion, the CFS can be proposed as a biopreservative for orange slices with a clean label, although its stability needs to be evaluated, and its limit of application is ruled by specific legislation.
Supplementary Materials
The following supporting information can be downloaded at https://www.mdpi.com/article/10.3390/app15126736/s1: Figure S1: Orange slices prepared at a lab scale in polystyrene containers; Table S1: Antimicrobial activity of cells and CFS of tested strains; and Table S2: Chemical analyses of orange slice samples treated differently during storage.
Author Contributions
Conceptualization, P.F. and N.R.; methodology, P.F., F.V.R., N.R. and C.C.; formal analysis, G.S.; investigation, P.F., G.S. and M.C.S.; resources, M.C.S. and M.A.; data curation, P.F. and M.A.; writing—original draft preparation, P.F. and N.R.; writing—review and editing, F.V.R. and C.C.; supervision, F.V.R. and C.C.; project administration, F.V.R.; funding acquisition, F.V.R. and C.C. All authors have read and agreed to the published version of the manuscript.
Funding
This research was funded by the Italian Ministry of University and Research (MUR), project “Conservabilità, qualità e sicurezza dei prodotti ortofrutticoli ad alto contenuto di servizio—POFACS”, ARS01_00640—D.D. 1211/2020 and 1104/2021.
Institutional Review Board Statement
Not applicable.
Informed Consent Statement
Not applicable.
Data Availability Statement
The original contributions presented in this study are included in the article/Supplementary Materials. Further inquiries can be directed to the corresponding author.
Conflicts of Interest
The authors declare no conflicts of interest.
References
- Pilone, V.; Stasi, A.; Baselice, A. Quality preferences and pricing of fresh-cut salads in Italy: New evidence from market data. Brit. Food J. 2017, 119, 1473–1486. [Google Scholar] [CrossRef]
- Food and Drug Administration (FDA). Current Good Manufacturing Practice, Hazard Analysis, and Risk-Based Preventive Controls for Human Food. 2015. Available online: http://federalregister.gov/a/2015-21920 (accessed on 15 April 2025).
- Russo, P.; Botticella, G.; Capozzi, V.; Massa, S.; Spano, G.; Beneduce, L. A Fast, Reliable, and Sensitive Method for Detection and Quantification of Listeria monocytogenes and Escherichia coli O157:H7 in Ready-to-Eat Fresh-Cut Products by MPN-QPCR. BioMed Res. Int. 2014, 2014, 608296. [Google Scholar] [CrossRef] [PubMed][Green Version]
- Belgacem, I.; Schena, L.; Teixidó, N.; Romeo, F.V.; Ballistreri, G.; Abadias, M. Effectiveness of a pomegranate peel extract (PGE) in reducing Listeria monocytogenes in vitro and on fresh-cut pear, apple and melon. Eur. Food Res. Technol. 2020, 246, 1765–1772. [Google Scholar] [CrossRef]
- Sharafi, H.; Divsalar, E.; Rezaei, Z.; Liu, S.-Q.; Moradi, M. The Potential of Postbiotics as a Novel Approach in Food Packaging and Biopreservation: A Systematic Review of the Latest Developments. Crit. Rev. Food Sci. Nutr. 2023, 64, 12524–12554. [Google Scholar] [CrossRef]
- Aguirre-Garcia, Y.L.; Nery-Flores, S.D.; Campos-Muzquiz, L.G.; Flores-Gallegos, A.C.; Palomo-Ligas, L.; Ascacio-Valdés, J.A.; Sepúlveda-Torres, L.; Rodríguez-Herrera, R. Lactic Acid Fermentation in the Food Industry and Bio-Preservation of Food. Fermentation 2024, 10, 168. [Google Scholar] [CrossRef]
- Obis, D.; Paris, M.; Ouwehand, A.C. The safety of lactic acid bacteria for use in foods. In Lactic Acid Bacteria; CRC Press: Boca Raton, FL, USA, 2019; pp. 355–369. [Google Scholar] [CrossRef]
- Mani-López, E.; Arrioja-Bretón, D.; López-Malo, A. The impacts of antimicrobial and antifungal activity of cell-free supernatants from lactic acid bacteria in vitro and foods. Compr. Rev. Food Sci. Food Saf. 2022, 21, 604–641. [Google Scholar] [CrossRef]
- Foti, P.; Ballistreri, G.; Timpanaro, N.; Rapisarda, P.; Romeo, F.V. Prebiotic Effects of Citrus Pectic Oligosaccharides. Nat. Prod. Res. 2022, 36, 3173–3176. [Google Scholar] [CrossRef]
- Cenci-Goga, B.T.; Sechi, P.; Iulietto, M.F.; Amirjalali, S.; Barbera, S.; Karama, M.; Aly, S.S.; Grispoldi, L. Characterization and growth under different storage temperatures of ropy slime-producing Leuconostoc mesenteroides isolated from cooked meat products. J. Food Prot. 2020, 83, 1043–1049. [Google Scholar] [CrossRef]
- Torriani, S.; Felis, G.E.; Dellaglio, F. Differentiation of Lactobacillus plantarum, L. pentosus, and L. paraplantarum by recA gene sequence analysis and multiplex PCR assay with recA gene-derived primers. Appl. Environ. Microbiol. 2001, 67, 3450–3454. [Google Scholar] [CrossRef]
- Coudeyras, S.; Marchandin, H.; Fajon, C.; Forestier, C. Taxonomic and Strain-Specific Identification of the Probiotic Strain Lactobacillus rhamnosus 35 within the Lactobacillus casei Group. Appl. Environ. Microbiol. 2008, 74, 2679–2689. [Google Scholar] [CrossRef]
- Behare, P.V.; Mazhar, S.; Pennone, V.; McAuliffe, O. Evaluation of lactic acid bacteria strains isolated from fructose-rich environments for their mannitol-production and milk-gelation abilities. J. Dairy Sci. 2020, 103, 11138–11151. [Google Scholar] [CrossRef] [PubMed]
- Russo, N.; Caggia, C.; Pino, A.; Coque, T.M.; Arioli, S.; Randazzo, C.L. Enterococcus spp. in Ragusano PDO and Pecorino Siciliano cheese types: A snapshot of their antibiotic resistance distribution. Food Chem. Toxicol. 2018, 120, 277–286. [Google Scholar] [CrossRef] [PubMed]
- Tenover, F.C.; Arbeit, R.D.; Goering, R.V.; Mickelsen, P.A.; Murray, B.E.; Persing, D.H.; Swaminathan, B. Interpreting chromosomal DNA restriction patterns produced by pulsed-field gel electrophoresis: Criteria for bacterial strain typing. J. Clin. Microbiol. 1995, 33, 2233–2239. [Google Scholar] [CrossRef] [PubMed]
- Ben Farhat, L.; Romeo, F.V.; Foti, P.; Russo, N.; Randazzo, C.L.; Caggia, C.; Abidi, F. Multi-Functional Potential of Lactic Acid Bacteria Strains and Antimicrobial Effects in Minimally Processed Pomegranate (Punica granatum L. cv Jolly Red) Arils. Microorganisms 2022, 10, 1876. [Google Scholar] [CrossRef]
- Mokdad, F.H.; Benmechernene, Z.; Benyoucef, A.; Russo, N.; Randazzo, C.L.; Caggia, C.; Kihal, M. Characterization of bioactive Leuconostoc mesenteroides producing bacteriocin strains isolated from camel’s and goat’s Algerian raw milks. Int. J. Sci. Res. 2020, 76, 32–61. [Google Scholar] [CrossRef]
- EFSA Panel on Additives and Products or Substances used in Animal Feed (FEEDAP). Guidance on the assessment of bacterial susceptibility to antimicrobials of human and veterinary importance. EFSA J. 2012, 10, 2740. [Google Scholar] [CrossRef]
- Montville, T.J.; Matthews, K.R. Physiology, growth, and inhibition of microbes in foods. Food Microbiol. Fundam. Front. 2012, 2013, 3–18. [Google Scholar] [CrossRef]
- Yolmeh, M.; Khomeiri, M.; Ahmadi, Z. Application of mixture design to introduce an optimum cell-free supernatant of multiple-strain mixture (MSM) for Lactobacillus against food-borne pathogens. LWT Food Sci. Technol. 2017, 83, 298–304. [Google Scholar] [CrossRef]
- Bangar, S.P.; Suri, S.; Trif, M.; Ozogul, F. Organic acids production from lactic acid bacteria: A preservation approach. Food Biosci. 2022, 46, 101615. [Google Scholar] [CrossRef]
- Özcelik, S.; Kuley, E.; Özogul, F. Formation of lactic, acetic, succinic, propionic, formic and butyric acid by lactic acid bacteria. LWT 2016, 73, 536–542. [Google Scholar] [CrossRef]
- Food and Drug Administration (FDA). Guidance for Industry: Guide to Minimize Microbial Food Safety Hazards of Fresh-Cut Fruits and Vegetables. 2008. Available online: https://www.fda.gov/Food/GuidanceRegulation/GuidanceDocumentsRegulatoryInformation/ProducePlantProducts/ucm064458.htm (accessed on 28 March 2025).
- Vaccalluzzo, A.; Pino, A.; De Angelis, M.; Bautista-Gallego, J.; Romeo, F.V.; Foti, P.; Caggia, C.; Randazzo, C.L. Effects of Different Stress Parameters on Growth and on Oleuropein-Degrading Abilities of Lactiplantibacillus plantarum Strains Selected as Tailored Starter Cultures for Naturally Table Olives. Microorganisms 2020, 8, 1607. [Google Scholar] [CrossRef] [PubMed]
- Macarisin, D.; Sheth, I.; Hur, M.; Wooten, A.; Kwon, H.J.; Gao, Z.; De Jesus, A.; Jurick, W.; Chen, Y. Survival of outbreak, food, and environmental strains of Listeria monocytogenes on whole apples as affected by cultivar and wax coating. Sci. Rep. 2019, 9, 12170. [Google Scholar] [CrossRef] [PubMed]
- Kho, K.; Kadar, A.D.; Bani, M.D.; Pramanda, I.T.; Martin, L.; Chrisdianto, M.; Pratama, F.; Devanthi, P.V.P. The Potential of Pediococcus acidilactici Cell-Free Supernatant as a Preservative in Food Packaging Materials. Foods 2024, 13, 644. [Google Scholar] [CrossRef] [PubMed]
- Carballo, S.; Zingarello, F.A.; Maestre, S.E.; Todoli, J.L.; Prats, M.S. Optimisation of analytical methods for the characterisation of oranges, clementines and citrus hybrids cultivated in spain on the basis of their composition in ascorbic acid, citric acid and major sugars. Int. J. Food Sci. Technol. 2014, 49, 146–152. [Google Scholar] [CrossRef]
- Xie, X.L.; Yin, X.R.; Chen, K.S. Roles of APETALA2/ethylene-response factors in regulation of fruit quality. Crit. Rev. Plant Sci. 2016, 35, 120–130. [Google Scholar] [CrossRef]
- Carstens, C.K.; Salazar, J.K.; Darkoh, C. Multistate Outbreaks of Foodborne Illness in the United States Associated with Fresh Produce from 2010 to 2017. Front. Microbiol. 2019, 10, 2667. [Google Scholar] [CrossRef]
- Bian, L.; Molan, A.L.; Maddox, I.; Shu, Q. Antimicrobial activity of Lactobacillus reuteri DPC16 supernatants against selected food borne pathogens. World J. Microbiol. Biotechnol. 2011, 27, 991–998. [Google Scholar] [CrossRef]
- Ozogul, F.; Tabanelli, G.; Toy, N.; Gardini, F. Impact of cell-free supernatant of lactic acid bacteria on putrescine and other polyamine formation by foodborne pathogens in ornithine decarboxylase broth. J. Agric. Food Chem. 2015, 63, 5828–5835. [Google Scholar] [CrossRef]
- Sanpa, S.; Sanpa, S.; Suttajit, M. Lactic acid bacteria isolates from Pla-som, their antimicrobial activities and fermentation properties in Pla-som. J. Food Health Bioenviron. Sci. 2019, 12, 36–43. Available online: https://li01.tci-thaijo.org/index.php/sdust/article/view/186555 (accessed on 17 April 2025).
- Riesute, R.; Salomskiene, J.; Moreno, D.S.; Gustiene, S. Effect of yeasts on food quality and safety and possibilities of their inhibition. Trends Food Sci. Technol. 2021, 108, 1–10. [Google Scholar] [CrossRef]
Disclaimer/Publisher’s Note: The statements, opinions and data contained in all publications are solely those of the individual author(s) and contributor(s) and not of MDPI and/or the editor(s). MDPI and/or the editor(s) disclaim responsibility for any injury to people or property resulting from any ideas, methods, instructions or products referred to in the content. |
© 2025 by the authors. Licensee MDPI, Basel, Switzerland. This article is an open access article distributed under the terms and conditions of the Creative Commons Attribution (CC BY) license (https://creativecommons.org/licenses/by/4.0/).