Abstract
Additive manufacturing via Fused Filament Fabrication (FFF) has enabled the development of functional components with customized mechanical properties. In this context, the use of polymers with flame-retardant additives offers an ideal solution for sectors such as aerospace, where fire resistance is a top priority. However, the tribological properties of these materials have not yet been sufficiently studied, despite their relevance in applications subjected to friction or wear. This study analyzes the tribological behavior of parts manufactured using PETG (Polyethylene Terephthalate Glycol) and flame-retardant PETG (PETG FP) through dry condition Ball-on-Disk tests. The influence of manufacturing parameters such as extrusion temperature and layer height on the coefficient of friction (CoF), surface wear, and roughness is investigated. The results show that PETG FP exhibits an increased CoF compared to conventional PETG, although it demonstrates more stable behavior at elevated temperatures. Statistical analysis via ANOVA reveals that material type and layer height significantly affect tribological properties, while temperature plays a secondary role. This study provides key insights for the selection of polymeric materials in environments with critical functional demands.
1. Introduction
Additive Manufacturing (AM) is not just a new way of producing, it is a new way of thinking about manufacturing. For the first time, we are no longer constrained by molds, tools, or standards imposed by mass production. It is possible to design parts that not only fit a specific shape but also respond precisely to the demands of their final application. Geometry, internal structure, and functional properties are integrated from the design stage, allowing for optimized and customized solutions like never before [1]. This approach does not replace traditional manufacturing; rather, it complements, expands, and challenges it to evolve. Additive manufacturing is, in essence, an invitation to reimagine what we manufacture, how we do it, and above all, why [2].
The increasing accessibility of additive manufacturing and computer-aided design (CAD) software has led to the widespread adoption of AM in today’s industry, especially in biomedical, automotive, and aerospace applications. These sectors benefit from the so-called “complexity for free” paradigm, which suggests that geometric complexity can be increased without significantly raising the cost of the final product [3]. However, recent studies have questioned this notion, showing that design complexity can negatively affect manufacturing time and material consumption [4]. Nevertheless, when managed properly, complex designs can serve as performance indicators in AM, optimizing dimensional accuracy and process sustainability [5]. This, combined with the inherent sustainability of additive processes, has accelerated their adoption across various industrial sectors [6,7,8].
Still, the most sought-after feature is not complexity per se, but the ability to create parts with optimized properties—either by modifying the design or by incorporating new or multi-material combinations. As a result, new materials are continuously being developed to meet the specific performance needs of parts, beyond just their mechanical properties.
For example, functionally graded materials can tailor properties such as thermal or mechanical resistance within a single part, which is particularly valuable in the aerospace sector [9]. In this industry, flame resistance is also essential, and specific developments of flame-retardant polymers such as ULTEM or PAEK have already been adapted for additive processes like selective laser sintering [10]. Research on polymer powders such as PPSF has also shown promising results as new fire-resistant materials for 3D printing in critical applications [11].
Thermal stability has always been a limiting factor in the service behavior of polymers. According to Bourbigot et al. [12], improving fire resistance or thermal stability typically requires either chemical modification or the addition of other materials in the form of additives. These additives have enabled the development of thermoplastic filaments suitable for additive manufacturing, specifically for material extrusion processes.
According to ISO/ASTM 52900:2021 [13], Material Extrusion (MEX) is a family of processes where material is extruded through a nozzle, changing its state in order to be deposited layer by layer, ultimately building a three-dimensional shape [14,15].
Within this family of processes, Fused Filament Fabrication (FFF) is the most commonly used technique, typically involving thermoplastic materials [7,14], such as Acrylonitrile Butadiene Styrene (ABS), Polylactic Acid (PLA), Polycarbonate (PC), and Polyethylene Terephthalate Glycol (PETG). This places FFF within the broader category of polymer additive manufacturing. In addition to these, new trends focus on the use of other materials, particularly reinforced organic matrix composites [7,14].
The incorporation of additives into these polymers has enabled the development of flame-resistant materials. Flame-retardant grades of ABS [16], PLA [17], PC [18,19], and PETG [20] are now available. In all cases, these materials achieve the V-0 rating [21] under the UL94 standard, indicating the highest level of flame resistance according to this classification:
- The maximum after-flame time after removing the material from the flame is 10 s or less.
- No dripping of flaming particles occurs.
- Afterglow combustion does not last more than 30 s after removing the flame source.
These characteristics make such materials ideal for industrial applications. However, their original drawbacks remain: ABS, although strong, emits toxic compounds during printing and has a greater environmental impact [22]; PLA is biodegradable but moisture-sensitive, limiting its durability in certain environments [23]; and PC, despite its thermal and mechanical strength, poses printing challenges due to the high temperatures required and its tendency to warp from shrinkage [24]. In contrast, PETG offers an excellent alternative, combining good mechanical strength, ease of printing, and a lower environmental impact [25], making it especially suitable for functional applications across different industries [26].
Nonetheless, there are very few studies on the fire-resistant additivated materials and they focus on traditional mechanical properties, such as those found in the material manufacturers’ data. In the case of fire-resistant PETG, only certain mechanical properties are known, and no other mechanical aspects of great relevance are known. Nevertheless, recent studies [27,28,29] demonstrate that tribological properties can be decisive in material selection, particularly for parts in motion, or subject to friction and vibrations. For this reason, evaluating these properties is a matter of special interest.
Polymer tribology has gained increasing attention in recent decades as the use of polymeric materials in functional applications has grown—particularly due to the rise in polymer additive manufacturing. Although this field is still less explored than that of metallic materials, it is crucial in sectors requiring low-friction, high wear-resistance components. Polymers exhibit unique tribological behavior due to their viscoelastic nature, low hardness, and adaptability to the contact surface. Wear in polymers usually results from a combination of friction and plastic deformation, and their coefficient of friction (CoF) tends to be high due to the increased contact area caused by material deformability [30,31,32,33].
In this context, the most commonly used materials in FFF exhibit varied behavior. PLA, for instance, has a lower CoF than other polymers such as ABS, but it suffers greater wear—although this can be improved with reinforcements like copper or aluminium [34,35,36]. ABS, on the other hand, has greater wear resistance than PLA and offers more consistent performance in humid environments, especially when reinforced with carbon fibers [37,38].
PETG has gained popularity due to its good wear resistance, combining hardness and flexibility. Compared to unreinforced PLA and ABS, PETG shows up to 40% less wear, and its performance improves in humid conditions [34,35]. However, there are no existing studies on PETG materials enhanced with fire-resistant additives.
In this context, the present study aims to analyze the tribological behavior of parts manufactured using PETG with flame-retardant additives via FFF technology. Through a series of tests designed to evaluate the coefficient of friction, wear resistance, and surface roughness, this work seeks to determine the extent to which additive incorporation affects the material’s functional properties. A comparison with conventional PETG will allow for objective criteria to be established for its potential application in industrial settings where fire safety requirements coexist with mechanical demands related to contact and friction. This study will help to decide the possible industrial applications of PETG with flame-retardant additives in applications where there is relative motion between different objects.
2. Experimental Procedure
The objective of this study is to determine how the tribological properties of PETG parts manufactured via FFF are altered when flame-retardant additives are incorporated. To this end, tests were conducted to analyze the relationship between manufacturing parameters, the characteristics of the fabricated specimens, and their influence on the coefficient of friction (CoF) and wear resistance. Figure 1 illustrates the steps followed during the tribological testing process.
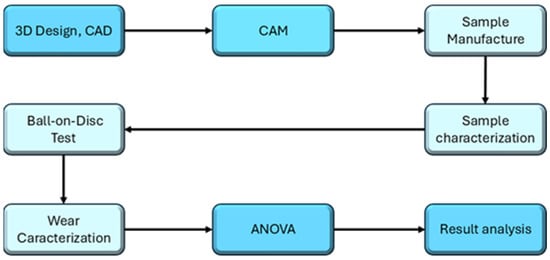
Figure 1.
Methodology followed for the dry tribology test.
For this purpose, cylindrical specimens (Figure 2) were fabricated using two materials: PETG and flame-retardant PETG. In both cases, commercial-grade materials were selected from the manufacturer Smartmaterials 3D (Smartmaterials 3D, Alcalá la Real, Jaén, Spain). The flame-retardant PETG is commercially known as PETG Fire Retardant (FP). The microhardness of both materials has been analyzed and is very similar in both cases: 10.34 HMV for PETG and 11 HMV for flame-retardant PETG.
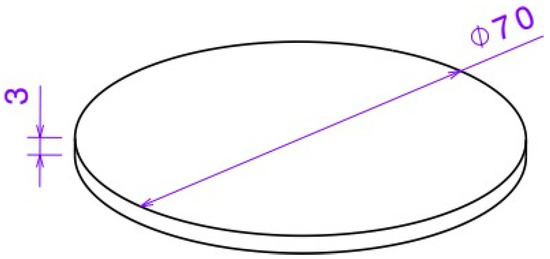
Figure 2.
Representation of the 3D model of the sample.
The manufacturing parameters were selected based on the manufacturer’s recommended settings (230 °C for PETG and 250 °C for PETG-FP), with adjustments made by increasing and decreasing the extrusion temperature. The remaining parameters were chosen according to values reported in the literature. Table 1 summarizes the parameters used. For the infill pattern, an Archimedean chord structure was selected to facilitate extrusion, which has been identified in the literature as an optimal solution [27,28,29,35].

Table 1.
Parameters used on the manufacture process of the PETG FP samples.
After fabrication, all specimens were examined using Stereoscopic Optical Microscopy (SOM). A Nikon SMZ 800 microscope (Nikon, Tokyo, Japan) was employed. In addition, the surface roughness of the specimens was characterized. For this purpose, nine measurements were taken radially on each specimen using a Mahr Marsurf Ps10 roughness tester (Mahr, Göttingen, Germany), measuring both Ra and Rz parameters according to UNE-EN ISO 4288:1998 [39].
To evaluate the tribological behavior of the specimens, Ball-on-Disk (BoD) tests were conducted using Microtest series MT equipment (Microtest, Madrid, Spain). This study aimed to assess the friction and wear performance of PETG modified with flame-retardant additives, compared to its unmodified counterpart manufactured using FFF. In these tests, a sphere rotates around a fixed axis on a disk-shaped surface. The sphere of a 3 mm diameter is made of AISI 316L stainless steel, with around 200 HB and 0.17 µm roughness in terms of Ra. This material is commonly used in these tests under similar conditions [27,28,29,35]. The general ASTM G99-23 standard [40] was followed and customized based on the relevant literature for FFF-manufactured parts. The test parameters are summarized in Table 2.

Table 2.
Parameters used in the Ball-on-Disk (BoD) tests.
The results of the BoD wear tests were measured using a non-contact system capable of capturing surface microgeometry via Focus Variation Microscopy (FVM). This technique reconstructs images taken at different heights, merges them, and represents the surface topography at various levels. In this study, a Bruker Alicona G5+ microscope (Bruker Alicona, Raaba/Graz, Austria) with a vertical resolution of 10 nm was used.
The statistical significance of the data obtained was analyzed using analysis of variance ANOVA by analyzing the p-value as the measure of the probability of observing the results obtained in the test, assuming that the null hypothesis is true. If the p-value is less than the significance level (α = 0.05), the null hypothesis is rejected and it is concluded that the means of the groups are significantly different. The F-value is also analyzed to determine whether the means of two or more groups are significantly different, since a low F-value will indicate that the variability between group means is similar to the variability within groups and the p-value needs to be analyzed to confirm whether this similarity is statistically significant.
3. Results
The following section presents and analyzes the results obtained from the tests performed on PETG and flame-retardant PETG (PETG FP) specimens. Several key aspects are addressed, including the defectology observed after the manufacturing process, surface roughness characterization, friction coefficient (CoF) behavior, and wear resistance. Each set of results is interpreted based on the manufacturing parameters used—namely, extrusion temperature and layer height—with the goal of identifying trends and significant correlations between process variables and the tribological properties of the evaluated materials.
3.1. Speciment Defectology
The micrographs shown were captured at the same scale, allowing for comparisons between different specimens.
As previously mentioned, spiral trajectories in the form of Archimedean Chords were used for fabricating these specimens. Since FFF is a thermal extrusion process, more pronounced defects tend to appear in areas where the nozzle remains longer [41]. For example, in the central area of the specimen, protrusions and material accumulation are visible, while the ends show evidence of stringing. This phenomenon occurs when the filament continues to extrude while the nozzle is moving without printing (retraction movements), causing the material to hang in the form of “strings” between nearby structures [42]. These defects are consistently observed across all specimens (Figure 3). However, the magnitude of temperature-induced defects is significantly lower in the PETG FP samples. This is consistent with its improved thermal resistance, despite requiring a higher extrusion temperature.
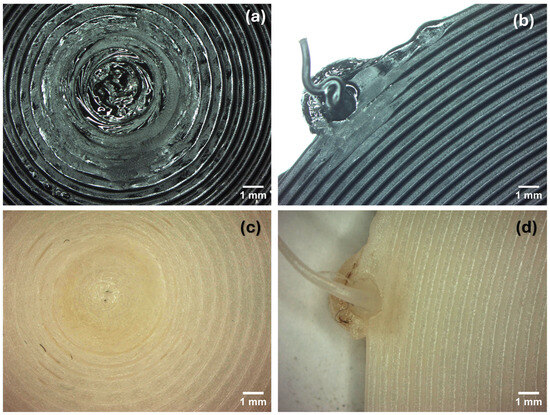
Figure 3.
Specimen defects. (a) Central region of PETG specimen. (b) Peripheral region of PETG specimen. (c) Central region of PETG FP specimen. (d) Peripheral region of PETG FP specimen.
These defects appear in the areas where tribological tests are not to be carried out. The intermediate zone of the specimens is more stable in all cases (Figure 4 and Figure 5). However, gaps between the deposited filament lines are visible. These gaps are more noticeable in PETG samples. Their occurrence is related to the material’s temperature and flow properties. Due to shrinkage effects or insufficient flow, such voids can appear, affecting the surface roughness on the top layers [43,44]. These voids are not evident in PETG FP specimens, likely because the additives improve the material’s flow behavior or reduce its shrinkage coefficient, resulting in a more stable deposition.
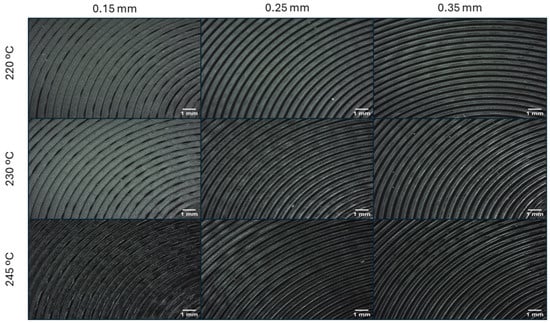
Figure 4.
Micrographs of PETG specimens manufactured with the proposed parameter combinations in the intermediate region.
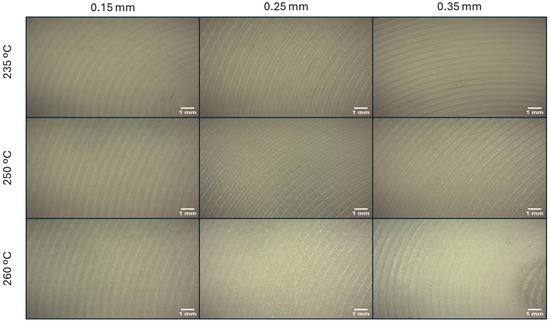
Figure 5.
Micrographs of PETG FP specimens manufactured with the proposed parameter combinations in the intermediate region.
3.2. Surface Roughness
In terms of the surface roughness of the specimens, both materials exhibited similar behavior. Figure 6 shows a comparison of surface roughness for the specimens in terms of Ra and Rz. As can be observed, both materials display similar trends, with the roughness increasing as the layer height increases. The effect of extrusion temperature is less clear, although there seems to be a slight tendency for roughness to decrease as the temperature rises. This contrasts with what was observed in the SOM analysis, where the visible gaps do not appear to significantly influence the roughness measurements.

Figure 6.
Comparison of PETG and PETG FP in terms of Ra and Rz.
However, an analysis of variance (ANOVA) revealed that the material has a statistically significant effect (Table 3). Moreover, it was noted that Rz is more sensitive to material changes than Ra. This is because Rz captures larger deviations between peaks and valleys, whereas Ra is an average value and less sensitive to outliers. In addition, no significant effect was found for the measurement area, indicating a good degree of homogeneity across the samples. Although, the low F value indicates that the means are not significantly different; therefore, the defects are similar in both cases.

Table 3.
ANOVA results for surface roughness with respect to material.
On the other hand, when the same statistical analysis is applied to the manufacturing parameters, the layer height stands out as a highly significant factor, which aligns with the trends observed in the graphs (Table 4). Furthermore, this analysis reveals another important insight: PETG FP shows high sensitivity to temperature changes. While this may seem to imply instability, it actually indicates that the material maintains more consistent behavior at higher temperatures. Thus, clearer trends emerge, and statistical significance is achieved. In contrast, PETG, which lacks specific stabilizing additives, exhibits more scattered behavior and no statistically significant trends, as no consistent pattern can be observed. Both also show an important significance with the layer thickness, despite having a very high F value, which suggests that the behaviors are nevertheless different. In addition, the interaction of both factors is significant, which can also stabilize the process due to the decrease in the F value.

Table 4.
ANOVA results for surface roughness with respect to extrusion temperature and layer height by material.
3.3. Coefficient of Friction Analysis
Regarding the coefficient of friction (CoF) obtained through the BoD tests, different behaviors were observed depending on the material and the process parameters (Figure 7 and Figure 8).

Figure 7.
CoF evolution for PETG specimens. (a) Constant layer height of 0.15 mm and test radius of 10 mm. (b) Constant layer height of 0.35 mm and test radius of 20 mm.

Figure 8.
CoF evolution for PETG specimens. (a) Constant extrusion temperature of 220 °C and test radius of 10 mm. (b) Constant extrusion temperature of 245 °C and test radius of 20 mm.
For PETG, the extrusion temperature affected the results at lower layer heights but had less influence at higher layer heights (Figure 8). Thus, layer height appears to be the more influential parameter. However, once the first printed layer begins to wear, the CoF becomes irregular—an effect that occurs sooner in specimens with thinner layers. This negative effect also tends to appear earlier at lower temperatures (Figure 9). Notably, the CoF values obtained were low overall, which is consistent with observations in the literature [27,28,29,35].

Figure 9.
CoF evolution for PETG FP specimens. (a) Constant layer height of 0.15 mm and test radius of 10 mm. (b) Constant layer height of 0.35 mm and test radius of 15 mm.
PETG FP, on the other hand, exhibited a different behavior (Figure 9). First, it showed generally higher CoF values, indicating that the presence of flame-retardant additives negatively impacts CoF. There was also a general trend for improvement with increased layer height, which contrasts with the results observed in the roughness analysis—suggesting that the CoF may not be directly correlated with roughness. This effect may be due to the enhanced stability resulting from the extrusion of larger volumes of material, which helps fill potential voids.
Additionally, extrusion temperature had a less pronounced effect on PETG FP, although a greater overall data dispersion was observed at higher temperatures (Figure 10).

Figure 10.
CoF evolution for PETG FP specimens. (a) Constant extrusion temperature of 235 °C and test radius of 15 mm. (b) Constant extrusion temperature of 260 °C and test radius of 10 mm.
When analyzing the complete dataset—averaging out the initial and final segments of the tests, which are considered stabilization phases—similar trends were observed regarding layer height. Temperature had much less impact overall, particularly in the case of PETG FP (Figure 11).

Figure 11.
Average CoF comparison results: (a) PETG; (b) PETG FP.
The ANOVA results reinforce many of these findings. The material type shows a strong statistical significance, which is visually evident in the performance graphs (Table 5). Furthermore, it shows (Table 6) lower with radius, which is related to the homogeneity of the specimens observed in the roughness study. Thus, a smaller radius implies more passes through the same point and should lead to more wear, and since the F-value is close, this means that the wear should be similar.

Table 5.
ANOVA results for CoF in relation to material.

Table 6.
ANOVA results for CoF in relation to test radius.
The analysis of manufacturing parameters is more complex (Table 7), as it only offers a qualitative significance with temperature in the case of PETG. This is in line with the previous observation of the sensitivity of PETG to temperature. On the other hand, despite the lack of significance, the low F-value indicates that the mean of these factors is close in their behavior and that they may therefore have the trends observed in the graphs.

Table 7.
ANOVA results for CoF with respect to extrusion temperature and layer height by material.
3.4. Wear Analysis
The BoD tests produced visible wear tracks, which in this study were analyzed in two dimensions, as this method has previously yielded reliable results in FFF contexts [27,28,29].
Analyzing the grooves in both materials (Figure 12), it is possible to observe how the PETG FP is more stable, being in all cases continuous grooves. In PETG, however, a typical geometry associated with material accumulation appears. This indicates that despite having a lower friction coefficient, the wear behavior of PETG is more irregular. This always occurs in the inner grooves, of smaller radii, where the ball slides more times over the same point, and is not observed in larger radii. This indicates that this appears in a high number of cycles, although the sliding distance is similar. On the other hand, the better behavior of PETG FP against temperature seems to stabilize the wear, with no accumulation of material or extrusions, which is common in other materials used in FFF [27,28,29].
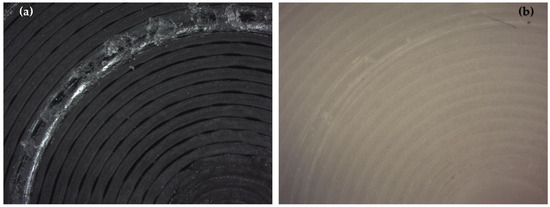
Figure 12.
Wear tracks’ comparison results: (a) PETG at 220 °C and 0.15 mm of layer thickness and 10 mm of radius; (b) PETG FP at 235 °C and 0.15 mm of layer thickness and 10 mm of radius.
This influence of the radius is very visible in the topological analysis of the specimens (Figure 13). In both materials, it can be seen that the depth is greater in the smaller radii. This depth decreases as the radius increases.
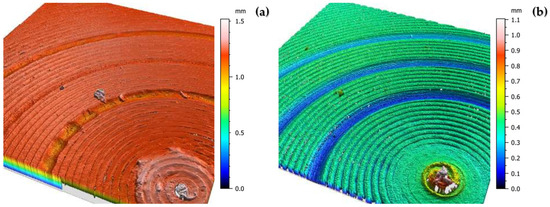
Figure 13.
Wear tracks’ comparison results: (a) PETG at 220 °C and 0.15 mm; (b) PETG FP at 235 °C and 0.25 mm.
As shown in Figure 14, the higher coefficient of friction in the PETG FP specimens led to greater material loss, resulting in wider and deeper wear tracks in all cases. Additionally, due to the irregular nature of the friction, no clear trend was observed in relation to the manufacturing parameters.

Figure 14.
Comparison of average wear track width and depth: (a) PETG; (b) PETG FP.
The ANOVA analysis confirmed the significant influence of material type, which was the only parameter to show a clear statistical effect. This is attributed to the inconsistency in how the materials respond to friction (Table 8, Table 9 and Table 10). While statistical significance was not always evident, the data from Figure 14 suggest certain trends: as layer height increases, PETG and PETG FP display opposing wear behaviors, and these trends tend to disappear as the extrusion temperature increases. This matches previous observations. Interestingly, for PETG FP, the thinnest layer height appears to offer the best wear resistance, whereas for PETG, the opposite is true. This could be explained by differences in material flow, as discussed earlier. This behavior can be supported by the low F value of these factors.

Table 8.
ANOVA results for wear track width and depth with respect to material.

Table 9.
ANOVA results for wear track width and depth with respect to test radius.

Table 10.
ANOVA results for wear track width and depth with respect to extrusion temperature and layer height by material.
4. Conclusions
This study analyzed the tribological behavior of parts manufactured via Fused Filament Fabrication (FFF) using PETG and its flame-retardant variant (PETG FP). The results obtained allow the following conclusions to be drawn:
The incorporation of flame-retardant additives into PETG results in an increase in both the coefficient of friction (CoF) and surface wear, indicating a less favorable tribological behavior compared to conventional PETG. However, PETG FP demonstrated greater dimensional and thermal stability during the manufacturing process, which may be advantageous in specific applications.
Layer height is the most influential parameter in determining surface roughness and tribological behavior. As layer height increases, there is a general trend toward increased wear and CoF, particularly for PETG. In contrast, PETG FP shows greater consistency with increasing extrusion temperature, suggesting improved flow behavior and interlayer bonding.
Although visual defects such as gaps or stringing were observed, they did not result in significant differences in the Ra roughness values between the materials. However, the Rz parameter proved more sensitive, particularly in relation to the material type and layer height.
ANOVA analyses confirmed the significant influence of the material type and layer height on tribological behavior, while the extrusion temperature had a more limited effect. This was especially evident in the case of conventional PETG, where no clear trends could be identified.
Despite its inferior tribological performance, PETG FP remains a viable option for applications where fire resistance is a priority and the frictional demands are moderate or controlled. The proper selection of manufacturing parameters can partially mitigate its disadvantages.
Author Contributions
Conceptualization, J.M.V.-M. and M.B.; project administration, G.R.-G. and J.G.-F.; experimental methodology, J.M.V.-M. and M.B.; investigation, F.d.P.R.-G., J.M.V.-M., and M.B.; data processing, F.d.P.R.-G. and M.B.; formal analysis, F.d.P.R.-G., J.M.V.-M., and M.B.; project review, G.R.-G. and J.G.-F.; writing—original draft preparation, F.d.P.R.-G., J.M.V.-M., and M.B.; writing—review and editing, G.R.-G. and J.G.-F. All authors have read and agreed to the published version of the manuscript.
Funding
This research received no external funding.
Institutional Review Board Statement
Not applicable.
Informed Consent Statement
Not applicable.
Data Availability Statement
The original contributions presented in the study are included in the article, further inquiries can be directed to the corresponding authors.
Acknowledgments
This work has been developed under the support of the Mechanical Engineering and Industrial Design department and the Vice-Rector’s Office for Scientific Policy of the University of Cadiz. The authors want to acknowledge the support from the Spanish Government (SCIENCE AND INNOVATION MINISTRY/FEDER, Grant Project EQC2018-005131-P) from the 2018 State Program for Research Infrastructures and Scientific/Technical Equipment. The authors want to report special thanks to the research group TEP-027 “Engineering and Technology of Materials and Manufacturing” of the University of Cadiz.
Conflicts of Interest
The authors declare no conflicts of interest.
References
- Sotomayor, O.; Vallejo, C.; Chicaisa, D. Un nuevo método para la fabricación de espumas metálicas aleatorias de célula abierta con regularidad controlada. Rev. Politécnica 2017, 38, 21. [Google Scholar]
- Sabino, M.A.; Loaiza, M.; Dernowsek, J.; Rezende, R.; Da Silva, J.V. Techniques for manufacturing polymer scaffolds with potential applications in tissue engineering. Rev. Lat. Metal. Mater. 2017, 37, 120–146. [Google Scholar] [CrossRef]
- Lipson, H.; Kurman, M. Fabricated: The New World of 3D Printing; Wiley: Hoboken, NJ, USA, 2013. [Google Scholar]
- Pradel, P.; Zhu, Z.; Bibb, R.; Moultrie, J. Complexity is not for free: The impact of component complexity on additive manufacturing build time. Presented at the Rapid Design, Prototyping & Manufacturing (RDPM2017), Newcastle, UK, 27–28 April 2017; Available online: https://hdl.handle.net/2134/24338 (accessed on 20 December 2024).
- George, N.; Chowdary, B. Design complexity as a driver for additive manufacturing process improvement. In Proceedings of the International Conference on Emerging Trends in Engineering & Technology (IConETech-2020), St. Augustine, FL, USA, 1–5 June 2020. [Google Scholar] [CrossRef]
- Bourell, D.L. Perspectives on Additive Manufacturing. Annu. Rev. Mater. Res. 2016, 46, 1–18. [Google Scholar] [CrossRef]
- Gardan, J. Additive manufacturing technologies: State of the art and trends. Int. J. Prod. Res. 2016, 54, 3118–3132. [Google Scholar] [CrossRef]
- Reeves, P.; Tuck, C.; Hague, R. Chapter 13: Additive Manufacturing for Mass Customization; Springer: London, UK, 2009. [Google Scholar]
- Tyagi, S.; Manjaiah, M. Laser Additive Manufacturing of Titanium-Based Functionally Graded Materials: A Review. J. Mater. Eng. Perform. 2022, 31, 6131–6148. [Google Scholar] [CrossRef]
- Lv, Y.; Thomas, W.; Chalk, R.; Singamneni, S. Flame retardant polymeric materials for additive manufacturing. Mater. Today Proc. 2020, 33, 5720–5724. [Google Scholar] [CrossRef]
- Lv, Y.; Thomas, W.; Chalk, R.; Hewitt, A.; Singamneni, S. Experimental Evaluation of Polyphenylsulfone (PPSF) Powders as Fire-Retardant Materials for Processing by Selective Laser Sintering. Polymers 2021, 13, 2704. [Google Scholar] [CrossRef]
- Bourbigot, S.; Duquesne, S. Fire retardant polymers: Recent developments and opportunities. J. Mater. Chem. 2007, 17, 2283–2300. [Google Scholar] [CrossRef]
- UNE-EN ISO/ASTM 52900:2022; Additive Manufacturing—General Principles—Fundamentals and Vocabulary. ISO: Geneva, Switzerland, 2022.
- Godec, D.; Gonzalez-Gutierrez, J.; Nordin, A.; Pei, E.; Ureña Alcázar, J. A Guide to Additive Manufacturing; Springer: Cham, Switzerland, 2022. [Google Scholar]
- Stübinger, S.; Klämpfl, F.; Schmidt, M.; Zeilhofer, H.F. Lasers in Oral and Maxillofacial Surgery; Springer: Cham, Switzerland, 2020. [Google Scholar] [CrossRef]
- Smart Materials 3D. Innovatefil ABS FP. Available online: https://www.smartmaterials3d.com/fp-fireproof (accessed on 20 December 2024).
- Kexcelled. THE K6™ PLA FR. Available online: https://kexcelled3d.com/products/the-k6-pla-fr/ (accessed on 20 December 2024).
- Polymaker. PC-FR. Available online: https://polymaker.com/product/polymax-pc-fr/ (accessed on 20 December 2024).
- Stratasys. Kimya PC-FR. Available online: https://www.stratasys.com/es/materials/materials-catalog/FFF-materials/kimya-pc-fr/ (accessed on 20 December 2024).
- Smart Materials 3D. Innovatefil PETG FP. Available online: https://www.smartmaterials3d.com/innovatefil-petg-fp (accessed on 20 December 2024).
- Underwriters Laboratories (UL). UL 94: Standard for Safety, “Flame Test Method for Plastics”; UL Solutions: Northbrook, IL, USA, 2022. [Google Scholar]
- Hill, W.; Seitz, D.; Hull, M.; Ballentine, M.; Kennedy, A. Additives influence 3D printer emission profiles: Implications for working safely with polymer filament composites. Indoor Air 2022, 32, e13130. [Google Scholar] [CrossRef]
- Zubrzycki, J.; Estrada, Q.; Staniszewski, M.; Marchewka, M. Influence of 3D Printing Parameters by FFF Method on the Mechanical Properties of Manufactured Parts. Adv. Sci. Technol. Res. J. 2022, 16, 52–63. [Google Scholar] [CrossRef]
- Patterson, A.; Hasanov, S.; Vajipeyajula, B. Influence of Matrix Material on Impact Properties of Chopped Carbon Fiber-Thermoplastic Composites Made Using FFF/FFF. In Proceedings of the 2022 International Additive Manufacturing Conference, Lisbon, Portugal, 19–20 October 2022. [Google Scholar] [CrossRef]
- Pérez, D.; Novay, E.; Mazón, H.; Llamuca, J. Elasticity and plasticity of PLA, PETG, ABS polymers for printing automotive parts. Espirales Rev. Multidiscip. Investig. 2024, 8, 51–66. [Google Scholar] [CrossRef]
- Prasad, G.; Arunav, H.; Dwight, S.; Ghosh, M.; Jayadev, A.; Nair, D. Advancing Sustainable Practices in Additive Manufacturing: A Comprehensive Review on Material Waste Recyclability. Sustainability 2024, 16, 10246. [Google Scholar] [CrossRef]
- Batista, M.; Ramirez-Peña, M.; Salguero, J.; Vazquez-Martinez, J.M. Optimization of Fused Filament Fabrication for High-Performance Polylactic Acid Parts under Wear Conditions. Lubricants 2024, 12, 281. [Google Scholar] [CrossRef]
- Batista, M.; Lagomazzini, J.M.; Ramirez-Peña, M.; Vazquez-Martinez, J.M. Mechanical and Tribological Performance of Carbon Fiber-Reinforced PETG for FFF Applications. Appl. Sci. 2023, 13, 12701. [Google Scholar] [CrossRef]
- Batista, M.; Tenorio, D.; Del Sol, I.; Vazquez-Martinez, J.M. Tribological Analysis of Fused Filament Fabrication PETG Parts Coated with IGUS. Appl. Sci. 2024, 14, 7161. [Google Scholar] [CrossRef]
- Neale, M.J. Tribology Handbook, 2nd ed.; Butterworth-Heinemann: Oxford, UK, 1995; ISBN 0-7506-1198-7. [Google Scholar]
- Chattopadhyay, R. Surface Wear: Analysis, Treatment, and Prevention; ASM Int.: Materials Park, OH, USA, 2001; ISBN 0-87170-702-0. [Google Scholar]
- Vaught, L.O.; Polycarpou, A.A. Investigating the effect of fused deposition modelling on the tribology of PETG thermoplastic. Wear 2023, 524–525, 204736. [Google Scholar] [CrossRef]
- Prabhu, R.; Devaraju, A. Recent review of tribology, rheology of biodegradable and FFF compatible polymers. Mater. Today Proc. 2020, 39, 781–788. [Google Scholar] [CrossRef]
- Hanon, M.M.; Zsidai, L. Comprehending the role of process parameters and filament color on the structure and tribological performance of 3D printed PLA. J. Mater. Res. Technol. 2021, 15, 647–660. [Google Scholar] [CrossRef]
- Batista, M.; Del Sol, I.; Gómez-Parra, Á.; Vazquez-Martinez, J.M. Tribological Performance of Additive Manufactured PLA-Based Parts. Polymers 2024, 16, 2529. [Google Scholar] [CrossRef]
- Tunalioglu, M.S.; Agca, B.V. Wear and Service Life of 3-D Printed Polymeric Gears. Polymers 2022, 14, 2064. [Google Scholar] [CrossRef]
- Mohamed, O.A.; Masood, S.H.; Bhowmik, J.L. Analysis of wear behaviour of additively manufactured PC-ABS parts. Mater. Lett. 2018, 230, 261–265. [Google Scholar] [CrossRef]
- Prusinowski, A.; Kaczyński, R. Tribological Behaviour of Additively Manufactured Fiber-Reinforced Thermoplastic Composites in Various Environments. Polymers 2020, 12, 1551. [Google Scholar] [CrossRef] [PubMed]
- ISO 4288:1998; Geometrical Product Specifications (GPS)—Surface Texture: Profile Method—Rules and Procedures for the Assessment of Surface Texture. ISO: Geneva, Switzerland, 1998.
- ASTM G99-23; Standard Test Method for Wear and Friction Testing with a Pin-on-Disk or Ball-on-Disk Apparatus. ASTM Int.: Borough, PA, USA, 2023.
- Oskolkov, A.; Bezukladnikov, I.; Trushnikov, D. Mathematical Model of the Layer-by-Layer FFF/FGF Polymer Extrusion Process for Use in the Algorithm of Numerical Implementation of Real-Time Thermal Cycle Control. Polymers 2023, 15, 4518. [Google Scholar] [CrossRef] [PubMed]
- Erokhin, K.; Naumov, S.; Ananikov, V. Analysis, classification and remediation of defects in material extrusion 3D printing. Russ. Chem. Rev. 2023, 92, 5103. [Google Scholar] [CrossRef]
- Chaidas, D.; Kitsakis, K.; Kechagias, J.; Maropoulos, S. The impact of temperature changing on surface roughness of FFF process. In Proceedings of the IOP Conference Series: Materials Science and Engineering, Kozani, Greece, 23–25 September 2016; Volume 161. [Google Scholar] [CrossRef]
- Buj-Corral, I.; Sánchez-Casas, X.; Luis-Pérez, C. Analysis of AM Parameters on Surface Roughness Obtained in PLA Parts Printed with FFF Technology. Polymers 2021, 13, 2384. [Google Scholar] [CrossRef]
Disclaimer/Publisher’s Note: The statements, opinions and data contained in all publications are solely those of the individual author(s) and contributor(s) and not of MDPI and/or the editor(s). MDPI and/or the editor(s) disclaim responsibility for any injury to people or property resulting from any ideas, methods, instructions or products referred to in the content. |
© 2025 by the authors. Licensee MDPI, Basel, Switzerland. This article is an open access article distributed under the terms and conditions of the Creative Commons Attribution (CC BY) license (https://creativecommons.org/licenses/by/4.0/).