2. Materials and Methods
2.1. Dataset
In our study, we employed the UniMiB-SHAR dataset [
3], a publicly available and widely used benchmark for human activity and fall detection research. This dataset comprises accelerometer data collected from smartphones carried by participants while performing a variety of activities, including both falls and activities of daily living (ADLs). Each observation contains tri-axial acceleration readings measured along the X, Y, and Z axes with corresponding metadata such as the activity label, participant identifier, and trial number.
The dataset includes data from 30 people (of 24 women and 6 men), aged between 18 and 60 years. In total, it contains 7013 labeled samples. The original annotation defines 17 distinct activity classes, encompassing 8 types of falls (e.g., falling leftward, generic backward falls, falls with protective strategy, and syncope) and 9 types of routine activities (e.g., walking, running, jumping, sitting down, and going up or down the stairs).
The relatively diverse participant pool and rich annotation, makes UniMiB-SHAR a valuable resource for developing and evaluating machine learning models aimed specifically at fall detection and activity recognition. Its inclusion of multiple fall types provides an especially relevant testbed for algorithms intended to distinguish dangerous events from benign motions in real-world conditions.
In this paper, we focused on a binary problem to distinguish falls from ADLs.
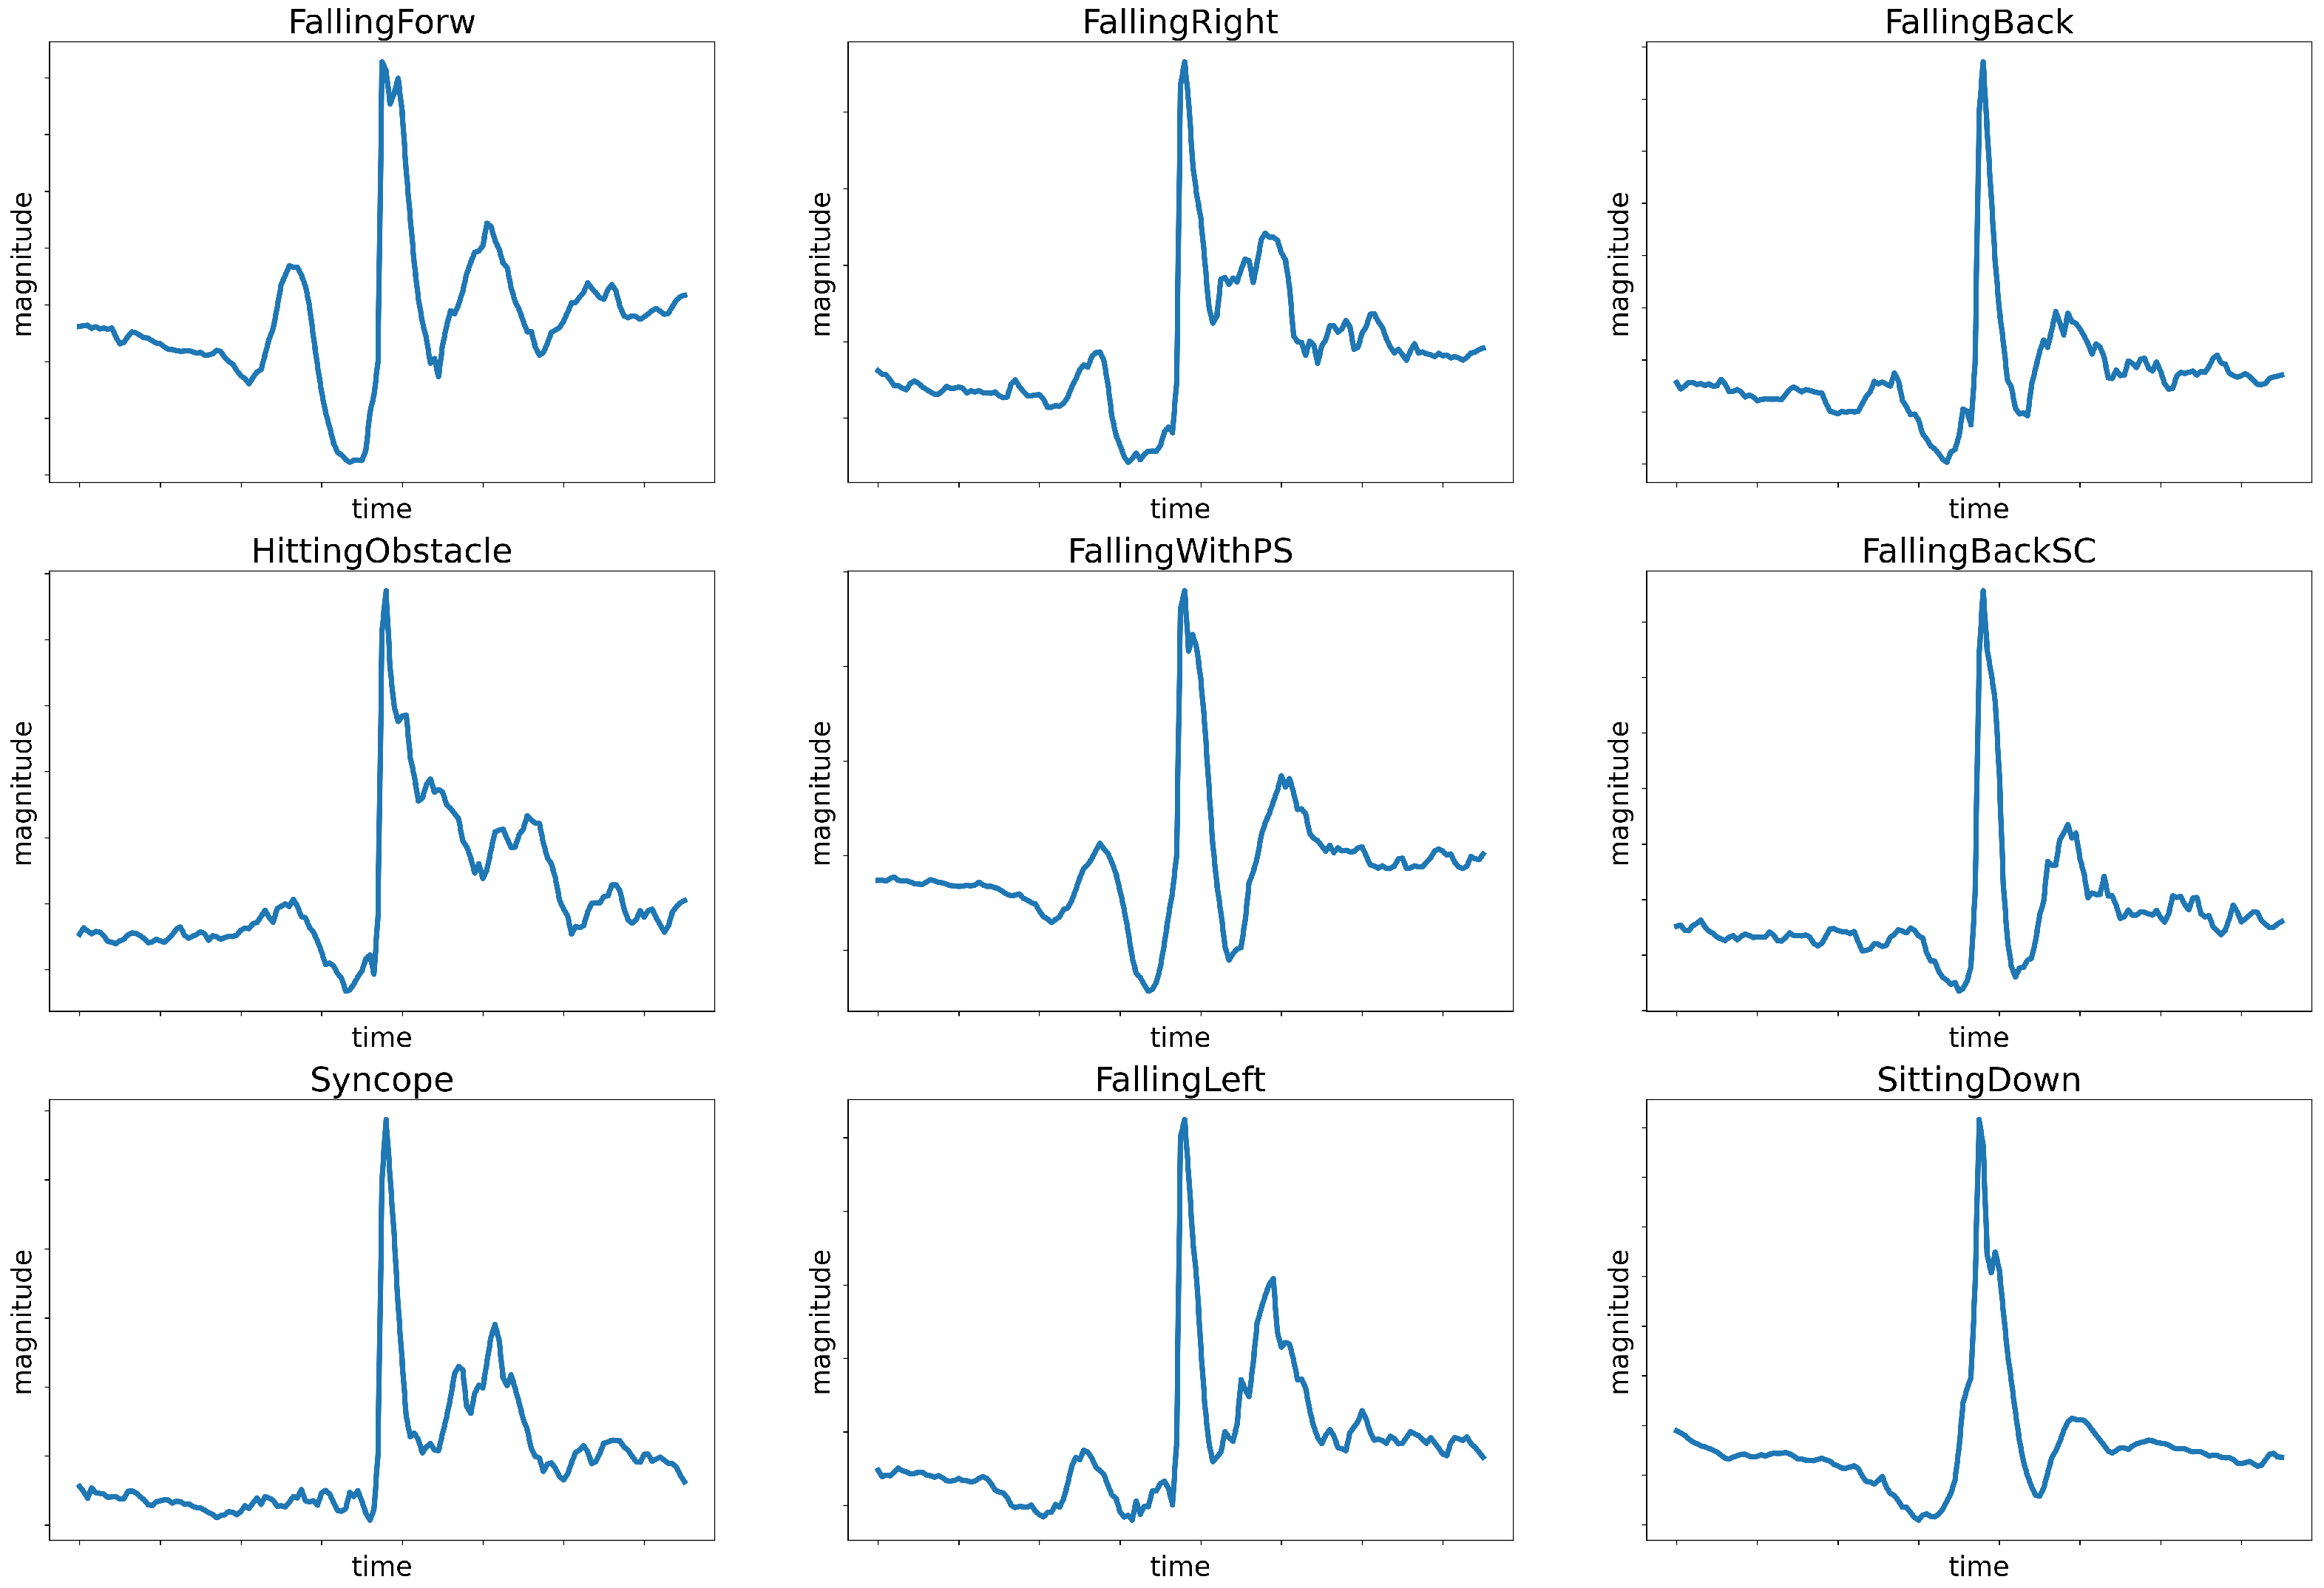
Figure 1 shows sample smartphones’ accelerometer data for eight different types of falls and, additionally, a sitting-down activity. It can be noticed that there is only a slight difference between those activities, which is not obvious at first glance. The subtle variations in accelerometer readings caused by different user activities present a formidable obstacle to achieving robust and precise classification.
2.2. Methodology
We used the same data to train and test the solution as in the reference [
3] article to ensure that our results were comparable to the competing solution. Accordingly, two approaches were applied to divide the data. The first was the
k-Fold Cross-Validation method with
, and the second was the Leave-One-Subject-Out validation. After prior shuffling, we split the data into 5 and 30 folds, respectively. In the first method, 5 groups of equal size are created (independently of the subjects’ identifiers). Leave-One-Subject-Out involves the establishment of samples about one subject as a test set and the remaining subjects as a training set, which provides a global approach to the problem. This way, we were able to reproduce the results from the reference article.
2.3. Metrics
To evaluate and compare the performance of our proposed models with existing solutions in the literature, we primarily used the accuracy metric (Equation (
1)), as it is the most commonly reported measure in fall detection studies. Accuracy represents the overall proportion of correctly classified instances, including both falls and non falls.
However, since datasets in fall detection are often imbalanced, we also report three additional classification metrics: precision, recall, and the F1-score. These metrics provide a detailed understanding of model performance, particularly in distinguishing fall events from normal daily activities.
Precision (Equation (
2)) measures the proportion of correctly predicted fall events among all instances predicted as falls.
Recall (Equation (
3)) quantifies the proportion of actual fall events that were correctly identified.
F1-score (Equation (
4)) is the harmonic mean of precision and recall, offering a balanced metric especially useful in the presence of class imbalance.
The formulas for these metrics are defined as follows:
where
—true positives (correctly detected fall events);
—true negatives (correctly detected non-fall events);
—false positives (non-fall events incorrectly classified as falls);
—false negatives (missed fall events).
These metrics provide a comprehensive evaluation of the model’s effectiveness in real-world fall detection scenarios, where both sensitivity (recall) and specificity (precision) are essential.
2.4. Evaluation Strategy
To ensure the reliability of our results, we trained and evaluated the models using the k-Fold Cross-Validation (CV) strategy. In this approach, the dataset is split into k equally sized subsets (folds). That means, for each of the k iterations, one fold is reserved as the test set, while the remaining folds are used for training. As a result, each sample in the dataset is used exactly once for validation and times for training.
We evaluated our models using two widely adopted cross-validation schemes:
k-Fold Cross-Validation with , which offers a good trade-off between computational efficiency and statistical robustness;
Leave-One-Subject-Out Cross-Validation (LOSO-CV), corresponding to , where each subject is left out once for testing while the model is trained on the data of the remaining 29 participants.
This evaluation strategy was also chosen to ensure the compatibility of our results with those reported in other studies, particularly those based on the UniMiB-SHAR dataset, where LOSO-CV is commonly used as a benchmark protocol.
Each model was trained for 20 epochs using the Adam optimizer, with a learning rate of 0.0003 and a batch size of 16 observations. To assess performance, the final accuracy of a given model was calculated as the average of the accuracy scores obtained across all k folds.
2.5. Our Approach
We propose two deep-learning models based on Recurrent Neural Networks (RNNs) [
22]. RNNs find application in signal processing due to the ability to model sequential data and capture temporal dependencies. This kind of network can effectively denoise and filter signals, making them more appropriate for further processing (i.e., classification task), and is an active subject of research [
23,
24,
25]. The problems related to this type of network are exploding and vanishing gradients [
26,
27]. Thus, we used the Gated Recurrent Unit (GRU) mechanism [
28] in our solutions to avoid such an issue.
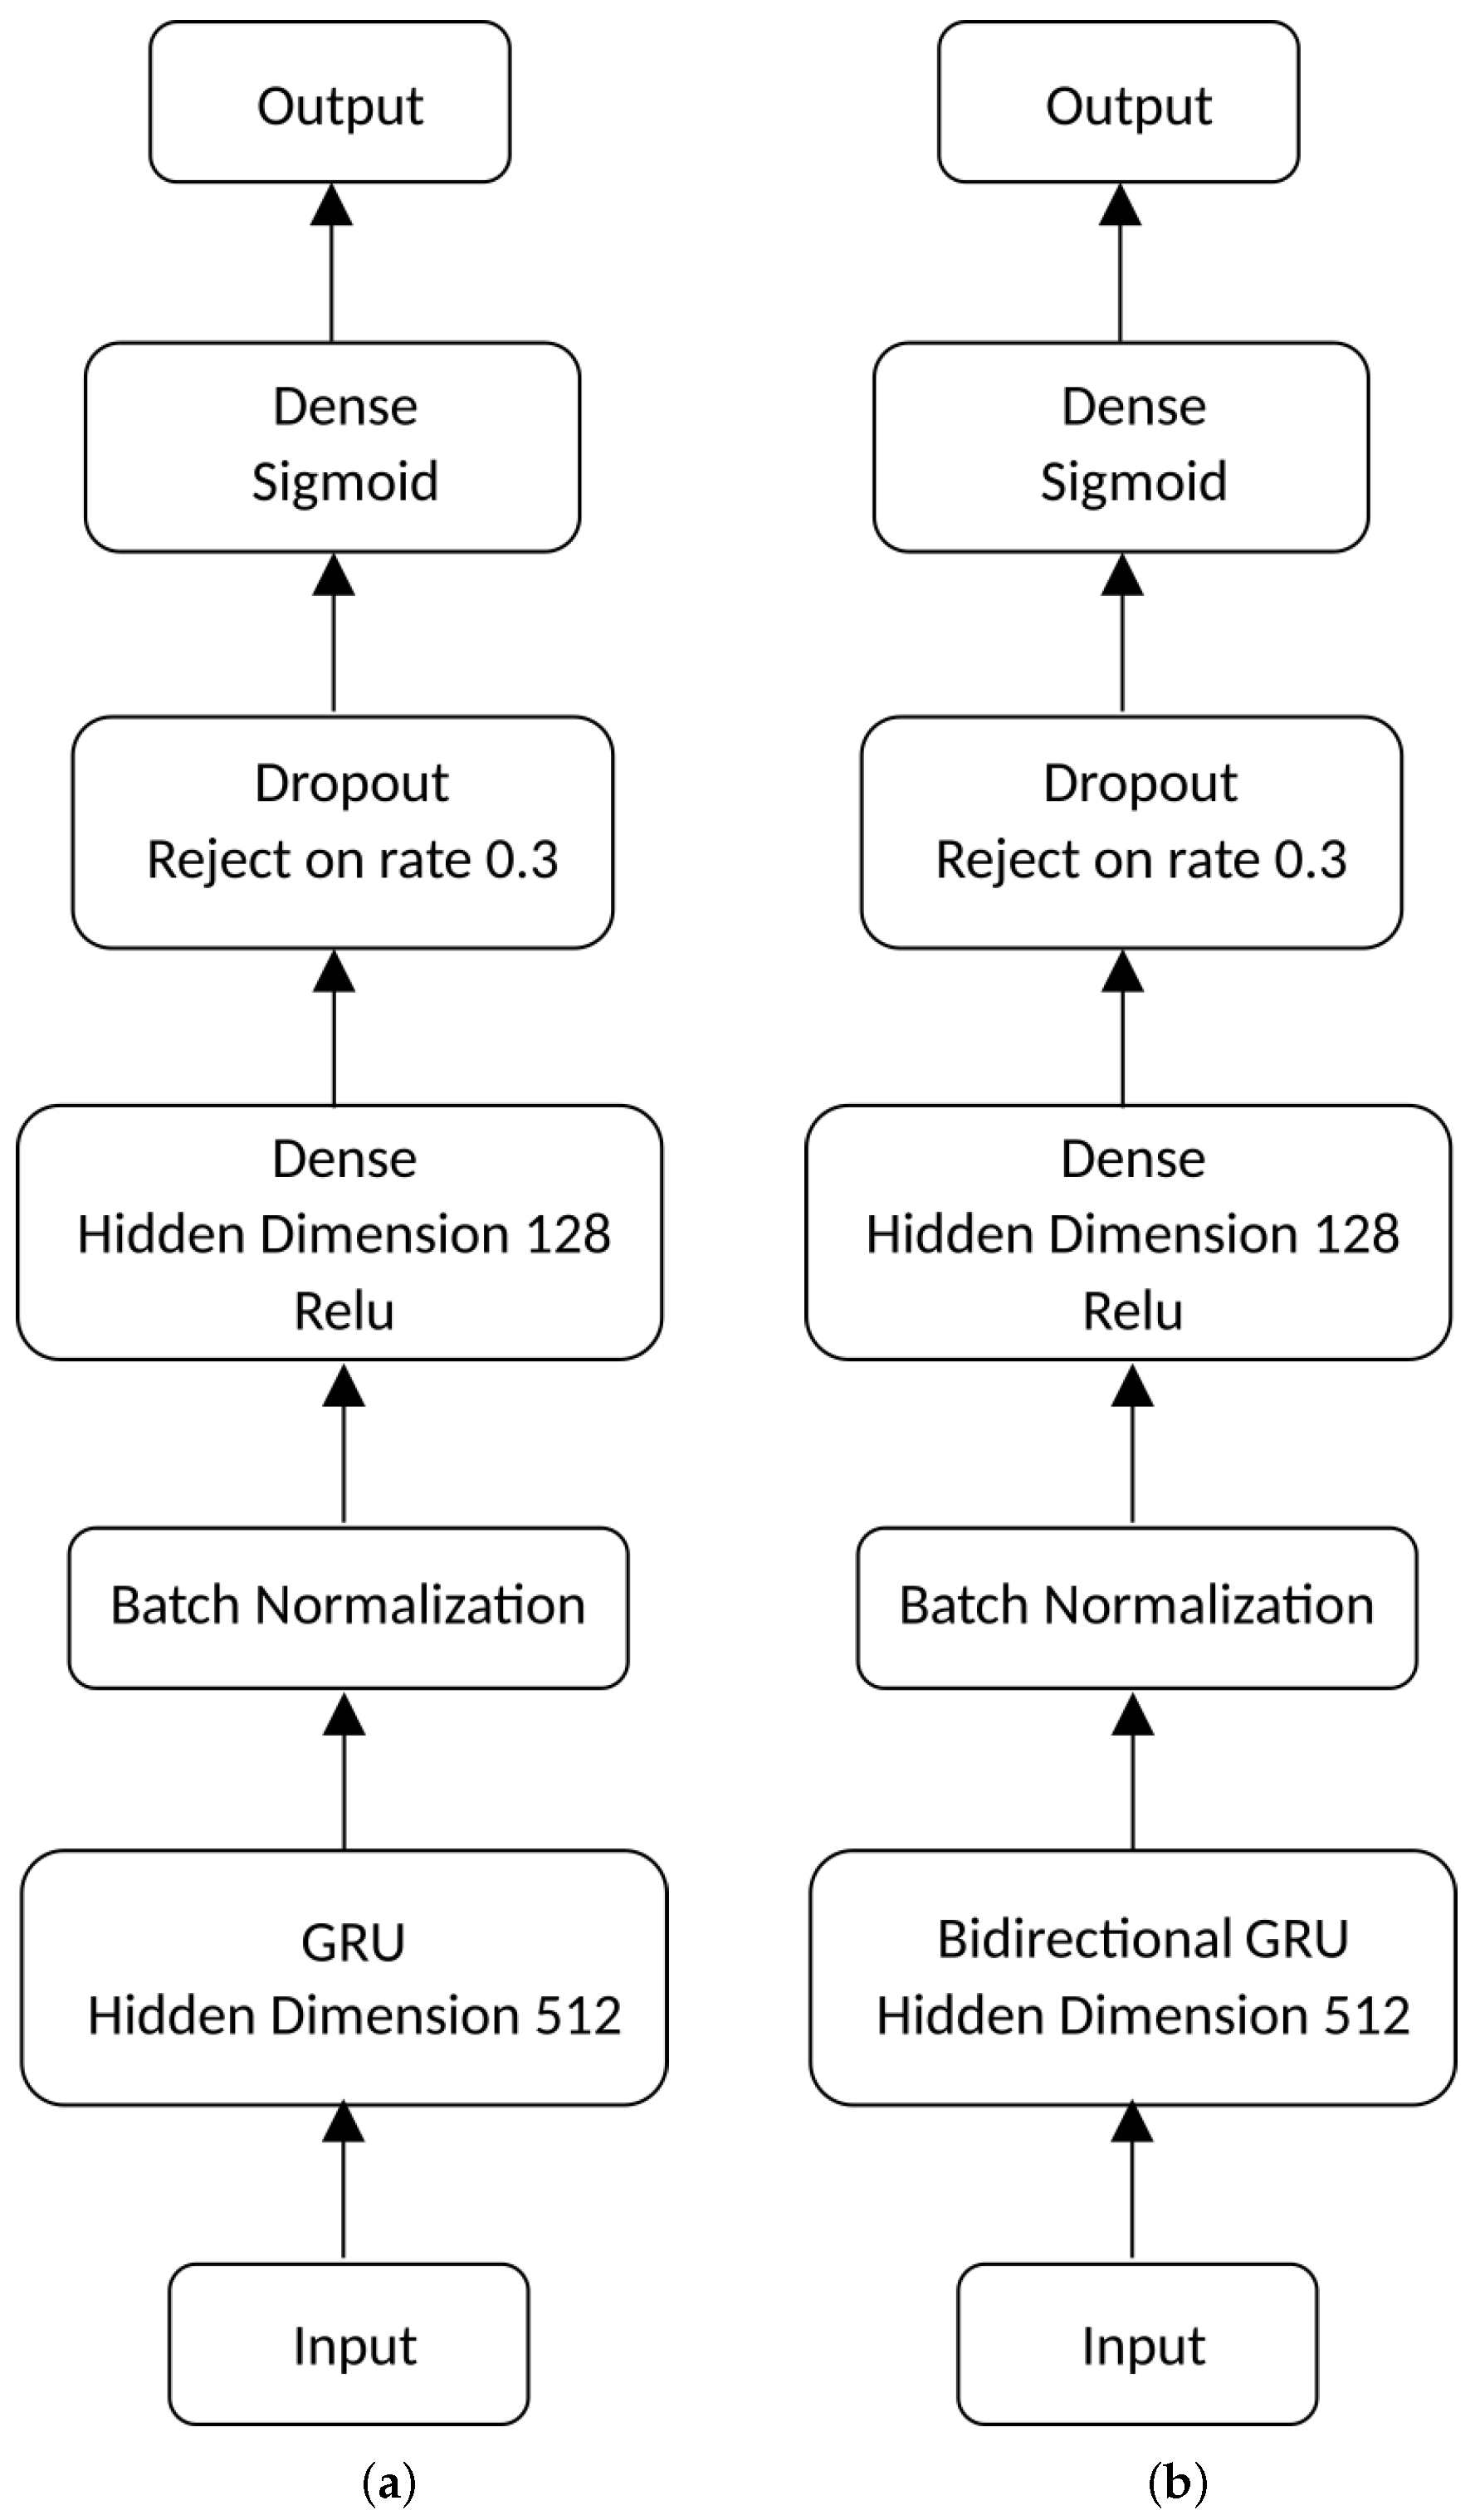
Figure 2a illustrates the described neural network. The input to the model are 453 values of the accelerometer signal (151 values for each axis: X, Y, and Z), sampled at 50 Hz. The architecture consists of a GRU layer with an output of 512 and a hyperbolic tangent as an activation function. It is followed by a batch normalization layer and the transition to a dense layer with 128 neurons and activation function ReLU ([
29]). In the next step, a dropout layer with a rejection rate of 30% and a dense layer with a single neuron with a sigmoidal activation function at the output.
The second proposed model is presented in
Figure 2b. This model’s architecture and its input shape are similar to the previous with the modification of the GRU layer to the bidirectional. The other layers were constructed in the same way as in the first model.
For both presented models, we used the same binary cross entropy loss function. We chose the Adam optimizer for training because of its adaptive learning rates, resulting in accelerated training.
2.6. Hyperparameter Optimization
Finally, we applied hyperparameter optimization to the BRNN model using the Keras Tuner framework (v. 1.4.7) [
30]. Specifically, we employed the RandomSearch strategy, conducting 10 trials to explore the hyperparameter space defined in
Table 1. This procedure allowed us to identify the optimal configuration of model hyperparameters which is presented in the last column. There might be still some room for improvement, but the process is time-consuming and requires a lot of computational resources.
2.7. Aparatus
The experiments were run on a machine equipped with an 11th Gen Intel
® Core™ i7 processor clocked at 2.30 GHz with a 24 MB Smart Cache. The operating system was Windows 11 Home 64 64-bit. The computer had 32 GB of RAM clocked at 3200 MHz. The training was run on an NVIDIA GeForce RTX 3050 graphic card with 2560 CUDA cores, 4 GiB of RAM, a 128-bit memory bus, 1.55 GHz base frequency, and 1.76 GHz boost frequency). The proposed models were implemented in Python 3.9.16 and Tensorflow 2.10.1. All the source codes are shared publicly and available on the GitHub platform at
https://github.com/rsusik/fall_detection_rnn (accessed on 12 March 2025).
3. Results
In this section, we first present the training and inference time analysis of the models. We begin with this analysis to provide a context for our decision to opt for the GRU architecture. Subsequently, we proceed to analyze the accuracy scores of the solutions available in the literature and compare their results to our approach.
Initially, we performed tests to measure the training time for an alternate approach with the LSTM layer in our models. We measured training and inference times for RNN- and BRNN-based models using GRU and LSTM layers to compare the computational efficiency of different recurrent architectures. The RNN model with a GRU layer required approximately 24 s per training epoch, while the bidirectional GRU variant (BRNN) increased this to 47 s. When replacing GRU with LSTM, training times increased notably, 33 s for a standard RNN and 63 s for the BRNN. These results confirm that GRU-based models are significantly more efficient during training, which is particularly beneficial for scenarios involving limited computational resources or frequent retraining.
In addition to training time, we also evaluated inference performance of the best performing model. The optimized BRNN model achieved a total inference time of 5.98 s on the entire test set (batch size = 32), corresponding to an average of 74 ms per batch and 2.31 ms per individual sample. When considering the case of processing a 1 s frame of accelerometer data (comprising 50 samples at a 50 Hz sampling rate), the average inference time per window was just 0.77 ms.
These results indicate that the model can produce predictions with an average inference time of 2.31 ms per sample, which gives 0.77 ms on average per 1 s of data. This is well within the constraints required for real-time applications. It demonstrates the potential for deploying the proposed solution on low latency platforms, such as mobile or wearable devices, for continuous health monitoring and fall detection.
Our goal was to compare these results with those reported in related works. However, we encountered a significant limitation as most publications do not specify the exact context in which their inference time measurements were obtained. For instance, in the study by Al-qaness et al. [
20], an average inference time of 282 ms is reported for the PCNN-Transformer model. Unfortunately, the authors do not clarify whether inference times corresponds to the time required for processing a single sample, a batch of samples, or the entire test set. This causes ambiguity and makes direct comparisons challenging and potentially misleading. A similar issue arises in the work of Wang and Wu [
19], where inference times are reported for models trained on input windows of different lengths of 1 s, 2 s, and 3 s. The corresponding inference times are 1.36 ms, 1.37 ms, and 1.43 ms, respectively. Although they report varying accuracy scores depending on the window size, it remains unclear how these inference times were measured, whether in a batched or unbatched setting, and whether additional preprocessing steps were included. Due to the lack of common process of inference time measurement across studies, we emphasize that our reported times were obtained in a controlled and repeatable environment, with details specified to facilitate reproducibility.
The optimized BRNN model achieved a high average accuracy of 99.82%, which means that nearly all samples were correctly classified. Additionally, the F1-score, that balances precision and recall, reached a very close value of 99.80%, reflecting the model’s ability to maintain both a low false positive and false negative rates. The precision metric, with an average of 99.82%, confirms that most fall predictions were correct, while the recall of 99.78% suggests that almost all actual falls were successfully detected. These consistently high scores across all evaluation metrics demonstrate the stability of the proposed model in handling the fall detection. Given this, the model shows potential for deployment in real world applications, where reliability and accuracy are essential to ensure trustworthy alerts in critical situations on time.
Table 2 presents the results of related solutions available in the literature (including ours). Each record represents an algorithm proposed by the authors to solve the problem. The table includes information about the paper, publication year, validation method, the algorithm used in the solution, and the accuracy score. Unfortunately, not all authors share the source codes. Thus, we are not able to reproduce all the results. Additionally, some solutions use different approaches to validate the model. For instance, Boutellaa [
12] uses a simple train/test split, where the test is a 20% subset of randomly selected records. On the other hand, Kanjilal et al. [
14] performs random subsampling cross-validation. Assuming the approach of the original paper [
3] we can divide the results into two categories: those that report the average accuracy score of
k-Fold Cross-Validation and those that use Leave-One-Subject-Out validation. The article introducing the dataset [
3] achieved the highest results using the 5-Fold Cross-Validation method, achieving a 98.57% accuracy score. Another approach using this validation method was proposed by Ivascu et al. [
9]. They used RF, SVM, and DNN algorithms, of which the highest score of 96.73% was reached by DNN. Boutellaa [
12], using a different method of data division and an autoencoder as a feature extractor, achieved a result of 98.17%. Kanjilal et al. [
14] improved the results, splitting the data using random sub-sampling for Cross-Validation, regardless of the adopted network architecture, meaning the number of hidden layers added. The ResNet-based model by Stampfler et al. [
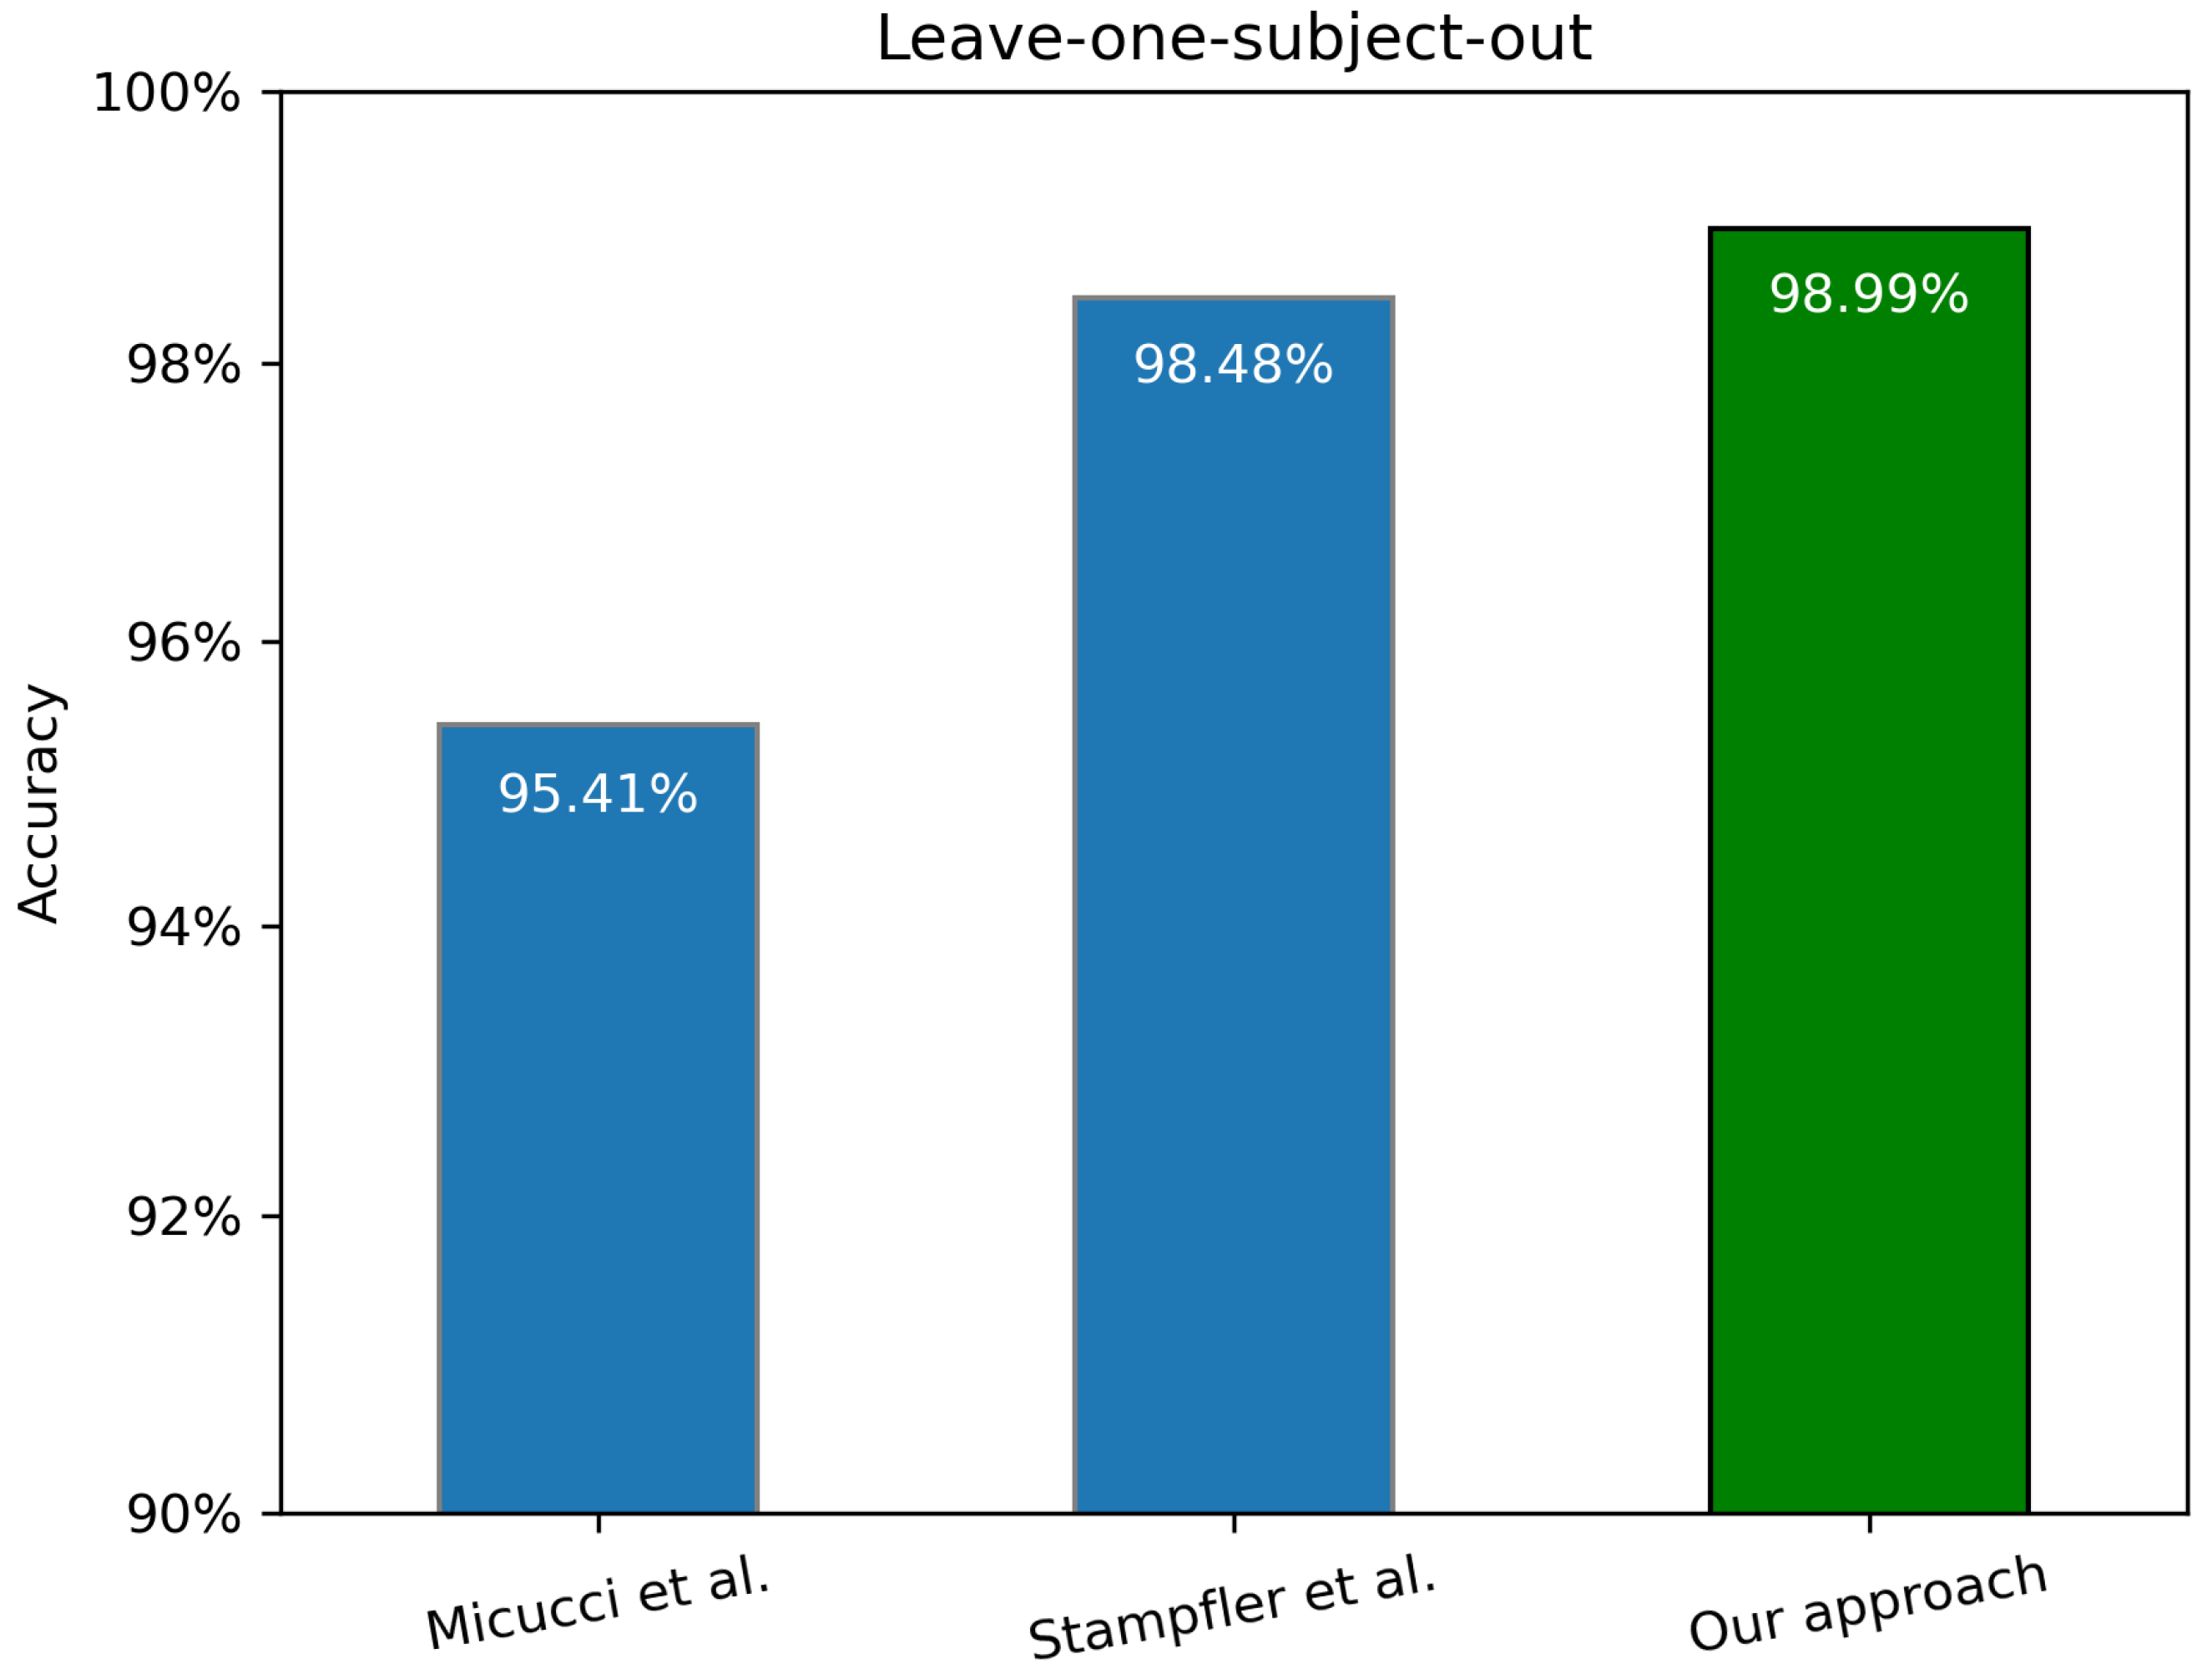
18] achieved the highest result for 5-Fold Cross-Validation among competitors (0.05 percentage points more than our model). On the other hand, our model dominated the competitive solutions (0.51 percentage points) for the Leave-One-Subject-Out strategy.
Figure 3 presents the accuracy score for solutions that used the Leave-One-Subject-Out validation strategy. We can clearly see that our solution outperforms competitors in fall detection, achieving a 98.99% accuracy score.
However, the results differ when the models are evaluated using the
k-Fold Cross-Validation strategy.
Figure 4 presents the accuracy scores of the algorithms under this evaluation protocol. Notably, the method proposed by Stampfler et al. [
18] achieves the highest accuracy for 5-Fold Cross-Validation, with a score that is nearly identical to ours (the difference amounts to only 0.05%). This marginal gap suggests that the potential for further improvement in terms of classification accuracy may be limited. Consequently, future research efforts might be better directed toward optimizing other aspects of fall detection models, such as inference time or computational efficiency, particularly in the context of real-time applications.
4. Discussion
The proposed RNN-based models, employing GRU and bidirectional GRU layers, achieved satisfactory results in the task of fall detection using the UniMiB-SHAR dataset. Specifically, the BRNN model reached an accuracy of 98.99% using the Leave-One-Subject-Out (LOSO) Cross-Validation protocol and 99.82% using 5-Fold Cross-Validation. These results are highly competitive when compared to existing methods reported in the literature. For instance, Al-qaness et al. [
20] reported a maximum accuracy of 98.68% using the PCNN-Transformer model, while Wang and Wu [
19] achieved 99.14% with their Patch-Transformer Network. Although Kanjilal et al. [
14] reported slightly higher scores (up to 99.82%) using different architectures, the validation strategy was less standardized, making direct comparison difficult. In contrast, our models follow widely accepted evaluation protocols and achieve comparable or better performance.
The optimized BRNN model processes a single data sample in approximately 2.31 ms which results in an average processing time of 0.77 ms for data corresponding to 1 s. However, these results are difficult to compare directly with those reported by other authors. For example, Al-qaness et al. [
20] reported an average inference time of 282 ms, though the precise measurement context (single sample, batch, or full set) was not specified. Similarly, Wang and Wu [
19] reported times in the range of 1.36 ms to 1.43 ms for different window sizes (1–3 s), but without details on the computational setup or batching. Our measurements were conducted in a transparent and repeatable environment, ensuring the reliability of the reported latency. The ability to generate predictions in real time makes the proposed model particularly suitable for mobile or wearable deployment.
These findings have important implications for health monitoring applications, especially in elderly care. Falls are a leading cause of injury and hospitalization among older adults, and timely detection is critical for reducing health risks and improving response times. The high accuracy and real-time performance of our models demonstrate their potential for practical integration into assistive technologies. Unlike many existing studies that focus on general activity recognition, our work is tailored specifically to fall detection, with the goal of contributing directly to systems aimed at enhancing safety and autonomy for older individuals.
Despite the promising results, this study has some limitations. The experiments were conducted exclusively on the UniMiB-SHAR dataset, which, although widely used, may not fully represent the variability found in real-world. Future research should include evaluations across multiple datasets (e.g., SisFall, MobiAct) to better assess the generalizability of the models. Additionally, fall detection alone may not provide sufficient context to assess a person’s health status. Future systems could integrate additional data sources such as ECG, heart rate, or blood pressure to improve diagnostic accuracy. Recent studies have demonstrated the value of multimodal sensing for detecting critical events, and this direction appears promising for building more comprehensive health monitoring solutions.
5. Conclusions
In this study, we proposed a fall detection solution based on Recurrent Neural Networks, specifically utilizing bidirectional GRU layers. The developed models were rigorously evaluated using two commonly applied validation strategies: Leave-One-Subject-Out and 5-Fold Cross-Validation. The experimental results demonstrate that the proposed approach achieves better results for LOSO compared to existing methods reported in the literature attaining an accuracy of 98.99% and close to the best results for 5-Fold Cross-Validation achieving 99.82%.
While the UniMiB-SHAR dataset has become a widely adopted benchmark in fall detection research, it was originally intended to complement other representative datasets in the field. As such, one potential direction for future work is to evaluate the model in real-world scenarios, where the characteristics of actual falls may differ from the simulated falls present in available datasets.
Furthermore, although fall detection is a crucial step toward enhancing the safety of vulnerable individuals, particularly the elderly, it does not provide a complete picture of a person’s health status. Falls may not always indicate a critical condition but can serve as early warnings of underlying medical issues. Therefore, future research could focus on the integration of additional physiological signals such as electrocardiogram (ECG), heart rate, or blood pressure to improve the reliability and clinical relevance of automated health monitoring systems.
Such multimodal solutions could be particularly valuable in care environments, such as nursing homes or assisted living facilities, where early detection and real-time alerting of potential health threats could significantly enhance the responsiveness and quality of care provided to residents.


