Article

Effect of Soft Interlayer Dip Angle on the Attenuation and Prediction of Blast-Induced Vibrations in Rock Slopes: An Experimental Study

1
CCCC Fourth Harbor Engineering Institute Co., Ltd., Guangzhou 510230, China
2
State Key Laboratory of Precision Blasting, Jianghan University, Wuhan 430056, China
3
CCCC Key Laboratory of Environment Protection and Safety in Foundation Engineering of Transportation, Guangzhou 510230, China
4
Guangxi Pinglu Canal Construction Co., Ltd., Qinzhou 535000, China
5
CCCC Fourth Harbor Engineering Bureau Co., Ltd., Guangzhou 510290, China
6
Faculty of Engineering, China University of Geosciences, Wuhan 430074, China
*
Author to whom correspondence should be addressed.
Appl. Sci. 2025, 15(12), 6683; https://doi.org/10.3390/app15126683
Submission received: 23 April 2025 / Revised: 1 June 2025 / Accepted: 10 June 2025 / Published: 13 June 2025
(This article belongs to the Special Issue Advances in Tunnel and Underground Engineering—2nd Edition)

Abstract

Rock slopes containing weak interlayers are highly prone to instability under the disturbance of blasting vibrations due to the influence of structural planes. To address the limitations of traditional models in predicting vibration attenuation for such slopes, this study conducted in situ blasting tests on sand–mudstone interbedded slopes from the Pinglu Canal project. Based on dimensional analysis, the Sadowsky formula was modified to incorporate both elevation difference (H/R) and soft interlayer dip angle (θ), resulting in an enhanced predictive model. Field data revealed that the proposed model significantly improved prediction accuracy, with determination coefficients (r2) increasing from 0.847 to 0.9946 in the vertical (Z) direction. Compared to traditional models, the root mean square error (RMSE) decreased by 96%, demonstrating superior capability in capturing vibration attenuation influenced by geological heterogeneity. Key findings reveal that steeper interlayer dip angles significantly accelerate PPV attenuation, particularly in the X direction. These findings provide a critical tool for optimizing blasting parameters in layered rock slopes, effectively mitigating collapse risks and enhancing construction safety. The model’s practicality was validated through its application in the Pinglu Canal project, offering a paradigm for similar engineering challenges in complex geological settings.

1. Introduction

With the increasing occurrence of rock slopes in blasting projects across fields such as transportation, mining, and hydraulic engineering, incidents of instability—such as collapse and sliding—under blasting vibrations have become more frequent. Ensuring the safety and stability of rock slopes subjected to blasting vibrations has become critical for the safe and efficient progress of these projects. Previous studies have shown that when the dip angle of the bedding plane aligns with the slope angle, the stability of rock slopes is generally poor, especially under the disturbance of blasting vibrations [1]. To ensure the stability and safety of rock slopes with weak interlayers under blasting vibrations, it is essential to understand the attenuation patterns of blasting vibrations within these slopes.
Currently, the attenuation pattern of blasting vibrations is commonly described by the peak particle velocity (PPV). As early as the 1940s, Soviet blasting expert Sadowsky derived the traditional Sadowsky formula through extensive monitoring data while studying the seismic effects of concentrated explosives [2]. Subsequently, various countries adapted the traditional Sadowsky formula with different parameters [3,4,5]. This is a semi-empirical formula that calculates the decay law of blast vibration velocity, describing the relationship between peak mass vibration velocity, blast charge and distance from the blast center [6,7]. With continued application of these equations, an increasing number of scholars have recognized the need to modify and improve them to account for different engineering geological conditions. For instance, in tunnel engineering, the area of the tunnel’s free face has a significant effect on blasting vibrations. Therefore, incorporating the influence of the free face area into the blasting vibration attenuation prediction model and modifying the prediction formula for vibration velocity can greatly improve prediction accuracy [8]. Hakan A. proposed a blasting vibration attenuation prediction model that considers delay time, among other improvements [9]. In slope engineering, the traditional Sadowsky formula can produce significant errors due to the effects of elevation and terrain, necessitating parameter adjustments [10,11]. Additionally, most researchers study the propagation patterns of blasting vibrations by combining field monitoring data with numerical simulations [12,13,14,15]. Based on the slope’s dynamic response features, as observed in the field monitoring data, a logarithmic functional relationship was discovered between the number of loading times and the slope’s safety factor under various loading amplitudes [16,17]. Using LS-DYNA(R9,2,0) numerical simulation software, Hu examined the effects of various blasting techniques on the stability of rock slopes and optimized the blasting and excavation procedures’ parameters [18]. Ma found during on-site monitoring that as the degree of jointing increased, the attenuation rate of both vibration velocity and the energy of blasting vibrations also increased. This indicates that rock mass structural parameters (such as discontinuities) significantly influence the attenuation laws of blasting vibrations [19]. Li monitored the blasting vibrations at the Manaoke open-pit gold mine slope, and conducted regression analysis of the monitoring results using the Sadowsky formula. The study examined the attenuation law of slope-blasting vibrations. Additionally, the relationship between rock mass damage depth and peak particle velocity was analyzed using ultrasonic velocity measurement, and the stability of the slope under blasting vibration conditions was assessed with finite element numerical software [20]. Jiang analyzed the open-pit slope of Daye Iron Mine and used the dynamic finite element method in conjunction with on-site monitoring data to establish a PPV prediction model that took into account the mining depth and the elevation difference between the explosion source and the monitoring point [21].
Most existing studies focus on rock slopes with uniform lithology, while research on layered rock slopes with variable lithology is relatively limited, especially for rock slopes with weak interlayers. In fact, the presence of weak interlayers makes such slopes more prone to instability under blasting disturbances, with varying dip angles affecting both the likelihood and mode of failure. Furthermore, as noted in prior studies, current research on this topic primarily relies on numerical simulations, with few studies utilizing full-scale model tests. Based on this, this study conducts on-site blasting experiments on a typical rock slope with weak interlayers, selected from the Phase I Youth Hub Project of the Pinglu Canal in China. It investigates the attenuation patterns of blasting vibrations within these slopes, focusing on how slope elevation and bedding dip angles influence vibration propagation. The findings provide essential insights for ensuring the stability of weak interlayer rock slopes and support the safe, efficient progress of the Phase I Youth Hub Project of the Pinglu Canal.

2. Background and Overview of Slope Engineering and Blasting Engineering

After the Beijing–Hangzhou Grand Canal, built more than a millennium ago, China’s first canal is the Pinglu Canal. Although its primary goal is to advance shipping, it also considers flood control, irrigation, water supply, and the enhancement of the aquatic natural environment. When finished, it will be strategically significant for sea transportation in Guangxi and the Chinese inland regions in the southwest. Figure 1 illustrates the construction of the three cascade hubs—Madao, Qishi, and Qingnian—along the canal, running upstream to downstream. The Qingnian Hub is situated at the most downstream cascade, approximately 1.8 km upstream of the Qingnian sluice that is in place at the moment. Blasting and rock excavation are required above a ship lock elevation of 0.5 m for the first phase of the Qingnian Hub construction. About 70 m is the maximum slope excavation height. The influence of the blasting vibration is evident, and there is a significant quantity and frequency of blasting. The engineering geological conditions in the Qingnian Hub area are also complicated, with mudstone, argillaceous sandstone, sandstone, and other rock mass types, according to the results from an on-site geological survey. With a maximum height of 75.5 m, the slopes are primarily high layered and reverse rock slopes made of argillaceous soft rock and sandstone. High slopes with interbedded soft and hard rocks that are layered are prone to slip along stratification planes, joint planes, and other weak structural planes when disturbed by blasting, and rock slopes that are reversed may also collapse or collapse locally under dynamic activity. Thus, one of the most pressing issues that needs to be resolved in the first stage of the Qingnian Hub project is how to regulate the stability and safety of sand–mud interbedded rock slopes under the influence of blasting vibration.
Prior to conducting a blasting vibration safety study, it is necessary to test the physical and mechanical properties of the main lithologies of the slopes in the project area. According to the on-site core sampling and indoor mechanical tests, the lithology of the slopes covered by the canal project is mainly sandstone and mudstone, and its detailed indoor mechanical test results are shown in Table 1.

3. On-Site Blasting In Situ Experiment and Testing Analysis
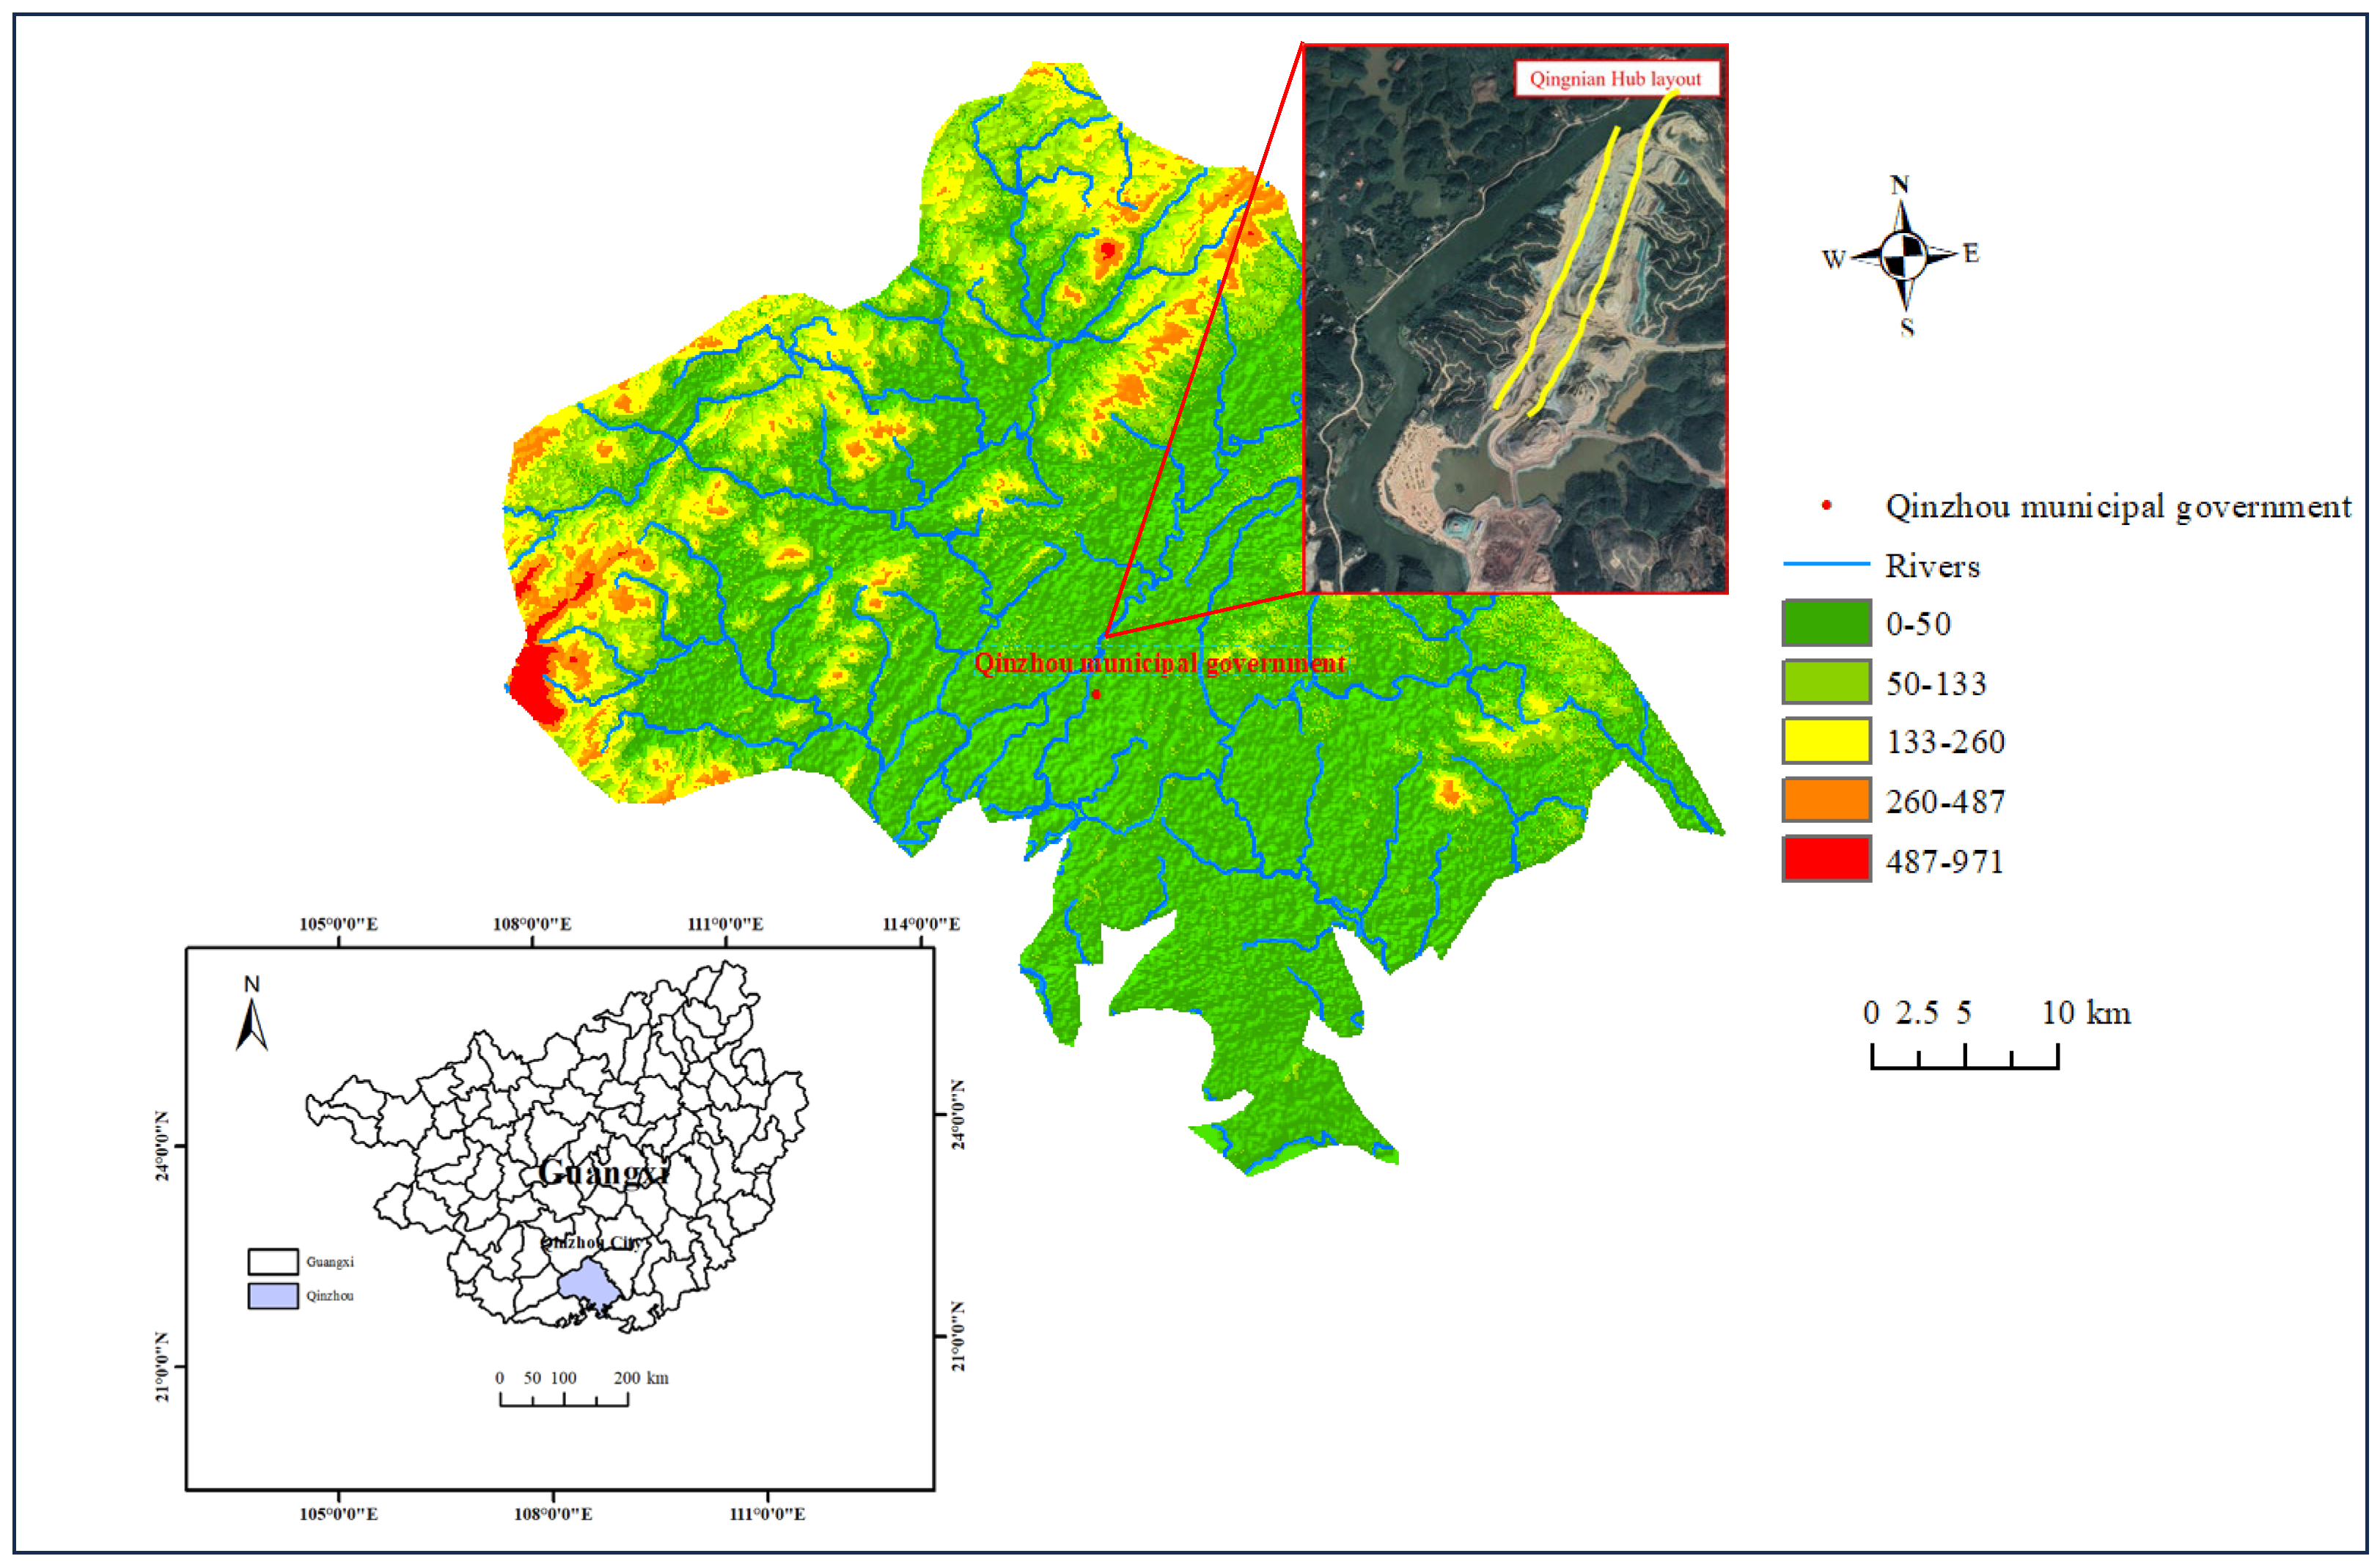
The initial selection of the test slopes was based on the geological features of the Qingnian hub project area and took into account a wide range of factors, including engineering construction, the surrounding environment, and experimental conditions. Rock samples were taken in situ on screened test slopes. Ultimately, a sand–mud interbedded rock slope with extremely similar geological conditions between the site and the project area was chosen as the test slope, based on the findings of the laboratory tests. A thorough investigation of the blasting vibration propagation law in sand–mud interbedded rock slopes was undertaken using on-site blasting tests. The stability and safety of rock slopes should be controlled with sand and mud interbedded when blasting vibration is present. The initial course of action for the Pinglu Canal Qingnian Hub initiative should also be specified.

3.1. Field Test

The slope at K1+500~600 in the site was chosen as the test object based on the geological exploration data, on-site reconnaissance, and careful consideration of variables like geological characteristics and the surrounding environment. It should be noted that the experiments carried out were based on the assumption that slope is characterized by variable surface morphology, while the internal structure of the soil mass is homogeneous in both properties and layer geometry. Variations in geometry are confined solely to the surface layer. At around 60 m in height, the test slope’s bottom elevation is between 9 and 12 m. According to the site investigation, the slope is about 33 to 40 degrees, the overall slope is smooth and continuous without obvious concave and convex ups and downs, and from the top of the slope to the foot of the slope, the slope is basically the same, and does not form a ladder-like shape. At the base of the slope, blasting tests were carried out on a 10 m drilled hole, taking into account that the final elevation of the canal channel excavation is 0.5 m. Three slopes were chosen around the test slope for the three blasting tests, based on the size of the slope and the occurrence of the slope rock strata, along with test equipment and other conditions, and careful consideration of the slope location and distance, test workload and cost, measurement point layout and monitoring. Figure 2 displays the chosen test slope along with its slope surface.
Drilling, charging, detonation and other tasks were completed at the appropriate place after choosing the side slope and slope surface. The diameter of the borehole was adjusted to 100 mm, and the explosion was started from outside the slope towards the inside to resemble the blasting parameters used in real engineering blasting. No. 2 emulsion explosive was chosen out of all the explosives used in actual engineering. The precise drilling and blasting plan is as follows, as depicted in the figure. Drill three blasting test holes with charges of 48 kg, 42 kg, and 36 kg each, perpendicular to the slope toe lines of the test slope’s three slopes. The drilling parameters are as follows: drilling depth of 10 m, drilling diameter of 100 mm, drilling row distance of 4 m, and drilling distance from the slope toe line of 6 m. The No. 2 rock emulsion explosive was used. Emulsion explosives have a linear charge density of 0.30 kg/m and a roll diameter of 90 mm. Figure 3 shows the blasting plan diagram. When clogging, pack a mixture of drill bits and cement into the bottom of the blocked section using kraft paper or a cement bag, and then compact the mixture using a wooden or plastic packing tamping rod. In the blasting test, the blast holes that were furthest away from the slope detonated one after the other, separated by 1.0 s.
The existing equipment and test conditions were used to arrange multiple vibration velocity measuring points along three slope surfaces to fully obtain the vibration velocity of the particles of the sand–mudstone interbedded rock slope under the blasting disturbance, according to the test’s purpose and the field conditions. Figure 2 displays the precise measuring point arrangement. The order in which the blasting tests are numbered corresponds to the ordering of the measuring points. The first blasting test is from 1 to 3, the second is from 4 to 6, and the third is from 7 to 9. The vibration meter’s location is indicated by the first letter V of the measurement point number. Figure 4 illustrates the equipment testing principle of the monitoring equipment, which uses TC-4850.
First, technicians are arranged to perform drilling tasks during the test. Blasting technicians clean the site and charge in accordance with specifications after drilling is finished. Drilling slag surrounding the drill hole is used to seal the blast hole after charging is finished. After that, monitoring equipment is installed and the blasting network is laid. The detonation test takes place following the completion of all preparations. Figure 5 shows the experimental procedure.

3.2. Analysis of Test Results

The test results for every measuring point used during the blasting process were acquired by performing the aforementioned on-site blasting tests. Table 2 displays the vibration speed statistics obtained during the test. On a horizontal plane, the X direction denotes the direction toward the explosion source, the Y direction, the direction perpendicular to the X direction, and the Z direction, the direction against the horizontal plane. Note that the instrument has not been triggered if there is no response in Table 2. One possible explanation for this could be that the measuring point’s instrument is not sensitive enough, which prevents it from triggering at low vibration speeds. The vibration velocity plots in the X, Y, and Z directions for measurement point V3 are shown in Figure 6.
Table 2 makes clear that all of the other measuring points’ primary vibration directions are in the Z direction, except the V1 measuring point’s X direction. Every measurement point essentially satisfies the law that states that the peak vibration speed decreases with increasing blast center distance. The peak vibration velocity in the Z direction can exceed 30 cm·s−1 at measuring locations that are closer to the explosion source. The measuring point’s peak vibration speed steadily drops as the blast center distance rises. The maximum vibration velocity at each measuring point is essentially less than 1 cm·s−1 when the blast center distance is greater than 60 m. Figure 6 displays the vibration velocity of the V3 measuring point. The figure makes it clear that the blasting vibration velocity peak resulted from the three blast holes detonating in succession. Wavebands of vibration occur once every second, are independent of one another, and the delay time is reasonable.

4. Establishment of a New Prediction Model for Blasting Vibration Attenuation

4.1. Conventional Model for Predicting Blasting Vibration Attenuation

To further establish the attenuation pattern of blasting vibration in interlayered sandstone–mudstone rock slopes, the Sadowsky formula (Equation (1)) was applied to fit the results of each of the three blasting tests separately. The fitting results are presented in Table 3. Figure 7 shows an illustration of the fitting formula.
v = k Q 3 R α
In the formula, v represents the blasting vibration velocity; Q is the explosive charge weight. R is the distance from the blast center, i.e., the distance from the measuring point to the center of the explosive charge; k and α are coefficients related to the blasting site conditions and geological conditions.
As shown in Table 3, the fitting accuracy of the Sadowsky formula varies across directions for the three blasting tests. The determination coefficients for the primary vibration direction range between 0.7 and 0.8, indicating moderate fitting accuracy, while in non-primary vibration directions, most determination coefficients exceed 0.9, showing a higher fitting accuracy. The significant difference in fitting accuracy may be due to the lower vibration velocity in non-primary directions, which leads to smaller fitting errors, whereas the higher vibration velocity in the primary direction results in larger fitting errors. These findings also reflect the instability of the predictive accuracy of Equation (1) across different directions. Therefore, it is necessary to explore a more accurate and stable predictive model for blasting vibration attenuation.

4.2. Prediction Model for Blast Vibration Attenuation, Taking Elevation Effect into Account

Considering the applicability conditions of the Sadowsky formula, and based on the relevant literature findings, it is shown that the vibration velocity of the rock slope is significantly affected by the altitude [22,23,24]. To more accurately capture the attenuation pattern of blasting vibration in interlayered sandstone–mudstone rock slopes and to improve prediction accuracy, a modified formula accounting for elevation effects was used to fit the experimental data (Equation (2)). Table 4 presents the fitting results.
v = k Q 3 R α H R β
In the formula, v represents the blasting vibration velocity; Q is the explosive charge weight; R is the distance from the blast center, i.e., the distance from the measuring point to the center of the explosive charge; H is the elevation difference; k and α are coefficients related to the blasting site and geological conditions; and β is the elevation influence factor.
According to the fitting results in Table 4, the determination coefficients for each direction are above 0.9 when considering the elevation effect, indicating a good fit. Compared to the results without the elevation effect, the determination coefficients in all directions have improved, demonstrating that the elevation-adjusted fit aligns more closely with actual conditions and has higher accuracy. This improvement is particularly significant in the primary vibration direction, where the determination coefficient increased by up to 0.275. In practical engineering, to predict and control the impact of blasting vibration on slope stability more precisely, it is essential to consider the elevation effect when analyzing the attenuation pattern of blasting vibration in rock slopes.
Additionally, as shown in Table 3 and Table 4, the fitting parameters k, α, and β vary among the three blasting tests. Engineering observations suggest that the primary difference among these tests lies in the inclination angles of the interlayered sandstone–mudstone planes along the vibration wave propagation path. This implies that the inclination angle may affect the blasting vibration attenuation pattern. Therefore, incorporating the bedding plane inclination into the attenuation model is necessary for a more accurate description of the blasting vibration attenuation pattern in interlayered sandstone–mudstone rock slopes.

4.3. Prediction Model for Blast Vibration Attenuation Taking into Account the Angle of Inclination of the Layer

The above analysis indicates that interlayered sandstone–mudstone rock slopes exhibit complex properties, and traditional predictive models fail to accurately predict the attenuation pattern of blasting vibrations. Predictive models that only consider the elevation effect show significant variability in the parameters k and α. Furthermore, existing blasting vibration attenuation models do not account for the influence of bedding plane inclination. Therefore, to incorporate the impact of bedding plane inclination, a blasting vibration prediction model that captures this effect is theoretically derived through dimensional analysis [25,26,27].
The specific steps are as follows: The attenuation of blast-induced seismic waves propagating within high rock slopes is influenced by multiple factors, including the characteristics of the blast source, the medium conditions of the slope body (such as lithology, joints, and geological structure), the distance from the blast source, and elevation differences. The summary of the main variables is presented in Table 5.
Using the Buckingham π theorem from dimensional analysis, the peak particle velocity v in high rock slopes can be expressed as
v = φ ( Q , μ , c , ρ , R , H , θ , a , f , t )
According to the π theorem, where the independent dimensional quantities are chosen as Q, R, and c, the dimensionless terms can be represented by π, yielding
π = v Q α R β c γ , π 1 = μ Q α R β c γ , π 2 = ρ Q α R β c γ π 3 = θ Q α R β c γ , π 4 = a Q α R β c γ , π 5 = f Q α R β c γ π 6 = t Q α R β c γ , π 7 = H Q α R β c γ
In the formula, α, β, and γ are undetermined coefficients. According to the principle of dimensional homogeneity, we have
π = v c , π 1 = μ R , π 2 = ρ Q R 3 , π 3 = θ 1 π 4 = a R 1 c 2 , π 5 = f R 1 c , π 6 = t R c 1 , π 7 = H R
Substituting Equation (5) into Equation (3) yields Equation (6).
v c = φ ( μ R , ρ Q R 3 , θ , a R 1 c 2 , f R 1 c , t R c 1 , H R )
Since the product and power of different dimensionless numbers π remain dimensionless, we can combine π1, π2 and π7 as follows to obtain a new dimensionless number π8:
π 8 = ( π 2 ) 1 3 π 3 π 7 = ( ρ 3 R Q 3 ) ( H R ) θ
For a given site, ρ and c can be approximated as constants. Thus, from Equation (7), v can be considered to have a functional relationship with 1 Q 1 / 3 R 1 H R θ . Taking into account the attenuation relationship of vibration velocity with H/R and θ , the above functional relationship can be expressed as
ln v = α 1 + β 1 ln ( Q 3 R ) + α 1 β 1 ln ( θ ) + α 1 β 1 ln ( H R )
If ln v 0 = α 1 + β 1 ln ( Q 3 R ) , we obtain
ln v 0 = α 1 + ( β 1 ln Q ) / 3 β 1 ln R
The attenuation index, β 1 , primarily reflects the influence of site medium conditions, while α 1 + ( β 1 l n Q ) / 3 comprehensively reflects the contribution of slope medium conditions and explosive amount to the slope rock mass particle vibration. β 1 l n r in the formula represents the attenuation of blasting vibration speed with distance r .
If α 1 = l n k 1 , we obtain
v 0 = k 1 ( Q 3 R ) β 1
The conventional Sadowsky formula is given by Equation (10). Equation (10) can be substituted into Equation (11) to obtain
ln v = ln v 0 + [ α 1 β 1 ln ( θ ) ] + α 1 β 1 ln ( H R )
If α 1 = l n k 2 , α 1 = l n k 3 , β 3 = β 1 , β 2 = β 1 , Equation (11) can be transformed into
v = k 1 k 2 k 3 Q 3 R β 1 H R β 2 ( θ ) β 3
If we assume k = k 1 k 2 k 3 , we obtain
v = k Q 3 R β 1 H R β 2 ( θ ) β 3
In the formula, k is the site influence coefficient; β1 is the attenuation coefficient; β2 is the parameter for the effect of elevation; and β3 is the coefficient representing the influence of bedding plane inclination.
To maintain a unified and esthetically pleasing form of the equation, while also ensuring that the bedding plane inclination in the formula is expressed in radians, Equation (13) is further revised as follows:
v = k Q 3 R β 1 H R β 2 θ π β 3
We can fit the field test results using Equation (14); During the fitting process, outliers were identified and removed using a MATLAB(R2019a)-based algorithm to ensure data reliability. Of note, the layer inclination angles of the test slope at the plane of the three blasting test holes were 60°, 50°, and 30°, respectively, according to the on-site inspection of the layer occurrence. However, using Equation (14) to fit only the data from a single blast had no practical significance because the bedding inclination angles of the same test were the same. As a result, the blasting vibration attenuation models for each of the three blasting tests’ directions are shown in Table 6.
Table 6 shows that the layer inclination angle-accounting blasting vibration attenuation prediction model has a high fitting degree in three directions, and fitting determination coefficients that are all above 0.93. Additionally, there is a gradual increase in the fitting degree in the X, Y and Z directions. Specifically, the Z direction has a substantially higher fitting degree than the X and Y directions. This indicates that Equation (14) applies better to the Z direction, indicating that the layer inclination angle may have a significant impact on the vibration speed in the Z direction. To further analyze the influence of bedding plane inclination on the peak particle velocity (PPV) and to evaluate the accuracy and advantages of the blasting vibration attenuation prediction model that incorporates bedding plane inclination, the traditional attenuation model and the elevation-effect-only model were used to fit the PPV in each direction for the three blasting tests. The summarized results are presented in Table 7.
Table 7 shows that compared to the conventional blasting vibration attenuation prediction model, the model that takes the elevation effect into account has a higher fitting accuracy. The Z direction exhibits a significant variation in fitting degree, confirming the impact of slope elevation on blasting vibration. The vertical direction has the greatest influence among these directions. On the other hand, Table 3, Table 4 and Table 7 show that the common fitting accuracy of multiple blasting test data is lower than the fitting accuracy of single blasting test data using Equations (1) and (2). This demonstrates that the blasting vibration speed in the three blasting tests is influenced by additional factors. This factor might be the layer’s inclination angle, based on the analysis presented in the preceding section.
By comparing the results in Table 6 and Table 7, it is evident that the traditional blasting vibration attenuation prediction model and the blasting vibration attenuation prediction model that only takes the elevation effect into account have lower prediction accuracy than the model that takes the layer inclination angle into account. The latter has a fitting coefficient of determination greater than 0.93, whereas the first two have a fitting coefficient of determination between 0.8 and 0.9. Notably, for the Z-direction, the determination coefficient of the fit using Equation (14) reached 0.97. This indicates that bedding plane inclination has a certain impact on the propagation pattern of blasting vibration. In engineering applications involving interlayered rock slopes, such as sandstone–mudstone interlayers, considering the influence of bedding plane inclination on blasting vibration is fundamental for accurately predicting and controlling blasting vibrations. RMSE (Root Mean Square Error) and MAE (Mean Absolute Error) were computed, respectively, to further examine the prediction accuracy of the three prediction models. Figure 8 displays the results of the calculation.
The patterns of RMSE and MAE are generally similar. The bar chart clearly shows that in the first model, the velocity error in the Z direction is the largest, followed by the X direction, with the smallest error observed in the Y direction. When compared to the second model, it can be seen that after accounting for the elevation effect, the velocity error in the Z direction is significantly reduced, while the errors in the X and Y directions also decrease, though less noticeably. This indicates that considering the elevation effect has the greatest impact on velocity in the Z direction. A comparison between the second and third models shows a substantial reduction in velocity errors across all three directions, demonstrating that the prediction model is most accurate when both elevation effect and bedding plane inclination are considered.

5. Conclusions and Discussion

Based on the first phase of the Pinglu Canal Youth Hub Project, through field blasting tests, it was found that there are certain errors in predicting the peak vibration velocity of rock slopes with weak interlayers using the traditional Sadowsky formula and the height difference correction formula. By employing dimensional analysis, a blasting vibration prediction model that takes the influence of weak interlayers into account has been derived, along with a modified formula that includes the inclination factor of weak interlayers. Comparative analysis shows that the new prediction model improves the fitting decision coefficient in the X direction from 0.848 to 0.9928, in the Y direction from 0.875 to 0.9862, and in the Z direction from 0.847 to 0.9946. Moreover, the new prediction model reduces the root mean square error in the vertical Z direction by 96% compared to the traditional model, demonstrating a significant advantage.
Although the model has been effectively validated through this case study, further research and exploration are needed to assess applicability and generalizability in other regions. The next step is numerical simulation, which is remarkable for its convenience and economy. It can be used for parametric analyses of various influencing factors, such as the thickness and number of weak interlayers and the physical properties of the rock. This can effectively compensate for the limitations of field tests. The resulting dynamic response data will further improve the universality of the modified prediction modeling method presented in this paper.

Author Contributions

Methodology, S.C.; Formal analysis, J.P.; Investigation, Y.S. and L.H.; Data curation, J.G.; Writing—original draft, J.Z.; Writing—review & editing, Z.Z.; Supervision, N.J. All authors have read and agreed to the published version of the manuscript.

Funding

This research was funded by the Natural Science Foundation of Hubei Province grant numer No. 2024AFA092, the Key Research and Development Program of Hubei Province grant number No. 2021BAD004, as well as by the National Natural Science Foundation of China grant number No. 42102329, and No. 52478525.

Institutional Review Board Statement

Not applicable.

Informed Consent Statement

Not applicable.

Data Availability Statement

The original contributions presented in this study are included in the article. Further inquiries can be directed to the corresponding author.

Conflicts of Interest

Authors Sheng Chen and Jianxiong Guo were employed by the company CCCC Fourth Harbor Engineering Institute Co., Ltd. Author Jian Pan was employed by the company Guangxi Pinglu Canal Construction Co., Ltd. Author Liping He was employed by the company CCCC Fourth Harbor Engineering Bureau Co., Ltd. The remaining authors declare that the research was conducted in the absence of any commercial or financial relationships that could be construed as a potential conflict of interest.

Abbreviation

The following abbreviation is used in this manuscript:
PPVpeak particle velocity

References

  1. Liu, X.; Liu, Y.; Lu, Y.; Li, X.; Li, P. Numerical analysis of evaluation methods and influencing factors for dynamic stability of bedding rock slope. J. Vibroeng. 2017, 19, 1937–1961. [Google Scholar] [CrossRef]
  2. Zeng, Y.; Li, H.; Xia, X.; Liu, B.; Zuo, H.; Jiang, J. Blast-induced rock damage control in Fangchenggang nuclear power station, China. J. Rock Mech. Geotech. Eng. 2018, 10, 914–923. [Google Scholar] [CrossRef]
  3. Wu, C. Study on the Influence of Bedding Orientation on Blasting Vibration in Tunnel Construction. Master’s Thesis, Chongqing Jiaotong University, Chongqing, China, 2017. [Google Scholar]
  4. Matidza, M.I.; Zhang, J.; Huang, G.; Mwangi, A.D. Assessment of blast-induced ground vibration at Jinduicheng molybdenum open pit mine. Nat. Resour. Res. 2020, 29, 831–841. [Google Scholar] [CrossRef]
  5. Gao, J.; Huang, C.; Huang, X.; Ren, J.J.; Wang, N. A Study of Blast Vibration Propagation Law under Negative Altitude Terrains. Math. Probl. Eng. 2022, 2022, 4289057. [Google Scholar] [CrossRef]
  6. Ma, H.Y. Attenuation and time-frequency characteristics of explosion ground vibration of shallow buried OD1422-X80 mm12 MPa pipeline based on prototype experiment. J. Perform. Constr. Fac. 2019, 34, 04019092. [Google Scholar]
  7. Wu, T.Y. Experimental and numerical investigations on damage assessment of high-density polyethylene pipe subjected to blast loads. Eng. Fail. Anal. 2022, 131, 105856. [Google Scholar] [CrossRef]
  8. Liang, Q.; An, Y.; Zhao, L. Comparative Study on Calculation Methods of Blasting Vibration Velocity. Rock Mech. Rock Eng. 2011, 44, 93–101. [Google Scholar] [CrossRef]
  9. Ak, H.; Iphar, M.; Yavuz, M.; Konuk, A. Evaluation of ground vibration effect of blasting operations in a magnesite mine. Soil Dyn. Earthq. Eng. 2009, 29, 669–676. [Google Scholar] [CrossRef]
  10. Wu, X.G.; Zhu, D.; Lu, H.; Li, L. Simulation research on blasting of an open pit mine slope considering elevation conditions and slope shape factors. Front. Earth Sci. 2024, 12, 1417895. [Google Scholar] [CrossRef]
  11. Qu, Y.; Xu, B.; Li, J.; Song, H.; Zuo, S. Influence of the elevation effect of slope blasting on the vibration velocity of existing buried steel pipes. Sci. Rep. 2024, 14, 23476. [Google Scholar] [CrossRef]
  12. Su, H.; Ma, S. Study on the stability of high and steep slopes under deep bench blasting vibration in open-pit mines. Front. Earth Sci. 2022, 10, 990012. [Google Scholar] [CrossRef]
  13. Azarfar, B.; Ahmadvand, S.; Sattarvand, J. Stability Analysis of Rock Structure in Large Slopes and Open-Pit Mine: Numerical and Experimental Fault Modeling. Rock Mech. Rock Eng. 2019, 52, 4889–4905. [Google Scholar] [CrossRef]
  14. Yan, B.; Liu, M.; Meng, Q.; Li, Y.; Deng, S.; Liu, T. Study on the Vibration Variation of Rock Slope Based on Numerical Simulation and Fitting Analysis. Appl. Sci. 2022, 12, 4208. [Google Scholar] [CrossRef]
  15. Zhang, S.; Zhou, C. Study on dynamic response and safety control of reinforced concrete rigid frame structure under foundation pit blasting. Int. J. Prot. Struct. 2022, 14, 549–570. [Google Scholar] [CrossRef]
  16. Wang, G. Stability analysis of steep and high bedding rock slopes under the action of underground blasting vibration. J. China Foreign Highw. 2018, 2018, 24–28. [Google Scholar]
  17. Wu, T.; Zhou, C.; Jiang, N.; Xia, Y.; Zhang, Y. Stability analysis for high-steep slope subjected to repeated blasting vibration. Arab. J. Geosci. 2020, 13, 828. [Google Scholar] [CrossRef]
  18. Hu, Y.; Lu, W.; Wu, X.; Liu, M.; Li, P. Numerical and experimental investigation of blasting damage control of a high rock slope in a deep valley. Eng. Geol. 2018, 237, 12–20. [Google Scholar] [CrossRef]
  19. Yin, Z.Q.; Hu, Z.X.; Wei, Z.D.; Zhao, G.M.; Hai-feng, M.; Zhang, Z.; Feng, R.M. Assessment of Blasting-Induced Ground Vibration in an Open-Pit Mine under Different Rock Properties. Adv. Civ. Eng. 2018, 2018, 4603687. [Google Scholar] [CrossRef]
  20. Li, Q.; Dai, B.; Long, L.; Zhang, D.; Liang, F. Response Characteristics of Slope Subjected to Blasting: A Case Study in Manaoke Open-pit Gold Mine. Geotech. Geol. Eng. 2022, 40, 3957–3971. [Google Scholar] [CrossRef]
  21. Jiang, N.; Zhou, C.; Lu, S.; Zhang, Z. Propagation and prediction of blasting vibration on slope in an open pit during underground mining. Tunn. Undergr. Space Technol. 2017, 70, 409–421. [Google Scholar] [CrossRef]
  22. Chen, M.; Lu, W.B.; Li, P.; Liu, M.; Zhou, C.B.; Zhao, G. Elevation amplification effect of blasting vibration velocity in rock slope. Chin. J. Rock Mech. Eng. 2011, 30, 2189–2195. (In Chinese) [Google Scholar]
  23. Jiang, N.; Zhou, C.B.; Ping, W.; Xu, X.; Lu, S.W. Altitude effect of blasting vibration velocity in rock slopes. J. Cent. South Univ. (Sci. Technol.) 2014, 45, 237–243. [Google Scholar]
  24. Wu, X.; Wang, M.; Lu, H.; Zhang, Y.; Nie, W. Modified Sadowski formula-based model for the slope shape amplification effect under multistage slope blasting vibration. Int. J. Min. Sci. Technol. 2024, 34, 631–641. [Google Scholar] [CrossRef]
  25. Tian, L.; Zhu, L.; Yang, Z.; Hu, Y.; Li, P.; Liu, M.; Zhao, G. Prediction formula of blasting vibration under complex terrain based on dimensional analysis. Adv. Comput. Eng. Technol. Res. 2024, 1, 380–386. [Google Scholar] [CrossRef]
  26. Gao, Y.; Fu, H.; Rong, X.; Paneiro, G. Ground-Borne Vibration Model in the near Field of Tunnel Blasting. Appl. Sci. 2023, 13, 87. [Google Scholar] [CrossRef]
  27. Shi, J.-J.; Guo, S.-C.; Zhang, W. Expansion of Blast Vibration Attenuation Equations for Deeply Buried Small Clearance Tunnels Based on Dimensional Analysis. Front. Earth Sci. 2022, 10, 889504. [Google Scholar] [CrossRef]
Figure 1. Schematic map illustrating the location of the Qingnian Hub.
Applsci 15 06683 g001
Figure 2. Slope of the field test.
Applsci 15 06683 g002
Figure 3. Schematic diagram of the blasting plan.
Applsci 15 06683 g003
Figure 4. Schematic diagram of the test apparatus.
Applsci 15 06683 g004
Figure 5. Experimental procedure.
Applsci 15 06683 g005
Figure 6. Vibration velocity of V3 measuring point.
Applsci 15 06683 g006
Figure 7. Illustration of the fitting results using the Sadowsky formula. (a) Test I; (b) Test II; (c) Test III.
Applsci 15 06683 g007
Figure 8. (A) Result of Mean Absolute Error; (B) Result of Root Mean Square Error.
Applsci 15 06683 g008
Table 1. Physical and mechanical parameters of rock in the fourth group of the Liantan Group of the Lower Silurian System.
NameNatural
Density
Saturation
Density
Coefficient of Water
Saturation
Uniaxial
Compression
Young’s
Modulus
Poisson’s
Ratio
sandstone2.64 g·cm−32.70 g·cm−30.51%30.66 MPa13.35 Gpa0.30
mudstone2.63 g·cm−3/2.91%3.93 MPa7.1 Gpa0.34
Table 2. Statistical results of vibration velocity of test measuring points.
Test
Sequence
NumberingHigh
Displacement/m
PPV/cm·s−1Blasting
Distance/m
Charge/kg
X-DirectionY-DirectionZ-Direction
IV10.1037.7216.3835.2012.8048
36.9216.4234.568.2342
36.3732.7733.224.3936
V220.131.26 43.1048
0.86 39.8042
1.02 36.2036
V350.500.571.151.2581.2048
0.350.630.6678.9042
0.380.740.7175.1036
IIV40.136.8512.7034.4114.2048
9.5513.5328.7310.1042
15.2927.9137.366.3036
V514.012.361.502.8336.0048
0.160.501.3232.3042
2.300.722.7028.8036
V633.650.680.61 67.4048
0.500.48 63.4042
0.460.45 60.6036
IIIV70.1112.2416.4035.2013.4048
13.4016.8434.129.9042
18.3622.6338.546.1036
V89.407.046.1410.0723.3048
4.094.063.9319.6042
7.549.4510.216.3036
V952.630.67 3.0273.3048
0.16 0.8070.7042
0.42 2.7468.1036
Table 3. The fitting results of the Sadowsky formula.
Test
Sequence
DirectionThe Fitting Results of the
Sadowsky Formula
Coefficient of
Determination (r2)
IX-direction v = 56.86 Q 3 R 0.818 0.720
Y-direction v = 43.14 Q 3 R 0.973 0.965
Z-direction v = 48.96 Q 3 R 0.619 0.722
IIX-direction v = 36.46 Q 3 R 1.307 0.975
Y-direction v = 78.02 Q 3 R 1.577 0.967
Z-direction v = 81.86 Q 3 R 1.037 0.719
IIIX-direction v = 36.14 Q 3 R 1.004 0.929
Y-direction v = 43.48 Q 3 R 0.973 0.817
Z-direction v = 83.67 Q 3 R 1.055 0.772
Table 4. Fitting results considering elevation effect correction.
Test SequenceDirectionFitting Results Considering
Elevation Effect Correction
Coefficient of
Determination (r2)
IX-direction v = 3.48 Q 3 R 0.703 H R 0.673 0.974
Y-direction v = 21.12 Q 3 R 1.069 H R 0.190 0.968
Z-direction v = 4.24 Q 3 R 0.588 H R 0.590 0.997
IIX-direction v = 22.59 Q 3 R 1.242 H R 0.106 0.981
Y-direction v = 27.20 Q 3 R 1.606 H R 0.269 0.982
Z-direction v = 7.813 Q 3 R 0.749 H R 0.516 0.965
IIIX-direction v = 22.53 Q 3 R 0.846 H R 0.086 0.929
Y-direction v = 19.88 Q 3 R 0.696 H R 0.137 0.910
Z-direction v = 15.03 Q 3 R 0.542 H R 0.317 0.976
Table 5. Vital physical parameters for vibration in slope blasting.
Variable TypeSignParaphraseDimension
Dependent variableμDisplacement of particle vibrationL
vPeak velocity of particle vibrationLT−1
aAcceleration of particle vibrationLT−2
fFrequency of particle vibrationT−1
Independent variableQExplosive qualityM
RThe distance between the source of the explosion and the particleL
HDifference in elevation between the explosion source and the particlesL
ρDensity of rocksML−3
cVibration wave speed of propagationLT−1
tDetonation timeT
θInclination angle/
Table 6. Fitting results considering layer inclination angle.
Test
Sequence
DirectionFitting Results Considering Elevation Effect
Correction
Coefficient of
Determination (r2)
I/II/IIIX-direction v = 28.1278 Q 3 R 1.3251 H R 0.0650 θ π 0.5353 0.9928
Y-direction v = 21.8309 Q 3 R 1.1159 H R 0.1881 θ π 0.0065 0.9862
Z-direction v = 6.0685 Q 3 R 0.5862 H R 0.5061 θ π 0.1699 0.9946
Table 7. The fitting results of Equations (1) and (2) in each direction.
Blasting Vibration Attenuation
Prediction Model Equations
DirectionThe Fitting Results of Equations (1) and (2)Coefficient of
Determination (r2)
Traditional blasting vibration attenuation prediction modelX-direction v = 86.64 Q 3 R 1.770 0.848
Y-direction v = 76.070 Q 3 R 1.627 0.875
Z-direction v = 117.58 Q 3 R 1.513 0.847
Prediction model of blasting vibration attenuation considering elevation effectX-direction v = 38.99 Q 3 R 1.513 H R 0.150 0.859
Y-direction v = 27.89 Q 3 R 1.308 H R 0.188 0.885
Z-direction v = 19.27 Q 3 R 0.933 H R 0.336 0.902
Disclaimer/Publisher’s Note: The statements, opinions and data contained in all publications are solely those of the individual author(s) and contributor(s) and not of MDPI and/or the editor(s). MDPI and/or the editor(s) disclaim responsibility for any injury to people or property resulting from any ideas, methods, instructions or products referred to in the content.

