Article

A Deep Learning-Based Algorithm for Ceramic Product Defect Detection

1
School of Art and Design, Zhengzhou University of Light Industry, Zhengzhou 450002, China
2
College of Electrical and Information Engineering, Zhengzhou University of Light Industry, Zhengzhou 450002, China
*
Author to whom correspondence should be addressed.
Appl. Sci. 2025, 15(12), 6641; https://doi.org/10.3390/app15126641
Submission received: 12 May 2025 / Revised: 3 June 2025 / Accepted: 6 June 2025 / Published: 12 June 2025

Abstract

In the field of ceramic product defect detection, traditional manual visual inspection methods suffer from low efficiency and high subjectivity, while existing deep learning algorithms are limited in detection efficiency due to their high complexity. To address these challenges, this study proposes a deep learning-based algorithm for ceramic product defect detection. The algorithm designs a lightweight YOLOv10s detector, which reconstructs the backbone network using GhostNet and incorporates an Efficient Channel Attention (ECA) mechanism fused with depthwise separable convolutions, effectively reducing the model’s complexity and computational load. Additionally, an adaptive threshold method is proposed to improve the traditional Canny edge detection algorithm, significantly enhancing its accuracy in defect edge detection. Experimental results demonstrate that the algorithm achieves an mAP@50 of 92.8% and an F1-score of 90.3% in ceramic product defect detection tasks, accurately identifying and locating four types of defects: cracks, glaze missing, damage, and black spots. In crack detection, the average Edge Localization Error (ELE) is reduced by 25%, the Edge Connectivity Rate (ECR) is increased by 15%, the Weak Edge Responsiveness (WER) is improved by 17%, and the frame rate reaches 40 frames per second (f/s), meeting real-time detection requirements. This algorithm exhibits significant potential in the field of ceramic product defect detection, providing solid technical support for optimizing the ceramic product manufacturing process.

1. Introduction

Ceramic products, as widely used materials in daily life, have a surface quality whose importance cannot be overstated. It not only affects the aesthetic appeal of the products but is also closely tied to their performance and service life, thereby profoundly influencing the overall quality, operational safety, and market competitiveness of the products. However, during the production and transportation of ceramic products, various factors such as fluctuations in process parameters, collisions during handling, and changes in environmental temperature and humidity can lead to the appearance of various defects on the ceramic surface, including cracks, glaze missing, damage, and black spots. These defects not only significantly reduce the product’s yield rate but may also pose safety hazards during use. Traditional methods for detecting defects in ceramic products primarily rely on manual visual inspection. However, this approach has numerous limitations, such as low detection efficiency, high susceptibility to subjective factors, and difficulties in data traceability, making it difficult to meet the modern manufacturing industry’s demands for high precision, real-time performance, and data-driven quality improvement [1]. Thus, achieving efficient and accurate detection of defects in ceramic products is of utmost importance for enhancing product quality, optimizing production processes, and reducing losses during transportation [2,3].
In the field of computer vision, deep learning technology is employed to precisely locate and classify specific targets within images or videos, primarily divided into object detection-based methods and semantic segmentation-based methods [,4,5]. Among them, object detection methods leverage the powerful feature extraction capabilities of deep convolutional neural networks (CNNs) to perform multi-scale and multi-level feature learning on input images [6]. These network architectures, such as the classic Faster R-CNN [7], YOLO [8] series, and SSD [9], can automatically learn low-level texture features, mid-level shape features, and high-level semantic features from images, thereby capturing the essential characteristics of targets under varying scales, poses, and lighting conditions. They are widely applied in fields such as pest and disease diagnosis [10], crop recognition [11], defect detection [12], and intelligent traffic monitoring [13]. On the other hand, semantic segmentation-based methods focus on assigning each pixel in an image to a specific category, enabling fine-grained understanding of images at the pixel level [14]. These network architectures, such as UNet [15], DeepLab [16] series, and SegNet [17], can capture rich spatial contextual features, fine boundary information, and complex relationships between different semantic categories within images. With the development of deep learning technology, they have been widely applied in fields such as medical image analysis [18], remote sensing image interpretation [19], visual navigation [20], and plant detection [21].
In recent years, deep learning technology has provided solid technical support for the field of ceramic product defect detection due to its high precision, strong real-time performance, and excellent adaptability to complex scenarios. Wan et al. proposed a lightweight model based on an improved YOLOv5s for detecting small defects on tile surfaces. By deepening the backbone network, introducing the CBAM attention module, and designing a four-output prediction layer, they enhanced feature extraction and detection efficiency [22]. Lu et al. focused on small defects in high-resolution tile images, optimizing the YOLOv5s bottleneck module, adopting a Shufflenetv2 backbone, and combining it with multi-sliding window detection, achieving breakthroughs in model lightweighting and detection speed [23]. Nogay et al. utilized acoustic noise data and transfer learning to construct a model for high-precision detection of invisible internal cracks in ceramics [24]. Chen et al. proposed a fuzzy inpainting network and a multi-scale contrast enhancement algorithm for low-contrast defects in 3D-printed ceramic curved parts, combined with the ECANet-Mobilenet SSD model, significantly improving the recognition accuracy of cracks and protrusions [25]. Cao et al. constructed a high-resolution CT surface defect dataset, improved YOLOv5, and introduced a dynamic attention mechanism and a balanced loss function, increasing detection accuracy by 6% and alleviating the problems of small targets and class imbalance [26]. Fang et al. proposed an improved edge-detection algorithm based on cluster analysis to enhance the accuracy of crack repair in ancient ceramics. This algorithm utilizes cluster analysis to optimize the Sobel operator and subsequently alters the gray-level distribution of the edge-detection map. Experiments demonstrate a 20% improvement in the alignment of the detected contour crack trajectories with the edge directions [27]. Zhou et al. first employed the Otsu method to extract the detection regions within the image. Then, they combined the Canny algorithm with methods like the Fast Fourier Transform (FFT) to detect defects such as pits, bubbles, and protrusions on the ceramic surface. The system achieved a detection accuracy of over 97.2% [28].
As shown in Table 1, existing methods such as manual visual inspection, traditional machine vision-based inspection, object detection algorithms, and semantic segmentation algorithms have all played their respective roles in the field of ceramic product defect detection. However, they also come with some notable limitations. For instance, manual visual inspection is inefficient and has poor data traceability. Traditional machine vision has limited functionality and is susceptible to environmental interference. Although object detection algorithms boast strong real-time performance, they have high model complexity and resource requirements. Semantic segmentation algorithms can provide fine-grained boundary information but suffer from a large computational load and poor real-time performance. In addition, these methods often struggle to simultaneously meet various demands such as detection accuracy, efficiency, and adaptability. Furthermore, in actual production applications, ceramic products have a wide variety and complex types of defects, placing even stricter requirements on inspection technologies. To address these challenges, this study proposes a deep-learning-based ceramic product defect detection algorithm. The main workflow is illustrated in Figure 1. First, the algorithm utilizes a lightweight YOLOv10s detector to process the input images. It is used to identify and locate four common types of defects: cracks, glaze deficiency, breakage, and black spots. At the same time, it designates the defect areas containing cracks as regions of interest (ROIs). Subsequently, within the ROIs, an adaptive Canny detection technique is employed to accurately capture and locate the edges of cracks, thereby providing strong support for subsequent process improvements.
The structure of this paper is arranged as follows: Chapter One elaborates on the importance of defect detection in ceramic products and the limitations of existing detection methods, thereby presenting the research background and significance of a deep-learning-based algorithm for ceramic product defect detection. Chapter Two provides a detailed introduction to the constructed ceramic product defect dataset and its building process, encompassing aspects such as data collection, annotation, and validation. Chapter Three describes the ceramic product defect detection algorithm based on the lightweight YOLOv10s model, with a focus on introducing the model’s design, optimization, and its performance in defect detection tasks. Chapter Four proposes a ceramic crack detection method based on an adaptive Canny edge detection algorithm. The superiority of this method in crack edge detection is verified through experiments. Chapter Five summarizes the research findings of the entire paper and offers an outlook on future research directions.

2. Materials and Methods

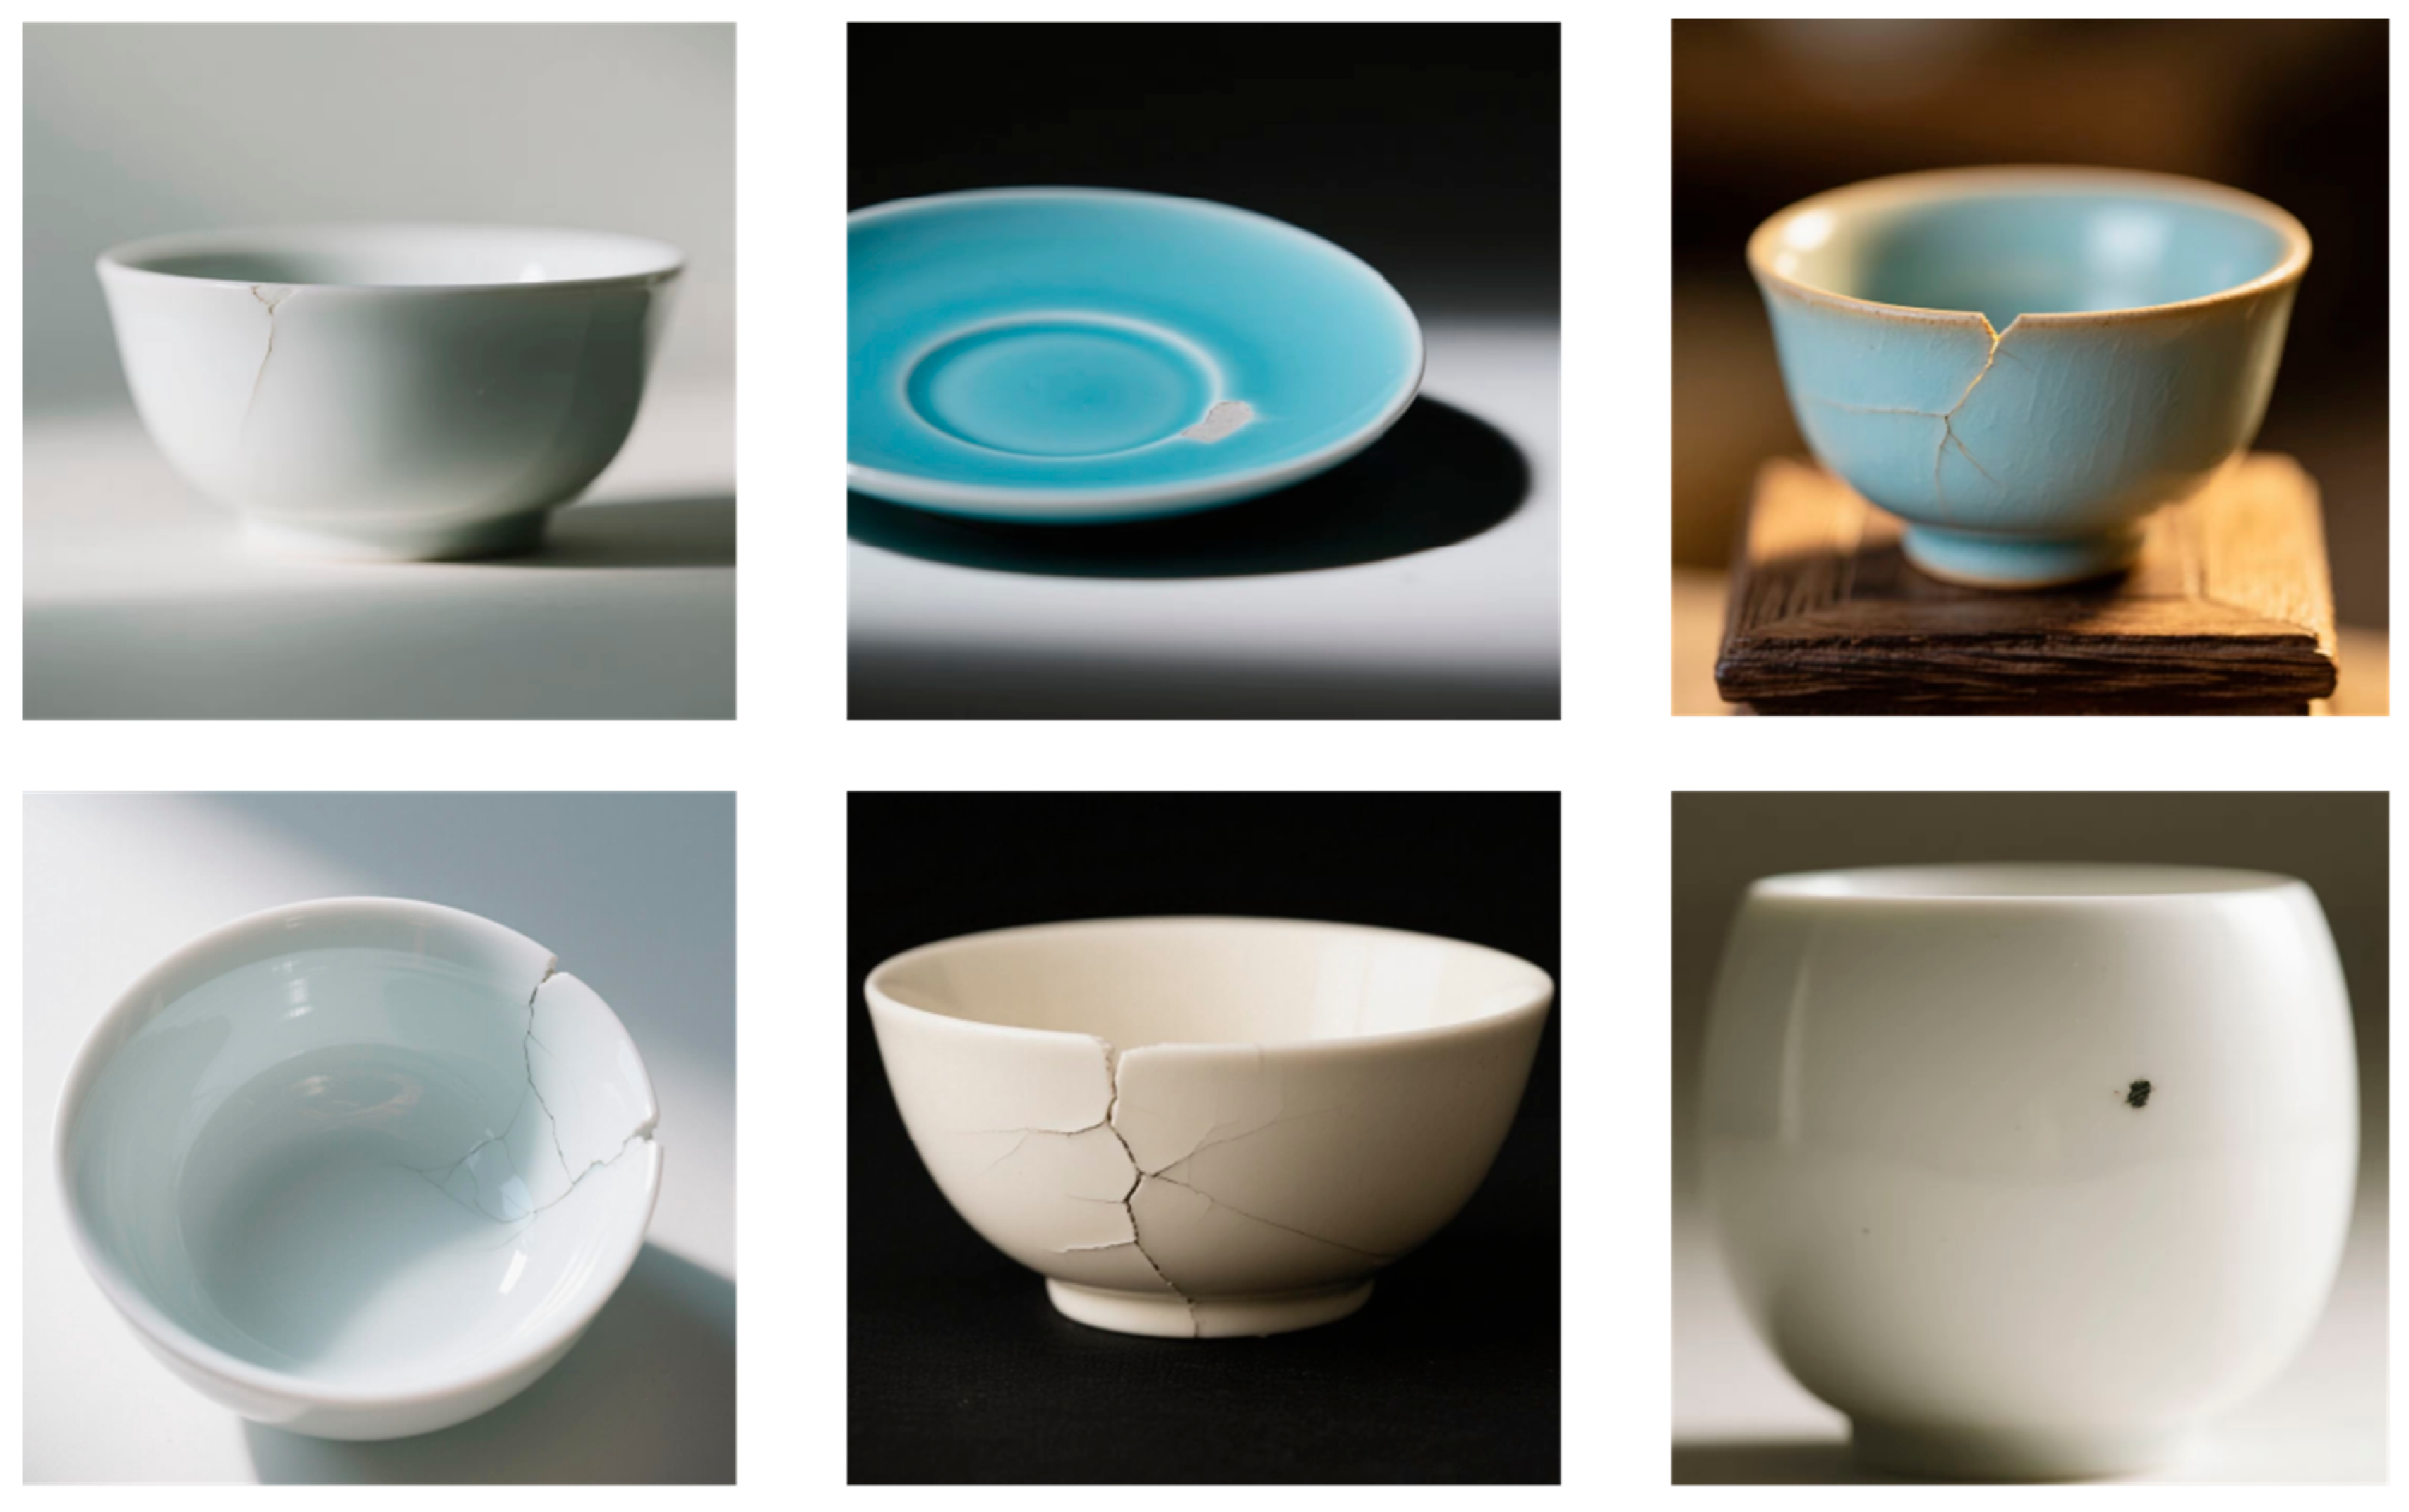
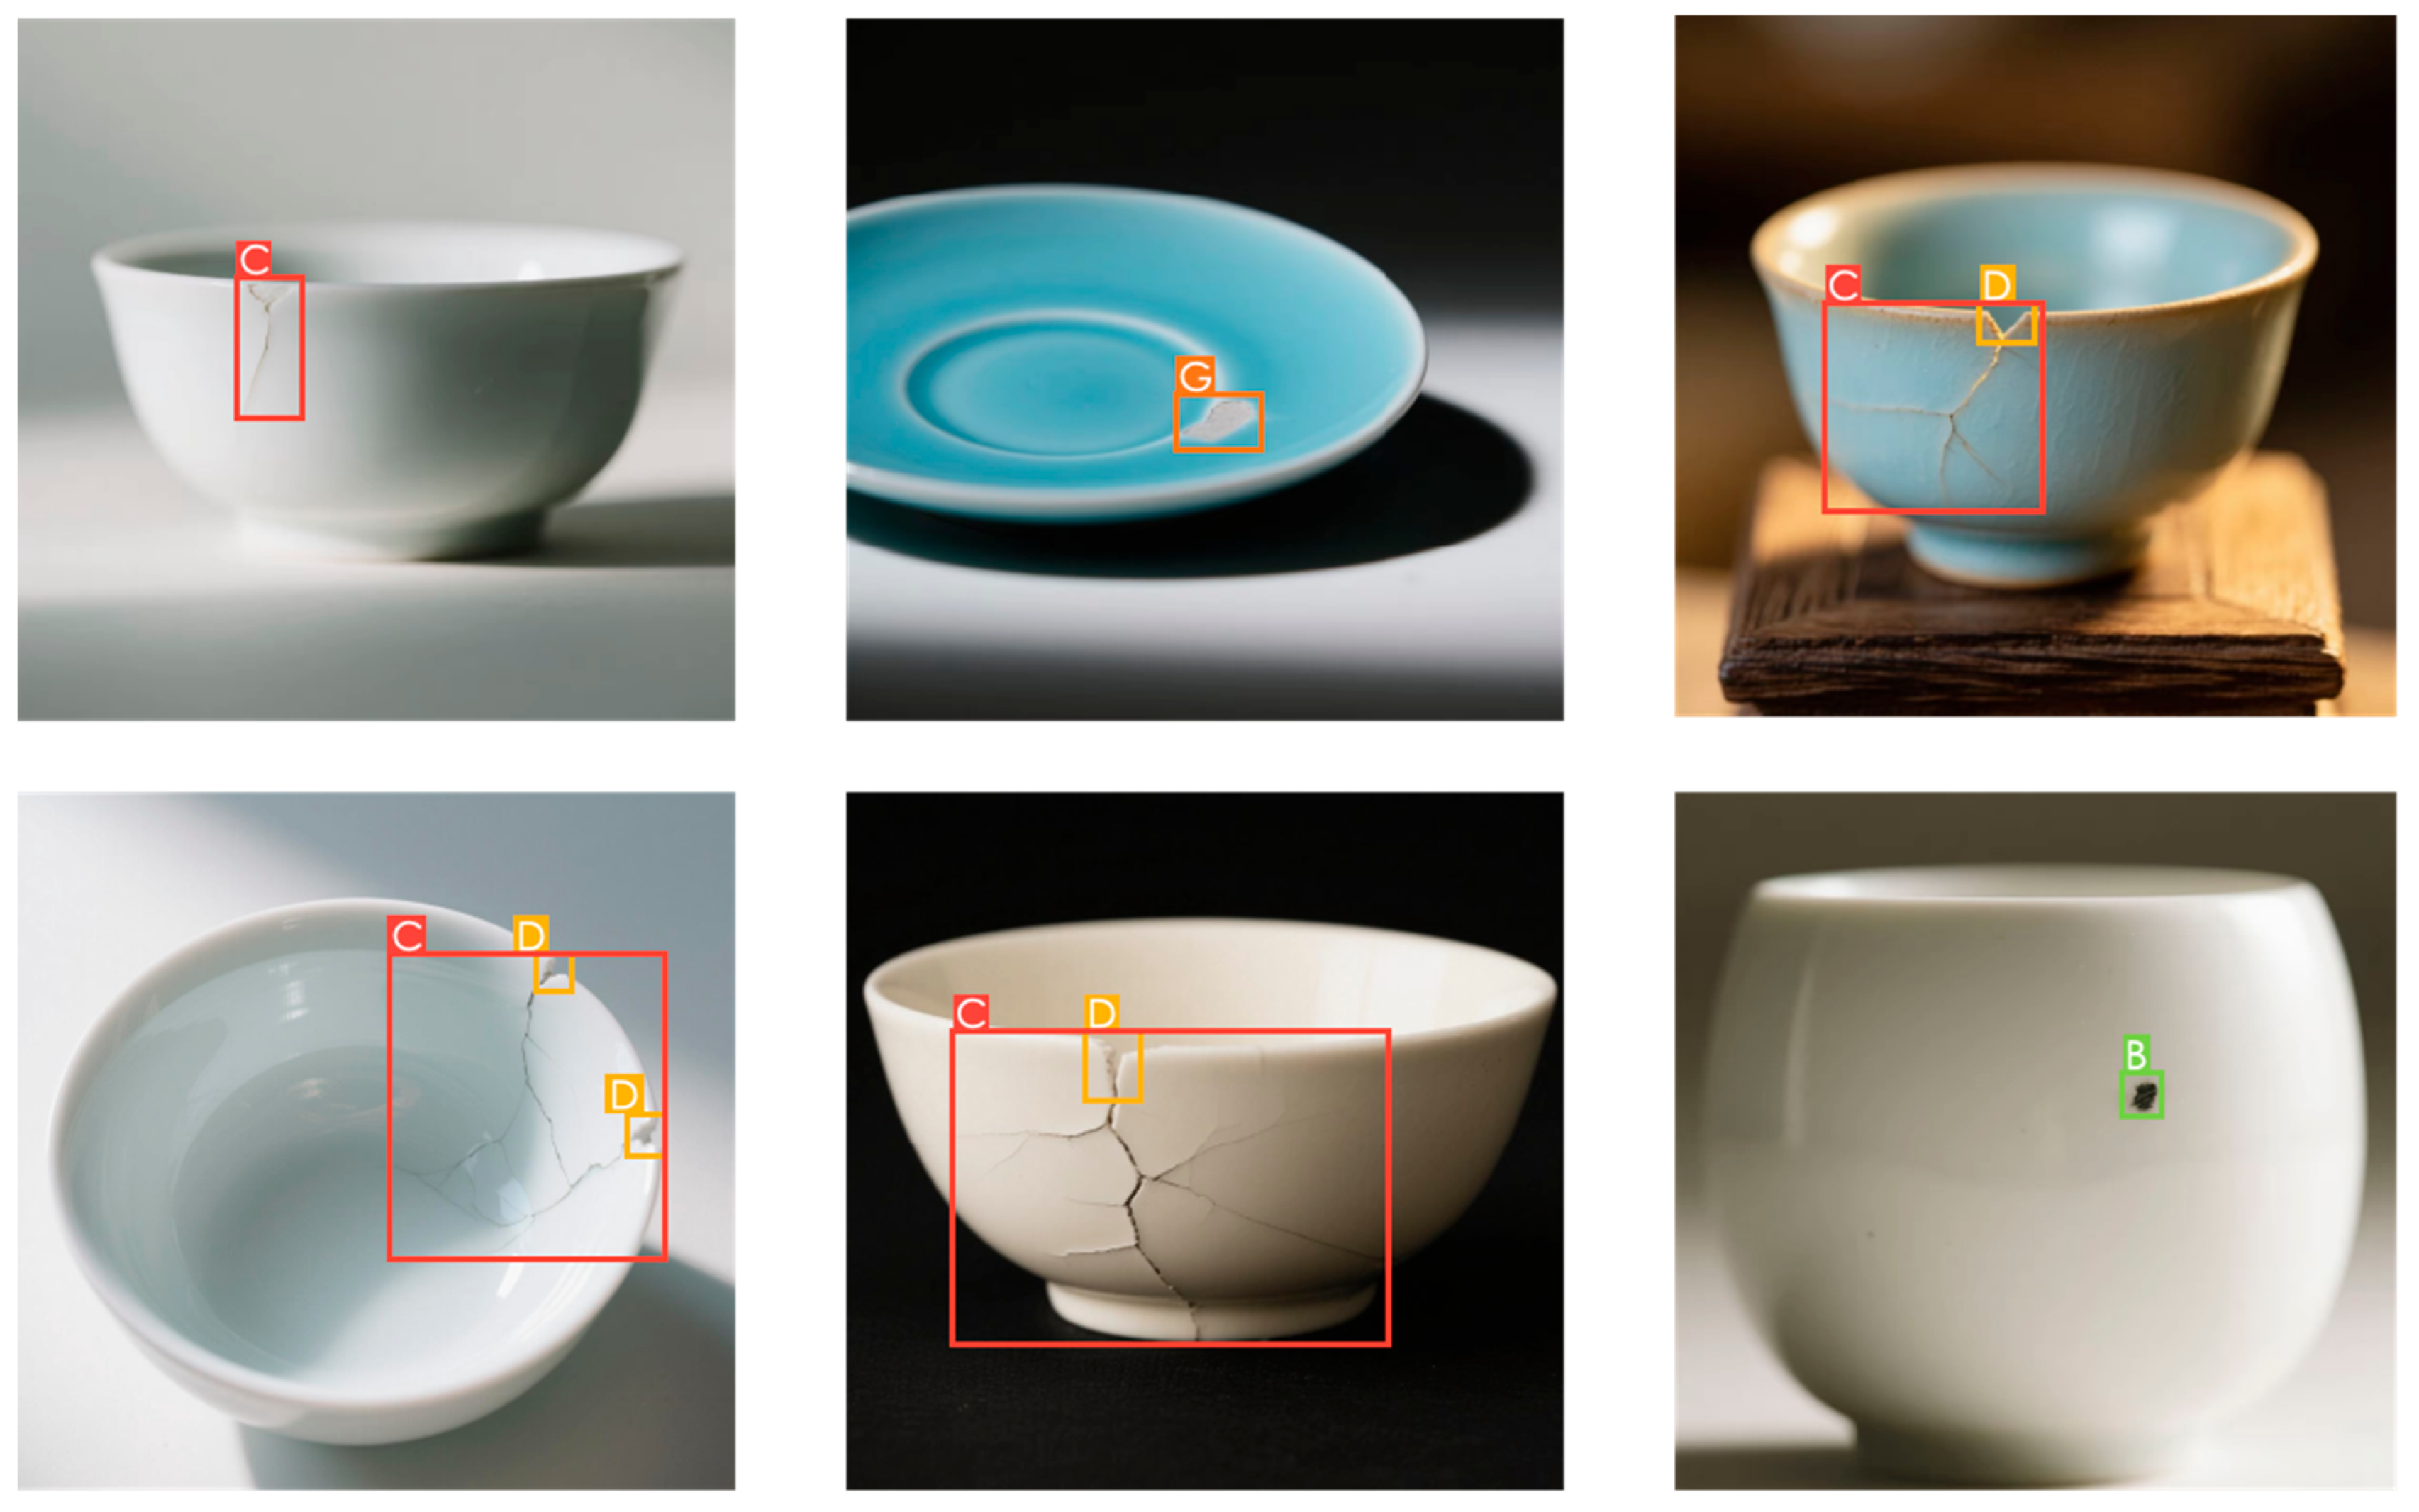
2.1. Dataset Construction

Given the extreme scarcity of publicly available ceramic defect datasets, constructing a specialized ceramic defect dataset is particularly essential. In this study, through data collection, annotation, and validation processes, a ceramic product defect dataset was created, encompassing four typical defect types: cracks, glaze missing, damage, and black spots.
During the data collection phase, the research team first gathered defective ceramic products from the market and used high-resolution cameras (Canon EOS R5, Canon Inc., Tokyo, Japan) to capture detailed images under various lighting conditions to obtain authentic and diverse samples. Meanwhile, to supplement the natural samples, the team simulated the creation of defective samples in a laboratory environment. For instance, damage was simulated by gentle tapping, and black spots were replicated using specific chemicals, ensuring the completeness and representativeness of the dataset. Considering that the study focused on the products themselves, the team selectively collected ceramic crafts with relatively uniform colors and shapes during the collection process, discarding handicrafts with complex colors or intricate designs to ensure data consistency and relevance.
In the annotation phase, members of the research team manually annotated the type and location of defects in each image using the professional image annotation tool LabelImg (GitHub, Inc., San Francisco, CA, USA). Given the lengthy full names of the defect types, only the capitalized initial letters of each type were used as annotation labels. To ensure the quality of the dataset, the research team invited professional annotators to conduct rigorous manual inspections, reviewing each annotation result individually to correct errors or inconsistencies. Simultaneously, ambiguous, duplicate, and poorly annotated samples were removed to guarantee the purity and usability of the dataset. After a series of implementation processes, a YOLO-formatted ceramic defect dataset containing 3030 original images was ultimately formed. This dataset was divided into a training set, a validation set, and a test set in an 8:1:1 ratio, respectively, used for training, evaluating, and testing the ceramic product defect detection model. Details of the ceramic defect dataset and original images are shown in Table 2 and Figure 2, respectively.
The experiment was conducted on a Windows system, utilizing PyCharm 2021 as the programming software. The experimental environment was configured with Python 3.9.19, the PyTorch 2.0.1 framework, and CUDA 11.8 for the training and evaluation of the algorithm model. In the experiment, all images were uniformly resized to 640 × 640 pixels. The training was set with 500 epochs, a batch size of 32, and 8 worker threads. In terms of hardware, a 64-bit Windows 10 operating system was employed, paired with an Intel(R) Core(TM) i5-14600KF 3.50 GHz processor (Intel Corporation, Santa Clara, CA, USA) and an NVIDIA GeForce RTX 4060 Ti graphics card with 16,380 MiB of video memory (NVIDIA Corporation, Santa Clara, CA, USA) to ensure efficient and stable operation of the experiment.

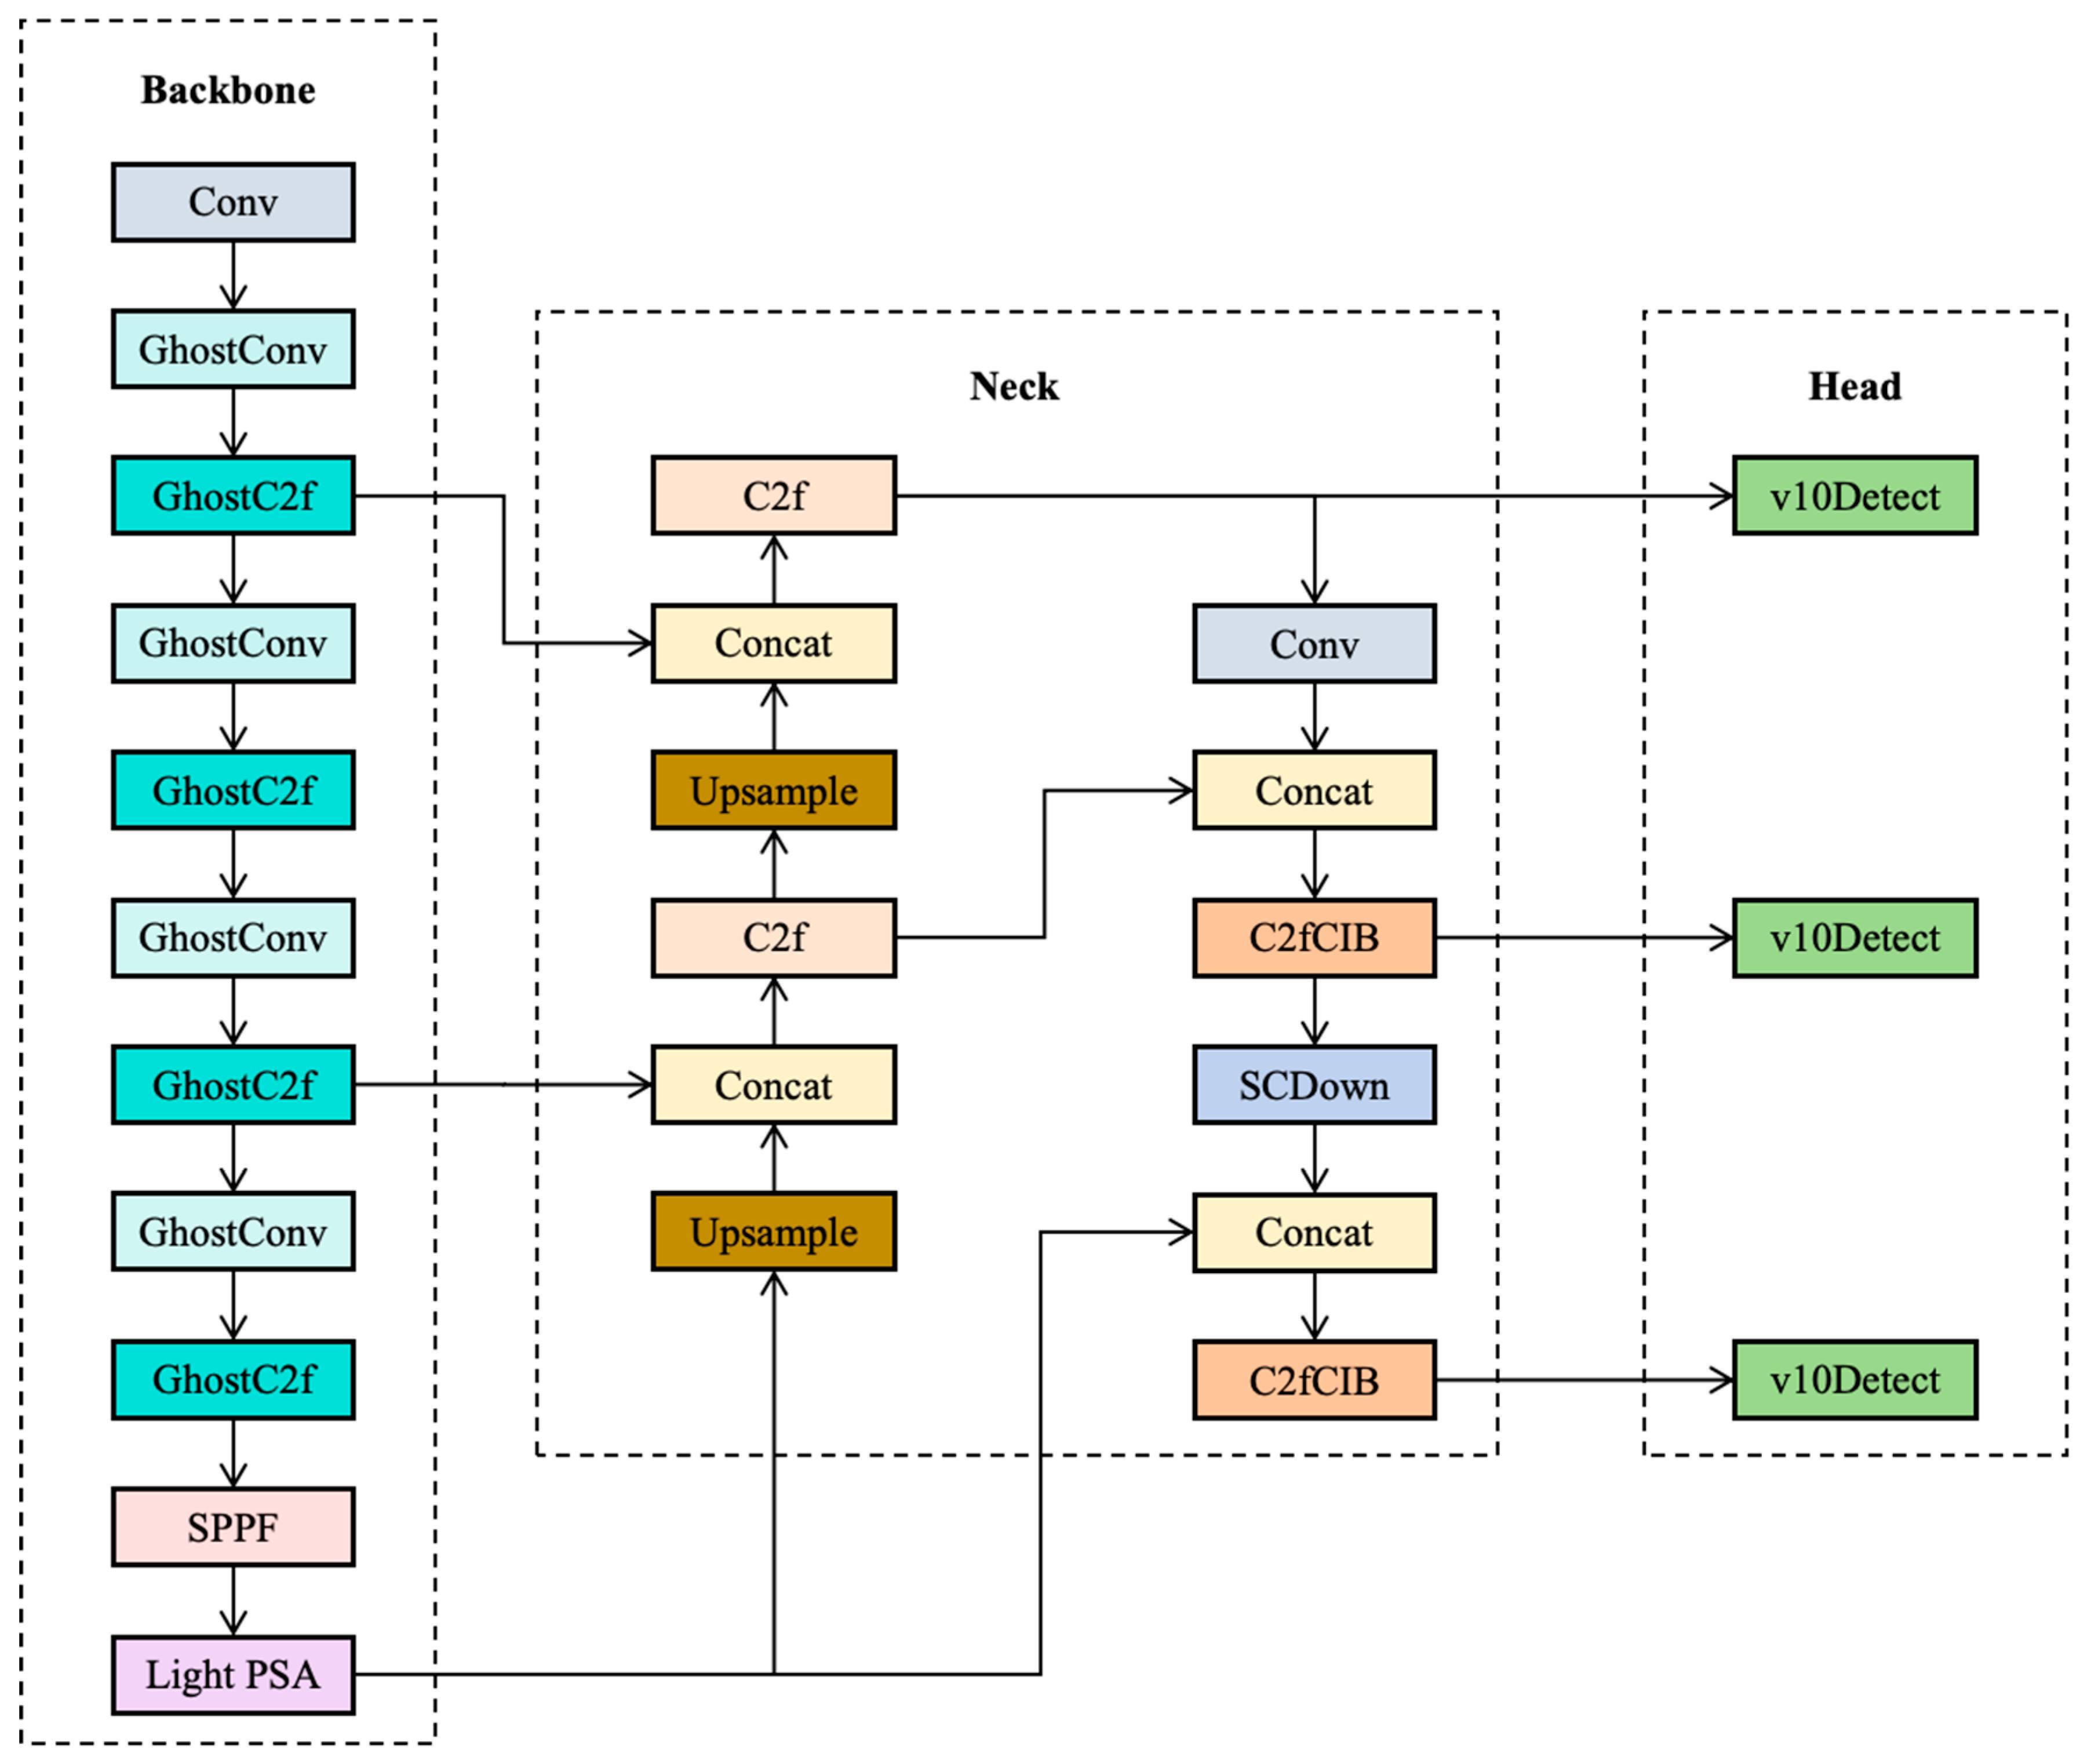
2.2. Lightweight YOLOv10s Model

In the quality inspection process of ceramic crafts, while detection accuracy is undoubtedly important, the rapid identification of whether a product has defects also plays a decisive role in the overall efficiency of the quality inspection system. Therefore, the development of an efficient recognition algorithm model is particularly urgent. In recent years, numerous advanced detectors have emerged, among which the YOLOv10 series models have garnered significant attention due to their outstanding real-time performance. In particular, YOLOv10s, as a standout in the series, has successfully achieved a balance between accuracy and speed, ensuring the precision of detection while significantly enhancing processing speed. Additionally, YOLOv10 employs an efficient feature fusion technique in the design of its detection head. This design further optimizes the feature extraction and classification process, improving the detection capability for small targets and dense defects. Consequently, YOLOv10 demonstrates exceptional performance and potential in the quality inspection of ceramic crafts.
To further enhance the operational efficiency of the model, this study proposes a lightweight-optimized YOLOv10s model, with its detailed architecture illustrated in Figure 3. During the optimization process, we first redesigned the backbone network using GhostNet. This network significantly reduces the model’s parameter count and computational load through an efficient feature reuse strategy. On this foundation, we also devised an ECA (Efficient Channel Attention) mechanism fused with depthwise separable convolutions and applied it to improve the original PSA (Position-Sensitive Attention) module. This enhancement aims to boost the model’s inference speed and strengthen its ability to capture key features. Ultimately, the optimized YOLOv10s model achieves a substantial leap in operational efficiency while maintaining high precision.

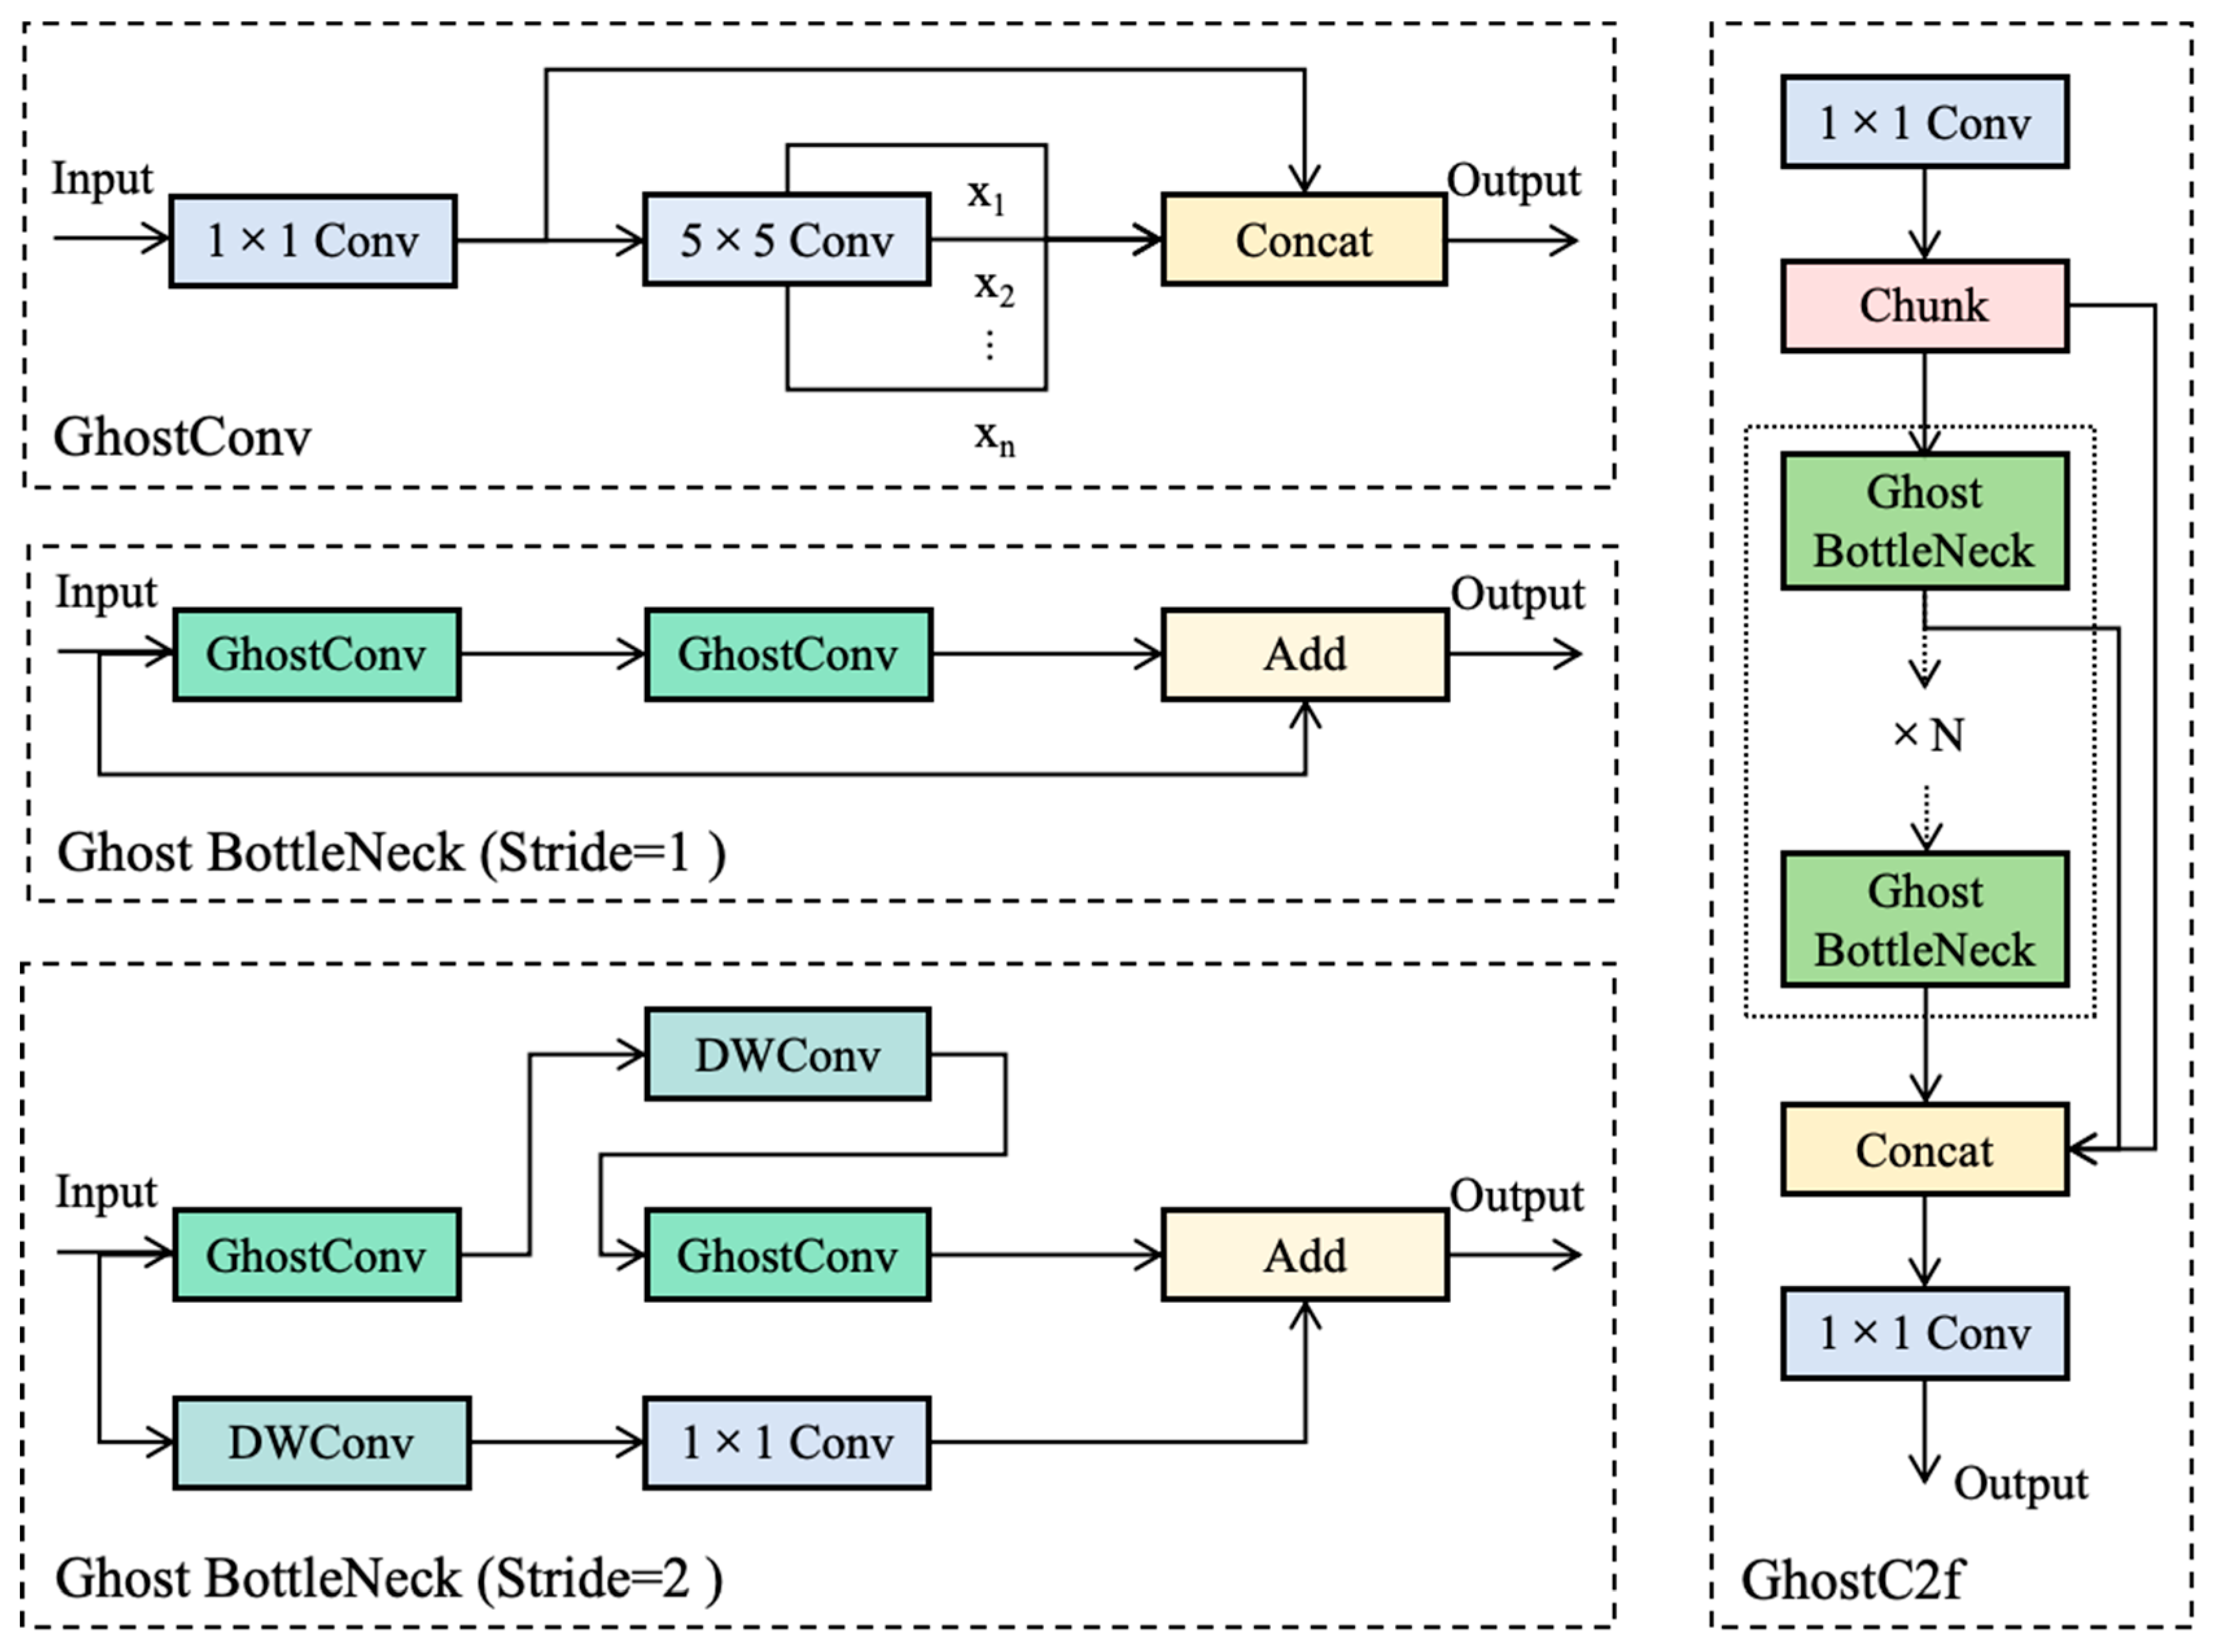
2.2.1. Lightweight Backbone Network

Among the various models that have implemented lightweight improvements to backbone networks, GhostNet offers a highly effective strategy, with its core lying in the GhostConv convolutional module. Compared to traditional convolutional modules, GhostConv introduces an efficient transformation mechanism for generating redundant feature maps. This approach significantly reduces the model’s complexity and runtime resource consumption while maintaining detection accuracy. Based on this, in the design of our backbone network, we comprehensively replaced the standard convolutional layers with GhostConv and constructed the GhostC2f module. The GhostC2f module not only inherits the efficient characteristics of GhostConv but also retains the multi-scale feature fusion and deep information mining capabilities of the original C2f module, further enhancing the network’s overall performance.
As shown in Figure 4, the GhostConv module employs a unique two-step feature map generation strategy. First, it utilizes a depthwise separable convolution operation to efficiently generate a small number of base feature maps, which capture the core characteristics of the input data. Subsequently, for each base feature map, a lightweight depthwise convolution operation is applied to derive redundant feature maps that are similar to yet distinct from the base feature maps at a minimal computational cost. Finally, the base and redundant feature maps are concatenated along the channel dimension to form a complete output feature map, preserving key information while enriching the feature representation. In the C2f module, the BottleNeck structure plays a crucial role in reducing computational load and parameter count, balancing network efficiency with feature representation capability. By replacing the standard convolutional layers used for dimensionality expansion and reduction with GhostConv, the computational load and parameter count are significantly reduced. For the C2f module, the optimized stacking of multiple BottleNeck structures leads to a substantial improvement in the module’s computational efficiency. Moreover, by retaining the base feature maps and generating redundant ones, GhostConv ensures that the BottleNeck structure can capture rich features from the input data, making the C2f module more robust in feature extraction, capable of handling complex and varied input data, and enhancing the model’s generalization ability.

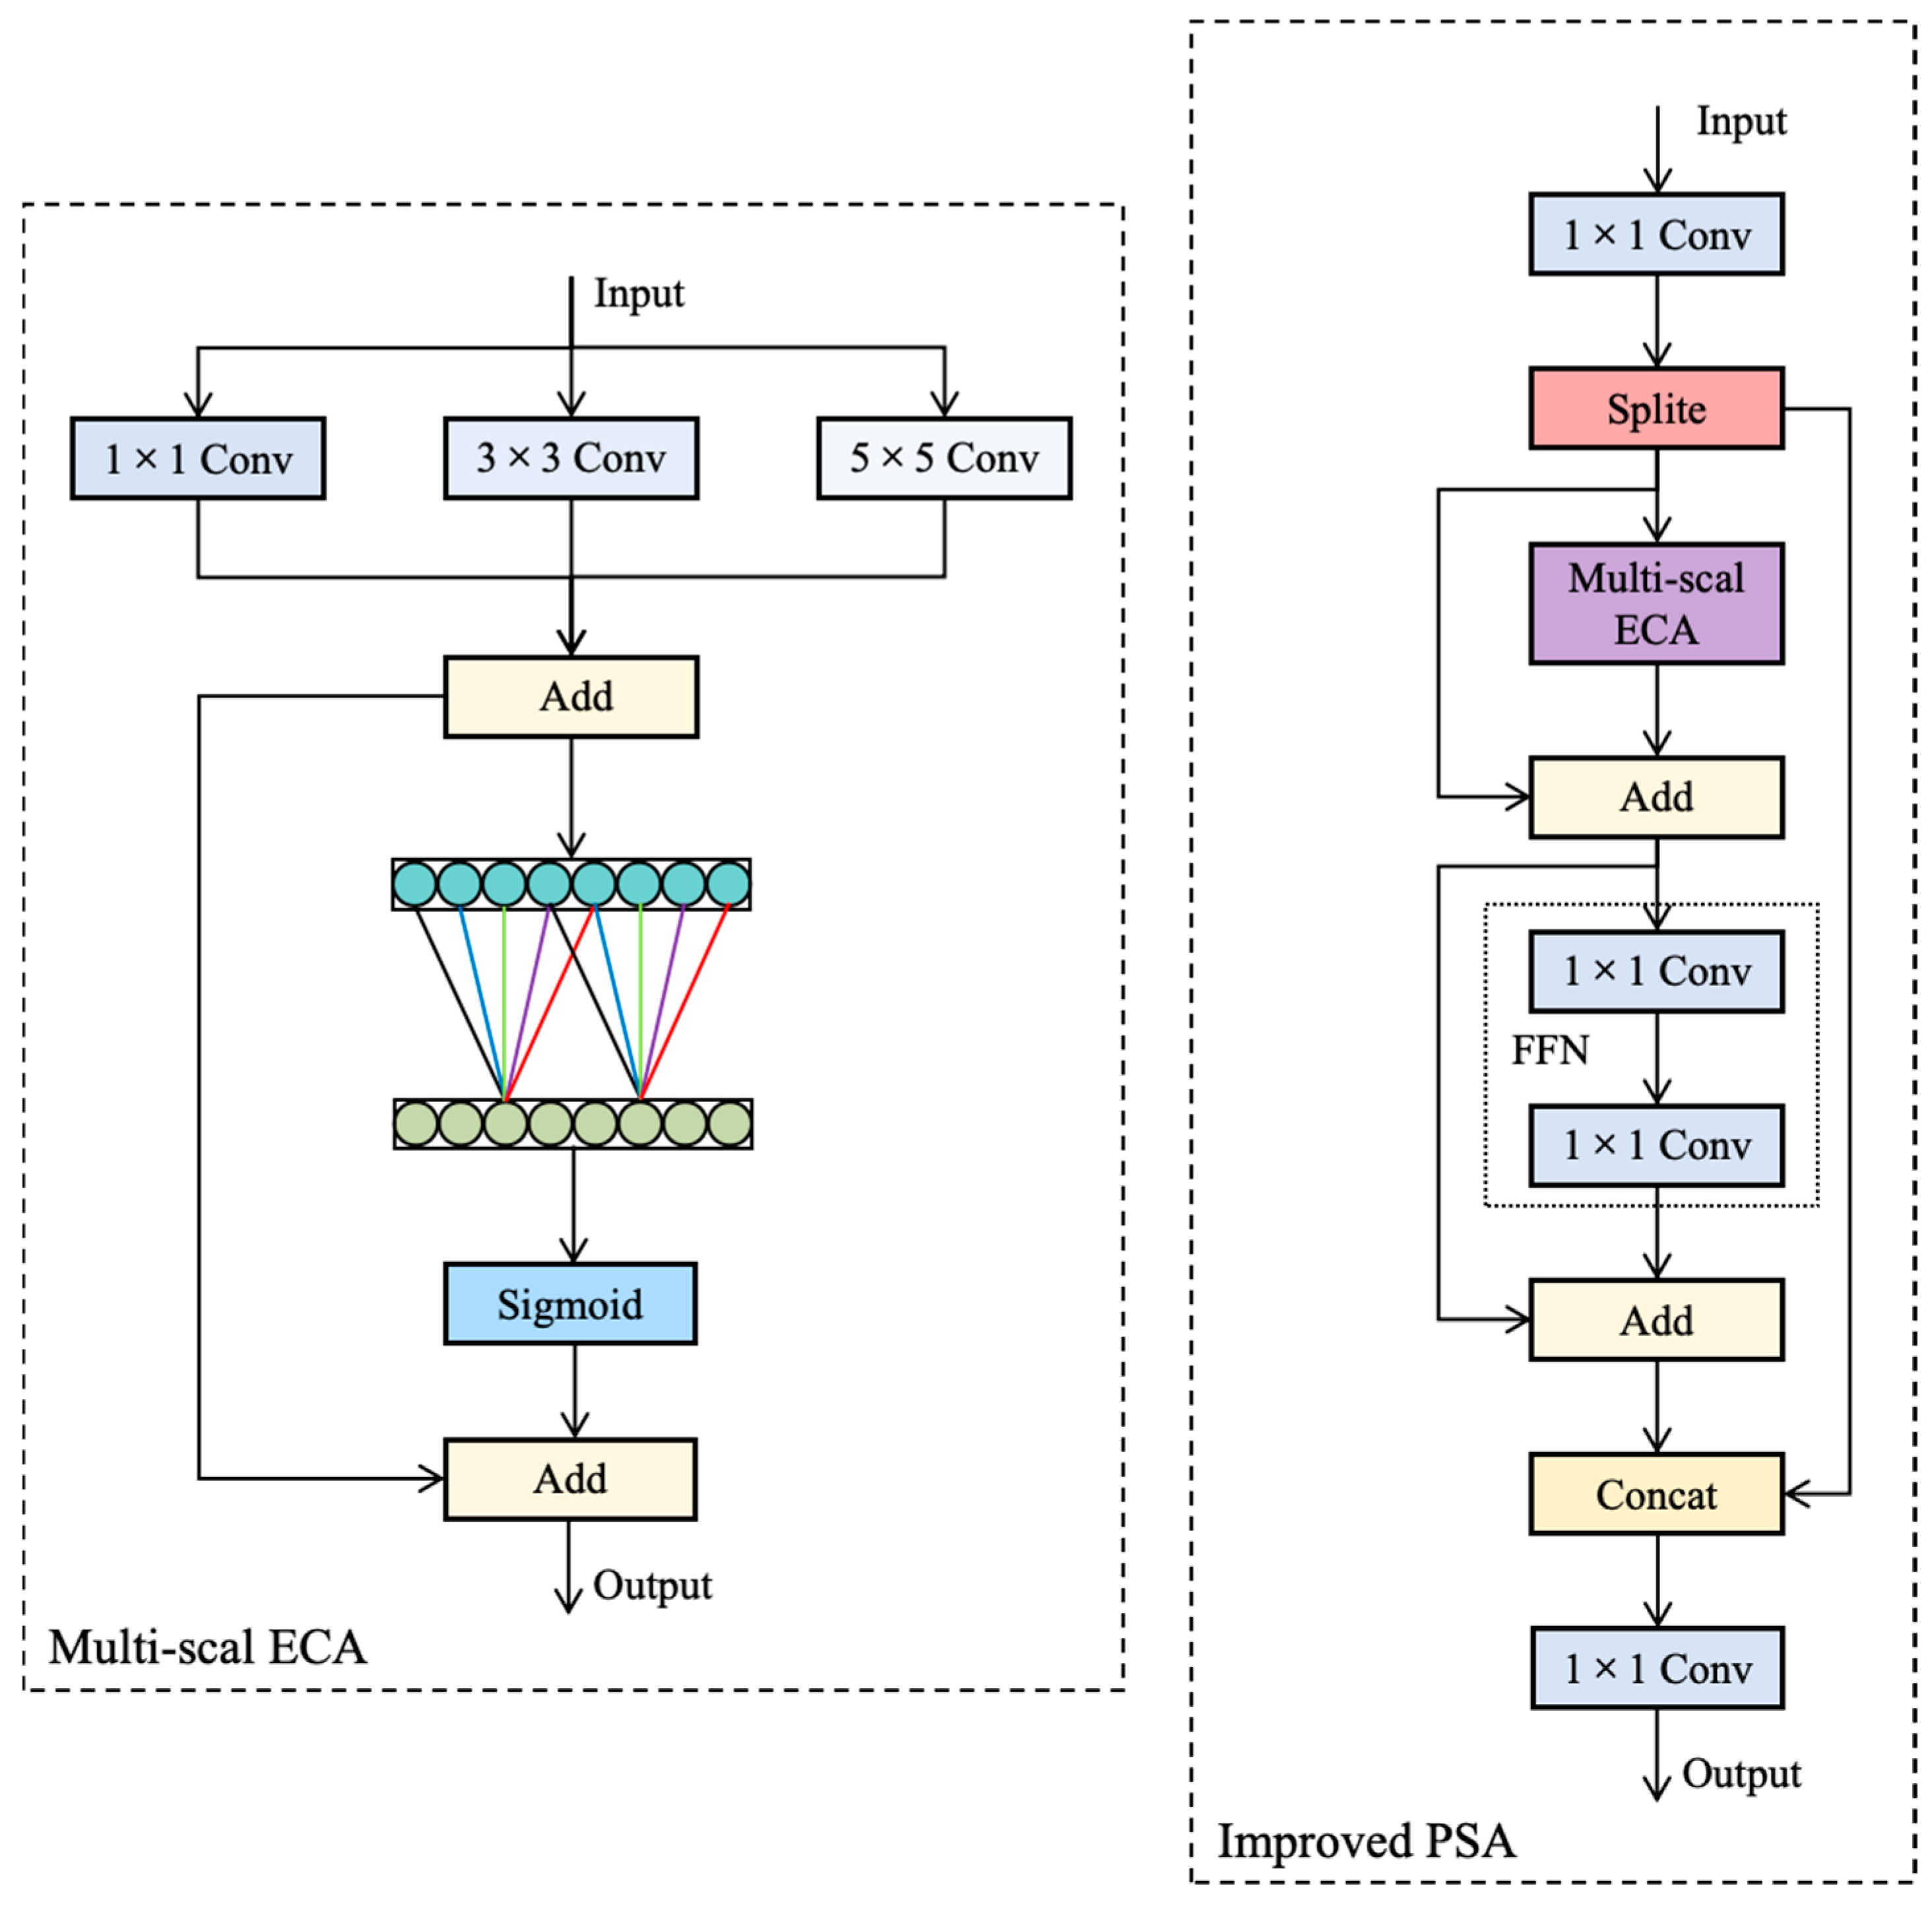
2.2.2. Improved PSA Module

To enhance the model’s global modeling performance, YOLOv10 innovatively introduces the PSA module. This module integrates a Multi-Head Self-Attention (MHSA) module with a Feed-Forward Network (FFN) module, enabling YOLOv10 to exhibit outstanding detection capabilities in complex object detection tasks. However, in the specific application scenario of ceramic product defect detection, the MHSA module poses challenges in terms of high computational complexity and a large number of parameters, which impact real-time processing performance. Therefore, this study adopts an efficient ECA mechanism that can adaptively adjust feature weights across channels, focusing on enhancing the expressiveness of key features while avoiding unnecessary complexity and overfitting. Additionally, to further improve the model’s ability to capture multi-scale features and enhance the richness of feature representation, this study replaces the global average pooling layer in the ECA mechanism with three parallel depthwise separable convolutions. This modification enables the model to exhibit higher accuracy and robustness in tasks requiring fine-grained feature representation, such as ceramic product defect detection.
The network architecture of the improved PSA module is illustrated in Figure 5. Its core innovation lies in the integration of a multi-scale enhanced ECA module. Specifically, in the design of the multi-scale enhanced ECA module, the input feature map is first fed in parallel into three depthwise separable convolutional layers with kernel sizes of 1 × 1, 3 × 3, and 5 × 5, respectively. These layers are capable of capturing spatial information at different scales. Subsequently, the weighted-fused channel features are passed into a one-dimensional convolutional layer, which aggregates information from adjacent channels through local cross-channel interactions, thereby adaptively capturing inter-channel dependencies. The output of the one-dimensional convolutional layer is then normalized using a Sigmoid activation function to obtain attention weights. Finally, these weights are used to reweight each channel of the input feature map, enhancing the feature representation of important channels while suppressing the influence of unimportant ones, thereby improving the network’s ability to capture key features.
By introducing multi-scale depthwise separable convolutional layers, the multi-scale enhanced ECA module can more effectively capture spatial information at different scales, focusing on fine-grained local features, medium-scale regional features, and broader contextual information, respectively. This enhances the model’s adaptability to complex scenarios. Meanwhile, the one-dimensional convolutional layer preserves the adaptive capability of inter-channel dependencies, dynamically aggregating information from adjacent channels through local cross-channel interactions. This enables the model to automatically adjust the weight distribution between channels based on the input features, not only improving the expressiveness of key features but also effectively suppressing irrelevant or redundant information, further enhancing the model’s discriminative ability.

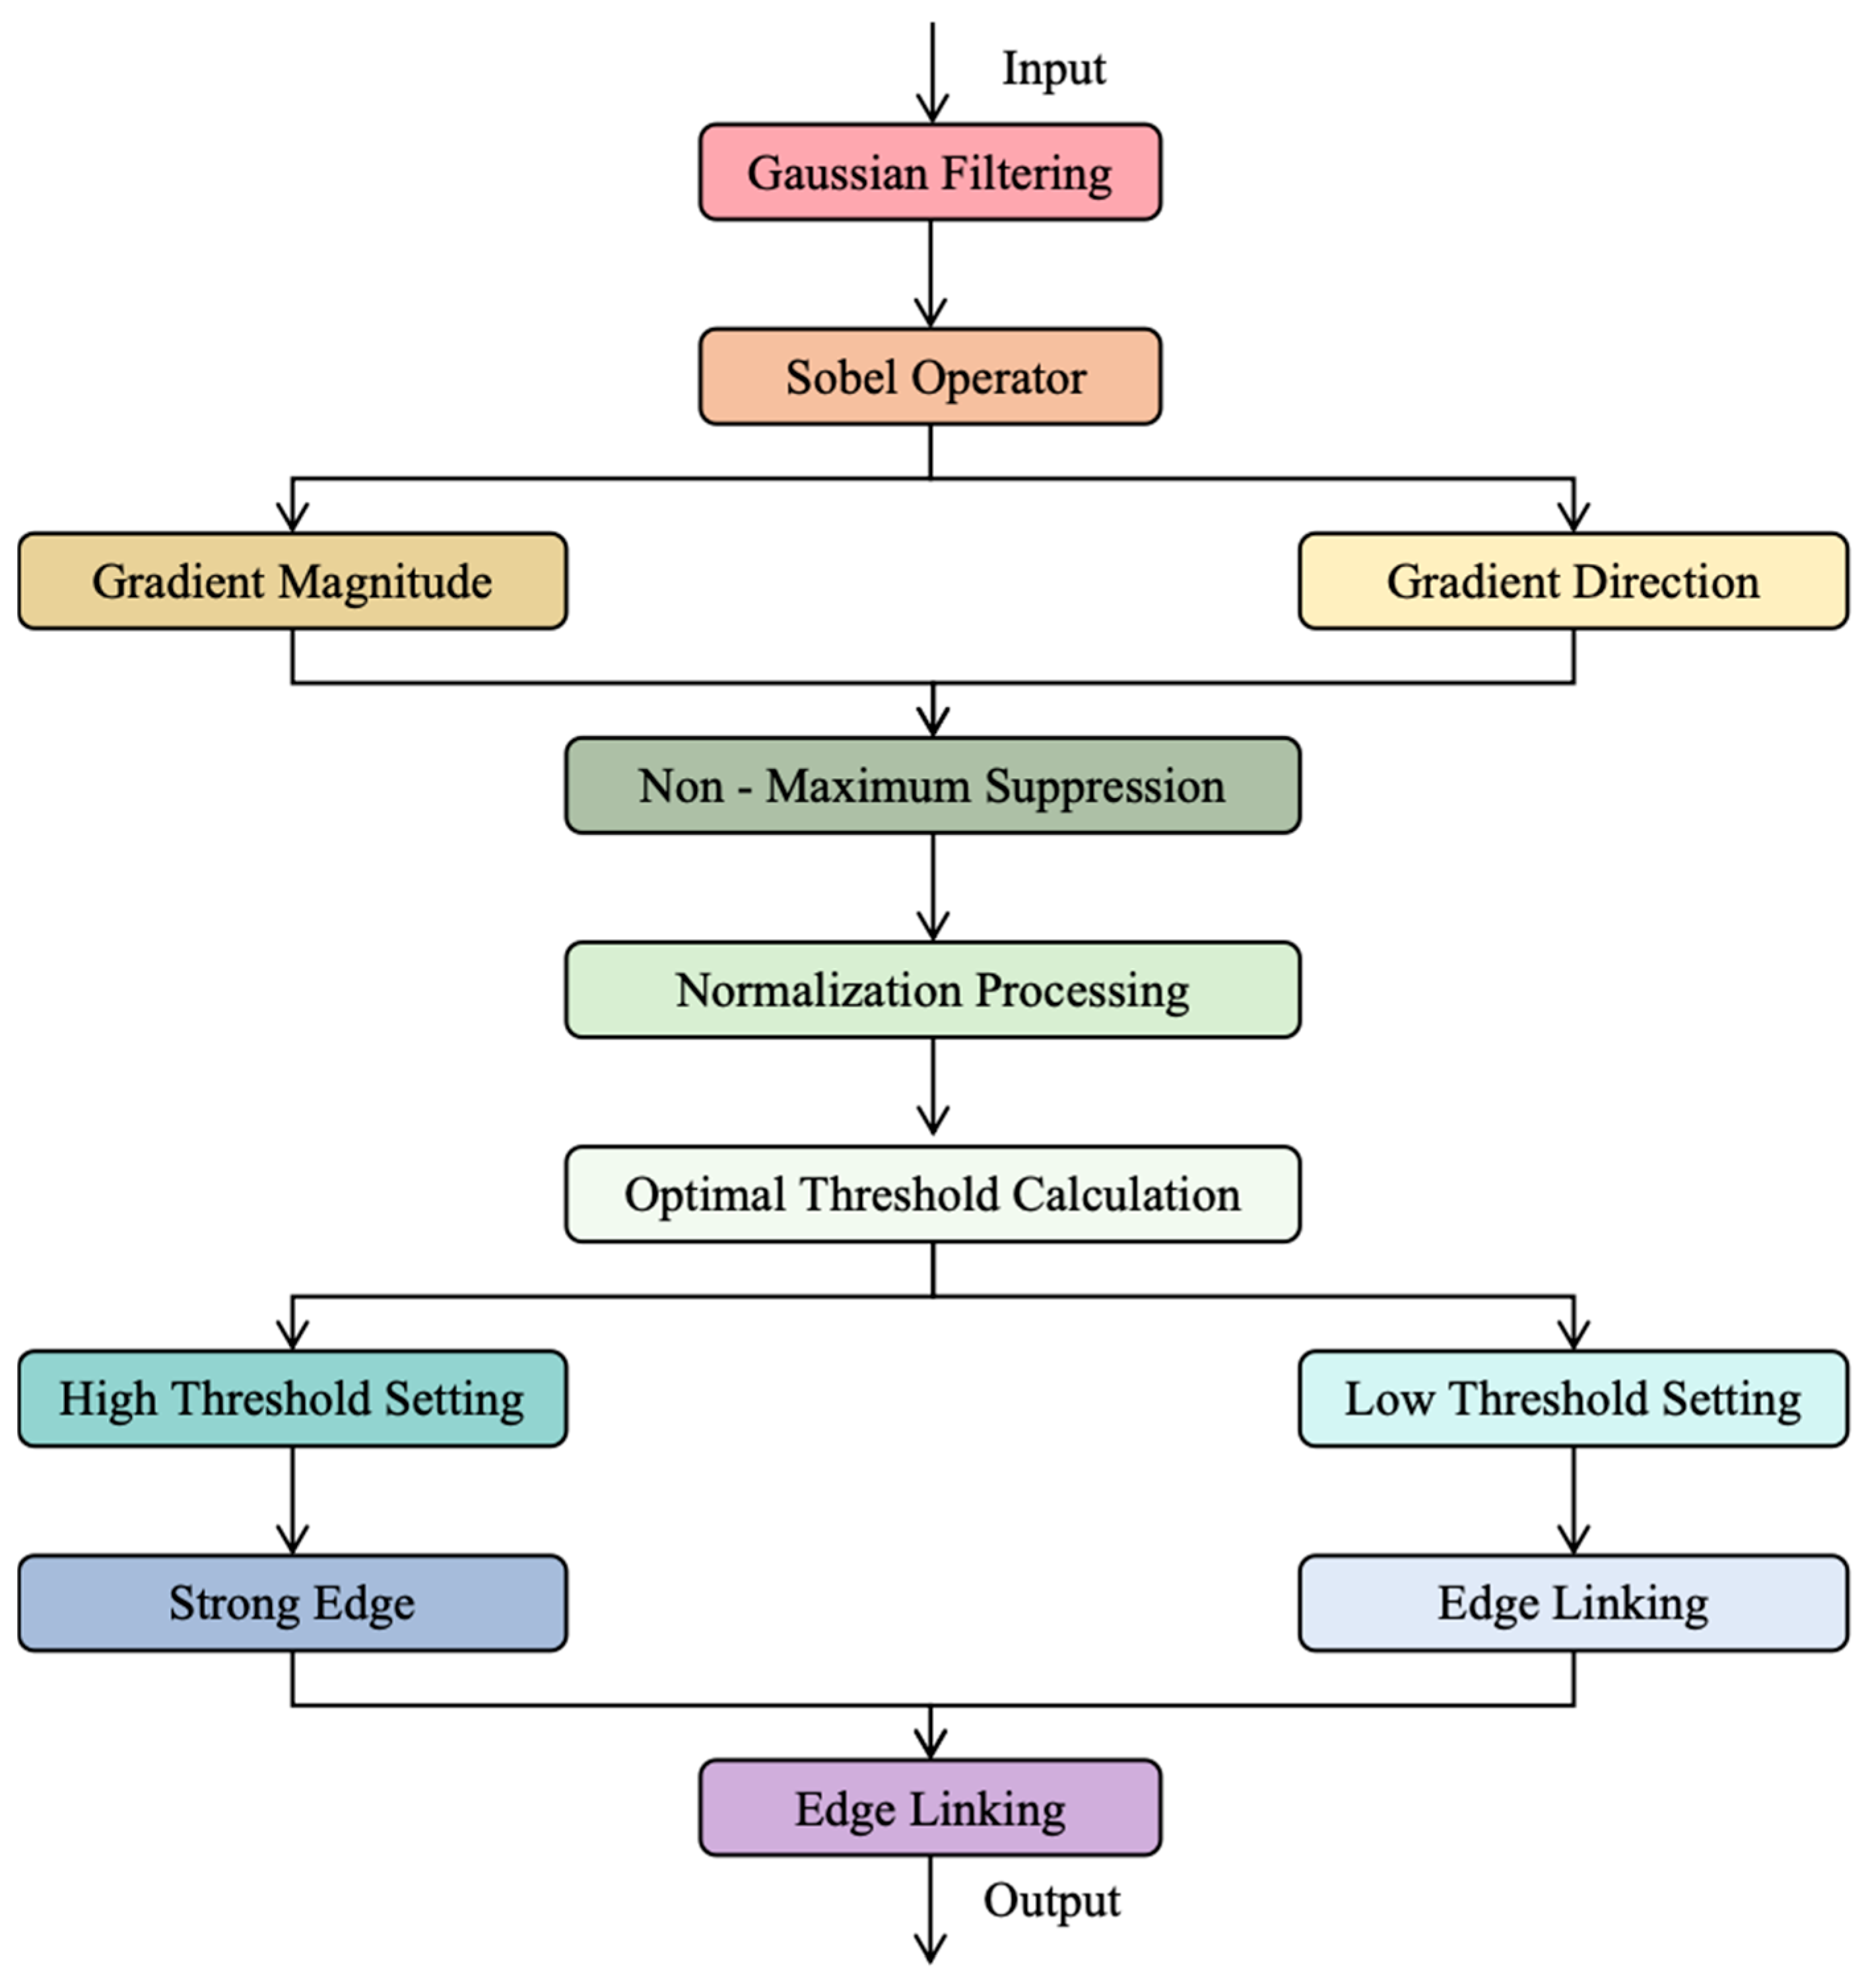
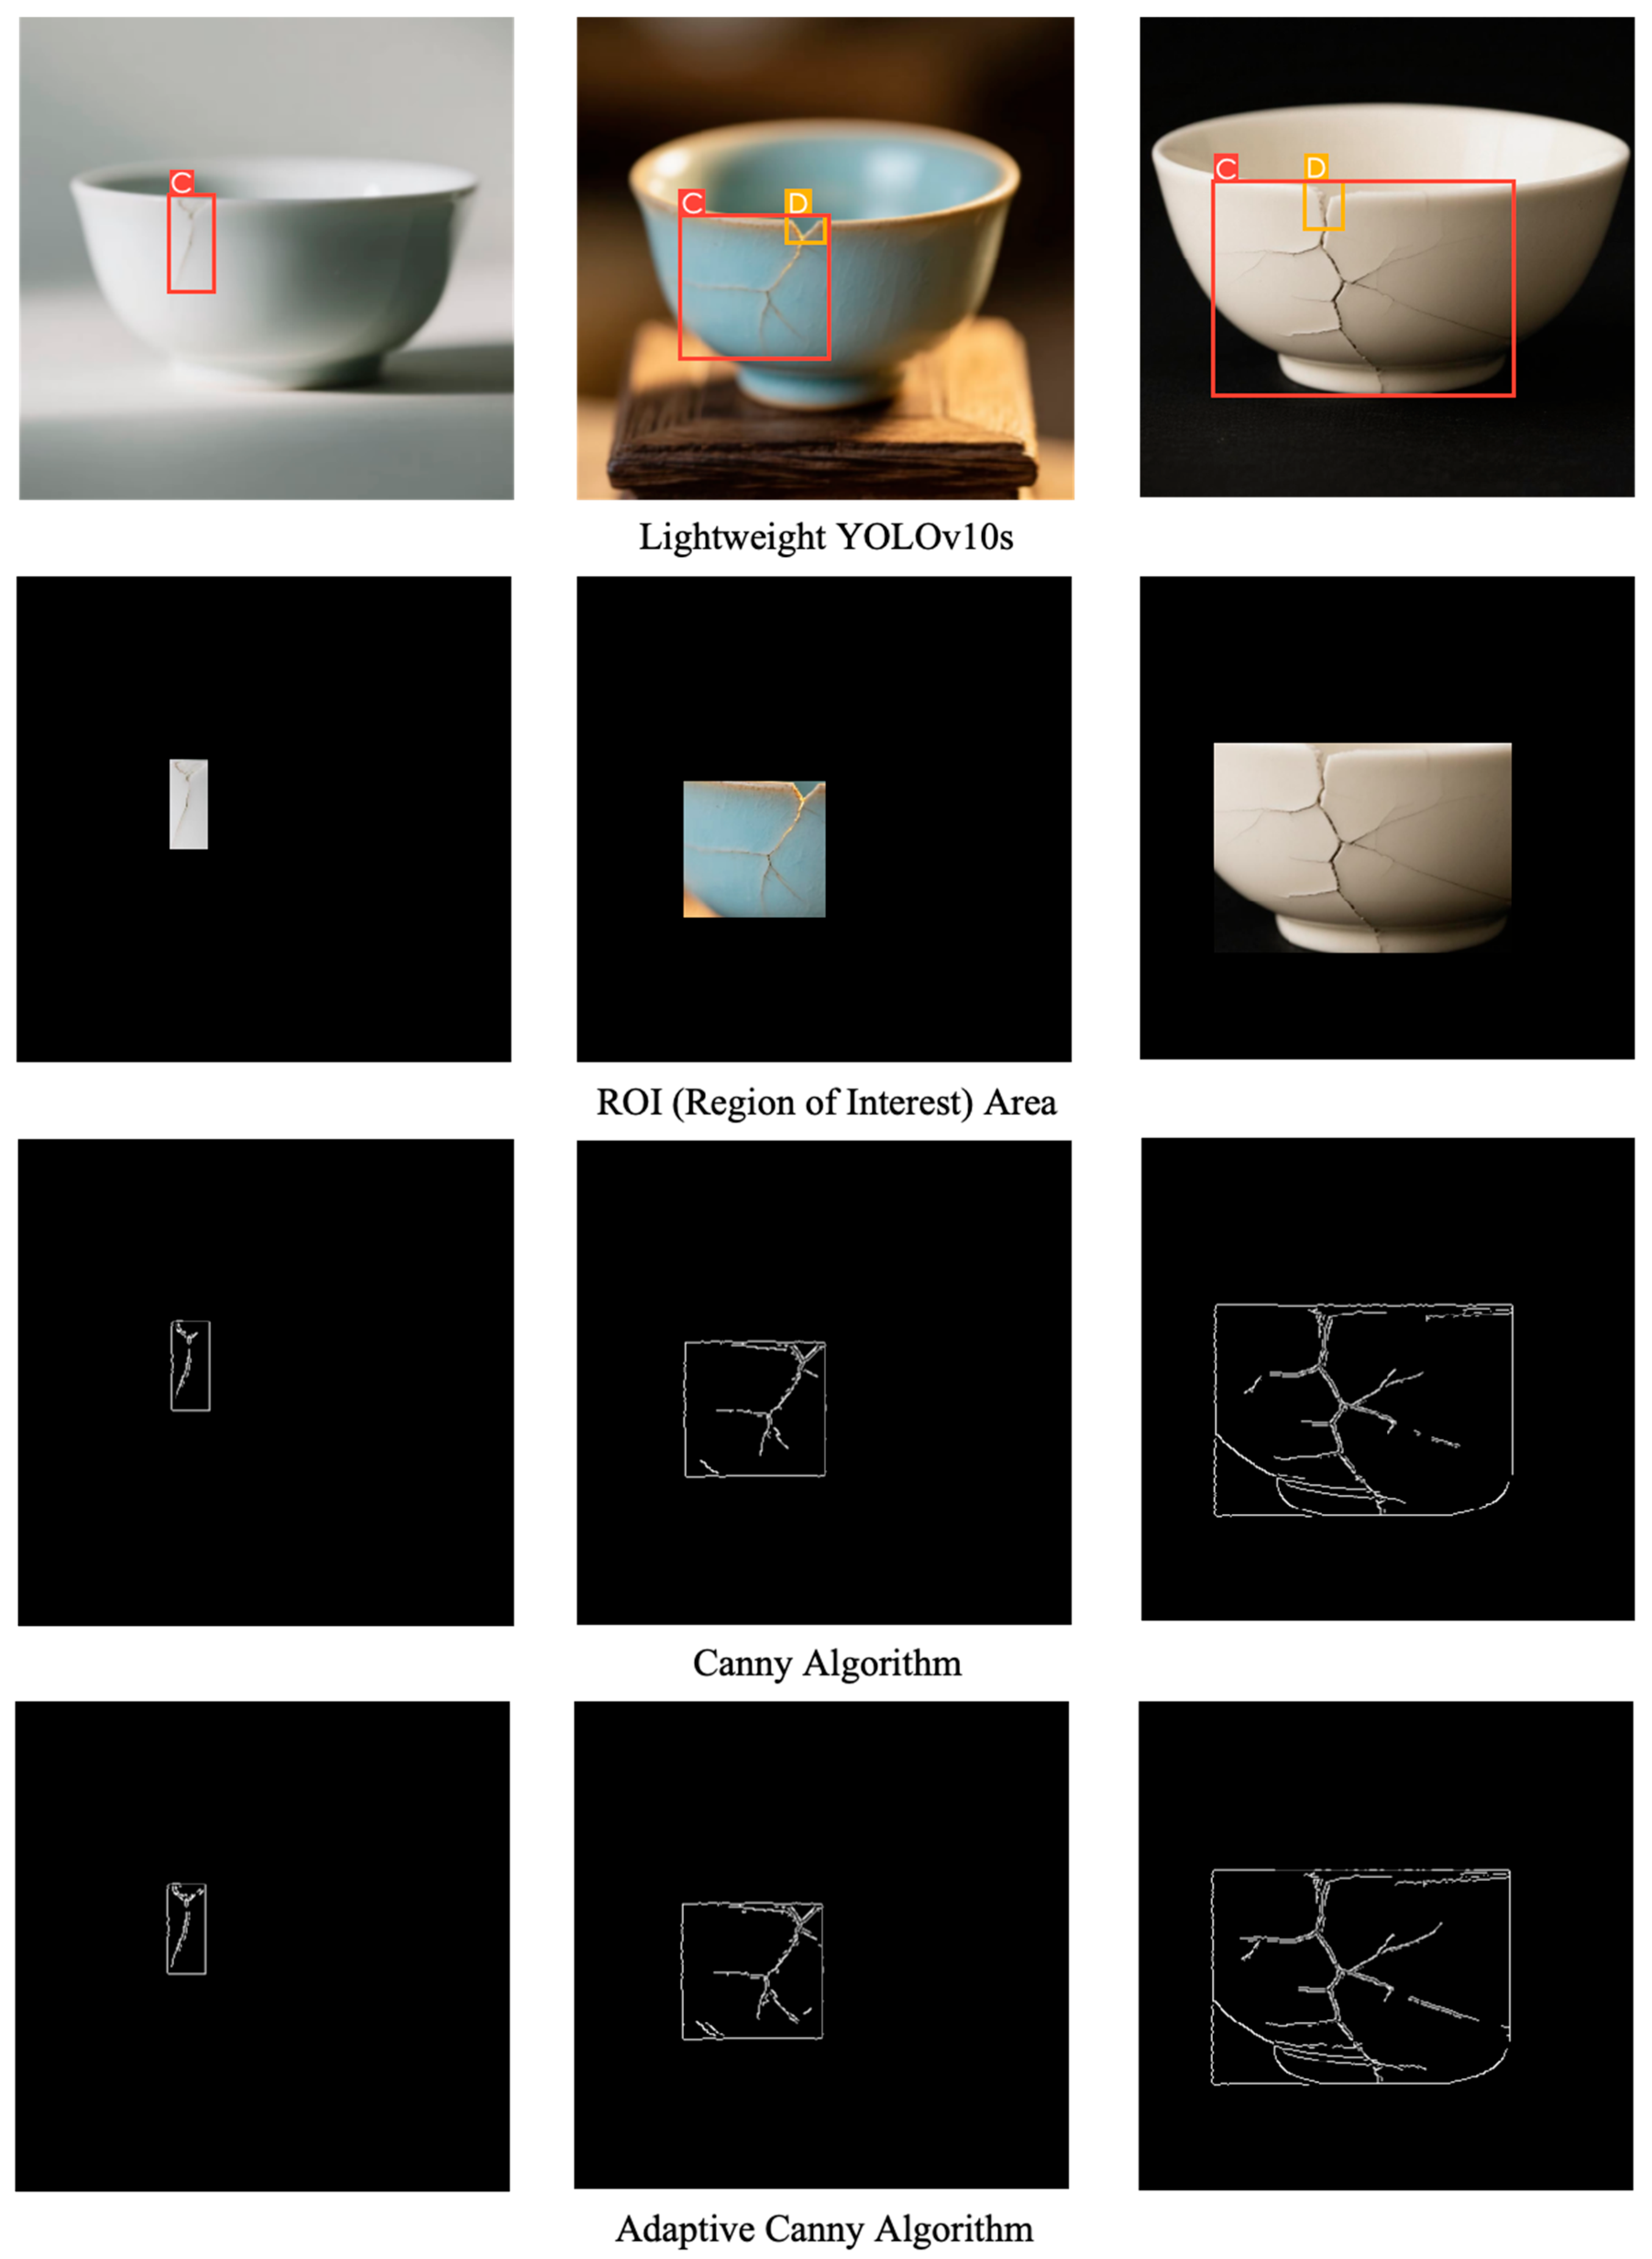
2.3. Adaptive Canny Edge Detection Algorithm

For the input images of ceramic products, precise bounding box coordinates output by the YOLOv10s model are first utilized to accurately define the defect regions within the images as ROIs. By focusing the processing scope and avoiding interference from irrelevant regions, the computational load of subsequent edge detection algorithms is significantly reduced, thereby improving overall processing efficiency. After accurately locating the ROIs, advanced edge detection techniques are employed to capture and localize defect edges with high precision, which aids in in-depth analysis of defect causes and optimization of production processes.
The Canny edge detection algorithm is a classic in the field of image processing, designed to accurately identify edge regions where pixel values undergo significant changes. The algorithm integrates steps such as Gaussian filtering, gradient calculation, non-maximum suppression, double-threshold processing, and edge linking to achieve high-precision and reliable detection of image edges. With its high-precision edge localization capability, it can accurately capture the edges of tiny crack defects on the ceramic surface, providing high-quality edge information for subsequent analysis. It boasts excellent noise-resistance performance. By employing Gaussian filtering, it effectively suppresses the noise introduced by the ceramic’s complex textures and lighting variations, ensuring the stability of the detection process. During processing, it can form continuous and clear edge lines, clearly presenting the trend and shape of the defects, which aids in precise defect analysis. Additionally, the Canny algorithm has relatively high computational efficiency. It can quickly process a large number of ceramic images, meeting the speed requirements for actual production-level inspection. However, the fixed nature of threshold setting in the traditional Canny algorithm, which relies on manually adjusted low and high thresholds, limits its adaptive capability across different image scenarios. To overcome this limitation, this study proposes an adaptive Canny edge detection algorithm that analyzes the image’s grayscale histogram to find the threshold that maximizes inter-class variance and automatically determines the most suitable low and high thresholds.
w 1 ( t ) = i = 0 t p i
w 2 ( t ) = i = t + 1 L 1 p i
μ 1 ( t ) = i = 0 t i p i w 1 ( t )
μ 2 ( t ) = i = t + 1 L 1 i p i w 2 ( t )
μ = i = 0 L 1 i p i
σ B 2 ( t ) = w 1 ( t ) w 2 ( t ) [ μ 1 ( t ) μ 2 ( t ) ] 2
In the adaptive threshold calculation method, it is assumed that the gray level of the image is L , the number of pixels with gray value i is n i , and the total number of pixels in the image is N = i = 0 L 1 n i . Then a pixel with gray value i appears with probability p i = n i N . Setting the threshold value to t , the pixel probabilities of the foreground and background of the image are shown in Equations (1) and (2), respectively. The average gray levels of the foreground and background are shown in Equations (3) and (4), respectively. The average gray level of the whole image is shown in Equation (5). The between-class variance is shown in Equation (6). The adaptive threshold calculation method calculates the between-class variance σ B 2 ( t ) by traversing all possible threshold values t and selects the threshold value t * that maximizes σ B 2 ( t ) as the best threshold value.
As illustrated in Figure 6, the complete process of the Adaptive Canny Edge Detection Algorithm is shown. First, the input image undergoes Gaussian filtering to effectively reduce noise interference by smoothing the image. Next, the Sobel operator is used to calculate the gradients of the image in the x and y directions, yielding the gradient magnitude (indicating edge strength) and gradient direction (for subsequent edge refinement). Then, non-maximum suppression is applied to the gradient magnitude to retain local maxima along the gradient direction, thereby refining the edges and making the detected edges more precise while reducing the occurrence of false edges. After that, the gradient magnitude after non-maximum suppression is normalized to a range suitable for processing by the adaptive threshold algorithm. The adaptive threshold algorithm analyzes the image’s grayscale histogram and automatically calculates the threshold that maximizes the inter-class variance. The high threshold is directly set to the optimal threshold, and the low threshold is set to half of the high threshold. Subsequently, double-threshold processing is employed to retain strong edges that are above the high threshold and weak edges that fall between the high and low thresholds. Finally, an edge linking algorithm is used to connect the weak edges with the strong edges, forming a continuous and complete edge map. This improvement enables the Canny algorithm to adaptively determine thresholds without manual intervention, significantly enhancing the accuracy and robustness of edge detection. Meanwhile, due to the automatic determination of thresholds, the algorithm’s processing efficiency is also significantly improved, making edge detection faster and more efficient.

3. Experiments and Results

3.1. Ceramic Defect Detection Model Based on Lightweight YOLOv10s

3.1.1. Evaluation Metrics

During the evaluation of ceramic defect detection, metrics such as Precision (P), Recall (R), mAP@0.5 (mean Average Precision at an Intersection over Union (IoU) threshold of 0.5), and F1-score are employed to measure the accuracy of the detection model. Additionally, metrics like Params (number of parameters), GFLOPs (billions of floating-point operations), and size (model size) are used to assess the lightweight nature of the detection model. Precision (P) represents the proportion of correctly detected positive instances among all instances detected as positive, while Recall (R) denotes the proportion of real positive instances that are correctly detected as positive. The specific calculation methods are shown in Equations (7) and (8), respectively. mAP@0.5 refers to the mean average precision across all categories at an IoU threshold of 0.5, which is the area under the Precision–Recall (P–R) curve in the detection results. The specific calculation formula is presented in Equation (9). The F1-score is the harmonic mean of precision and recall, considering both metrics comprehensively, and its specific calculation formula is shown in Equation (10).
P = T P T P + F P × 100 %
R = T P T P + F N × 100 %
m A P = 1 N i = 1 N 0 1 P i ( R ) d R
F 1 = 2 × P r e c i s i o n × R e c a l l P r e c i s i o n + R e c a l l × 100 %
Here, TP stands for True Positives, representing the number of positive samples correctly detected; FP stands for False Positives, indicating the number of negative samples incorrectly detected as positive; and FN stands for False Negatives, denoting the number of positive samples incorrectly detected as negative. The variable “ i ” signifies the serial number of a category, while “ N ” represents the total number of categories.

3.1.2. Ablation Experiments

To validate the effectiveness of the proposed lightweight YOLOv10s model and its improved modules in the task of ceramic defect detection, we conducted a series of ablation experiments using an existing YOLO dataset. The experimental results are detailed in Table 3.
As indicated by the data in Table 3, the original YOLOv10s model demonstrates exceptional performance in the task of ceramic product defect detection, achieving an mAP@50 of 92.5% and an F1-score of 90.1%. When the lightweight backbone network improvement scheme based on GhostConv is adopted, although there is a slight decline in detection accuracy (with mAP@50 decreasing by 1.9% and F1-score by 2.6%), the lightweight effect is remarkable; the model parameters (Params) are reduced by 24.2%, the computational load (GFLOPs) is lowered by 37.1%, and the model size (Size) is shrunk by 25.6%. This outcome suggests that the backbone network improvement based on GhostConv is feasible for lightweight optimization of ceramic defect detection models, effectively reducing model complexity and size while maintaining relatively high detection accuracy. During the improvement of the PSA module, by introducing the ECA mechanism, the model’s complexity metrics are further optimized while the accuracy metrics remain largely stable. After further optimizing the ECA mechanism and appropriately increasing the model complexity, the detection accuracy is significantly enhanced, with mAP@50 rising to 92.8% and F1-score increasing to 90.3%. This improvement validates the importance of enhancing the model’s multi-scale feature extraction capability for improving the performance of complex defect detection. Overall, through the collaborative optimization of the GhostConv lightweight backbone network and the ECA-PSA module, the improved model achieves a more efficient lightweight design while maintaining detection accuracy. Compared to the original model, the lightweight YOLOv10s model sees an increase of 0.3% in mAP@50 and 0.2% in F1-score, along with reductions of 26%, 37.9%, and 26.8% in Params, GFLOPs, and Size, respectively. This achievement provides a solid foundation for subsequent ceramic defect edge detection tasks.
As illustrated in Figure 7, the defect detection performance in ceramic products based on the lightweight YOLOv10s model is visually demonstrated. From the visual analysis results of the test images, the model exhibits a high degree of sensitivity to various types of defects on ceramic surfaces, including cracks, glaze missing, damage, and black spots. Among these, black spots and glaze-missing defects, due to their distinct contrast, can be easily and accurately detected by the model. When faced with more complex defects like cracks and damage, the model also performs exceptionally well. It not only reliably detects the presence of these defects but also provides precise boundary localization. Whether it is large-scale cracks or minute damage, the lightweight YOLOv10s model can accurately locate them. This showcases the model’s multi-scale detection capability, enabling it to adapt to defect detection needs of varying sizes and shapes, thereby enhancing the accuracy and reliability of detection. Additionally, the lightweight YOLOv10s model demonstrates strong stability in detecting ceramic product defects under different lighting conditions, effectively coping with complex lighting variations caused by factors such as natural light and workshop illumination in ceramic production and inspection environments.

3.1.3. Comparative Experiments on Different Ceramic Product Defect Detection Models

To further evaluate the performance of the lightweight YOLOv10s model in the task of ceramic product defect detection, we conducted quantitative comparative experiments on mainstream YOLO series models while keeping the dataset and hardware–software configurations completely consistent. To more intuitively reflect the model’s detection speed, an additional evaluation metric, FPS (frames per second, the number of image frames the model can process per second), was included. The experimental results are detailed in Table 4.
It is evident from the data presented in Table 4 that, when compared with other mainstream models from the YOLO series, the lightweight YOLOv10s model demonstrates the most outstanding overall performance.
In terms of detection accuracy, the model achieves mAP@50 and F1-score metrics of 92.8% and 90.3%, respectively, significantly surpassing the other five mainstream models. Specifically, compared to the YOLOv5s, YOLOv7, YOLOv8s, YOLOv9s, and YOLOv10s models, mAP@50 exceeds them by 3.7%, 4.5%, 1.7%, 2.6%, and 0.3%, respectively; F1-score surpasses them by 3.4%, 4.2%, 1.4%, 2.2%, and 0.2%, respectively. This data fully indicates that the lightweight YOLOv10s model possesses stronger defect recognition and localization capabilities in the task of ceramic product defect detection, enabling it to more accurately detect various types of defects on ceramic products.
In terms of model complexity, the lightweight YOLOv10s model’s Params, GFLOPs, and Size metrics are 5.97 M, 14.9 G, and 12.3 MB, respectively, all significantly lower than those of the other five mainstream models. Compared to the YOLOv5s, YOLOv7, YOLOv8s, YOLOv9s, and YOLOv10s models, Params are reduced by 14.96%, 63.42%, 52.09%, 17.43%, and 26.02%, respectively; GFLOPs are reduced by 5.70%, 58.03%, 48.08%, 44.40%, and 37.92%, respectively; and Size is reduced by 11.51%, 57.88%, 45.33%, 13.38%, and 26.79%, respectively. This implies that the lightweight YOLOv10s model, while maintaining high detection accuracy, has lower computational complexity and a smaller model size, enabling it to run more efficiently on resource-constrained devices and reducing hardware resource requirements and deployment costs.
Furthermore, for the task of ceramic defect detection, FPS is the most critical metric, directly measuring the model’s real-time processing speed, which is crucial for real-time detection in actual production. The proposed lightweight YOLOv10s model achieves an FPS of 63 frames per second, whereas most cameras operate at a rate of only 30 frames per second. Therefore, this model fully meets real-time operation standards and takes into account the potential increase in detection difficulty due to complex defects in a single frame. Compared to the YOLOv5s, YOLOv7, YOLOv8s, YOLOv9s, and YOLOv10s models, FPS exceeds them by 21.15%, 90.91%, 65.79%, 53.66%, and 40.00%, respectively, showcasing far superior real-time detection capabilities compared to other models.
Overall, the proposed lightweight YOLOv10s model not only boasts excellent detection accuracy, enabling precise recognition of ceramic product defects in complex scenarios, but also possesses the best detection speed, allowing for rapid response and handling of a large number of detection tasks. This provides strong technical support for the defect detection process of ceramic products, helping to improve production quality and efficiency, reduce defect rates, and has significant practical application value.

3.2. Ceramic Product Crack Detection Algorithm Based on Adaptive Canny

3.2.1. Evaluation Metrics

During the evaluation phase of the ceramic product crack detection algorithm, several key metrics, including ELE (Edge Localization Error), ECR (Edge Connectivity Rate), WER (Wrong Edge Rate), and FPS, were employed to assess the effectiveness of the experimental results. ELE (Edge Localization Error): This metric is used to quantify the degree of deviation between the edge positions detected by the algorithm and the actual true edge positions. The calculation method is as shown in Equation (11), where N represents the total number of true edge pixels; P i det e c t e d represents the edge coordinates detected by the algorithm; and P i t r u e denotes the true edge coordinates.
E L E = 1 N i = 1 N | | P i det e c t e d P i t r u e | |
ECR is utilized to evaluate the algorithm’s capability in maintaining structural continuity of the detected edges. It is calculated as the ratio of the number of matched continuous segments to the total number of actual continuous segments. WER focuses on measuring the algorithm’s ability to detect edges in low-contrast regions. It is computed as the ratio of the number of detected weak edge pixels to the total number of actual weak edge pixels. FPS is employed to assess the algorithm’s computational efficiency in real-time application scenarios. It is determined as the ratio of the total number of processed images to the total time consumed (in seconds).

3.2.2. Ablation Experiments

To validate the improvement effects of the adaptive Canny algorithm in ceramic product crack detection, this study utilized the lightweight YOLOv10s model to filter out defect images containing cracks as the experimental dataset. ROIs were precisely delineated based on the detection boxes to focus on crack features and reduce background interference. The impacts of the key improvement strategies of the algorithm were systematically analyzed through ablation experiments, and the results are presented in Table 5.
As shown in Table 5, in the ceramic crack edge detection experiments, the original Canny algorithm, due to its use of a fixed threshold strategy, resulted in significant deviations in edge localization in high-noise areas, with an average ELE of 3.2 px. In contrast, the improved adaptive Canny algorithm, by introducing an adaptive thresholding method, effectively reduced noise interference, bringing the edge localization closer to the actual cracks. The average ELE was reduced to 2.4 px, representing a 25% reduction in error. Given the stringent requirements for localization accuracy in ceramic crack detection, the notable decrease in ELE significantly enhanced the reliability of the detection.
In terms of edge connectivity, the original Canny algorithm frequently suffered from weak crack edge discontinuities due to its fixed threshold, resulting in an ECR of only 76%. In comparison, the adaptive Canny algorithm, by preserving more weak edge information, increased the ECR to 91%, representing a 15% improvement in connectivity. Considering the importance of a complete crack profile for assessing crack severity (such as through-cracks), the increase in ECR effectively avoided missed detections.
Furthermore, in terms of weak edge response capability, the original Canny algorithm, due to its fixed high-threshold strategy, resulted in severe missed detections of light-colored or fine cracks, with a WER of only 65%. The adaptive Canny algorithm, by dynamically adjusting the threshold, significantly enhanced the response capability to weak edges, increasing the WER to 82%, representing a 17% improvement in detection rate. Given the importance of detecting micro-cracks (such as cracking in glazes) on ceramic surfaces for early defect identification, the increase in WER contributed to improving the sensitivity of defect recognition.
Although the improved adaptive Canny algorithm experienced a slight decrease in frame rate, it still met the requirements for real-time detection on production lines (typically requiring ≥30 frames per second). Therefore, considering multiple factors such as detection accuracy, connectivity, weak edge response capability, and real-time performance, the proposed adaptive Canny algorithm exhibits significant advantages in ceramic crack detection.
As shown in Figure 8, the ceramic crack edge detection results based on the adaptive Canny algorithm are presented. After obtaining the detection results using the lightweight YOLOv10s model, the defect type and relevant information about the detection bounding boxes are acquired. Subsequently, the algorithm delineates the ROI on the original image based on the bounding box coordinates of the crack defect. This operation significantly reduces the area of the subsequent detection region, not only helping to shorten the detection time but also effectively excluding interference from irrelevant background information, thereby improving detection efficiency and accuracy. After determining the ROI, tests are conducted using both the original Canny algorithm and the adaptive Canny algorithm proposed in this paper. By comparing the test results, it is evident that the adaptive Canny algorithm demonstrates significant improvements in the accuracy and continuity of crack edge detection, as well as a notable enhancement in weak edge detection capability. This is primarily attributed to the effectiveness and practicality of the adaptive threshold calculation method, which dynamically adjusts the threshold based on local image features, enabling more precise identification of crack edges. Additionally, the crack regions in the detected images gradually increase from left to right, and as the crack regions expand, the crack patterns become increasingly complex, posing higher demands on the algorithm’s adaptability. The adaptive Canny algorithm proposed in this paper exhibits excellent detection capabilities, being able to detect almost all cracks. Despite some instances of discontinuity in the detection process and occasional false detections of minor cracks, overall, the algorithm demonstrates outstanding performance in complex crack detection tasks, providing an effective approach for the precise detection of ceramic cracks.

4. Conclusions

This study proposes a deep learning-based algorithm for ceramic product defect detection, achieving efficient and accurate detection of surface defects on ceramic products by combining the lightweight YOLOv10s model with the adaptive Canny algorithm. The algorithm operates in two stages: first, it utilizes the lightweight YOLOv10s model for preliminary defect detection, accurately identifying and locating four types of defects—cracks, glaze missing, damage, and black spots—and delineating the ROI; subsequently, the adaptive Canny algorithm is applied within the ROI to capture and locate crack defect edges with high precision. The experimental results indicate that the lightweight YOLOv10s model effectively reduces model complexity and size while maintaining high detection accuracy, achieving an mAP@50 of 92.8% and an F1-score of 90.3%. The adaptive Canny algorithm performs exceptionally well in crack detection, with a 25% reduction in ELE, a 15% increase in ECR, and a 17% improvement in WER, while achieving a frame rate of 40 fps, meeting the requirements for real-time detection.
Despite the significant progress made in this study on ceramic product defect detection, several limitations still exist. Firstly, the dataset size is relatively limited, primarily focusing on ceramic crafts with relatively uniform colors and shapes, which may affect the model’s performance when dealing with more complex handicrafts. Secondly, although the adaptive Canny algorithm performs well in crack detection, its edge detection performance for other types of defects has not been fully validated, and different defect types may require targeted adjustments to the algorithm parameters. Lastly, although the algorithm meets the requirements for real-time detection in terms of frame rate, under extreme conditions (such as high-resolution images, complex backgrounds, etc.), real-time performance may face challenges.
In response to the above limitations, future research can be conducted from the following aspects: firstly, expand the scale and diversity of the dataset by collecting more samples of ceramic products with complex colors and shapes and introducing data augmentation techniques to increase dataset diversity; secondly, enhance the algorithm’s generality by designing specialized edge detection strategies or adjusting algorithm parameters for different types of defects, and explore multi-task learning frameworks to achieve joint optimization of defect type identification and edge detection; thirdly, optimize real-time performance by improving the model’s real-time processing capabilities through algorithm optimization, hardware acceleration, and other means.

Author Contributions

Conceptualization, J.D. and Y.Z.; methodology, J.D. and Z.D.; formal analysis, Z.D.; investigation, H.W.; resources, J.D.; writing—original draft, J.D.; writing—review and editing, Z.D.; supervision, H.W. and Y.Z. All authors have read and agreed to the published version of the manuscript.

Funding

This research was supported by the 2024 Annual Project of Henan Provincial Philosophy and Social Sciences Planning-Research on the “Site-Specific” Design Strategies of Public Art Based on the Cultural Construction of Rural Areas in the Central Plains (Project No.: 2024BYS019), and the 2022 Annual Project of Henan Provincial Philosophy and Social Sciences Planning-Research on the Development Paths of Public Art in Henan’s Revolutionary Cultural Tourism (Project No.: 2022BYS045).

Institutional Review Board Statement

Not applicable.

Informed Consent Statement

Not applicable.

Data Availability Statement

The data presented in this study are available on request from the corresponding author (the data are not publicly available due to privacy or ethical restrictions).

Conflicts of Interest

The authors declare that they have no known competing financial interests or personal relationships that could have appeared to influence the work reported in this paper.

References

  1. Dong, G.; Pan, X.; Liu, S.; Wu, N.; Kong, X.; Huang, P.; Wang, Z. A review of machine vision technology for defect detection in curved ceramic materials. Nondestruct. Test. Eval. 2024, 1–27. [Google Scholar] [CrossRef]
  2. Tercan, H.; Meisen, T. Machine learning and deep learning based predictive quality in manufacturing: A systematic review. J. Intell. Manuf. 2022, 33, 1879–1905. [Google Scholar] [CrossRef]
  3. Yang, J.; Li, S.; Wang, Z.; Dong, H.; Wang, J.; Tang, S. Using deep learning to detect defects in manufacturing: A comprehensive survey and current challenges. Materials 2020, 13, 5755. [Google Scholar] [CrossRef]
  4. Yang, R.; Yu, Y. Artificial convolutional neural network in object detection and semantic segmentation for medical imaging analysis. Front. Oncol. 2021, 11, 638182. [Google Scholar] [CrossRef]
  5. Nan, Z.; Peng, J.; Jiang, J.; Chen, H.; Yang, B.; Xin, J.; Zheng, N. A joint object detection and semantic segmentation model with cross-attention and inner-attention mechanisms. Neurocomputing 2021, 463, 212–225. [Google Scholar] [CrossRef]
  6. Kaur, R.; Singh, S. A comprehensive review of object detection with deep learning. Digit. Signal Process. 2023, 132, 103812. [Google Scholar] [CrossRef]
  7. Sharma, V.K.; Mir, R.N. Saliency guided faster-RCNN (SGFr-RCNN) model for object detection and recognition. J. King Saud Univ.-Comput. Inf. Sci. 2022, 34, 1687–1699. [Google Scholar] [CrossRef]
  8. Diwan, T.; Anirudh, G.; Tembhurne, J.V. Object detection using YOLO: Challenges, architectural successors, datasets and applications. Multimed. Tools Appl. 2023, 82, 9243–9275. [Google Scholar] [CrossRef]
  9. Zhai, S.; Shang, D.; Wang, S.; Dong, S. DF-SSD: An improved SSD object detection algorithm based on DenseNet and feature fusion. IEEE Access 2020, 8, 24344–24357. [Google Scholar] [CrossRef]
  10. Wu, B.; Liang, A.; Zhang, H.; Zhu, T.; Zou, Z.; Yang, D.; Tang, W.; Li, J.; Su, J. Application of conventional UAV-based high-throughput object detection to the early diagnosis of pine wilt disease by deep learning. For. Ecol. Manag. 2021, 486, 118986. [Google Scholar] [CrossRef]
  11. Diao, Z.; Yan, J.; He, Z.; Zhao, S.; Guo, P. Corn seedling recognition algorithm based on hyperspectral image and lightweight-3D-CNN. Comput. Electron. Agric. 2022, 201, 107343. [Google Scholar] [CrossRef]
  12. Hsu, S.H.; Hung, H.T.; Lin, Y.Q.; Chang, C.M. Defect inspection of indoor components in buildings using deep learning object detection and augmented reality. Earthq. Eng. Eng. Vib. 2023, 22, 41–54. [Google Scholar] [CrossRef]
  13. Lin, C.J.; Jhang, J.Y. Intelligent traffic-monitoring system based on YOLO and convolutional fuzzy neural networks. IEEE Access 2022, 10, 14120–14133. [Google Scholar] [CrossRef]
  14. Guo, Y.; Liu, Y.; Georgiou, T.; Lew, M.S. A review of semantic segmentation using deep neural networks. Int. J. Multimed. Inf. Retr. 2018, 7, 87–93. [Google Scholar] [CrossRef]
  15. Fu, L.; Li, S. A new semantic segmentation framework based on UNet. Sensors 2023, 23, 8123. [Google Scholar] [CrossRef] [PubMed]
  16. Liu, F.; Fang, M. Semantic segmentation of underwater images based on improved Deeplab. J. Mar. Sci. Eng. 2020, 8, 188. [Google Scholar] [CrossRef]
  17. Sun, J.; Yang, S.; Gao, X.; Ou, D.; Tian, Z.; Wu, J.; Wang, M. Masa-segnet: A semantic segmentation network for polsar images. Remote Sens. 2023, 15, 3662. [Google Scholar] [CrossRef]
  18. Koitka, S.; Kroll, L.; Malamutmann, E.; Oezcelik, A.; Nensa, F. Fully automated body composition analysis in routine CT imaging using 3D semantic segmentation convolutional neural networks. Eur. Radiol. 2021, 31, 1795–1804. [Google Scholar] [CrossRef]
  19. Alam, M.; Wang, J.F.; Guangpei, C.; Yunrong, L.V.; Chen, Y. Convolutional neural network for the semantic segmentation of remote sensing images. Mob. Netw. Appl. 2021, 26, 200–215. [Google Scholar] [CrossRef]
  20. Diao, Z.; Guo, P.; Zhang, B.; Zhang, D.; Yan, J.; He, Z.; Zhao, S.; Zhao, C. Maize crop row recognition algorithm based on improved UNet network. Comput. Electron. Agric. 2023, 210, 107940. [Google Scholar] [CrossRef]
  21. Kim, Y.H.; Park, K.R. MTS-CNN: Multi-task semantic segmentation-convolutional neural network for detecting crops and weeds. Comput. Electron. Agric. 2022, 199, 107146. [Google Scholar] [CrossRef]
  22. Wan, G.; Fang, H.; Wang, D.; Yan, J.; Xie, B. Ceramic tile surface defect detection based on deep learning. Ceram. Int. 2022, 48, 11085–11093. [Google Scholar] [CrossRef]
  23. Lu, Q.; Lin, J.; Luo, L.; Zhang, Y.; Zhu, W. A supervised approach for automated surface defect detection in ceramic tile quality control. Adv. Eng. Inform. 2022, 53, 101692. [Google Scholar] [CrossRef]
  24. Nogay, H.S.; Akinci, T.C.; Yilmaz, M. Detection of invisible cracks in ceramic materials using by pre-trained deep convolutional neural network. Neural Comput. Appl. 2022, 34, 1423–1432. [Google Scholar] [CrossRef]
  25. Chen, W.; Zou, B.; Huang, C.; Yang, J.; Li, L.; Liu, J.; Wang, X. The defect detection of 3D-printed ceramic curved surface parts with low contrast based on deep learning. Ceram. Int. 2023, 49, 2881–2893. [Google Scholar] [CrossRef]
  26. Cao, T.; Song, K.; Xu, L.; Feng, H.; Yan, Y.; Guo, J. Balanced multi-scale target score network for ceramic tile surface defect detection. Measurement 2024, 224, 113914. [Google Scholar] [CrossRef]
  27. Fang, F. Crack repair model of ancient ceramics based on digital image. Sci. Program. 2022, 2022, 4932183. [Google Scholar] [CrossRef]
  28. Zhou, J.; Li, H.; Lu, L.; Cheng, Y. Machine vision-based surface defect detection study for ceramic 3D printing. Machines 2024, 12, 166. [Google Scholar] [CrossRef]
Figure 1. Main workflow of the defect detection algorithm for ceramic products.
Applsci 15 06641 g001
Figure 2. Original images of ceramic product defects.
Applsci 15 06641 g002
Figure 3. Network architecture of the lightweight YOLOv10s model.
Applsci 15 06641 g003
Figure 4. Network architectures of the lightweight GhostConv and GhostC2f modules.
Applsci 15 06641 g004
Figure 5. Network architecture of the improved PSA module.
Applsci 15 06641 g005
Figure 6. Flowchart of the adaptive Canny edge detection algorithm.
Applsci 15 06641 g006
Figure 7. Defect detection performance based on the lightweight YOLOv10s model.
Applsci 15 06641 g007
Figure 8. Ceramic crack edge detection results based on the adaptive Canny algorithm.
Applsci 15 06641 g008
Table 1. Comparison table of existing inspection technologies.
Inspection TechnologyAdvantagesDisadvantages
Manual Visual InspectionIntuitive, capable of handling complex defectsLow efficiency, poor data traceability
Traditional Machine VisionSimple, capable of handling repetitive tasksLimited functionality, sensitive to the environment
Object Detection AlgorithmStrong real-time performance, adaptable to complex environmentsHigh model complexity, high resource requirements
Semantic Segmentation AlgorithmPixel-level, provides fine-grained boundary informationLarge computational load, relatively poor real-time performance
Table 2. Types and quantities of dataset labels.
CategoryAnnotation LabelTraining SetValidation SetTest Set
CrackC5526969
Glaze DeficiencyG4565757
DamageD824103103
Black SpotB5927474
Table 3. Results of ablation experiments.
ModelmAP@50 (%)F1-Score (%)Params (M)GFLOPs (G)Size (MB)
YOLOv10s92.590.18.0724.16.8
+GhostConv90.687.56.1215.112.5
+GhostConv + ECA90.587.75.6614.612.1
+GhostConv + Improved ECA
(Lightweight YOLOv10s)
92.890.35.9714.912.3
Table 4. Results of comparative tests.
ModelmAP@50 (%)F1-Score (%)Params (M)GFLOPs (G)Size (MB)FPS (f/s)
YOLOv5s89.186.97.0215.813.952
YOLOv788.386.116.3235.529.233
YOLOv8s91.188.912.4628.722.538
YOLOv9s90.288.17.2326.814.241
YOLOv10s92.590.18.072416.845
Lightweight YOLOv10s
(Ours)
92.890.35.9714.912.363
Table 5. Results of ablation experiments.
ModelELE (px)ECR (%)WER (%)FPS (f/s)
Lightweight YOLOv10s + Canny3.2766544
Lightweight YOLOv10s + Adaptive Canny2.4918240
Disclaimer/Publisher’s Note: The statements, opinions and data contained in all publications are solely those of the individual author(s) and contributor(s) and not of MDPI and/or the editor(s). MDPI and/or the editor(s) disclaim responsibility for any injury to people or property resulting from any ideas, methods, instructions or products referred to in the content.

